
Submitted:
26 November 2024
Posted:
26 November 2024
You are already at the latest version
Abstract
Currently, natural rubber is an irreplaceable and important strategic material. Coagulation of fresh latex is one of the key processes in natural rubber processing, which directly affects the properties of natural rubber and its derived materials. Based on tensile experiments and the Yeoh model, the effects of natural coagulation, enzyme coagulation, acid coagulation, microbial coagulation, and enzyme-assisted microbial coagulation modes on the superelastic ontological relationships of natural rubber were analyzed in detail. Given the limitations of the Yeoh model in describing the mechanical behavior in the low-strain region, a strain-rate-related factor was introduced and a more accurate hyperelastic constitutive relationship of natural rubber was established. The results demonstrate that the Yeoh model effectively characterizes the mechanical behavior of natural rubber carbon black composites in the moderate and high-strain regions. Additionally, the material characteristics reflected by the model parameters align with those observed in cyclic tensile tests The performance of rubber under small, medium, and large deformations is different for different coagulation methods. The modulus of natural coagulation rubber is the highest in small deformations, the modulus of enzyme coagulation rubber is the highest in medium deformations and the modulus of enzyme-assisted microbial coagulation rubber is the highest in large deformations so that the appropriate coagulation method can be selected according to the degree of deformation of the rubber required by application scenarios in the practical application. Following the incorporation of a strain-rate-related factor, the modified Yeoh model provides accurate predictions of stress-strain curves across different tensile speeds within the low-strain range.
Keywords:
natural rubber (NR)
; coagulation
; constitutive model
; Yeoh model
; properties
1. Introduction
Natural rubber is a primary processed product obtained from the fresh latex of the Brazilian rubber tree through processes such as coagulation, dehydration (sheet and crepe processing), and drying. The structural composition of natural rubber and other bioactive components endow it with superior resilience, insulation, waterproofness [1], and flexibility compared to synthetic rubber. As a result, natural rubber is extensively applied in the tire manufacturing industry and remains irreplaceable in some critical industrial sectors and cutting-edge equipment. With the continuous advancement of science and technology and the expansion of various fields, higher demands have been placed on the comprehensive performance of natural rubber.
The coagulation of fresh latex is a critical step in the initial processing of natural rubber that significantly affects rubber quality [2]. This is primarily because non-rubber substances such as proteins and phospholipids are key components of the natural rubber network structure and are closely related to the vulcanization characteristics and mechanical properties of natural rubber. The types and content of these non-rubber components can change variably under different coagulation processes, thus causing variations in the quality and application performance of natural rubber [3]. The common coagulation processes and their characteristics are as follows: Acid coagulation is the most widely used in the industry but can corrode equipment and affect product performance [4]. Natural coagulation requires no operation but is time-consuming and may result in incomplete coagulation, it is the method for obtaining cup lump raw materials [5,6]. Microbial coagulation produces dry rubber with better physical-mechanical properties and vulcanization characteristics [7], but wet coagulated blocks can develop an odor during storage, similar to naturally coagulated blocks [8,9]. Enzymatic coagulation has a rapid coagulation rate and high product physical-mechanical properties but leads to fast vulcanization and the risk of scorching the rubber compound. Enzyme-assisted microbial coagulation combines the advantages of microbial and enzymatic coagulation, improving vulcanization processing characteristics while obtaining higher mechanical properties [10].
Choosing the appropriate coagulation process is an important way to improve the performance of rubber products. Currently, evaluations of fresh latex coagulation processes mainly focus on the effects of latex coagulation and certain performance indicators of raw rubber and vulcanized rubber [11,12,13,14]. Ng [2] described the subsequent effects of different coagulation methods on natural rubber from the perspective of processing characteristics, vulcanization characteristics, mechanical properties, and aging retention performance of vulcanized rubber. However, to establish the connection between latex coagulation technology and the rubber industry, it is necessary to research the impact of different coagulation methods on the application performance of end products. Research on forming and structural simulation is a common method for predicting the performance of rubber composites and the application performance of end products due to their convenience, speed, and intuitiveness [15,16,17,18,19]. Engineers often use software such as Ansys and Abaqus for simulations [20,21,22,23], and the constitutive model and parameters play an important role in the reasonableness and precision of the calculations.
Models commonly used to investigate the constitutive relationships of natural rubber are the Mooney-Rivlin [24,25,26]and Yeoh [27,28] models. The Mooney-Rivlin model is suitable for moderate to small deformations, generally applicable to strains of about 100% for tension and 30% for compression. For rubber without carbon black, this model can provide relatively accurate results, but it fails to precisely simulate the behavior of carbon black-filled rubber composites [29]. On the other hand, the Yeoh model is better suited to simulating the large deformation behavior of carbon black-filled natural rubber (NR) and can describe the mechanical behavior under other deformation conditions using simple uniaxial tensile test data [30].
Given that the mechanical properties of natural rubber in practical applications are reflected by the composite performance after filler incorporation and carbon black is the most commonly used filler in the natural rubber industry, this study utilizes the Yeoh model in conjunction with tensile experiments to investigate the constitutive relationships of carbon black-filled NR samples with large deformation obtained through different coagulation methods. Additionally, the Yeoh model cannot accurately simulate the small deformation region primarily because the initial tensile speed must rapidly increase from zero to the set speed within a short period, resulting in a non-constant strain rate in the small strain area and thus inaccurate simulation results. To address this issue, this study transitions the constitutive relationship of rubber composites from the Yeoh model to a Yeoh model with a strain rate correction factor. Then, the modified model is applied to predict the uniaxial tensile stress-strain curves at different strain rates, and compared with experimental results to verify the accuracy of the modified model and the effect of strain rate reflected by the modified model on the mechanical properties of rubber materials. This lays the foundation for further research on material forming and structural simulation.
2. Materials and Methods
2.1. Raw Materials and Reagents
Fresh latex: Collected from the experimental field of the Chinese Academy of Tropical Agricultural Sciences in Danzhou, Hainan, China. Microbial coagulation liquid: Prepared and preserved by the Rubber Research Institute of the Chinese Academy of Tropical Agricultural Sciences; Alkaline protease: Shengwanjiaxin Materials Co., Ltd.; Other chemical reagents are commercially available.
2.2. Instruments and Equipment
Electronic tensile machine: AI-7000-SGD1, Gotech Testing Machines Inc.; Open mill: XK-300B, Shanghai Kechuang Rubber and Plastic Machinery Co., Ltd.; Flat vulcanizing machine: JH-PB-600T, Shanghai Kuntian Laboratory Instrument Co., Ltd.
2.3. Sample Preparation
Homogeneous ammonia-free fresh latex with a dry rubber content of 23% was taken and sampled using different coagulation methods in Table 1, mixed well, and then left to coagulate.
After the above latex coagulated and matured for 2 days, it was pressed into sheets, hung to dry in a ventilated area for 3 days, and then dried at 80°C to produce raw rubber samples prepared by different coagulation methods.
Compounded rubber was prepared according to formula No. 3 in NY/T 1403-2007 and vulcanized for 30 minutes at 143°C on a flat vulcanizing machine. Samples were prepared by GB/T 528-2009.
2.4. Sample Testing
- (1)
- Uniaxial tensile test: By GB/T528-2009 in the universal tensile machine at a set tensile speed for uniaxial tensile test.
- (2)
- Cyclic tensile test: A tensile strain of 400% was selected for five load-unload cycles at a stretch rate of 500mm/min.
2.5. Yeoh Model Under Uniaxial Tensile Conditions for Rubber [30]
The Yeoh model is a commonly used molecular statistical constitutive model for rubber materials, which is particularly suitable for simulating the large deformation behavior of carbon black-filled natural rubber. The ANSYS finite element analysis software also categorizes it into various parameter forms such as first, second, third, fourth, and fifth orders. Rubber, being an incompressible material, has its strain energy density function model under uniaxial tensile conditions with three parameters as follows:
where Ci0 is a material constant determined by material experimentation, with the initial shear modulus μ=2C10. For uniaxial tension and incompressible materials:
Because:
Then:
The three-parameter Yeoh constitutive relationship model for rubber is:
By conducting uniaxial tensile tests on rubber samples prepared using different coagulation methods, the strain and stress data obtained from the tests can be fitted using the above equations to determine the Yeoh model parameters C10, C20, C30.
2.6. Strain Rate-Related Three-Parameter Yeoh Model
The Yeoh model cannot well simulate the stress-strain curve in the small strain region, mainly because, at the initial stretch, the stretching speed must rapidly increase from zero to the specified rate within a short period, resulting in a non-constant strain rate in the small strain region. Since the Yeoh model is a function related to the principal strain obtained by fitting uniaxial tensile test data and does not contain parameters and variables related to strain rate and time, it causes the fitting curve in the small strain area (<100%) to not coincide with the experimental curve. To solve this problem, different strain rates are designed for uniaxial tensile tests in the small strain region to refit the model parameters, and a strain rate-related factor ט is introduced to modify the Yeoh model equation.
2.7. Determination and Application of the Modified Yeoh Model Parameter μ [29]
A group of samples is stretched to 100% strain at different tensile speeds of 100mm/min, 200mm/min, 300mm/min, 400mm/min, and 500mm/min to measure the stress-strain curve data at each tensile speed. Selecting a certain tensile speed as the reference speed, the strain rate-related parameter μ is linearly fitted based on the introduced strain rate-related factor relationship, combined with unidirectional tensile test data and parameters simulated by the Yeoh model.
The fitted strain rate-related parameter μ is substituted into the modified Yeoh model, and the model is used to predict the uniaxial tensile stress-strain curves of the group of rubber materials at different strain rates within the small strain range. The predictions are then compared with the actual stress-strain curves to verify the accuracy of the model.
3. Results and Discussion
3.1. Stress-Strain Curves of Natural Rubber Materials under Different Coagulation Methods
As seen in Figure 1, the stress-strain curves for rubber obtained via five different coagulation methods exhibit a consistent trend. The differences become increasingly evident in the medium to large strain region, i.e., beyond 200%. In terms of mechanical properties, the samples produced by enzyme-assisted microbial coagulation exhibited a higher elongation at break and slightly greater tensile strength, whereas the tensile strength of samples from natural and acid coagulation was relatively lower. It is also noticeable that at the same strain, the modulus of the samples from enzymatic and microbial coagulation was relatively higher. This is primarily because non-rubber components facilitate the construction of the natural rubber vulcanization network [3]. Enzymatic and microbial coagulation involves more intense material transformations and a richer variety of non-rubber components, resulting in a more extensive network crosslinking and a better overall performance compared to rubber obtained through natural and acid coagulation [31,32].
3.2. Impact of Coagulation Method on the Yeoh Model Parameters under Uniaxial Tensile Conditions for Rubber
The stress-strain data from uniaxial tensile tests on rubber samples produced by different coagulation methods were fitted using the Yeoh model equation. Comparisons between the five fitted curves and the experimental stress-strain curves are shown in Figure 2, and the Yeoh model parameters C10, C20, and C30 were obtained in Table 2. These parameters directly affect the accuracy and effectiveness of the simulation results.
C10 represents the initial shear modulus. As the second coefficient C20 is positive, the material hardens during moderate deformation, but due to the third coefficient C30 being negative, it softens under large deformations. There is a larger error in the small strain region, but the results align well with experimental outcomes in the moderate to large strain regions.
Since the material parameter C10 represents half of the shear modulus at small strains [33], the initial shear modulus of rubber samples prepared by the five coagulation methods, from largest to smallest, is as follows: natural coagulation, microbial coagulation, enzymatic coagulation, enzyme-assisted microbial coagulation, and acid coagulation. The material parameter C20 indicates the hardening phenomenon of filled rubber under moderate deformation. The greater the C20, the harder the rubber material is. It can be seen that in moderate deformation, the hardness of rubber samples prepared by the five coagulation methods, from hardest to softest, is as follows: enzymatic coagulation, microbial coagulation, acid coagulation, natural coagulation, and enzyme-assisted microbial coagulation. The material parameter C30 indicates the softening of filled rubber under large deformation. The larger the C30, the more easily the rubber material softens. Therefore, the order of the rubber samples prepared by the five coagulation methods in terms of ease of softening under large deformation is as follows: natural coagulation, enzymatic coagulation, acid coagulation, microbial coagulation, and enzyme-assisted microbial coagulation.
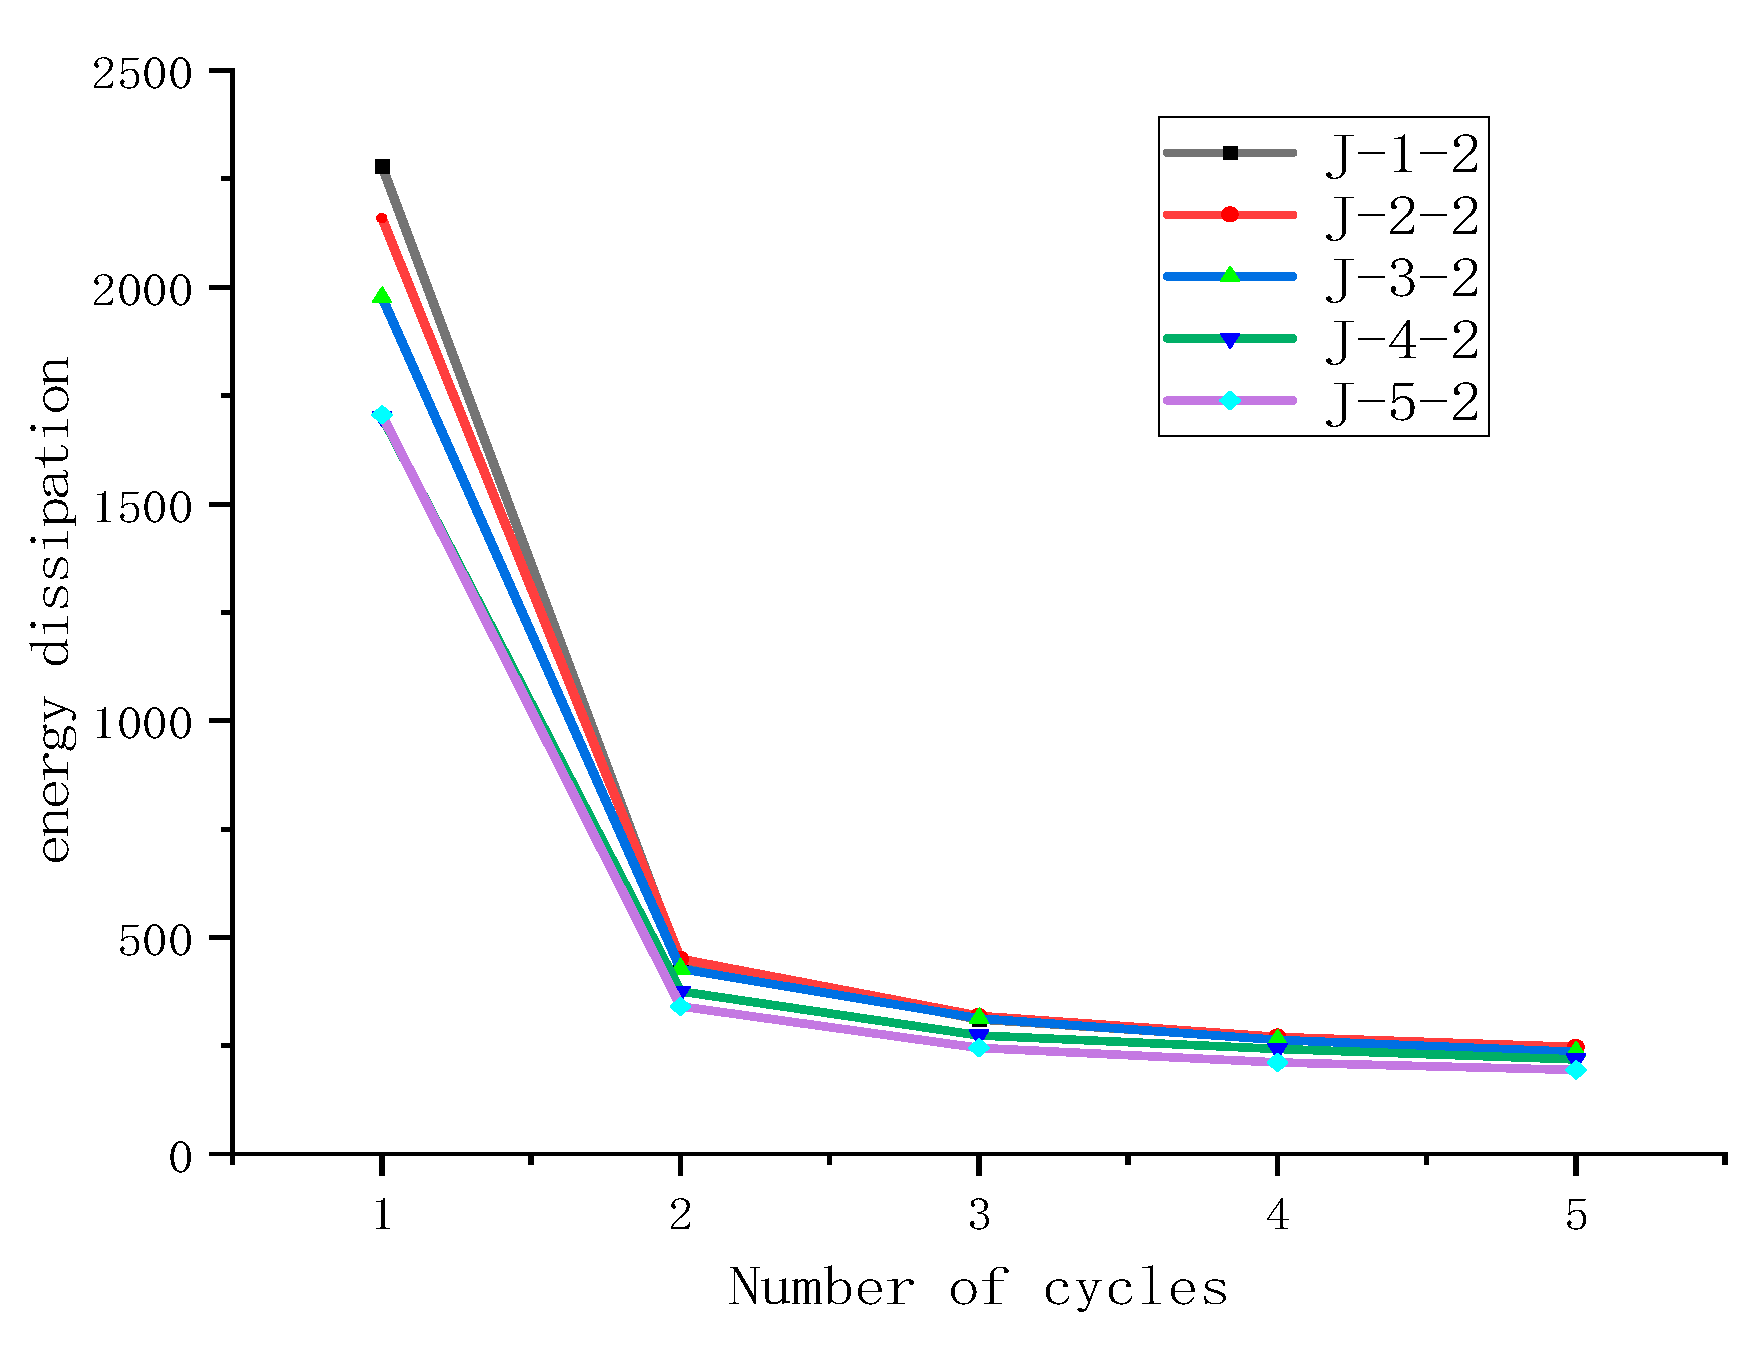
3.3. Effect of Coagulation Method on Energy Dissipation Capacity of Natural Rubber Composites During Cyclic Stretching
Observations from the cyclic stretching curves at a fixed strain of 400% and the energy dissipation of the five samples show that the energy dissipation decreases gradually with an increasing number of cycles, exhibiting the typical Mullins effect [34]. The differences in energy dissipation are more pronounced during the first stretch but become less significant thereafter. For rubber materials, a portion of the dissipated energy contributes to deforming the network structure, leading to material deformation and thus providing the rubber with shock-absorbing functionality. The extent of deformation is related to the softness or hardness of the material; hence, samples with greater energy dissipation indicate a tendency for easier deformation or a relatively softer characteristic. Therefore, the results of the cyclic stretching tests suggest that the coagulation methods leading to easier deformation of the rubber material are, in order, natural coagulation, enzymatic coagulation, acid coagulation, microbial coagulation, and enzyme-assisted microbial coagulation—consistent with the hardness rankings under large strain predicted by the Yeoh model.
Figure 3.
Effect of Coagulation Method on the cyclic stretching curves.
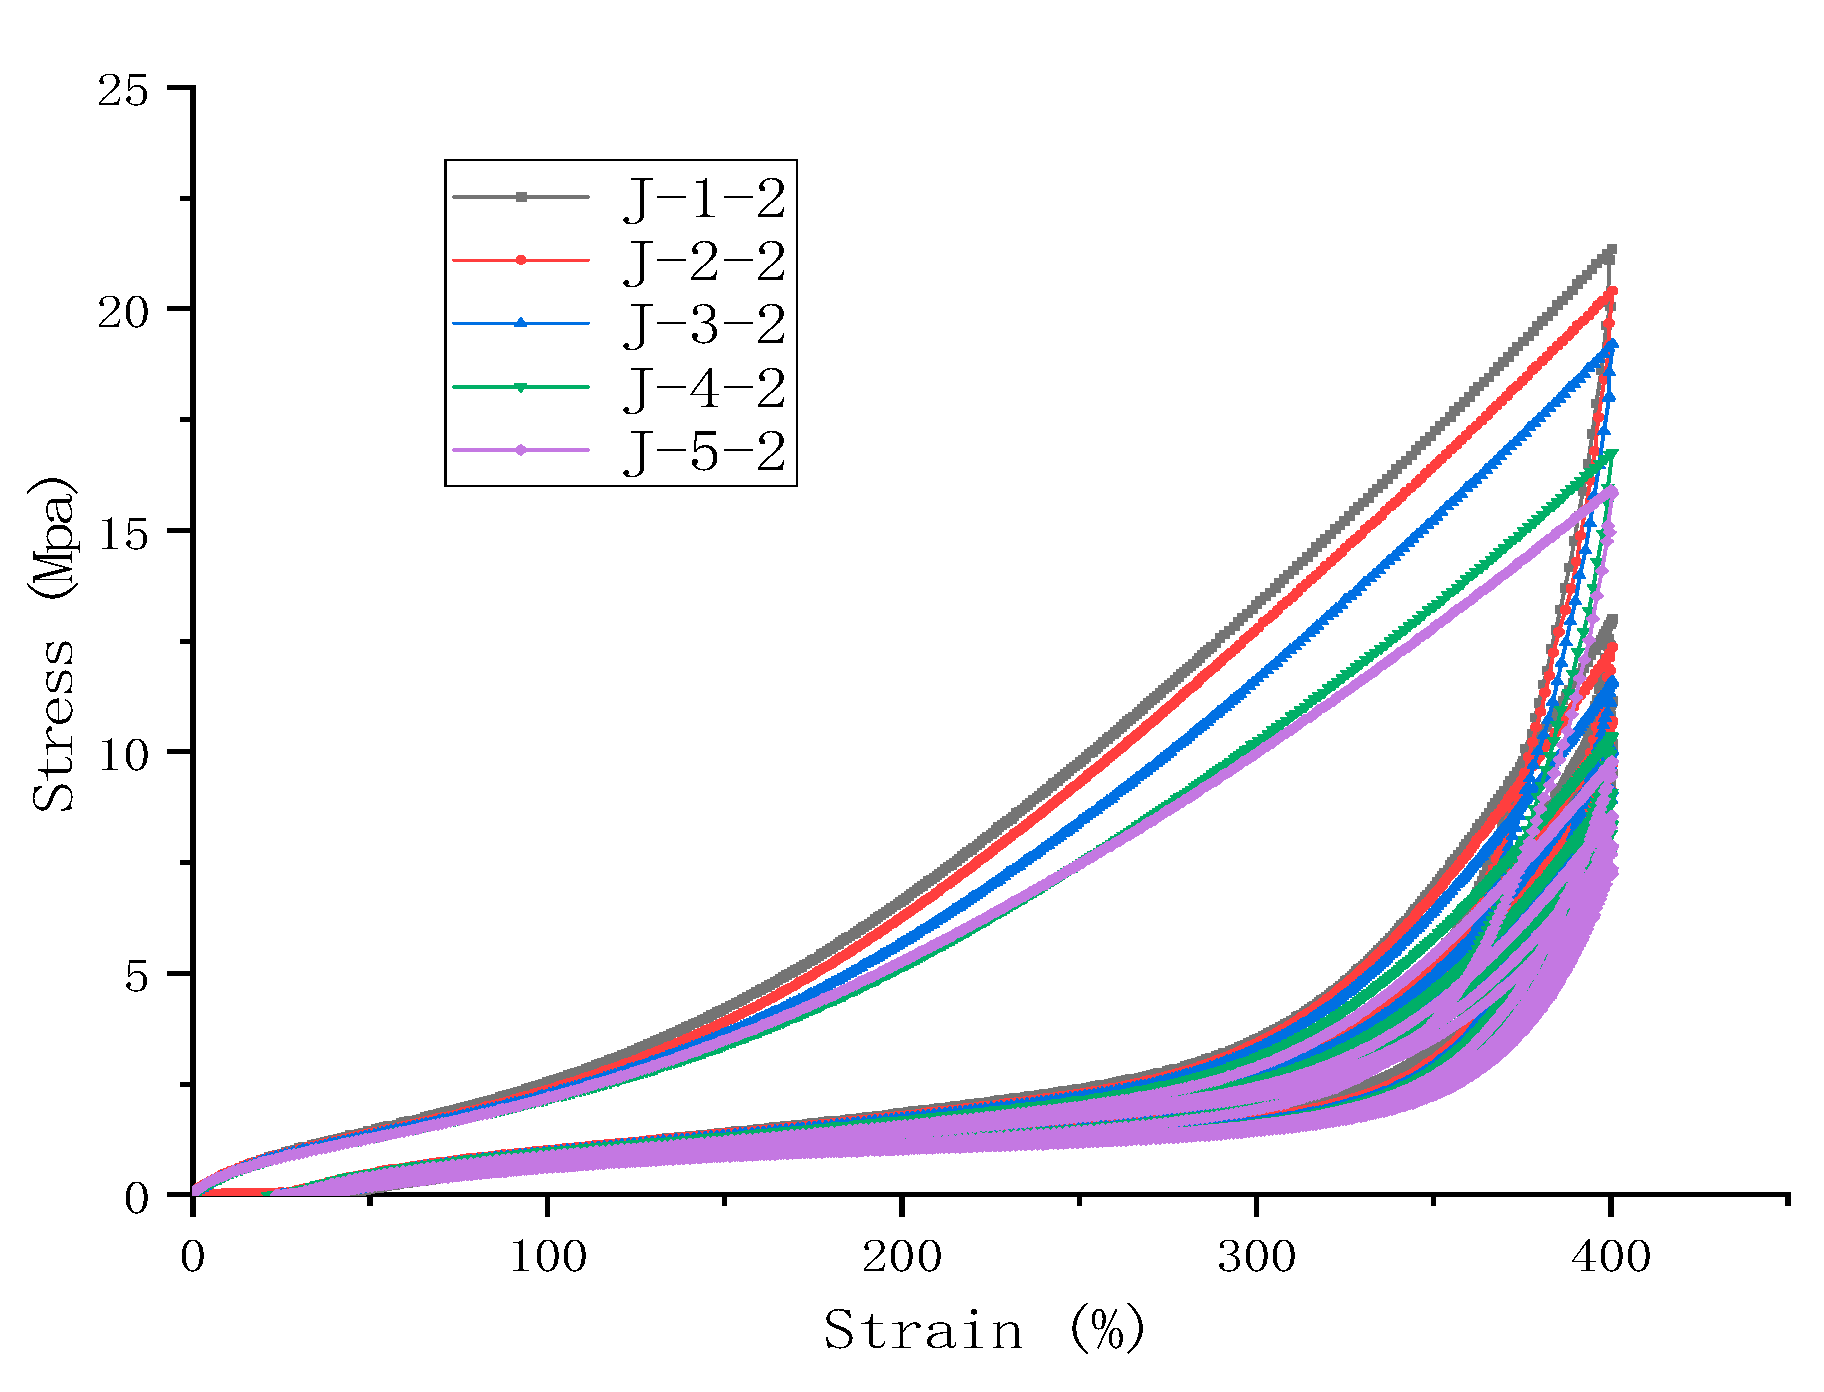
Figure 4.
Effect of Coagulation Method on Energy Dissipation.
3.4. Optimization of the Yeoh Model Parameters
Comparing the fitted curves of the Yeoh model with the experimental curves, the Yeoh model can describe the mechanical behavior of natural rubber carbon black composites well in the moderate and large strain regions. However, there is a significant error in the small strain region. It has been proposed that different forms of constitutive models must be adopted within different strain ranges [35], but this approach is cumbersome. To address this issue, uniaxial tensile tests with different strain rates were conducted in the small strain region to refit the model parameters, introducing a strain rate-related factor, ט, to modify the Yeoh model equation.
Based on previous research, the strain rate-related factor, ט, can be represented by the following exponential function [29]:
where is the ratio of strain rates, is the actual strain rate obtained by the tensile machine at a certain stretching speed, andis a reference strain rate taken from one of the rates in a set of experiments.
After introducing the strain rate-related factor, the Yeoh model can be written as:
This is the three-parameter Yeoh model related to strain rate, and the modified Yeoh model can reflect the influence of strain rate on the hyperelastic properties of the rubber material in the small strain region.
3.5. Determination of the Modified Yeoh Model Parameter μ
Select a rubber sample prepared by the natural coagulation method and cut it into several sets of dumbbell-shaped films. The films were stretched to 100% strain at different stretching speeds, and the differences between the theoretical and actual strain rates at different speeds are shown in Table 3.
Selecting a stretching speed of 300mm/min as the reference speed, setting the actual strain rate at this speed as the reference strain rate , and setting the model parameter C10 at this speed as the reference , the relationship between the strain rate , model parameter at other stretching speeds and the reference speed ,is as follows:
Equation (9) is transformed into:
Combining the uniaxial tensile test data and the parameters simulated by the Yeoh model, the strain rate-related parameter μ can be linearly fitted using the equation above.
The actual stress-strain curve at the reference speed of 300mm/min and the fitted curve of the Yeoh model are shown in Figure 5.
The reference strain rate at the reference speed is 0.1105/s, and the simulated C10, which is , is 0.01273. The strain rates and simulated parameters at other stretching speeds are shown in Table 4. According to Equation (10), the strain rate-related parameter μ is linearly fitted to be 0.251, which is shown in Figure 6.
For the same batch of rubber samples, the strain rate-related parameter μ is constant. For different batches of samples, the strain rate-related parameter μ will not be the same and needs to be recalculated according to the same method.
3.6. Application of the Modified Yeoh Rubber Model
Substitute the relevant parameter (μ= 0.251) into the Yeoh-modified model (8), and still select the same sample in 2.5 as the experimental object. Using the stress-strain curve data of the sample at a stretching speed of 300mm/min as a basis, the theoretical stress-strain curve data for each stretching speed were calculated according to the modified Yeoh equation. The mechanical behavior at different strain rates was forecasted, with results depicted in the following Figure 7. It can be observed that the predictions of the modified model at various stretching speeds align well with the actual stress-strain curves, especially at a stretching speed of 500mm/min, where the stress-strain curve shows a marked improvement in the small strain region compared to the unmodified model.
Predicted uniaxial tensile stress-strain curves at five different stretching speeds are shown in Figure 8, indicating that the modified model accurately forecasts the stress-strain relationship trends of rubber materials at different strain rates without the need to refit parameters. It is also evident that varying stretching speeds have a significant impact on the material's stress-strain curves, with higher speeds resulting in steeper slopes of the curves. This further confirms the inability of the Yeoh model to accurately simulate behaviors in the small strain range.
The figure also reflects the influence of strain rate on the hyperelastic properties of the materials within the small strain region. Rubber materials display similar nonlinear behavior in the forecasted stretching results at different strain rates. The stiffness of the material decreases with increasing applied strain, while at a constant strain, the stiffness increases with an increasing strain rate. Therefore, the initial stiffness is closely related to the strain rate—the higher the strain rate, the greater the material stiffness (i.e., modulus). This phenomenon is consistent with the conclusions of Sanghyeub Kim et al. [36], who found that different strain rates lead to variations in the entanglement and disentanglement of chains in uncured rubber. In vulcanized rubber, a network of chain entanglements also exists, and the contribution of this network to the modulus significantly increases under high-speed strain [37].
3.7. The Impact of Distinct Coagulation on the Modified Model Parameters of Rubber in Small Strain Regions
The five rubber samples were stretched to 100% strain at different tensile speeds of 300mm/min and 500mm/min. The tensile speed of 300mm/min was selected as the reference speed, and the model parameters were calculated according to the formula (9). The following Table 5 shows the changes in the model parameters (C10) before and after the modification.
As seen in Table 5, after the modification, the model parameter C10 increased for all five samples, and the differences between them were amplified, However, there is no change in the order of their values, indicating that the natural coagulant is still the largest and the acid coagulant is the smallest in terms of modulus, which is in agreement with the results of the study before the model modification.
4. Conclusions
Natural rubber carbon black composites were prepared using five different fresh latex coagulation methods: natural, acid, enzymatic, microbial, and enzyme-assisted microbial coagulation. The influence of these coagulation methods on the hyperelastic constitutive model parameter characteristics of the natural rubber carbon black composites was investigated based on the three-parameter Yeoh model. The results indicate that the Yeoh model accurately describes the mechanical behavior of natural rubber carbon black composites in both moderate and large deformation regions, and the properties of the material reflected by the model parameters are consistent with the results of cyclic tensile tests. The performance of rubber under small, medium, and large deformations is different for different coagulation methods. The modulus of natural coagulation rubber is the highest in small deformations, the modulus of enzyme coagulation rubber is the highest in medium deformations and the modulus of enzyme-assisted microbial coagulation rubber is the highest in large deformations so that the appropriate coagulation method can be selected according to the degree of deformation of the rubber required by application scenarios in the practical application.
Addressing the significant error of the Yeoh model in describing the mechanical behavior of natural rubber carbon black composites in the small strain region, a strain rate-related factor was introduced to modify the Yeoh model. The modified strain rate-related three-parameter Yeoh model accurately predicts the stress-strain curves of rubber materials at different stretching speeds within the small strain range. Moreover, it resolves the issue of the unmodified model requiring multiple parameter fits at different strain rates. With the modified model, fitting parameters at a single reference strain rate suffices to predict the mechanical behavior of rubber materials at other strain rates. This ensures that the simulation model's stress-strain characteristics at varying strain rates are consistent with experimental data, enhancing the precision of subsequent simulations.
Author Contributions
Conceptualization, L.D. and H.H.; methodology, L.D., and H.G.; software, L.D.; validation, Y.W., H.H., and L.D.; formal analysis, L.D. and J.L.; investigation, L.D., and H.H.; resources, H.G. and Y.C.; data curation, L.D., Y.W., and H.H.; writing—original draft preparation, L.D.; writing—review and editing, Y.C.; visualization, L.D.; supervision, J.L.; project administration, Y.C.; H.G. funding acquisition, H.G. All authors have read and agreed to the published version of the manuscript.
Funding
This research was funded by the National Key R&D Program of China (No. 2022YFD2301203), and the Hainan Province Science and Technology Special Fund (No. ZDYF2024XDNY284).
Institutional Review Board Statement
Not applicable.
Data Availability Statement
Data are contained within the article.
Conflicts of Interest
The authors declare no conflicts of interest.
References
- He, Y.P. Natural Rubber Processing Science. 3: Haikou: Hainan Publishing House 2007, 2007. [Google Scholar]
- Ng, J.W.; Othman, N.; Yusof, N.H. Various coagulation techniques and their impacts towards the properties of natural rubber latex from Hevea brasiliensis- a comprehensive review related to tyre application. Industrial Crops & Products 2022, 181, 114835. [Google Scholar] [CrossRef]
- Wei, Y.C.; Liu, G.X.; Zhang, L.; Zhao, F.; Liao, S.; Luo, M.C. , Shuang-Quan, L. Non-rubber components tuning mechanical properties of natural rubber from vulcanization kinetics. Polymer 2019, 183, 121911.. [Google Scholar] [CrossRef]
- Wang, G.S.; Fu, Z.N.; F, X. Effect of different coagulation methods on the properties of natural rubber. Chemical Engineer 2014, 28(05), 11–13. [Google Scholar]
- Salomez, M.; Subileau, M.; Vallaeys, T.; Santoni, S.; Bonfils, F.; Sainte-Beuve, J.; Intapun, J.; Granet, F.; Vaysse, L.; Dubreucq, E. Microbial communities in natural rubber coagula during maturation: Impacts on technological properties of dry natural rubber. J.Appl. Microbiol. 2018, 124, 444–456. [Google Scholar] [CrossRef]
- Bai, W.N.; Guan, J.; Liu, H.; Cheng, S.H.; Zhao, F.C.; Liao, S.Q. Microstructure and Lamellae Phase of Raw Natural Rubber via Spontaneous Coagulation Assisted by Sugars. Polymers 2021, 13, 4306. [Google Scholar] [CrossRef] [PubMed]
- Liang, Y.; Huang, M.F.; Zeng, Z.Q. Molecular Structures and Mechanical Properties of Microbe Rapid Coagulation Natural Rubber. Chinese J. Struct. Chem. 2011. 30(12):1810~1819. [CrossRef]
- Chen, J.; Li, S.D.; Li, L.F.; Wang, Z.F.; Yang, L.; Zhong, J.P. Contrastive Study on Properties of Acid and Microorganisms Coagulated Natural Rubber during Accelerated Storage. Journal of Rubber Research 2018, 21, 17–29. [Google Scholar] [CrossRef]
- Li, S.D.; Chen, J.; Li, L.F. , Wang, Z. Vulcanization characteristics of natural rubber coagulated by microorganisms. Rubber Chem. Technol. 2018, 91(1), 64–78. [Google Scholar] [CrossRef]
- Deng, D.Y.; Zhao, T.; Ding, L.; Li, J.; Huang, H.H.; Liao, J.H.; Gui, H.X. Effect of enzyme dosage assisted microbial coagulation on properties of natural rubber. China Elastomerics 2023, 33 (01), 1-4+39.
- Hutapea, Y.; Eliza Maryana, Y.; Karman, J.; Hanapi, S.; Raharjo, B. The effects of coagulant types on the quality and added value of raw rubber materials. E3S Web of Conferences 2022, 361, 01001. [Google Scholar] [CrossRef]
- Jidapa, N.; Frédéric, B.; Natedao, M.; Sainte-Beuve, J.; Albert, F.; Siriluck, L.; Kittipong, R.; Francoise, G.; Laurent, V. Post-harvest maturation of Hevea brasiliensis latex coagula: ranking of the key drivers of the mesostructure and physical properties of natural rubber. Journal of Rubber Research 2022, 25, 5–18. [Google Scholar] [CrossRef]
- Achmad, F.; Deviany, D. The Effect of Averrhoa Bilimbi Extract as Natrual Coagulants on the Characteristics of rubber. Konversi 2022, 11(1), 44–51. [Google Scholar] [CrossRef]
- Yanter, H.; Yeni, E. M.; Joni, K.; Sidiq, H.; Budi, R. The effects of coagulant types on the quality and added value of raw rubber materials. E3S Web of Conferences 2022, 361, 01001. [Google Scholar] [CrossRef]
- Chen, L.; Xin-Yu, Z.; Guo-Lin, W. ; Chang-Da, L.Test and Simulation Analysis of Tire Inflation Pressure Loss.Tire Science and Technology 2020, 48(4), 329-353. [CrossRef]
- Luyen, T.T.; Mac, T.B.; Nguyen, D.T. Simulation and experimental comparison study based on predicting forming limit curve of sus304 sheet material.Modern Physics Letters, B. Condensed Matter Physics, Statistical Physics, Applied Physics 2023, 37(16), 257271272. [CrossRef]
- Nguyen, D. T.; Young-Suk, K. Combined numerical and experimental study to predict the forming limit curve of boron steel sheets at elevated temperatures.Proceedings of the Institution of Mechanical Engineers, Part B. Journal of engineering manufacture 2020, 234(2), 189–203. [Google Scholar] [CrossRef]
- Berger, T.; Kim, S.; Kaliske, M. A Microsphere-Based Rubber Curing Model for Tire Production Simulation. Tire Science and Technology 2023, 51(2), 82–113. [Google Scholar] [CrossRef]
- Wan, Q.; Xiong, Z. Simulation Analysis of Stir Tool Wear Considering the Effect of Temperature Rise caused by Material Deformation on Flow Stress. Current Materials Science 2023, 16(2), 225–234. [Google Scholar] [CrossRef]
- Han, F.; Li, Z.B.; Zhang, J.Y.; Liu, Z.Y.; Yao, C.; Han, W.P. ABAQUS and ANSYS Implementations of the Peridynamics-Based Finite Element Method (PeriFEM) for Brittle Fractures. Computer Modeling in Engineering & Sciences 2023, 136(3), 2715-2740. [CrossRef]
- Parvathidevi, A.; Naga Satish, K. Ch.Thermal analysis of concrete slabs with insulating materials using ANSYS. World journal of engineering 2024, 21(1), 156–169. [Google Scholar] [CrossRef]
- Zeng, J.; Li, J.Y.; Dong, S.; Wang, F.H.; Wang, F.L.; Jin, L.; Dong, J. Optimization of Hot Backward Extrusion Process Parameters for Seamless Tube of Mg-8Gd-3Y Alloy by Finite Element Simulation.Journal of Materials Engineering and Performance 2024, 33(5), 2453-2461. [CrossRef]
- Yoon, I. C.; Kang, I. S.; Park, K. H.; Heo, J. Y.; Lee, J. R.; Jung, Y.C. Three-Dimensional Measurement and Finite-Element Simulation for Tool Wear Estimation in Cutting of Inconel 718 Superalloy. International Journal of Precision Engineering and Manufacturing 2024, 25(1), 21–34. [Google Scholar] [CrossRef]
- Wan-Bao, N.; Yan-Min, L.; Yu-Hong, M.; Gui-Feng, Z. Determination and Prediction of Time-Varying Parameters of Mooney-Rivlin Model of Rubber Material Used in Natural Rubber Bearing under Alternating of Aging and Seawater Erosion. Materials 2023, 16(13), 4696. [Google Scholar] [CrossRef]
- Santos, R.J.; Hiranobe, C.T.; Dognani, G.; Silva, M.J.; Paim, L.L.; Cabrera, F.C.; Torres, G.B.; Job, A.E. Using the Lorenz–Park, Mooney–Rivlin, and dynamic mechanical analysis relationship on natural rubber/leather shavings composites. Journal of Applied Polymer Science 2022, 139(14), 244299978. [Google Scholar] [CrossRef]
- Zhao, G.F.; Ma, Y.H.; Li, Y.M.; Luo, J.R.; Chang, D. Development of a modiffed Mooney-Rivlin constitutive model for rubber to investigate the effects of aging and marine corrosion on seismic isolated bearings. Earthquake Engineering and Engineering Vibration 2017, 16(4), 815–826. [Google Scholar] [CrossRef]
- Kuang, Y.; Fan, P.; Lin, H.W. Research on Yeoh-Revised hyperelastic constitutive model considering the volume almost incompressible premise for rubber materials. Journal of Elastomers & Plastics 2023,55(7):1123-1151. [CrossRef]
- Mars, W. V.; Fatemi, A. Observations of the Constitutive Response and Characterization of Filled Natural Rubber Under Monotonic and Cyclic Multiaxial Stress States. Journal of engineering materials and technology 2004, 126(1), 19–28. [Google Scholar] [CrossRef]
- Zhou, W.H. The study of mechanical constitutive relation rubber materials. Nanjing: Nanjing University of Aeronautics and Astronautics 2021.
- Wang, H. Application of Hyper-elastic Constitutive Models on Rubbers in Tyre Analysis. Harbin: Harbin Institute of Technology,2008.06.
- Intapun, J.; Sainte-Beuve, J.; Bonfils, F. Effect of microorganisms during the initial coagulum maturation of hevea natural rubber. Journal of Applied Polymer Science 2010, 118(3), 1341–1348. [Google Scholar] [CrossRef]
- Mélanie, S.; Maeva, S.; Tatiana, V.; Sylvain, S. Microbial communities in natural rubber coagula during maturation: impacts on technological properties of dry natural rubber. Journal of Applied Microbiology 2018, 124(2), 444–456. [Google Scholar] [CrossRef]
- Du, K.; Zhou, H.W.; Ding, M.M.; Ye, F.; Shi, T.F. Cluster Analysis of Correlation Between Rubber Carbon Black Filling and Yeoh Model Parameters. Chinese Journal of Applied Chemistry 2021, 38(6), 675–684. [Google Scholar] [CrossRef]
- Diani, J.; Fayolle, B.; Gilormini, P. A review on the Mullins effect. European Polymer Journal 2009, 45, 601–612. [Google Scholar] [CrossRef]
- Wang, L.R.; Lu, Z.H. Modeling Method of Constitutive Law of Rubber Hyperelasticity Based on Finite Element Simulations. Rubber Chemistry and Technology 2003, 76(1), 271–285. [Google Scholar] [CrossRef]
- Sanghyeub, K.; Thomas, B.; Michael, K. Strain Rate-Dependent Behavior of Uncured Rubber: Experimental Investigation and Constitutive Modeling. Rubber Chemistry and Technology 2022, 95(2), 175–199. [Google Scholar] [CrossRef]
- Huang, C.; Huang, G.S.; Li, S.Q.; Luo, M.C.; Liu, H.; Fu, X.; Qu, W.; Xie, Z.T.; Wu, J.R. Research on architecture and composition of natural network in natural rubber. Polymer 2018, 154, 90–100. [Google Scholar] [CrossRef]
Figure 1.
Stress-Strain Curves of Natural Rubber Materials under Different Coagulation Methods.
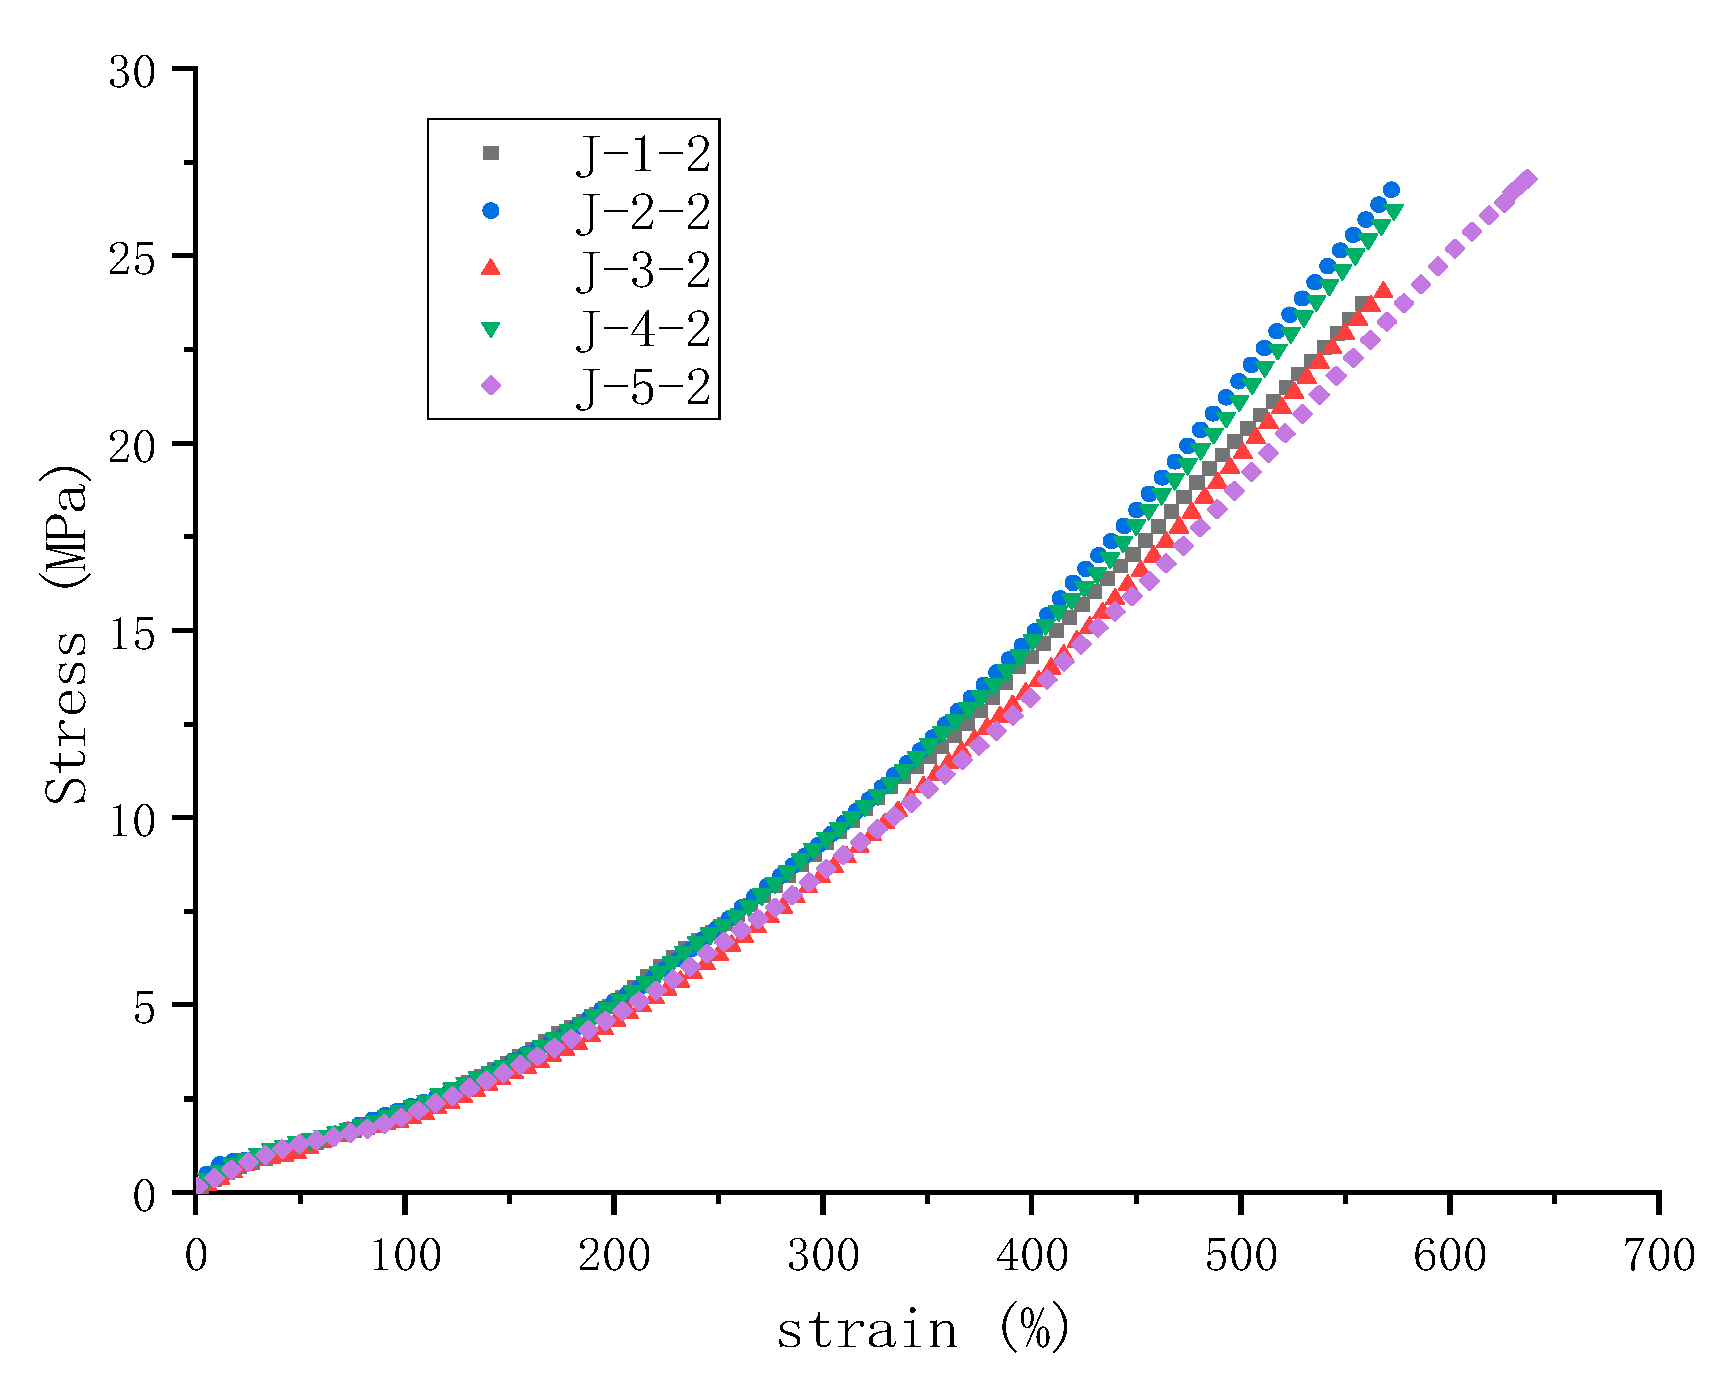
Figure 2.
Yeoh model’s fitting curve of rubber samples :(a) J-1-2; (b) J-2-2; (c) J-3-2; (d) J-4-2; (e) J-5-2.
Figure 2.
Yeoh model’s fitting curve of rubber samples :(a) J-1-2; (b) J-2-2; (c) J-3-2; (d) J-4-2; (e) J-5-2.
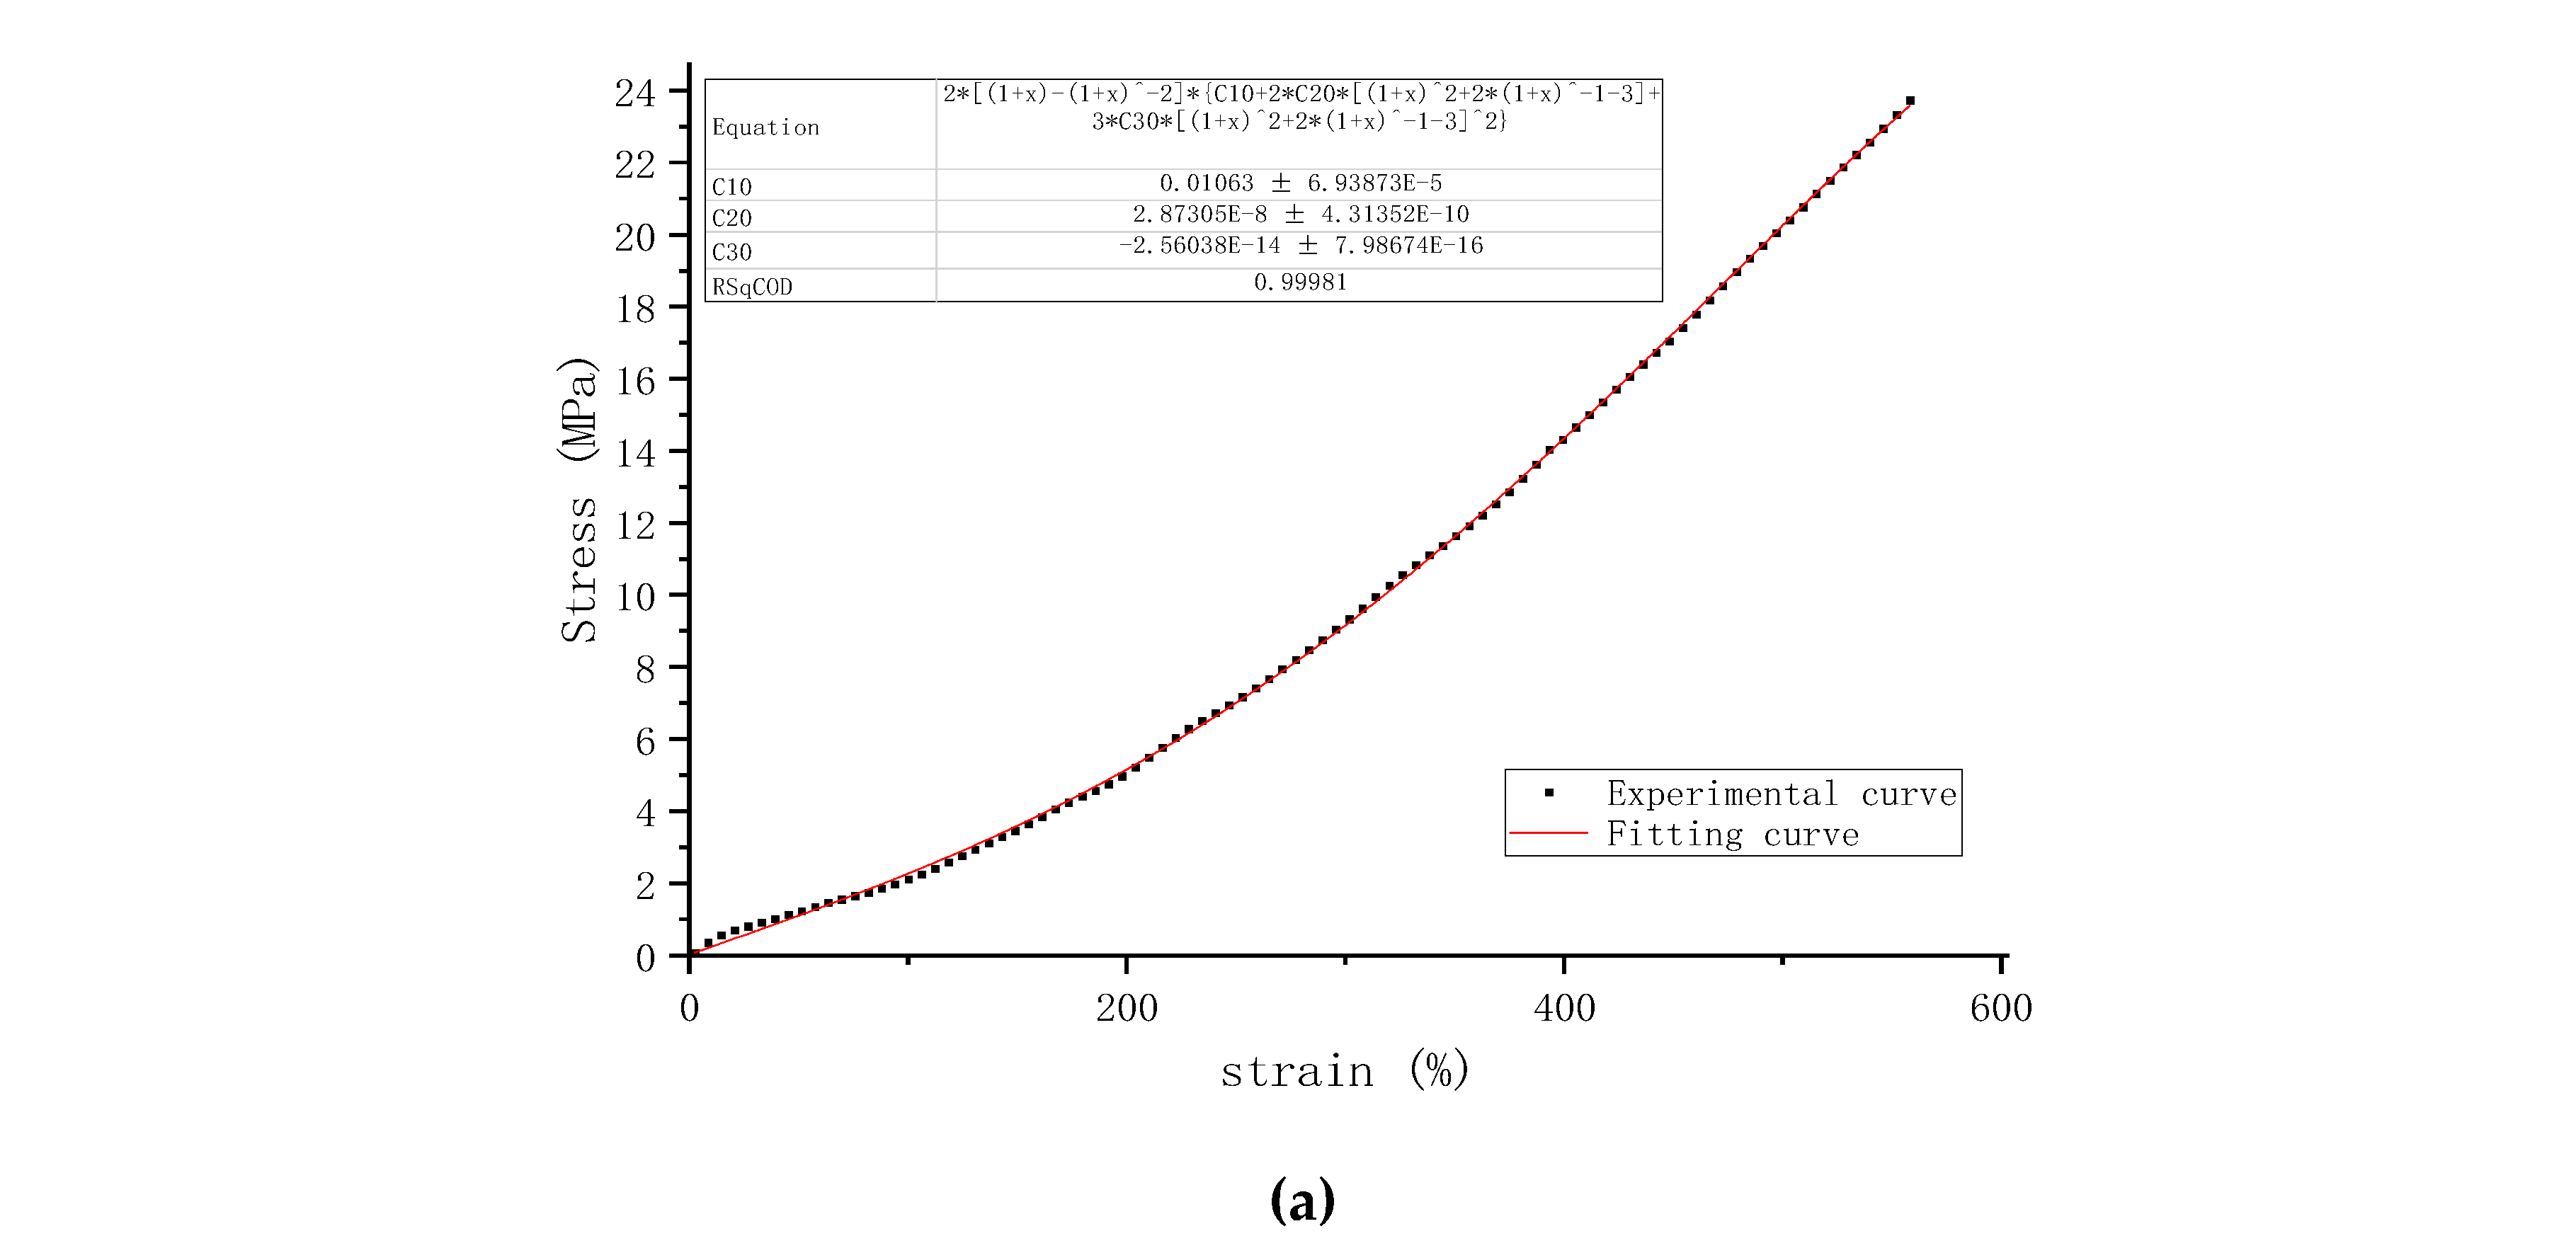
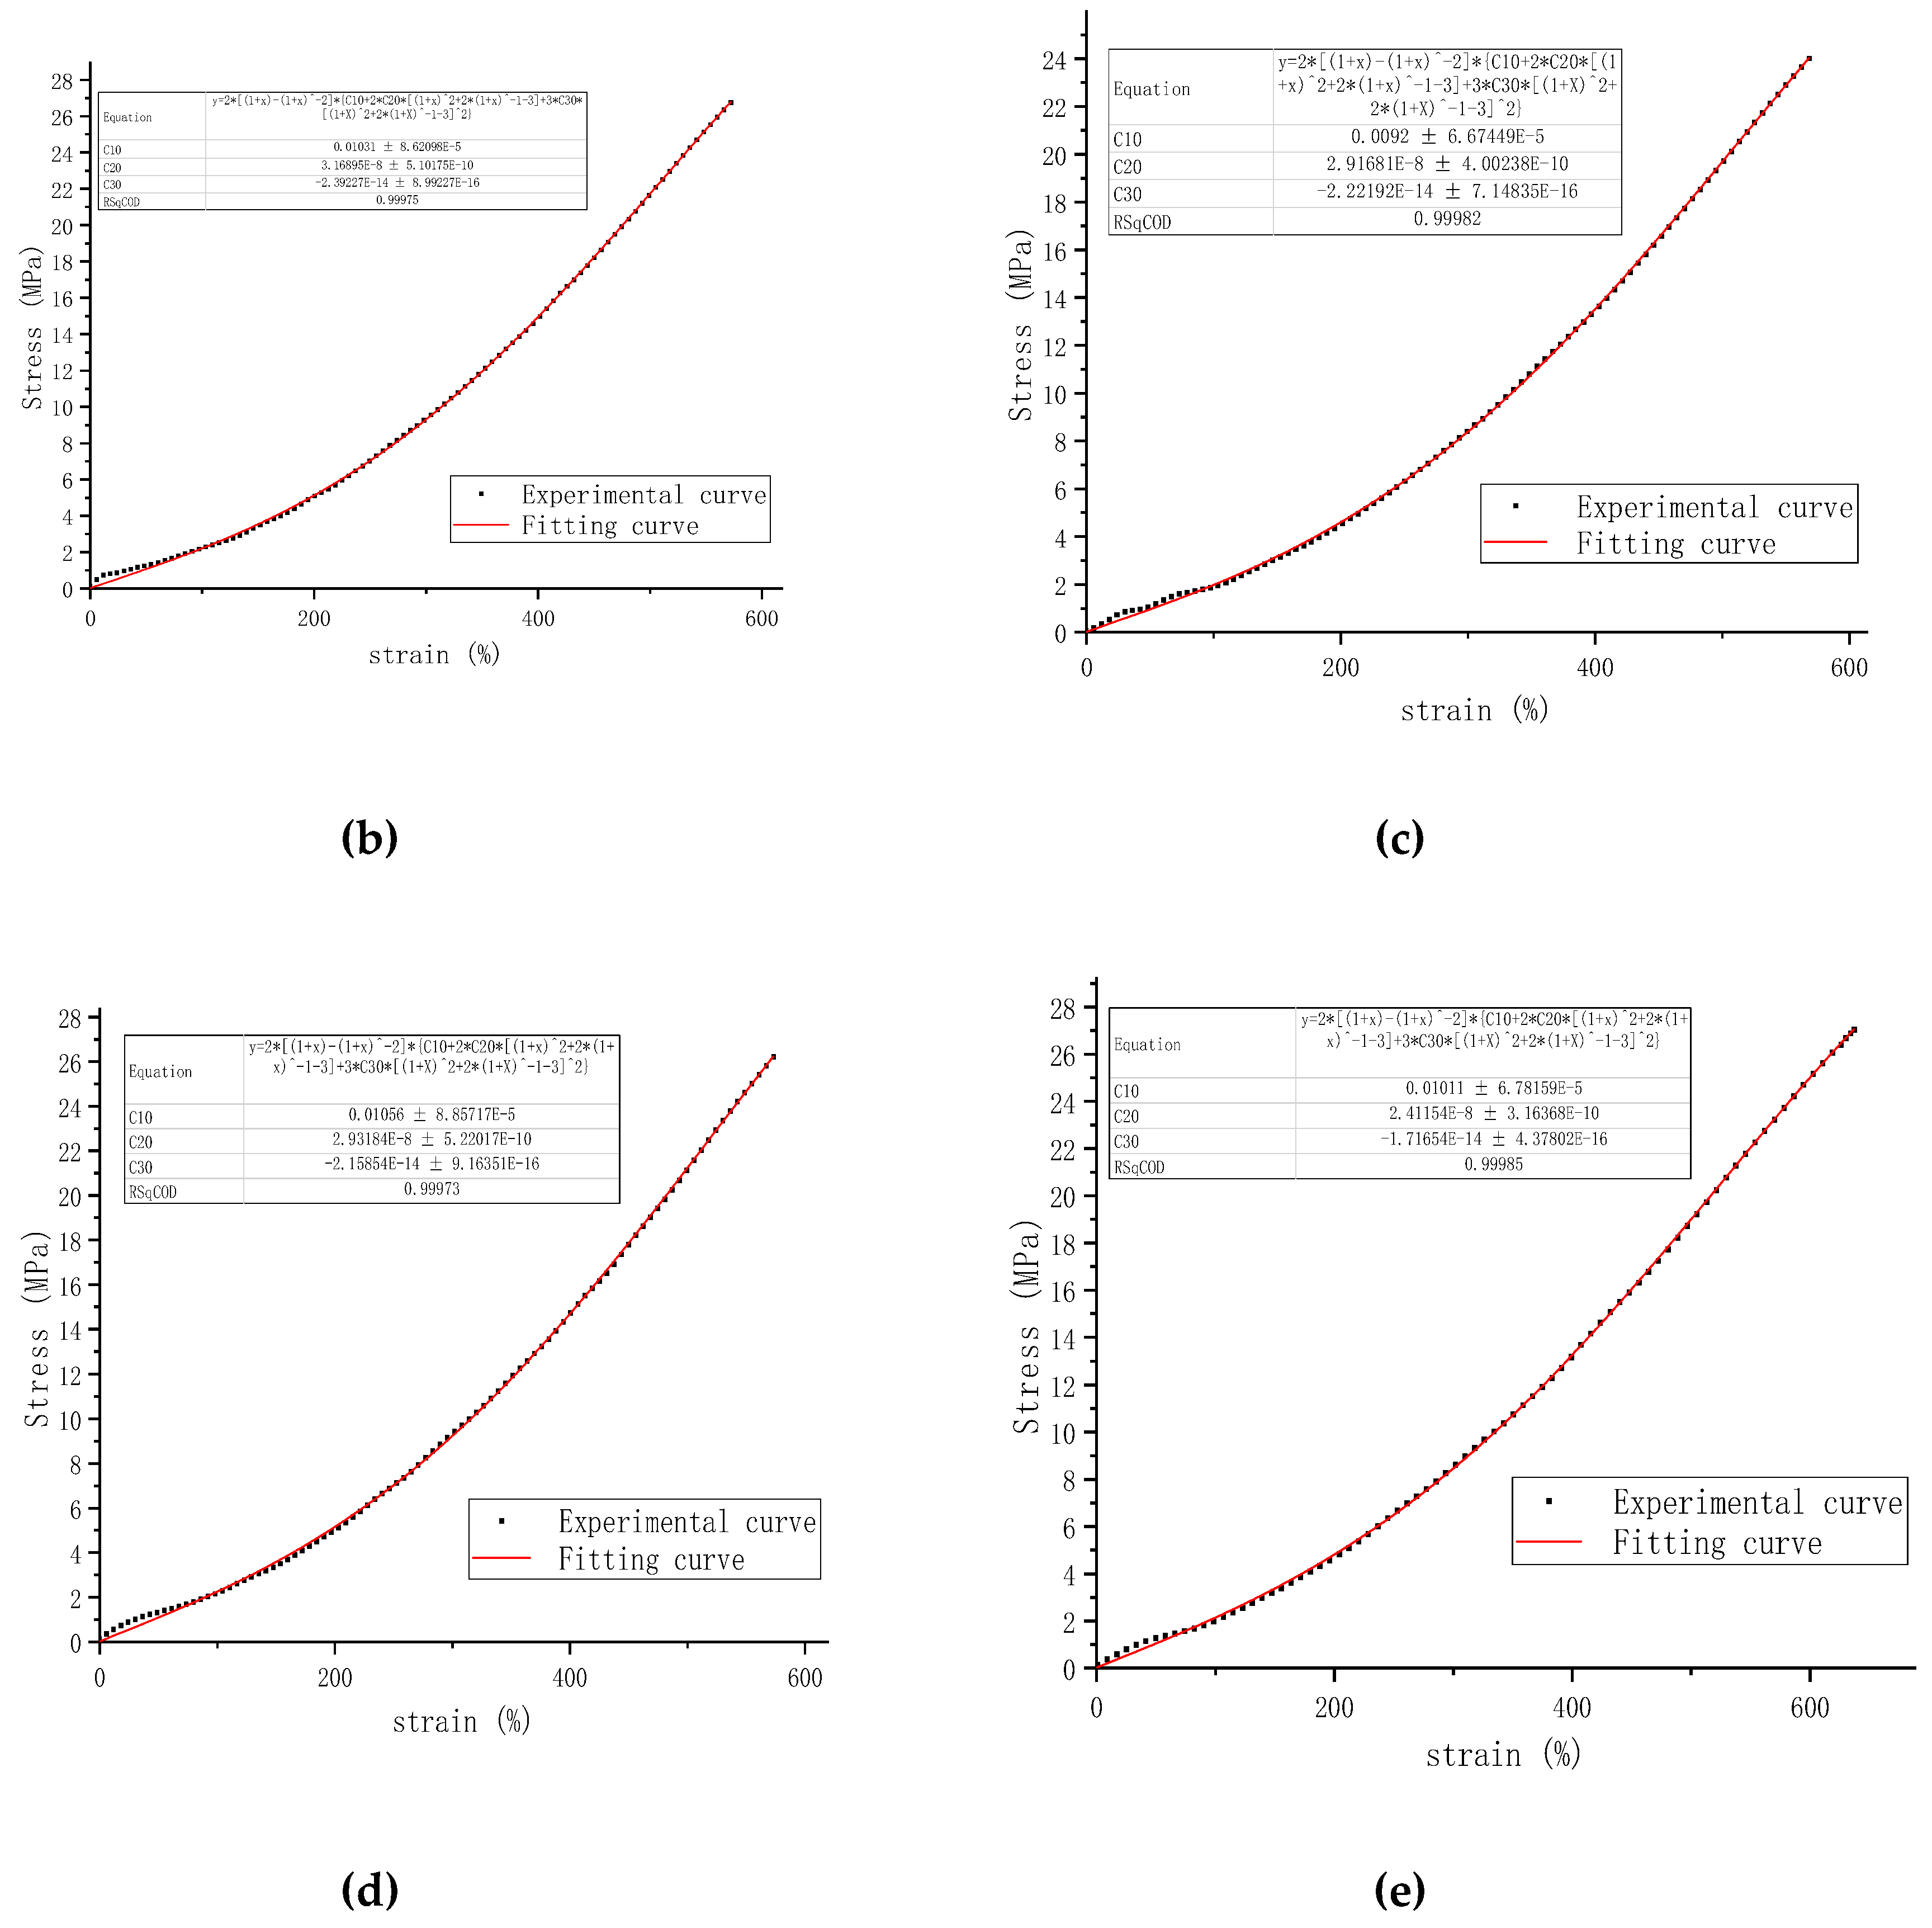
Figure 5.
The actual stress-strain curve and the fitting curve at the reference speed of 300mm/min.
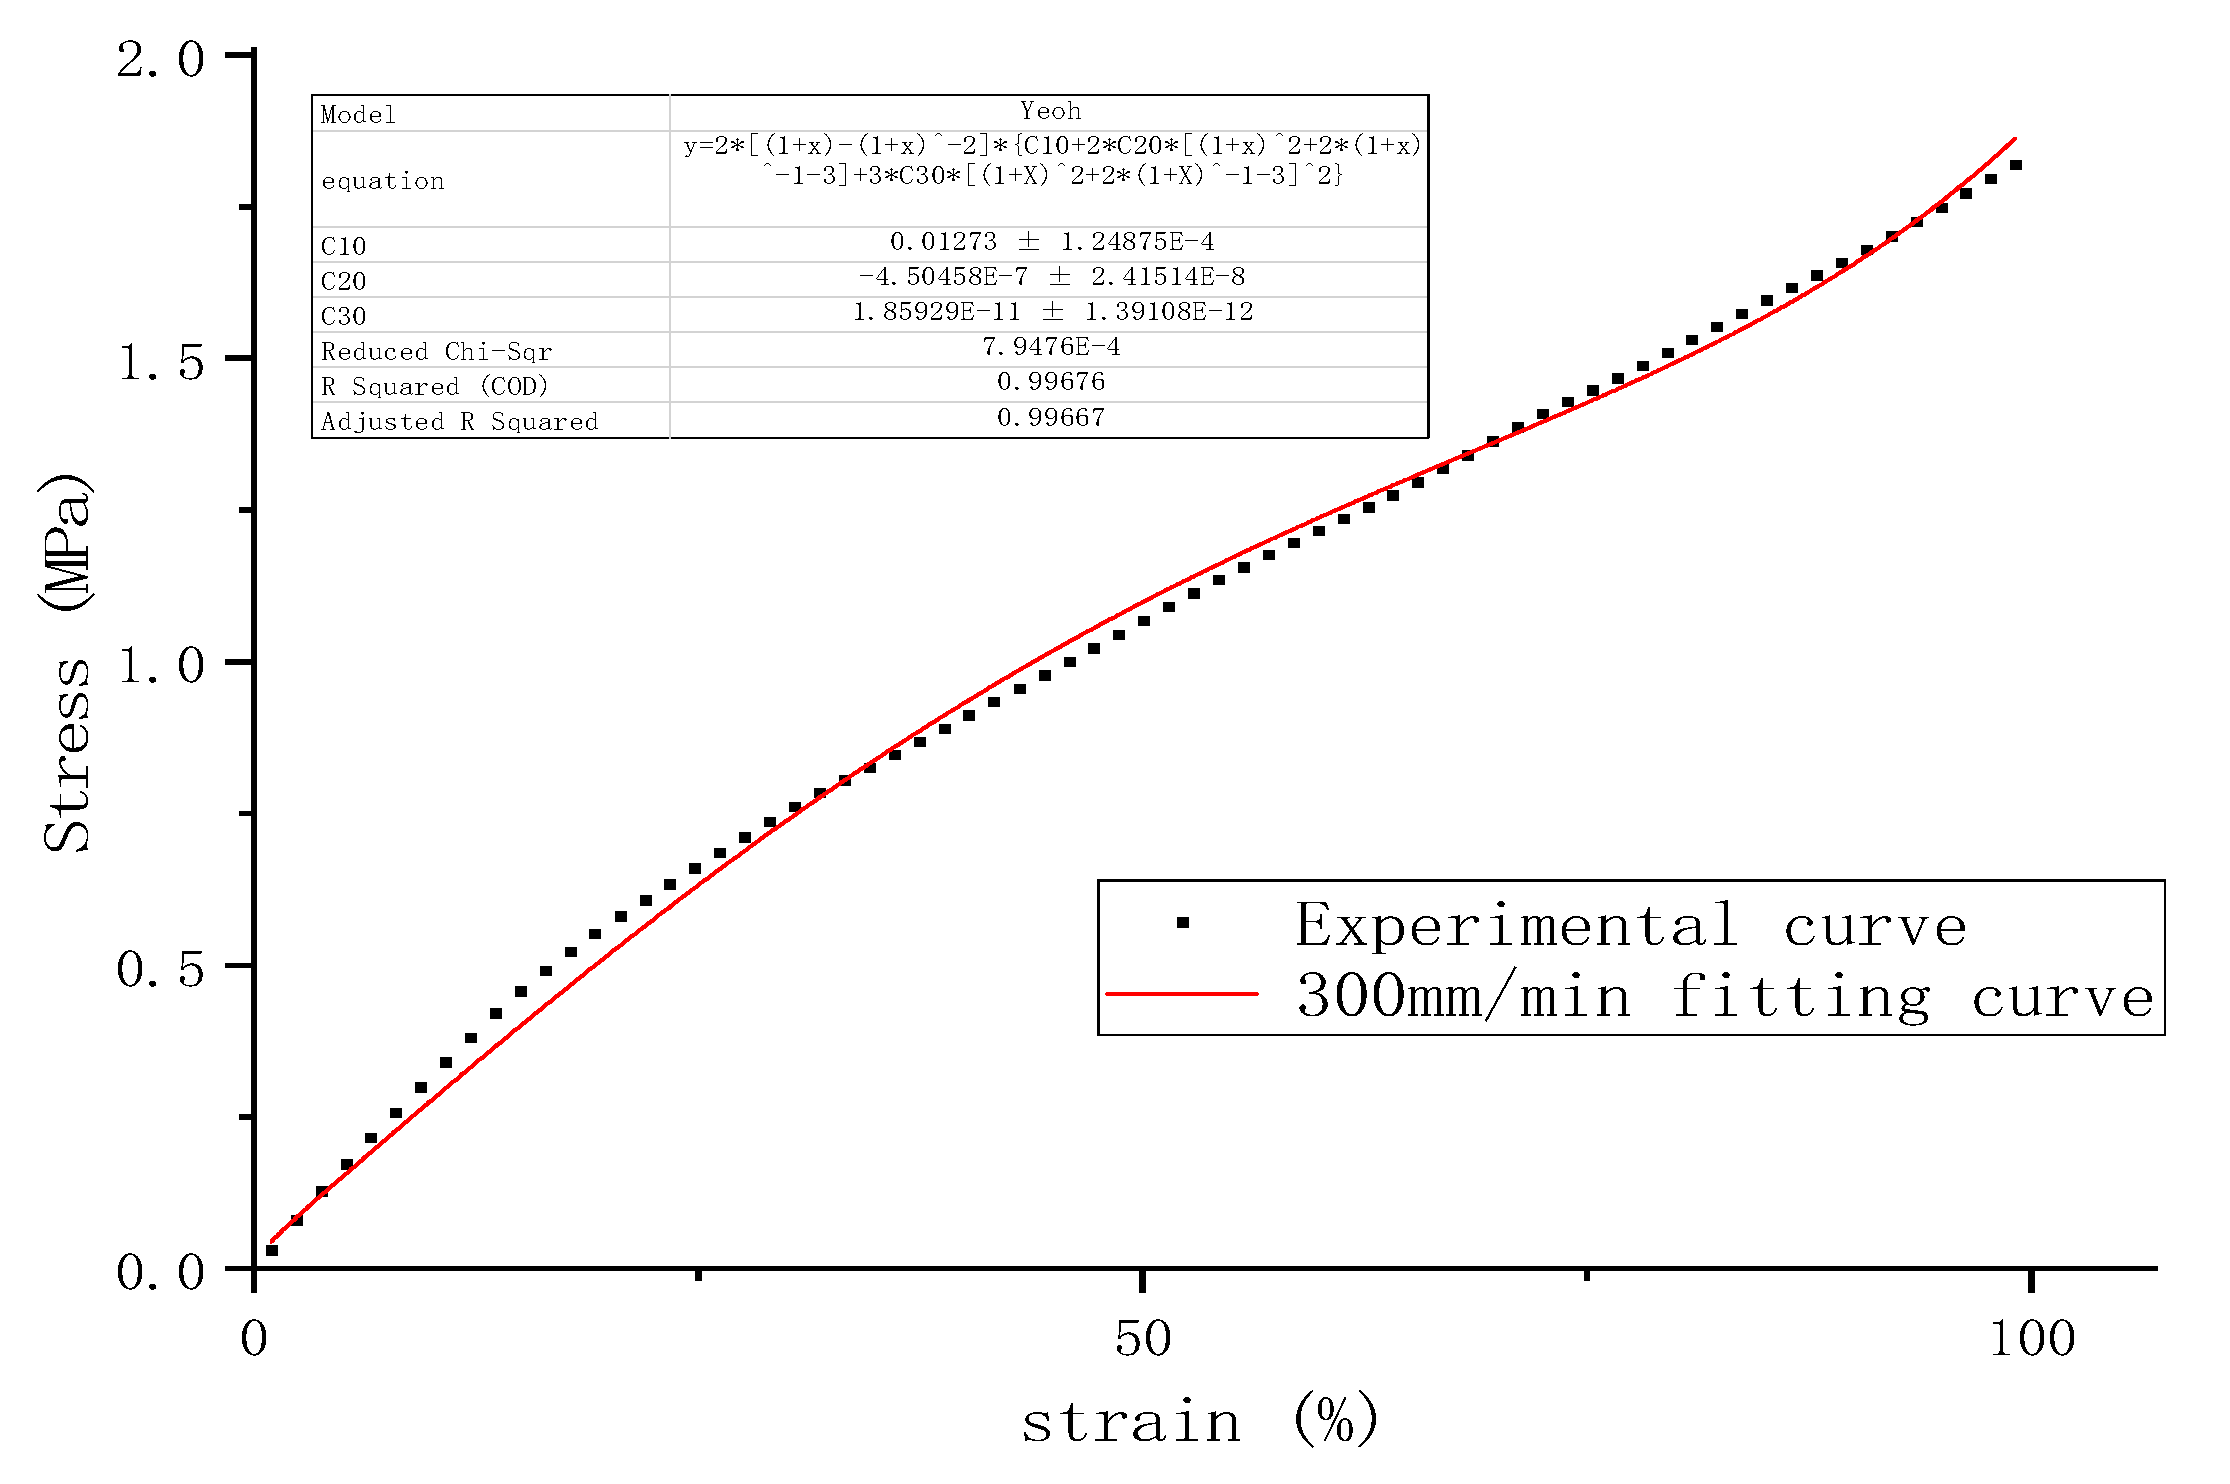
Figure 6.
Linear fitting of the strain rate-related parameter μ.
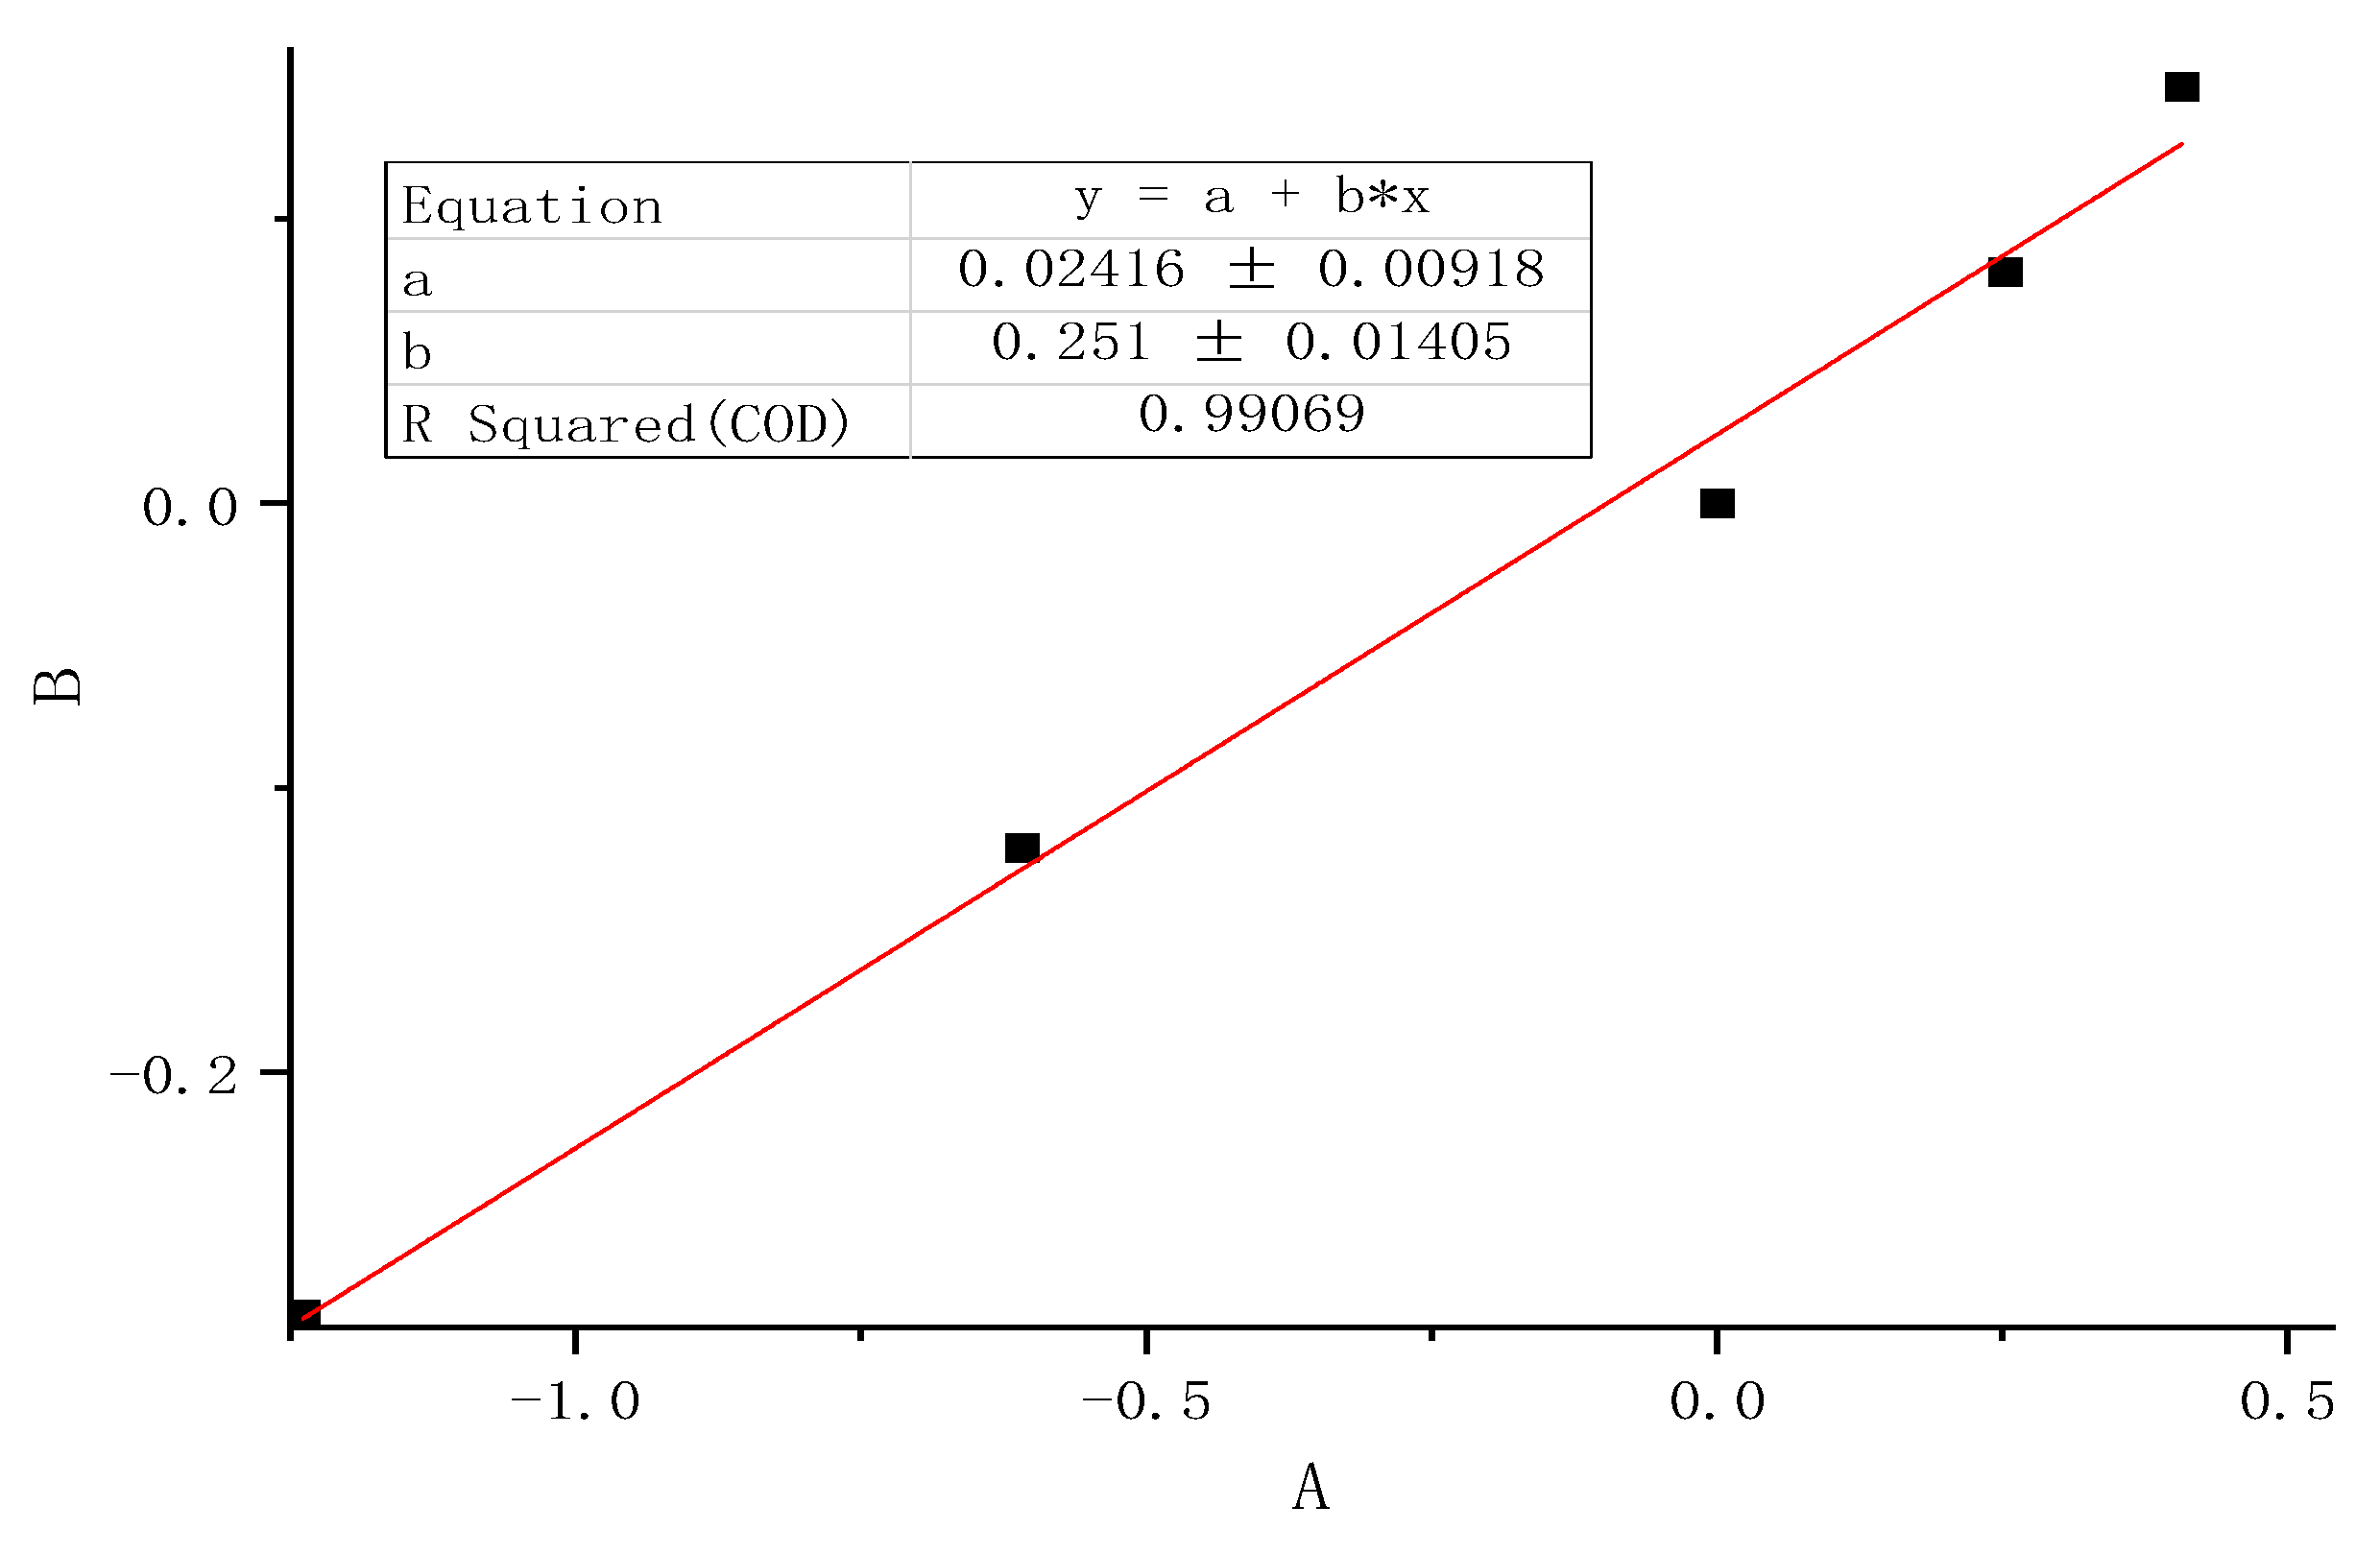
Figure 7.
Comparison between the curve calculated by the modified model and the actual curve at different speeds: (a) 100mm/min; (b) 200 mm/min; (c) 400 mm/min; (d) 500 mm/min.
Figure 7.
Comparison between the curve calculated by the modified model and the actual curve at different speeds: (a) 100mm/min; (b) 200 mm/min; (c) 400 mm/min; (d) 500 mm/min.
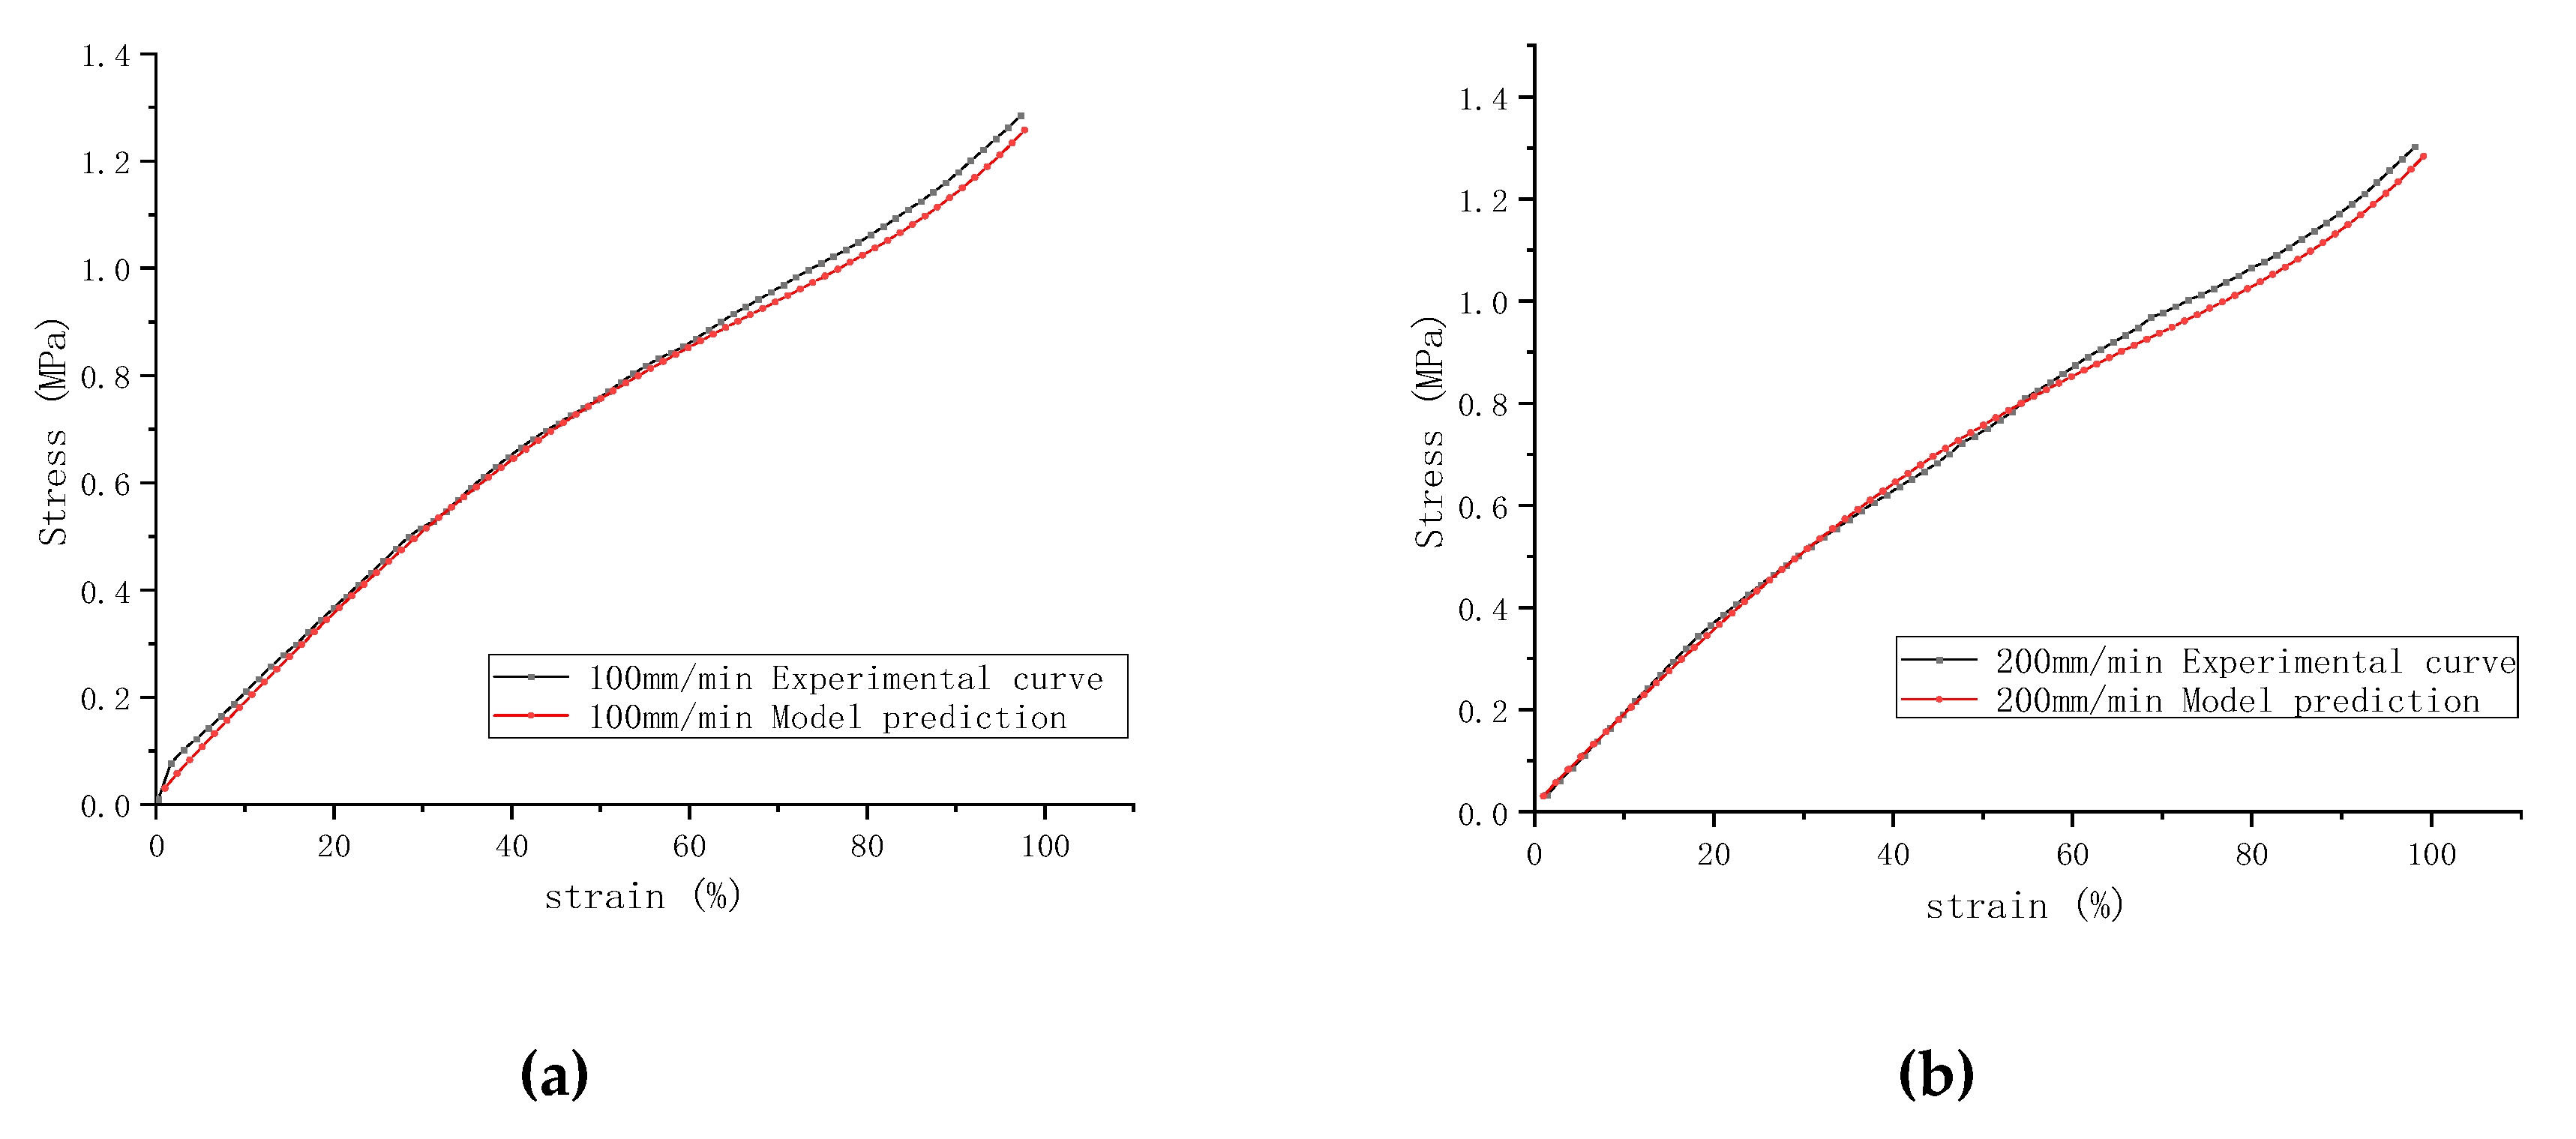
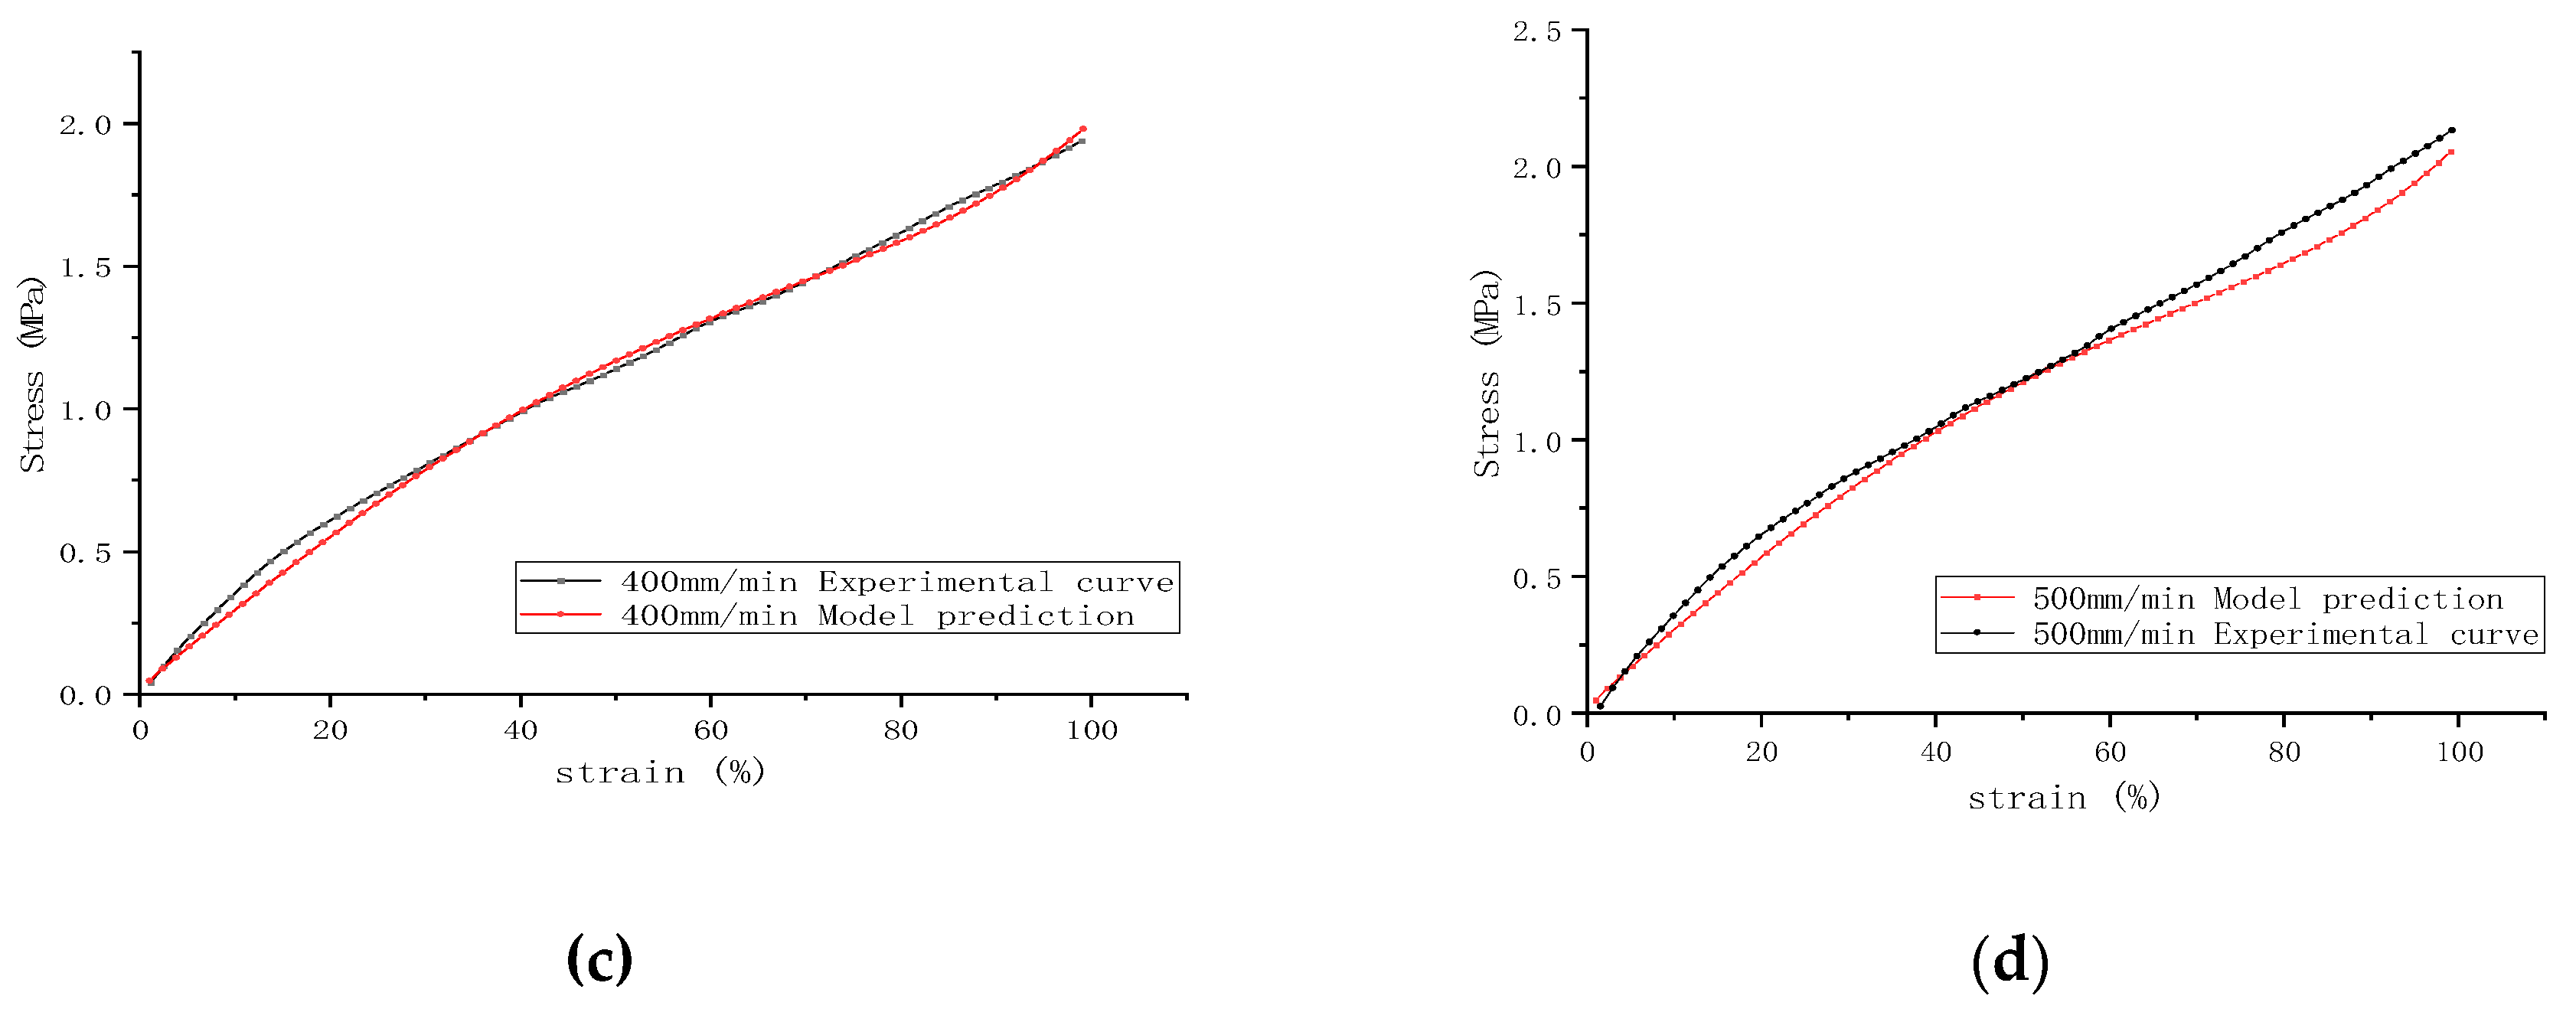
Figure 8.
Predicted uniaxial tensile stress-strain curves.


Table 1.
Sample Preparation
| Samples Number | Coagulation Methods | Type of Coagulant | Dosage of Coagulant | Note |
|---|---|---|---|---|
| J-1-2 | Natural coagulation | ---- | ---- | |
| J-2-2 | Enzymatic coagulation | Alkaline protease | Weight of dry rubber×0.09% | |
| J-3-2 | Acid coagulation | Methanoic acid | Weight of dry rubber×0.35% | |
| J-4-2 | Microbial coagulation | Microbial coagulation liquid | Weight of latex×10% | |
| J-5-2 | Enzyme-assisted microbial coagulation | a. Alkaline protease | Weight of dry rubber×0.05% | Added a first and mixed well |
Table 2.
Constants of Yeoh model.
| Samples Number | C10 | C20 | C30 |
|---|---|---|---|
| J-1-2 | 0.01063 ± 6.93873E-5 | 2.87305E-8± 4.31352E-10 | -2.56038E-14 ± 7.98674E-16 |
| J-2-2 | 0.01031 ± 8.62098E-5 | 3.16895E-8 ± 5.10175E-10 | -2.39227E-14 ± 8.99227E-16 |
| J-3-2 | 0.0092 ± 6.67449E-5 | 2.91681E-8 ± 4.00238E-10 | -2.22192E-14 ± 7.14835E-16 |
| J-4-2 | 0.01056 ± 8.85717E-5 | 2.93184E-8 ± 5.22017E-10 | -2.15854E-14 ± 9.16351E-16 |
| J-5-2 | 0.01011 ± 6.78159E-5 | 2.41154E-8 ± 3.16368E-10 | -1.71654E-14 ± 4.37802E-16 |
Table 3.
The differences between the theoretical and actual strain rates at different speeds.
| stretching speeds (mm/min) | 100 | 200 | 300 | 400 | 500 |
| theoretical strain rates (/s) | 0.0667 | 0.1333 | 0.2 | 0.2667 | 0.3333 |
| Strain time(s) | 31.27 | 16.11 | 9.05 | 7.03 | 6.02 |
| actual strain rates (/s) | 0.032 | 0.0621 | 0.1105 | 0.1422 | 0.1661 |
Table 4.
The differences between the theoretical and actual strain rates at different speeds.
| stretching speeds (mm/min) | actual strain rates (/s) | ln(/) | /-1 | |
| 100 | 0.032 | 0.0091 | -1.239279618 | -0.285153181 |
| 200 | 0.0621 | 0.01119 | -0.609005679 | -0.120974077 |
| 300 | 0.1105 () | 0.01273() | 0 | 0 |
| 400 | 0.1422 | 0.01377 | 0.252218996 | 0.081696779 |
| 500 | 0.1661 | 0.0146 | 0.407574496 | 0.146897093 |
Table 5.
The model parameters (C10) before and after the modification.
| SamplesNumber | actual strain rates (/s) | Yeoh model C10 | Yeoh modified model C10 | ||
| 300mm/min | 500mm/min | 300mm/min | 500mm/min | 500mm/min | |
| J-1-2 | 0.1105 | 0.1661 | 0.01615 | 0.0146 | 0.017802 |
| J-2-2 | 0.0994 | 0.1661 | 0.01427 | 0.01353 | 0.016109 |
| J-3-2 | 0.0994 | 0.1661 | 0.01263 | 0.01237 | 0.014258 |
| J-4-2 | 0.0903 | 0.1658 | 0.01438 | 0.01455 | 0.016233 |
| J-5-2 | 0.0994 | 0.1661 | 0.01273 | 0.01288 | 0.014672 |
Disclaimer/Publisher’s Note: The statements, opinions and data contained in all publications are solely those of the individual author(s) and contributor(s) and not of MDPI and/or the editor(s). MDPI and/or the editor(s) disclaim responsibility for any injury to people or property resulting from any ideas, methods, instructions or products referred to in the content. |
© 2024 by the authors. Licensee MDPI, Basel, Switzerland. This article is an open access article distributed under the terms and conditions of the Creative Commons Attribution (CC BY) license (http://creativecommons.org/licenses/by/4.0/).
Copyright: This open access article is published under a Creative Commons CC BY 4.0 license, which permit the free download, distribution, and reuse, provided that the author and preprint are cited in any reuse.


