
Submitted:
23 November 2024
Posted:
26 November 2024
You are already at the latest version
Abstract
Increasing feed efficiency in beef cattle is critical for meeting the growing global demand for beef while managing rising feed costs and environmental impacts. This review examines the progression from traditional data collection methods to modern genetic and nutritional approaches that enhance feed efficiency. We first discuss the technological advancements that allow precise measurement of individual feed intake and efficiency, providing valuable insights for research and industry. The role of genomic selection in identifying and breeding feed-efficient animals is then explored, emphasizing the benefits of integrating multi-population data to improve prediction accuracy. Additionally, the paper highlights the importance of nutritional models that could be used synergistically with genomic selection, allowing for optimized feed management in diverse production systems. Combining these approaches provides a roadmap for reducing input costs and promoting a more sustainable beef industry.
Keywords:
feed intake
; genomics
; precision livestock farming
; resource management
; sustainability
1. Introduction
The global beef (meat) supply decreased by 11.25% between 2010 and 2015 [1], then had a 19.2% increase from 2015 to 2022 [1]. In 2024, the United States produced 20% of the world's beef supply, with only Brazil, China, and the European Union each producing more than 10% [2]. By 2030, the global population is projected to exceed 8.5 billion, reaching over 9.8 billion by 2050 [3], with worldwide beef consumption estimated to be between 460 and 570 million tons [4,5]. Considering the global population has already surpassed 7 billion, beef (meat) consumption would be twice as high as in 2008 [4,5], despite urban sprawl reducing the total area of farmland available for agricultural production compared to 1970 [6,7]. Unfortunately, the United States and global beef producers face numerous challenges, including climate change, rising energy costs, non-agricultural encroachment on crop and grazing land, greater competition for feed sources, and confusing governmental policies [8]. These challenges significantly impact the prices of feed, which account for 75% of the total cost of producing finished cattle [9]. Cattle play a crucial role in utilizing the vast grazing land by harvesting grasses and producing a nutritious protein source while preserving the land for future generations. It is, therefore, essential to recognize the diverse challenges cattle producers face as they strive to maintain a sustainable business while upholding animal welfare, ensuring a safe and healthy beef supply, and conserving the environment. Additionally, it emphasizes the importance of continuous genetic progress of economically important traits that enable cattle producers to achieve greater efficiency with fewer resources [9].
Over the past four decades, there has been an increasing focus on feed efficiency (FE) among scientists and the industry. For producers, enhancing FE represents a shift in mindset, moving from solely considering revenue generation to actively managing costs. Improving FE not only boosts profitability but also helps to reduce the substantial expenses associated with feed [10]. Specifically in beef cattle, improved FE reduces costs and enhances the production system's overall efficiency [13]. Studies have demonstrated that modest improvements in FE can have a substantial economic impact on beef production [13,14,15,16]. A 5% increase in FE can have four times the economic impact of a 5% increase in average daily weight gain (ADG) [14,15]. Similarly, research performed in feedlot settings revealed that a 10% increase in ADG led to an 18% increase in profitability [16]. In comparison, a 10% increase in FE led to a substantial 43% increase in profits [16]. These results highlight the significance of improving the efficiency of feed and forage utilization in cattle production to reduce input costs.
The nutritional requirements of beef cattle, such as energy, protein, and minerals, change depending on their growth stage. This variation occurs because the proportions and composition of the animal's body evolve over time, with different tissues and organs growing at different rates. As a result, young animals have distinct nutritional needs compared to adults, both in terms of the types of nutrients required and the quantities of each component. Approximately 70 to 75% of the nutrients consumed by beef cattle are allocated to body maintenance functions [18,19]. Historically, studies on FE have primarily focused on young growing and finishing cattle, neglecting the importance of the cow herd and its maintenance requirements. As a cow goes through different stages of its life, such as growing, breeding, gestation, and lactation, its nutritional requirement changes accordingly [20]. Therefore, to improve the profitability of the beef cattle industry, it is crucial to consider these changes in the overall FE of the production system [12]. Furthermore, accurately estimating the nutritional requirements for modern genotypes under current feeding conditions is of utmost importance in enhancing the profitability of the beef industry [20]. Measuring individual animal feed intake (FI) has traditionally been challenging and costly. However, recent advancements in computing and electronics and the availability of reliable automatic FI recorders have simplified the process [12].
The livestock industry has significantly increased access to genomic data, creating a profitable method for estimating the genetic merit of young animals early in life. This is beneficial for making selection decisions that promote genetic gains. Genomic selection has become widespread in animal breeding programs because it facilitates the selection of traits that are complex and expensive to measure, such as FE [21]. Genomic selection reduces the generation interval and consequently increases genetic gains by allowing breeders to predict the genetic potential of animals early in their lifetimes [21,22]. In beef and dairy cattle, the accuracy of genomic predictions for Residual Feed Intake (RFI) and dry matter intake (DMI) was reported to range from 0.2 to 0.4 [23,24,25,26,27,28,29,30,31]. RFI's phenotypic independence from daily gain and heritability estimates of 0.08 to 0.49 among cattle populations make it a preferred measure for dissecting FE biology and genomic selection. There are opportunities to enhance the precision of these forecasts by utilizing data from multiple research populations. Using data from nine Bos taurus taurus and Bos taurus indicus cattle breeds, Bolormaa et al. [25] estimated a 0.36 genomic prediction accuracy for RFI. It has been demonstrated that combining data from three research herds in Australia and Europe improves the accuracy of genomic prediction for DMI. It increased from 0.33 when utilizing data from a single country to 0.35 from all three countries [29,32]. Therefore, this review paper aims to summarize advancements in measuring and improving FE in beef cattle. It explores innovations in data collection, the role of genomic selection in breeding more feed-efficient animals, and the integration of nutritional models to optimize feed use under various conditions. By combining these approaches, the paper highlights strategies for enhancing profitability and sustainability in response to increasing global demand and resource constraints in beef production.
2. Measures of Feed Efficiency
Feed intake and production outputs are correlated and examining them in isolation provides limited insight into production system efficiency. Due to the variation in the FI of individual animals, knowledge of body weight and production level alone isn't enough to estimate FI in national cattle evaluation systems [33]. Thus, there is a need for accurate measurement of FI. Researchers often focus on specific production cycle phases to compare FI and production outputs, using an index that combines these factors to express FE. Multiple definitions of FE have been proposed in both literature and industry. As such, the term “feed efficiency” seems vague and needs to be distinguished between the proposed indices. When comparing the proposed alternative definitions, the key distinction lies in whether they involve measuring actual FI or not [9]. Extensive research indicates that the most useful definitions of efficiency require accurate measurement of individual FI [9]. For instance, dry matter measurements are needed alongside nutrient intake to calculate FE. Berry and Crowley [34] comprehensively reviewed different methods for calculating FE and classified them into ratios and residual or regression traits. One example of ratio traits is the Feed Conversion Ratio (FCR), which is the ratio of FI to weight gain, or its inverse, known as feed conversion efficiency [34,35]. Residual/regression traits include RFI/net FI, which is the difference between actual and predicted dry matter intake [36].
2.1. Feed Conversion Ratio/Feed Conversion Efficiency (FCR)
The most commonly used FE index is FCR, or its inverse, referred to as gross FE. In meat production systems, outputs are commonly assessed by the weight gain of growing animals, and FCR is determined by dividing FI by weight gain over a specific period of growth. Gross FE is calculated as the ratio of weight gain to FI. Alternatively, the output can be defined as lean tissue, and the percentage of lean tissue gain to FI can be used to measure efficiency. The period of growth over which FCR is measured is typically defined on a time-constant basis, where growth and FI are measured between two specific time points. Other alternatives that have been used to account for maturity patterns or scale in the measurement include weight-constant basis (calculating feed required for growth from one weight to another) or maturity-constant basis (measuring feed and weight gain from one stage of maturity to another or from a specific subcutaneous fat depth to another) (e.g., [37,38,39]). However, the practical application of weight-constant or maturity-constant measurements to many animals is challenging due to the increased data requirements. Numerous studies have provided evidence for the phenotypic and genetic correlations between FCR and production traits in beef cattle. For instance, Archer et al. [40] summarized four studies that revealed significant negative genetic correlations (-0.61 to -0.95) between growth rate and FCR. This indicates a strong relationship between the rate of growth and the efficiency of converting feed into weight gain in beef cattle.
Heritability estimates for FCR in cows have shown considerable variation in previous studies, ranging from 0.00 [41] to 0.38 [42]. In growing animals, the minimum heritability for FCR was 0.06, with 0.46 being the maximum. The heritability estimates for FCR in mature cows ranged from 0.05 to 0.32 [40]. Torres-Vázquez et al. [43] estimated the FCR of Australian Angus beef cattle to be 0.20 ± 0.06, and Novo et al. [44] recorded heritability of 0.09 ± 0.05 in Senepol heifers. Compared with other traits estimated by regressions using residual gain (RG), residual intake gain (RIG), and RFI, FCR was found to be less heritable. Moreover, FCR had genetic correlations of −0.21 ± 0.27, −0.83 ± 0.13, −0.30 ± 0.32, 0.11 ± 0.27, 0.09 ± 0.25, 0.46 ± 0.29, and −0.38 ± 0.28 with body weight (BW), average daily gain (ADG), DMI, rib-eye area (REA), backfat (BF), intramuscular fat (IMF), and carcass conformation score (CCS), respectively. Phenotypic correlations recorded in the same study were −0.05, −0.80, 0.14, −0.01, −0.07, −0.10, and 0.00 with BW, ADG, DMI, REA, BF, IMF, and CCS, respectively [44]. Smith et al. [45] recorded high phenotypic correlations between FCR and three measures of RFI (DMI adjusted for production, RFIP; DMI adjusted for ultrasonic backfat thickness, RFIBF; DMI estimated using the NRC net energy equations, RFINRC) to be 0.68, 0.68 and 0.71, respectively. Santana et al. [46] reported that FCR had genetic correlations of 0.10, 0.95, and -0.87 with DMI, RFI, and RIG, respectively. The phenotypic correlations reported were 0.17,0.34, and -0.46 with DMI, RFI, and RIG, respectively.
The strong genetic correlations between gross FE and production traits suggest that selecting moderate to high heritability traits like growth rate can improve gross FE without directly measuring FI [35]. Research by Mrode et al. [47] on Hereford cattle showed a more significant improvement in lean FCR through selection for lean growth rate than direct selection for FCR alone. However, improving the FCR may not enhance overall system efficiency or profitability. Higher growth rates in genotypes often lead to increased mature cow weights and higher feed requirements for the cow herd, which can offset gains in growth efficiency. Maturity patterns influence the FCR of growing animals, and if increased feed requirements of the breeding herd negate the improvements in growth efficiency, production system FE may remain unchanged. Nevertheless, there may be economic efficiency gains if the feed value for the slaughter generation surpasses that for the breeding herd.
One limitation of FCR is its strong correlation with FI and growth rate. Consequently, focusing on the feed:gain ratio during selection may result in increased maintenance needs for animals with larger mature weights. Animals with similar FCRs can exhibit significant variations in their growth rates and FI. Selecting based on ratio traits makes predicting changes in individual traits in future generations challenging to achieve with high accuracy [45]. Another limitation is the typical avoidance of ratio traits in breeding programs. Conventional breeding models often assume additive genetic effects, which may not accurately capture well the complexities of ratio traits that involve non-additive genetic effects (as they do not follow the assumptions in most models) [48]. More so, interpreting and understanding ratio traits can be challenging for farmers. Ratio traits often have complex relationships with other traits and can interact differently under various environmental conditions. This complexity makes it difficult for farmers to assess the practical implications and trade-offs of incorporating ratio traits into their breeding goals [49]. Numerous studies have examined the effects of increased mature size on FE in beef production systems [50,51,52,53]. The consensus from these studies, particularly in maternal breeds, is that an increase in mature size has minimal impact on production system FE. Therefore, it seems that while FCR remains a useful measure of efficiency for scenarios involving only growing cattle or specific breeding purposes (e.g., terminal sires), it is unlikely to correlate with the FE of beef production systems when accounting for the requirements of the breeding herd [40].
2.2. Residual Feed Intake (RFI)
Koch et al. [36] introduced the concept of RFI to account for the impact of both weight maintenance and weight gain on the feed requirements of growing cattle. They proposed adjusting FI based on body weight and weight gain, separating it into two components: (1) the expected FI for a specific level of production and (2) a residual portion that allows for the identification of animals that deviate from their expected level of FI. Overall, efficient animals typically have lower (negative) RFIs. RFI is an index not influenced by the production traits used to calculate expected FI. Unlike in FCR, this allows for comparisons between individuals with different production levels during the measurement period. The fact that RFI is independent of production has led researchers, such as Korver [35], to propose that it may reflect inherent variation in essential metabolic processes that determine efficiency. RFI may also be correlated with the overall FE of the production system, as it adjusts for production during the measurement period and reduces the complexities associated with interpreting gross FE.
Although RFI is phenotypically unrelated to the production growth rate and body weight in growing cattle [10,11,54,55,56], it has been shown that when RFI is calculated by phenotypic regression of production on FI, the resulting efficiency measure is not necessarily genetically independent of production. Although some other studies have found genetic independence [54,57], genetic variation in RFI may include genetic variation in production traits and inherent relationships between FI and production. Kennedy et al. (1993) suggested that to obtain a measure of efficiency that are genetically independent of production, genotypic RFI could be calculated using genetic (co)variances rather than the phenotypic (co)variances used in the phenotypic regression approach. Genotypic RFI is genetically independent of production and thus may be more likely to reflect genetic differences in inherent relationships between FI and production. Production differs between studies; for instance, Nkrumah et al. [58] found RFI to be genetically independent of ADG and BW but showed a phenotypic correlation with ADG (r = −0.21; P < 0.05). In comparison, Ceacero et al. [59] found unfavorable genetic correlations between RFI, RFI adjusted for backfat thickness (RFIb), RFI adjusted for backfat and rump fat thickness (RFIsf) with weight at selection (WS) (0.17, 0.23 and 0.22), BF (0.37, 0.33 and 0.33) and RF (0.30, 0.31 and 0.32).
However, knowledge of genetic relationships between FI and production is required to calculate genotypic RFI or predict correlated responses in FI and production to selection based on phenotypic RFI. Most animal production systems have limited information on these genetic relationships. Choosing to select for RFI is better than selecting for FCR because it decreases FI in both young and adult cattle without affecting growth performance or increasing cow size [56].
Archer and Arthur [55] reported a strong correlation (>0.90) between post-weaning RFI in heifers and RFI measured in the same females as mature cows. This finding implies that selecting for enhanced post-weaning RFI can yield offspring that exhibit efficiency across all industry sectors. Multiple studies have demonstrated that RFI and FCR exhibit moderate heritability across beef cattle breeds [11,57,58,60]. These studies have shown a correlation between RFI and FCR, ranging from 0.45 to 0.85. Therefore, selecting for improved RFI will likely lead to genetic changes in FCR.
2.3. Residual Average Daily Gain (RADG)
A recent approach to measuring FE is residual average daily gain (RADG). RADG is calculated by subtracting the predicted ADG from the actual ADG. It is worth noting that a positive or high RADG value is desired as it indicates a more significant gain. The American Angus Association (AAA) has developed this method and created an expected progeny difference (EPD) to assess RADG. The RADG EPD is a product of research projects funded by the Angus Foundation and the American Angus Association [61]. These projects, performed by the University of Illinois, North Carolina State University, and Iowa State University, have collected individual intake data over several years. The RADG EPD provides a comprehensive approach to identifying cattle that excel at converting a specific quantity of feed. By combining the individual intake data with genomic information on dry matter intake, Angus producers can access a nearly real-time selection of more feed-efficient genetics. According to the AAA, a comprehensive genetic evaluation incorporating various anchor trait, such as weaning weight, post-weaning gain, subcutaneous fat thickness, calf DMI, and DMI genomic values, can quickly determine RADG without requiring a feed test. These genetic values, combined with animal ADG and fat measurements, serve as predictors for an animal's RADG potential.
RADG has a moderate heritability (0.31 to 0.41), making it practical for improving FE in cattle production systems. Freetly et al. [62] reported heritability of 0.21 ± 0.11 in heifers and 0.14 ± 0.10 in cows in a study that compared the relationship between FI in growing heifers and mature cows. In this study, heifer RADG had genetic correlations of −0.86 ± 0.40, 0.05 ± 0.30, −0.13 ± 0.28, and 0.52 ± 0.11 with heifer RFI, cow ADG, cow average daily dry matter intake (ADDMI), and heifer ADG, respectively. Cow RADG had a heritability of 0.14 ± 0.10 and genetic correlations of −0.86 ± 0.57, 0.31 ± 0.46, −0.16 ± 0.43, 0.50 ± 0.16, 0.33 ± 0.30, and 0.20 ± 0.26 with cow RFI, heifer RADG, heifer RFI, cow ADG, heifer ADG, and heifer ADDMI, respectively. The genetic correlations between RFI and RADG within heifers and cows were both -0.86, as these two efficiency measures have opposite directional preferences. The genetic correlations between heifers and cows for RFI and RADG were 0.41 ± 0.36 and 0.31 ± 0.46, respectively [62].
However, it is essential to consider that RADG and FCR, are suitable for feedlot animals but pose challenges for cow-calf producers. According to the AAA, selecting based on RADG or FCR may result in larger, heavier cows with higher nutrient requirements, which is not advantageous for cow efficiency neither to the production system. The ability to provide EPDs for RADG gives Angus producers the power to make accurate decisions [63]. Making selections decisions based on EPDs for RADG may improve feed conversion ratios and reduce RFIs without compromising growth or carcass quality, suggesting that enhancing FE shouldn't compromise animal productivity or meat quality.
2.4. Maintenance Efficiency
Another method of measuring FE traits involves dividing the feed consumed into portions required for maintenance and production (growth, lactation, and gestation). One example is maintenance efficiency, which calculates the ratio of FI used for maintenance (actual intake minus predicted intake for growth) per unit of metabolic body size, BW0.75 [66]. Maintenance requirement is the feed energy needed for an animal to maintain a constant body weight [40]. On the other hand, maintenance efficiency is the ratio of body weight to FI when there is no change in body weight. In a typical beef breeding herd, the energy required for maintenance constitutes 60-75% of the total energy needs of individual breeding cows [18,40]. Additionally, it is estimated that the cow herd utilizes 65-85% of the energy required for beef production [18,40], although this percentage may vary depending on the production system. While these estimates are based on temperate beef production systems, extensive pastoral systems in northern Australia might exhibit different proportions of feed utilization due to lower reproductive rates and higher ages at slaughter.
Nevertheless, the cost of maintaining breeding cows is crucial in determining the efficiency and profitability of beef production systems. However, measuring maintenance efficiency presents practical challenges. Measuring maintenance efficiency in growing animals is unrealistic because weight stasis is not achieved as young animals are still experiencing growth. Proxy measures such as fasting heat production have been proposed and used. However, studies have shown that an animal's growth trajectory can significantly influence maintenance efficiency, suggesting that measurements should account for factors beyond just maintenance requirements [40]. To accurately measure maintenance requirements, animals need to be kept at a constant live weight, which may take as long as two years in beef cattle [67]. Such measurements require significant resources and costs.
2.5. Partial Efficiency of Growth
Partial Efficiency of Growth (PEG) measures weight gain compared to the feed consumed after accounting for the animal's maintenance needs (AFI minus predicted feed for maintenance). These maintenance needs can be determined using feeding tables or metabolic studies. However, both methods have their limitations. Feeding tables, which are standardized references of dietary requirements, assume that the efficiency of feed use for maintenance is consistent. However, this assumption may not be accurate, especially in forage-based diets where nutrient profiles vary more significantly than in concentrate-based feeds. Additionally, nutritionists often use a dynamic mechanical model (alongside empirical models) that estimates nutritional requirements based on an animal's changing live weight and condition. Metabolic models, which dynamically estimate nutritional requirements, offer an alternative to feeding tables but have limitations of their own. These models are complex and require extensive data, making them difficult to apply in practical settings with large or diverse groups of animals. Additionally, they rely on static parameters that may not fully adapt to rapid changes in an animal's condition, such as stress or illness. Both feeding tables and metabolic models can benefit from incorporating nutrient analysis of the actual diet to improve accuracy, especially in forage-based diets where nutrient content can fluctuate widely. Thus, the PEG fails to capture the inherent variations in maintenance-related energetic efficiencies. However, PEG seems to have an advantage over FCR as a measure of FE. Grion et al. [68] recorded heritability of 0.14 ± 0.07 in Nellore cattle when collective pens were used and an estimate of 0.25 ± 0.09 without collective pens. They also found genetic correlations of –0.23 ± 0.18, –0.67 ± 0.11, –0.29 ± 0.21, and –0.37 ± 0.16 with weaning weight adjusted to 210 days of age (W210), DMI, ADG, and metabolic BW (BW0.75), respectively. And phenotypic correlations of –0.13 ± 0.03, –0.54 ± 0.03, 0.17 ± 0.04, and –0.24 ± 0.04 between PEG and W210, DMI, ADG, and BW0.75, respectively.
Nkrumah et al. [58] also observed a marked genetic correlation between PEG and DMI (–0.51) in Canadian crossbred heifers. Fan et al. [69] estimated a genetic correlation between ADG and PEG of –0.57 and –0.62, whereas Nkrumah et al. [58] obtained a genetic correlation of 0.55. Nkrumah et al. [70] reported a phenotypic correlation of -0.89 and -0.83 with RFI and FCR, respectively. They also recorded phenotypic correlations between PEG and carcass traits: -0.30, -0.25, -0.27, 0.24, and -0.25 with backfat gain, ultrasound backfat, grade fat, lean meat yield, and yield grade, respectively. Carstens and Tedeschi [66] recorded Pearson’s correlation of -0.77, 0.27, -0.52, -0.15, -0.10, 0.20, -0.25, -0.57, and -0.87 between PEG and FCR, a dry matter required (DMR), DMR to ADG ratio (R: G), BF, REA, ADG, initial body weight (iBW), DMI, and RFI in growing calves. In finishing calves, the correlation recorded between PEG and FCR, DMR, R: G, BF, REA, ADG, iBW, DMI, and RFI was -0.79, 0.27, -0.52, -0.38, 0.02, 0.11, -0.38, -0.64 and -0.84 respectively. In both growing and finishing calves, PEG showed strong correlations with FI, with values of -0.57 and -0.64, respectively [66]. As mentioned above, the phenotypic correlations between ADG and PEG (0.24) are significantly lower than between ADG and FCR (-0.63). Grion et al. [68] recommend that PEG and RFI provide the best responses to selection for reduced DMI, proportional to high genetic gains in growth traits. This in the context of 2-stage selection schemes, which include including preselection during the post-weaning period.
2.6. Cow/Calf Efficiency
Cow/calf efficiency is another alternative to assess the efficiency of the beef production system [71]. This index is designed to assess a cow’s ability to produce marketable calves with minimal input costs while ensuring herd health and profitability. There are multiple methods for calculating this index, depending on the available information. The simplest approach is to calculate the ratio of the weight of the weaned calf to the cow's weight. This method is already employed by some beef cattle genetic evaluation programs worldwide. A second method is recommended for assessing the metric at the herd level. This involves calculating the total weight of the weaned calves divided by the number of cows that entered the breeding season. The third method focuses on FE and requires consideration of the total feed intake (TFI) of the cow and her offspring throughout an entire production cycle, typically from the weaning of one calf to the weaning of the next. By comparing the TFI over the production cycle with the weight of the weaned calf, cow/calf efficiency is expressed as the ratio of kilograms of calf weaned per kilogram of feed consumed. This method captures the efficiency of the cow/calf unit in terms of both biological and economic aspects, as it considers the FI and production of the breeding herd and the pre-weaning phase of the progeny. It reflects the efficiency of animals in a realistic production state. However, cow/calf efficiency does not account for the FI of the slaughter generation from weaning to slaughter or the replacement animals entering the cow herd. Additionally, it does not factor in the output from the sale of culled cows.
Nonetheless, since the feed utilized for post-weaning growth represents a relatively small portion of total feed used in beef production in many systems, cow/calf efficiency may reasonably indicate production system efficiency [40]. While cow/calf efficiency may be more strongly associated with production system FE than other efficiency indices, its practical application and use in genetic studies are challenging. Measuring cow/calf efficiency entails significant costs and effort, and is highly dependent on the nutrient profile of the ration, and especially forage quality and amount of supplemental feeds needed to meet maintenance requirements. However, cow/calf efficiency can be valuable as an indicator of the extent of phenotypic variation in the FE of production systems.
Research utilizing the cow/calf unit as a measure of efficiency has provided evidence of substantial variation in cattle production's efficiency. In two separate years, the coefficient of variation for cow/calf efficacy among 33 Hereford × Angus heifers studied by Shuey et al. [71] was 6% and 7%. The calf gained between 6.0 and 8.2 grams at weaning for every megajoule of metabolizable energy the cow and calf consumed [40,71]. Similarly, an Australian study discovered that even within the same herd and genetic background, cow/calf efficiency varied widely, with some cows requiring up to 50% less feed per kilogram of weaned offspring than others [40]. Jenkins and Ferrell [72] compared British and European strains at differing nutrition levels to demonstrate that genetics influence the feed utilization efficacy of a production system. The study recorded individual cow consumption and daily feed allowance adjusted for refusal, weekly. They discovered a significant relationship between genotype and feeding level, with higher-yielding genotypes, defined by weight at weaning, achieving their optimum efficiency at elevated feeding levels, while lower-yielding genotypes did so at reduced feeding levels. In addition, as the quantity of food consumed increased, the efficiency of the latter group declined. This genotype-feeding level interaction was primarily driven by differences in reproductive rate, highlighting the need to optimize production by matching genotype to the environment, in this case, feed availability. However, Jenkins and Ferrell [72] did not specify how much variation in FE is not attributable to differences in reproductive rate between or within breeds.
3. Methods of Recording Feed Intake
Traditional ways of collecting information on FI in dairy and beef cattle are usually costly and involve time-consuming methods like watching them directly, recording videos over time, and manually measuring feed delivery and feed refusal. However, these methods are limited, mainly when used for a long time or with many animals. Also, much of the research has been done in environments that may not accurately represent how animals behave in pasture conditions, in groups such as pens, tied stalls, or feed bunks with limited access. Because there's a growing need for a large database that includes FI as a trait for breeding programs and for studying precision livestock farming, new tools are being developed to measure FI better.
One method includes using electronic scales and radio frequency identification (RFID) antennae positioned inside feeding stalls. This electronic scale is the oldest and one of the most direct methods used in group housing and feedlots [73]. The scale is placed inside a feeding station to measure the precise amount of feed consumed by each animal during every meal at each designated feed bin. Each farm determines the appropriate quantity of electronic scales to use along a feeding lane by the number of animals. Several companies have developed systems for this purpose, including the Calan Broadbent Feeding System, Controlling and Recording Feed Intake System, GrowSafe System (recently acquired by Vytelle, a precision livestock company), Intergado Efficiency, and Roughage Intake Control system. Many researchers have also evaluated the efficiency of these systems [73,74,75,76,77,78,79,80]. Nevertheless, these systems are rarely extensively used in commercial operations due to their exorbitant cost and the substantial cleaning and maintenance requirements. Additionally, some systems exercise control over the data they gather, and the user is not provided with a clear understanding of how it is managed.
Other studies have used affordable cameras and computer vision algorithms to develop innovative methods for accurately measuring FI. The camera is often positioned above the feed bunk. Various techniques are utilized to visually represent the three-dimensional (3D) location of the surface captured by the camera. One of these methods uses structured light illumination (SLI) and time of flight [81] using a camera and light projector. Light patterns are projected onto the observed area. SLI scanned the 3D structure of dairy cow feed to determine its volume and weight in a bin before and after feeding [82]. The SLI method significantly differs between estimated image weight and real values on 272 piles in a lab [82]. Only 72% of findings were within 814 g of the comparison between image-estimated mass and scale-measured mass. Unfortunately, SLI systems only operate indoors shielded from sunlight because they require regulated lighting, tuning, and shade. The system also needs eight cameras per heap, making it impractical. Another challenge is that each time the moisture content of the diet or ration ingredients is changed, the camera algorithms must be recalibrated. Figure 1 shows some examples of equipment used to record FI.
Another method uses calibrated stereo cameras to monitor FI via triangulation and point disparity analysis to derive depth information. Bloch et al. [84] used photogrammetry to quantify feed mass and volume, producing a 3D model of several ration heaps from various angles. The procedure was tested with 125 and 60 ration piles in the lab and cowshed. The estimated inaccuracy for feeding piles up to 7 kg was 0.483 kg in the lab. The cowshed experiment had a standard deviation of 0.44 kg and a total error of 1.32 kg for ration piles up to 40 kg. The colored markers used for point cloud processing may not be viable in a cowshed on a working farm since dirt might distort their colors and dislodge them from the floor and walls owing to tractor use and ventilation.
Feed intake, may also be monitored with red–green–blue and depth (RGB-D) cameras and infrared sensors. These cameras provide depth data for each RGB pixel via an infrared (IR) or near-IR projector-based depth sensor. This 3D data-gathering method has been utilized in research and industry to evaluate object surfaces [85]. Indoor, outdoor, and open cowshed RGB-D feed intake techniques and algorithms have been developed [81,86,87]. An RGB-D camera and deep learning system mitigated sunlight’s influence on an open cowshed’s IR scanner [87]. The device correctly assessed one meal’s FI with a mean absolute error of 0.127 kg per meal from 0 to 8 kg. When integrated with eating behavior sensing, developed FI techniques and algorithms may be enhanced [88].
Precision phenotyping in livestock has been revolutionized with recently developed technologies for welfare, prediction, and diagnosis [89,90]. One of which is 3D cameras for estimating FI and BW in commercial herds. Unlike scale-based methods, the Cattle Feed Intake System (CFIT; [81,91,92,93]) uses 3D camera records and artificial intelligence to forecast individual DMI and BW. The CFIT's barn-mounted 3D cameras can recognize cows and use artificial intelligence algorithms to collect herd DMI and BW [94,95,96]. This technique has been used in dairy cattle to forecast FI and BW for each cow during the lactation and across all lactations. Importantly, 3D cameras on the barn roof does not interfere with animal eating as feed bins do. It addresses limited FI and efficiency records in early lactations and can be used in beef cattle production systems. More recently, Lassen et al. [91,97] and Manzanilla-Pech et al. [91,97] obtained FI data from 3D cameras on 17 Danish commercial dairy farms from 2019 to 2021. The cows were videotaped while eating using cameras above the roof-mounted feed bunk [81,92]. A radio frequency identification reader scanned the ear tags, and the 3D camera used time-of-flight technology. AI-based algorithms identify cows and transform 3D pictures into phenotypes (DMI and BW). Each cow is assigned records for FI after visiting the feed bunk. From each specific visit, five variables are stored: the ID of the cow, the placement in the barn, the meal start time, the meal end time, and the total amount of feed consumed. Lassen et al. [91] reported repeatability estimates ranging from 0.62 to 0.65 for daily FI and from 0.83 – 0.88 for BW measured as a weekly average.
4. Genetic Relationships Between Feed Efficiency, and Growth and Carcass Traits
Although FI and other growth traits have been widely used in FE studies, some studies provide insights into their relationship with carcass traits. In a study evaluating FE traits in Japanese Black cattle over three separate periods, Takeda et al. [98] found that RFI exhibited moderate genetic correlations with FI (0.53 to 0.63) and low genetic correlations with daily gain (0.00 to 0.08). On the other hand, the residual body weight gains showed moderate genetic correlations with daily gain (0.33 to 0.61) and low correlations with FI (-0.14 to 0.27). Among these FE traits, the strongest correlations were observed with FCR, with absolute values ranging from 0.63 to 0.96. Specifically, residual intake gains (RIGs) exhibited the highest correlations (ranging from -0.84 to -0.96) compared to the other FE traits. In the same study, carcass traits including carcass weight (CW), ribeye area (REA), subcutaneous fat thickness (SFT), rib fat thickness (RT), and marbling fat score (BMS)) were evaluated at 21 months of age. The heritability estimate for BMS was the highest at 0.77, while moderate heritability estimates were observed for CW, REA, RT, and SFT at 0.66, 0.59, 0.51, and 0.57, respectively. During different fattening periods, the three FE traits exhibited weak correlations with all carcass traits, ranging from -0.05 to 0.19 for RFI, 0.02 to 0.31 for RG, and -0.11 to 0.20 for RIG. In the first half of the fattening period, RG and RIG showed significant positive genetic correlations with CW and REA, but these correlations were not significant in the latter half.
Arthur et al. [54] conducted a study on Angus cattle and reported heritability estimates of 0.39 for FI, 0.28 for daily gain, and 0.29 for FCR. Similarly, Hoque et al. [99] and Retallick [100] studied Japanese Black cattle and found heritability estimates of 0.36 for FI and 0.38 for FCR. Retallick [100] also discovered high genetic correlations between FCR and residual gains (RG) at -0.97 and residual intake gains (RIG) at -0.95. Based on these findings, selecting cattle with high RIG may result in reduced FI and increased body weight gain. Elolimy et al. [101], another study that evaluated the association between RFI and carcass traits in Red Angus cattle, arrived at some interesting findings. Significant differences were found in carcass traits based on the grouping of RFI, with the most efficient animals showing higher hot carcass weight; kidney, pelvic, heart fat; and ribeye area than the least efficient animals (p ≤ 0.05). However, no significant differences were observed in carcass traits when considering the interaction between RFI and sex (p > 0.10).
Santana et al. [46] found low genetic correlations between RIG and ribeye area, and subcutaneous fat thickness in Nellore cattle (0.02 and -0.03, respectively). Retallick [100] reported low genetic correlations between RIG and carcass weight, loin eye area, backfat, and marbling score (ranging from -0.09 to 0.20). Ceacero et al. [59] also observed favorable genetic correlations between RIG and carcass traits, with values of 0.16 for loin eye and -0.38 for subcutaneous fat thickness. These studies suggest that selecting individuals with high RIG can improve overall cattle performance without adversely affecting carcass traits. Regarding the genetic relationships between RFI and carcass traits in Japanese Black cattle, previous studies have found similar patterns except for the relationship with BMS. Hoque et al. [99] reported a correlation of -0.59 between RFI and BMS, while Inoue et al. [102] reported a correlation of 0.51. This discrepancy may be due to differences in population size or the definition of RFI. Hoque et al. [99] studied 514 bulls from 22,029 progenies, while Inoue et al. [102] studied 863 bulls from a population of 4,578 animals. In conclusion, selecting animals with high RIG is recommended to improve FE and body weight gain without negatively impacting carcass traits. On the other hand, selecting animals with low RFI can lead to improvements in FE alone [98].
A more recent study conducted a genetic evaluation of FI in beef cattle as a relationship between FI in growing heifers and mature cows [62]. In the study, 687 heifers and 622 5-year-old cows were used, and the heritability of average daily dry matter intake (ADDMI) was estimated to be 0.84 ± 0.12 in heifers and 0.53 ± 0.12 in cows. The heritability of ADG was estimated to be 0.53 ± 0.12 in heifers and 0.34 ± 0.11 in cows. The genetic correlation between heifer and cow ADDMI was 0.84 ± 0.09, indicating a strong genetic relationship. Similarly, the genetic correlation between heifer and cow ADG was 0.73 ± 0.19. The heritability of RFI was estimated to be 0.25 ± 0.11 in heifers and 0.16 ± 0.10 in cows. RG's heritability was 0.21 ± 0.11 in heifers and 0.14 ± 0.10 in cows. The genetic correlations between RFI and RADG were -0.86 in heifers and -0.86 in cows. This indicates that the two measures of efficiency operate in opposite favorable directions. The genetic correlations between heifers and cows for RFI and RADG were 0.41 ± 0.36 and 0.31 ± 0.46, respectively. These findings suggest that both FI and ADG are heritable traits and exhibit genetic correlations between heifers and cows; therefore, selecting for decreased FI and ADG in growing animals is likely to have similar effects on mature cows, indicating that genetic improvements in FE during the growing stage can carry over to the mature stage. Importantly, differences in FI among different breeds of growing animals do not necessarily indicate differences in FI among mature cows [62].
5. Genetic Relationships Between Feed Efficiency and Maintenance Requirements
Limited information is available regarding genetic variation in maintenance efficiency within breeds due to the challenges and costs associated with measuring it in a sufficient number of cattle. However, two studies using twin pairs have found genetic variation in maintenance efficiency within specific breeds. Taylor et al. [67] observed a genetic coefficient of variation of 6.4% in Ayrshire twins, suggesting genetic variability within the Ayrshire breed. Archer et al. [40] measured heat production in monozygotic twin pairs from different breed combinations and found significant variation in estimated maintenance requirements, with heritability estimates ranging from 0.17 to 0.71 at various ages. It is essential to exercise caution when extrapolating these findings to adult cattle, but variation in maintenance efficiency likely exists within breeds.
5.1. Physiological basis for variation in feed efficiency
Three compelling reasons exist to investigate the mechanisms underlying differences in reported FE. Understanding the physiological basis of disparities in FE enables us to anticipate potentially correlated responses to selection. While this information cannot be used to predict the genetic effects of selection, it can assist researchers in identifying responses associated with selection. Understanding the physiological underpinnings of FE variation could lead to the identifying traits that are less expensive to detect than FI and efficiency and could be used as proxies during the selection. In conclusion, understanding the physiological causes of variation in FE could lead to the development of novel, non-genetic methods for altering the metabolic rate of cattle and thereby improving their FE.
5.2. Distribution of nutrient demands
Typically, the animal fodder is categorized into two main types: maintenance and production requirements. This classification aims to simplify the process of diet formulation for animals of different categories raised in diverse environmental conditions. The rate of absorbed nutrients varies considerably based on health and growth status as well as feed sources. Due to this distinction, the physiological basis of variation in feed requirements and FE is typically investigated in terms of differences in the feed energy efficiency required for maintenance or growth. Other possible sources of variation in FE include susceptibility to disease and environmental stresses as well as differences in energy expenditure for feed acquisition, activity, and thermogenesis. Maintenance requirements include the energy required to maintain the body's fundamental processes, perform voluntary activities, and generate enough heat to maintain body temperature [35]. These include the necessary nutrients for protein and lipid synthesis and turnover, ion transport across cell walls, thermogenesis, and the operation of vital organs and the nervous system [103]. Maintenance requirements are a significant portion of the total nutrient requirements for cattle production, and it has been demonstrated that different animals are more or less efficient at maintaining themselves. Consequently, determining the physiology underlying the observed phenotypic and genetic variations in animal FE may be best accomplished by examining factors influencing maintenance nutritional requirements.
Adult cattle fed forage-based diets generally require over 50% of their total dietary consumption for body maintenance, whereas growing cattle typically require more than 40%. Several physiological and biochemical mechanisms contribute to the high demand for maintaining homeostasis and may affect for FE. According to Bottje and Carstens [104], mitochondria are responsible for producing around 90 percent of the oxygen that is found in a cell. Kolath et al. [105] studied the respiratory control ratio (RCR) in the longissimus muscle tissue of steers, which indicates the degree of coupling between oxidative phosphorylation and respiration, a measure of how efficiently electrons are transferred. They observed that steers classified as low RFI had RCR significantly greater than that of steers classified as high RFI. On the other hand, when tissue samples from young beef bulls were examined (provided by the study of Fitzsimons et al. [106]) and used citrate synthase activity as an indicator of mitochondrial number, they were unable to find a correlation between RFI status and the number of mitochondria in either the muscle or the liver tissue.
A study of bovine liver tissue performed by Lancaster et al. [107] indicates, on the other hand, that energetically inefficient steers have a lower level of ADP control of oxidative phosphorylation than feed-efficient steers. The acceptor control ratio (ACR; ratio of state 3:state 2 respiration), which indicates the respiratory rate within the mitochondrion, was higher in low-RFI cattle [107] This finding was also observed in steer progeny of sires with divergent RFI [108]. According to Ramos and Kerley [109], lymphocytes obtained from low-RFI steers contain larger amounts of mitochondrial complex I than those obtained from high-RFI steers, which suggests that the former generate more ATP. Studies assessing differential mRNA expression of genes linked with oxidative phosphorylation in beef cattle's muscle or liver tissue divergent for RFI have found inconsistent results at the cellular transcript level [110,111].
Furthermore, it has been postulated that variations in stress reactions between animals classified as high and low RFI are one of the processes that contribute to the observed disparities in energy efficiency. These hypotheses are based on evidence that reveals differences in stress responses between animals classified as high and low RFI. Recent research by Kenny et al. [112] showed that low-RFI Simmental heifers tended to have lower sensitivity to exogenous adrenocorticotropic hormone. This finding suggests that RFI status may be connected to the hypothalamic-pituitary-adrenal axis function in cattle [113]. Cortisol concentrations in high-RFI and low-RFI Limousin heifer were found to be identical in a recent investigation on the hormonal responses to a corticotropin-releasing hormone challenge [114]. In the study that was carried out by Munro et al. [115], plasma cortisol levels were not measured; however, it was noted that low-RFI heifers had a significantly elevated heart rate in response to an acute stressor. This was the finding that stood out the most.
5.3. Body Composition
Researchers have shown that fatter cattle have fewer maintenance needs than leaner livestock of the same live weight, and this effect holds across a wide range of animal species [116]. It is estimated that the ratio of retained energy (RE) to expended energy is 0.88 for protein synthesis and 0.81 for lipid synthesis, indicating that protein production is more energy efficient. Once proteins have been synthesized, they undergo constant degradation and reconstruction. Due to this "turnover," protein is maintained at a lower efficiency than fat (0.4 for protein versus 0.70–0.75 for fat; [117]). Owens et al. [118] found that fat accretion had an average efficiency of 76% (heat loss of 24%), whereas protein accretion was only 47% (heat loss of 53%). Therefore, dietary requirements are determined by considering both body and gain composition.
Recent studies indicate that lines of Angus cattle selected for and against the yearling growth rate exhibit comparable differences in protein turnover rates (Oddy et al., 1998, as cited in [40]). Due to differences in protein turnover rates, there may be an inherited component to the variation in the quantity of feed energy required for maintenance and growth. Larger percentages of subcutaneous fat, as seen in beef breeds, were found by Thompson et al. [103] to be associated with lower maintenance costs than larger percentages of visceral fat, as shown in dairy cow breeds. This finding may partially explain differences in maintenance efficiency between dairy and beef breeds. Dairy breeds have higher energy and weight balance maintenance needs than beef breeds, according to research by Solis et al. [119]. They hypothesized that this may be due to differences in fat distribution throughout the body. In addition, beef breeds' maintenance energy needs reflect their lean body mass and subcutaneous fat. In contrast, dairy breeds' maintenance energy needs reflect their lean body mass, internal fat, and vital organ mass. These physiological differences accounted for the remaining variance. The fact that differences in body composition do not totally explain variations in maintenance needs is supported by Taylor et al. [120], who observed persistent differences between beef and dairy cattle when animals were evaluated at identical body composition.
5.4. Physical Activity
Luiting et al. [121] found that physical activity was the most influential factor in determining energy efficiency, accounting for 80% of the heritable variance in RFI. Morrison and Leeson (1978), as cited in Archer [40] discovered that productive birds were less active (spent more time resting and less time upright and consuming) compared to less productive birds, and Katle and Kolstad [122] discovered that locomotive activity was the most significant factor influencing FE. There have been few attempts to replicate these results with larger ruminant species. Herd and Arthur [123] discovered that DMI variation in cattle may be associated with disparities in activity levels, including feeding, ruminating, and walking at different speeds. Both Herd et al. [124] and Richardson [125] discovered that physical activity accounted for between 5 and 10 percent of the variance in DMI. Physical activity may influence total energy expenditure; if an increase in DMI does not compensate for the energy consumed, overall gain and efficiency may be diminished [123,124,126]. According to Llonch et al. [127], animals that walked less had a greater dry matter intake.
5.5. Extra-physiological Considerations
The efficiency with which feed is utilized for maintenance and production may also be influenced by a vast array of biological systems within the animal. Dry matter digestibility measures an animal's ability to derive usable nutrients from its dietary source. According to research by Richardson et al. [128], there was a small but significant difference in digestibility between cattle with high and low RFI. Herd et al. [129] observed that ewes from a line selected for high weaning weight assimilated 1.8% more dietary organic matter than ewes from a line selected for low weaning weight, indicating that digestibility is related to genetic variations in performance. According to Katle and Kolstad [122]. the digestibility findings from their investigation into the causes of variation in hens' residual feed consumption were ambiguous.
Numerous other physiological indicators have been linked to performance in different studies. Richardson et al. [128] discovered that cattle with a high RFI (i.e., low efficiency) had a higher total plasma protein concentration than cattle with a low RFI (i.e., high efficiency). These differences may have resulted from distinct metabolic processes, such as protein synthesis and proteolysis rates, and not the immune system. Müller et al. [40] demonstrated that milk lipid, milk protein, thyroxine (T4), triiodothyronine (T3), T3/T4, and total plasma protein correlate with dairy cattle's residual feed consumption. These findings suggest that animal-to-animal differences in efficiency are associated with differences in metabolism; however, the physiological mechanisms underlying this variation and the relative importance of various metabolic processes in determining FE are unknown. This information is necessary for a deeper understanding of the processes underlying variations in supply efficiency [40].
5.5. Visceral Organs
Differences in metabolic activity between lean and fat tissue help to clarify variations in maintenance requirements. Recent research has concentrated on other highly metabolic body tissues. Smith and Baldwin [130] demonstrated that the liver, heart, breast, and gastrointestinal tissues are among the most metabolically active. They hypothesized that alterations in the relative proportions of these tissues and organs contribute to the increase in maintenance requirements of lactating dairy cows. Similarly, Early et al. [131] observed that the turnover of proteins in visceral tissues was greater than that of skeletal muscle. According to research by Ferrell and Jenkins (1985), as cited in Archer et al. [40], visceral organs consume most of the nutrients required for basal metabolism. The high consumption of these tissues was attributed to their high protein synthesis rates. Consequently, the proportion of these visceral organs within the body is anticipated to impact the maintenance requirements of cattle.
Jenkins et al. [132] found that the proportion of non-carcass components in dairy-type heifers was higher than in beef cattle. In the study by Jenkins et al., Brown Swiss cows had substantially larger livers and lungs than Hereford cows, with significantly smaller internal organs and more structural-type tissue. The effect of visceral organs on total body nutrient consumption is demonstrated by the response of these organs to dietary manipulations. The increased weights or proportions of the small intestine, liver, and pancreas [133], and the small and large intestines, liver, and stomach [40,132,134] have been associated with the increased energy demands observed in studies of sheep and cattle fed high levels of nutrition. Some research suggests that restricting nutrition to maintain a live weight increases the proportion of metabolically inactive viscera, such as the liver and digestive tract [135]; however, others have found the opposite true [136].
5.6. Intestinal Absorption and Cell Morphology
Increased intestinal nutrient absorption has been linked to variations in FE among animals [112]. This is supported by the negative correlations (r=0.33) between jejunal mucosal density and RFI in cattle [137]. Montanholi et al. [138] found more cells in the duodenum and ileal epithelial tissue of low-RFI steers compared to high-RFI steers of the same age. In a 2013 study, single nucleotide polymorphisms (SNPs) in genes responsible for transporting phospholipids and cholesterol in the small intestine were associated with disparities in FE [139].
6. Descriptors of International Nutritional Models on Determination of Energy Requirements for Beef Cattle
Table 3 summarizes the nutritional models used worldwide to estimate beef cattle's calorie requirements.
In contrast to the comparative slaughter trials utilized by the North American [140,141] and Brazilian systems [142], the AFRC, CSIRO[143], and INRA [144] models are based on calorimetry. The energy systems that were initially developed using calorimetric data for dairy cattle in the United States may also be beneficial for heifer calves [145]. However, the NRC notes that calorimetry estimates have limitations when applied to realistic feeding conditions [146]. To supplant the defective Starch Equivalent (SE) method, British researchers proposed in 1965 a calorimetric nutrition system based on metabolizable energy (ME) [147]. Under The Agricultural and Food Research Council's vigilant eye, the Metabolizable Energy (ME) system, ARC, 1980 as cited in [20] underwent simplification [148], revision, and enhancement [149]. An energy and protein requirements guidebook for ruminants was published in the early 1990s [150].
Calorimetry is a technique for calculating ME by measuring heat emission and subtracting losses from total energy consumption. Indirect calorimetry, which calculates heat production from oxygen intake, carbon dioxide production, and nitrogen excretion, is more accurate than comparative slaughter [151]. Maintenance energy (MEm) is the disparity between the quantity of heat produced during a fast and the amount of sustenance consumed during the fast. When attempting to estimate energy balance and other variables, such as diet, output, organ mass, breed, sex, and length arise [151,152].
MEm can be determined by either dividing the fasting metabolic rate by the energetic efficiency for maintenance (Km) or by regressing energy intake against energy outputs. The ME method has faults due to its foundation in experiments with castrated male sheep rather than cattle, even though there are no significant differences in energy consumption between the two species[153]. Since more than a century ago, calorimetry investigations have provided the foundation for our understanding of energy metabolism in domesticated animals, despite being costly and time-consuming [154]. The current Australian method for calculating the energy requirements of beef cattle is based on the UK system's definitions of animal energetics. However, the AFRC's energy recommendations are no longer applicable due to the constant evolution of the dairy and cattle industries [150]. As part of an endeavor to modernize the dietary requirements of dairy cattle, the 'Feed into Milk' technique was devised in 2004 [155]. The energy requirements of beef cows are calculated using the California Net Energy System and slaughter comparisons. It is more convenient to discuss energy requirements in terms of either Shrunk Body weight (SBW) or Empty Body Weight (EBW), although live weight (LW) is the most significant factor in [156] determining maintenance demands.
Directly quantifying ME and Retained Energy (RE) at slaughter for comparison enables linear regression to estimate ME consumption for RE. This method may also be used to calculate the fasting heat production (FHP) and maintenance energy (MEm). However, comparative slaughter research is time-consuming, labor-intensive, and costly. Cattle weighing less than 250 kilograms do not reliably suit the NASEM energy calculations. Long-term feeding experiments can estimate maintenance requirements by calculating the quantity of food required to maintain a constant body mass [157]. However, when information is rare in the literature on several factors, custom-tailored production studies may be helpful in modifying energy requirements. The feed into milk system for dairy cattle is one example of such studies, effectively incorporating custom-tailored production into updated standards [155]. The ME and NE systems include maintenance, production (milk, LW gain, fiber growth), and fetal development when calculating the energy requirements of ruminant animals [151]. ME [143,150] and NE [142,144,157] systems both utilize feed ME concentration in their calculations; however, the NE system also accounts for variable NE values based on animal production functions.
Due to concerns regarding the cattle industry's impact on global warming, NE [142,144,157] systems now include equations to predict enteric methane output. Using their own sets of equations, both the tropical and French methodologies consider individual cattle genotypes [144]. Concerns have been expressed regarding the energy requirements of foraging and cold-stressed animals. These systems use a factorial design, which has been criticized for its inability to describe the interactions between feed and nutrients adequately. This analysis excludes the more mechanical Ruminant Nutrition System (RNS) [141]. It is recognized that the RNS’s theoretical foundation is crucial to its future development. There are numerous European feeding systems, with the French system being the most recently enhanced. Comparatively, the Brazilian method was designed for tropical regions due to its importance to beef cattle energetics, particularly from 2009 to 2020.
7. Metabolizable and Net Energy requirements for maintenance for growing beef cattle from recent studies published around the world
According to Ferrell and Jenkins [158], up to 65-70% of the energy required for livestock production is spent on maintenance. To optimize the utilization of dietary energy, it is essential to determine the maintenance energy requirements with precision. Maintenance energy requirements vary based on variables such as live weight, metabolic body size, age, breed, sex, and production level [158,159]. Diverse models are developed using the live weight of animals, either as metabolic live weight (LW0.75) in calorimetry-based systems [143,144,150] or adjusted to empty body weight (EBW) in comparative slaughter-based models [142,157]. Notably, the AFRC equation raises LW to the power of 0.67, whereas the CSIRO and INRA equations both use a coefficient of 0.75. The AFRC equation isolates maintenance energy requirements into fasting metabolism and adds energy cost for activity, whereas the CSIRO equation incorporates the factor (0.1 MEp × km) into the basal metabolic rate to account for increased maintenance requirements with higher FI. Table 4 presents the equation used to estimate maintenance requirements in animals.
However, Marcondes et al. [160], utilizing an earlier BR-corte database, did not detect a distinct relationship between km and ME concentration in the diets of tropical animals fed low-digestibility feeds. Both the AFRC and CSIRO systems incorporate a correction factor of 1.15 to account for the elevated metabolic rate of bulls compared to steers and heifers.
The Australian methodology accounts for breed differences by employing correction factors of 1.2 for Bos indicus and 1.4 for Bos taurus. The effect of age is included as a power term in the CSIRO equation. In NE systems, it is presumed that the maintenance energy requirement is constant per kg of LW0.75 (Table 4). The French system differentiates between pre-ruminant and ruminant animals using distinct coefficients (0.289 and 0.423, respectively). The NASEM system additionally compensates for the impact of environmental temperature on metabolic rate, assuming thermoneutrality at 20°C and considering cold or heat stress. Live weight (LW) and maintenance energy (MEm) for Bos taurus bulls were obtained using equations from the three energy systems above. For all calculations utilizing the NASEM equation assumed thermoneutrality. Because of the following, this comparison of energy systems does not include the CSIRO or BR-Corte equations: The Brazilian equation was derived from data for Zebu and Zebu crossbred animals, which is not representative of UK conditions, whereas the CSIRO equation requires growth curve data and implies non-constant ME for production even at the same q value. The BR-Corte approach provides an equation only for Bos taurus x Bos indicus hybrids and not for pure Bos taurus animals, which is another disadvantage. The NRC estimates that the net energy required for maintenance (NEm) of Bos indicus cattle is approximately 10% less than that of Bos taurus cattle. With increasing metabolic weight (LW0.75), the NEm per kg requirement in all three energy systems decreases. The MEm from the INRA equation (ruminant equation) was frequently greater than the MEm from the AFRC and NASEM equations. For LW less than 180 kg (pre-weaning), however, the associations between the two European systems were comparable. Intriguingly, the results of the INRA equation for pre-ruminant animals are remarkably similar to those of the NASEM equation, albeit with substantially lower MEm values. Using Bos taurus genotypes, AFBI calorimetry researchers determined that developing animals require 21% more MEm than mature animals (0.78 vs 0.617 MJ/kg LW0.75). Table 5 demonstrates that this is consistent with the findings of [159,161], as well as the comparisons conducted by Jiao et al. [162].
Various physiological states influence the requirement for NEm in developing animals, as demonstrated by comparative euthanasia experiments conducted in Brazil. At 0.334±0.0335 MJ of NEm/kg LW0.75 versus 0.349±0.0420 MJ of NEm/kg LW0.75 (finishing animals versus developing animals, respectively; p = 0.426), the NEm demand of bulls weighing 300 kg or less was 4.3% lower. This evaluation did not include additional comparisons based on measuring method, breed, or sex due to a lack of data.
The net energy for maintenance (NEm) requirements in the earlier data compiled by Cottrill et al. [175] were slightly higher (0.353 vs. 0.336 MJ/kg LW0.75, respectively; see Table 5) compared to the most recent data collected for the present review, which consisted primarily of comparative slaughter trials with Zebu animals and their crossbreeds. Variations in the conversion of metabolizable energy (ME) to net energy (NEm) for maintenance at the level of individual animals and in the method for calculating km may contribute to the observed differences in MEm levels between studies. The estimated MEm requirement using the AFRC and NASEM equations appears to be 8.2% and 19.5% less than the mean value of 0.672 MJ/kg0.75 derived from calorimetry studies conducted at AFBI (Table 5) based on a hypothetical Bos taurus bull with a live weight (LW) of 300 kilograms and a constant km value of 0.65. In accordance with the data, the INRA calculation for ruminant animals predicts a value of 0.67 MJ/kg0.75 (see Table 4 for additional information). Cottrill et al. [175] discovered that the ME systems recommend a 1.15-fold higher MEm maintenance requirement for males than for steers and heifers (Table 4). These findings are supported by the results of Jiao et al. [162].
Selection based on RFI has been extensively studied worldwide over the past decade, and its effects on the maintenance energy requirements of developing animals in Irish settings have been partially elucidated. Lawrence et al. [176] determined NEm requirements for developing Simmental Holstein-Friesian heifers categorized according to phenotypic RFI under Irish conditions based on a regression analysis of daily live weight gain (g/kg LW0.75) versus NE intake. The high RFI group required 0.410 MJ/kg LW0.75, the medium RFI group required 0.368 MJ/kg LW0.75, and the low RFI group required 0.335 MJ/kg LW0.75 (LW = 311 kg at the beginning of the test period).
Cabezas-Garcia et al. [20] found that animals with a high RFI required 18% more MEm than those with a low RFI (0.777 versus 0.637 MJ of MEm/kg LW0.75, for the high and low RFI groups, respectively). These values are consistent with those obtained by Gomes et al. [177] in Nellore calves (Table 5). The NEm values derived by Lawrence et al. [176] were omitted from Table 5 as energy metabolism calculations were not the primary focus of the investigation.
Energy systems provide equations for estimating net energy requirements for weight gain (NEg) in developing cattle, as shown in Table 6.
Different systems utilize body weight and growth data to estimate nutritional energy requirements, with specific methods incorporating unique adjustments for accuracy. The LW and LWG are incorporated into the calculations and are utilized in numerous systems, including AFRC, CSIRO, NASEM, and BR-Corte. The AFRC equation adjusts the NEg to account for differences in maturation between sexes of the same breed, with greater correction factors for the former. The French method incorporates protein and lipid retention to improve NEg estimates when comparing systems based solely on LW measurements.
Previously, it was believed that there were substantial differences in the fasting or maintenance energy expenditure of cattle due to differences in body composition. It is now possible to obtain precise and consistent readings using non-invasive techniques such as computed tomography and ultrasound. Concerns persist, however, about the viability of employing such techniques on farms. The projected energy required for LW gain is based on RE about the animal's maturation, which in turn is primarily determined by the composition of EBG. According to studies, animals' maintenance energy requirements decrease by 0.75 kcal/kg of LW as they acquire weight. This trend may be explained by the decreasing relative weight of organs and body protein that occurs with aging. The American method for calculating NE requirements for growth considers current and desired body weights. For heifers and bulls, it is suggested that various variables be used to calculate the net energy requirements for weight gain.
Males have greater growth potential on a diet rich in forage than heifers. Regarding lean growth, males respond more significantly to increases in FI per MJ of metabolizable energy (ME) than females. A developing animal's total energy requirements are believed to include maintenance and growth requirements. Comparing the AFRC and NASEM energy requirements using a hypothetical example from Gordon et al. [161]. The minimal energy requirement (MEmin) calculated by both systems is significantly below the actual value. Both methods overestimate the efficiency with which ME is converted to growth (in kilograms). The formulas used to determine a meal's metabolizability may influence efficiency estimations, particularly for kg, as shown in Table 7.
As addressed by the French method, muscle lipid, and protein accretion rates could improve NEg calculations for developing animals in Northern Ireland's climate. Modernizing the British approach requires a reevaluation of how the concept of food metabolizable energy influences energy utilization efficiency.
When animals experience a period of malnutrition followed by adequate food intake, they experience compensatory growth, which increases the efficiency with which they use energy to gain weight. Beef cattle raised on pasture, where forage quantity and quality fluctuate with the seasons, provide an intriguing case study for this issue. When determining an animal's energy requirements at a younger age, the British system disregards compensatory growth, whereas the Australian system considers it. While the most recent upgrade to the French system acknowledges the significance of compensatory growth, it does not factor it into estimates of energy requirements. According to the National Research Council (NRC), animals experiencing compensatory growth have more energy available for weight gain because their maintenance requirements are reduced. Compensating animals have become more efficient at utilizing energy, requiring less net energy to gain mass. Compensatory growth has been linked to factors such as gut content, increased tissue intestine weight, and internal organ size alterations. However, compensatory growth in animals occurs as a direct result of two factors. First, cattle experiencing compensatory growth are leaner than average, which leads to a lighter weight due to reduced muscle and fat, while their frame and gut capacity remain normal. As a result, these cattle can consume more feed than their live weight alone would predict. Second, because they are lean, their weight gain is more efficient per unit of energy intake, as the gain is primarily lean tissue (protein and water) rather than fat. This is important because the energetic cost of depositing fat is much greater than that of lean tissue. Age may modify the magnitude of compensatory growth responses. It is still being determined how compensatory growth affects the caloric requirements of beef cattle, particularly in the United Kingdom and Ireland.
8. Energy Requirement for Maintenance During the Finishing Period
Multiple studies have demonstrated a variance in the maintenance energy requirements of various beef cattle breeds. However, there is limited information on studies comparing the energy requirements of different genetic groups during the finishing period. One of the studies that attempts to bridge this knowledge gap is that of Goulart et al. [178]. In the study, animals were fed the same diet from birth to slaughter to compare the NEm of purebred Nellore to that of its crosses with Simmental, Angus, and Canchim breeds. The animals were born in the tropics and fed free-choice minerals throughout their development until the feedlot phase began, potentially affecting factors such as ingestion, carcass composition, mature weight, and the ensuing energy requirement for maintenance during the finishing phase may be affected. The dietary digestible energy (DE) was determined to be 4,409 Mcal/kg of total digestible nutrients. As recommended by NASEM [157] they utilized an efficiency of 82% to convert DE to ME for both the limit-fed and ad libitum groups. Recent publications suggest that the ratio of DE to ME may exceed 82% and can differ [179,180], however, Goulart et al. [178] chose to use the established 82% ratio. This decision was based on the high proportion of forage in their diets, which is comparable to the diets used in previous studies that determined the 82% ratio [141]. The Lofgreen and Garrett [156] method calculated the RE and maintenance energy requirements. The initial EBW was calculated using SBW. Then, the initial empty body fat (EBF) and empty body protein (EBP) were estimated for each animal and genetic group (GG) using the average EBW, SBW, EBF, and EBP values of the respective breed group's baseline cattle. The methodology Goulart et al. [178] used is comparable to that described by Tedeschi et al. [181].
Goulart et al. [178] found no significant differences in NEm requirements between Nellore (NL) and Angus (AN) crosses at the same age and frame size (P = 0.528), Charolais (CN) crosses (P = 0.671), and Simmental (SN) crosses (P = 0.706). Furthermore, they determined a common NEm requirement of 86.86 kcal/d/kg0.75 EBW (see Table 8) by analyzing the aggregated data for NL, CN, AN, and SN. This equates to 79.6 kcal/d/kg0.75 EBW for a 300-kg SBW bull, which is very similar to the value of 77 kcal/d/kg0.75 EBW reported by Lofgreen and Garrett [156]. Fox and Black [182] also noted that beef cattle strains with comparable frame proportions are presumed to have comparable net energy needs at the same body composition. According to the NRC [146] it was assumed that Bos indicus breeds require 10% less NEm than Bos taurus breeds, with crossbreeds falling in the middle.
Chizzotti et al. [183] observed a 14% reduced NEm requirement for Nellore purebreds and Nellore Bos taurus crossbreds, with an average NEm of 75 kcal/d/kg0.75 EBW, in contrast to the findings of Goulart et al. [178] (86.8 kcal/d/kg0.75 EBW). In their meta-analysis, Marcondes et al. [169] reported a NEm of 79.4 kcal/d/kg0.75 EBW for Nellore cattle. Tedeschi and Fox [184] reported a 95% confidence interval of 74.1 to 84.7 kcal/d/kg0.75 EBW for Nellore cattle, and the average NEm of 77 kcal/d/kg0.75 EBW reported by Lofgreen et al. [156] would lie within the range of meta-analysis databases. Frisch and Vercoe [185] suggested that Zebu cattle require 10% less NEm, which is consistent with the findings of Goulart et al. [178]. In contrast, the experimental findings of Ferrell and Jenkins [186] and Tedeschi et al. [181] do not support the notion that Nellore cattle have a diminished NEm. The reported NEm value of 86.8 kcal/d/kg0.75 EBW is comparable to the NEm reported by Ferrell & Jenkins [186] for Brahman crossbred steers and Tedeschi et al. [181] for Nellore steers. The recent publication of NASEM [157] also noted that Bos indicus cattle, specifically those reared in Brazil, do not require a 10% NEm adjustment. Despite the lack of statistical significance, the study revealed that the NEm values for NL and AN were 85.53 and 90.76 kcal/d/kg0.75 EBW, respectively, indicating a 5.76% decrease in NEm for NL compared to AN. This relative difference between purebred NL and AN crossbred calves corresponds with NRC [146] data. Oldham [141] mentioned the concept of reduced NEm requirement while maintaining similar basal metabolism. Because breed genetics and nutritional management practices change over time, more effort should be devoted to studying and comprehending the NEm of cattle. Comparisons of maintenance requirements should also consider the genetic background of the tested population. Moraes et al. [187] found that selection for growth considerably increased the maintenance requirements of Nellore and Holstein cattle over time.
Moraes et al. [187] assumed that the MEm requirement for genetic group was similar, with a mean value of 137.53 kcal/d/kg0.75 EBW, since there were no significant differences between GG for the slope and intercept when regressing HP on MEI. The average values for km and kg among GG were also comparable (P > 0.05 for both): 63.2% and 26.0%, respectively. Ferrell and Jenkins [186] reported similar kg and km values (between 65% and 69%) for Brahman crossbred steers, whereas Oldham [141] reported higher kg and km values (69.9% and 52.5%, respectively) for Nellore steers. Chizzotti et al. [188] reported that the km and kg values for Nellore Red Angus crossbred cattle were 70.6% and 47.0%, respectively.
To calculate NEm based on comparative slaughter methods, animals must be fed at two or three levels of ingestion (approximating maintenance, libitum, and an intermediate level) [156]. Variations in RE and body mass index (BMI) resulted from these dietary differences. Goulart et al. [178] were among the first to compare the energy needs of various GG raised under the same conditions and fed the same diet throughout their lives. In their study, cattle were assigned to two nutritional treatments (NT): ad libitum or restricted feeding. As corroborated by previous studies by Old & Garrett [189] and Oldham [141], the limit-fed treatment received 70% of the daily feed administered to the ad libitum treatment of the same genetic group. However, it is essential to observe that increased FI is a significant component of compensatory growth when animals are fed at total capacity [157]. In their study, ad libitum-fed steers had a higher average daily DMI as a percentage of body weight than limit-fed steers (2.90% of BW in ad libitum-fed steers, compared to 2.10% of BW in limit-fed steers). They suggested that the ad libitum-fed group experienced compensatory growth, although if cattle consume more ad libitum, assuming the same diet is fed, the increased intake of energy and protein should lead to increased weight gain due to the availability of additional nutrients for growth. Furthermore, higher FI would result in a dilution of the energy cost for maintenance, directing more nutrients toward weight gain. This raises questions about whether the observed growth in the ad libitum-fed group is truly compensatory or simply a result of higher nutrient intake. The higher values of DMI were reportedly linked to lower quality and quantity of pastures, because the animals experienced a protracted period of feed restriction, which resulted in decreased growth rates, particularly from 18 months of age until the commencement of the feedlot phase. According to Lofgreen & Kiesling [190], compensatory growth periods are typically characterized by increased FI throughout the feeding period. Consequently, limiting the limit-fed treatment to 70% of the daily feed offered to the ad libitum treatment likely overestimated the feed offered to the limit-fed cattle, thereby influencing the net energy requirement calculations in their study. As a result, their data represents the first study to demonstrate how the energy requirements of cattle can change when animals experience compensatory gain.
9. Future Directions
There is increasing pressure on the beef industry to enhance FE while minimizing the environmental impact and preserving productivity. Future research and development in FE must address specific limitations while exploring innovative solutions to support a sustainable future for beef production. First, FE must be improved without compromising productivity. While current strategies to enhance FE may sometimes involve trade-offs with growth, carcass quality, or reproductive performance, developing methods that allow animals to convert feed to productive output more efficiently without overall productivity loss is essential. Advances in genetics and nutrition may provide ways to enhance FE and production simultaneously. In that light, the developing area of nutrigenomics, the study of how diet can change and/or modify gene expression, offers a possible avenue for improving FE. By accounting for genetic variation among animals, nutrigenomics could optimize FE at the individual level, i.e., precision nutrition. This approach could allow producers to adjust diets based on each animal's genetic profile, thereby improving feed conversion efficiency to meet specific nutritional needs and production targets.
Genetic selection for FE traits presents another promising but challenging direction. Measuring FE has historically been costly and complex, and routine phenotyping is often limited across farms. However, new methods and technologies are allowing direct selection for FE especially in bulls used for breeding. Emerging technologies, such as automated FI recorders and precision sensors, can offer real-time FE data with increased affordability. Additionally, machine learning approaches could be leveraged to predict FE phenotypes from readily available data, such as growth rate, body condition, or behavioral traits, thereby increasing the number of usable phenotypes. As these sophisticated phenotyping tools are deployed on farms and feedlots, the resulting data could support more robust genomic selection models. With a sufficient volume of FE phenotypes recorded across various production environments, genomic models could achieve greater accuracy, enabling breeders to make highly accurate selections based on genomically predicted performance.
A future-focused approach that warrants further investigation is the incorporation of nutritional models into genetic evaluations for FE. Nutritional models provide valuable insights into how different feeding strategies affect growth and metabolism and, thus, provide a way of accounting for environmental and dietary variations when predicting FE traits. By integrating these models could be incorporated into genetic evaluations, we can achieve more accurate estimations of an animal’s genetic potential and, consequently, enable the development of feed-efficient cattle across a range of production systems and feed resources. Additionally, there is a need for better equations to predict dry matter intake, particularly for cattle on high-forage diets. The variation in forage quality, particle size (e.g., long vs. chopped), levels of supplemental feeds, and the amount of feed offered relative to animal capacity (ad libitum vs. limit-fed) all significantly influence intake and the digestibility of the total diet. In feedlot finishing diets, although there is animal-to-animal variation in intake, diet quality plays a much smaller role as a source of variation. Addressing these gaps in intake prediction is essential for improving the precision of nutritional models and enhancing their utility in genetic evaluations.
Author Contributions
Conceptualization, H.R.O., and A.O.O.; investigation, A.O.O., and H.R.O.; data curation, A.O.O., H.R.O., H.A.M., V.J., and G.S.C.; writing—original draft preparation, A.O.O., and H.A.M.; writing, review and editing, A.O.O., H.R.O., H.A.M., V.J., G.S.C., R.P.L., and J.S.; supervision, H.R.O. All authors have read and agreed to the published version of the manuscript.
Funding
This research received no external funding
Institutional Review Board Statement
Not applicable
Informed Consent Statement
Not applicable
Data Availability Statement
Not applicable
Conflicts of Interest
The authors declare no conflicts of interest.
References
- USDA USDA Foreign Agricultural Service. Beef. Foreign Agricultural Service (FAS), United States Department of Agriculture (USDA); 2024. Released April 11, 2024.; 2024.
- USDA USDA National Agricultural Statistics Service. Cattle . National Agricultural Statistics Service (NASS), Agricultural Statistics Board, United States Department of Agriculture (USDA); 2024. Released January 31, 2024.; 2024.
- UN World Population Projected to Reach 9.8 Billion in 2050, and 11.2 Billion in 2100 | United Nations. 2017.
- Revell, B. Meat and Milk Consumption 2050: The Potential for Demand-Side Solutions to Greenhouse Gas Emissions Reduction. EuroChoices 2015, 14, 4–11. [Google Scholar] [CrossRef]
- FAO Global Meat Consumption, World, 1961 to 2050; 2024.
- Xie, Y.; Hunter, M.; Sorensen, A.; Nogeire-McRae, T.; Murphy, R.; Suraci, J.P.; Lischka, S.; Lark, T.J. U.S. Farmland under Threat of Urbanization: Future Development Scenarios to 2040. Land (Basel) 2023, 12, 574. [Google Scholar] [CrossRef]
- Abu Hatab, A.; Cavinato, M.E.R.; Lindemer, A.; Lagerkvist, C.J. Urban Sprawl, Food Security and Agricultural Systems in Developing Countries: A Systematic Review of the Literature. Cities 2019, 94, 129–142. [Google Scholar] [CrossRef]
- Nesheim, M.C.; Oria, M.; Yih, P.T.; Committee on a Framework for Assessing the Health, E. and S.E. of the F.S.; Board, F. and N.; Resources, B. on A. and N.; Medicine, I. of; Council, N.R. U.S. BIOFUELS POLICY. 2015.
- Hill, R.A. Feed Efficiency in the Beef Industry; Wiley-Blackwell, 2012; ISBN 9780470959527.
- Baker, S.D.; Szasz, J.I.; Klein, T.A.; Kuber, P.S.; Hunt, C.W.; Glaze, J.B.; Falk, D.; Richard, R.; Miller, J.C.; Battaglia, R.A.; et al. Residual Feed Intake of Purebred Angus Steers: Effects on Meat Quality and Palatability. J Anim Sci 2006, 84, 938–945. [Google Scholar] [CrossRef]
- Arthur, P.F.; Archer, J.A.; Johnston, D.J.; Herd, R.M.; Richardson, E.C.; Parnell, P.F. Genetic and Phenotypic Variance and Covariance Components for Feed Intake, Feed Efficiency, and Other Postweaning Traits in Angus Cattle. J Anim Sci 2001, 79, 2805–2811. [Google Scholar] [CrossRef]
- Arthur, J.P.F.; Herd, R.M. Residual Feed Intake in Beef Cattle. Revista Brasileira de Zootecnia 2008, 37, 269–279. [Google Scholar] [CrossRef]
- Nkrumah, J.D.; Okine, E.K.; Mathison, G.W.; Schmid, K.; Li, C.; Basarab, J.A.; Price, M.A.; Wang, Z.; Moore, S.S. Relationships of Feedlot Feed Efficiency, Performance, and Feeding Behavior with Metabolic Rate, Methane Production, and Energy Partitioning in Beef Cattle. J Anim Sci 2006, 84, 145–153. [Google Scholar] [CrossRef]
- Gibb, D.J.; Mcallister, T.A. The Impact of Feed Intake and Feeding Behaviour of Cattle on Feedlot and Feedbunk Management. Proc. 20th Western Nutr. Conf., Calgary, Alberta 1999, 101–116.
- Basarab, J.A.; Price, M.A.; Okine, E.K. Commercialization of Net Feed Efficiency; 2002.
- Fox, D.G.; Tedeschi, L.O.; Guiroy, P.J. Determining Feed Intake and Feed of Individual Cattle Fed in Groups. In Proceedings of the Proceedings of the 2001 Beef Improvement Federation Meeting, San Antonio, TX.; 2001.
- Lamb, G.C.; Black, T.E.; Bischoff, K.M.; Mercadante, V.R.G. The Importance of Feed Efficiency in the Cow Herd; 2013.
- Montaño-Bermude, M.; Nielsen, M.K.; Deutsches, G.H. ENERGY REQUIREMENTS FOR MAINTENANCE OF CROSSBRED BEEF CAlTLE WITH DIFFERENT GENETIC POTENTIAL FOR MILK1; 1990.
- Klosterman, E.W.; Parker, C.F.; Wooster, S. Effect of Size, Breed, and Sex Upon Feed Efficiency in Beef Cattle *****; 1976.
- Cabezas-Garcia, E.H.; Lowe, D.; Lively, F. Energy Requirements of Beef Cattle: Current Energy Systems and Factors Influencing Energy Requirements for Maintenance. Animals 2021, 11. [Google Scholar] [CrossRef]
- Meuwissen, T.; Hayes, B.; Goddard, M. Accelerating Improvement of Livestock with Genomic Selection. Annu Rev Anim Biosci 2013, 1, 221–237. [Google Scholar] [CrossRef]
- Miar, Y.; Plastow, G.; Wang, Z. Genomic Selection, a New Era for Pork Quality Improvement. Springer Science Reviews 2015 3:1 2015, 3, 27–37. [Google Scholar] [CrossRef]
- Brito, L.F.; Oliveira, H.R.; Houlahan, K.; Fonseca, P.A.S.; Lam, S.; Butty, A.M.; Seymour, D.J.; Vargas, G.; Chud, T.C.S.; Silva, F.F.; et al. Genetic Mechanisms Underlying Feed Utilization and Implementation of Genomic Selection for Improved Feed Efficiency in Dairy Cattle. Can J Anim Sci 2020, 100, 587–604. [Google Scholar] [CrossRef]
- de Haas, Y.; Calus, M.P.L.; Veerkamp, R.F.; Wall, E.; Coffey, M.P.; Daetwyler, H.D.; Hayes, B.J.; Pryce, J.E. Improved Accuracy of Genomic Prediction for Dry Matter Intake of Dairy Cattle from Combined European and Australian Data Sets. J Dairy Sci 2012, 95, 6103–6112. [Google Scholar] [CrossRef] [PubMed]
- Bolormaa, S.; Pryce, J.E.; Kemper, K.; Savin, K.; Hayes, B.J.; Barendse, W.; Zhang, Y.; Reich, C.M.; Mason, B.A.; Bunch, R.J.; et al. Accuracy of Prediction of Genomic Breeding Values for Residual Feed Intake and Carcass and Meat Quality Traits in Bos Taurus, Bos Indicus, and Composite Beef Cattle. J Anim Sci 2013, 91, 3088–3104. [Google Scholar] [CrossRef]
- Wang, Y.; Zhang, F.; Chen, L.; Vinsky, M.; Crowley, J.; Plastow, G.; Basarab, J.; Stothard, P.; Li, C.; Canada, A.-F.; et al. 287 Genomic Prediction for Residual Feed Intake and Its Component Traits Based on 50K and Imputed 7.8. J Anim Sci 2018, 96, 107–107. [Google Scholar] [CrossRef]
- Verbyla, K.L.; Calus, M.P.L.; Mulder, H.A.; de Haas, Y.; Veerkamp, R.F. Predicting Energy Balance for Dairy Cows Using High-Density Single Nucleotide Polymorphism Information. J Dairy Sci 2010, 93, 2757–2764. [Google Scholar] [CrossRef]
- Pryce, J.E.; Arias, J.; Bowman, P.J.; Davis, S.R.; Macdonald, K.A.; Waghorn, G.C.; Wales, W.J.; Williams, Y.J.; Spelman, R.J.; Hayes, B.J. Accuracy of Genomic Predictions of Residual Feed Intake and 250-Day Body Weight in Growing Heifers Using 625,000 Single Nucleotide Polymorphism Markers. J Dairy Sci 2012, 95, 2108–2119. [Google Scholar] [CrossRef]
- Pryce, J.E.; Wales, W.J.; De Haas, Y.; Veerkamp, R.F.; Hayes, B.J. Genomic Selection for Feed Efficiency in Dairy Cattle. Animal 2014, 8, 1–10. [Google Scholar] [CrossRef]
- Mujibi, F.D.N.; Nkrumah, J.D.; Durunna, O.N.; Stothard, P.; Mah, J.; Wang, Z.; Basarab, J.; Plastow, G.; Crews, D.H.; Moore, S.S. Accuracy of Genomic Breeding Values for Residual Feed Intake in Crossbred Beef Cattle. J Anim Sci 2011, 89, 3353–3361. [Google Scholar] [CrossRef] [PubMed]
- de Haas, Y.; Pryce, J.E.; Calus, M.P.L.; Wall, E.; Berry, D.P.; Løvendahl, P.; Krattenmacher, N.; Miglior, F.; Weigel, K.; Spurlock, D.; et al. Genomic Prediction of Dry Matter Intake in Dairy Cattle from an International Data Set Consisting of Research Herds in Europe, North America, and Australasia. J Dairy Sci 2015, 98, 6522–6534. [Google Scholar] [CrossRef]
- Bolormaa, S.; MacLeod, I.M.; Khansefid, M.; Marett, L.C.; Wales, W.J.; Miglior, F.; Baes, C.F.; Schenkel, F.S.; Connor, E.E.; Manzanilla-Pech, C.I.V.; et al. Sharing of Either Phenotypes or Genetic Variants Can Increase the Accuracy of Genomic Prediction of Feed Efficiency. Genet Sel Evol 2022, 54. [Google Scholar] [CrossRef]
- Nielsen, M.K.; MacNeil, M.D.; Dekkers, J.C.M.; Crews, D.H.; Rathje, T.A.; Enns, R.M.; Weaber, R.L. Review: Life-Cycle, Total-Industry Genetic Improvement of Feed Efficiency in Beef Cattle: Blueprint for the Beef Improvement Federation. Prof Anim Sci 2013, 29, 559–565. [Google Scholar] [CrossRef]
- Berry, D.P.; Crowley, J.J. CELL BIOLOGY SYMPOSIUM: Genetics of Feed Efficiency in Dairy and Beef Cattle. J Anim Sci 2013, 91, 1594–1613. [Google Scholar] [CrossRef] [PubMed]
- Korver, S. Genetic Aspects of Feed Intake and Feed Efficiency in Dairy Cattle: A Review. 1988.
- Koch, R.M.; Swiger, L.A.; Chambers, D.; Gregory, K.E. Efficiency of Feed Use in Beef Cattle. J Anim Sci 1963, 22, 486–494. [Google Scholar] [CrossRef]
- Keith Salmon, R.; C Bailey, D.R.; Weingardt, R.; aNoBBnc, R. GROWTH EFFICIENCY IN MICE SELECTED FOR INCREASED BODY WEIGHT; 1990.
- Honig, A.C.; Inhuber, V.; Spiekers, H.; Windisch, W.; Götz, K.-U.; Schuster, M.; Ettle, T. NC-ND License Body Composition and Composition of Gain of Growing Beef Bulls Fed Rations with Varying Energy Concentrations. Meat Sci 2022, 184, 309–1740. [Google Scholar] [CrossRef]
- Hersom, M.J.; Horn, G.W.; Krehbiel, C.R.; Phillips, W.A. Effect of Live Weight Gain of Steers during Winter Grazing: I. Feedlot Performance, Carcass Characteristics, and Body Composition of Beef Steers. J. Anim. Sci 2004, 82, 262–272. [Google Scholar] [CrossRef]
- Archer, J.A.; Richardson, E.C.; Herd, R.M.; Arthur, P.F. Potential for Selection to Improve Efficiency of Feed Use in Beef Cattle: A Review; 1999; Vol. 50.
- Svendsen, M.; Skipenes, P.; Mao, I.L. Genetic Parameters in the Feed Conversion Complex of Primiparous Cows in the First Two Trimesters. J Anim Sci 1993, 71, 1721–1729. [Google Scholar] [CrossRef]
- Veerkamp, R.F.; Emmans, G.C.; Cromie, A.R.; Simm, G. Variance Components for Residual Feed Intake in Dairy Cows. Livest Prod Sci 1995, 41, 111–120. [Google Scholar] [CrossRef]
- Torres-Vázquez, J.A.; van der Werf, J.H.J.; Clark, S.A. Genetic and Phenotypic Associations of Feed Efficiency with Growth and Carcass Traits in Australian Angus Cattle. J Anim Sci 2018, 96, 4521–4531. [Google Scholar] [CrossRef]
- Novo, L.C.; Gondo, A.; Gomes, R.C.; Fernandes Junior, J.A.; Ribas, M.N.; Brito, L.F.; Laureano, M.M.M.; Araújo, C. V.; Menezes, G.R.O. Genetic Parameters for Performance, Feed Efficiency, and Carcass Traits in Senepol Heifers. Animal 2021, 15. [Google Scholar] [CrossRef]
- Smith, S.N.; Davis, M.E.; Loerch, S.C. Residual Feed Intake of Angus Beef Cattle Divergently Selected for Feed Conversion Ratio. Livest Sci 2010, 132, 41–47. [Google Scholar] [CrossRef]
- Santana, M.H.A.; Oliveira, G.A.; Gomes, R.C.; Silva, S.L.; Leme, P.R.; Stella, T.R.; Mattos, E.C.; Rossi, P.; Baldi, F.S.; Eler, J.P.; et al. Genetic Parameter Estimates for Feed Efficiency and Dry Matter Intake and Their Association with Growth and Carcass Traits in Nellore Cattle. Livest Sci 2014, 167, 80–85. [Google Scholar] [CrossRef]
- Mrode, R.A.; Smith, C.; Thompson, R. Selection for Rate and Efficiency of Lean Gain in Hereford Cattle 1. Selection Pressure Applied and Direct Responses. Anim Prod 1990, 51, 23–34. [Google Scholar] [CrossRef]
- Akdemir, D.; Beavis, W.; Fritsche-Neto, R.; Singh, A.K.; Isidro-Sánchez, J. Multi-Objective Optimized Genomic Breeding Strategies for Sustainable Food Improvement. Heredity (Edinb) 2019, 122, 672–683. [Google Scholar] [CrossRef] [PubMed]
- Covarrubias-Pazaran, G.; Gebeyehu, Z.; Gemenet, D.; Werner, C.; Labroo, M.; Sirak, S.; Coaldrake, P.; Rabbi, I.; Kayondo, S.I.; Parkes, E.; et al. Breeding Schemes: What Are They, How to Formalize Them, and How to Improve Them? Front Plant Sci 2022, 12, 791859. [Google Scholar] [CrossRef] [PubMed]
- Dickerson, G.E. Animal Size and Efficiency: Basic Concepts. Anim Prod 1978, 27, 367–379. [Google Scholar] [CrossRef]
- Andersen, B.B. Animal Size and Efficiency, with Special Reference to Growth and Feed Conversion in Cattle. Anim Prod 1978, 27, 381–391. [Google Scholar] [CrossRef]
- Fitzhugh, H.A. Animal Size and Efficiency, with Special Reference to the Breeding Female. Anim Prod 1978, 27, 393–401. [Google Scholar] [CrossRef]
- Holmes, W. Size of Animal in Relation to Productivity Nutritional Aspects. Proceedings of the British Society of Animal Production (1972) 1973, 2, 27–34. [Google Scholar] [CrossRef]
- Arthur, P.F.; Renand, G.; Krauss, G. Genetic and Phenotypic Relationships among Different Measures of Growth and Feed Efficiency in Young Charolais Bulls. Livest Prod Sci 2001, 68, 131–139. [Google Scholar] [CrossRef]
- Archer, J.A.; Arthur, P. Genetic Variation in Feed Intake and Efficiency of Mature Beef Cows and Relationships with Post-Weaning Measurements. In Proceedings of the Proc. 7th World Congr.Genet. Appl. Livest. Prod., Montpelier, France.; 2002; pp. 221–225.
- Herd, R.M.; Archer, J.A.; Arthur, P.F. Reducing the Cost of Beef Production through Genetic Improvement in Residual Feed Intake: Opportunity and Challenges to Application 1. J. Anim. Sci. 2003, 81, E9–E17. [Google Scholar]
- Herd, R.M.; Bishop, S.C. Genetic Variation in Residual Feed Intake and Its Association with Other Production Traits in British Hereford Cattle. Livest Prod Sci 2000, 63, 111–119. [Google Scholar] [CrossRef]
- Nkrumah, J.D.; Basarab, J.A.; Wang, Z.; Li, C.; Price, M.A.; Okine, E.K.; Crews, D.H.; Moore, S.S. Genetic and Phenotypic Relationships of Feed Intake and Measures of Efficiency with Growth and Carcass Merit of Beef Cattle. J Anim Sci 2007, 85, 2711–2720. [Google Scholar] [CrossRef] [PubMed]
- Ceacero, T.M.; Mercadante, M.E.Z.; Cyrillo, J.N.D.S.G.; Canesin, R.C.; Bonilha, S.F.M.; De Albuquerque, L.G. Phenotypic and Genetic Correlations of Feed Efficiency Traits with Growth and Carcass Traits in Nellore Cattle Selected for Postweaning Weight. PLoS One 2016, 11, e0161366. [Google Scholar] [CrossRef]
- Robinson, D.L.; Oddy, V.H. Genetic Parameters for Feed Efficiency, Fatness, Muscle Area and Feeding Behaviour of Feedlot Finished Beef Cattle. Livest Prod Sci 2004, 90, 255–270. [Google Scholar] [CrossRef]
- Northcutt, S.; Bowman, B. American Angus Association to Release Selection Tool for Feed Efficiency Available online:. Available online: https://www.angus.org/pub/newsroom/releases/090210_radgrelease.html (accessed on 3 November 2024).
- Freetly, H.C.; Kuehn, L.A.; Thallman, R.M.; Snelling, W.M. Heritability and Genetic Correlations of Feed Intake, Body Weight Gain, Residual Gain, and Residual Feed Intake of Beef Cattle as Heifers and Cows. J Anim Sci 2020, 98. [Google Scholar] [CrossRef]
- Faulkner, D.B. The Relationship of RFI and Voluntary Forage Intake and Cow Survival under Range Conditions Measuring Feed Efficiency Residual Average Daily Gain (RADG); 2016. 2016.
- Fan, L.Q.; Wilton, J.W.; Colucci, P.E. Genetic Parameters for Feed Intake and Efficiency in Lactating Beef Cows. Can. J. Anim. Sci. 1996, 76, 81–87. [Google Scholar] [CrossRef]
- Fan, L.Q.; Wilton, L.E.; Colucci, J.W.; Fan, P.E. Genetic Parameters for Feed Intake and Efficiency in Dry Pregnant Beef Cows. 1996.
- Carstens, G.E.; Tedeschi, L.O. Defining Feed Efficiency in Beef Cattle. In Proceedings of the Beef Improvement Federation, 38th Annual Meeting; 2006.
- Taylor, C.S.; Turner, H.G.; Young, G.B. Genetic Control of Equilibrium Maintenance Efficiency in Cattle. Anim Prod 1981, 33, 179–194. [Google Scholar] [CrossRef]
- Grion, A.L.; Mercadante, M.E.Z.; Cyrillo, J.N.S.G.; Bonilha, S.F.M.; Magnani, E.; Branco, R.H. Selection for Feed Efficiency Traits and Correlated Genetic Responses in Feed Intake and Weight Gain of Nellore Cattle. J Anim Sci 2014, 92, 955–965. [Google Scholar] [CrossRef] [PubMed]
- Fan, L.Q.; Bailey, D.R.; Shannon, N.H. Genetic Parameter Estimation of Postweaning Gain, Feed Intake, and Feed Efficiency for Hereford and Angus Bulls Fed Two Different Diets. J Anim Sci 1995, 73, 365–372. [Google Scholar] [CrossRef]
- Nkrumah, J.D.; Basarab, J.A.; Price, M.A.; Okine, E.K.; Ammoura, A.; Guercio, S.; Hansen, C.; Li, C.; Benkel, B.; Murdoch, B.; et al. Different Measures of Energetic Efficiency and Their Phenotypic Relationships with Growth, Feed Intake, and Ultrasound and Carcass Merit in Hybrid Cattle. J Anim Sci 2004, 82, 2451–2459. [Google Scholar] [CrossRef]
- Shuey, S.A.; Birkelo, C.P.; Marshall, D.M. The Relationship of the Maintenance Energy Requirement to Heifer Production Efficiency. J Anim Sci 1993, 71, 2253–2259. [Google Scholar] [CrossRef] [PubMed]
- Jenkins, T.G.; Ferrell, C.L. Productivity through Weaning of Nine Breeds of Cattle under Varying Feed Availabilities: I. Initial Evaluation. J Anim Sci 1994, 72, 2787–2797. [Google Scholar] [CrossRef] [PubMed]
- Halachmi, I.; Edan, Y.; Maltz, E.; Peiper, U.M.; Moallem, U.; Brukental, I. A Real-Time Control System for Individual Dairy Cow Food Intake. Comput Electron Agric 1998, 20, 131–144. [Google Scholar] [CrossRef]
- DeVries, T.J.; Von Keyserlingk, M.A.G.; Weary, D.M.; Beauchemin, K.A. Technical Note: Validation of a System for Monitoring Feeding Behavior of Dairy Cows. J Dairy Sci 2003, 86, 3571–3574. [Google Scholar] [CrossRef]
- Bach, A.; Iglesias, C.; Busto, I. Technical Note: A Computerized System for Monitoring Feeding Behavior and Individual Feed Intake of Dairy Cattle. J Dairy Sci 2004, 87, 4207–4209. [Google Scholar] [CrossRef]
- Ferris, C.P.; Keady, T.W.J.; Gordon, F.J.; Kilpatrick, D.J. Comparison of a Calan Gate and a Conventional Feed Barrier System for Dairy Cows: Feed Intake and Cow Behaviour. Irish Journal of Agricultural and Food Research 2006, 45, 149–156. [Google Scholar]
- Wang, Z.; Nkrumah, J.D.; Li, C.; Basarab, J.A.; Goonewardene, L.A.; Okine, E.K.; Crews, D.H.; Moore, S.S. Test Duration for Growth, Feed Intake, and Feed Efficiency in Beef Cattle Using the GrowSafe System. J Anim Sci 2006, 84, 2289–2298. [Google Scholar] [CrossRef]
- Chapinal, N.; Veira, D.M.; Weary, D.M.; Von Keyserlingk, M.A.G. Technical Note: Validation of a System for Monitoring Individual Feeding and Drinking Behavior and Intake in Group-Housed Cattle. J Dairy Sci 2007, 90, 5732–5736. [Google Scholar] [CrossRef]
- Joo, E.M. New Trends in Technologies: Control, Management, Computational Intelligence and Network Systems; BoD–Books on Demand, 2010; ISBN 953307213X.
- Chizzotti, M.L.; Machado, F.S.; Valente, E.E.L.; Pereira, L.G.R.; Campos, M.M.; Tomich, T.R.; Coelho, S.G.; Ribas, M.N. Technical Note: Validation of a System for Monitoring Individual Feeding Behavior and Individual Feed Intake in Dairy Cattle. J Dairy Sci 2015, 98, 3438–3442. [Google Scholar] [CrossRef]
- Lassen, J.; Thomasen, J.R.; Hansen, R.H.; Nielsen, G.G.B.; Olsen, E. V; Stentebjerg, P.R.B.; Hansen, N.W.; Borchersen, S. Individual Measure of Feed Intake on In-House Commercial Dairy Cattle Using 3D Camera System. In Proceedings of the World Congress on Genetics Applied to Livestock Production; 2018.
- Shelley, A.N. Monitoring Dairy Cow Feed Intake Using Machine Vision. 2013.
- Saar, M.; Edan, Y.; Godo, A.; Lepar, J.; Parmet, Y.; Halachmi, I. A Machine Vision System to Predict Individual Cow Feed Intake of Different Feeds in a Cowshed. Animal 2022, 16, 100432. [Google Scholar] [CrossRef]
- Bloch, V.; Levit, H.; Halachmi, I. Assessing the Potential of Photogrammetry to Monitor Feed Intake of Dairy Cows. Journal of Dairy Research 2019, 86, 34–39. [Google Scholar] [CrossRef] [PubMed]
- Spencer Jr, B.F.; Hoskere, V.; Narazaki, Y. Advances in Computer Vision-Based Civil Infrastructure Inspection and Monitoring. Engineering 2019, 5, 199–222. [Google Scholar] [CrossRef]
- Shelley, A.N.; Lau, D.L.; Stone, A.E.; Bewley, J.M. Short Communication: Measuring Feed Volume and Weight by Machine Vision. J Dairy Sci 2016, 99, 386–391. [Google Scholar] [CrossRef] [PubMed]
- Bezen, R.; Edan, Y.; Halachmi, I. Computer Vision System for Measuring Individual Cow Feed Intake Using RGB-D Camera and Deep Learning Algorithms. Comput Electron Agric 2020, 172, 105345. [Google Scholar] [CrossRef]
- Halachmi, I.; Guarino, M. Editorial: Precision Livestock Farming: A ‘per Animal’ Approach Using Advanced Monitoring Technologies. animal 2016, 10, 1482–1483. [Google Scholar] [CrossRef]
- Brito, L.F.; Oliveira, H.R.; McConn, B.R.; Schinckel, A.P.; Arrazola, A.; Marchant-Forde, J.N.; Johnson, J.S. Large-Scale Phenotyping of Livestock Welfare in Commercial Production Systems: A New Frontier in Animal Breeding. Front Genet 2020, 11, 552352. [Google Scholar] [CrossRef] [PubMed]
- Neethirajan, S.; Kemp, B. Digital Phenotyping in Livestock Farming. Animals 2021, Vol. 11, Page 2009 2021, 11, 2009. [Google Scholar] [CrossRef]
- Lassen, J.; Thomasen, J.R.; Borchersen, S. Repeatabilities of Individual Measures of Feed Intake and Body Weight on In-House Commercial Dairy Cattle Using a 3-Dimensional Camera System. J Dairy Sci 2023, 106, 9105–9114. [Google Scholar] [CrossRef]
- Thomasen, J.R.; Lassen, J.; Nielsen, G.G.B.; Borggard, C.; Stentebjerg, P.R.B.; Hansen, R.H.; Hansen, N.W.; Borchersen, S. Individual Cow Identification in a Commercial Herd Using 3D Camera Technology. 2018.
- Viking Genetics Innovators in Cattle Breeding Available online:. Available online: https://www.vikinggenetics.com/about-us/innovative-breeding/innovators (accessed on 25 December 2023).
- Borchersen, S.; Hansen, N.W.; Borggaard, C. System for Determining Feed Consumption of at Least One Animal 2018.
- Borchersen, S.; Borggaard, C.; Hansen, N.W. System and Method for Identification of Individual Animals Based on Images of the Back 2023.
- Lassen, J.; Borchersen, S. Weight Determination of an Animal Based on 3d Imaging 2022.
- Manzanilla-Pech, C.I.V.; Stephansen, R.B.; Lassen, J. Genetic Parameters for Feed Intake and Body Weight in Dairy Cattle Using High-Throughput 3-Dimensional Cameras in Danish Commercial Farms. J Dairy Sci 2023, 106, 9006–9015. [Google Scholar] [CrossRef]
- Takeda, M.; Uemoto, Y.; Inoue, K.; Ogino, A.; Nozaki, T.; Kurogi, K.; Yasumori, T.; Satoh, M. Evaluation of Feed Efficiency Traits for Genetic Improvement in Japanese Black Cattle. J Anim Sci 2018, 96, 797–805. [Google Scholar] [CrossRef]
- Hoque, M.A.; Hosono, M.; Oikawa, T.; Suzuki, K. Genetic Parameters for Measures of Energetic Efficiency of Bulls and Their Relationships with Carcass Traits of Field Progeny in Japanese Black Cattle. J Anim Sci 2009, 87, 99–106. [Google Scholar] [CrossRef] [PubMed]
- Retallick, K. Evaluation of Feedlot Feed Efficiency Relationships as Well as Genetic and Phenotypic Performance, Carcass, and Economic Outcomes [Dissertation (PhD in Animal Sciences)]. Urbana-Champaign: University of Illinois. p. 102.; 2013.
- Elolimy, A.A.; Abdelmegeid, M.K.; McCann, J.C.; Shike, D.W.; Loor, J.J. Residual Feed Intake in Beef Cattle and Its Association with Carcass Traits, Ruminal Solid-Fraction Bacteria, and Epithelium Gene Expression. J Anim Sci Biotechnol 2018, 9. [Google Scholar] [CrossRef] [PubMed]
- Inoue, K.; Kobayashi, M.; Shoji, N.; Kato, K. Genetic Parameters for Fatty Acid Composition and Feed Efficiency Traits in Japanese Black Cattle. Animal 2011, 5, 987–994. [Google Scholar] [CrossRef] [PubMed]
- Thompson, W.R.; Meiske, J.C.; Goodrich, R.D.; Rust, J.R.; Byers, F.M. Influence of Body Composition on Energy Requirements of Beef Cows during Winter. J Anim Sci 1983, 56, 1241–1252. [Google Scholar] [CrossRef] [PubMed]
- Bottje, W.G.; Carstens, G.E. Variation in Metabolism: Biological Efficiency of Energy Production and Utilization That Affects Feed Efficiency. Feed Efficiency in the Beef Industry 2012, 251–273. [Google Scholar] [CrossRef]
- Kolath, W.H.; Kerley, M.S.; Golden, J.W.; Keisler, D.H. The Relationship between Mitochondrial Function and Residual Feed Intake in Angus Steers. J Anim Sci 2006, 84, 861–865. [Google Scholar] [CrossRef]
- Fitzsimons, C.; Kenny, D.A.; McGee, M. Visceral Organ Weights, Digestion and Carcass Characteristics of Beef Bulls Differing in Residual Feed Intake Offered a High Concentrate Diet. Animal 2014, 8, 949–959. [Google Scholar] [CrossRef]
- Lancaster, P.A.; Carstens, G.E.; Michal, J.J.; Brennan, K.M.; Johnson, K.A.; Davis, M.E. Relationships between Residual Feed Intake and Hepatic Mitochondrial Function in Growing Beef Cattle. J Anim Sci 2014, 92, 3134–3141. [Google Scholar] [CrossRef]
- Acetoze, G.; Weber, K.L.; Ramsey, J.J.; Rossow, H.A. Relationship between Liver Mitochondrial Respiration and Proton Leak in Low and High RFI Steers from Two Lineages of RFI Angus Bulls. Int Sch Res Notices 2015, 2015, 1–5. [Google Scholar] [CrossRef]
- Ramos, M.H.; Kerley, M.S. Mitochondrial Complex I Protein Differs among Residual Feed Intake Phenotype in Beef Cattle. J Anim Sci 2013, 91, 3299–3304. [Google Scholar] [CrossRef]
- Kelly, A.K.; Waters, S.M.; McGee, M.; Fonseca, R.G.; Carberry, C.; Kenny, D.A. MRNA Expression of Genes Regulating Oxidative Phosphorylation in the Muscle of Beef Cattle Divergently Ranked on Residual Feed Intake. Physiol Genomics 2011, 43, 12–23. [Google Scholar] [CrossRef] [PubMed]
- Fonseca, L.F.S.; Gimenez, D.F.J.; Mercadante, M.E.Z.; Bonilha, S.F.M.; Ferro, J.A.; Baldi, F.; de Souza, F.R.P.; de Albuquerque, L.G. Expression of Genes Related to Mitochondrial Function in Nellore Cattle Divergently Ranked on Residual Feed Intake. Mol Biol Rep 2015, 42, 559–565. [Google Scholar] [CrossRef] [PubMed]
- Kenny, D.A.; Fitzsimons, C.; Waters, S.M.; McGee, M. Invited Review: Improving Feed Efficiency of Beef Cattle - The Current State of the Art and Future Challenges. Animal 2018, 12, 1815–1826. [Google Scholar] [CrossRef] [PubMed]
- Kelly, A.K.; Lawrence, P.; Earley, B.; Kenny, D.A.; McGee, M. Stress and Immunological Response of Heifers Divergently Ranked for Residual Feed Intake Following an Adrenocorticotropic Hormone Challenge. J Anim Sci Biotechnol 2017, 8, 1–8. [Google Scholar] [CrossRef]
- Kelly, A.K.; Earley, B.; McGee, M.; Fahey, A.G.; Kenny, D.A. Endocrine and Hematological Responses of Beef Heifers Divergently Ranked for Residual Feed Intake Following a Bovine Corticotropin-Releasing Hormone Challenge. J Anim Sci 2016, 94, 1703–1711. [Google Scholar] [CrossRef]
- Munro, J.C.; Schenkel, F.S.; Physick-Sheard, P.W.; Fontoura, A.B.P.; Miller, S.P.; Tennessen, T.; Montanholi, Y.R. Associations of Acute Stress and Overnight Heart Rate with Feed Efficiency in Beef Heifers. Animal 2017, 11, 452–460. [Google Scholar] [CrossRef]
- Thompson, W.R.; Meiske, J.C.; Goodrich, R.D.; Rust, J.R.; Byers, F.M. Influence of Body Composition on Energy Requirements of Beef Cows during Winter. J Anim Sci 1983, 56, 1241–1252. [Google Scholar] [CrossRef]
- Mcdonald, P.; Edwards, R.A.; Greenhalgh, J.F.D.; Morgan, C.A.; Sinclair, L.A.; Wilkinson, R.G.; Greenhalgh, M.E.; Wilkinson, M.S. AnimAl Nutrition Seventh Edition Seventh Edition; 1988.
- Owens, F.N.; Gill, D.R.; Secrist, D.S.; Coleman, S.W. Review of Some Aspects of Growth and Development of Feedlot Cattle. J Anim Sci 1995, 73, 3152–3172. [Google Scholar] [CrossRef]
- Solis, J.C.; Byers, F.M.; Schelling, G.T.; Long, C.R.; Greene, L.W. Maintenance Requirements and Energetic Efficiency of Cows of Different Breed Types. J Anim Sci 1988, 66, 764–773. [Google Scholar] [CrossRef]
- Taylor, C.S.; Thiessen, R.B.; Murray, J. Inter-Breed Relationship of Maintenance Efficiency to Milk Yield in Cattle. Animal Science 1986, 43, 37–61. [Google Scholar] [CrossRef]
- Luiting, P.; Urff, E.M.; Verstegen, M.W.A. Between-Animal Variation in Biological Efficiency as Related to Residual Feed Consumption. Netherlands Journal of Agricultural Science 1994, 42, 59–67. [Google Scholar] [CrossRef]
- Katle, J.; Kolstad, N. Selection for Efficiency of Food Utilisation in Laying Hens: Direct Response in Residual Food Consumption and Correlated Responses in Weight Gain, Egg Production and Body Weight. https://doi.org/10.1080/00071669108417420 2007, 32, 939–953. [CrossRef]
- Herd, R.M.; Arthur, P.F. Physiological Basis for Residual Feed Intake. J Anim Sci 2009, 87. [Google Scholar] [CrossRef] [PubMed]
- Herd, R.M.; Oddy, V.H.; Richardson, E.C. Biological Basis for Variation in Residual Feed Intake in Beef Cattle. 1. Review of Potential Mechanisms. Aust J Exp Agric 2004, 44, 423. [Google Scholar] [CrossRef]
- Richardson Pedometers Measure Differences in Activity in Bulls Selected for High or Low Net Feed Efficiency. Aust. Soc. Anim. Behav 1999, 26, 16–2.
- Susenbeth, A.; Mayer, R.; Koehler, B.; Neumann, O. Energy Requirement for Eating in Cattle 1. J. Anim. Sci 1998, 76, 2701–2705. [Google Scholar] [CrossRef]
- Llonch, P.; Somarriba, M.; Duthie, C.A.; Troy, S.; Roehe, R.; Rooke, J.; Haskell, M.J.; Turner, S.P. Temperament and Dominance Relate to Feeding Behaviour and Activity in Beef Cattle: Implications for Performance and Methane Emissions. Animal 2018, 12, 2639–2648. [Google Scholar] [CrossRef]
- Richardson, E.C.; Arthur, P.; Oddy, H. Possible Physiological Indicators for Net Feed Conversion Efficiency in Beef Cattle. Proc. Aust. Soc. Anim. Prod. 1996, 21. [Google Scholar]
- Herd, R.M.; Oddy, V.H.; Lee, G.J. Effect of Divergent Selection for Weaning Weight on Liveweight and Wool Growth Responses to Feed Intake in Merino Ewes. Aust J Exp Agric 1993, 33, 699–705. [Google Scholar] [CrossRef]
- Smith, N.E.; Baldwin, R.L. Effects of Breed, Pregnancy, and Lactation on Weight of Organs and Tissues in Dairy Cattle. J Dairy Sci 1974, 57, 1055–1060. [Google Scholar] [CrossRef]
- Early, R.J.; McBride, B.W.; Ball, R.O. Growth and Metabolism in Somatotropin-Treated Steers: III. Protein Synthesis and Tissue Energy Expenditures. J Anim Sci 1990, 68, 4153–4166. [Google Scholar] [CrossRef]
- Jenkins, T.G.; Ferrell, C.L.; Cundiff, L. V. Relationship of Components of the Body among Mature Cows as Related to Size, Lactation Potential and Possible Effects on Productivity. Animal Science 1986, 43, 245–254. [Google Scholar] [CrossRef]
- Koong, L.J.; Nienaber, J.A.; Pekas, J.C.; Yen, J.T. Effects of Plane of Nutrition on Organ Size and Fasting Heat Production in Pigs. J Nutr 1982, 112, 1638–1642. [Google Scholar] [CrossRef]
- Burrin, D.G.; Ferrell’, C.L.; Britton’s A N D M A, R.A.; Bauer’, R.C.; Hruska, R.L. Level of Nutrition and Visceral Organ Size and Metabolic Activity in Sheep*. British Journal of Nutrition 1990, 64, 439–448. [Google Scholar] [CrossRef] [PubMed]
- Seebeck, R.M. The Effect of Body-Weight Loss on the Composition of Brahman Cross and Africander Cross Steers: 1. Empty Body Weight, Dressed Carcass Weight and Offal Components. J Agric Sci 1973, 80, 201–210. [Google Scholar] [CrossRef]
- Ledger, H.P.; Sayers, A.R. The Utilization of Dietary Energy by Steers during Periods of Restricted Food Intake and Subsequent Realimentaion: 1. The Effect of Time on the Maintenance Requirements of Steers Held at Constant Live Weights. J Agric Sci 1977, 88, 11–26. [Google Scholar] [CrossRef]
- Meyer, A.M.; Hess, B.W.; Paisley, S.I.; Du, M.; Caton, J.S. Small Intestinal Growth Measures Are Correlated with Feed Efficiency in Market Weight Cattle, despite Minimal Effects of Maternal Nutrition during Early to Midgestation. J Anim Sci 2014, 92, 3855–3867. [Google Scholar] [CrossRef]
- Montanholi, Y.; Fontoura, A.; Swanson, K.; Coomber, B.; Yamashiro, S.; Miller, S. Small Intestine Histomorphometry of Beef Cattle with Divergent Feed Efficiency. Acta Vet Scand 2013, 55, 9. [Google Scholar] [CrossRef] [PubMed]
- Serão, N.V.L.; González-Peña, D.; Beever, J.E.; Faulkner, D.B.; Southey, B.R.; Rodriguez-Zas, S.L. Single Nucleotide Polymorphisms and Haplotypes Associated with Feed Efficiency in Beef Cattle. BMC Genet 2013, 14, 94. [Google Scholar] [CrossRef]
- National Academies of Sciences, E. and M. Nutrient Requirements of Beef Cattle: Eighth Revised Edition. Nutrient Requirements of Beef Cattle, 8th Revised Edition 2016. [CrossRef]
- Oldham, J.D. The Ruminant Nutrition System: An Applied Model for Predicting Nutrient Requirements and Feed Utilization in Ruminants, Eds L. O. TEDESCHI & D. G. FOX. 578 Pp. Ann Arbor, MI: XanEdu (2016). US $104.69 (Hardback). ISBN 978-1-58390-236-3. J Agric Sci 2017, 155, 1188–1189. [Google Scholar] [CrossRef]
- BR-Corte Nutrient Requirements of Zebu and Crossbred Cattle Third Edition Editors; De Campos, S., Filho, V., Fernando Costa, L., Mateus, S., Gionbelli, P., Pizzi, P., Marcos, R., Marcondes, I., Luiz, M., Laura, C., Prados, F., Eds.; 2016.
- CSIRO Nutrient Requirements of Domesticated Ruminants; CSIRO, Ed.; CSIRO Publishing: Melbourne, 2007; ISBN 9780643092624.
- INRA INRA Feeding System for Ruminants; Pierre Nozière, Daniel Sauvant, Institut national de la recherche agronomique (France), Luc Delaby, Eds.; 2nd ed.; 2018.
- NRC Nutrient Requirements of Dairy Cattle: Seventh Revised Edition, 2001. Nutrient Requirements of Dairy Cattle 2001. [CrossRef]
- NRC Nutrient Requirements of Beef Cattle: Seventh Revised Edition: Update 2000. Nutrient Requirements of Beef Cattle 2000. [CrossRef]
- Smith, J.A.B. The Nutrient Requirements of Farm Livestock. No. 2, Ruminants : Summaries of Estimated Requirements.; Agricultural Research Council,: London :, 1965.
- MAFF MAFF Technical Bulletin 33: Energy Allowances and Feeding Systems for Ruminants. 1975, 80.
- UK.AFRC AFRC Technical Committee on Responses to Nutrients, Report Number 5, Nutritive Requirements of Ruminant Animals: Energy. In Proceedings of the Nutrition Abstracts and Reviews. Series B. Livestock Feeds and Feeding; 1990; Vol. 60.
- Alderman, G.; Cottrill, B.R. Energy and Protein Requirements of Ruminants.; Acribia, SA, 1996; ISBN 8420008028.
- Agnew, R.E.; Yan, T. Calorimetry. In Quantitative aspects of ruminant digestion and metabolism; 2005; pp. 421–442.
- Graham, N.M. Energy Metabolism of Farm Animals : Proceedings of the 9th Symposium Held at Lillehammer, Norway, September 1982 / Edited by A. Ekern and F. Sundstol; Ekern, A., Sundstol, F. (Frik), Production, E.A. for A., Symposium on Energy Metabolism 1982 : Lillehammer, N., Eds.; Publication (European Association for Animal Production) ; 29.; Dept. of Animal Nutrition, Agricultural University of Norway: Aas-NLH, Norway, 1982; ISBN 8257590061.
- Blaxter, K.L.; Wainman, F.W. The Utilization of Food by Sheep and Cattle. J Agric Sci 1961, 57, 419–425. [Google Scholar] [CrossRef]
- McLean, J.A.; Tobin, G. Animal and Human Calorimetry. 1987, 338.
- Thomas, C. Feed into Milk : A New Applied Feeding System for Dairy Cows : An Advisory Manual.; 2004.
- Lofgreen, G.P.; Garrett, W.N. A System for Expressing Net Energy Requirements and Feed Values for Growing and Finishing Beef Cattle. J Anim Sci 1968, 27, 793–806. [Google Scholar] [CrossRef]
- NASEM Nutrient Requirements of Beef Cattle: Eighth Revised Edition; The National Academies Press: Washington, DC, 2016; ISBN 978-0-309-27335-0.
- Ferrell, C.L.; Jenkins, T.G. Cow Type and the Nutritional Environment: Nutritional Aspects. J Anim Sci 1985, 61, 725–741. [Google Scholar] [CrossRef] [PubMed]
- Dawson, L.E.R.; Steen, R.W.J. Estimation of Maintenance Energy Requirements of Beef Cattle and Sheep. J Agric Sci 1998, 131, 477–485. [Google Scholar] [CrossRef]
- Marcondes, M.; Chizzotti, M.; Gionbelli, M.P. Energy Requirements of Zebu Beef Cattle; 2010.
- Gordon, F.J.; Dawson, L.E.R.; Ferris, C.P.; Steen, R.W.J.; Kilpatrick, D.J. The Influence of Wilting and Forage Additive Type on the Energy Utilisation of Grass Silage by Growing Cattle. Anim Feed Sci Technol 1999, 79, 15–27. [Google Scholar] [CrossRef]
- Jiao, H.P.; Yan, T.; McDowell, D.A.; Carson, A.F.; Ferris, C.P.; Easson, D.L.; Wills, D. Enteric Methane Emissions and Efficiency of Use of Energy in Holstein Heifers and Steers at Age of Six Months. J Anim Sci 2013, 91, 356–362. [Google Scholar] [CrossRef]
- Castro, M.M.D.; Albino, R.L.; Rodrigues, J.P.P.; Sguizzato, A.L.L.; Santos, M.M.F.; Rotta, P.P.; Caton, J.S.; Moraes, L.E.F.D.; Silva, F.F.; Marcondes, M.I. Energy and Protein Requirements of Holstein × Gyr Crossbred Heifers. Animal 2020, 14, 1857–1866. [Google Scholar] [CrossRef]
- Ferreira, A.L.; Borges, A.L.C.C.; Mourão, R.C.; Silva, R.R.; Duque, A.C.A.; Silva, J.S.; Souza, A.S.; Gonçalves, L.C.; Carvalho, P.H.A.; Ferreira, A.L.; et al. Energy Partition, Nutritional Energy Requirements and Methane Production in F1 Holstein × Gyr Bulls, Using the Respirometric Technique. Anim Prod Sci 2018, 59, 1253–1260. [Google Scholar] [CrossRef]
- Silva, A.L.; Marcondes, M.I.; Detmann, E.; Campos, M.M.; Machado, F.S.; Filho, S.C.V.; Castro, M.M.D.; Dijkstra, J. Determination of Energy and Protein Requirements for Crossbred Holstein × Gyr Preweaned Dairy Calves. J Dairy Sci 2017, 100, 1170–1178. [Google Scholar] [CrossRef]
- Oss, D.B.; Machado, F.S.; Tomich, T.R.; Pereira, L.G.R.; Campos, M.M.; Castro, M.M.D.; da Silva, T.E.; Marcondes, M.I. Energy and Protein Requirements of Crossbred (Holstein × Gyr) Growing Bulls. J Dairy Sci 2017, 100, 2603–2613. [Google Scholar] [CrossRef]
- Posada-Ochoa, S.L.; Noguera, R.R.; Rodríguez, N.M.; Costa, A.L.; Reis, R. Indirect Calorimetry to Estimate Energy Requirements for Growing and Finishing Nellore Bulls. J Integr Agric 2017, 16, 151–161. [Google Scholar] [CrossRef]
- Salah, N.; Sauvant, D.; Archimède, H. Nutritional Requirements of Sheep, Goats and Cattle in Warm Climates: A Meta-Analysis. Animal 2014, 8, 1439–1447. [Google Scholar] [CrossRef] [PubMed]
- Marcondes, M.I.; Tedeschi, L.O.; Valadares Filho, S.C.; Gionbelli, M.P. Predicting Efficiency of Use of Metabolizable Energy to Net Energy for Gain and Maintenance of Nellore Cattle. J Anim Sci 2013, 91, 4887–4898. [Google Scholar] [CrossRef] [PubMed]
- Rotta, P.P.; Filho, S.C.V.; Detmann, E.; Costa, L.F.; Villadiego, F.A.C.; Burgos, E.M.G.; Silva, F.A.S. Nutrient Requirements of Energy and Protein for Holstein × Zebu Bulls FInished in Feedlot. Semin Cienc Agrar 2013, 34, 2523–2534. [Google Scholar] [CrossRef]
- Sainz, R.; Magnabosco, C.U.; Da, R.; Gomes, C. Performance, Efficiency and Estimated Maintenance Energy Requirements of Bos Taurus and Bos Indicus Cattle. In Energy and Protein Metabolism and Nutrition in Sustainable Animal Production; EAAP Publication No. 134; Oltjen, J.W., Kebreab, E., Lapierre, H., Eds.; Wageningen Academic Publishers 2013. [CrossRef]
- Valente, E.E.L.; Paulino, M.F.; Detmann, E.; Valadares Filho, S. de C.; Cardenas, J.E.G.; Dias, I.F.T. Requirement of Energy and Protein of Beef Cattle on Tropical Pasture. Acta Sci 2013, 35, 417–424. [Google Scholar] [CrossRef]
- Gomes, R.C.; Sainz, R.D.; Silva, S.L.; César, M.C.; Bonin, M.N.; Leme, P.R. Feedlot Performance, Feed Efficiency Reranking, Carcass Traits, Body Composition, Energy Requirements, Meat Quality and Calpain System Activity in Nellore Steers with Low and High Residual Feed Intake. Livest Sci 2012, 150, 265–273. [Google Scholar] [CrossRef]
- Porto, M.O.; Paulino, M.F.; de Campos Valadares Filho, S.; Detmann, E.; Cavali, J.; Sales, M.F.L.; Valente, É.E.L.; Couto, V.R.M. Nutritional Requirements of Energy, Protein and Macrominerals for Maintenance and Weight Gain of Young Crossbred Nellore × Holstein Bulls on Pasture. Revista Brasileira de Zootecnia 2012, 41, 734–745. [Google Scholar] [CrossRef]
- Cottrill, B.; Dawson, L.; Yan, T.; Xue, B. A Review of the Energy, Protein and Phosphorus Requirments of Beef Cattle and Sheep. Defra Project WQ 2009, 133. [Google Scholar]
- Lawrence, P.; Kenny, D.A.; Earley, B.; McGee, M. Grazed Grass Herbage Intake and Performance of Beef Heifers with Predetermined Phenotypic Residual Feed Intake Classification. Animal 2012, 6, 1648–1661. [Google Scholar] [CrossRef]
- Gomes, R.C.; Sainz, R.D.; Silva, S.L.; César, M.C.; Bonin, M.N.; Leme, P.R. Feedlot Performance, Feed Efficiency Reranking, Carcass Traits, Body Composition, Energy Requirements, Meat Quality and Calpain System Activity in Nellore Steers with Low and High Residual Feed Intake. Livest Sci 2012, 150, 265–273. [Google Scholar] [CrossRef]
- Goulart, R.S.; Tedeschi, L.O.; Silva, S.L.; Leme, P.R.; De Alencar, M.M.; Lanna, D.P.D. The Energy Requirement for Maintenance of Nellore Crossbreds in Tropical Conditions during the Finishing Period. J Anim Sci 2022, 100. [Google Scholar] [CrossRef]
- Galyean, M.L.; Cole, N.A.; Tedeschi, L.O.; Branine, M.E. BOARD-INVITED REVIEW: Efficiency of Converting Digestible Energy to Metabolizable Energy and Reevaluation of the California Net Energy System Maintenance Requirements and Equations for Predicting Dietary Net Energy Values for Beef Cattle. J Anim Sci 2016, 94, 1329–1341. [Google Scholar] [CrossRef] [PubMed]
- Seo, S.; Kang, K.; Jeon, S.; Lee, M.; Jeong, S. Development of a Model to Predict Dietary Metabolizable Energy from Digestible Energy in Beef Cattle. J Anim Sci 2021, 99, 1–9. [Google Scholar] [CrossRef]
- Tedeschi, L.O.; Boin, C.; Fox, D.G.; Leme, P.R.; Alleoni, G.F.; Lanna, D.P.D. Energy Requirement for Maintenance and Growth of Nellore Bulls and Steers Fed High-Forage Diets. J Anim Sci 2002, 80, 1671–1682. [Google Scholar] [CrossRef] [PubMed]
- Fox, D.G.; Black, J.R. A System for Predicting Body Composition and Performance of Growing Cattle. J Anim Sci 1984, 58, 725–739. [Google Scholar] [CrossRef]
- Chizzotti, M.L.; Tedeschi, L.O.; Valadares Filho, S.C. A Meta-Analysis of Energy and Protein Requirements for Maintenance and Growth of Nellore Cattle. J Anim Sci 2008, 86, 1588–1597. [Google Scholar] [CrossRef]
- Tedeschi, L.; Fox, D. The Ruminant Nutrition System: An Applied Model for Predicting Nutrient Requirements and Feed Utilization in Ruminants. cir.nii.ac.jp 2020.
- Frisch, J.E.; Vercoe, J.E. Food Intake, Eating Rate, Weight Gains, Metabolic Rate and Efficiency of Feed Utilization in Bos Taurus and Bos Indicus Crossbred Cattle. Animal Science 1977, 25, 343–358. [Google Scholar] [CrossRef]
- Ferrell, C.L.; Jenkins, T.G. Body Composition and Energy Utilization by Steers of Diverse Genotypes Fed a High-Concentrate Diet during the Finishing Period: II. Angus, Boran, Brahman, Hereford, and Tuli Sires. J Anim Sci 1998, 76, 647–657. [Google Scholar] [CrossRef]
- Moraes, L.E.; Kebreab, E.; Strathe, A.B.; Dijkstra, J.; France, J.; Casper, D.P.; Fadel, J.G. Multivariate and Univariate Analysis of Energy Balance Data from Lactating Dairy Cows. J Dairy Sci 2015, 98, 4012–4029. [Google Scholar] [CrossRef] [PubMed]
- Chizzotti, M.L.; Valadares Filho, S.C.; Tedeschi, L.O.; Chizzotti, F.H.M.; Carstens, G.E. Energy and Protein Requirements for Growth and Maintenance of F1 Nellore x Red Angus Bulls, Steers, and Heifers. J Anim Sci 2007, 85, 1971–1981. [Google Scholar] [CrossRef]
- Old, C.A.; Garrett, W.N. Effects of Energy Intake on Energetic Efficiency and Body Composition of Beef Steers Differing in Size at Maturity. J Anim Sci 1987, 65, 1371–1380. [Google Scholar] [CrossRef]
- Lofgreen, G.P.; Kiesling, H.E. Effects of Receiving and Growing Diets on Compensatory Gains of Stressed Calves. J Anim Sci 1985, 61, 320–328. [Google Scholar] [CrossRef] [PubMed]
Figure 1.
Example of equipment used to monitor and record feed intake in cattle. (A) The feeding lane equipped with multiple electronic scales for individual feed intake monitoring – adapted from Biocontrol (https://biocontrol.no/products-2/controlling-and-recording-feed-intake/). (B) Close-up of a feed intake system with individual animal identification – adapted from Biocontrol (https://biocontrol.no/products-2/controlling-and-recording-feed-intake/). (C) Visual monitoring of feeding behavior using color-coded overlays on each animal to track feeding status and health parameters in real-time – adapted from Pipeless (https://www.pipeless.ai/industries/cattle-raising)). (D) Diagram of a feed intake system integrated with cameras and sensors for automated data collection and analysis – adapted from Saar et al. [83].
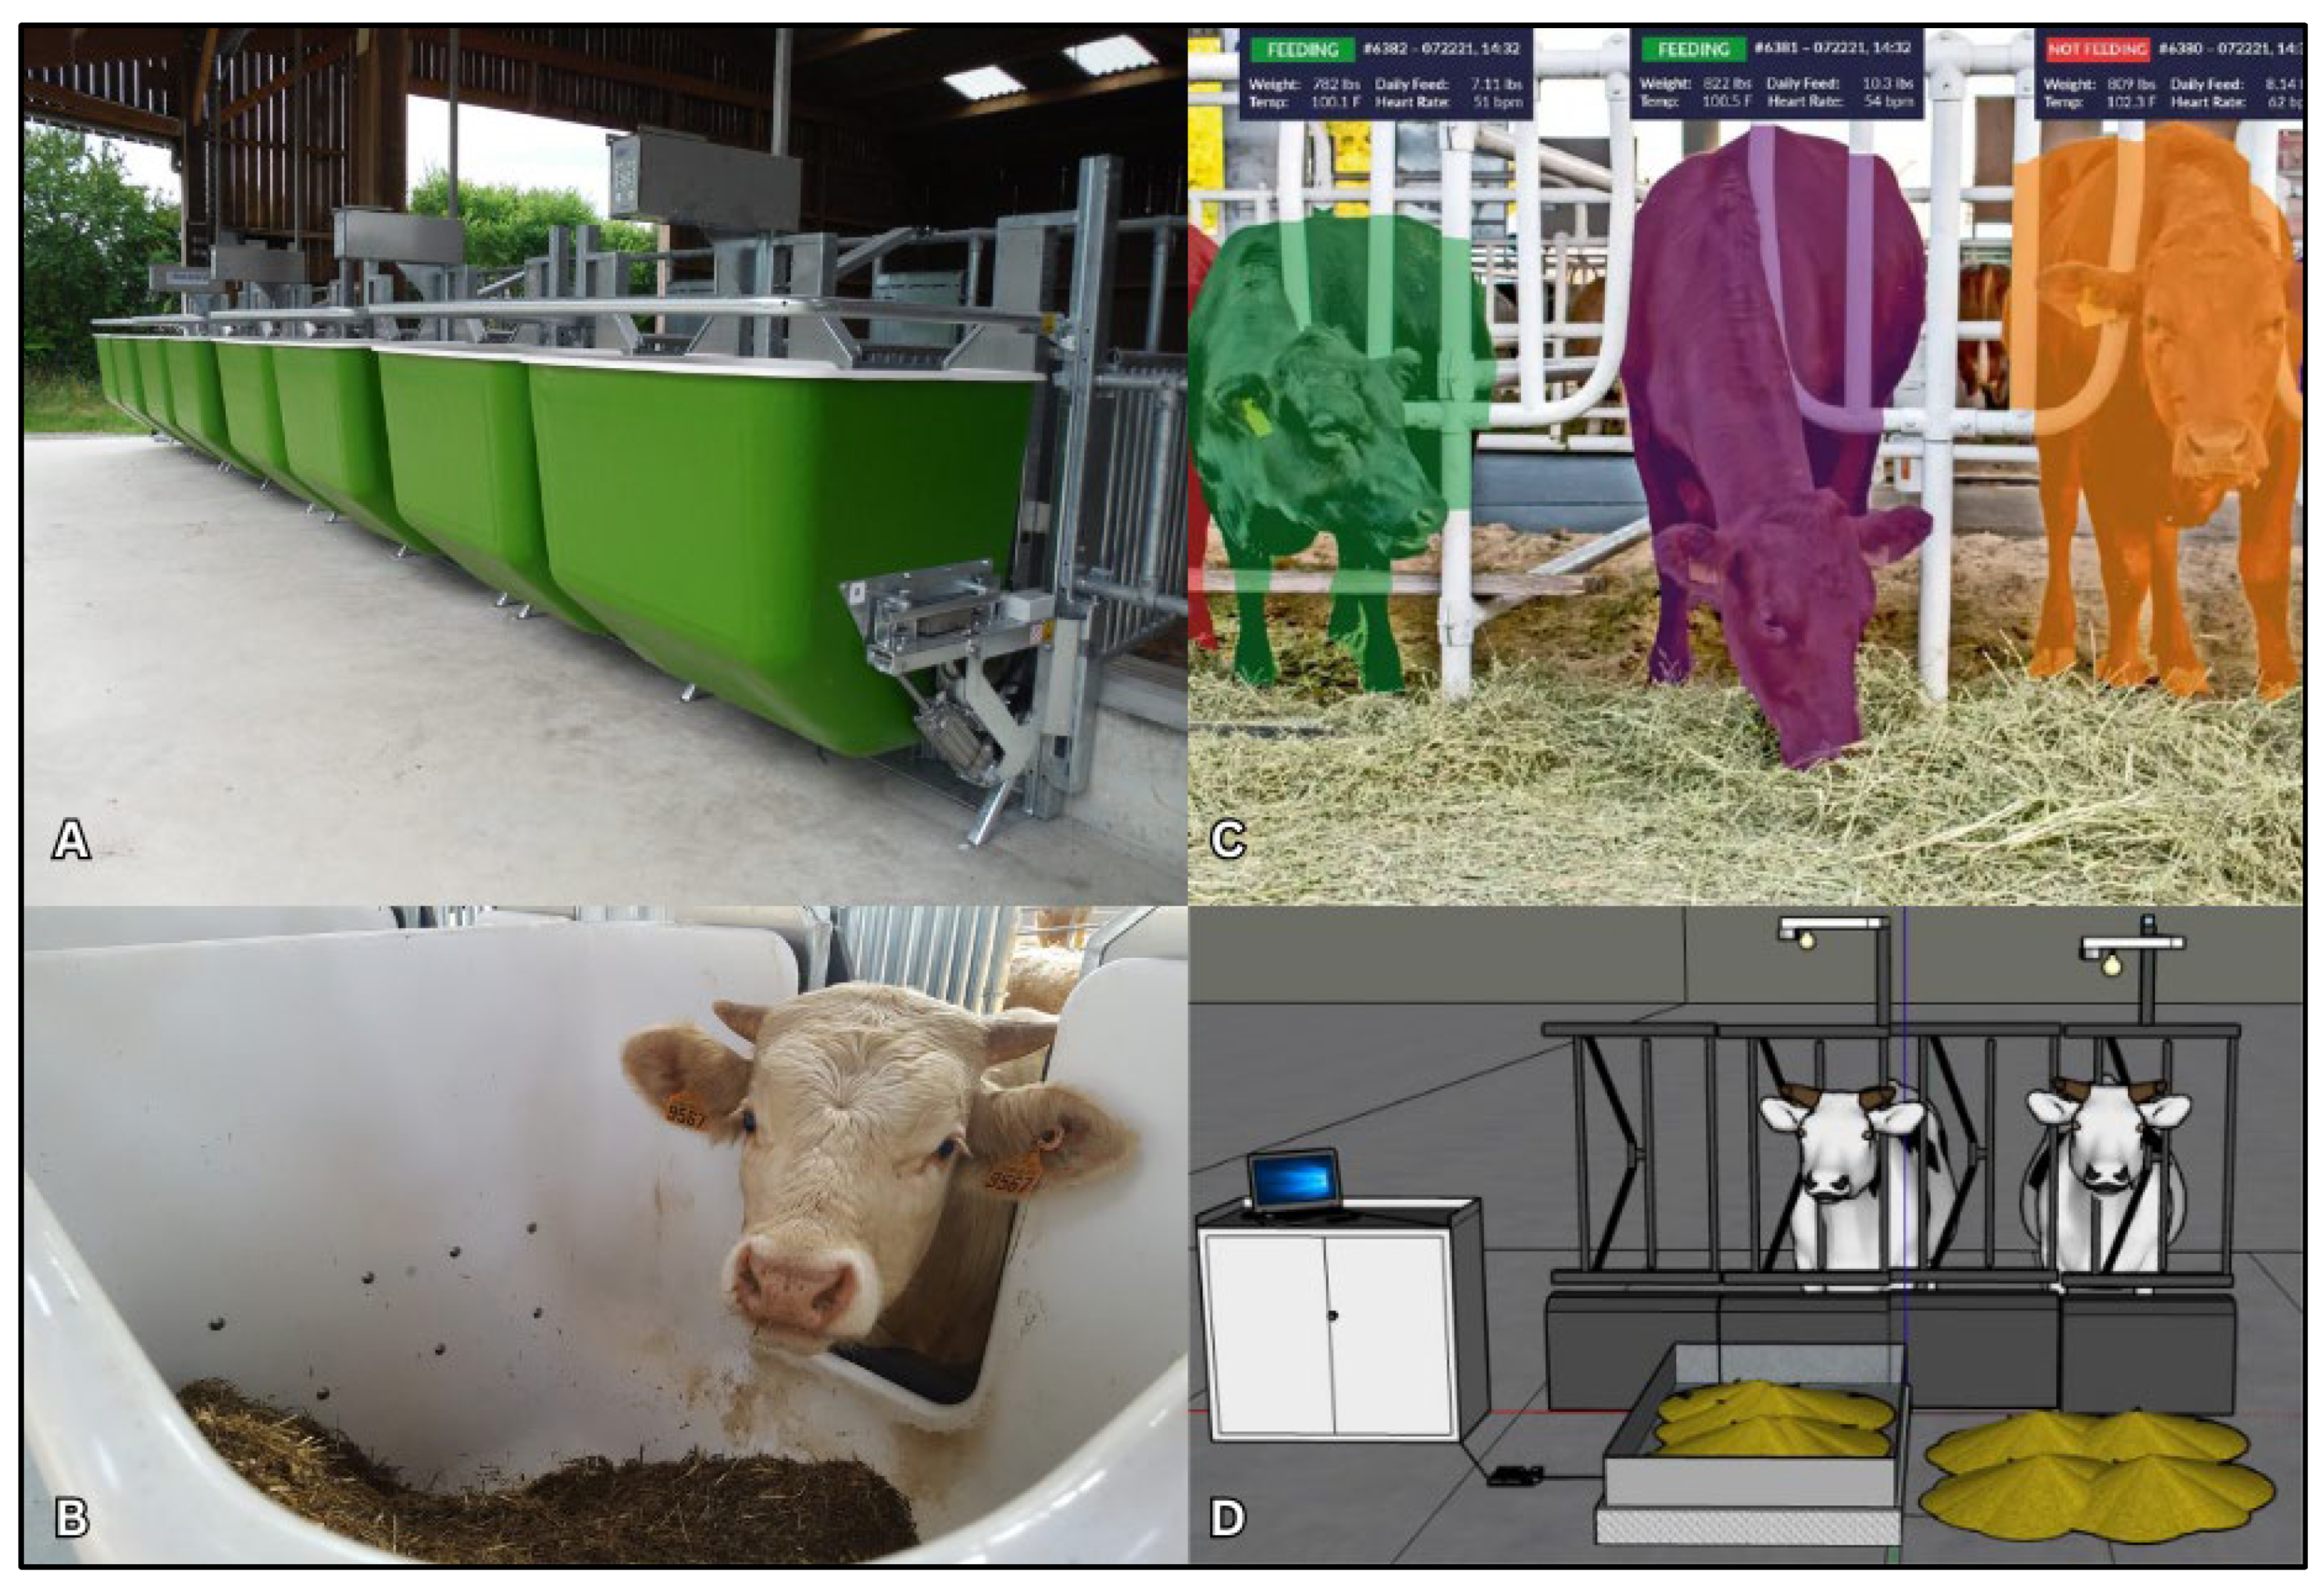

Table 1.
Heritability estimates (SE in parentheses) for average daily gain (ADG), body weight (BW), feed intake (FI), residual feed intake (RFI), and feed conversion rate (FCR) for a range of studies in growing animals across different breeds and countries1.
Table 1.
Heritability estimates (SE in parentheses) for average daily gain (ADG), body weight (BW), feed intake (FI), residual feed intake (RFI), and feed conversion rate (FCR) for a range of studies in growing animals across different breeds and countries1.
| ADG | BW | FI | RFI | FCR | Breeds2 | Country | Animals3 | Reference |
|---|---|---|---|---|---|---|---|---|
| 0.65 (0.13) | - | 0.64 (0.12) | 0.28 (0.11) | - | AN, HE, SH | United States | 1,324 | [34] |
| 0.36 (0.11) | - | - | - | 0.14 (0.07) | AN | United States | 393 | [66] |
| 0.33(0.11) | - | - | - | 0.13 (0.08) | HE | United States | 340 | [66] |
| - | - | - | - | 0.33 (0.10) | HE | United Kingdom | 452 | [44] |
| 0.48 (0.21) | 0.39 (0.19) | 0.37 (0.19) | - | 0.19 (0.16) | Bonsmara | South Africa | 298 | [70] |
| 0.48 (0.21) | - | 0.06 (0.12) | - | 0.46 (0.20) | FRXHE | United Kingdom | 327 | [71] |
| 0.43 (0.24) | 0.45 (0.22) | 0.27 (0.15) | 0.23 (0.12) | 0.35 (0.22) | AN | Canada | 263 | [73] |
| 0.16 (0.15) | 0.43 (0.22) | 0.18 (0.10) | 0.07 (0.13) | 0.08 (0.09) | HE | Canada | 271 | [73] |
| 0.55 (na) | 0.51 (na) | 0.58 (na) | - | 0.16 (na) | BB | France | 1,442 | [74] |
| 0.25 (na) | - | 0.24 (na) | - | 0.14 (na) | HE | United States | 486 | [75] |
| 0.35 (0.11) | - | 0.62 (0.12) | 0.62 (0.14) | 0.42 (0.13) | AN, HE, Polled HE, SH | Australia | 760 | [76] |
| 0.41 (0.08) | 0.68 (0.08) | 0.59 (0.07) | 0.44 (0.07) | 0.31 (0.09) | AN, HE, SH | Australia | 966 | [76] |
| 0.38 (0.10) | 0.42 (0.10) | 0.31 (0.08) | 0.16 (0.08) | 0.17 (0.09) | HE | United Kingdom | 540 | [62] |
| 0.28 (0.04) | 0.40 (0.02) | 0.39 (0.03) | 0.39 (0.03) | 0.29 (0.04) | AN | Australia | 1180 | [5] |
| 0.34 (0.04) | 0.37 (0.04) | 0.48 (0.04) | 0.39 (0.04) | 0.46 (0.04) | CH | France | 792 | [57] |
| 0.41 (0.06) | 0.46 (0.05) | 0.48 (0.06) | 0.43 (0.04) | 0.31 (0.06) | CH | France | 397 | [57] |
| - | - | - | 0.30 (0.06) | - | CH-sired steers | Canada | 281 | [77] |
| - | - | - | 0.26 (0.07) | - | CH-sired steers | Canada | 274 | [77] |
| 0.23 (0.06) | 0.41 (0.07) | 0.27 (0.06) | 0.18 (0.06) | 0.06 (0.04) | Tropically adapted, temperate | Australia | 1,481 | [63] |
| 0.35 (0.03) | 0.35 (0.02) | 0.44 (0.06) | 0.38 (0.07) | 0.37 (0.06) | CH, LI, AN, SI, HE, BA | Canada | 2,284 | [78] |
| 0.37 (na) | - | - | 0.31 (na) | 0.34 (na) | Bonsmara | South Africa | 6,738 | [79] |
| 0.20 (0.10) | 0.47 (0.10) | 0.34 (0.11) | 0.24 (0.11) | 0.15 (0.04) | Japanese Black (Wagyu) | Japan | 740 | [80] |
| 0.59 (0.17) | 0.32 (0.14) | 0.54 (0.15) | 0.21 (0.12) | 0.41 (0.15) | AN, CH, composite | Canada | 464 | [81] |
| 0.26 (na) | 0.39 (na) | 0.33 (na) | 0.29 (na) | 0.14 (na) | Wagyu | Japan | 1,304 | [82] |
| - | - | 0.36 (0.09) | 0.49 (0.09) | 0.38 (0.07) | Wagyu | Japan | 514 | [83] |
| 0.34 (0.12) | 0.47 (0.16) | 0.49 (0.15) | 0.24 (0.11) | - | Brahman | Australia | 1,007 | [84] |
| 0.20 (0.10) | 0.39 (0.13) | 0.51 (0.14) | 0.38 (0.12) | - | Tropical Composite | Australia | 1,209 | [84] |
| 0.21 (0.12) | 0.35 (0.15) | 0.48 (0.14) | 0.47 (0.13) | 0.29 (0.12) | Brangus | United States | 468 | [85] |
| - | - | - | 0.18 (0.14) | - | AN, CH, composite | Canada | 387 | [86] |
| 0.09 (na) | 0.14 (na) | 0.14 (na) | - | AN | United States | 698 | [87] | |
| - | 0.57 (0.10) | 0.30 (0.08) | 0.26 (0.10) | 0.30 (0.12) | BA | France | 678 | [88] |
| - | 0.30 (0.08) | 0.48 (0.14) | 0.45 (0.18) | 0.23 (0.15) | LI | France | 708 | [88] |
| 0.30 (0.06) | 0.69 (0.07) | 0.49 (0.07) | 0.45 (0.07) | 0.30 (0.06) | AN, CH, HE, SI, LI | Ireland | 2,605 | [28] |
| - | - | 0.21 (0.07) | 0.14 (0.06) | 0.18 (0.07) | AN, BR, BA | United States | 1,129 | [89] |
| 0.06(0.08) | - | 0.30 (0.15) | 0.19 (0.12) | 0.07 (0.09) | ANX, CHX | Canada | 402 | [90] |
| 0.17 (0.28) | - | 0.43 (0.14) | 0.36 (0.13) | 0.26 (0.12) | ANX, CHX | Canada | 419 | [90] |
| - | - | 0.70 (0.11) | 0.22 (0.07) | 0.11 (0.05) | Wagyu | Japan | 863 | [91] |
| 0.26 (0.04) | 0.33 (0.03) | 0.36 (0.05) | - | - | AN | United States | 4,215 to 18,169 | [92] |
| 0.28 (0.11) | - | 0.41 (0.12) | 0.29 (0.12) | - | AN, CH, composite | Canada | 721 | [25] |
| 0.26 (0.10) | 0.35 (0.12) | 0.40 (0.02) | 0.52 (0.14) | 0.27 (0.10) | Multibreed | United States | 1,141 | [93] |
| 0.30 (0.06) | 0.69 (0.07) | - | - | 0.30 (0.06) | AN, CH, HE, LI, SI | Ireland | 3,531 | [95] |
| 0.38 (0.18) | - | - | 0.27 (0.12) | - | - | France | 2,023 | [96] |
| 0.38 (0.12) | - | - | 0.47 (0.12) | 0.21 (0.08) | AN, CH | Canada | 968 | [97] |
| - | - | - | 0.40 (0.10) | - | AN, ANXSI, SI | United States | 1,321 | [98] |
| 0.35 (0.15) | - | - | 0.38 (0.16) | 0.31 (11) | NE | Brazil | 1.038 | [50] |
| 0.20 (0.03) | - | - | - | - | AN, HE, MARC III, SI, LI, CH, RA | United States | 6,331 | [99] |
| 0.33 (0.07) | - | 0.55 (0.08) | 0.40 (0.07) | 0.20 (0.06) | AN | Australia | 6,371 | [47] |
| 0.53 (0.12) | - | - | 0.25 (0.11) | - | AN, HE, MARC III, SI, LI, CH, RA | United States | 687 | [64] |
1na = not available. 2AN = Angus; BA = Brangus; BB = Belgian Blue; BR = Brahman; CH = Charolais; CHX=Charolais crossbred; FRXHE = Friesian-Hereford crossbreds; HE = Hereford; LI = Limousin; SH = Shorthorn; SI = Simmental, RA = Red Angus, GE = Gelbvieh, NE = Nellore; MARC III = Composite breed (¼ Angus, ¼ Hereford, ¼ Pinzgauer, ¼ Red Poll). 3Number of animals.
Table 2.
Heritability estimates (SE in parentheses) for body weight (BW), feed intake (FI), residual feed intake (RFI), and feed conversion ratio (FCR) for a range of studies in mature animals across different breeds and countries1.
Table 2.
Heritability estimates (SE in parentheses) for body weight (BW), feed intake (FI), residual feed intake (RFI), and feed conversion ratio (FCR) for a range of studies in mature animals across different breeds and countries1.
| BW | FI | RFI | FCR | Breeds2 | Country | Animals | Reference |
|---|---|---|---|---|---|---|---|
| 0.65 (0.01) | - | 0.04 (0.05) | - | Norwegian | Norway | 353 | [41] |
| 0.29 (0.09) | 0.02 (0.02) | 0.23 (0.11) | 0.18 (0.15) | HE | Canada | 295 | [64] |
| 0.40 (0.04) | 0.11 (0.02) | 0.03 (0.01) | 0.11 (0.06) | HE, multibreed | Canada | 1,174 | [64] |
| 0.20 (0.12) | 0.03 (0.01) | 0.03 (0.02) | 0.11 (0.10) | HE | Canada | 206 | [65] |
| 0.44 (0.17) | 0.16 (0.02) | 0.22 (0.04) | 0.05 (0.01) | HE, multibreed | Canada | 729 | [65] |
| 0.71 (na1) | 0.28 (na) | 0.23 (na) | 0.26 (na) | AN, HE, Polled HE, SH | Australia | 751 | [55] |
| - | - | 0.16 (0.10) | - | AN, HE, MARC III, SI, LI, CH, RA | United States | 622 | [62] |
1na = not available. 2AN = Angus; HE = Hereford; SH = Shorthorn, SI = Simmental; LI = Limousin; CH = Charolais; RA = Red Angus; MARC III = Composite breed (¼ Angus, ¼ Hereford, ¼ Pinzgauer, ¼ Red Poll).
Table 3.
General Descriptors of International Nutritional Models on the determination of energy requirements for beef cattle.
Table 3.
General Descriptors of International Nutritional Models on the determination of energy requirements for beef cattle.
| Country | Organization | Date | Breed | Maintenance Requirement/ Units | Observations |
|---|---|---|---|---|---|
| UK | Agriculture and Food Research Council, AFRC, formerly Agriculture Research Council (ARC) | 1993 | Continental and British breeds | Calorimetry/ ME |
Continues to offer a crucial theoretical foundation for the majority of energy systems worldwide. Forage-based diets. |
| Australia | Australia Commonwealth Scientific and Industrial Research Organization (CSIRO) | 2007 | Bos taurus, Bos indicus, and crossbreds. | Calorimetry/ ME |
The CSIRO guidelines align with the AFRC approach, utilizing MEm to measure maintenance requirements. The feed tables also incorporate low-quality forages. |
| France | Institut National de la Recherche Agronomique (INRA) | 2018 | Beef and dairy origin genotypes | Calorimetry/ NE |
NE is quantified using the barley feed unit (FU), where 1 FU corresponds to 1760 kcal for 1 kg of fresh standard barley. |
| USA and Canada | National Academies of Sciences, Engineering, and Medicine (NASEM). Update on National Research Council (NRC) guidelines | 2016 | Bos taurus, Bos indicus, and crossbreds | Comparative slaughter/ NE |
North American diets for feeding beef cattle are known for their high concentrate levels, distinguishing them from diets in other countries. The NASEM (2016) guidelines offer solutions from empirical to mechanistic approaches. |
| USA and Canada | Ruminant Nutrition System (RNS) Project | 2018 | Bos taurus, Bos indicus, and crossbreds | Comparative slaughter/ NE |
The RNS (Ruminant Nutrition System) is an advancement of the Cornell Net Carbohydrate and Protein System, which was introduced in the 2000s. The RNS incorporates three levels of solutions (L0, L1, and L2), ranging from empirical to more mechanistic approaches. |
| Brazil | Universidade Federal de Viçosa (UFV) (BR-Corte) | 2016 | Zebu cattle and crossbreds | Comparative slaughter/ NE |
The predominant breed of Zebu cattle is Nellore, and energy equations have been developed for feedlot and pasture conditions. Calorimetry has been recently introduced as a method to estimate energy requirements. |
For comparison purposes, energy systems can be grouped into two main categories. 1. metabolizable energy (ME) systems, which includes AFRC and CSIRO, and .2 net energy (NE) systems, which include French (INRA), North America (NRC, NASEM, and RNS) and Brazilian (BR-Corte) systems. In UK and Australian systems, units for energy equations are in Mega Joules (MJ), whereas in North America and Brazil, calories are preferred. Feed units in the French system are usually converted to calories equivalent. One calorie = 4.184 MJ.
Table 4.
Equations used to calculate maintenance requirements (NEm, MJ/d) in growing animals *.
| Systems | Equations |
|---|---|
| AFRC (1993) | |
| CSIRO (2007) | |
| INRA (2018) | |
| NASEM (2016) | |
| BR-Corte (2016) |
* For comparison purposes, energy coefficients are expressed in MJ (1 Mcal = 4.184 MJ); MEm= NEm/km. In AFRC, C = 1.0 for females and castrates, 1.15 for males. The factor 1.08 converts LW to fasted body weight; Activity allowance: 0.0071LW; LW= live weight. In CSIRO. A generalized equation without excluding energy expenditure at pasture and additional energy expenditure for low temperatures. C = as in the AFRC equation; K = 1.2 for Bos taurus indicus, 1.4 for Bos taurus taurus; M = is the fraction of the DE intake provided by milk. For convenience, where the proportion of milk in the diet is not known, M can be estimated from the following equation: where B = 0.010 is a coefficient for suckled calves and a is week of life; A = age in years; MEp = the amount of dietary ME being used directly for production. In the INRA equation for growing and finishing beef, NEm(MJ/kg0.75) = 0.289 LW0.75 and 0.423 LW0.75 for pre-ruminant and ruminant animals, respectively; the NEm increased from 88 kcal NE/kg0.75 to 101 kcal NE/kg0.75in the updated version. The latest value was theoretically determined from feeding trials by regression techniques. In NASEM, Tp = ambient temperature; SBW= shrunk body weight; equation can be further adjusted by multiplying it for breed factor ranging from 0.9 (e.g., Brahman) to 1.2 (e.g., Holstein). In BR-Corte, the equation is valid for feedlot and pasture conditions; EBW= empty body weight.
Table 5.
Metabolizable and NE requirements for maintenance for growing beef cattle from recent studies published around the world.
Table 5.
Metabolizable and NE requirements for maintenance for growing beef cattle from recent studies published around the world.
| Ref. | Country | Technique | N | Type | Breed | LW(Kg) | MEm (MJ/KG LW0.75) | NEm (MJ/KG LW0.75) |
|---|---|---|---|---|---|---|---|---|
| AFBI Studies (1990 - 2020) | ||||||||
| [162] | UK | Calorimetry | 20 | Steers, heifers | Holstein | 176 | 0.781 | 0.570 |
| [161] | UK | Calorimetry | 12 | Steers | Angus x Friesian | 416 | 0.620 | - |
| [159] | UK | Calorimetry | 75 | Steers | Beef Cross | 450-628 | 0.614 | - |
| International Studies (2009 - 2020) | ||||||||
| [163] | Brazil | Comp. Slaughter | 22 | Heifers | Holstein X Gyr | 98-172 | 0.545 | 0.352 |
| [164] | Brazil | Calorimetry | 15 | Bulls | Holstein X Gyr | 302 | 0.523 | 0.312 |
| [165] | Brazil | Comp. Slaughter | 39 | Bulls | Holstein X Gyr | 43-93 | - | 0.298 |
| [166] | Brazil | Comp. slaughter | 24 | Bulls | Holstein X Gyr | 182-388 | - | 0.313 |
| [167] | Brazil | Calorimetry | 5 | Bulls | Nellore | 219 | 0.691 | 0.418 |
| Brazil | Calorimetry | 5 | Bulls | Nellore | 328 | 0.567 | 0.332 | |
| Brazil | Calorimetry | 5 | Bulls | Nellore | 394 | 0.512 | 0.331 | |
| Brazil | Calorimetry | 5 | Bulls | Nellore | 473 | 0.468 | 0.303 | |
| [168]* | France | Feeding Studies | 1855 | Growing | Temperate and tropical | - | 0.631 | - |
| [169]* | Brazil | Comp. Slaughter | 752 | Growing | Nellore, Nellore X Bos taurus | 258-426 | - | 0.386 |
| [170] | Brazil | Comp. Slaughter | 44 | Bulls | Holstein x Zebu | 338 | 0.555 | 0.382 |
| [171]* | USA | Comp. Slaughter | 127 | Steers | Angus, Hereford, and cross | - | - | 0.314 |
| Brazil | Comp. Slaughter | 711 | Bulls | Bos indicus | - | - | 0.292 | |
| [172] | Brazil | Comp. Slaughter | 46 | Bulls | Nellore | 138 | 0.603 | 0.325 |
| [173] | Brazil | Comp. Slaughter | 8 | Steers | Nellore, High RFI | 340-348 | 0.778 | - |
| Brazil | Comp. Slaughter | 9 | Steers | Nellore, Low RFI | 334-441 | 0.637 | - | |
| [174] | Brazil | Comp. Slaughter | 10 | Bulls | Nellore X Holstein | 199-317 | 0.607 | 0.352 |
| Summaries | ||||||||
| AFBI studies (1990 - 2020) | 0.672 ± 0.0947 | |||||||
| Literature (2009 - 2020) | 0.593 ± 0.0846 | |||||||
| Cottrill et. al. (1989 - 2009) | 0.524 ± 0.0776 | |||||||
Table 6.
Equations used to calculate energy requirements for LW gain (NEg) *.
| Systems | Equations |
|---|---|
| AFRC (1993) | |
| CSIRO (2007) | |
| INRA (2018) | |
| NASEM (2016) | |
| BR-Corte (2016) |
* For comparison purposes, energy coefficients are expressed in MJ (1 Mcal = 4.184 MJ); AFRC Energy value of weight gain; C = 0.70 to 1.30 for different maturity (early, medium, and late) of different animals (bull, steer and female); C2 = 1 when plane of nutrition, L, > 1 and = 0 when L < 1 (L > 1 indicates that the animal is being fed above its maintenance requirements, L < 1 indicates that the animal is being fed below its maintenance requirements); LW = live weight; LWG = live weight gain; CSIRO. Equation for immature animals (energy value of gain); 6.7 and 20.3 are coefficients expressing total energy in MJ/kg; R = adjustment for rate of gain or loss; P = live weight/standard reference weight; INRA. ProtGain and LipGain are protein and lipid deposition (kg/d); MEg= NEg/kpf; NASEM. Retained energy; EBW = empty body weight; EBG = empty body gain; BR-Corte. EQEBW = Equivalent empty body weight. This is obtained by dividing the EBW by the weight at maturity of the respective sex/genetic group and multiplied by the reference weight; EBG = empty body gain.
Table 7.
Equations used to calculate efficiencies of ME utilization for maintenance, growth, and lactation in the global energy system and calculated values at two diet metabolic ability values.
Table 7.
Equations used to calculate efficiencies of ME utilization for maintenance, growth, and lactation in the global energy system and calculated values at two diet metabolic ability values.
| System | Equation | ||
|---|---|---|---|
| 0.50 | 0.65 | ||
| AFRC (1993); CSIRO (2007) | 068 | 0.73 | |
| 0.40 | 0.51 | ||
| 0.60 | 0.65 | ||
| INRA (2018) | 0.70 | 0.74 | |
| 0.40 | 0.51 | ||
| - | - | ||
| - | - | ||
| 0.62 | 0.65 | ||
| NASEM (2016) | 0.61 | 0.67 | |
| 0.35 | 0.45 | ||
| BR-Corte (2016) | - | - | |
| - | - |
* ME/GE is metabolic ability. CSIRO. Although the Australian system largely adopted the principles and equations used in the AFRC, those equations were converted in M/D (MJ of ME per kg of feed DM). There is a specific equation for kg in grazing conditions kg= 0.035 M/D (1 + 0.33 Le) (1.0 + 0.12(λ sin (0.0172T)/40)); where: Le = the proportion of legume in the forage, T = the day of the year from 1 January, h = the latitude (◦) of the site; adverse in the south. Otherwise, kg in Table above (converted to M/D equivalents) is recommended for concentrate and grass silage-based diets; INRA. The ME units= Mcal/kg of DM; EP= protein proportion in LW gain. EP = 5.48 ProtGain/(5.48 ProtGain + 9.39 LipGain); For slow-growing cattle (LW gain≤1 kg/d; a metabolisability coefficient is calculated instead as qprimma = 0.62−0.262×exp(−3.175×LW gain), with LW gain in kg/d; kf= fattening; kmf= combined efficiency of ME for maintenance, growth and meat deposition for fast-growing animals; kpf= protein and fat deposition (known body gain composition);kls= milk yield + maintenance for lactating animals/ maintenance and gain for slow-growing cattle. Both kg and kl as such are used as such in the up-to-date version of the French system. NASEM, the same equations for km and kg as in the NRC. Values for energy efficiencies (ks) are not based on diet metabolisability (ME/GE); BR-Corte, the efficiency for maintenance includes kg; EBG = empty body gain (kg/d), β2= 0.100 for Zebu, 0.073 for beef crossbred and 0.010 for dairy crossbred and θ= fit factor for the rearing system that takes the value of 1 for animals reared on feedlot, and 0.92 for pasture reared animals. There is no explicit mention of kl calculations. Rather than providing information to estimate energetic efficiencies, the NASEM included equations to calculate dietary NE concentrations for maintenance and LW gain. For comparison purposes, the km and kg values in NASEM are estimated by dividing NE data by ME values as proposed by Cottrill et al.; see Table 5, when assuming metabolisability coefficients of 0.50 and 0.65. Conversely, in the Brazilian system, the principle for calculating both km and kg values is not based on the ME/GE ratio. Instead, both animal-related and production-system factors are considered. The authors did not obtain accurate kg predictions based on ME concentration in the diet.
Table 8.
Regression of logarithm of heat production on ME intake to describe energy utilization by Nellore and B. taurus × Nellore crosses steers1.
Table 8.
Regression of logarithm of heat production on ME intake to describe energy utilization by Nellore and B. taurus × Nellore crosses steers1.
| GG2 | Intercept2 | N | r2 | RMSE | NEm | MEm | km(CI) | kg(CI) | |
|---|---|---|---|---|---|---|---|---|---|
| AN | 16 | 0.94 | 0.015 | 90.76 | 142.44 | 63.7 (56.3,69.3) | 28.4% (14.6, 42.2) | ||
| CN | 16 | 0.98 | 0.009 | 82.28 | 130.98 | 62.8 (60.7, 66.2) | 22.1% (8.4, 35.9) | ||
| NL | 16 | 0.93 | 0.016 | 85.53 | 137.12 | 62.4 (62.8, 69.1) | 24.6% (10.4, 38.8) | ||
| SN | 14 | 0.85 | 0.024 | 88.80 | 139.11 | 63.8 (46.6, 73.3) | 29.5% (29.5, 29.5) | ||
| All | 62 | 0.93 | 0.016 | 86.86 | 137..53 | 63.2 (59.3, 66.5) | 26.0% (23.3, 28.6) |
1Values are mean ± SE. RMSE, the root of the mean square error; NEm, net energy required for maintenance (kcal/kg0.75 of EBW per d) calculated as the antilog of the intercept; MEm, metabolizable energy required for maintenance (kcal/kg0.75 of EBW per d) calculated by iteration assuming heat produced is equal to ME intake at maintenance; km, efficiency of energy utilization for maintenance (calculated as NEm/MEm), kg, efficiency of energy utilization for growth which was calculated as the slope of the regression of RE (kcal/kg0.75 EBW) on ME intake (kcal/kg0.75 EBW). CI, the confidence interval for km and kg, were computed by adding or subtracting one SE of the intercept and slopes for each genetic group (GG) and calculating the NEm, MEm, km, and kg as described earlier. 2NL, Nellore; AN, one-half Angus + one-half Nellore; CN, one-half Canchim (five-eighths Charolais + three-eighths Zebu) + one-half Nellore; SN, one-half Simmental + one-half Nellore. The limit-fed treatment received 70% of the daily feed of the ad libitum-fed treatment of the same genetic group.
Disclaimer/Publisher’s Note: The statements, opinions and data contained in all publications are solely those of the individual author(s) and contributor(s) and not of MDPI and/or the editor(s). MDPI and/or the editor(s) disclaim responsibility for any injury to people or property resulting from any ideas, methods, instructions or products referred to in the content. |
© 2024 by the authors. Licensee MDPI, Basel, Switzerland. This article is an open access article distributed under the terms and conditions of the Creative Commons Attribution (CC BY) license (http://creativecommons.org/licenses/by/4.0/).
Copyright: This open access article is published under a Creative Commons CC BY 4.0 license, which permit the free download, distribution, and reuse, provided that the author and preprint are cited in any reuse.


