
Submitted:
22 November 2024
Posted:
25 November 2024
You are already at the latest version
Abstract
Background: Tendinopathy is the preferred term to describe various tendon pathologies, including paratendinitis, tendinitis, and tendinosis in the absence of histopathological evidence in biopsy specimens. The management of tendinopathies is challenging. Rest, physiotherapy, such as eccentric training, injections, shock waves, orthotics, medical therapy, and surgery are the main therapeutic options offered to the patient. Conservative treatment of tendinopathies is still difficult, but several options have been attempted, including anti-inflammatory molecules. Methods: A retrospective data analysis concerning the application of Polynucleotides High Purification Technology (PN HPTTM) in 47 patients with tendinitis were analyzed. All patients received 3 bi-weekly injections of PN HPTTM (T0-T2). Follow-up visits were performed at T3 (8 weeks from T2) and T4 (24 weeks from T2). Both the visual analog scale (VAS) for pain assessment and functional impairment (FI) scores, were processed in anonymized form for clinical improvement evaluations. Results: Statistically significant differences (p < 0.001) were found for pain reduction (-85%), FI improvement (+86%) at the end of treatments. The level of patient satisfaction (PS) and clinician global improvement-impression (CGI-I) were equal to 93% and 98%, respectively. Analyses of other patient data (e.g., gender, age, and BMI) did not appear to influence treatment benefits. Conclusions: The application of High Purification Technology (PN HPTTM) has been shown to affect both pain and functional deterioration in patients with tendonitis in a similar manner to other conservative treatments. These retrospective analyses may open a new window on conservative approaches for patients with tendinitis.
Keywords:
Musculoskeletal disorders
; Tendinitis
; Novel therapeutic approach
; Polynucleotides
; PN HPTTM
; Peritendineous injection
; Visual analog scale
; functional impairment
1. Introduction
Tendinopathy is the preferred term to describe various tendon pathologies, including paratendinitis, tendonitis and tendinosis in the absence of histopathological evidence in biopsy specimens [1]. The management of tendinopathies is challenging. Rest, physiotherapy, such as eccentric training, infiltrations, shock waves, orthosis, medical therapy and surgery are the main therapeutic options offered to patients [2,3]. In the acute treatment phase, the main objectives are the reduction of risk factors such as training errors, flexibility problems and biomechanical abnormalities, together with the reduction of symptoms using rest, ice, ultrasound and laser therapy [4]. Conservative treatment of tendinopathies is still difficult. Patients expect their symptoms to improve within 3 to 12 months of starting treatment, but no more than a year. However, chronic symptoms persist in about a quarter of patients even more than 10 years after treatment and tendinopathy compromises both quality of life and physical activity [5]. Conservative treatments include platelet-rich plasma (PRP) [6] or corticosteroid infiltrations (CI) [7], but a systematic review of clinical trials has shown that corticosteroids reduce pain in the short term, but this effect is cancelled out in the medium to long term. After 3-6 months of failure of conservative therapy, surgery should be considered [8]. In order to find safe and effective conservative treatments, several studies have recently reported have an effect on musculoskeletal pain, especially involving tendons and ligaments, such as rotator cuff tendinopathy [8]. Indeed, both pain and functional impairment play a fundamental role in the relationship between patient and doctor. Pain reduction and functional improvement are the goals at any stage of clinical management, in the patient affected by tendinitis [9]. Furthermore, the clinical improvement of the patient associated with conservative management, does not seem to be an effective combination for a medium-long term solution. Two most clinical conditions in regard patient tendinitis are the hip bursitis (HB) [10] and the biceps tendinitis (BT) [11]. The HB pathology, includes Lateral hip pain associated with greater trochanteric pain syndrome (GTPS) [12], which includes gluteus medius tendinopathy or tear, bursitis [13], and iliotibial band friction [14]. Posterior hip pain includes referred pain such as Low back pain (LBP) [15], deep gluteal syndrome with sciatic nerve entrapment [16], ischiofemoral impingement [17], and hamstring tendinopathy [18]. The musculoskeletal pathologies affecting the upper limb of human body, includes also the disease of arm, as well BT [19]. Indeed, massive rotator cuff tears (MRCT) represent a significant portion of all rotator cuff injuries, accounting for approximately 20%-40% of all injuries [20,21]. In MRCT, the long head of the biceps tendon (LHBT) is frequently involved, resulting in anterior shoulder pain and loss of function associated with tendinitis, partial tear, or subluxation of the shoulder [22,23]. In fact these two pathologies represent a common clinical problem representing a variety of periarticular pathologies of both the hip [24] and the shoulder [25]. Consequently the clinical management of these conditions often becomes mandatory [26,27]. There are two possible options for these two problems: the surgical approach [25,27,28,29] and the conservative one [29,30]. In order to treat these two musculoskeletal pathologies avoid surgical procedures, several conservative approach are available, over PRP [6] and CI [26] mentioned above. These attempts included: non steroidal anti-inflammatory drugs (NSAIDs) [10,31,32], Despite, many different therapeutic approaches by injection, are promoting a curative intent, the clinical features of both HB and BT, are often unsolved in long-term period. Indeed, some physicians are looking for new approaches (surgical and non surgical), in order to fight these clinical problems [30]. A new approach may be represented by the utilization of injectable Polynucleotides. Polynucleotides (PNs) are extracted from natural sources (trout gonads) using a specific process developed by Mastelli Srl denominated High Purification Technology (HPTTM) from fish intended for human consumption [33]. The derivatives of enzyme degradation of polynucleotide chains (simple nucleotides, nucleosides, nitrogen bases) are physiologically present in the extra-cellular environment and are useful substrates for cells [34]. The polynucleotides High Purification Technology (PN HPTTM) are always already used in aesthetic medicine, taking advantage of previous experience in other clinical applications [35]. Recent studies have demonstrated both the efficacy and safety of PN HPTTM injections both in dermatology and in aesthetic medicine for skin rejuvenation [35,36]. The polynucleotides High Purification Technology (PN HPTTM) injection is also used against osteoarthritis of knee [37]. In this study, doctors demonstrated a better efficacy of PN HPTTM compared to hyaluronic acid (HA) injection. In fact, the same group of scientists reported significant positive effects for a long time, up to 26 weeks after treatment [37]. Intra-articular injection progressively enriches the synovial fluid of PNs and thus of nucleotides, purine and pyrimidine bases that cells can use to promote their vitality [34]. This healing process could also be reproduced in the context of tendinopathy, creating an ideal environment for the healing of dam-aged tendons. Given these premises, the hypothesis of stimulating a retrospective data analyses in a cohort of subjects affected by hip bursitis (HB) and Biceps tendinitis (BT), treated with a polynucleotide injection alone. The goal of these retrospective analyses was to understand whether the Tropho Tend (7.5 mg/mL PN HPTTM, Mastelli, Sanremo, Italy) injection affected the pain and the functional impairment of pathological subjects.
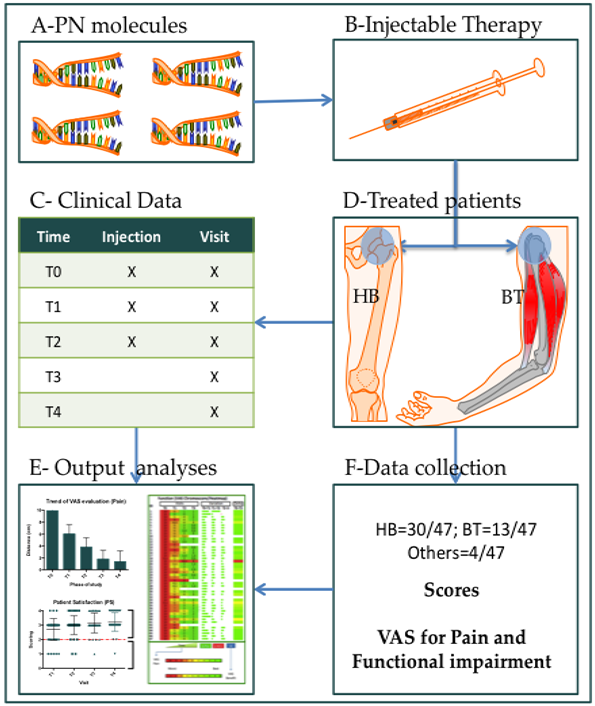
2. Materials and Methods
2.1. General Aspects
The duration of the data acquirement covered 4 months. In this period data manipulation were performed in collaboration with two authors (P.G. and N.F) in order to build a database “ad hoc” including the clinical data and the anonymized personal data. The informatics code assigned at the beginning of this phase of work allowed maintaining the anonymity of the patients.
2.2. Data Assessments
All data procedures were performed in agreement with the legal standards of human data manipulation in agreement with the Helsinki declaration of 1975, updated in 2000 and 2008. The patient data included the clinical evaluation for a total of 5 visits (T0, T1, T2, T3 and T4). Final results were compared with respect to baseline assessments (T0). A patient is considered enclose in the database whether had signed informed consent, the treatment was performed and complete clinical data were available.
2.3. Treatment Documentation
All patients received Tropho Tend (7,5 mg/mL of Polynucleotides High Purification Technology - PN HPTTM, Mastelli Sanremo, Italy) administered by injecting the solution in the musculotendinous (MT) or osteotendinous (OT) junctions using a thin gauge needle (typically 25-30G). Before injecting the product, the target area will be disinfected with alcohol or another antiseptic solution. The total number of treatments consisted of 3 administrations of Tropho Tend: at T0 –baseline visit, at T1 – after 2 weeks and at T2 – after 4 weeks. All subjects were screened on the baseline visit (T0). Each subject was involved in the study for 7 months, promoting a total of 5 visits (T0= baseline, T1= after 2 weeks, T2= after 4 weeks, T3= after 8 weeks from T2, T4= after 24 weeks from T2). The results were compared with baseline assessments (T0).
2.4. Score Evaluations
During each visit, all patients were evaluated for both pain and functional impairment using a specific visual-analogue scale (VAS) from 0 to 10 cm, consisting of a line connecting two extremes (0 = absence of pain or absence of functional impairment and 10 = worst possible pain or maximum functional impairment). The patient placed a cross on the line between the two extremes, at the point that in his opinion best represented the intensity of the pain perceived. The investigators evaluated the tendinopathy as improved or worsened compared to baseline using the Clinical Global Impression – Improvement scale (CGI-I). This is a 7-point scale that compares the patient’s condition between the visits in front of the baseline visit (T0). The condition was judged as: 1=Very much improved, 2 Much improved, 3=Minimally improved, 4=No change, 5=Minimally worse, 6=Much worse and 7=Very much worse. At the same time the patient satisfaction (PS) was also evaluated according a 5-point scale. The PS values ranged among the following scores: (0=Very dissatisfied; 1= Dissatisfied; 2=Neutral; 3=Satisfied; 4=Very satisfied).
2.5. Statistical Procedures
2.5.1. General Methodology
All data were listed, sorted by gender, analysis population and when appropriate by visit number within subject. All summary tables of efficacy data were structured with a column for each target and were annotated with the total population size relevant to that table/treatment, including any missing observations, if any. All continuous variables were summarized using the following descriptive statistics: n (number), mean, standard deviation, median, maximum and minimum. The frequency and percentages (based on the non-missing sample size) were reported for all categorical measures. The data generated in this study were recorded in a study-specific electronic system and the original rows data will be available on demand. After the completion of the data entry in the system, the resolution and closure of all discrepancies, the database was blocked to avoid any further modification. After quality checks, the SAS format database was used for statistical analysis.
2.5.2. Study variables
For subject demography and clinical data documentation, the following variables were documented: Year of birth, Age (years), Gender (Male/Female), Weight, Height, BMI calculation, Pain evaluation (VAS score), Functional impairment evaluation (VAS score), Questionnaire about patient satisfaction (PS) and Questionnaire about patient Clinical Global Impression (CGI).
2.5.3. Analytical tests application (ATA)
The GraphPad 8.0 version for Apple Computer was used for statistical analysis (PRISM, San Diego, CA, USA). The Wilcoxon rank test and will be used to compare the differences between before and after treatment for the degree of clinical improvement of tendinopathies and patient satisfaction. The paired t-test will be applied for group comparison of numerical variables. The Umpired T-test and ANOVA analyses were performed in order to compare the VAS, the PS and CGI acquisitions. The final suggestive results were outlined through the heat-maps representation. All the parameters measured in this study were evaluated using the classic descriptive statistics: mean, SD, minimum and maximum (for quantitative variables) and frequencies (for qualitative variables). All statistical results were considered significant if less than 0.05 (p < 0.05). The Shapiro-Wilk test was performed in order to understand whether we have a normal distribution of data. Both W and p values for the BMI value were reported (W=0.980 and p=0.574). These values justified the utilization of parametric tests.
3. Results
3.1. Demographic Description of the Population
Inside the database were recorded the data concerning a total of 47 different subjects the demographic data distributions (gender, age, BMI and pathology) were reported in the following multi-panel image (Figure 1). Through both weight and height acquisitions data the Body Mass Index (BMI) was calculated for all record included in the database. The subjects were distributed as follows: males (20; 42.55%) and females (27; 57.45%), respectively (Figure 2A). The mean age of total population was 70.46 (SD=11.73), while the mean value of BMI was equal to 24.0 (SD=3.52). Furthermore, two most common pathologies were registered inside this cohort of subjects: Biceps tendinitis (BT; 13/48; 27.08%) and Hip bursitis (HB; 31/48; 64.58%; Figure 2D). one subject had two pathological sites (bi-lateral HB). The ANOVA and Student’s test revealed that no statistical differences were found between males and females concerning both age (Figure 2B) and BMI (Figure 2C).
3.2. Pathologies Description
A total of six types of different pathologies regarding the orthopedic conditions, were acquired at beginning of the data collection. However, six follow-ups were not completed due to patients withdrawing from the study. In particular: in one case the reasons were unknown, in four cases there were unsuccessful of results or dissatisfaction of patient and in the last case there were personal reasons. Indeed, the frequencies of treated pathology patient-associated were evaluated according the accomplishment of established protocol. The distinction of pathologies is reported in Figure 3A. The most common pathological condition treated was the Hip Bursitis (HB; 31/48; 64.58%), followed by Biceps Tendinitis (BT; 13/48; 27.08%). The miscellanea group (see Figure 2, graph D) represented the remaining 8.42% of pathological conditions (see Figure 2, graph D). Data from 41 of 47 subjects indicated that treatment with PN HPTTM injections had been completed. Indeed, the ratio of full-filled data was 82.23% (Figure 3B).
3.3. Missing Data and Data Subjects Incomplete
The information of missed data had grouped in two graphs report below (Figure 4). Graph A reports the total records distributed by visits. While, the graph B indicates the number of subjects not included in the global analyses, according the absence of data.
3.4. VAS result (T0 Visit)
The baseline analyses for both pain and functional impairment (obtained by VAS scores) were performed by Kruskal-wallis test. No statistical differences were assessed in both pain and functional rows, according the gender distribution. Both pain and functional impairment showed mean values close to maximum of the VAS score (mean VAS=10). Below, are reported the respective analyses concerning the pain (Figure 5A) and the functional impairment (Figure 5B) at T0 time.
3.5. VAS results (T0-T4 and Delta analyses)
The data concerning the following visits (T0 and T4) were completely found for 41 subjects, in which, was possible to perform the paired T-Test analyses (Wilcoxon Test). The same analyses were addressed for both pain and functional impairment VAS data (Figure 6). Looking for the difference observed in pain, the delta value was 8.537±1.429 (Figure 6A); figure, while the delta values for the functional impairment was 8.598±1.441 (Figure 6B). Furthermore, both pain and functional impairment reductions, in terms of VAS score difference (percentage), were equal to 85.68% and 86.19%, respectively. The variations mentioned above, showed, showed significant statistical differences for both pain and functional impairment (p<0.0001).
3.6. VAS results (Global Trend)
The data concerning the following visits (T0, T1, T2, T3 and T4) were harvested for 41 subjects, in which, was possible to perform the ANOVA Analyses (Kruskal-Wallis). All pairs of groups were compared against each other. The same analyses were addressed for both pain and functional impairment VAS data (Figure 7). These analyses revealed that the PN treatments showed a great efficacy in front of both pain and functional impairment parameters, in which as final results (T4), the mean improvement of VAS (for both parameters) was 85.89% (pain 85.68%; functional impairment 86.16%), with respect to the T0 time (Figure 7A and 7D; p<0.0001). For both parameters (pain and functional impairment), there was a continuous and positive trend for the VAS score, from visit T1 to visit T4 (Figure 7B and 7E; p<0.0001). The Delta of VAS improvement (at visit T1) was 61.68% and 41.20% in pain and functional impairment, respectively. These data highlighted that there are two different speeds (S) for the VAS improvement (VI; percentage) in the two parameters (Figure 7C; R2=0.9703 and 7F R2=0.9641). By observing the speed of VAS, it is possible to ascertain that the treatment accelerated the functional impairment parameter faster (Delta T4-T1; 44.96%) then in the pain (Delta T4-T1; 35.42%; Figure 7B and 7D. In fact, is it possible to express the speed of VAS improvement (SVI) as variation of VAS per week (VI/w). The time of visits covered a 22 weeks period (T1-T4). So far, SVI for pain (1.56 VI/w) and functional impairment (2.04 VI/w), were taken out, respectively. In fact, it was possible to express the acceleration as AVI (AVI/w2). So far, the following measurements have been calculated for pain (0.16 AVI/w2) and functional impairment (0.20 AIV/w2). This data was obtained to express the percentage change in VAS per week. Indeed, the greater speed of improvement of the VAS (SVI) value was observed for the pain parameter, in which the improvement was equal to 4.00, while that observed in the functional impairment: 3.59 (Figure 7C and 7F). Overall, observing the results obtained for the pain parameter and that of functional deterioration (measured by the VAS score) it was possible to ascertain that large statistical differences were observed and confirmed, comparing T0 vs T4 (starting point vs ending point). Therefore, the current data suggest the VAS score appears to be an adequate tool to evaluate the improvement of better pain status and functional impairments. Furthermore, it was observed that approximately 50% of the large statistically significant differences, in terms of improvement of the VAS score, were observed in the early time of treatment (for example in visits T1 and T2).
3.7. Questionnaires Results
The data concerning the following visits (T1, T2, T3 and T4) were obtained for 41 subjects, in which, was possible to perform the ANOVA Analyses (Kruskal-Wallis). The rows data concerning the questionnaires for both Patient Satisfaction (PS; Figure 8) and Clinical Global Impression-Improvement (CGI-I; Figure 9) were analyzed performing two-way ANOVA test. All pairs of groups were compared against each other’s. The same analyses were addressed for both parameters (p<0.0001). In both parameters (PS and GCI-I) it was observed a progressive positive improvement (Figure 8A and 9A). In particular it was calculated the mean score of questionnaire visit by visit and in all checkpoints, all value expressed a good impression from both patient and physicians. As reported in figures 8B and 9B, the distribution of scores, associated with positive impressions, always increased starting from T1, for both the PS parameter (Figure 8) and for the CGI-I one (Figure 9). In particular, it is highlighted that the compressively positive result (at visit T4) for the PS and CGI-I parameters were 92.68% and 97.56%, respectively.
3.8. Heat-Maps and Chromo-Score Representation
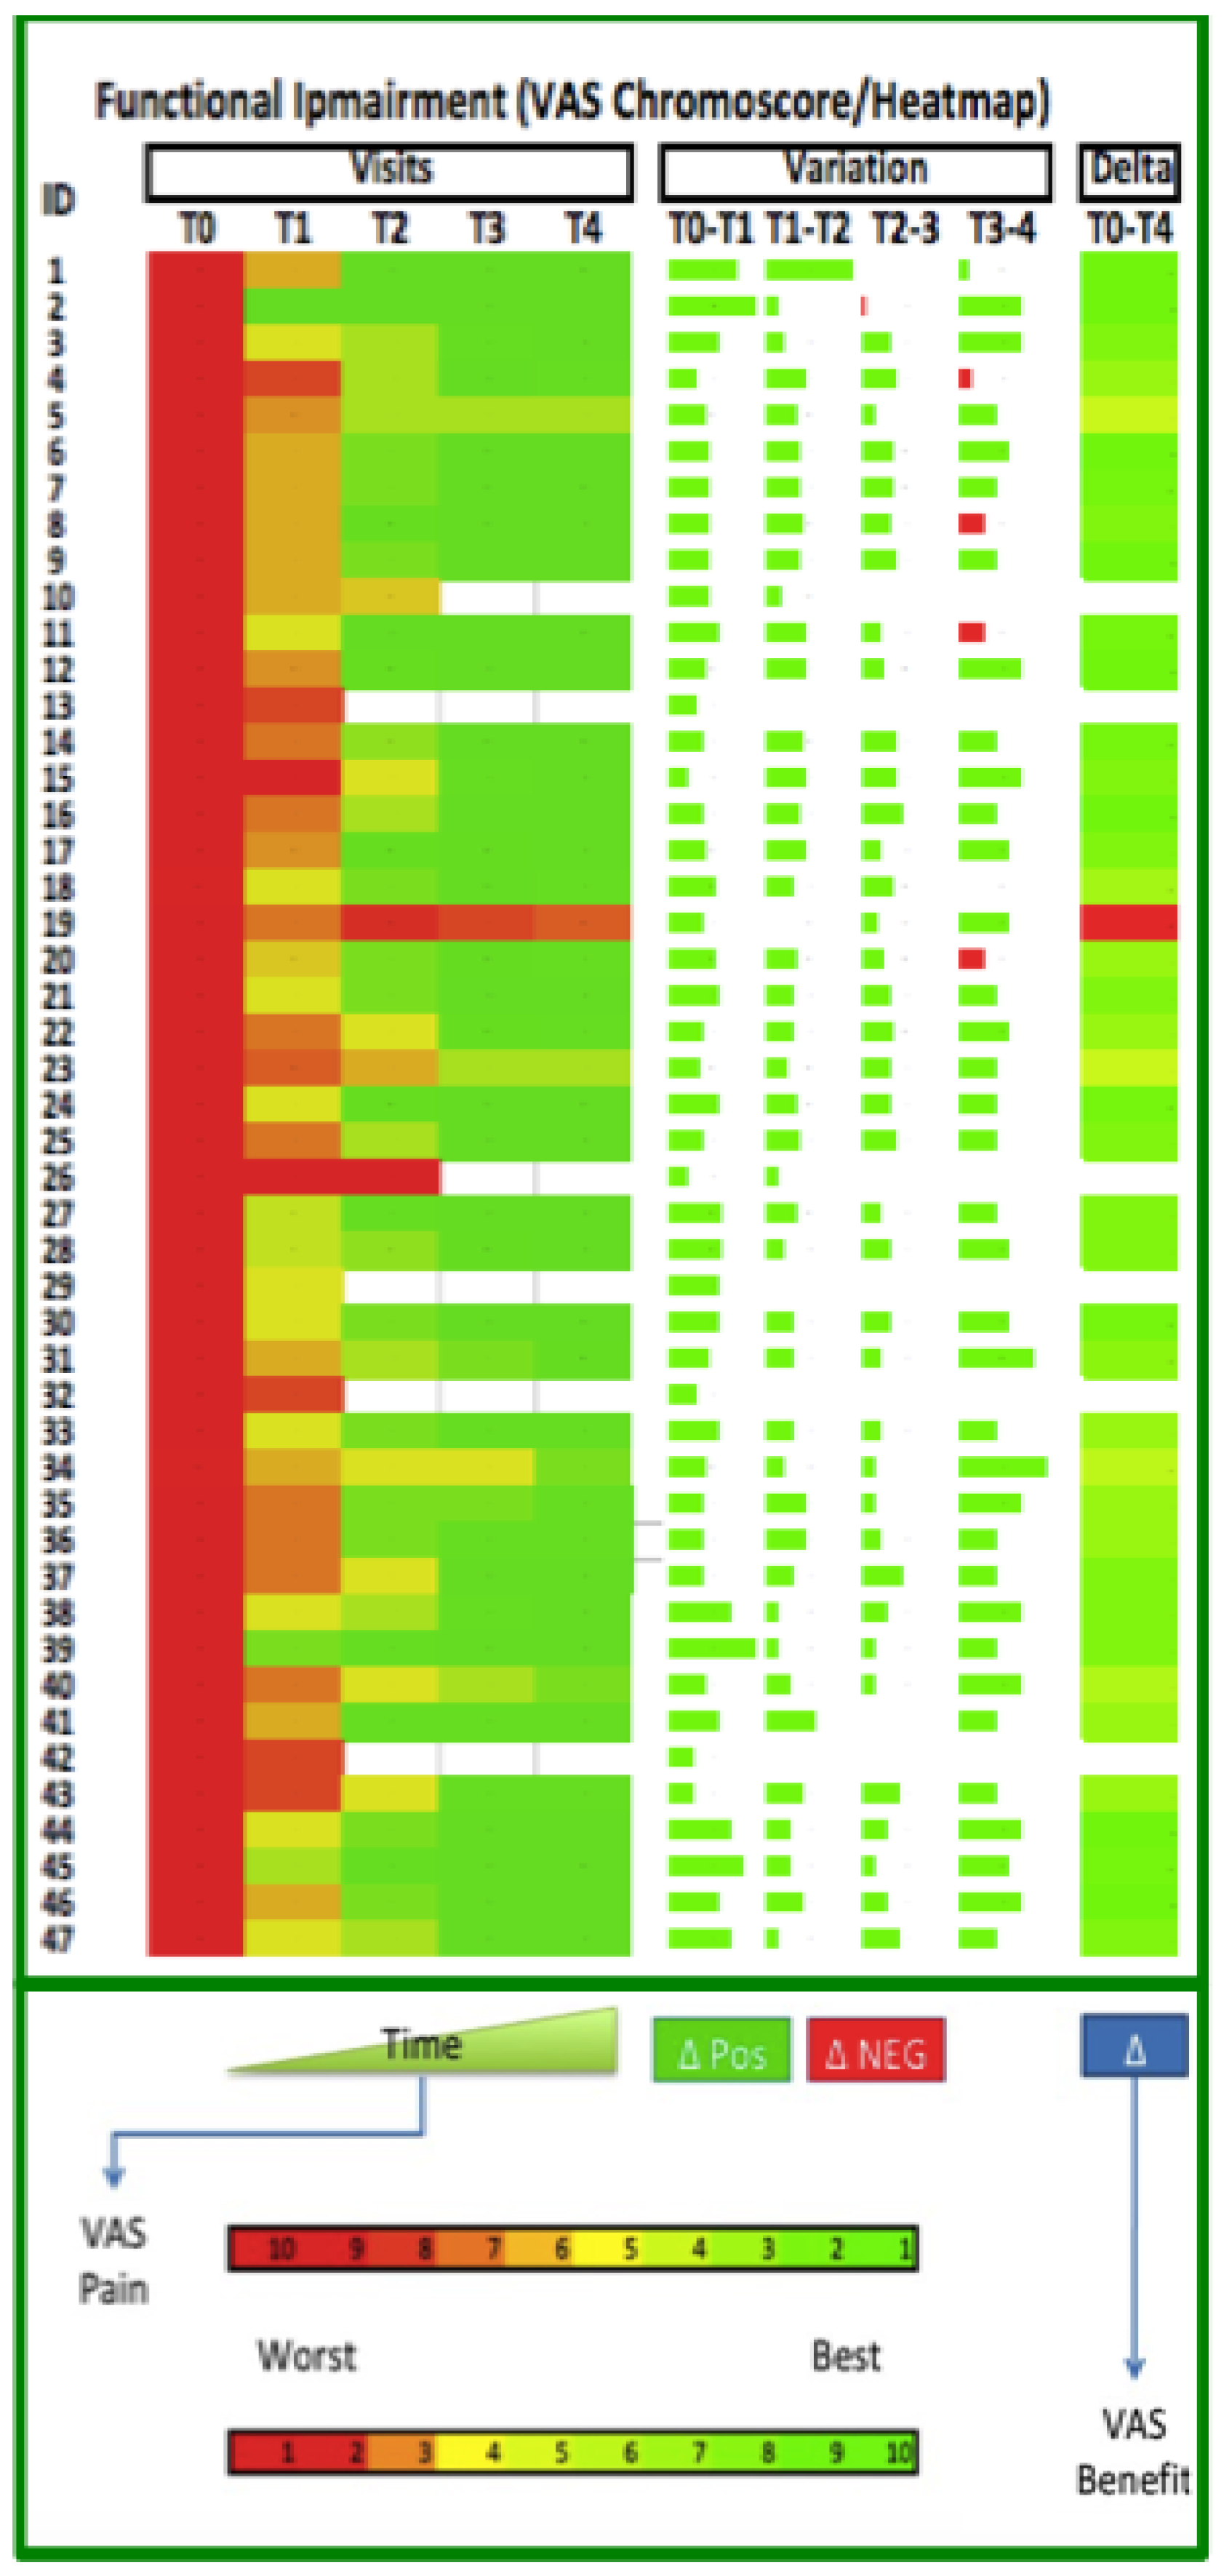
In order to explain the complex data of the study through a one shot picture, we would like to use the heat-map chart in order to highlight the progress of patients in term of pain reduction and functional improvement of physical function. Both of parameters are reported in figures below. The figures represent the final analyses belonging the visits. The chromo-score ranging from red to green in order to represent the worst and the better parameter situation, respectively (Figure 10 and 11). The heat-map showed that 40 out of 41 patients had a notable positive improvement after treatment. However, only one patient (#ID19) had negative statement in these analyses. However, it should also be mentioned that two patients (#ID02 and #ID41), received the greatest improvement in VAS in pain (Figure 10) and in functional improvement (Figure 11) after just one injection. The green color used in figures 10 and 11, shows all the positive changes measured between one visit and the next ones. Looking for the pain analyses, in two cases (#ID02 and #ID08), the change measured between T3 and T4 were negative. While, looking for the functional improvement, five subject (#ID02, 4, 8, 11 and 20) showed negative results. In these subjects, the changes in VAS between two visits were very close to zero and the computer algorithm assigned a negative value (red color). However, the final effect on patients was not changed by this small difference, resulting in a global positive effect (green color)
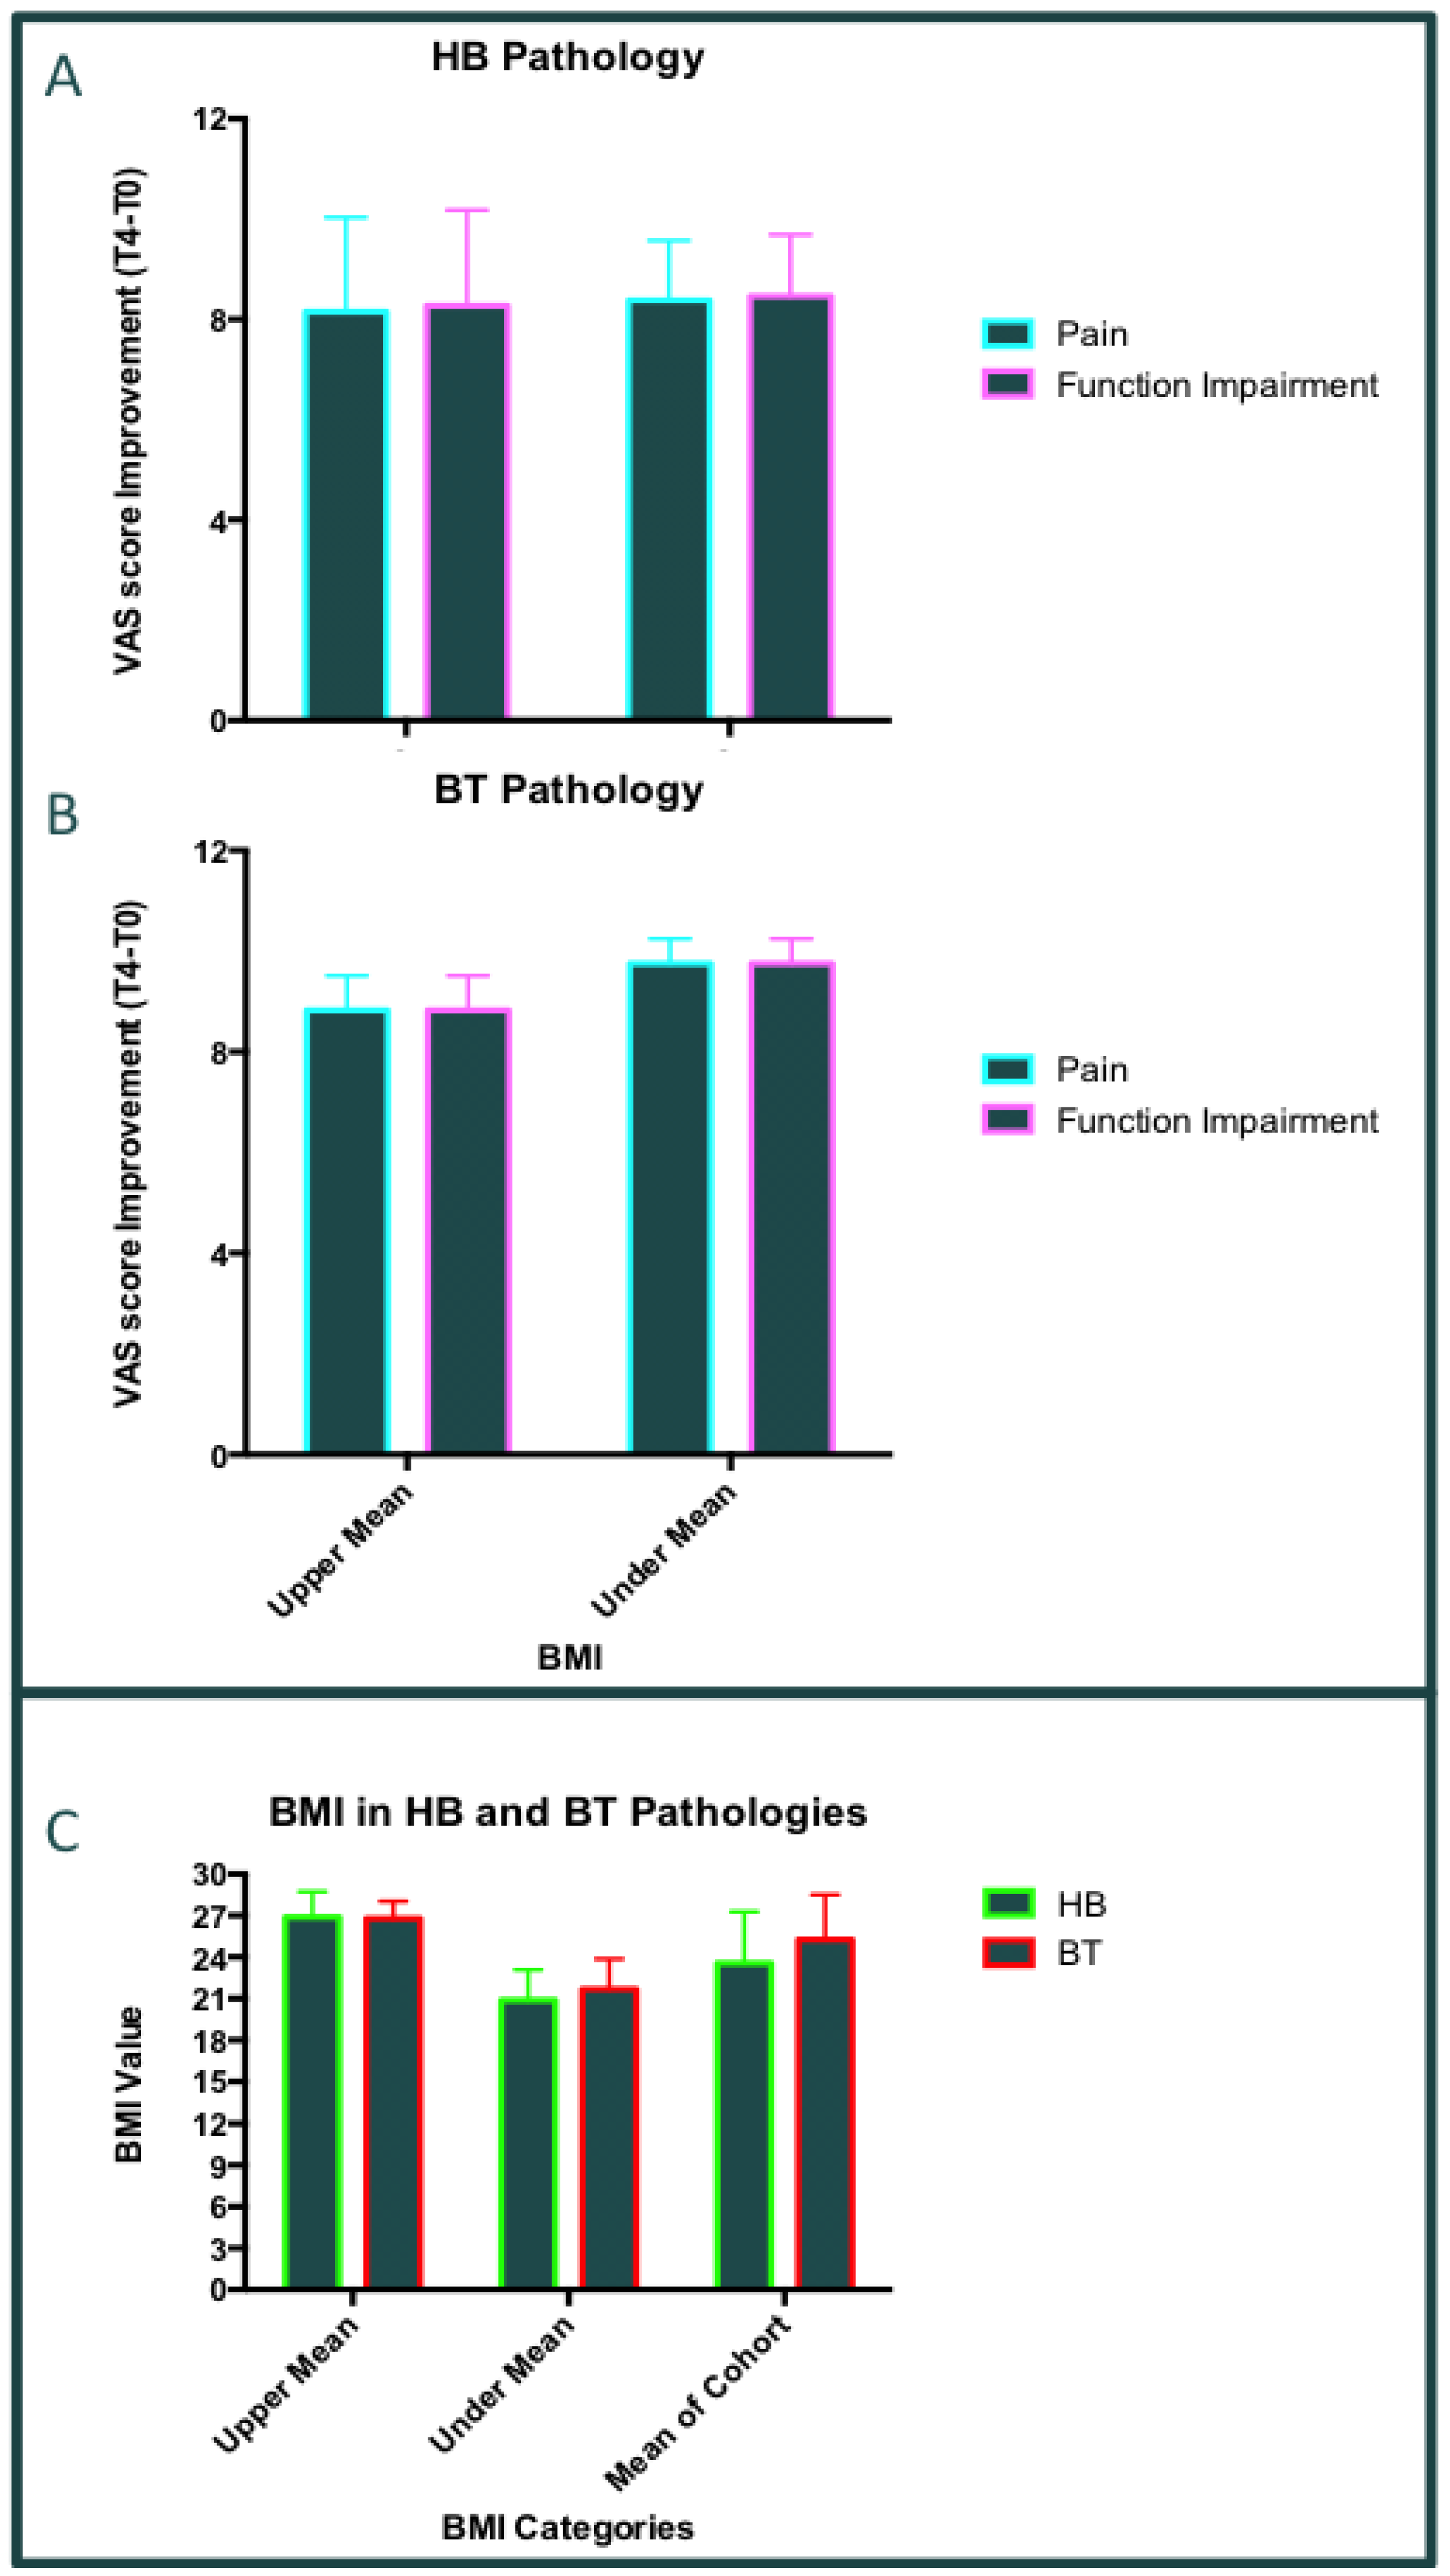
3.9. Correlation BMI and Pathologies
According both statistical reports, we tried to understand whether could exist a correlation between body mass index BMI (as well reported in Figure 2D) and the pathologies-associated patients treated. The ANOVA analyses were carried out comparing the BMI and the most frequent two pathologies in patients treated with PN HPTTM: HB (Hip bursitis) and BT (Biceps tendinitis) as well reported in Figure 3. The two pathologies patients-associated were investigated separately. The patients were sorted in two groups according their BMI values (upper or under group, with respect to the mean value of BMI). In the BT group (10 patients treated) there were 6 patients showing a BMI value upper the mean, while, 4 patients showing a BMI value under the mean value. Furthermore, in the HB group including 26 patients treated (for one of them it was no possible to calculate BMI), there were 13 in both groups upper and under the BMI mean value. The ANOVA tests revealed that there not significant difference comparing the BMI partition in both BT and HB subjects (Figure 12A and 12B). Indeed, the global differences of VAS (T4-T0) were evaluated for both pain and functional impairment in the two most common pathologies treated with PN HPTTM (BT and HB). According the BMI partition. No one significant statistical difference was discovered by ANOVA or T-test analyses in these subgroup of patients (p=ns). The global VAS improvements for pain and functional impairment were the same in both groups of patients (sorted by BMI and pathology). This statistical evaluation was reported in Figure 12C). However, the statistical data indicated that the less value of BMI seems to be associated with a higher improvement in both pain and functional impairment in BT (The differences were not significant). Moreover, no significant differences were found in HB subgroup subject.
Figure 1.
BMI and pathologies. Graph Bars reporting: the patients sorted for BMI levels (Upper or Under the mean) A): Hip bursitis (HB) pathology; B) Biceps tendinitisendi (BT) pathology; C) HB and BT. The ANOVA and multi-comparative T-test revealed not significant values (p=ns).
Figure 1.
BMI and pathologies. Graph Bars reporting: the patients sorted for BMI levels (Upper or Under the mean) A): Hip bursitis (HB) pathology; B) Biceps tendinitisendi (BT) pathology; C) HB and BT. The ANOVA and multi-comparative T-test revealed not significant values (p=ns).
4. Discussion
These series of retrospective data confirmed that the treatment with Polynucleotides HPTTM injection affects pain and functional impairment in both HB and BT subject (p<0.0001). Indeed, the “final chromo-score data” confirmed and maintains the results of analyses focused on T0-T4 times. Nevertheless, the clinical data of both HB patients and BT ones, might represent the pathological condition of GTPS [12] and LHBT [22,23], as well was indicated by Figure 1D. In fact, the treatment based on PN HPT™, corresponded to site of great trochanteric site [29] and Long head Biceps [38]. The significant statistical values obtained for both pain and functional impairment, in these musculoskeletal conditions are indicating an important role of the Polynucleotides HPTTM (PN HPT™) against the pathology investigated. In particular, the results obtained in earlier phases of treatment (e.g., at T1 and T2 times), are indicating a both great and early efficacy of treatment. Moreover, the trend of VAS score showed a constant reduction over time. Nonetheless, VAS score have been using a important parameter in order to evaluate the both pain and functional improvements in osteon-articular (OA) and musculoskeletal pathologies [13,15,39]. In particular, it is important to note that (see global chromo-score analyses) the mean of Delta (T0 vs T4) was important in both pain and functional impairment. In the second level analyses it was observed that the acceleration and velocity of VAS improvement were different for the two parameters investigated. No studies were found in order to compare this “triage” including the PNs application, tendinitis and VAS improvement. The higher acceleration was observed for the functional impairment, while the higher velocity was assessed for the pain parameter. Furthermore, only one subject (2.38% of total subjects included) didn’t show a benefit of treatment looking at both the pain and functional impairment parameters. However, the results reported from different studies regarding OA diseases, seem to confirm a similar trend, associated to the PN HPT™ treatment [34,39,40,41,42]. Nevertheless, this patient had a continue benefit derived from treatment, but the final score of VAS remained so high, with respect to the general treated population (# ID19; Figure 10 and 11). Vice versa, two patients (#ID02, and #ID41) received the maximum of benefit after only one injection at T1 and or T2 (see heat-maps figures 10 and 11). A total of 168 points of analyses (comparing any delta point for each subject) were performed for pain and functional impairment (see heat-map analyses). Only one delta point was negative in pain analyses (0.59%) and four out of 168 (2.38%), were negative in functional impairment analyses. By the way, in these four patients the final result (delta Visit T0-T4) was positive too. Furthermore, at the end of data analyses (completed in 87,23% of 47 patients) a total of 40 of them reached a fully positive VAS improvement for pain and functional impairment (Figure 10 and 11). On the other hands, the questionnaires showed twins positive trends for patient’s satisfaction (PS) and Clinical Global Improvement-Impression (CGI-I) data. In these analyses it was observed that more than 90% of response within fall in the positive impression score for both PS and CGI-I. The negative impressions were reported in less than 3% of questionnaire’s answers. The last but not the list, the results mentioned above didn’t receive the influence of variable personal data such as: age, gender and BMI. Nonetheless, these results demonstrated also, that BMI and pathologies (specially HB and BT) didn’t impact of treatment results.
The utility of polynucleotides (PN HPT™) has been widely documented over the last decade, in several studies conducted since 2014 [34,40,41,42,43,44]. Orthopedics has been the medical field in which the use of PNs has been most widely used. In particular, three different groups of physicians have performed their randomized clinical trials (RCTs) on patients with knee osteoarthritis (OA) [34,37,42] and rotator cuff syndrome (RCS) [43], comparing treatments with PN HPT™ versus those with hyaluronic acid (HA) [34,37,43]. A total of 242 patients were enrolled in these studies and 121 of them were treated with PN HPT™ alone [34,37,42,43]. Notably, in two Randomized Clinical Trials (RCTs) the physicians demonstrated non-inferiority of PN HPT™ treatments with respect to the HA alone [37,42]. The comparison between PN HPT™ vs HA treatments revealed a marked difference in terms of non-steroidal anti-inflammatory drug (NSAID) consumption, a reduction in NSAID use was observed in the arm including PN patients, 8 weeks earlier than in HA patients (at 10 weeks in PN HPT™ vs 18 weeks in HA [37] and at 8 weeks in PN HPT™ vs 16 weeks in HA [42]. The results demonstrated a positive impact of PNs applications in order to reduce pain in the first six months of treatment both in patients with knee OA and in those with RCS [34,37,43]. Nonetheless, similar medical findings were reported by Guelfi et al. in 2020 [44]. Here, scientists prospectively studied 146 patients with knee OA and 56 patients with ankle OA, respectively. The authors concluded their investigation by assessing that PN HPT™ treatment positively improved the patients’ WOMAC score after one month and the positive effects remained stable for the following six months. Furthermore, they supported the hypothesis that PN HPT™ could behave like high molecular weight HA, with the advantage of less injection difficulties [44]. Nevertheless, in other one study focused in Hip OA [41], scientists retrospectively evaluated the application of PN HPT™ alone in 43 patients with hip OA. Pain analyses (via VAS approach) demonstrated a reduction in the score of -46.6% from baseline, after a six-month follow-up [41]. Indeed, the VAS score remained close to low VAS values after 24 (-51,4%) and 36 (-55.6%) months (with respect to baseline assessment, respectively) [41].
5. Conclusions
The results obtained in the present data collection seem to demonstrate the efficacy and safety of Tropho Tend (PN HPTTM) use in tendinitis patients. The PN HPTTM treatment improved the pain statement and the functional impairment of patients. The results in this retrospective clinical data collection seem to be in agreement with the other contribution present in the literature. In vivo experiments and the following analysis, supported the results illustrated in this report and the rationale of the studies mentioned above. Also the data concerning the cross-match between the BMI deep analyses and the pathologies patient-associated, revealed not impact of BMI with respect to the tendon healing. Overall, the Polynucleotides HPTTM might represent a new weapon against the tendinitis.
Author Contributions
Conceptualization, P.G. and N.F.; methodology, P.G.; software, N.F.; validation, P.G., M.M. and N.F.; formal analysis, N.F.; investigation, P.G.; resources, P.G. and M.M.; data curation, P.G. and M.M.; writing—original draft preparation, N.F.; writing—review and editing, N.F.; visualization, P.G and N.F.; supervision, M.M.; project administration, P.G. and N.F.
Funding
This research received no external funding.
Institutional Review Board Statement
For this study, the approval of the ethics committee was not necessary since it is a retrospective analysis on anonymized data. The data in possession for the analyses can be considered anonymized, when it is not possible to trace the identity of the subjects even using subsequent operations at the informatic level. This aspect is regulated by law no. 675/1996 of the Guarantor of Privacy in Italy, in compliance with the use of personal data for scientific purposes.
Informed Consent Statement
Informed consent was obtained from all subjects involved in the retrospective analyses.
Data Availability Statement
All data obtained from this study are available for consultation. The data controller is Dr. Paolo Gervaso.
Acknowledgments
None.
Conflicts of Interest
The authors declare no conflicts of interest.
References
- Woodley, B.L.; Newsham-West, R.J.; Baxter, G.D.; Kjaer, M.; Koehle, M.S. Chronic Tendinopathy: Effectiveness of Eccentric Exercise * COMMENTARY 1 * COMMENTARY 2. Br. J. Sports Med. 2007, 41, 188–198. [Google Scholar] [CrossRef]
- Millar, N.L.; Silbernagel, K.G.; Thorborg, K.; Kirwan, P.D.; Galatz, L.M.; Abrams, G.D.; Murrell, G.A.C.; McInnes, I.B.; Rodeo, S.A. Tendinopathy. Nat. Rev. Dis. Primer 2021, 7, 1. [Google Scholar] [CrossRef]
- Van Der Vlist, A.C.; Winters, M.; Weir, A.; Ardern, C.L.; Welton, N.J.; Caldwell, D.M.; Verhaar, J.A.N.; De Vos, R.-J. Which Treatment Is Most Effective for Patients with Achilles Tendinopathy? A Living Systematic Review with Network Meta-Analysis of 29 Randomised Controlled Trials. Br. J. Sports Med. 2021, 55, 249–256. [Google Scholar] [CrossRef]
- Cardoso, T.B.; Pizzari, T.; Kinsella, R.; Hope, D.; Cook, J.L. Current Trends in Tendinopathy Management. Best Pract. Res. Clin. Rheumatol. 2019, 33, 122–140. [Google Scholar] [CrossRef]
- Childress, M.A.; Beutler, A. Management of Chronic Tendon Injuries. Am. Fam. Physician 2013, 87, 486–490. [Google Scholar]
- Mathew, J.; Sankar, P.; Varacallo, M. Physiology, Blood Plasma. In StatPearls; StatPearls Publishing: Treasure Island (FL), 2024. [Google Scholar]
- Mellor, R.; Bennell, K.; Grimaldi, A.; Nicolson, P.; Kasza, J.; Hodges, P.; Wajswelner, H.; Vicenzino, B. Education plus Exercise versus Corticosteroid Injection Use versus a Wait and See Approach on Global Outcome and Pain from Gluteal Tendinopathy: Prospective, Single Blinded, Randomised Clinical Trial. Br. J. Sports Med. 2018, 52, 1464–1472. [Google Scholar] [CrossRef]
- Dean, B.J.F.; Lostis, E.; Oakley, T.; Rombach, I.; Morrey, M.E.; Carr, A.J. The Risks and Benefits of Glucocorticoid Treatment for Tendinopathy: A Systematic Review of the Effects of Local Glucocorticoid on Tendon. Semin. Arthritis Rheum. 2014, 43, 570–576. [Google Scholar] [CrossRef]
- Stanos, S.P.; McLean, J.; Rader, L. Physical Medicine Rehabilitation Approach to Pain. Anesthesiol. Clin. 2007, 25, 721–759. [Google Scholar] [CrossRef]
- Seidman, A.J.; Taqi, M.; Varacallo, M. Trochanteric Bursitis (Archived). In StatPearls; StatPearls Publishing: Treasure Island (FL), 2024. [Google Scholar]
- Elser, F.; Braun, S.; Dewing, C.B.; Giphart, J.E.; Millett, P.J. Anatomy, Function, Injuries, and Treatment of the Long Head of the Biceps Brachii Tendon. Arthrosc. J. Arthrosc. Relat. Surg. 2011, 27, 581–592. [Google Scholar] [CrossRef]
- Redmond, J.M.; Chen, A.W.; Domb, B.G. Greater Trochanteric Pain Syndrome. J. Am. Acad. Orthop. Surg. 2016, 24, 231–240. [Google Scholar] [CrossRef]
- LaPorte, C.; Vasaris, M.; Gossett, L.; Boykin, R.; Menge, T. Gluteus Medius Tears of the Hip: A Comprehensive Approach. Phys. Sportsmed. 2019, 47, 15–20. [Google Scholar] [CrossRef]
- Reiman, M.P.; Goode, A.P.; Hegedus, E.J.; Cook, C.E.; Wright, A.A. Diagnostic Accuracy of Clinical Tests of the Hip: A Systematic Review with Meta-Analysis. Br. J. Sports Med. 2013, 47, 893–902. [Google Scholar] [CrossRef]
- Wilson, J.J.; Furukawa, M. Evaluation of the Patient with Hip Pain. Am. Fam. Physician 2014, 89, 27–34. [Google Scholar]
- Gómez-Hoyos, J.; Martin, R.L.; Martin, H.D. Current Concepts Review: Evaluation and Management of Posterior Hip Pain. J. Am. Acad. Orthop. Surg. 2018, 26, 597–609. [Google Scholar] [CrossRef]
- Hernando, M.F.; Cerezal, L.; Pérez-Carro, L.; Canga, A.; González, R.P. Evaluation and Management of Ischiofemoral Impingement: A Pathophysiologic, Radiologic, and Therapeutic Approach to a Complex Diagnosis. Skeletal Radiol. 2016, 45, 771–787. [Google Scholar] [CrossRef]
- Degen, R.M. Proximal Hamstring Injuries: Management of Tendinopathy and Avulsion Injuries. Curr. Rev. Musculoskelet. Med. 2019, 12, 138–146. [Google Scholar] [CrossRef]
- McDevitt, A.W.; Young, J.L.; Cleland, J.A.; Hiefield, P.; Snodgrass, S.J. Physical Therapy Interventions Used to Treat Individuals with Biceps Tendinopathy: A Scoping Review. Braz. J. Phys. Ther. 2024, 28, 100586. [Google Scholar] [CrossRef]
- Burkhart, S.S.; Barth, J.R.H.; Richards, D.P.; Zlatkin, M.B.; Larsen, M. Arthroscopic Repair of Massive Rotator Cuff Tears With Stage 3 and 4 Fatty Degeneration. Arthrosc. J. Arthrosc. Relat. Surg. 2007, 23, 347–354. [Google Scholar] [CrossRef]
- Virk, M.S.; Cole, B.J. Proximal Biceps Tendon and Rotator Cuff Tears. Clin. Sports Med. 2016, 35, 153–161. [Google Scholar] [CrossRef]
- Abraham, V.T.; Tan, B.H.M.; Kumar, V.P. Systematic Review of Biceps Tenodesis: Arthroscopic Versus Open. Arthrosc. J. Arthrosc. Relat. Surg. 2016, 32, 365–371. [Google Scholar] [CrossRef]
- Friedman, D.J.; Dunn, J.C.; Higgins, L.D.; Warner, J.J.P. Proximal Biceps Tendon: Injuries and Management. Sports Med. Arthrosc. Rev. 2008, 16, 162–169. [Google Scholar] [CrossRef]
- Shemesh, S.S.; Moucha, C.S.; Keswani, A.; Maher, N.A.; Chen, D.; Bronson, M.J. Trochanteric Bursitis Following Primary Total Hip Arthroplasty: Incidence, Predictors, and Treatment. J. Arthroplasty 2018, 33, 1205–1209. [Google Scholar] [CrossRef]
- Ardebol, J.; Ghayyad, K.; Pak, T.; Galasso, L.; Noble, M.; Kiliç, A.Ī.; Gonzalez-Morgado, D.; Menendez, M.E.; Denard, P.J. Long Head of Biceps Tendon Management in the Setting of Massive Rotator Cuff Tears. JSES Rev. Rep. Tech. 2024, 4, 662–667. [Google Scholar] [CrossRef]
- Ali, M.; Oderuth, E.; Atchia, I.; Malviya, A. The Use of Platelet-Rich Plasma in the Treatment of Greater Trochanteric Pain Syndrome: A Systematic Literature Review. J. Hip Preserv. Surg. 2018, 5, 209–219. [Google Scholar] [CrossRef]
- Ahn, J.; Kim, J.-H.; Shin, S.-J. Arthroscopic Suprapectoral Biceps Tenodesis Provided Earlier Shoulder Function Restoration Compared with Open Subpectoral Biceps Tenodesis during the Recovery Phase. J. Shoulder Elbow Surg. 2024, 33, 678–685. [Google Scholar] [CrossRef]
- Lustenberger, D.P.; Ng, V.Y.; Best, T.M.; Ellis, T.J. Efficacy of Treatment of Trochanteric Bursitis: A Systematic Review. Clin. J. Sport Med. 2011, 21, 447–453. [Google Scholar] [CrossRef]
- Giai Via, R.; Elzeiny, A.; Bufalo, M.; Massè, A.; Giachino, M. Endoscopic Management of Greater Trochanteric Pain Syndrome (GTPS): A Comprehensive Systematic Review. Eur. J. Orthop. Surg. Traumatol. 2024, 34, 3385–3394. [Google Scholar] [CrossRef]
- Alghamdi, A.A.; Althaqafi, R.M.M.; Babaier, Y.H.; Singer, M.S.; Assiri, S.; Aljohani, B.; Alghamdi, F.A.; Abdel Badie, A. Clinical Outcomes of Long Head Biceps Tendinitis Treatment by a Semitenodesis Technique. Cureus 2022. [Google Scholar] [CrossRef]
- Le, D.T.; Shah, S. Greater Trochanteric Bursa Injection. In StatPearls; StatPearls Publishing: Treasure Island (FL), 2024. [Google Scholar]
- Shbeeb, M.I.; Matteson, E.L. Trochanteric Bursitis (Greater Trochanter Pain Syndrome). Mayo Clin. Proc. 1996, 71, 565–569. [Google Scholar] [CrossRef]
- Colangelo, M.T. Polynucleotide Biogel Enhances Tissue Repair, Matrix Deposition and Organization. J. Biol. Regul. Homeost. AGENTS 2021, 35. [Google Scholar] [CrossRef]
- Vanelli, R.; Costa, P.; Rossi, S.M.P.; Benazzo, F. Efficacy of Intra-Articular Polynucleotides in the Treatment of Knee Osteoarthritis: A Randomized, Double-Blind Clinical Trial. Knee Surg. Sports Traumatol. Arthrosc. 2010, 18, 901–907. [Google Scholar] [CrossRef]
- Cavallini, M.; Bartoletti, E.; Maioli, L.; Massirone, A.; Pia Palmieri, I.; Papagni, M.; Priori, M.; Trocchi, G. ; As Members of The Polynucleotides HPTTM Priming Board, Collegio Italiano delle Società Scientifiche di Medicina Estetica (Italian College of the Aesthetic Medicine Scientific Societies) — SIME, AGORÀ, SIES Consensus Report on the Use of PN-HPTTM (Polynucleotides Highly Purified Technology) in Aesthetic Medicine. J. Cosmet. Dermatol. 2021, 20, 922–928. [Google Scholar] [CrossRef]
- Park, K.Y.; Seok, J.; Rho, N.K.; Kim, B.J.; Kim, M.N. Long-Chain Polynucleotide Filler for Skin Rejuvenation: Efficacy and Complications in Five Patients: Efficacy & Complications of Polynucleotide Filler. Dermatol. Ther. 2016, 29, 37–40. [Google Scholar] [CrossRef]
- Giarratana, L.S.; Marelli, B.M.; Crapanzano, C.; De Martinis, S.E.; Gala, L.; Ferraro, M.; Marelli, N.; Albisetti, W. A Randomized Double-Blind Clinical Trial on the Treatment of Knee Osteoarthritis: The Efficacy of Polynucleotides Compared to Standard Hyaluronian Viscosupplementation. The Knee 2014, 21, 661–668. [Google Scholar] [CrossRef]
- Richards, J.A.; Haralson, W.G.; Woodard, D.R.; Nuelle, C.W.; DeFroda, S.F. Arthroscopic Suprapectoral Biceps Tenodesis: A Knotless, Onlay, All-Suture Anchor Technique. Arthrosc. Tech. 2024, 103202. [Google Scholar] [CrossRef]
- Cenzato, N.; Crispino, R.; Russillo, A.; Del Fabbro, M.; Tartaglia, G.M. Clinical Effectiveness of Polynucleotide TMJ Injection Compared with Physiotherapy: A 3-Month Randomised Clinical Trial. Br. J. Oral Maxillofac. Surg. 2024, 62, 807–812. [Google Scholar] [CrossRef]
- Giarratana, L.S.; Marelli, B.M.; Crapanzano, C.; De Martinis, S.E.; Gala, L.; Ferraro, M.; Marelli, N.; Albisetti, W. A Randomized Double-Blind Clinical Trial on the Treatment of Knee Osteoarthritis: The Efficacy of Polynucleotides Compared to Standard Hyaluronian Viscosupplementation. The Knee 2014, 21, 661–668. [Google Scholar] [CrossRef]
- A. Migliore, R. Graziano,L.S.M. Martin, A. Sorbino, M. Raichi and G. Boni Three-Years Management of Hip Osteoarthritis with Intra-Articular Polynucleotide: A Real-Life Cohort Retrospective Study. Three-Years Manag. Hip Osteoarthr. Intra-Articul. Polynucleotide Real-Life Cohort Retrosp. Study 2021, 34, 1189–1194. [CrossRef]
- Ancuța Zazgyva, István Gergely, Octav Marius Russu, Ciprian Roman,; Tudor Sorin Pop Polynucleotides Versus Sodium Hyaluronate In The Local Treatment Of Knee Osteoarthritis. Ancuța Zazgyva1 István Gergely2 Octav Marius Russu3 Ciprian Roman4 Tudor Sorin Pop5 2013, 2, 260–263.
- Di Stefano A, S.R. Viscosupplementation with Hyaluronic Acid or Polynucleotides: Results and Hypothesis for Condro-Synchronization. J. Clin. Trials 2014, 04. [Google Scholar] [CrossRef]
- M. Guelfi, R. Fabbrini and MG. Guelfi Intra-Articular Treatment of Knee and Ankle Osteoarthritis with Polynucleotides: Prospective Case Record Cohort vs Historical Controls. Intra-Articul. Treat. Knee Ankle Osteoarthr. Polynucleotides Prospect. Case Rec. Cohort Vs Hist. Controls 2020, 34, 1949–1953. [CrossRef]
Figure 2.
Mutli-pannel image concerning the anagraphical data of patients population. Graph 1 – Geder distribution; Graph 2 – Age distribution; Graph 3 – BMI – calculation; Graph 4 – Pathologies distribution. Legends: BT= Biceps Tendinitis (13 cases); HB= Hip Borsitis (31cases); Others= Miscellanea of other patologies; Epicondilitis (one case); Epitrocletis (one case); Latissimus Dorsi (one case); Plantar Fascitis (one case). One subject had two patologies. The ANOVA Analyses doesn’t revealed significant differences among the groups reported in graph 2 and3 (p=ns).
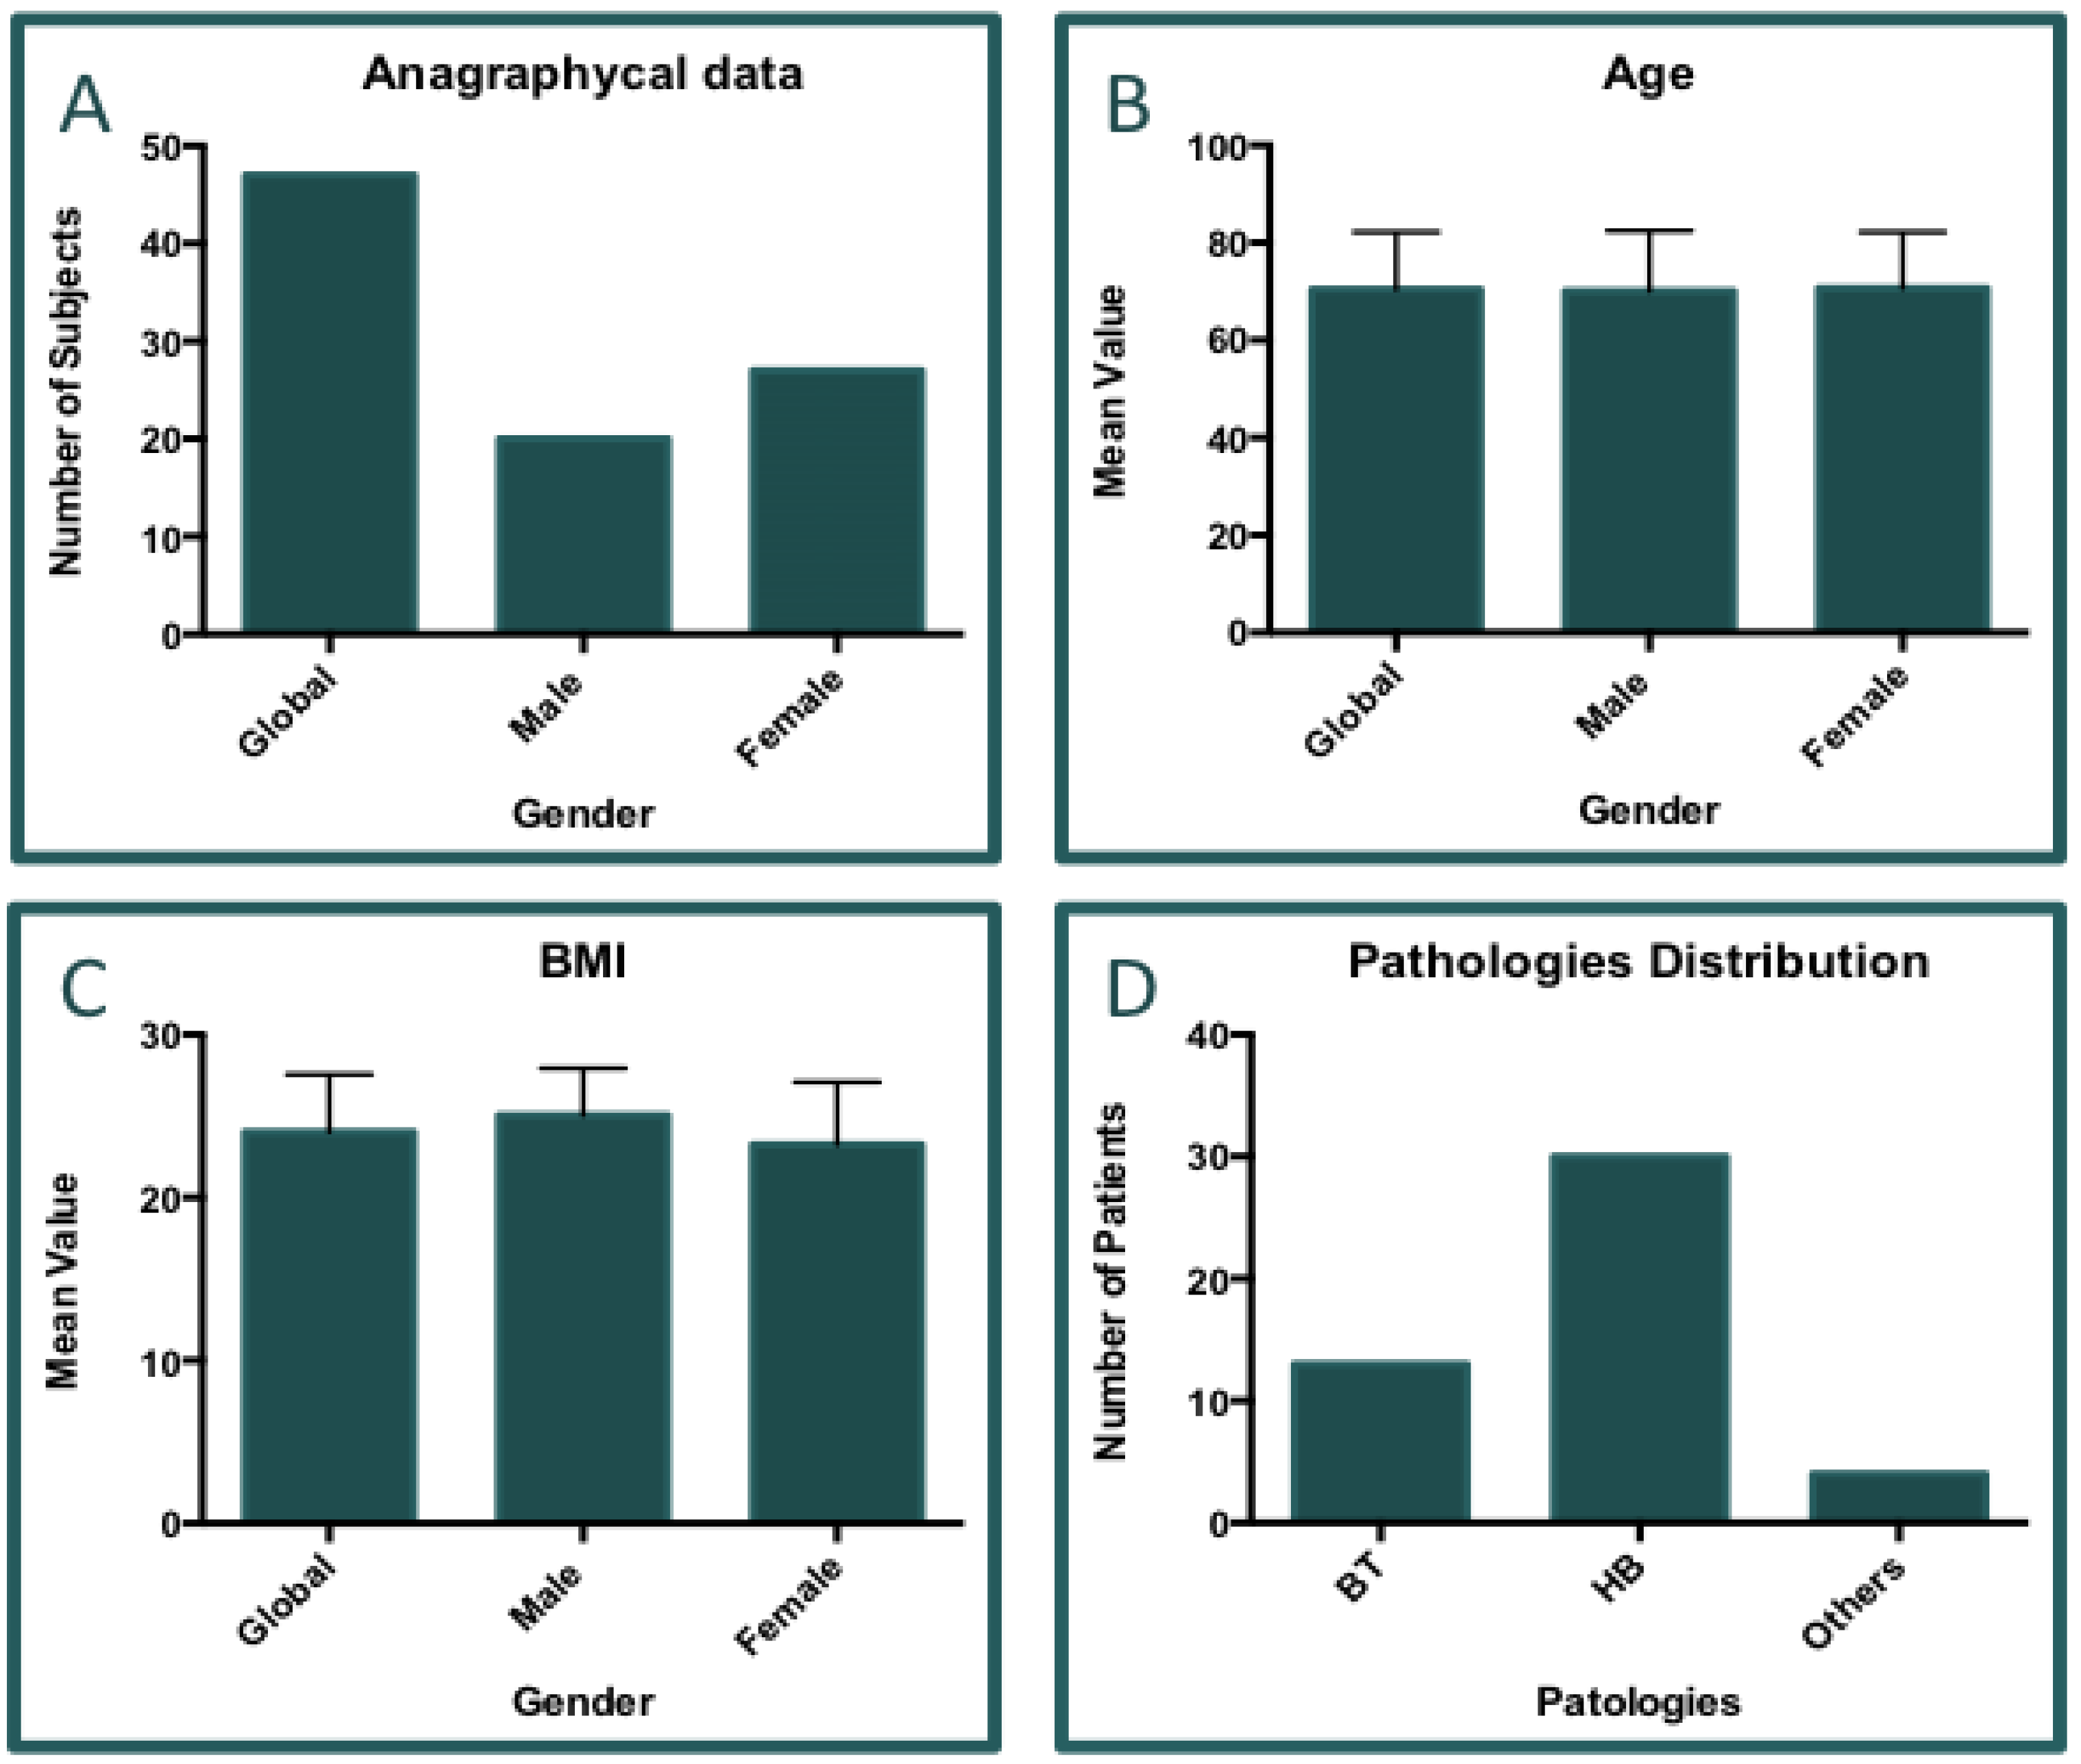
Figure 3.
Analisys of pathological condition treatments. Above: Graph bar concerning the number distribution of pathologies. Below: table reporting the percentages of accomplishement of treatment scheme. A total of 48 pathological sites were reported. One subject had bi-lateral HB.
Figure 3.
Analisys of pathological condition treatments. Above: Graph bar concerning the number distribution of pathologies. Below: table reporting the percentages of accomplishement of treatment scheme. A total of 48 pathological sites were reported. One subject had bi-lateral HB.
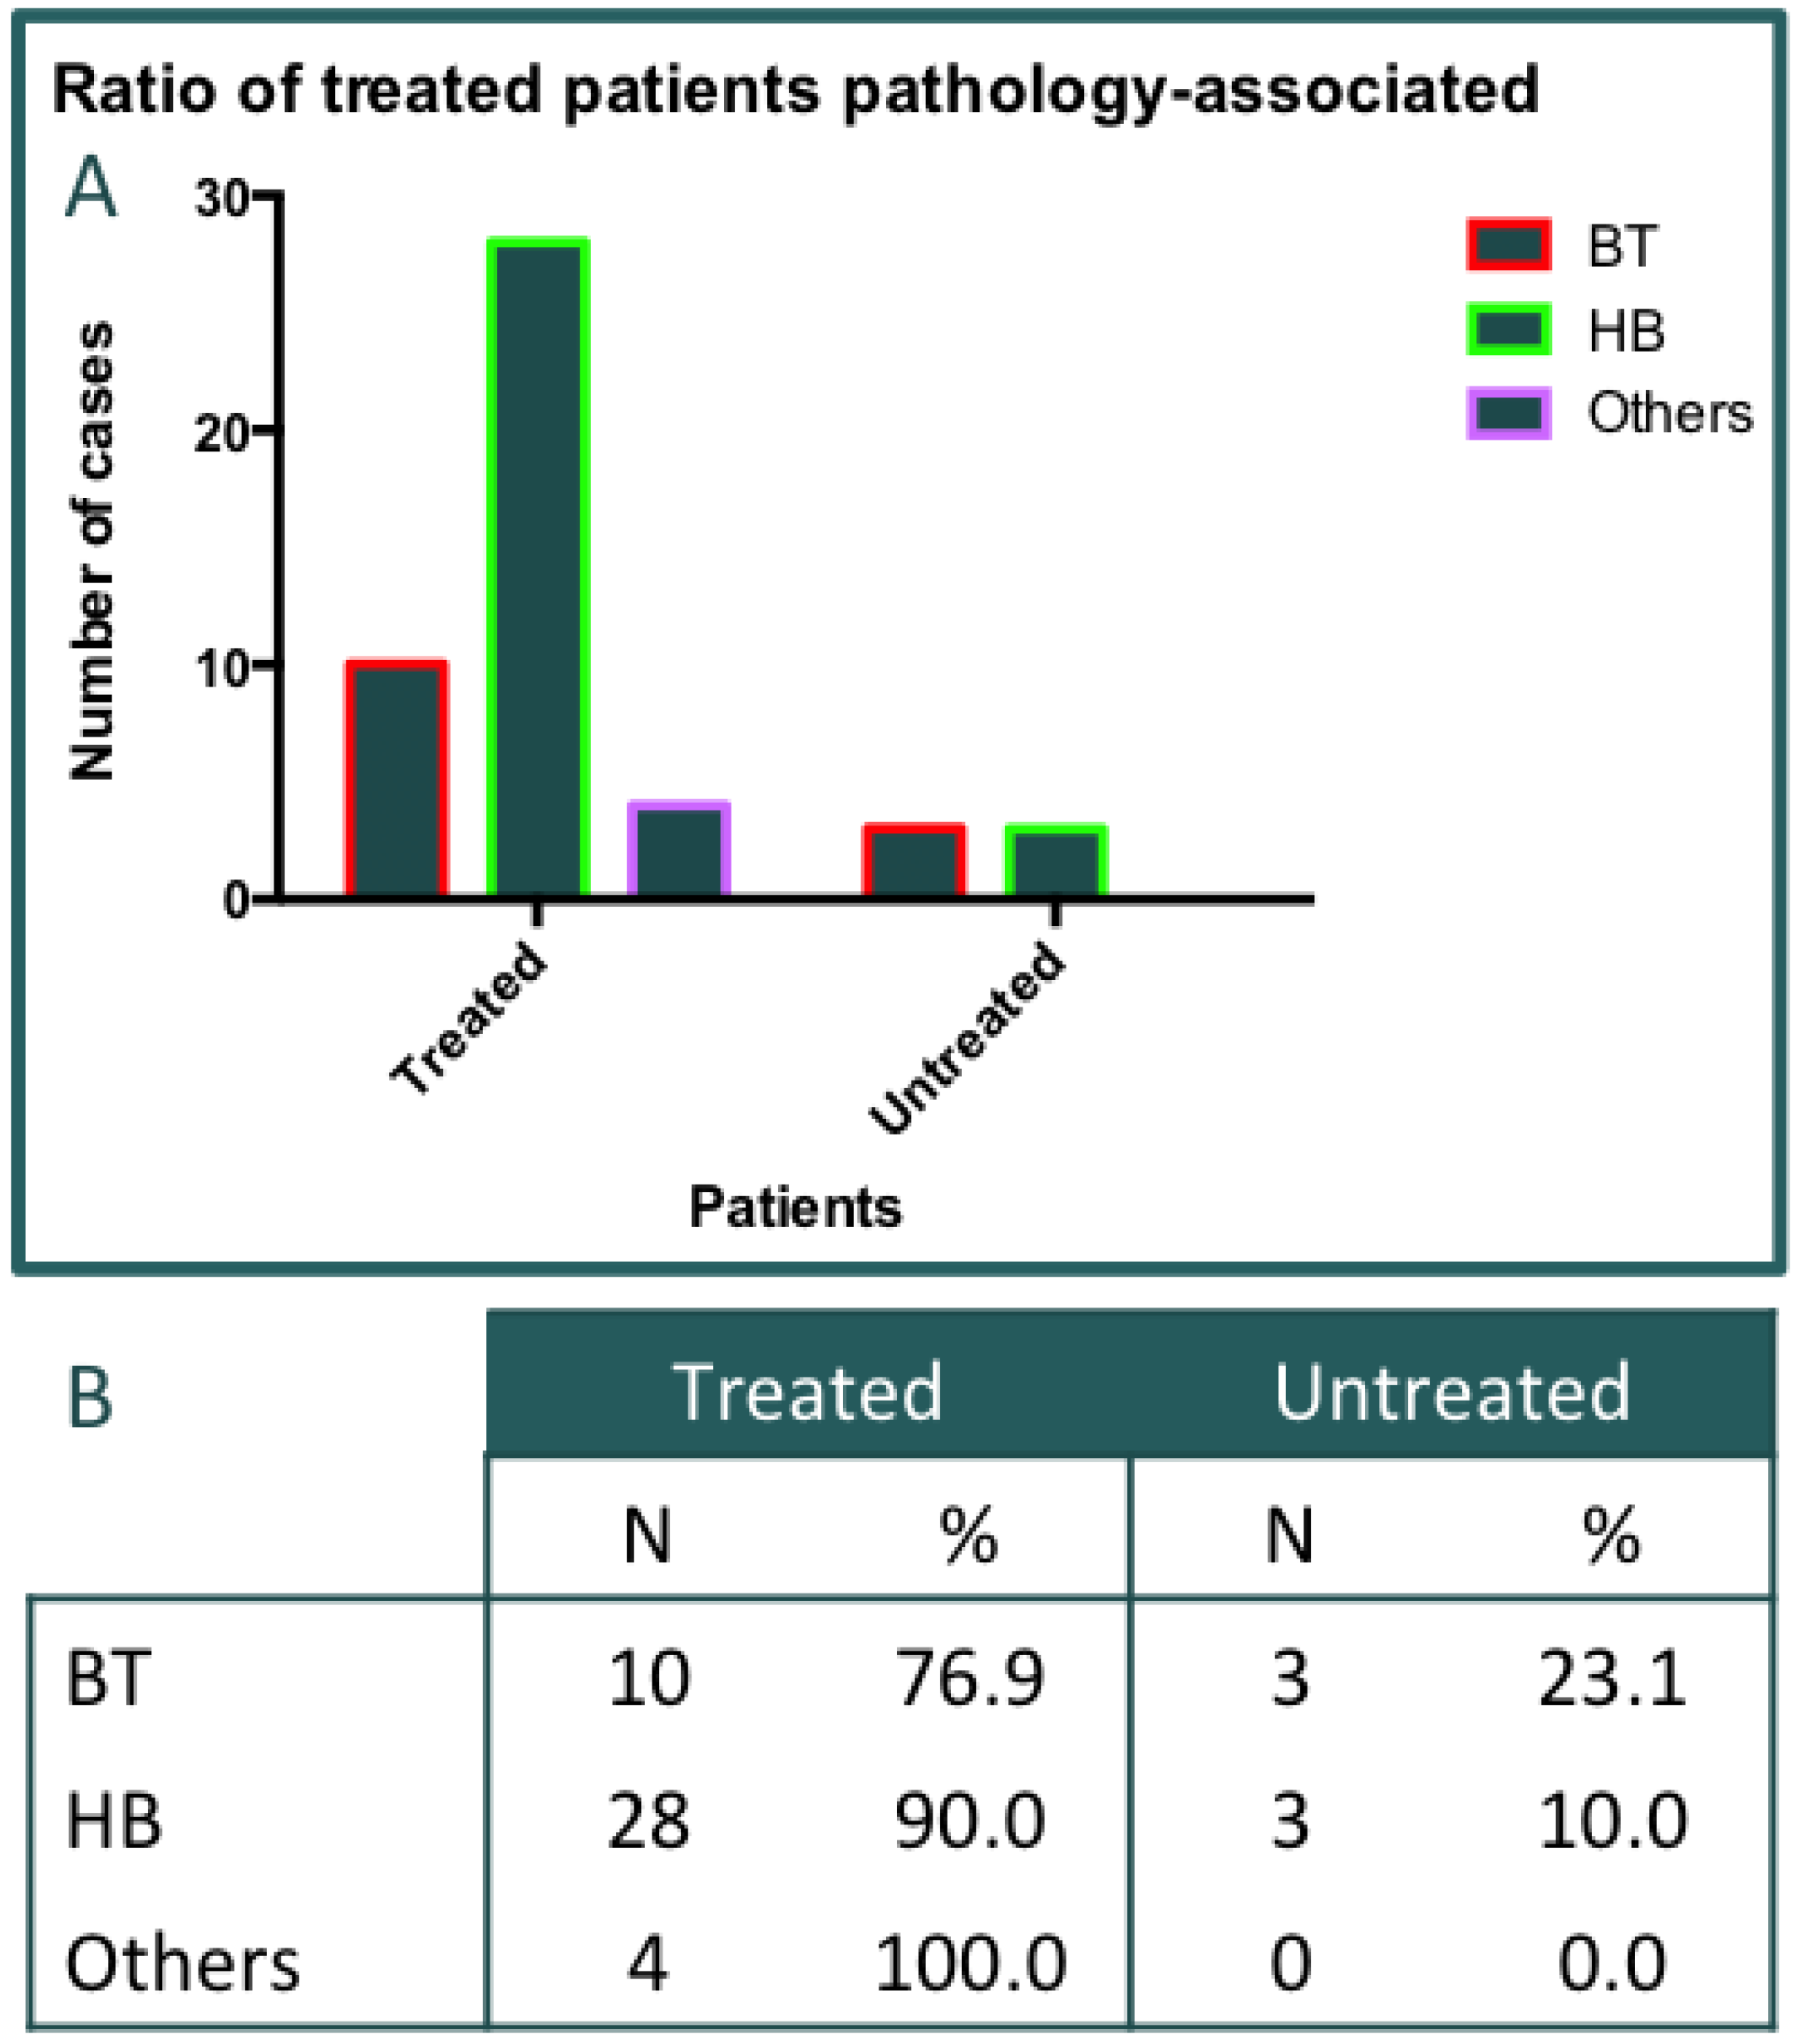
Figure 4.
Missed data. Graph A) The complete database was obtained from physicians for 41 out of 47 subjects collected. Here, are reported the missing data per visit. Graph B) Report the numeber of subject with incomplete data. Six subjects was escluded from the clnical data analyses. Five records was absent at visit T2, while, one record was absent at visit T3.
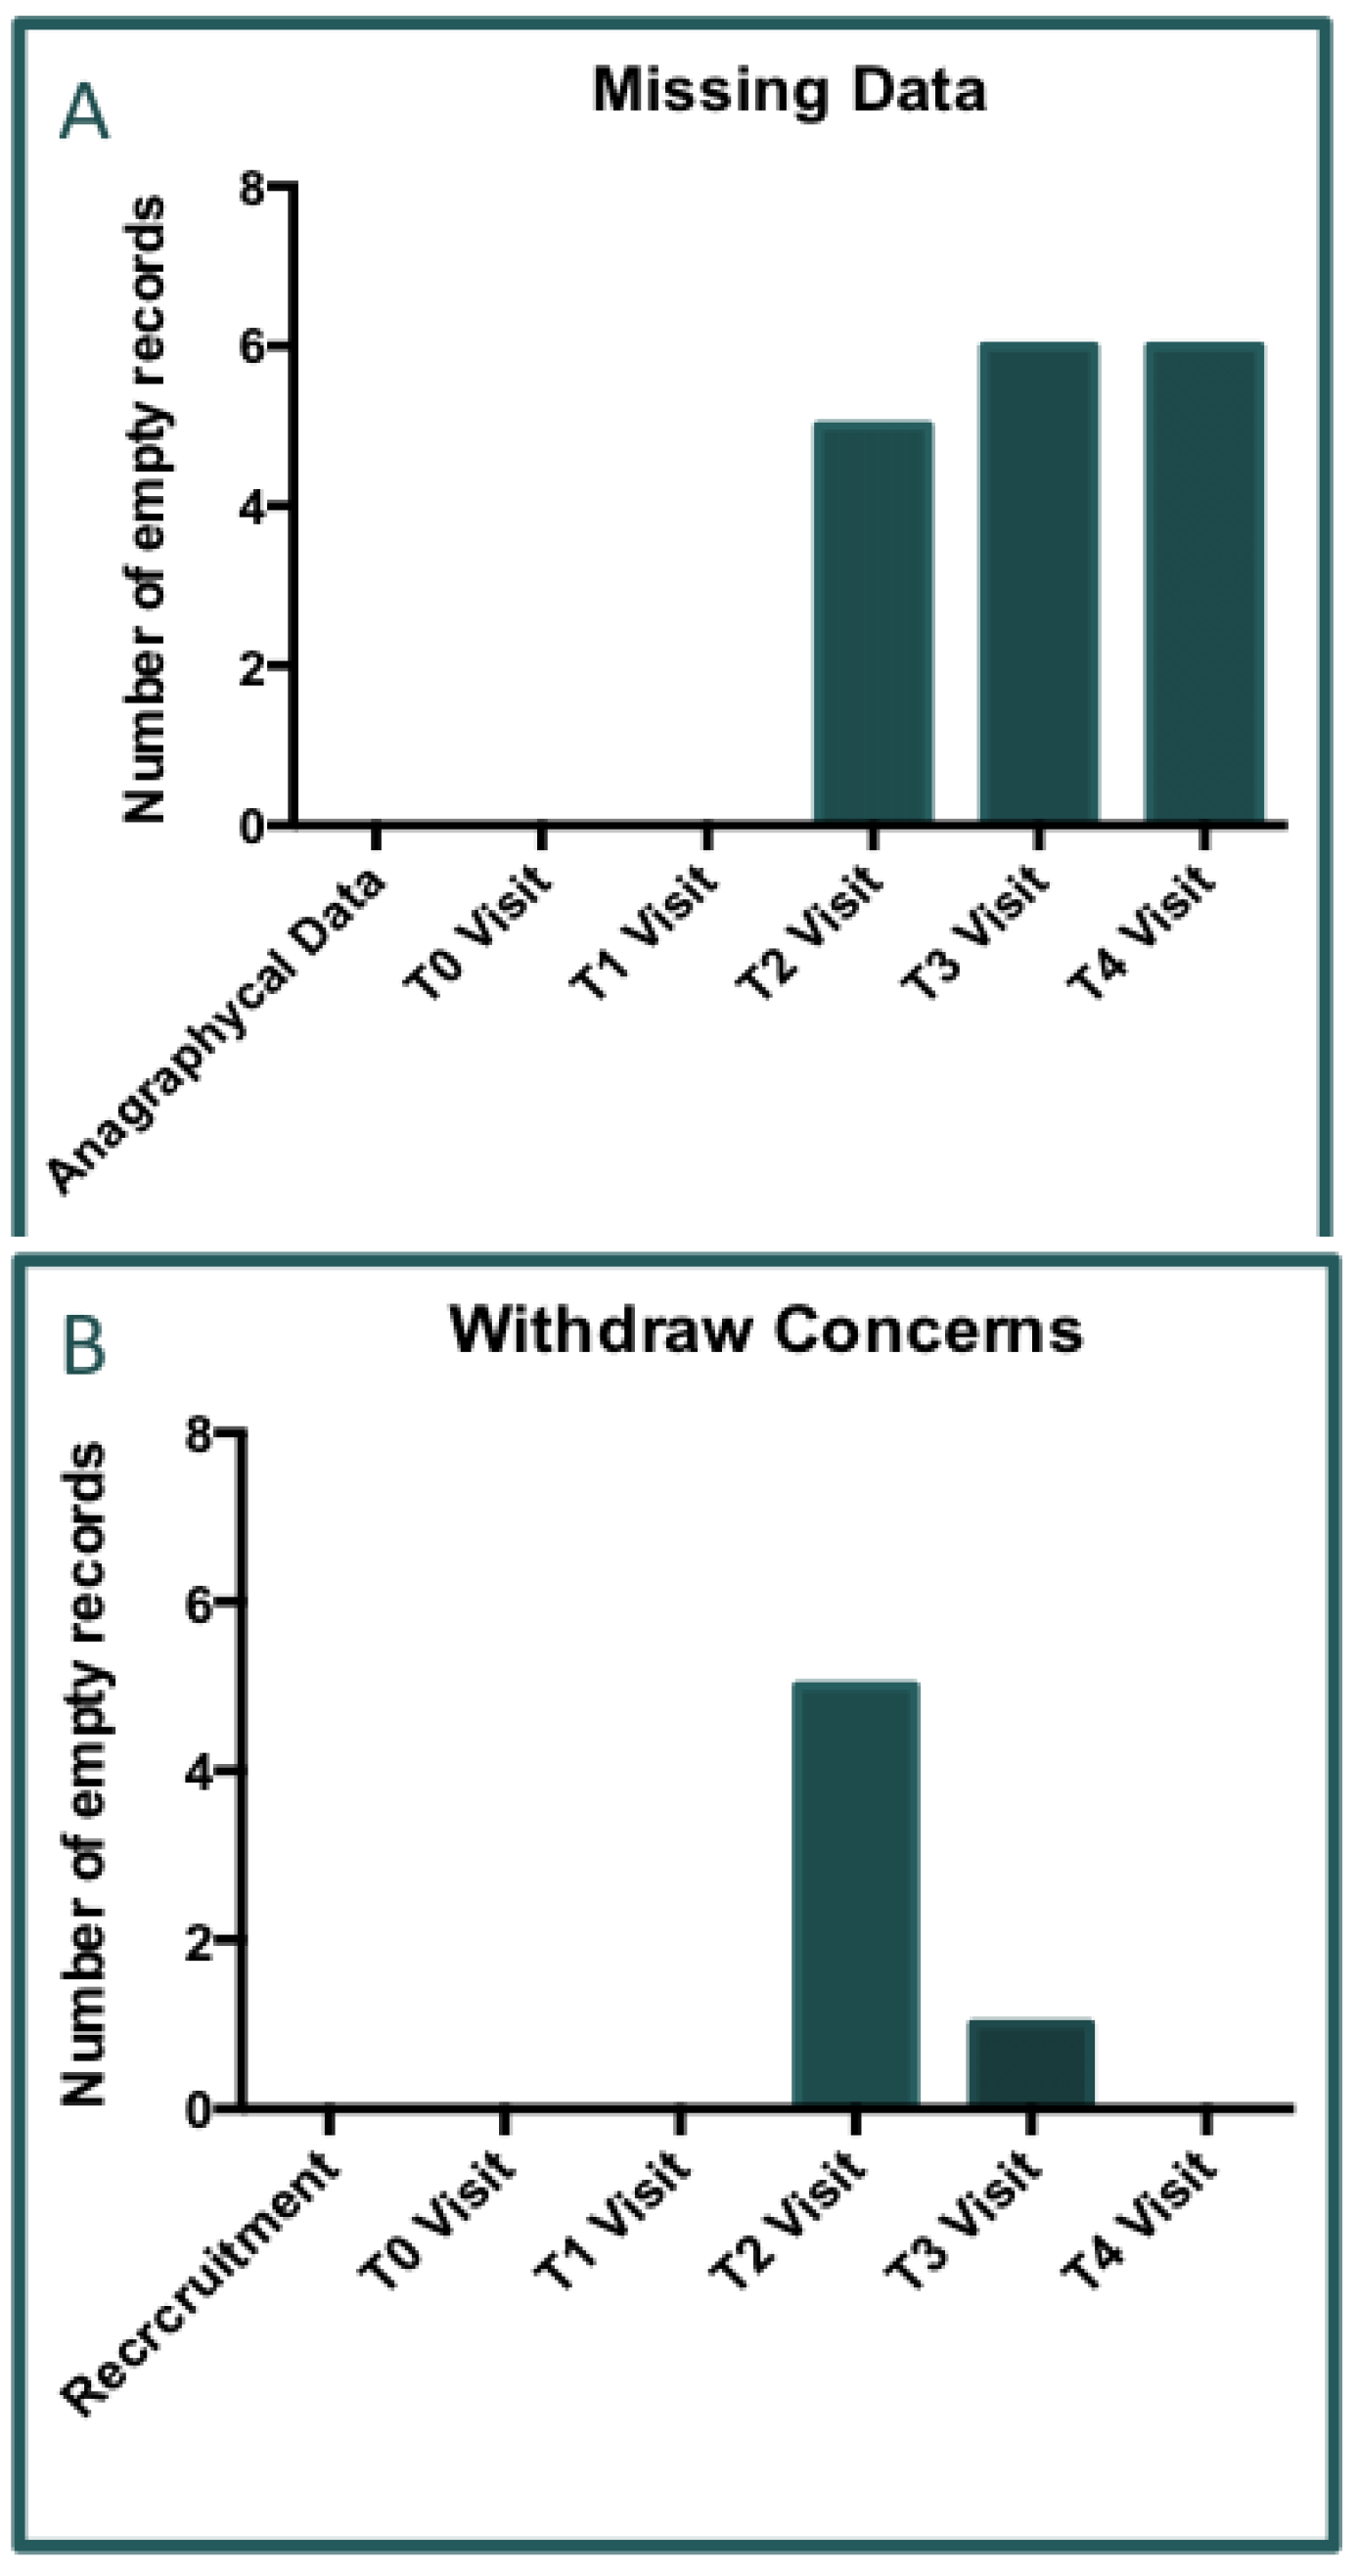
Figure 5.
Graph A) VAS analyses for pain (p>0.05) revealed there are not significant differences among the distribution of gender inside the population of the study. Graph B) VAS analyses for functional impairment (p>0.05). By observing the results obtained from pain and functional impairment (mesured by VAS score) we ascertained that no statistical differences between males and females are confirmed. Indeed, the present data are suggesting that the future differences in therm of VAS score reported from the subjects might be really addressed to the general condition from the patient and do not influenced by gender, age or BMI.
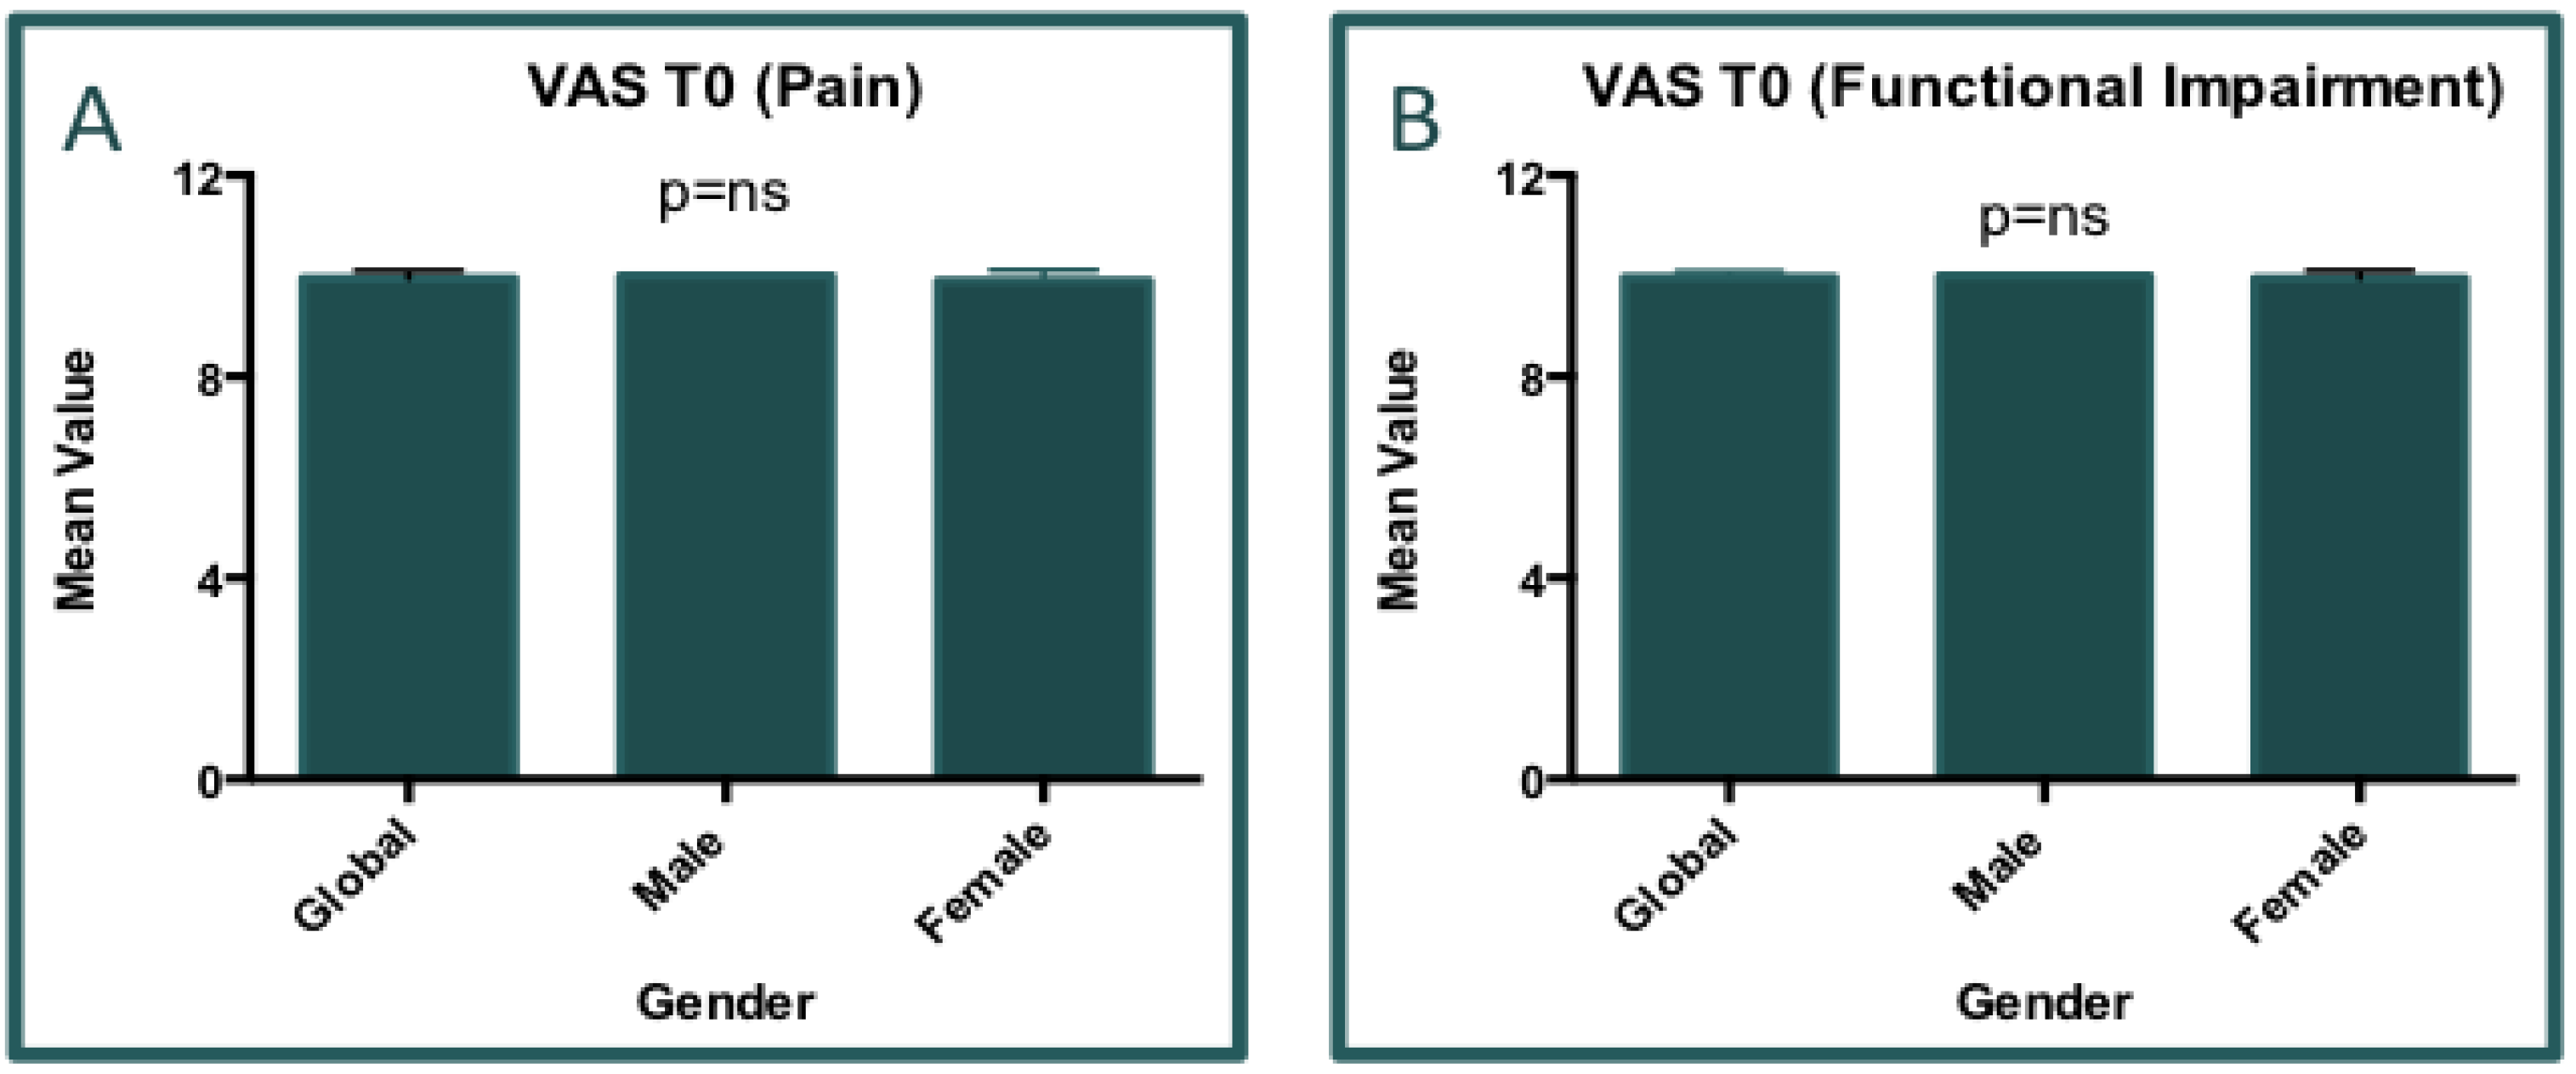
Figure 6.
Graph A) VAS analyses for pain. Delta= 8.357±1.429 (Final Visit T4 and Delta value with respect to T0); p<0.0001. Graph B) VAS analyses for functional impairment. Delta= 8.357±1.429 (Final Visit T4 and Delta value with respect to T0); p<0.0001.
Figure 6.
Graph A) VAS analyses for pain. Delta= 8.357±1.429 (Final Visit T4 and Delta value with respect to T0); p<0.0001. Graph B) VAS analyses for functional impairment. Delta= 8.357±1.429 (Final Visit T4 and Delta value with respect to T0); p<0.0001.
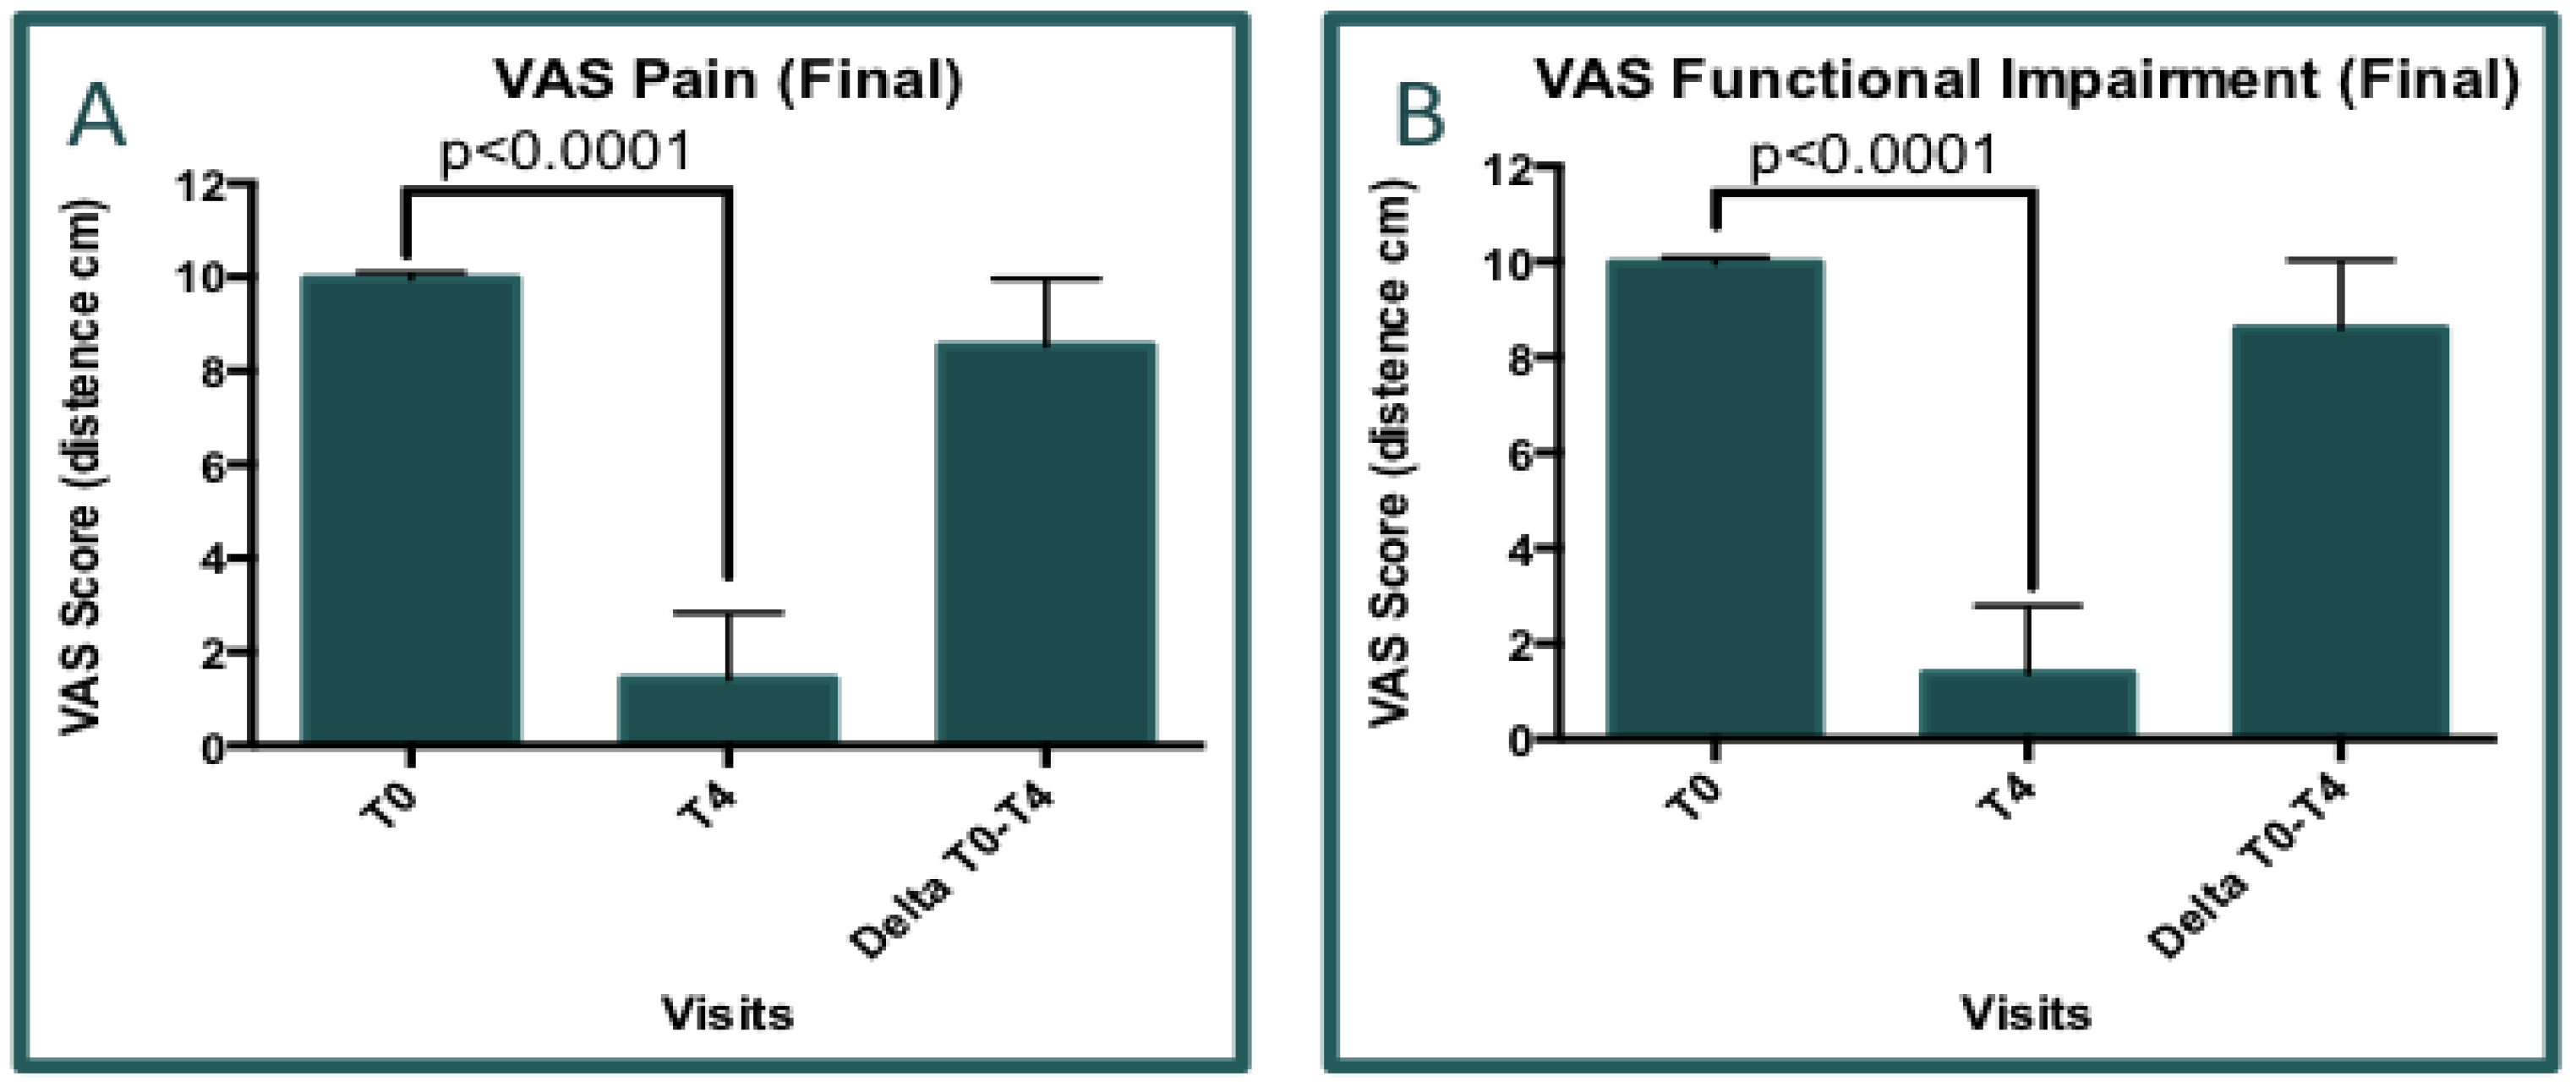
Figure 7.
Comulative analyses of VAS (pain and functional impairment) among all visits). Graphs A,B and C represent the statistical data for pain, while the graphs D,E and F represent the statitical data for functional impairment; Graphs A and D: Analyses and desciption of VAS (trends among the visits, p<0.0001); Graph B and E: Evaluation of VAS improvement (delta of VAS with respect to T0, p<0.0001); Graphs C and F: Calculation of VAS improvement velocity based on the of variation of VAS mean score per week.
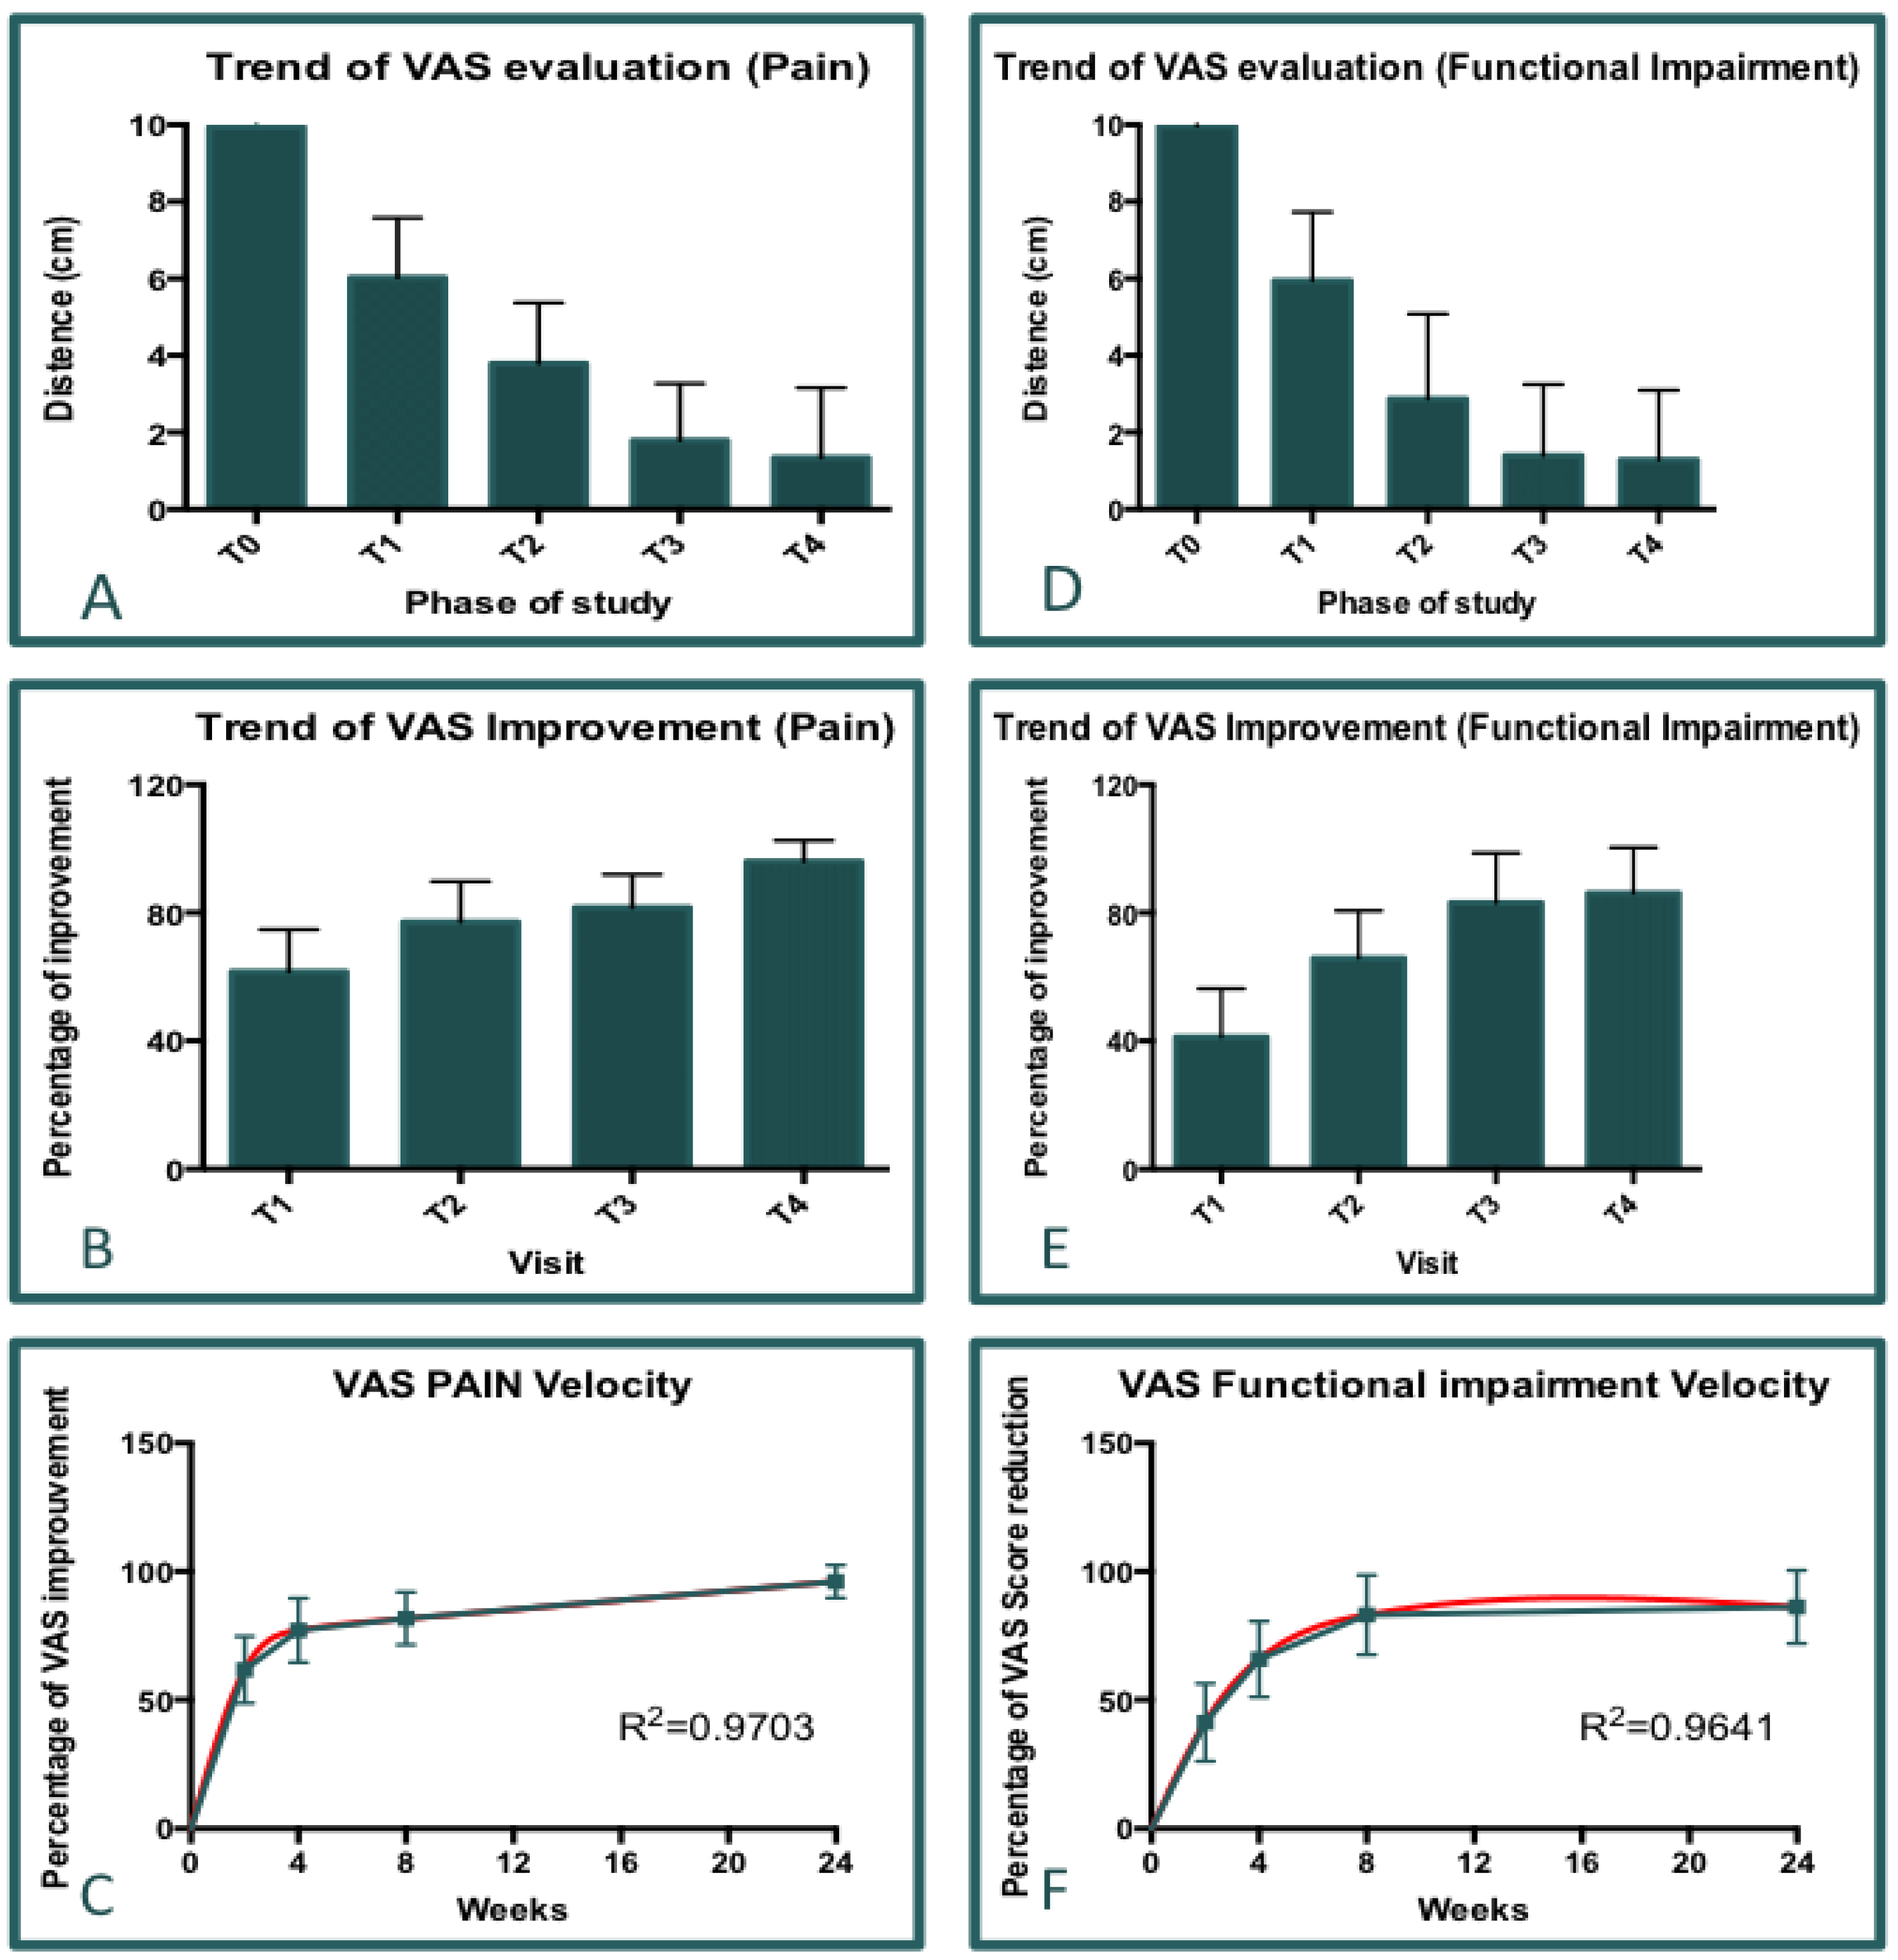
Figure 8.
Questionnaire results concerning the Patient Satisfaction (PS). A): The bar Graph shows the mean score value elaborated for each visit and the significative increasement of PS among the time. B): Plot graph representing the distribution of scoring. According the five levels of satisfaction the graph groups the patients voting “good” impression and “bad” impression. C): Graph of percentage; The graph in C reports the percentage of PS distribution among al visits.
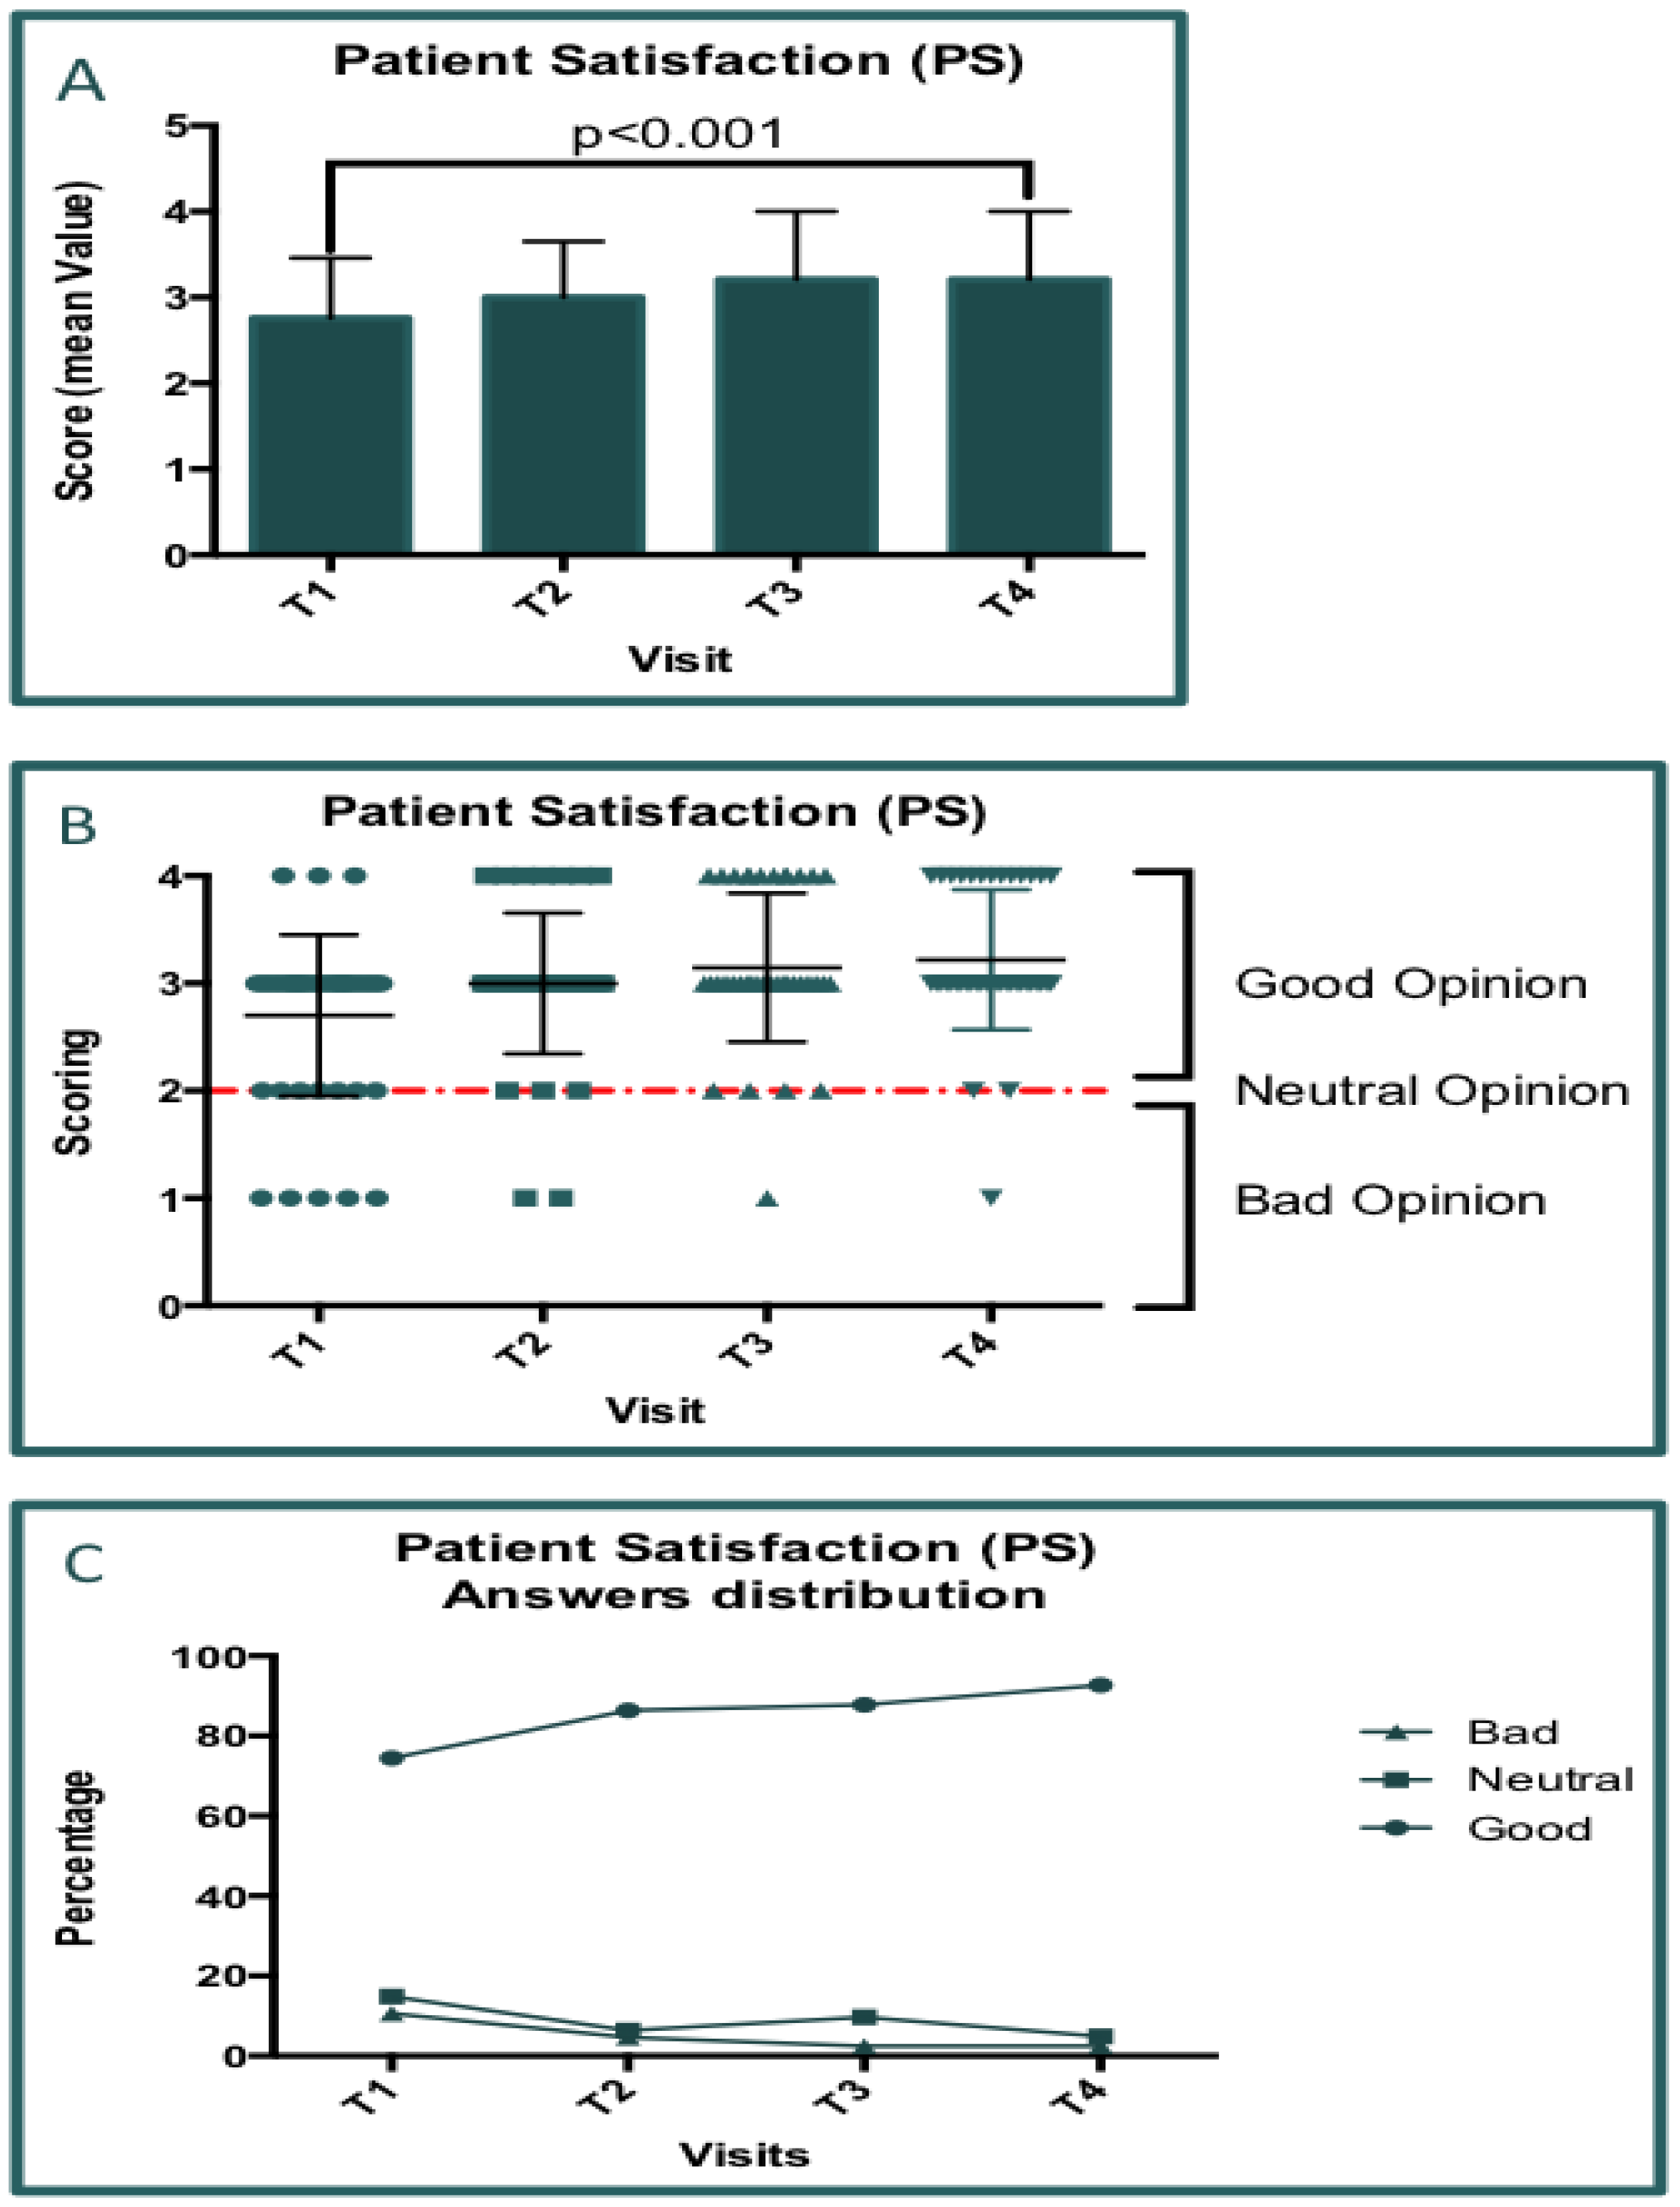
Figure 9.
Questionnaire results concerning the Clinical Global Impression-Improvement. A): The bar Graph shows the mean score value elaborated for each visit, and the significative increasement of CGI-I among the time. B): Plot graph representing the distribution of scoring. According the seven levels of satisfaction; the graph groups the patients voting “good” impression and “bad” impression. C): Graph of percentage; The Graph in C reports the percentage of (CGI-I) distribution among al visits.
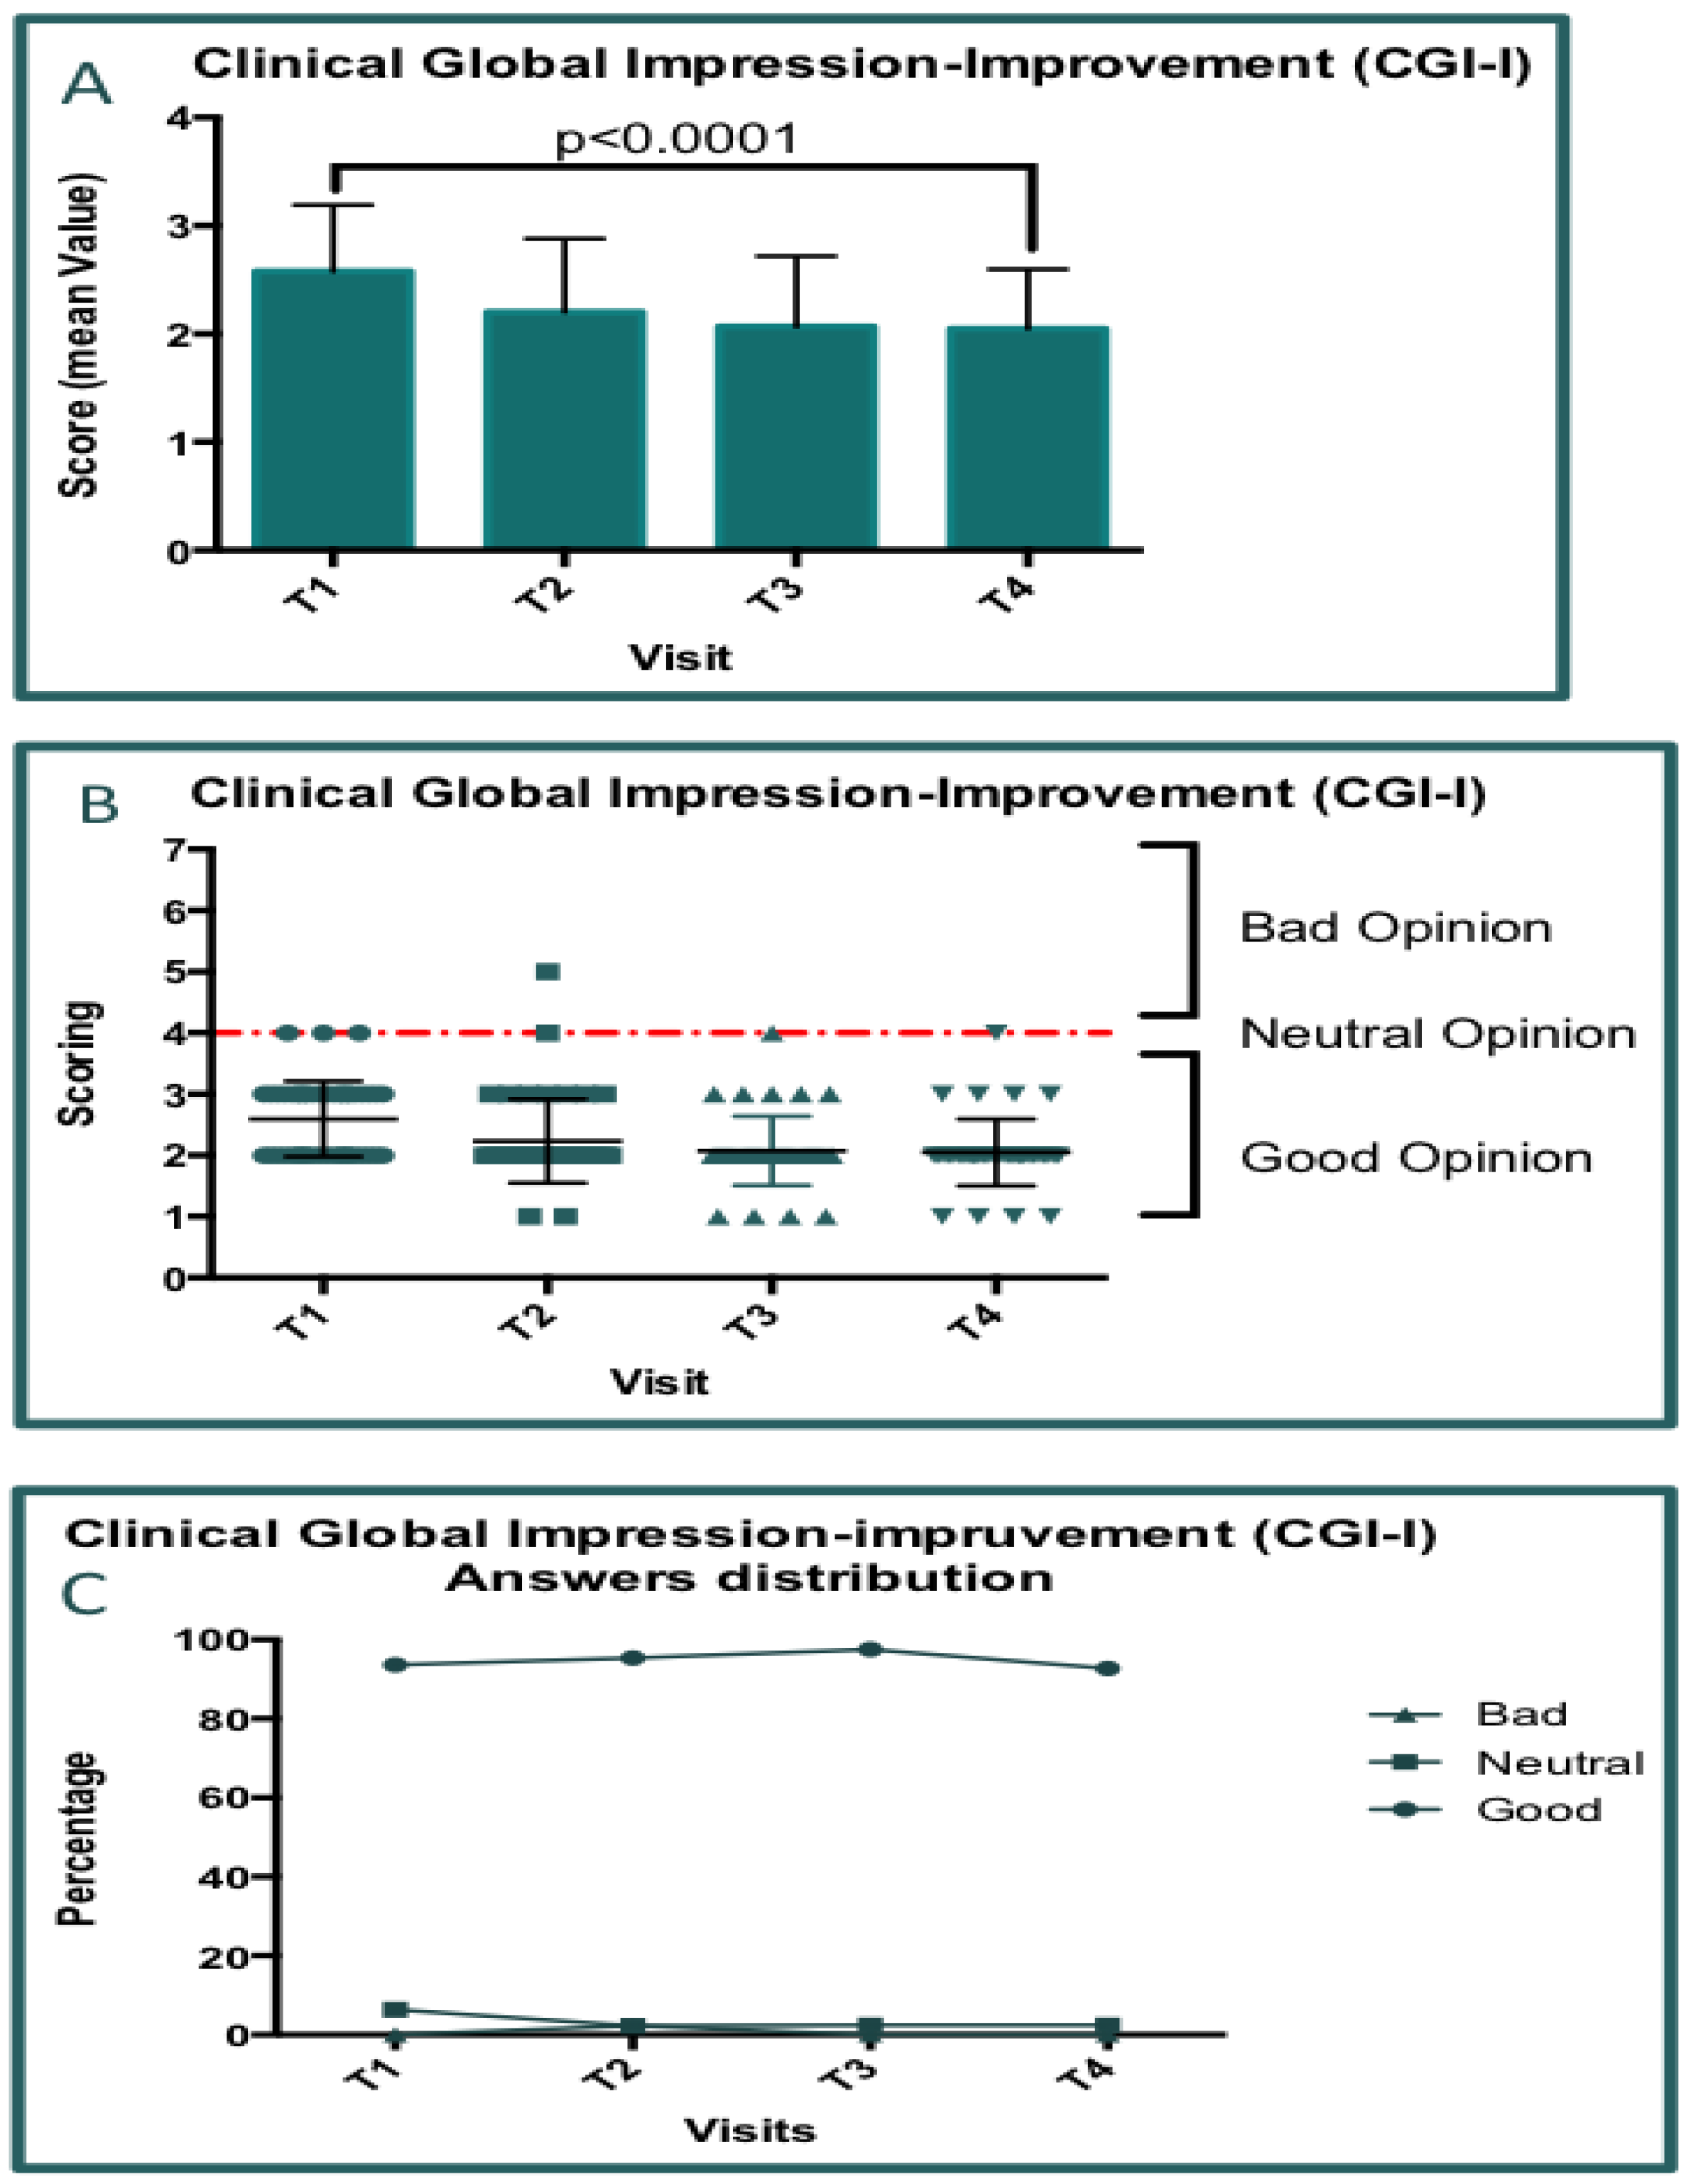
Figure 10.
Heatmap representation of VAS data concerning the pain analyses (p=0.0001). Top-left: singular interpretation of chromo-score for each visit. Top center: Delta evaluation between to convecutive visits; The width of bar means the delta value and. Green color is associated with positive changes (benefit). Red color is associated with a worst difference (minus). The global variation of VAS (Delta, Top-right column) is represente following the chromo-score bar (botton of pannel).
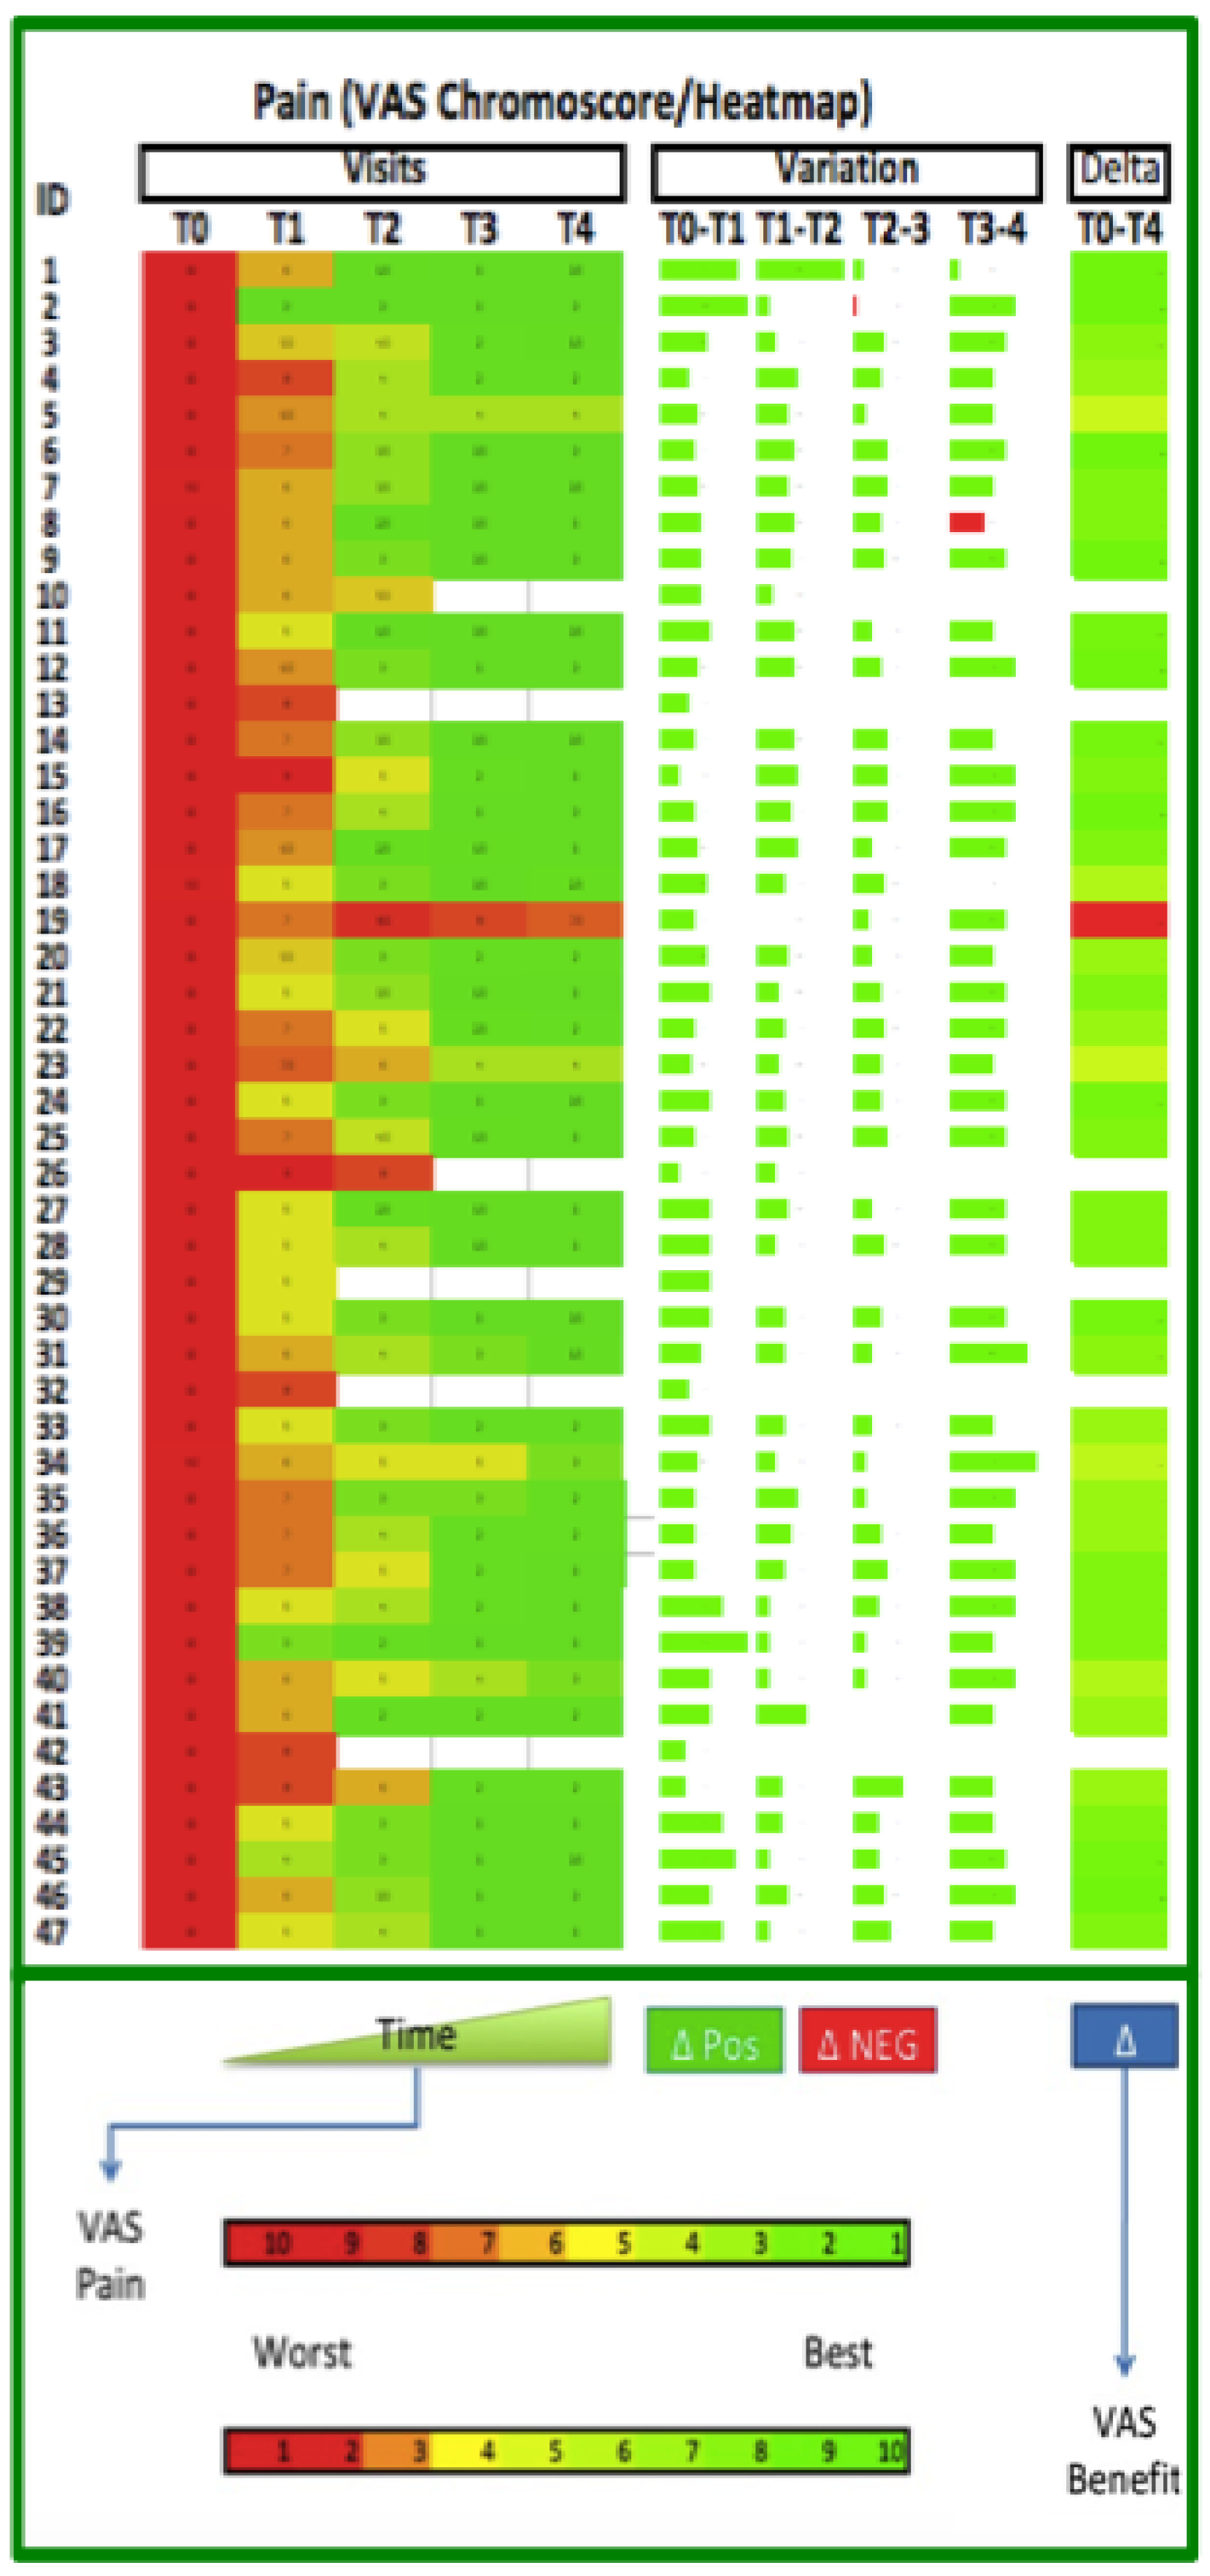
Figure 11.
Heatmap representation of VAS data concerning the functional impairment analyses (p=0.0001). Top-left: singular interpretation of chromo-score for each visit. Top center: Delta evaluation between to convecutive visits; The width of bar means the delta value and. Green color is associated with positive changes (benefit). Red color is associated with a worst difference (minus). The global variation of VAS (Delta, Top-right column) is represente following the chromo-score bar (botton of pannel).
Disclaimer/Publisher’s Note: The statements, opinions and data contained in all publications are solely those of the individual author(s) and contributor(s) and not of MDPI and/or the editor(s). MDPI and/or the editor(s) disclaim responsibility for any injury to people or property resulting from any ideas, methods, instructions or products referred to in the content. |
© 2024 by the authors. Licensee MDPI, Basel, Switzerland. This article is an open access article distributed under the terms and conditions of the Creative Commons Attribution (CC BY) license (http://creativecommons.org/licenses/by/4.0/).
Copyright: This open access article is published under a Creative Commons CC BY 4.0 license, which permit the free download, distribution, and reuse, provided that the author and preprint are cited in any reuse.


