
Submitted:
21 November 2024
Posted:
25 November 2024
You are already at the latest version
Abstract
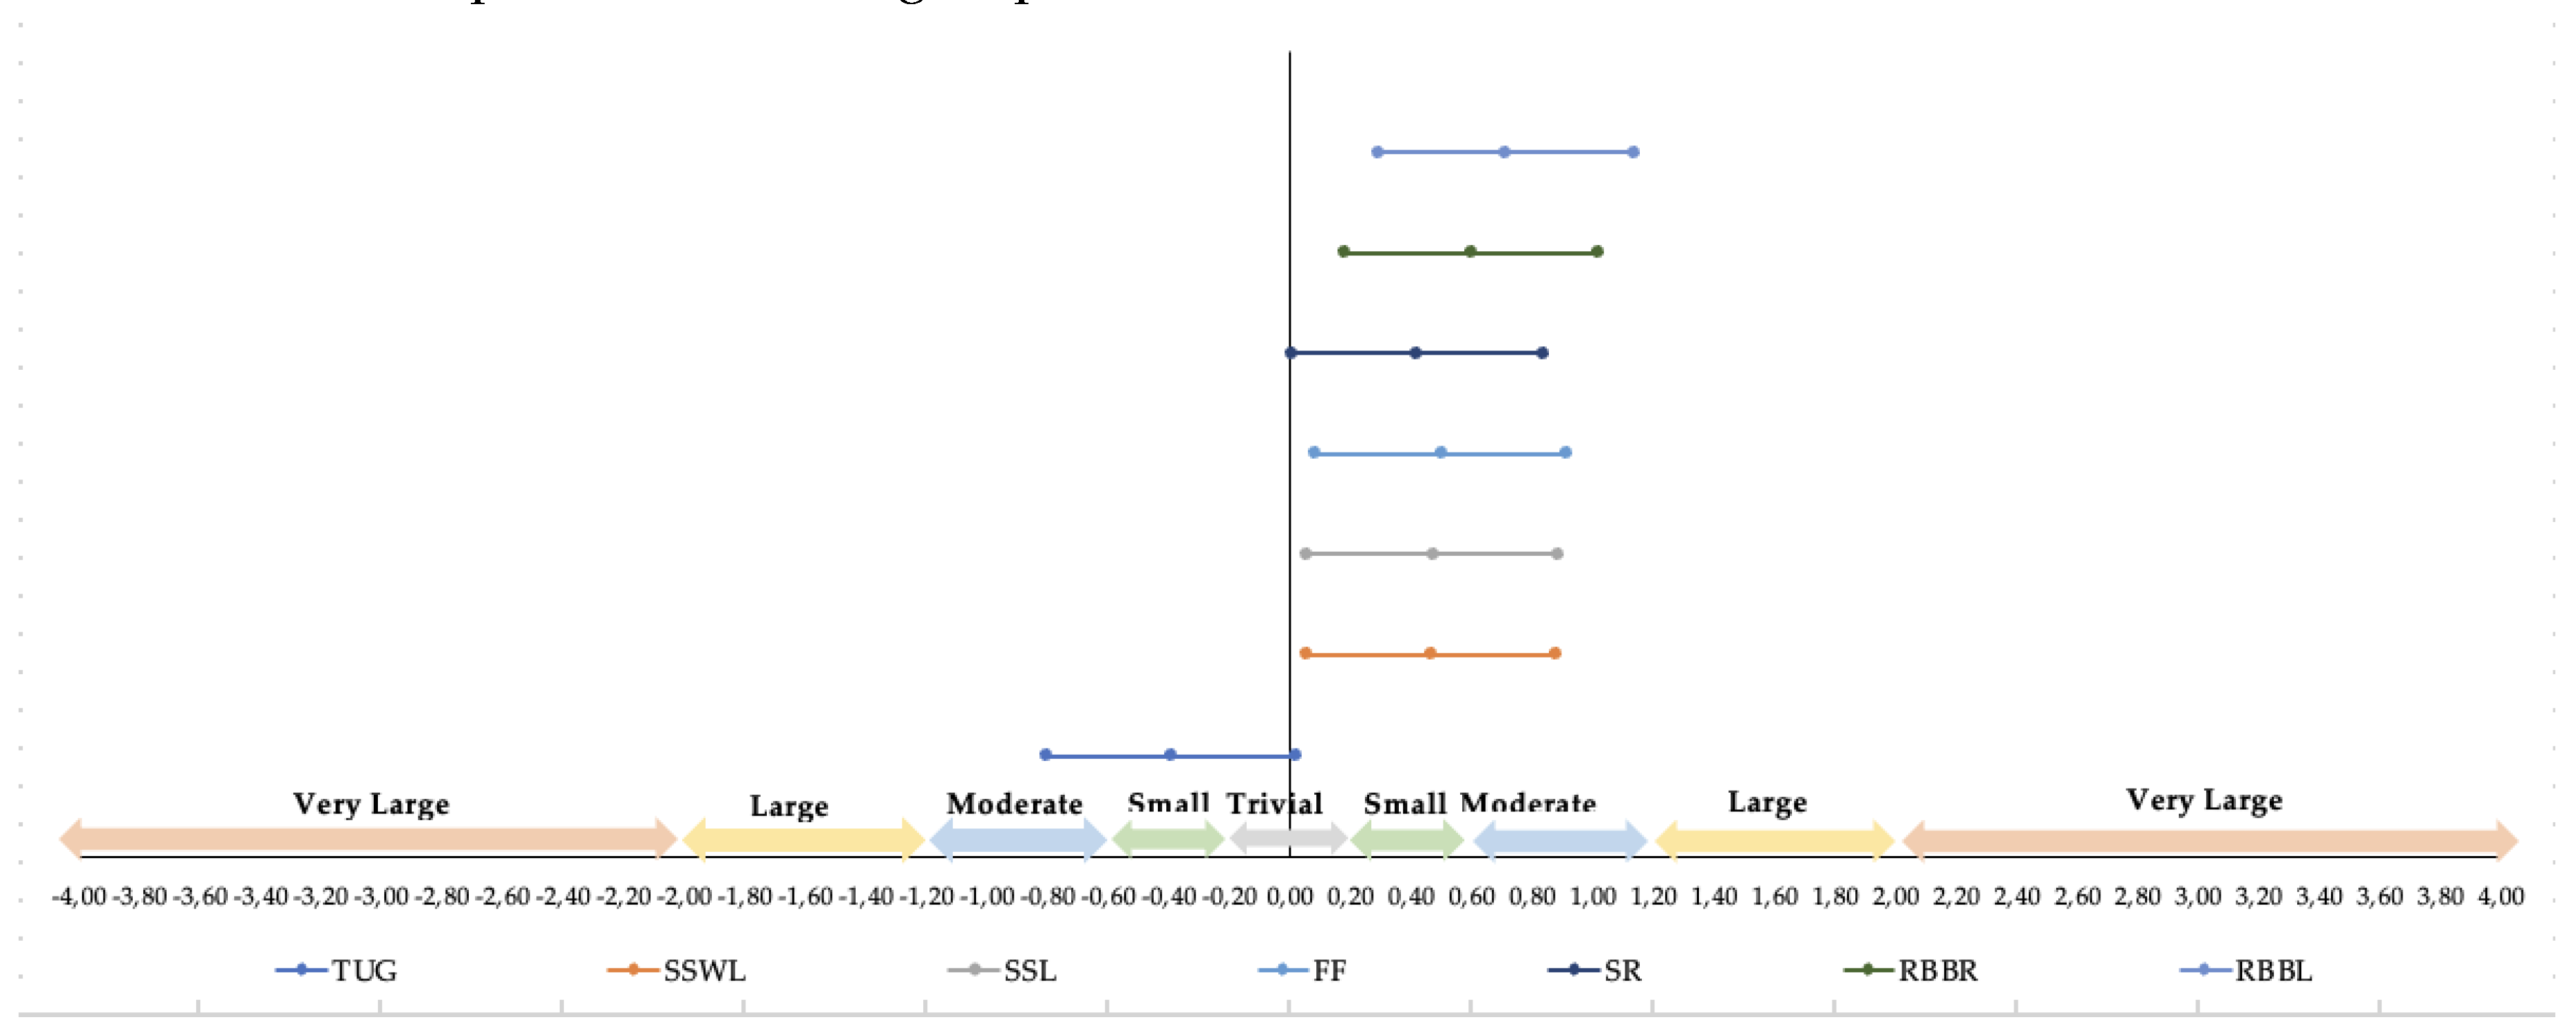
Background: Physical activity (PA) plays a crucial role in improving the quality of life (QoL) in the elderly, particularly by enhancing balance and movement coordination. Objective: This study aimed to assess the effects of sensorimotor training intervention in older adults. Methods: 90 participants, divided into a Control Group (N=44) and Experimental Group (N=46) were involved in a 24-week period sensorimotor training program. Participants were evaluated both before and after the intervention period. Strength and flexibility were measured using the Rikli and Jones protocol (1999), while agility and speed were assessed through timed-up-and-go tests. A descriptive analysis of the sample was performed to characterize the data using the mean and standard deviation considering the gender of the participants. Student’s T test was performed to compare the differences between groups according to the first and second data collection moments (before and after the intervention). Jamovi software was used to develop the statistical analysis, with a value of p<0.05 to determine the statistical significance. Results: The Experimental Group showed significant improvements across all analyzed variables following the intervention (p < 0.005), indicating substantial gains in physical capacities. In contrast, the Control Group exhibited no significant changes in any variable, with the lowest p-value observed in the “Sitting and Reaching” test (p = 0.155), highlighting the lack of improvement without intervention. The results showed significant differences in all the analyzed variables before and after intervention. Individually, in the “reach behind your back (left)” test largest effect size was observed. Conclusions: In conclusion, the sensorimotor training program demonstrated significant improvements in various physical capacities, though flexibility did not show notable progress. Developing PA programs tailored to the elderly is essential for enhancing their QoL and reducing the risk of falls, injuries, and illnesses. These interventions play a crucial role in promoting overall health, independence, and well-being among older adults.
Keywords:
1. Introduction
2. Materials and Methods
2.1. Design
2.2. Participants
| N | Age (year) | Weight (kg) | Height (m) | BMI | |||||
| Mean | SD | Mean | SD | Mean | SD | Mean | SD | ||
| Control Group | 44 | 73.70 | 6.08 | 70.10 | 12.70 | 1.58 | 0.08 | 28.10 | 4.69 |
| Experimental Group | 46 | 72.40 | 6.88 | 68.40 | 14.20 | 1.58 | 0.09 | 27.40 | 5.03 |
| Note. Kg: kilograms; m: meters, BMI: Body Mass Index; SD: Standard deviation. | |||||||||
2.3. Ethics
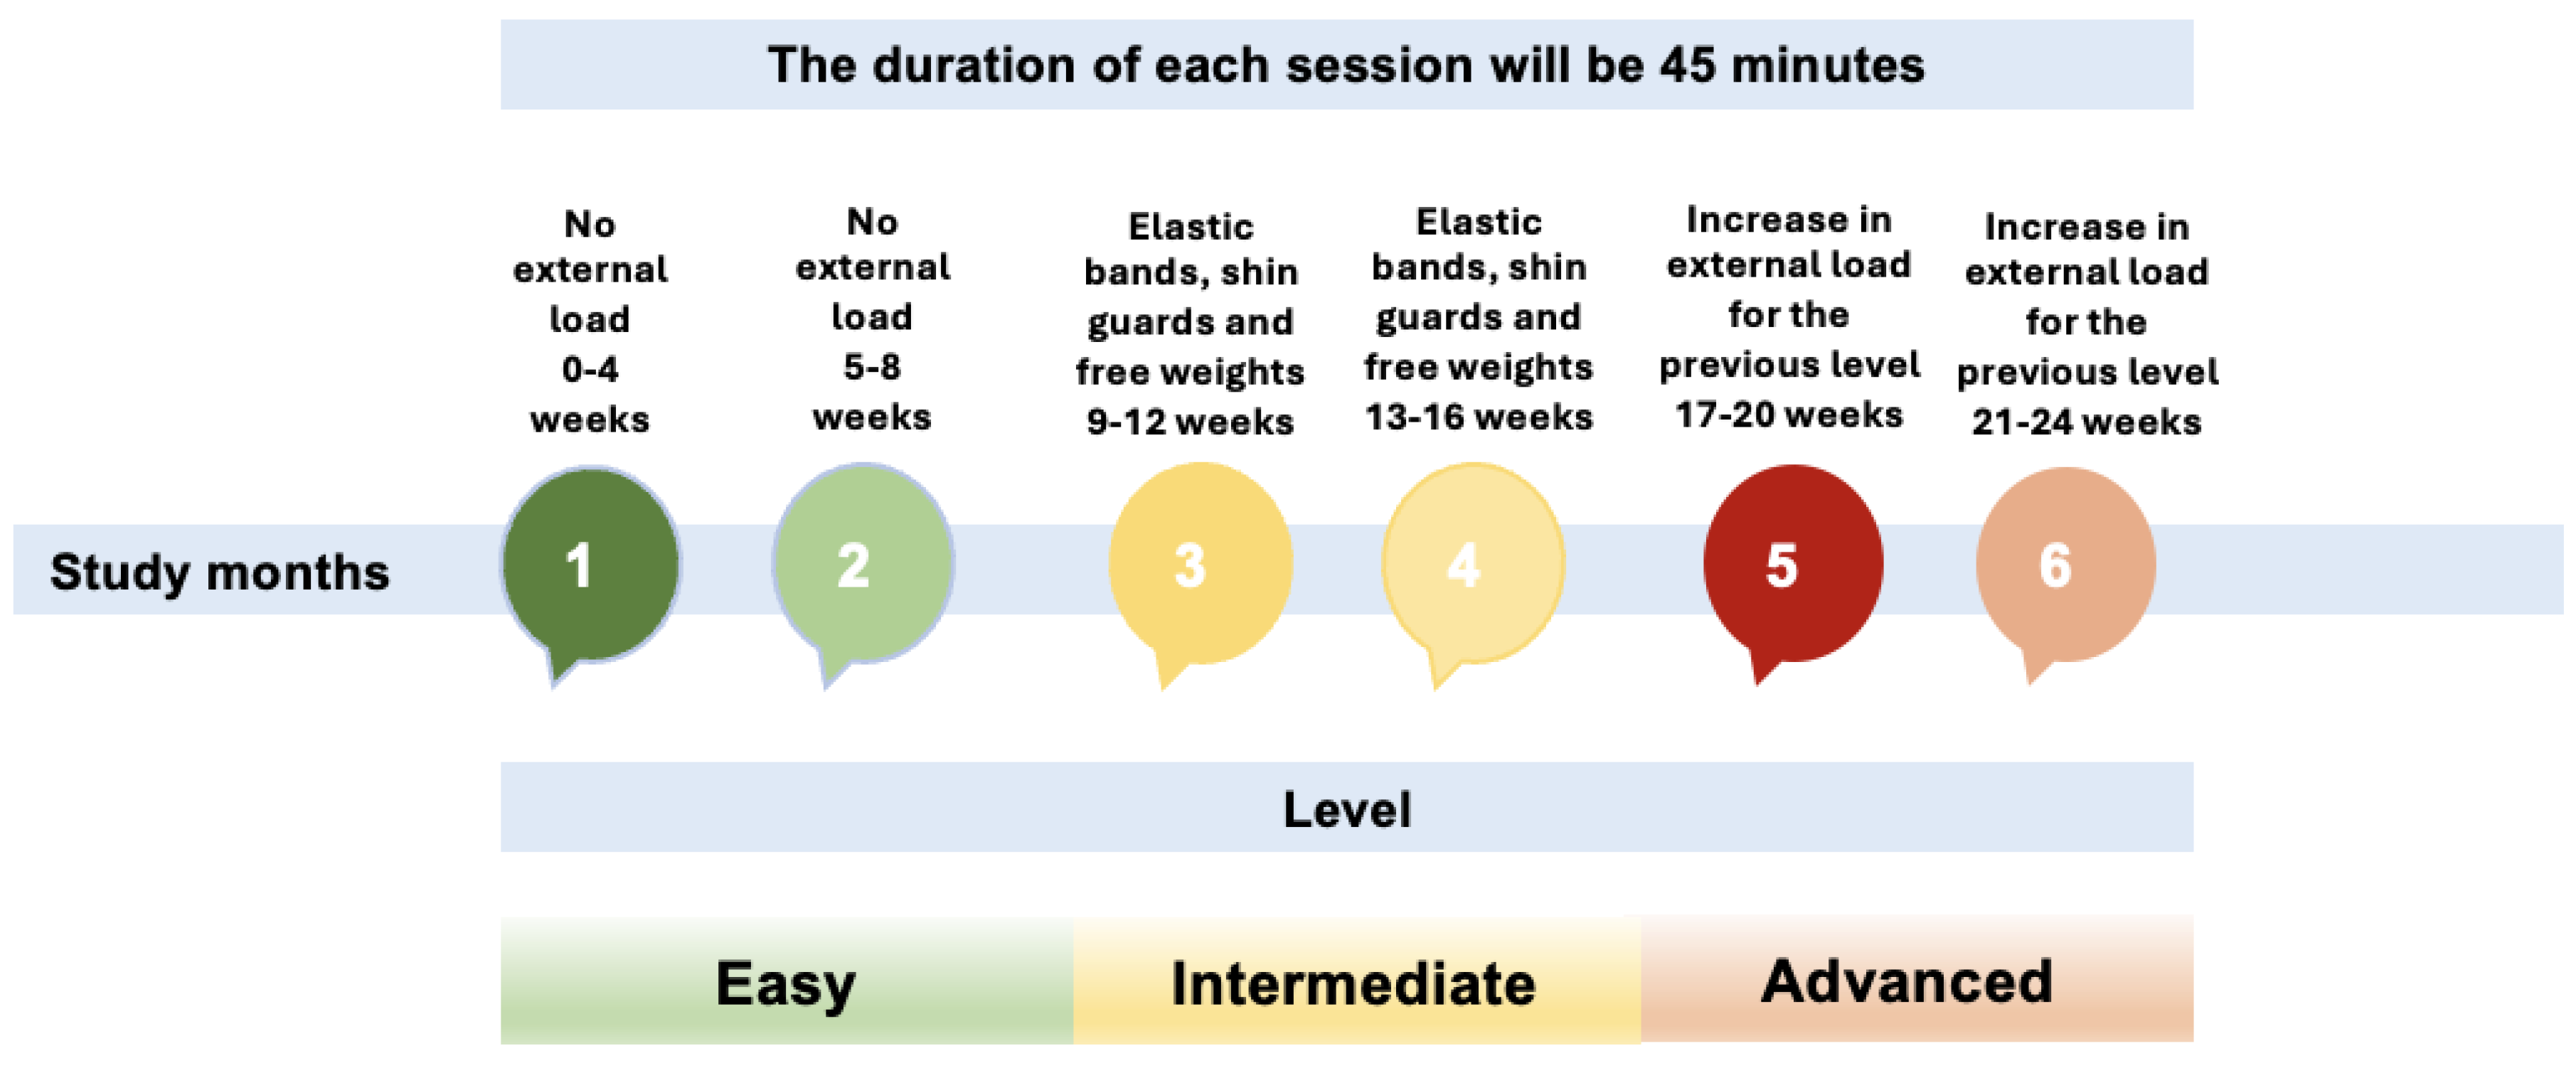
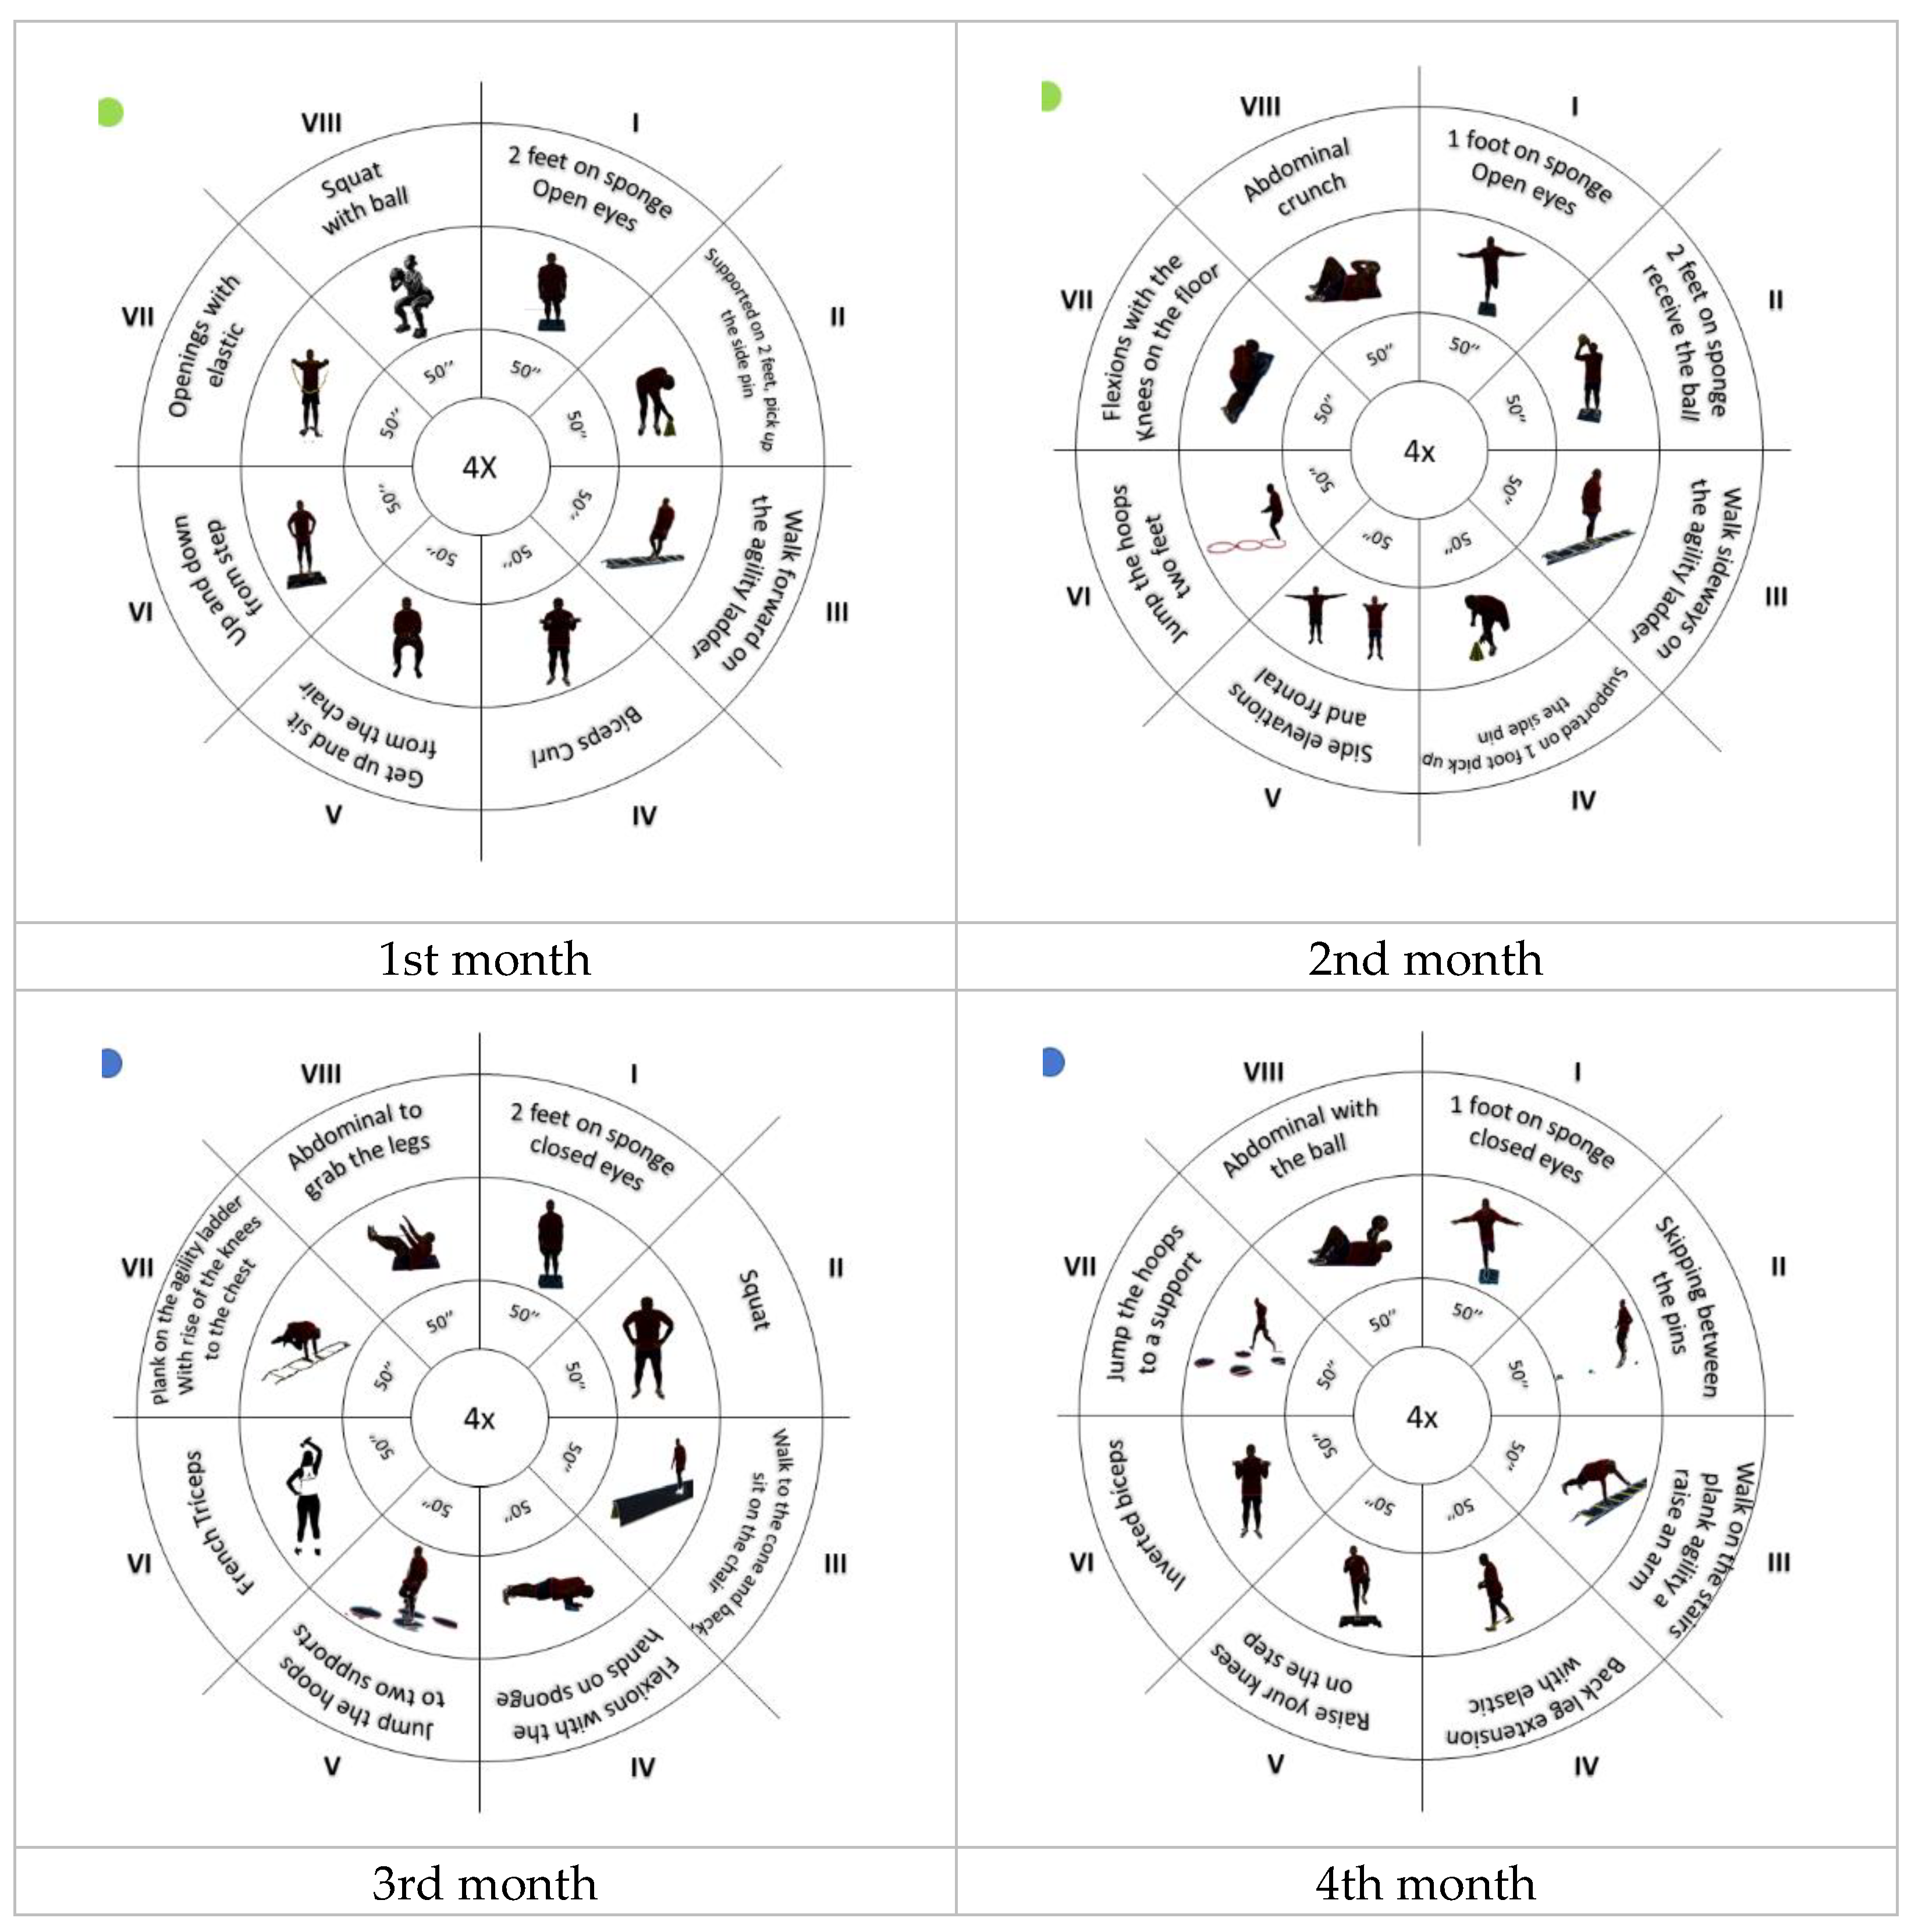
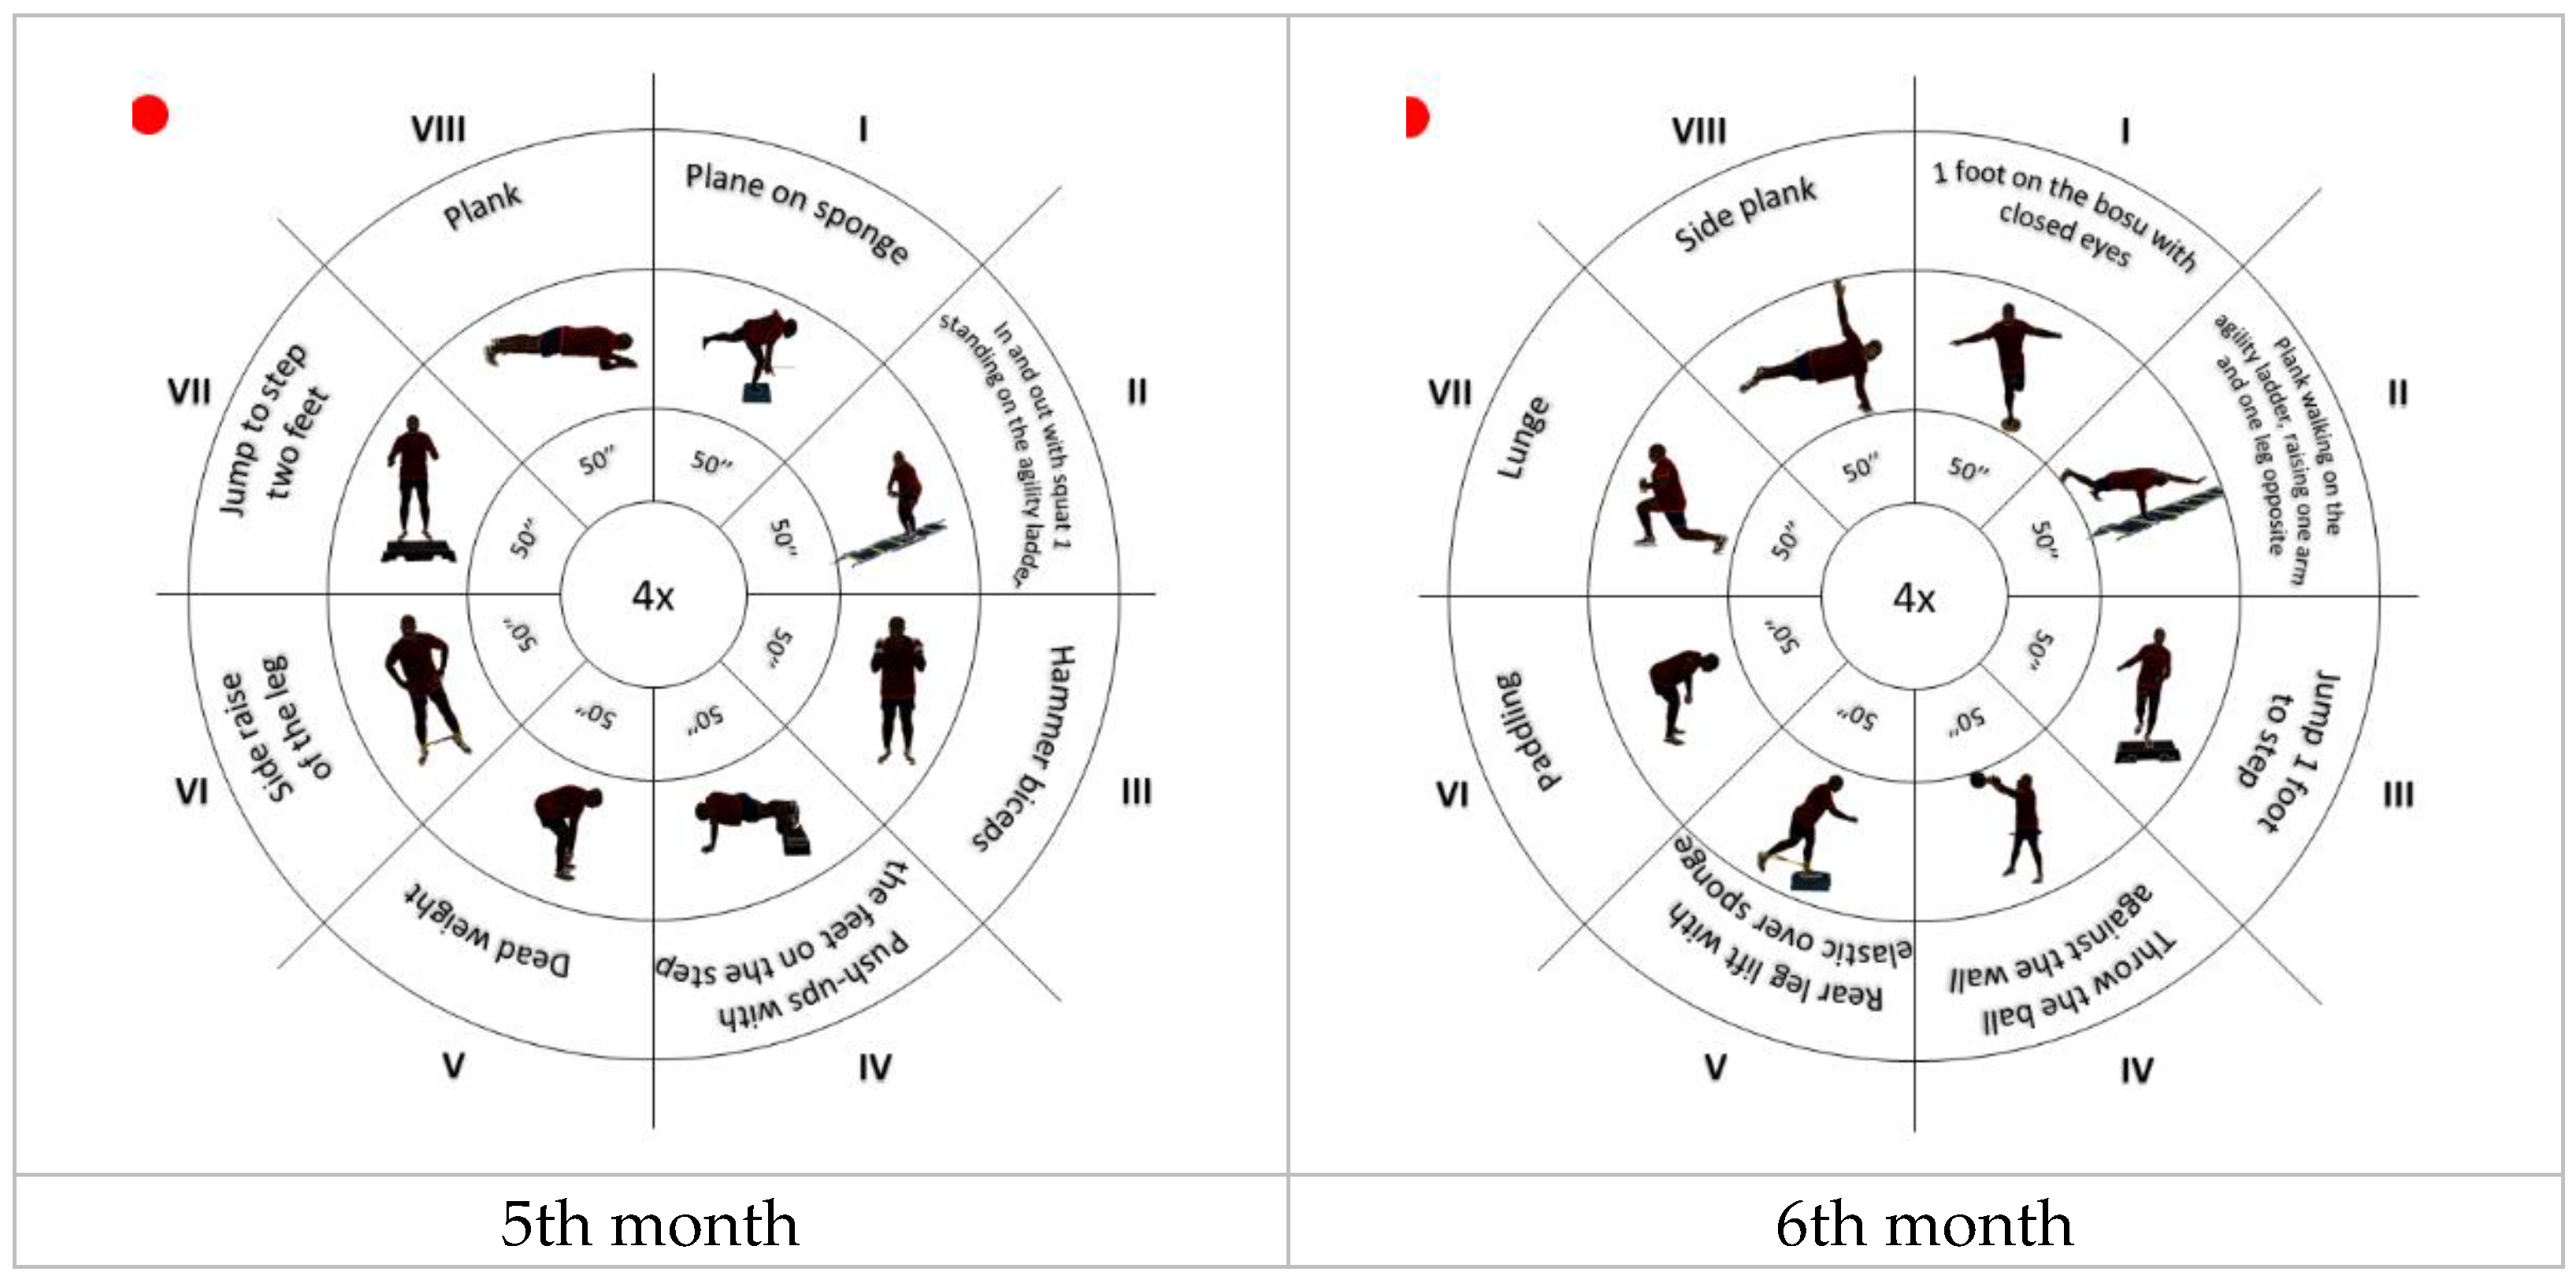
2.4. Intervention
Main Evaluations:
- Bodyweight and height. Before the measurements, participants were asked to remove their shoes, socks, and heavy clothing (coats, sweaters, coats, etc.). They were also asked to empty their pockets and remove belts and other accessories (bands, pendants, etc.). Height was measured using a stadiometer (Seca 22, Hamburg, Germany). This instrument was placed on a vertical surface with the measuring scale perpendicular to the ground. Participants were positioned in a standing position, with their shoulders balanced, and their arms relaxed along their body. Height was determined in cm and rounded to the nearest mm. Body weight was measured using a scale. Body weight was registered in kg and the BMI was calculated using the formula: weight (Kg)/height2.
- Agility and execution speed were assessed through the TUG test, which consisted of getting up from a chair, walking in a straight line three meters away, and walking back and sitting down again [2].
- Muscular endurance was evaluated by rising from the chair or bending and straightening for 30 seconds, during which the strength of the lower limbs involving the vastus medialis obliquus (VMO) and the vastus lateralis (VL) was also calculated [3].
- Upper limb strength was determined by the number of times that a determined weight can be lifted by performing a flexion–extension of the arms for 30 seconds [3].
- Lower limb flexibility was assessed using the "Sit and Reach" test, in which the participants, from a seated position with one leg extended, slowly bent over, sliding their hands down the extended leg until they touched (or passed) their toes [3].
- Upper limbs flexibility was assessed using the "behind the back reach", which consisted of measuring with a ruler the distance between (or the overlap of) the middle fingers behind the back [3].
2.5. Statistical Analysis
3. Results
4. Discussion
5. Conclusions
Author Contributions
Funding
Institutional Review Board Statement
Informed Consent Statement
Data Availability Statement
Acknowledgments
Conflicts of Interest
References
- Choi, J.I.; Cho, Y.H.; Kim, Y.J.; Lee, S.Y.; Lee, J.G.; Yi, Y.H.; Tak, Y.J.; Hwang, H.R.; Lee, S.H.; Park, E.J.; et al. The Relationship of Sitting Time and Physical Activity on the Quality of Life in Elderly People. Int J Environ Res Public Health 2021, 18, 1459. [Google Scholar] [CrossRef] [PubMed]
- Prasad, L.; Fredrick, J.; Aruna, R. The Relationship between Physical Performance and Quality of Life and the Level of Physical Activity among the Elderly. J Educ Health Promot 2021, 10, 68. [Google Scholar] [CrossRef] [PubMed]
- Dunsky, A. The Effect of Balance and Coordination Exercises on Quality of Life in Older Adults: A Mini-Review. Front Aging Neurosci 2019, 11. [Google Scholar] [CrossRef] [PubMed]
- Vagetti, G.C.; Barbosa Filho, V.C.; Moreira, N.B.; Oliveira, V. de; Mazzardo, O.; Campos, W. de Association between Physical Activity and Quality of Life in the Elderly: A Systematic Review, 2000-2012. Revista Brasileira de Psiquiatria 2014, 36, 76–88. [Google Scholar] [CrossRef]
- Goodarzi, S.; Teymouri Athar, M.M.; Beiky, M.; Fathi, H.; Nakhaee, Z.; Omran, S.P.; Shafiee, A. Effect of Physical Activity for Reducing Anxiety Symptoms in Older Adults: A Meta-Analysis of Randomized Controlled Trials. BMC Sports Sci Med Rehabil 2024, 16, 153. [Google Scholar] [CrossRef]
- Pfeifer, C.E.; Ross, L.M.; Weber, S.R.; Sui, X.; Blair, S.N. Are Flexibility and Muscle-Strengthening Activities Associated with Functional Limitation? Sports Medicine and Health Science 2022, 4, 95–100. [Google Scholar] [CrossRef]
- Lindsay Smith, G.; Banting, L.; Eime, R.; O’Sullivan, G.; van Uffelen, J.G.Z. The Association between Social Support and Physical Activity in Older Adults: A Systematic Review. International Journal of Behavioral Nutrition and Physical Activity 2017, 14, 56. [Google Scholar] [CrossRef]
- Ghram, A.; Briki, W.; Mansoor, H.; Al-Mohannadi, A.S.; Lavie, C.J.; Chamari, K. Home-Based Exercise Can Be Beneficial for Counteracting Sedentary Behavior and Physical Inactivity during the COVID-19 Pandemic in Older Adults. Postgrad Med 2021, 133, 469–480. [Google Scholar] [CrossRef]
- Woessner, M.N.; Tacey, A.; Levinger-Limor, A.; Parker, A.G.; Levinger, P.; Levinger, I. The Evolution of Technology and Physical Inactivity: The Good, the Bad, and the Way Forward. Front Public Health 2021, 9. [Google Scholar] [CrossRef]
- Fletcher, G.F.; Landolfo, C.; Niebauer, J.; Ozemek, C.; Arena, R.; Lavie, C.J. Reprint of: Promoting Physical Activity and Exercise. J Am Coll Cardiol 2018, 72, 3053–3070. [Google Scholar] [CrossRef]
- Rizwan Sajid, M.; Muhammad, N.; Shahbaz, A.; Zakaria, R. A Statistical Study on the Prevalence of Physical Inactivity among Cardiovascular Diseases Patients: The Predictive Role of Demographic and Socioeconomic Factors. Res J Pharm Technol 2021, 3679–3684. [Google Scholar] [CrossRef]
- Cabo, C.A.; Hernández-Beltrán, V.; Gamonales, J.M.; Parraca, J.A.; Fernandes, O.; Espada, M.C. Evolution of Research Related to How a Sedentary Lifestyle Influences the Aging Process: A Bibliometric Review. J Public Health (Bangkok) 2024. [Google Scholar] [CrossRef]
- Ciumărnean, L.; Milaciu, M.V.; Negrean, V.; Orășan, O.H.; Vesa, S.C.; Sălăgean, O.; Iluţ, S.; Vlaicu, S.I. Cardiovascular Risk Factors and Physical Activity for the Prevention of Cardiovascular Diseases in the Elderly. Int J Environ Res Public Health 2021, 19, 207. [Google Scholar] [CrossRef] [PubMed]
- Nikitas, C.; Kikidis, D.; Bibas, A.; Pavlou, M.; Zachou, Z.; Bamiou, D.-E. Recommendations for Physical Activity in the Elderly Population: A Scoping Review of Guidelines. J Frailty Sarcopenia Falls 2022, 07, 18–28. [Google Scholar] [CrossRef] [PubMed]
- Fabris, E.; Sinagra, G. Physical Activity in Older People: Better Late than Never, but Better Early than Late. Heart 2022, 108, 328–329. [Google Scholar] [CrossRef]
- McGarrigle, L.; Todd, C. Promotion of Physical Activity in Older People Using MHealth and EHealth Technologies: Rapid Review of Reviews. J Med Internet Res 2020, 22, e22201. [Google Scholar] [CrossRef]
- Musdalifah Ahmad, S. A Systematic Review of the Impact of Physical Activity on Elderly Mental Health. J Psychiatr Nurs 2023, 248–255. [Google Scholar] [CrossRef]
- Carvalho, W.V. de; Katakura, E.A.L.B.; Carvalho, T.L.R.B. de; Koga, P.M.; Kawamoto, A.B.S.S.; Cardoso, R.B.C.M.; Tashima, C.M.; Alarcon, M.F.S. Benefit of Pleasurable Physical Activity for the Elderly: An Integrative Review. In A LOOK AT DEVELOPMENT; Seven Editora, 2023.
- Fiorilli, G.; Buonsenso, A.; Centorbi, M.; Calcagno, G.; Iuliano, E.; Angiolillo, A.; Ciccotelli, S.; di Cagno, A.; Di Costanzo, A. Long Term Physical Activity Improves Quality of Life Perception, Healthy Nutrition, and Daily Life Management in Elderly: A Randomized Controlled Trial. Nutrients 2022, 14, 2527. [Google Scholar] [CrossRef]
- Mueller, D.; Redkva, P.E.; Fernando de Borba, E.; Barbosa, S.C.; Krause, M.P.; Gregorio da Silva, S. Effect of Mat vs. Apparatus Pilates Training on the Functional Capacity of Elderly Women. J Bodyw Mov Ther 2021, 25, 80–86. [Google Scholar] [CrossRef]
- Wróblewska, Z.; Chmielewski, J.P.; Florek-Łuszczki, M.; Nowak-Starz, G.; Wojciechowska, M.; Wróblewska, I.M. Assessment of Functional Capacity of the Elderly. Annals of Agricultural and Environmental Medicine 2023, 30, 156–163. [Google Scholar] [CrossRef]
- Donisi, L.; Coccia, A.; Amitrano, F.; Mercogliano, L.; Cesarelli, G.; D’Addio, G. Backpack Influence on Kinematic Parameters Related to Timed Up and Go (TUG) Test in School Children. In Proceedings of the 2020 IEEE International Symposium on Medical Measurements and Applications (MeMeA); IEEE, June 2020; pp. 1–5. [Google Scholar]
- Chua, K.Y.; Lim, W.S.; Lin, X.; Yuan, J.-M.; Koh, W.-P. Handgrip Strength and Timed Up-and-Go (TUG) Test Are Predictors of Short-Term Mortality among Elderly in a Population-Based Cohort in Singapore. J Nutr Health Aging 2020, 24, 371–378. [Google Scholar] [CrossRef] [PubMed]
- Parraca, J.A.; Adsuar, J.C.; Domínguez-Muñoz, F.J.; Barrios-Fernandez, S.; Tomas-Carus, P. Test-Retest Reliability of Isokinetic Strength Measurements in Lower Limbs in Elderly. Biology (Basel) 2022, 11, 802. [Google Scholar] [CrossRef] [PubMed]
- Li, R.C.; Jasiewicz, J.M.; Middleton, J.; Condie, P.; Barriskill, A.; Hebnes, H.; Purcell, B. The Development, Validity, and Reliability of a Manual Muscle Testing Device With Integrated Limb Position Sensors. Arch Phys Med Rehabil 2006, 87, 411–417. [Google Scholar] [CrossRef] [PubMed]
- Perrin, D.H.; Robertson, R.J.; Ray, R.L. Bilateral Isokinetic Peak Torque, Torque Acceleration Energy, Power, and Work Relationships in Athletes and Nonathletes. Journal of Orthopaedic & Sports Physical Therapy 1987, 9, 184–189. [Google Scholar] [CrossRef]
- Janssen, J.C.; Le-Ngoc, L. Intratester Reliability and Validity of Concentric Measurements Using a New Hand-Held Dynamometer. Arch Phys Med Rehabil 2009, 90, 1541–1547. [Google Scholar] [CrossRef]
- Takai, Y.; Ohta, M.; Akagi, R.; Kanehisa, H.; Kawakami, Y.; Fukunaga, T. Sit-to-Stand Test to Evaluate Knee Extensor Muscle Size and Strength in the Elderly: A Novel Approach. J Physiol Anthropol 2009, 28, 123–128. [Google Scholar] [CrossRef]
- Cho, K.H.; Bok, S.K.; Kim, Y.-J.; Hwang, S.L. Effect of Lower Limb Strength on Falls and Balance of the Elderly. Ann Rehabil Med 2012, 36, 386. [Google Scholar] [CrossRef]
- Teraoka, K.; Tsuji, T.; Jindo, T.; Tokunaga, S.; Okura, T. Changes in the Physical Fitness of Elderly People in the COVID-19 Pandemic: An Examination Using Performance Tests. Nippon Ronen Igakkai Zasshi. Japanese Journal of Geriatrics 2022, 59, 59.491. [Google Scholar] [CrossRef]
- Shirazi, F.; Jaberi, A.; Zahedian Nasab, N. Effect of a Technology-Based Exercise Program on Physical Fitness and Activities of Daily Living in the Elderly With Balance Impairment: A Clinical Trial. Salmand 2023, 18, 178–191. [Google Scholar] [CrossRef]
- Correa, L. da P.; Bento, T.P.F.; Guariglia, D.A.; Rodrigues, G.F.; Conti, M.H.S. De Effects of Functional Training on Pain and Functional Capacity in Elderly Women. Fisioterapia em Movimento 2022, 35. [Google Scholar] [CrossRef]
- de Oliveira, F.N.; Damião, E.P.; dos Santos, L.; Galvão, L.L.; Machado, H.R.; Silva, R.R.; Tribess, S.; Virtuoso Júnior, J.S.; de Assis Teles Santos, D. Prevalence and Factors Associated with Low Functional Mobility in Older Adults. Aging Medicine 2024, 7, 292–300. [Google Scholar] [CrossRef] [PubMed]
- Melchiorri, G.; Triossi, T.; Viero, V.; Marroni, S.; D’Arcangelo, G.; Tancredi, V. A Study about a New Standardized Method of Home-Based Exercise in Elderly People Aged 65 and Older to Improve Motor Abilities and Well-Being: Feasibility, Functional Abilities and Strength Improvements. Geriatrics 2022, 7, 134. [Google Scholar] [CrossRef] [PubMed]
- Cabo, C.A.; Hernández-Beltrán, V.; Gamonales, J.M.; Fernandes, O.; Espada, M.C.; Parraca, J.A. Evolution of Documents Related to the Influence of Physical Activity and Functional Capacity throughout the Aging Process: A Bibliometric Review. Front Physiol 2024, 15. [Google Scholar] [CrossRef] [PubMed]
- Warburton, D.E.; Bredin, S.S. Health Benefits of Physical Activity: A Systematic Review of Current Systematic Reviews. Curr Opin Cardiol 2017, 32, 541–556. [Google Scholar] [CrossRef] [PubMed]
- Montero, I.; León, O.G. A Guide for Naming Research Studies in Psychology. International Journal of Clinical and Health Psychology 2007, 7, 847–862. [Google Scholar]
- Cabo, C.A.; Fernandes, O.; Mendoza-Muñoz, M.; Barrios-Fernandez, S.; Muñoz-Bermejo, L.; Gómez-Galán, R.; Parraca, J.A. An Active Retirement Programme, a Randomized Controlled Trial of a Sensorimotor Training Programme for Older Adults: A Study Protocol. Healthcare 2022, 11, 86. [Google Scholar] [CrossRef]
- Field, A. Discovering Statistics Using IBM SPSS Statistics.; Sage Publications.: Londres, Reino Unido, 2013. [Google Scholar]
- O’Donoghue, P. Statistics for Sport and Exercise Studies; Routledge: London, 2012. [Google Scholar]
- Hopkins, W.G.; Marshall, S.W.; Batterham, A.M.; Hanin, J. Progressive Statistics for Studies in Sports Medicine and Exercise Science. Med Sci Sports Exerc 2009, 41, 3–12. [Google Scholar] [CrossRef]
- Podsiadlo, D.; Richardson, S. The Timed “Up & Go”: A Test of Basic Functional Mobility for Frail Elderly Persons. J Am Geriatr Soc 1991, 39, 142–148. [Google Scholar] [CrossRef]
- Barry, E.; Galvin, R.; Keogh, C.; Horgan, F.; Fahey, T. Is the Timed Up and Go Test a Useful Predictor of Risk of Falls in Community Dwelling Older Adults: A Systematic Review and Meta- Analysis. BMC Geriatr 2014, 14, 14. [Google Scholar] [CrossRef]
- Martinez, B.P.; Santos, M.R. dos; Simões, L.P.; Ramos, I.R.; Oliveira, C.S. de; Forgiarini Júnior, L.A.; Camelier, F.W.R.; Camelier, A.A. Segurança E Reprodutibilidade Do Teste Timed Up And Go Em Idosos Hospitalizados. Revista Brasileira de Medicina do Esporte 2016, 22, 408–411. [Google Scholar] [CrossRef]
- Andrade, L.C.A.; Costa, G.L. dos A.; Diogenes, L.G.B.; Pimentel, P.H.R. Timed Up and Go Teste Na Avaliação Do Risco de Quedas Em Idosos: Uma Revisão de Literatura. Research, Society and Development 2021, 10, e321101321615. [CrossRef]
- Bretan, O.; Elias Silva, J.; Ribeiro, O.R.; Corrente, J.E. Risk of Falling among Elderly Persons Living in the Community: Assessment by the Timed up and Go Test. Braz J Otorhinolaryngol 2013, 79, 18–21. [Google Scholar] [CrossRef] [PubMed]
- Rikli, R.E.; Jones, C.J. Development and Validation of a Functional Fitness Test for Community-Residing Older Adults. J Aging Phys Act 1999, 7, 129–161. [Google Scholar] [CrossRef]
- Baptista, F.; Sardinha, L.B. Avaliação Da Aptidão Física e Do Equilíbrio de Pessoas Idosas – Baterias de Fullerton; Faculdade de Motricidade Humana: Cruz Quebrada, 2005. [Google Scholar]
- Lord, S.R.; Sherrington, C.; Menz, H.B.; Close, C.T. Falls in Older People: Risk Factors and Strategies for Prevention.; Cambridge University Press: Cambridge, 2002. [Google Scholar]
- Pan, Y.; Zhang, Y.; Tian, X.; Zhang, Z.; Zheng, C.; Zhang, T. Low Handgrip Strength and Mortality Risk among Older People: A Systematic Review and Meta-Analysis. Age Ageing 2022, 51. [Google Scholar]
- La Greca, S.; Rapali, M.; Ciaprini, G.; Russo, L.; Vinciguerra, M.G.; Di Giminiani, R. Acute and Chronic Effects of Supervised Flexibility Training in Older Adults: A Comparison of Two Different Conditioning Programs. Int J Environ Res Public Health 2022, 19, 16974. [Google Scholar] [CrossRef]
- Ruivo, R. Manual de Avaliação e Prescrição de Exercício; Self, 2015.
- Jones, J.; Rikli, R.E. Measuring Functional. The journal on Active Aging 2022, 25–30. [Google Scholar]

| Variables | Mean | SD | Student’s T test | Mean differences |
Df | p |
|---|---|---|---|---|---|---|
| Timed up and go (pre) (s) | 7.26 | ±1.23 | 3.90 | 0.416 | 45.0 | < .001 |
| Timed up and go (post) (s) | 6.85 | ±0.810 | ||||
| Stand and sit with leaning (pre) (rep) | 13.00 | ±2.30 | -3.64 | -1.043 | 45.0 | < .001 |
| Stand and sit with leaning (post) (rep) | 14.00 | ±1.97 | ||||
| Stand and sit without leaning (pre) (rep) | 15.30 | ±2.95 | -5.04 | -1.370 | 45.0 | < .001 |
| Stand and sit without leaning (post) (rep) | 16.60 | ±2.57 | ||||
| Forearm flexion (pre) (rep) | 17.30 | ±5.83 | -3.33 | -2.522 | 45.0 | 0.002 |
| Forearm flexion (post) (rep) | 19.80 | ±4.04 | ||||
| Sitting and reaching (pre) (rep) | -2.54 | ±8.70 | -4.43 | -3.565 | 45.0 | < .001 |
| Sitting and reaching (post) (rep) | 1.02 | ±8.24 | ||||
| Reach behind your back (right) (pre) (m) | -13.80 | ±11.7 | -7.29 | -6.261 | 45.0 | < .001 |
| Reach behind your back (right) (post) (m) | -7.50 | ±9.12 | ||||
| Reach behind your back (left) (pre) (m) | -18.50 | ±11.0 | -8.97 | -7.391 | 45.0 | < .001 |
| Reach behind your back (left) (post) (m) | -11.20 | ±9.43 |
| Variables | Mean | SD | Student’s T test | Mean differences |
Df | p |
|---|---|---|---|---|---|---|
| Timed up and go (pre) (s) | 8.15 | ±2.89 | 0.763 | 0.076 | 43.0 | 0.450 |
| Timed up and go (post) (s) | 8.08 | ±2.94 | ||||
| Stand and sit with leaning (pre) (rep) | 13.5 | ±3.42 | -0.947 | -0.318 | 43.0 | 0.349 |
| Stand and sit with leaning (post) (rep) | 13.8 | ±2.96 | ||||
| Stand and sit without leaning (pre) (rep) | 15.5 | ±4.31 | -0.120 | -0.045 | 43.0 | 0.905 |
| Stand and sit without leaning (post) (rep) | 15.6 | ±3.63 | ||||
| Forearm flexion (pre) (rep) | 18.3 | ±4.69 | 1.007 | 0.386 | 43.0 | 0.319 |
| Forearm flexion (post) (rep) | 17.9 | ±4.11 | ||||
| Sitting and reaching (pre) (rep) | -0.614 | ±9.97 | 1.446 | 1.204 | 43.0 | 0.155 |
| Sitting and reaching (post) (rep) | -1.82 | ±9.37 | ||||
| Reach behind your back (right) (pre) (m) | -9.32 | ±12.5 | 1.100 | 2.636 | 43.0 | 0.277 |
| Reach behind your back (right) (post) (m) | -12.0 | ±20.4 | ||||
| Reach behind your back (left) (pre) (m) | -15.8 | ±12.9 | -1.310 | -1.056 | 43.0 | 0.197 |
| Reach behind your back (left) (post) (m) | -14.8 | ±11.9 |
| Variables | Pre-intervention | Post-intervention | ES | σ | 95% IC | |||||
|---|---|---|---|---|---|---|---|---|---|---|
| M | SD | n | M | SD | n | LL | UL | |||
| Times up and go | 7.26 | 1.23 | 46 | 6.85 | 0.81 | 46 | -0.39 | 0.210524737 | -0.81 | 0.02 |
| Stand and sit with leaning | 13.00 | 2.3 | 46 | 14.00 | 1.97 | 46 | 0.47 | 0.211337371 | 0.05 | 0.88 |
| Stand and sit without leaning | 15.30 | 2.95 | 46 | 16.60 | 2.57 | 46 | 0.47 | 0.211372433 | 0.06 | 0.88 |
| Forearm flexion | 17.30 | 5.83 | 46 | 19.80 | 4.04 | 46 | 0.50 | 0.211727587 | 0.08 | 0.91 |
| Sitting and reaching | -2.54 | 8.7 | 46 | 1.02 | 8.24 | 46 | 0.42 | 0.210802398 | 0.01 | 0.83 |
| Reach behind your back (right) | -13.80 | 11.7 | 46 | -7.50 | 9.12 | 46 | 0.60 | 0.213163448 | 0.18 | 1.02 |
| Reach behind your back (left) | -18.50 | 11 | 46 | -11.20 | 9.43 | 46 | 0.71 | 0.215029136 | 0.29 | 1.13 |
Disclaimer/Publisher’s Note: The statements, opinions and data contained in all publications are solely those of the individual author(s) and contributor(s) and not of MDPI and/or the editor(s). MDPI and/or the editor(s) disclaim responsibility for any injury to people or property resulting from any ideas, methods, instructions or products referred to in the content. |
© 2024 by the authors. Licensee MDPI, Basel, Switzerland. This article is an open access article distributed under the terms and conditions of the Creative Commons Attribution (CC BY) license (http://creativecommons.org/licenses/by/4.0/).


