
Submitted:
20 November 2024
Posted:
22 November 2024
You are already at the latest version
Abstract
Age-related macular degeneration (AMD) is a leading cause of vision loss among older adults. This study evaluates and compares the performance of five vision transformer (ViT) models (Classic ViT, Swin Transformer, BEiT, Swin Transformer V2, and SwiftFormer) in detecting dry AMD using fundus images. We used an initial dataset of 305 images, divided into training, validation, and test sets. The data set was increased by employing data augmentation techniques to enhance the models' generalization capabilities in different phases of the disease: No ADM, Mild, Moderate, and Advanced. Metrics of accuracy, precision, recall, F1-score, ROC curves, and computational efficiency were evaluated. Classic ViT and BEiT models achieved the best overall performance, excelling in accuracy (83.69% and 82.60%) and F1-score (85.47% and 86.36%), while SwiftFormer stood out in computational efficiency with a shorter inference time (14.19 ms/img), lower memory consumption (3.86 GB), and higher energy efficiency (131.46 W). This study provides evidence-based guidance for selecting ViT models for early detection of AMD, streamlining clinical diagnosis, and improving patient outcomes.
Keywords:
Age-related macular degeneration (AMD)
; Fundus image
; Ophthalmic disease detection
; Vision transformers
1. Introduction
Dry age-related macular degeneration (dry AMD) is one of the leading causes of vision loss among individuals over the age of 50. This disease affects the macula, i.e., the central part of the retina, and presents in two main forms: dry and wet [1]. Early and accurate detection of AMD is critical for preventing disease progression and preserving vision. [2]. Imaging techniques, such as fundus photography, are essential for diagnosing AMD. However, interpreting these images requires expertise and can be subjective [3]. In recent years, advances in artificial intelligence (AI) and deep learning have revolutionized the field of ophthalmology [4,5]. Deep learning models, particularly vision transformers (ViTs) [6], have demonstrated outstanding performance in various computer vision tasks [7]. These models leverage transformer-based architectures, which were originally developed for natural language processing [8], and adapt them for image analysis. The ability of ViTs to capture complex spatial relationships within images renders them particularly suitable for the detection of ophthalmological pathologies [9,10,11].
AMD represents a significant challenge in ophthalmology due to its prevalence and the profound impact it has on the quality of life of patients [12,13]. Early and accurate detection of features associated with AMD is crucial to supporting experts in implementing effective treatments that can slow or halt disease progression; however, identifying these features from fundus images remains a complex task that heavily depends on the expertise of the specialist, which can lead to variability in interpretations and potential delays in clinical decision-making [7,14,15]. For this reason, ophthalmologists constantly need support solutions that leverage emerging technologies, such as AI, to improve the accuracy and consistency in detecting features associated with AMD [16]. These technological tools complement clinical expertise and serve as crucial support in diagnostic decision-making.
The development of advanced technologies to support diagnostic tasks is highly useful and relevant in ophthalmology. As highlighted in the 2020 World Vision Report by the World Health Organization (WHO) [17], there is a growing need for technological developments that enable healthcare institutions to tackle the challenges in ocular medical care. As support tools, these technological innovations do not replace clinical expertise but complement it, helping reduce variability in interpretations and improve the speed and accuracy of clinical decision-making. The integration of these tools into medical practice can, therefore, optimize the diagnosis and treatment of diseases like AMD, ultimately improving patient outcomes and alleviating the workload of healthcare professionals [18].
This study focuses on the comparative evaluation of five vision transformer (ViT) architectures: Classic ViT [6], Swin Transformer [19], BEiT (BERT Pre-Training of Image Transformers) [20], Swin Transformer V2 [21], and Swiftformer [22]. Each of these models has been trained and evaluated on specific datasets of fundus images to detect dry AMD. The study highlights the importance of vision transformers in supporting detecting features associated with dry AMD. To streamline diagnostic assistance in ophthalmology, we establish the following research questions:
- 1)
- How does the performance of five vision transformer architectures (Classic ViT, Swin Transformer, BEiT, Swin Transformer V2, and SwiftFormer) compare in detecting features associated with AMD from fundus images evaluated through accuracy, precision, recall, ROC, and F1-Score metrics?
- 2)
- What are the strengths and limitations of each of these architectures in their ability to detect features associated with AMD.
- 3)
- ¿How can these observations contribute to a better understanding of their potential applications and clinical relevance in supporting ophthalmologists' diagnostic work?
The main contribution of this research lies in providing a detailed comparative analysis of five vision transformer (ViT) architectures for the detection of AMD, specifically in its dry form. This analysis evaluates model performance in accuracy, precision, recall, ROC, and F1-Score. By identifying the strengths and limitations of each ViT model, this study offers valuable insights into the capabilities and limitations of different ViT architectures, which can serve as a foundation for making informed decisions in clinical applications.
The remainder of this research is organized as follows: Section 2 reviews the literature, highlighting the main differences between our work and the studies we analyzed. Section 3 briefly describes each of the ViT architectures included in the comparative analysis. Section 4 details the methodology that we used to conduct the comparative study. Section 5 presents the results of the analysis and the corresponding discussion. Finally, Section 6 offers the conclusions and potential directions for future research.
2. Related Work
Numerous studies highlight the efficiency and superiority of ViT architectures over Convolutional Neural Networks (CNNs). Although these studies were not specifically conducted for AMD detection, they have demonstrated that ViT can outperform CNNs in various computer vision tasks because they capture long-range relationships and process images with greater detail and precision. The works analyzed in this research are further discussed below. They were categorized into two groups: those focusing on ophthalmological applications and those exploring other healthcare applications.
2.1. Comparative Studies of Deep Learning in Ophthalmology
In their study, Linde G. et al. [23] comparatively analyzed various deep learning architectures, including ViT, EfficientNet, and RegNet, for classifying ophthalmic images such as Optical Coherence Tomography (OCT) and fundus images. The models achieved accuracy above 90%, with EfficientNet and RegNet standing out as the most effective. Also, Peng Z. et al. [24] discussed an ocular diagnostic device that combines ViTs and CNNs, achieving an accuracy of 94.35% in fundus image classification. The device optimizes processing times compared to traditional methods and demonstrates robustness in cross-validation, highlighting its potential in diagnosing disc edema, fundus neoplasms, and pathological myopia. Researchers Azizi M. et al. [25] evaluated MedViT models for classifying OCT images into the following classes: normal, drusen, and Choroidal Neovascularization (CNV), achieving accuracies ranging from 94.9% to 97.9%. Stitchable networks and the new Micro MedViT were employed, standing out for their precision and efficiency in AMD detection.
Lin Goh et al. [26] conducted a comparative analysis between ViTs and CNNs to detect referable diabetic retinopathy. Five CNN models and four ViT models were evaluated, with the Swin Transformer ViT model achieving an AUC of 95.7% on the internal Kaggle test set, outperforming the CNNs and VAN_small. The improvement in image and video classification from OCT is addressed in the work of Badr A. et al. [27], using Classic ViT, Swin Transformer, and Multiscale Vision Transformer (MViT). The results showed significant improvements in accuracy, with MBT_ViT reaching an accuracy of 96.33% and an AUC-ROC of 0.9973. Xu K. et al. [28] presented a comparative study based on hierarchical transformers for AMD automated detection and differential diagnosis, comparing their DeepDrAMD model (based on Swin Transformer) with Classic ViT and traditional CNNs. The model achieved an AUC of 98.76% for AMD detection on the Wenzhou Medical University (WMUEH) dataset and 96.47% on the iChallenge-AMD dataset. Dutta P. et al. [29] presented the Conv-ViT model, a hybrid architecture that combines Inception-V3, ResNet-50, and ViT for the detection of retinal diseases using OCT images. The model classifies images into four classes: CNV (Choroidal neovascularization), AMD, Drusen, and Normal. The results revealed that Conv-ViT outperformed current models, achieving a weighted average accuracy of 94%, an F1-Score of 0.9436, and class-wise accuracy of up to 98% for the Normal class.
In the same vein, the work of Philippi D. et al. [30] proposed a model based on Swin-UNETR for automatically segmenting retinal lesions in Spectral Domain Optical Coherence Tomography (SD-OCT) images. The model achieved superior accuracy compared to traditional CNN methods such as U-Net and U-Net3+, and it stood out for its lower computational cost, suggesting a promising balance between performance and efficiency for clinical applications. The effectiveness of CNNs and ViTs in the automated detection of glaucoma through retinal images was studied by Alayón et al. [31]. The researchers compared the performance of CNNs and ViTs in glaucoma detection using retinal images. Multiple architectures were evaluated, with a CNN (VGG19) achieving the highest AUC of 0.987. ViT reached accuracies of 95.8% and 93.8%, highlighting its potential with larger datasets. Additionally, He et al. [32] proposed a Swin-Poly Transformer model for classifying retinal diseases in OCT images, achieving 99.69% accuracy, 99.69% recall, and a 99.68% F1-Score. The model effectively highlighted abnormal areas, suggesting its utility for early detection of retinal diseases. Hwang et al.[33] compared ViTs and CNNs in detecting Glaucomatous Optic Neuropathy (GON) using six public datasets. ViTs showed superior performance with an AUC 5% higher than CNN and greater sensitivity, suggesting that ViT models could improve accuracy in GON detection and help prevent blindness from glaucoma.
Researchers Mallick et al. [34] used Classical ViT, Swin Transformer, and CNNs with transfer learning to detect glaucoma using the REFUGE, RIM-ONE DL, and DRISHTI-GS datasets. Swin Transformer, pre-trained on ImageNet22k, achieved 96.7% accuracy, 97.6% AUC, and 99.0% sensitivity, demonstrating its effectiveness in glaucoma detection. Wassel et al. [35] employed ViTs to classify glaucoma in fundus images by combining multiple public datasets. The models achieved up to 94.5% accuracy and an AUC of 98.4%. Swin Transformer stood out in ensembles, improving class separation and showing good inference times. In their work, Wu et al. [36] evaluated the use of ViTs for grading diabetic retinopathy, comparing it with CNNs. ViT outperformed CNNs in accuracy and sensitivity, achieving 90.5% accuracy compared to CNNs' 85.7%, highlighting its ability to capture global features in fundus images.
2.2. Comparative Studies of Deep Learning in Other Areas of Healthcare
Studies on ViTs emphasize the ability of these architectures to process images through global attention, whereas the study of CNNs greatly revolves around the ability of these networks to extract local features via convolutions. Researchers Li J. et al. [37] compared Transformer and CNN architectures in medical image analysis. Transformers were reported to stand out due to their contextual understanding facilitated by large receptive fields, although they were reported to be more computationally intensive. They also showed potential in segmentation tasks and improved performance across various medical tasks. Cantone M. et al. [38] compared the performance of ViT- and CNN-based architectures used in mammograms for breast cancer detection. The study highlighted that while transformer-based architecture did not generally outperform CNNs, the SwinV2 model showed promising results. Limitations mentioned include the lack of exhaustive statistical analysis, the use of binary rather than multi-label classification, and the absence of hyperparameter optimization.
Jahangir R. et al. [39] focused on brain tumor classification in Magnetic Resonance Imaging (MRI) using BiT (Big Transfer) and ViT. BiT outperformed ViT in both training (100% accuracy, recall, and F1-Score) and testing (95.93% accuracy, 95.92% recall, and 95.92% F1-Score). Nurgazin M. et al. [40] used ViT models to classify medical images in few-shot learning scenarios. Algorithms, data augmentation, and domain transfer were analyzed. When combined with ProtoNets, ViT outperformed CNNs and achieved competitive results in these challenging scenarios. Nafisah S. et al.[41] comparatively analyzed CNN and ViT models in the context of detecting COVID-19 in chest X-rays using the COVID-QU-Ex dataset. EfficientNetB7 (CNN) achieved the highest accuracy (99.82%), followed by SegFormer (ViT). Segmentation and data augmentation improved the results, and the study suggests that ViT is a promising alternative to CNNs. Similarly, Fanizzi A. et al. [42] classified recurrence in non-small cell lung cancer (NSCLC) patients using ViTs and CNNs in a dataset of 144 patients. Pre-trained ViTs showed promising results, but the study emphasized the need for validation on larger datasets for effective clinical application.
Asiri A. et al. [43] performed a classification of brain tumors using 4,855 training images and 857 test images with ViT models (R50-ViT-l16, ViT-b16, ViT-l16, ViT-l32, ViT-b32). ViT-b32 achieved an accuracy of 98.24%, surpassing previous approaches. Key metrics ranged from 90.31% to 98.24%, highlighting the potential of ViTs in medical imaging. Xiong X. et al. [44] segmented head and neck cancer lesions in PET-CT images (Positron Emission Tomography-Computed Tomography) using U-Net and U-Net-CBAM. U-Net-CBAM outperformed U-Net in segmenting small lesions. Metrics included Dice coefficient and distance errors. CNNs and ViTs proved promising in tumor segmentation in medical images. Sherwani P. et al. [45] compared ViT, DeepViT, and CaiT (Class-Attention in Image Transformers) for detecting Alzheimer's disease in MRI scans. ViTs outperformed CNNs in both accuracy and efficiency, achieving four times the performance. The models were trained for 90 epochs with a learning rate of 0.001 and a dropout rate of 0.3. ViT architectures demonstrated great potential for early Alzheimer's detection. Researchers Ma D. et al. [46] evaluated ViTs and CNNs across six medical tasks using pre-trained models and self-supervision (SimMIM and MoCo v3). With random initialization, ViT-B and Swin-B did not outperform ResNet-50; however, pre-trained models on medical data enabled transformers to compete with CNNs, highlighting the importance of self-supervision. Deininger L. et al. [47] studied the detection of tumors in tissues, such as colorectal cancer, lymph nodes, lymphoma, and breast and lung cancers, using histological images. The authors used 256x256 patches at 20x magnification with a 90% overlap. Models were trained and tested on various datasets, including Camelyon16 for detecting metastatic tumors in lymph nodes, achieving AUC scores of 0.887 and 0.919 with ResNet18 and DeiT-Tiny at 10x magnification. The results were compared with state-of-the-art methods, showing similar performance in digital pathology tasks.
Efforts in skin lesion detection and segmentation have also been reported. Gulzar Y. et al. [48] tackled melanoma using images from the ISIC dataset. CNN outperformed dermatologists in detection. TransUNet performed better in precision, recall, and accuracy in Intersection over Union (IoU). Hybrid architectures required more training and inference time than U-Net and V-Net, highlighting their differences. On the other hand, Yang H. et al. [49] compared microorganism image segmentation using CNN and ViT. U-Net++ achieved 95.32% pixel-level accuracy, followed by ViT (95.31%). ResNet50 reached 90% for patches, while ViT had the lowest at 89.25%. ViT outperformed most CNNs in pixel segmentation. Yang Y. et al. [50] also compared five deep-learning models for pneumonia recognition in 3,150 chest X-rays, with 80% for training and 20% for testing. LeNet5, AlexNet, MobileNet, ResNet18, and ViT were evaluated. Accuracy did not improve significantly due to the limited size of the dataset and insufficient data augmentation. Hu W. et al. [51] classified pathological images of gastric cancer using the GasHisSDB database, which contains 245,196 images. Five color and texture features were extracted. Deep learning methods outperformed traditional ones, achieving 95% accuracy and an F1-Score of 0.94 in image classification. Finally, Galdran A. et al. [52] compared the performance of CNN and ViTs in classifying diabetic ulcers. CNNs outperformed Transformers with limited data, emphasizing their spatial correlations. Optimization with the Segment Anything Model (SAM) improved both models, with CNN+SAM achieving superior performance in F1-Score, AUC, recall, and accuracy.
Table 1 below summarizes the data from the works analyzed:
If compared to the existing literature, this research evaluates five specific ViT architectures – Classical ViT, Swin Transformer, BEiT, SwinV2, and SwiftFormer – without interference from other architectures. This enabled us to conduct a more accurate assessment of the performance of these models and better understand their capability in AMD detection. Moreover, our focus on AMD detection offers a differentiated contribution. Although several studies compare ViTs and CNNs in diseases such as glaucoma and diabetic retinopathy, research on AMD has been addressed in a more limited manner. In other words, this work provides a specific and detailed analysis of the efficacy of different ViT variants in detecting AMD, significantly contributing to the advances in ophthalmologic research.
Another relevant aspect of this research is the study of ViT architectures in fundus imaging. Studies such as those of Lin Goh et al. and Wu et al. have focused on diabetic retinopathy or general disease. Here, we address five ViT architectures in the context of AMD detection, providing a more in-depth analysis of how these variants influence diagnostic accuracy. Also included is an evaluation of each architecture's processing time and computational efficiency. Unlike the studies of Wassel et al. and Mallick et al., which discuss the computational performance of ViT from a general perspective, this work provides a precise quantitative comparison, allowing us to identify which ViT architecture presents the best balance between diagnostic accuracy and efficiency, a key factor for use in clinical settings.
Finally, this study explores ViT generalization capabilities in the specific context of AMD, evaluating how these models perform under domain transfer scenarios. In contrast to works that revolve around the transfer of pre-trained models in general datasets, such as ImageNet, we investigate the adaptation of these models to specific ophthalmologic data, providing a more focused analysis of their performance in clinical practice.
3. ViT Architectures Included in the Study
This study explores the performance of several ViT architectures applied to ophthalmic image classification to identify models that offer diagnostic accuracy and computational efficiency in analyzing pathologies such as AMD. The selected architecture includes both classical versions and recent evolutions of transformers, highlighting their ability to handle high-resolution images and process visual information globally and locally. The following is a detailed description of the architectures evaluated, providing a comparative analysis based on their suitability for diagnostic fundus imaging.
3.1. Vision Transformer
ViT [6], also referred to as Classical ViT (Figure 1), introduces the use of transformers, originally designed for natural language processing, in image analysis. ViT divides images into patches and uses attention mechanisms to capture global relationships [53]. It is suitable for ophthalmological image analysis, such as drusen detection in AMD patients. Its ability to process global information enables a comprehensive evaluation of medical images. ViT has demonstrated competitive performance in previous studies [54], and its inclusion in this work aims to evaluate its performance in ophthalmic image classification against other architectures.
3.2. Swin Transformer
Swin Transformer [19] (also referred to as Shifted Window Transformer) is an evolution of the Vision Transformer (ViT) model, designed to address some of the inherent limitations of transformer-based models when applied to computer vision tasks. Swin Transformer was selected in this study for its ability to handle high-resolution images using a sliding window mechanism, which optimizes computational resources by limiting attention to local subsets without losing global detail. This architecture (Figure 2) is suitable for analyzing ophthalmological images, where details and overall structures are essential for detecting pathologies such as AMD. Its outstanding performance in benchmarks such as ImageNet [55] and its potential to improve diagnostic accuracy justifies its inclusion in this study.
3.3. BEiT
BEiT (Bidirectional Encoder representation from Image Transformers) [20] is a computer ViT architecture developed to improve the capability of self-monitoring models in image understanding.
BEiT (Figure 3) was selected for its auto-supervised pre-training approach [56], which allows robust representations to be learned from unlabeled data, an advantage in areas such as ophthalmology where labeled data is limited. BEiT decomposes images into visual tokens to identify key patterns, which facilitates the detection of relevant features in fundus images. This study evaluates its performance in medical image classification, comparing it with traditional and emerging architectures, highlighting its potential in pre-accuracy and generalization, crucial aspects for AMD diagnosis.
3.4. Swin Transformer V2
Swin Transformer V2 [21] is an improved version of Swin Transformer, designed to address the limitations of its predecessor and further optimize performance in computer vision tasks. Swin Transformer V2 (Figure 4) introduces several enhancements that extend the capability of handling high-resolution images and improves computational efficiency.
Swin Transformer V2 optimizes the stability and scalability of the original Swin Transformer model, maintaining the use of sliding windows and incorporating improvements such as logarithmic variance scaling. This architecture is designed to handle high-resolution images, a key aspect in ophthalmology due to their complexity. Its ability to work with limited datasets without loss of accuracy is critical in clinical contexts with a scarcity of labeled data. This study evaluates whether these improvements positively impact the model’s performance in classifying ophthalmologic images compared to other architectures.
3.5. SwiftFormer
SwiftFormer [22] is a recent architecture that seeks to optimize the efficiency and performance of ViT models for computer vision tasks. Designed to be lightweight and fast, SwiftFormer (Figure 5) focuses on reducing computational complexity without compromising accuracy in visual feature detection and classification.
SwiftFormer was included in this study because of its focus on computational efficiency, a key feature in real-time ophthalmic diagnostic applications. Its lightweight design allows it to perform complex image classification tasks without compromising accuracy, making it ideal for hardware-limited environments. Despite its simplicity, SwiftFormer maintains competitive accuracy against more complex architectures. This study evaluates whether its trade-off between efficiency and accuracy is an advantage in medical image classification, particularly in diagnosing AMD.
Table 2 below summarizes the main characteristics of the five ViT models to be studied to facilitate a clear understanding of their characteristics.
4. Comparative Analysis Methodology
We followed a systematic and structured methodology to evaluate the ViT models (ViT, Swin Transformer, BEiT, SwiftFormer, and Swin Transformer V2)). This methodology comprised four phases (1) Image Acquisition: Images were sourced from external databases; (2) Dataset Composition: This phase involved manual classification, medical validation, and data augmentation to ensure the dataset's robustness and reliability; (3) Model Training: The ViT models were trained with comprehensive hyperparameter tuning to optimize their performance; and (4) Performance Evaluation: Model performance was assessed using metrics such as accuracy, recall, F1-score, and confusion matrices.
A detailed outline of this methodology is provided in Figure 6, and each phase is described in detail in the sections below.
4.1. Image Acquisition and Dataset Composition
We curated an initial dataset of 305 fundus images from clinical sources and publicly available databases [57,58]. Medical experts specializing in ophthalmology [59,60] reviewed and validated these images to ensure their clinical relevance and accuracy. The dataset included a balanced representation of the various stages of AMD degeneration: No AMD, Mild, Moderate, and Advanced. To evaluate the multiple ViT architectures, the dataset was segmented into three subsets: a training set, a validation set, and a testing set, following a 70-15-15 percent ratio.
The training set, comprising 214 images, underwent data augmentation [61] to increase its diversity and robustness. This process involved applying random transformations, including size changes, rotations between -5° and 5°, and modifications to brightness and contrast. The transformations were intentionally kept subtle, as we observed during training that applying overly drastic modifications or generating a large number of augmented versions of an image (exceeding 10 per original image) introduced noise into the training process, adversely affecting model performance. Figure 7 illustrates examples of the augmented images.
The data set was also expanded to a total of 911 images. Of these, 819 images were intended for training, while the remaining 92 images were divided equally between the validation and test sets, with 46 images in each.
The validation set was used during training to adjust the hyperparameters of the models and evaluate their performance on previously unseen data. The test set, on the other hand, was reserved for the final evaluation of the models' performance, providing an objective measure of their ability to generalize to new data.
4.2. Model Training
The evaluation of the ViT architectures was meticulously designed to provide an accurate and comprehensive measure of the performance of these models in detecting characteristics associated with AMD degeneration. The steps followed in this evaluation process are described below:
- 1.
- Model Training. The five architectures (classic ViT, Swin Transformer, BEiT, Swin Transformer V2, and SwiftFormer) were trained using an extended training dataset. This process included data augmentation techniques to improve the diversity and robustness of the models.
- 2.
- Validation during Training. Periodic validation was performed during training using the validation set to adjust the hyperparameters and reduce the risk of overfitting. Key metrics, such as accuracy, sensitivity, and F1-Score, were monitored to select the optimal model at each iteration. Table 3 shows the hyperparameters that obtained the best performance for each model evaluated.
- 3.
- Evaluation in the Test Data Set. After completing training, each model was evaluated using the reserved test set, which allowed for measuring the performance of the models on completely new and previously unseen data. Evaluation metrics included accuracy, sensitivity, specificity, F1-Score, and the area under the ROC curve (AUC-ROC).
- 4.
- Comparison of Results. Results were cross-compared to identify the strengths and weaknesses of each model. Particular emphasis was placed on analyzing performance variations across the stages of AMD (non-AMD, mild, moderate, and advanced) and understanding how each model handled these differences.
- 5.
- Visualization of Results. Graphs and tables were computed to visualize the results clearly and understandably. Materials included confusion matrices, ROC curves, and bar charts comparing key metrics between the models.
This evaluation procedure offered an objective and detailed comparison of the different ViT architectures, providing a solid basis for their selection and implementation in clinical practice.
4.3. Performance Evaluation
The ViT models were evaluated with respect to the following metrics [62]:
- Precision. Refers to the proportion of images correctly diagnosed as positive for AMD among all those classified as positive. In this context, it measures the ability of the ViT models to avoid false positives, i.e., when an image without AMD is incorrectly diagnosed as positive.
- Recall. Measures the proportion of images correctly identified with AMD among all those that actually show the disease. It evaluates a model's ability to detect all cases of AMD, avoiding false negatives. A high recall value indicates that the model is sensitive to identifying all images with AMD, including the most difficult-to-diagnose cases.
- F1-Score. Provides a measure of the balance between the model's ability to correctly diagnose positive cases (accuracy) and its ability to detect as many AMD cases as possible (recall). A high F1-Score indicates that the model performs well overall in classifying images with the disease.
- Accuracy. Represents the proportion of correctly classified images, both with and without AMD, in relation to the total number of images analyzed. This metric encompasses the classification accuracy of images with and without the disease. High accuracy indicates that the model correctly classifies the presence or absence of AMD in the images.
5. Results and Discussion
The following section presents a detailed analysis of the results obtained from the comparative evaluation of the ViT models. This analysis encompasses results for both performance metrics and computational efficiency, offering an in-depth discussion of each architecture's capabilities in detecting AMD at its various degeneration stages. We provide a comprehensive assessment of the models' behavior on both the validation and test sets. Furthermore, we examine the strengths and limitations of each model, highlighting potential areas for optimization and future improvement.
5.1. Accuracy
Table 4 summarizes the overall accuracy of the evaluated models, thus offering an overview of the performance of each model in classifying fundus images across the different stages of AMD. The overall accuracy results are reported for both validation (the validation data set) and testing (the test data set) for comparison purposes.
The data in the table reveal notable variability in the performance of various ViT models in validation and testing, allowing for key inferences about their effectiveness in detecting AMD.
The Classic ViT model demonstrated solid performance in both validation (0.8695) and testing (0.8043), with an average of 0.8369, indicating consistency and reliability in controlled and real-world environments, making it a viable option for clinical applications. The Swin Transformer presented acceptable performance in validation (0.7826) and testing (0.7391), but it exhibited the lowest average score (0.76085) among the evaluated models, suggesting a reduced capacity for generalization and thus limiting its applicability in environments with high data variability. BEiT stood out for its balance, achieving high results in both validation (0.8478) and testing (0.8043), averaging 0.82605 and thus indicating effective management of data variability. Swin Transformer V2 showed a slight improvement in testing (0.7826) compared to its predecessor, although it exhibited lower performance in validation (0.7608), resulting in an average of 0.7717, which may limit its reliability in practical applications. Finally, SwiftFormer performed well, with an average accuracy of 0.8152 and high scores in validation (0.8478) and testing (0.7826), suggesting that it is a reliable option for AMD detection, combining accuracy and generalization capabilities.
5.2. Precision
Class-specific precision enables us to evaluate the performance of each ViT model in classifying the different stages of AMD: No AMD, Mild, Moderate, and Advanced. Table 5 summarizes the precision results by class or AMD stage, offering insight into the ability of each model to minimize false positives in each category.
Figure 8 shows significant variability in the precision of the models based on the class and data set. ViT and BEiT emerged as promising options for detecting AMD at various stages, while SwiftFormer excelled in extreme cases ("No AMD" and "Advanced"), suggesting the need for careful model selection based on the clinical context. Additionally, ViT exhibited outstanding performance in the "Advanced" class, achieving perfect precision (1.0000) across all data sets; however, in the "Moderate" class, precision decreased to 0.7142 in testing, indicating potential generalization difficulties. Swin Transformer exhibited balanced performance, with a consistent precision of 0.8333 in "No AMD" and 1.0000 in "Advanced" during testing, although inconsistencies were observed in other classes. BEiT excelled in the "Moderate" class, averaging 0.8873. Swin Transformer V2 exhibited irregular performance, with low precision in "No AMD" (0.4000) and high precision in "Advanced" (1.0000). SwiftFormer maintained precision in "No AMD" and "Advanced" classes but decreased to 0.6666 in "Moderate" during testing, indicating variability in generalization.
5.2. Recall
Recall, or the true positive rate, measures the model's ability to correctly identify positive cases. It is particularly important in disease detection, as the goal is to identify as many cases as possible. Table 6 presents the sensitivity results by class (AMD stage).
Figure 9 shows that the BEiT and ViT models excelled in classifying AMD, particularly in the moderate and advanced stages ("Moderate" and "Advanced" classes). Swin Transformer and Swin Transformer V2 performed better in the early (Mild) and moderate stages, while SwiftFormer maintained balanced performance in extreme cases.
ViT demonstrated notable performance in the "Moderate" class, achieving perfect recall (1.0000) in testing and an average of 0.9333, although it decreased to 0.7000 in the "Advanced" class, suggesting difficulties in distinguishing between severe cases. Swin Transformer exhibited inconsistent performance, with low sensitivity in "No AMD" and "Advanced" classes (0.4000) but a solid performance in "Mild" (0.8809) and "Moderate" (0.8333) classes. BEiT stood out in "Advanced" with perfect recall (1.0000) in validation and an average of 0.9000, although it exhibited variability in "No AMD" (0.5000). Swin Transformer V2 also showed low recall in "No AMD" and "Advanced" (0.4000) classes but performed well in "Mild" (0.8333) and "Moderate" (0.8667). SwiftFormer remained balanced in "Advanced" with perfect recall (1.0000) in validation, although its score decreased to 0.8000 in testing. In the "Mild" class, it exhibited a solid average of 0.8809.
5.3. F1-Score
The F1-Score, being the harmonic mean of precision and sensitivity, balances both metrics and is useful for evaluating model performance when both are important. Table 7 presents the F1-Score results by class.
As shown in Figure 10, BEiT and ViT excelled in the classification, particularly in the Moderate and Advanced stages of AMD, while SwiftFormer maintained balanced performance across all classes. Swin Transformer and Swin Transformer V2 exhibited significant variations, suggesting that their effectiveness depends on the specific class of AMD.
The Classic ViT achieved an average F1-Score of 0.8547 in the "Mild" class and 0.8500 in the "Moderate" class, indicating high precision and consistency. However, the model exhibited a declined value of 0.8194 in the "Advanced" class, suggesting lower generalization capabilities in severe cases. Swin Transformer recorded an average F1-Score of 0.5357 in "No AMD," improving to 0.8222 in "Mild" and 0.7813 in "Moderate." BEiT stood out in the "Advanced" and “Mild” classes with average F1-Score values of 0.8636 and 0.8534, respectively. However, its performance declined in the "No AMD" class with 0.5857. Swin Transformer V2 performed poorly in "No AMD" (0.4857) but improved in "Mild" (0.8050) and "Moderate" (0.8286). However, it declined once more in the "Advanced" class (0.6857 ). SwiftFormer maintained a balanced performance with averages of 0.8494 in "Mild," 0.8333 in "Moderate," and 0.7917 in "Advanced," indicating a good capacity to identify severe cases.
5.4. Comparison Between Validation and Test Datasets
Comparing the performance of the models in both validation and testing offers valuable insight into the generalization capabilities of each model in detecting dry AMD. Such a comprehensive comparison helps identify issues of overfitting and variability, ensuring reliable performance on unseen data. Evaluating both data sets provides a realistic measure of the models' potential for clinical application. Table 8 summarizes the performance results of the five ViT models with respect to the metrics of precision, recall, and F1-Score, across both the validation and testing data sets.
Figure 11 compares precision results across the five ViT models, revealing that ViT consistently performed well across the "Advanced" and "Moderate" classes, with values approaching 1.0 in both the validation and testing. BEiT also exhibited strong precision, particularly in the "Moderate" class. In contrast, Swin Transformer and Swin Transformer V2 demonstrated lower performance in the "No AMD" class in both validation and testing, indicating potential challenges in generalizing for this specific class. SwiftFormer displayed relatively balanced precision overall, although a slight decline was observed in the "Moderate" class during testing.
As depicted in Figure 12, ViT and BEiT recorded high sensitivity in the "Advanced" and "Mild" classes. ViT achieved a value of 1.0 in "Moderate" in the test set, while BEiT maintained perfect recall in the "Advanced" class during validation. Swin Transformer and Swin Transformer V2 demonstrated variability, particularly in the "No AMD" class, suggesting that these models may struggle to detect cases of early stages of AMD.
F1-Score performance during validation and testing was charted for the five models, as depicted in Figure 13. ViT and BEiT exhibited solid performance in the "Moderate" and "Advanced" classes. ViT achieved a high F1-Score in both classes, while BEiT excelled in "Mild" and "Moderate." Swin Transformer and Swin Transformer V2 demonstrated greater variability in their scores, particularly in the "No AMD" and "Advanced" classes. SwiftFormer exhibited balanced performance across all classes, although slight inconsistencies were noted in the "Moderate" class during testing, suggesting good generalization capability but with areas for improvement.
We conducted a comparative analysis of precision, recall, and F1-Score for the five ViT models in the validation and testing data sets. These results are presented below and offer valuable insight into the strengths and areas for improvement of each model.
As depicted in Figure 14, ViT and BEiT models performed consistently during both validation and testing in the "Advanced" and "Moderate" classes. However, models such as Swin Transformer and Swin Transformer V2 exhibited a decrease in the "No AMD" class, suggesting potential difficulties in generalizing to less severe classes. Finally, SwiftFormer stood out for its balance across all classes, although it also exhibited some variability in the "Moderate" class during testing.
As regards Recall results (Figure 15), BEiT and ViT achieved high sensitivity in the "Advanced" and "Mild" classes. In contrast, Swin Transformer and Swin Transformer V2 exhibited inconsistent performance, particularly in the "No AMD" class. BEiT's perfect sensitivity in the "Advanced" class during validation suggests its ability to detect the most severe cases of AMD accurately, although variability was also observed in other classes for that same model.
The comparative analysis of the F1-Score shown in Figure 16 indicates that ViT and BEiT exhibited solid and balanced performance in the "Moderate" and "Advanced" classes. In contrast, the Swin Transformer and Swin Transformer V2 models displayed more significant variability in their scores, especially in the "No AMD" and "Advanced" classes. SwiftFormer maintained balanced performance across all classes, suggesting good generalization capabilities and precision, although it exhibited slight inconsistencies in the "Moderate" class.
5.5. Analysis of ROC Curves
ROC curves display the Y-axis's true positive rate (TPR) and the X-axis's false positive rate (FPR). The "ideal" point is located in the upper left corner, with an FPR of zero and a TPR of one, although this is rarely achievable in practice. A larger area under the curve (AUC) generally indicates better model performance. The slope of the ROC curve maximizes TPR while minimizing FPR.
ROC curves are commonly used in binary classification. In multiclass classification, the output can be binarized in two ways:
- One-vs-Rest (OvR): This strategy, also known as one-vs-all, calculates a ROC curve for each class. Each iteration considers a specific class positive, while the remaining classes are grouped as negative. This approach evaluates a model's performance in classifying each class separately.
- One-vs-One (OvO): This strategy trains a classifier for each pair of classes. Which increases complexity and computation time compared to the one-vs-all (OvA) approach. Although it is more computationally expensive, it allows for a more detailed analysis of the differences between each pair of classes.
We implemented the OvR strategy as it is well-suited for multiclass classification. Additionally, we employed the micro-average, which aggregates the contributions of all classes to calculate the average metrics. This approach is particularly useful when dealing with highly imbalanced classes. The results for each evaluated ViT model or architecture are presented below.
5.5.1. ViT
As depicted in Figure 17, ViT demonstrated high performance during validation and testing, with micro-averages of 0.96 and 0.93, respectively, remaining well above the level of chance. Similar to BEiT, ViT achieved a high actual positive rate in the validation set, although its performance slightly decreased in the same class during testing. Regardless of this decline, ViT still recorded an AUC of 0.93, which is significantly higher than the chance level. Excluding the "No AMD" class in validation, the model exceeded 0.90 in all classes across both data sets, indicating its overall strong performance.
5.5.2. Swin Transformer
As Figure 18 depicts, the ROC curves remained well above the chance level for Swin Transformer, indicating that the classification was not random. Micro-average performance was satisfactory, exceeding 0.91. The model was proved to be consistent, with an AUC ranging from 0.86 to 0.89 in most cases, except in the "Advanced" and "No AMD" classes in both data sets – validation and testing – where AUCs of 0.94 and 0.95 were recorded, respectively. Overall, it can be concluded that the Swin Transformer model exhibited accurate results in its classifications.
5.5.3. BEiT
In Figure 19, the results for BEiT are presented, where the ROC curves for three of the four classes remain well above the chance level, with areas under the curve exceeding 0.90 in most cases. The exception is the "No AMD" class in both sets, although it remains above 0.80. The best performance is observed in the "Advanced" class, with an AUC of 1.0 in validation and 0.95 in testing, confirming that the classification is not random. Since the "Moderate" and "Mild" classes have a larger sample size than the "Advanced" and "No AMD" classes, it is noteworthy that the micro-average reaches and exceeds 0.92 in both sets, indicating satisfactory overall performance.
5.5.4. Swin Transformer V2
The ROC curves remained well above the chance level for Swin Transformer V2 (see Figure 20), indicating that the classification was not random. At first glance, the model appeared to perform similarly to the original Swin Transformer model; however, closer inspection of the individual ROC curves revealed some differences. The micro-average AUC was satisfactory and consistent at 0.90. Unlike the original Swin Transformer, Swin Transformer V2 exhibited slight variations among classes in both validation and testing. In the testing set, performance improved progressively across classes, with the "Advanced" class showing the lowest performance and the "Moderate" class the highest. The AUC never declined below 0.80, confirming that Swin Transformer V2 effectively classified all classes well above the chance level and achieved accurate classification results.
5.5.5. SwiftFormer
Micro-average performance was also satisfactory for SwiftFormer, exceeding 0.9 this time. The model performed below 0.9 in the "Mild" class in validation and testing and unevenly below 0.9 in the "No AMD" and "Moderate" classes in validation and testing, respectively. However, the model remained above 0.8 in all cases, indicating overall good performance and surpassing the chance level.
Figure 21.
ROC Comparison for SwiftFormer Model in Validation and Testing.
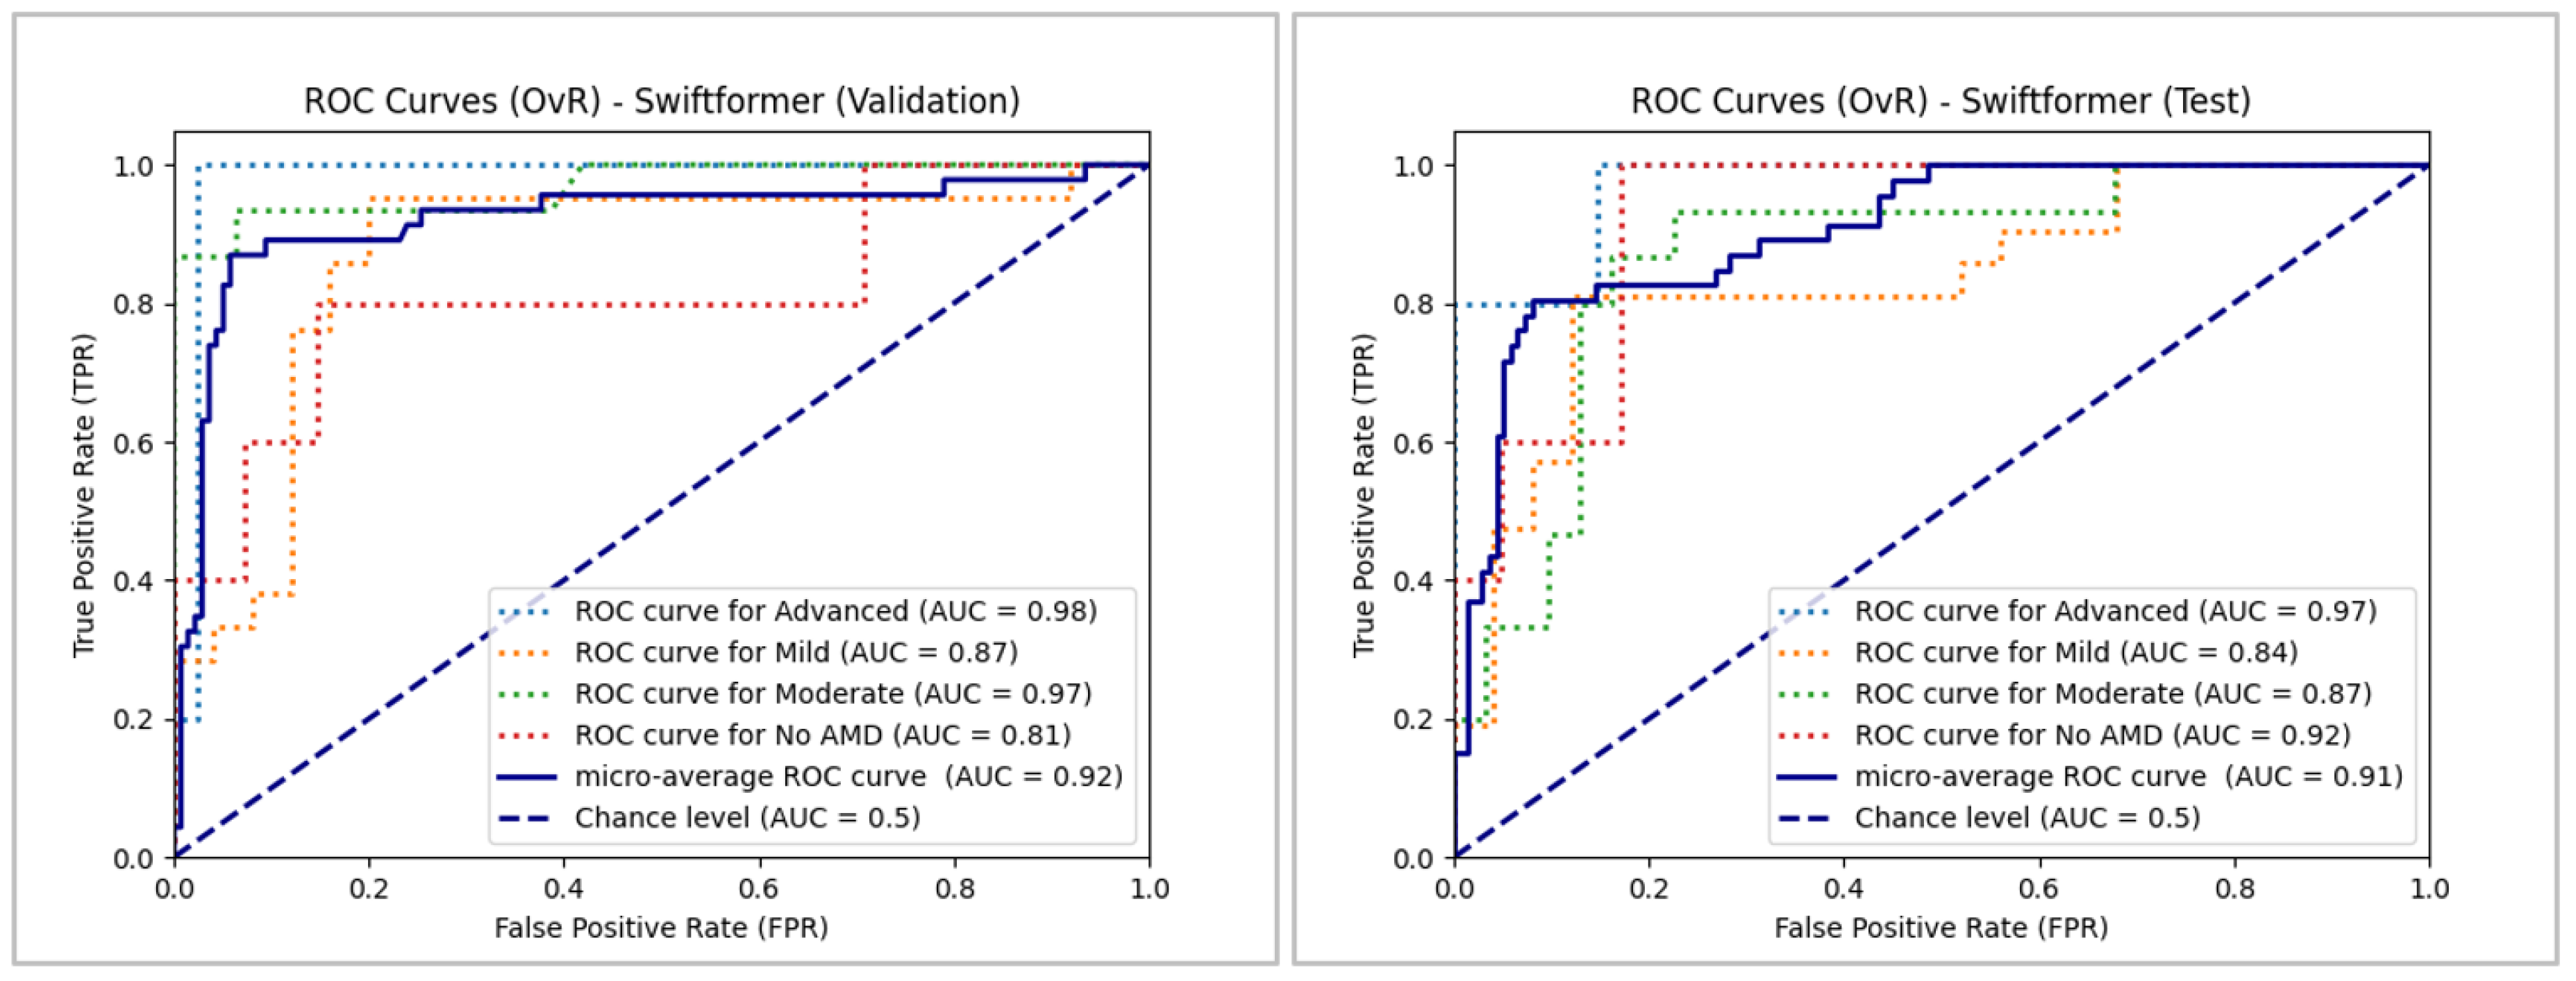
Our analysis reveals subtle differences in performance across the five ViT models, which is likely attributable to the margin of error stemming from the small sample size and class imbalance. Notably, the models face greater challenges in accurately classifying the "No AMD" class. Despite these slight variations, ViT achieved the highest classification performance, closely followed by BEiT. The remaining models also maintain efficient performance in the classification task overall.
5.6. Confusion Matrix
The following confusion matrices (Figure 22) were computed to analyze and compare the performance of each model, providing detailed information about their classification capabilities. These matrices allowed for identifying specific strengths and weaknesses of each architecture to better understand each model’s effectiveness in clinical practice and its potential implementation in telemedicine systems.
The analysis of the confusion matrices revealed significant findings regarding the performance of the ViT-derived architectures. Overall, all the models demonstrated a notable ability to detect moderate and advanced cases of AMD. BEiT recorded an accuracy of 80% in the "Moderate" class and 90% in "Advanced," while Swin Transformer achieved 83.3% in the "Moderate" class and 40% in the "Advanced" class. However, the models faced challenges in correctly classifying cases without AMD (No AMD) and mild cases. For example, SwiftFormer incorrectly classified 50% of the No AMD cases as Mild, which could lead to misdiagnoses and unnecessary treatments.
The Classic ViT model also demonstrated solid performance, with an accuracy of 93.3% in the "Moderate" class and 70% in the "Advanced" class. Although all the models showed high sensitivity in the moderate and advanced categories, there is a recognized need to improve specificity. Swin Transformer V2 displayed a good balance between precision and sensitivity across all categories, with an accuracy of 60% in the "Advanced" class and high performance in the "Moderate" and "Mild" classes. Optimizing these models for detecting AMD at earlier stages could enhance disease intervention and management.
These results suggest that, while ViTs have great potential for detecting AMD, further optimization is needed to improve specificity without compromising sensitivity. Implementing fine-tuning techniques and using more significant, diverse datasets could help overcome these limitations and enhance the clinical applicability of ViT models.
5.7. Computational Efficiency
Table 9 presents a comparative analysis of the computational efficiency of the evaluated models, including data on training and inference times, memory consumption, number of parameters, FLOPs, and energy efficiency. The training, which was conducted through a fine-tuning process, and the evaluation of the models were performed using hardware consisting of an AMD Ryzen 5 3500X 6-core CPU, an NVIDIA RTX 3070 GPU with 8 GB of memory, and 16 GB of DDR4 RAM.
The SwiftFormer model distinguished itself due to its reduced training time (4.60 minutes), which was reflected in lower memory consumption (3.86 GB) and high energy efficiency (131.46 W). With a low number of parameters (23.14 million) and FLOPs (0.61 GFLOPs), SwiftFormer is an architecture optimized for efficient resource use. In contrast, Swin Transformer V2 required the longest inference time (37.14 ms) despite having a relatively low number of parameters (27.58 million) and FLOPs (5.96 GFLOPs), suggesting greater computational complexity. Its training time was intermediate (13.45 minutes). BEiT exhibited metrics similar to ViT but recorded the longest training time (17.55 minutes), higher memory consumption (7.70 GB), and greater energy consumption (177.56 W), making it advantageous in scenarios where accuracy is a priority, and resources are abundant. The Classic ViT balanced training time (17.38 minutes) and inference time (14.31 ms) with an energy consumption of 175.82 W. This makes it sui3 for applications that balance energy efficiency and computational performance. Finally, Swin Transformer displayed a relatively low training time (9.92 minutes) and below-average memory consumption (5.52 GB). With 27.52 million parameters and 4.51 GFLOPs, it offers a good ratio between complexity and performance.
6. Conclusions
This study offers a comprehensive overview of the performance of five ViT architectures – Classic ViT, Swin Transformer, BEiT, Swin Transformer V2, and SwiftFormer – in detecting AMD. Significant differences were observed in the classification capabilities of these models as measured through key metrics of accuracy, precision, sensitivity, F1-Score, and area under the ROC curve (AUC-ROC). Classic ViT stood out for its consistency, achieving the highest average accuracy (83.69%), thus highlighting its robustness in clinical scenarios where precision is essential. However, its performance declined in the "Moderate" class, suggesting limitations in its ability to perform generalizations in this category.
BEiT exhibited outstanding performance in the "Advanced" class, with a high micro-average in validation and testing. However, its precision in the "No AMD" class was lower compared to other models. This indicates that BEiT can effectively detect severe cases of AMD but may benefit from adjustments to improve its accuracy in less severe classes. Swin Transformer and Swin Transformer V2 provided balanced performance, although with variations across classes. Swin Transformer V2 excelled with high AUC in most classes, reaching an AUC of 0.96 in the "Advanced" class during validation. This indicates its potential for detecting AMD in early and moderate stages, although it may require improvements in advanced classes. Finally, SwiftFormer demonstrated balanced performance across all classes, with some inconsistencies in the "Moderate" class. Its high precision in the "No AMD" and "Advanced" classes reflects good generalization ability and low computational requirements, making it a viable option for clinical settings with limited resources.
Variability in model performance across the different classes or AMD stages suggests that there is no single optimal solution for all cases, and combining different models may be an effective strategy for improving diagnostic accuracy in clinical practice. Beyond ophthalmological applications, ViT-based architectures have significant potential in other areas of healthcare. In oncology, these models have shown superior performance in detecting breast cancer in mammograms and brain tumors in MRI scans, which could enhance early diagnosis and treatment. In neurodegenerative diseases, such as Parkinson's disease and Alzheimer's disease, ViT could facilitate the early identification of biomarkers in MRI scans, improving the diagnosis and management of these conditions.
Moreover, integrating ViT architectures into telemedicine platforms could revolutionize healthcare by providing accurate diagnoses in remote areas, enhancing equity in health access, and optimizing medical resources. Ongoing research and development in this field will enable the creation of technological tools that transform healthcare worldwide, making it more precise, efficient, and accessible.
7. Future Work
Developing a telemedicine platform for detecting AMD is envisioned as a key component for future work. This solution would facilitate accurate and timely diagnoses for patients in remote areas and optimize the monitoring and treatment of the disease. In this context, ViT models could demonstrate their capability to identify rare pathologies, expanding their application in the ophthalmological field.
Several technological tools are being considered for implementing this platform. TensorFlow Serving is a viable option for efficiently and scalably deploying deep learning models in production. Additionally, Kubernetes is being evaluated for container orchestration, facilitating the deployment and management of applications in a microservice environment. Docker would allow for the creation of containers to ensure portability and consistency across development and production environments.
The platform's analysis and design shall follow a rigorous software engineering approach, utilizing agile methodologies that ensure rapid and efficient iterations and continuous integration and delivery (CI/CD). Tools such as Jenkins and GitLab CI/CD could be considered to automate testing and deployment, ensuring the quality and reliability of the software. To handle large volumes of ophthalmic image data, the use of NoSQL databases like MongoDB and distributed storage systems like Apache Hadoop is being evaluated, offering high availability and scalability.
Solutions like Prometheus and the ELK Stack (Elasticsearch, Logstash, Kibana) will manage continuous monitoring and incidents, ensuring optimal platform operation and maintenance. Together, these technologies promise to improve the detection and treatment of AMD and other ophthalmological diseases, establishing a scalable framework for future applications in visual health.
In terms of future research, we propose the exploration of biomarker detection in fundus images for neurodegenerative diseases such as Parkinson's disease and Alzheimer's disease. Identifying these biomarkers could contribute to the early diagnosis and effective management of these diseases. Integrating biomarkers into ViT models would enable the identification of subtle changes in the retina associated with early stages of neurodegenerative diseases, facilitating continuous and non-invasive monitoring of their progression. Transfer learning techniques could accelerate the development of specialized models for detecting neurodegenerative biomarkers, utilizing pre-trained models on large ophthalmic datasets. Additionally, implementing continuous monitoring systems with advanced technologies, such as imaging sensors and mobile devices, would allow for regularly capturing fundus images. These models could automatically analyze ViT images, improving the early detection of neurodegenerative diseases. This interdisciplinary approach promises significant advancements in preventing and treating complex diseases, benefiting physicians and patients.
Author Contributions
G.A.-H. and J.M.-M were involved in manuscript preparation. J.E.G.-D., A.J.R.-D., and J.L.S.-C. were involved in conceptualization, methodology, software, validation, formal analysis, investigation, resources, data curation, writing of original draft, reviewing and editing of writing. L.R.-M. was involved in the figures and tabulation of results. All authors were involved in collating the manuscript and formatting the same. All authors have read and agreed to the published version of the manuscript.
Funding
This research received no external funding.
Institutional Review Board Statement
This study did not require ethical approval.
Informed Consent Statement
Not applicable.
Data Availability Statement
The data supporting this study's findings are publicly available. The Baidu Research dataset can be accessed at https://ai.baidu.com/broad/download. Additionally, the "ARMD curated dataset 2023" is available on Kaggle at https://www.kaggle.com/datasets/rakhshandamujib/armd-curated-dataset-2023.
Acknowledgments
We thank Tecnológico Nacional de Mexico (TecNM, by its Spanish acronym) for supporting this work. This research was also sponsored by Mexico’s National Council of Science and Technology (CONACYT) and Mexico’s Secretariat of Public Education (SEP) through the PRODEP program.
Conflicts of Interest
The authors declare no conflict of interest.
References
- X. Zhao, M. Luo, and Y. Chen, “Age-Related Macular Degeneration,” in Atlas of Swept Source OCT and OCT Angiography, Y. Chen and X. Peng, Eds., Singapore: Springer Nature Singapore, 2023, pp. 97–113. [CrossRef]
- P. Udayaraju and P. Jeyanthi, “Early Diagnosis of Age-Related Macular Degeneration (ARMD) Using Deep Learning,” in Intelligent Systems and Sustainable Computing, V. S. Reddy, V. K. Prasad, D. N. Mallikarjuna Rao, and S. C. Satapathy, Eds., Singapore: Springer Nature Singapore, 2022, pp. 657–663. [CrossRef]
- J. Sanghavi and M. Kurhekar, “Ocular disease detection systems based on fundus images: a survey,” Multimed Tools Appl, vol. 83, no. 7, pp. 21471–21496, Aug. 2023, . [CrossRef]
- D. S. W. Ting et al., “Deep learning in ophthalmology: The technical and clinical considerations,” Prog Retin Eye Res, vol. 72, p. 100759, Sep. 2019, . [CrossRef]
- E. Crincoli, R. Sacconi, L. Querques, and G. Querques, “Artificial intelligence in age-related macular degeneration: state of the art and recent updates,” BMC Ophthalmol, vol. 24, no. 1, p. 121, Mar. 2024, . [CrossRef]
- A. Dosovitskiy et al., “An Image is Worth 16x16 Words: Transformers for Image Recognition at Scale,” ICLR 2021 - 9th International Conference on Learning Representations, Oct. 2020, Accessed: Mar. 16, 2024. [Online]. Available: https://arxiv.org/abs/2010.11929v2.
- K. Han et al., “A Survey on Vision Transformer,” IEEE Trans Pattern Anal Mach Intell, vol. 45, no. 1, pp. 87–110, Jan. 2023, . [CrossRef]
- A. Vaswani et al., “Attention Is All You Need,” Jun, Jun. 2017, . [CrossRef]
- B. Mbakwe, L. Wang, M. Moradi, and I. Lourentzou, “Hierarchical Vision Transformers for Disease Progression Detection in Chest X-Ray Images,” in Medical Image Computing and Computer Assisted Intervention -- MICCAI 2023, H. Greenspan, A. Madabhushi, P. Mousavi, S. Salcudean, J. Duncan, T. Syeda-Mahmood, and R. Taylor, Eds., Cham: Springer Nature Switzerland, 2023, pp. 685–695. [CrossRef]
- R. Fan et al., “Detecting Glaucoma from Fundus Photographs Using Deep Learning without Convolutions,” Ophthalmology Science, vol. 3, no. 1, p. 100233, Mar. 2023, . [CrossRef]
- M. M. Azizi, S. Abhari, and H. Sajedi, “Stitched vision transformer for age-related macular degeneration detection using retinal optical coherence tomography images,” PLoS One, vol. 19, no. 6, p. e0304943, Jun. 2024, . [CrossRef]
- J. B. Jonas, C. M. G. Cheung, and S. Panda-Jonas, “Updates on the Epidemiology of Age-Related Macular Degeneration,” Asia-Pacific Journal of Ophthalmology, vol. 6, no. 6, pp. 493–497, 2017, . [CrossRef]
- J. Q. Li, T. Welchowski, M. Schmid, M. M. Mauschitz, F. G. Holz, and R. P. Finger, “Prevalence and incidence of age-related macular degeneration in Europe: a systematic review and meta-analysis,” British Journal of Ophthalmology, vol. 104, no. 8, pp. 1077–1084, Aug. 2020, . [CrossRef]
- A. Omar et al., “Diabetic Disease of the Eye in Canada: Consensus Statements from a Retina Specialist Working Group,” Ophthalmol Ther, vol. 13, no. 5, pp. 1071–1102, May 2024, . [CrossRef]
- Y. Xu et al., “The diagnostic accuracy of an intelligent and automated fundus disease image assessment system with lesion quantitative function (SmartEye) in diabetic patients,” BMC Ophthalmol, vol. 19, no. 1, p. 184, Dec. 2019, . [CrossRef]
- E. Crincoli, R. Sacconi, L. Querques, and G. Querques, “Artificial intelligence in age-related macular degeneration: state of the art and recent updates,” BMC Ophthalmol, vol. 24, no. 1, p. 121, Mar. 2024, . [CrossRef]
- Organización Mundial de la Salud, Informe mundial sobre la visión, vol. 214, no. 14. 2020.
- X. Leng et al., “Deep learning for detection of age-related macular degeneration: A systematic review and meta-analysis of diagnostic test accuracy studies,” PLoS One, vol. 18, no. 4, p. e0284060, Apr. 2023, . [CrossRef]
- Z. Liu et al., “Swin Transformer: Hierarchical Vision Transformer using Shifted Windows”, Accessed: Mar. 16, 2024. [Online]. Available: https://github.
- H. Bao, L. Dong, S. Piao, and F. Wei, “BEiT: BERT Pre-Training of Image Transformers,” ICLR 2022 - 10th International Conference on Learning Representations, Jun. 2021, Accessed: Mar. 16, 2024. [Online]. Available: https://arxiv.org/abs/2106.08254v2.
- Z. Liu et al., “Swin Transformer V2: Scaling Up Capacity and Resolution,” Nov. 2021, [Online]. Available: https://arxiv.org/abs/2111.09883.
- A. Shaker, M. Maaz, H. Rasheed, S. Khan, M.-H. Yang, and F. S. Khan, “SwiftFormer: Efficient Additive Attention for Transformer-based Real-time Mobile Vision Applications,” Mar. 2023, [Online]. Available: https://arxiv.org/abs/2303.15446.
- G. Linde, W. Rodrigues de Souza Jr, R. Chalakkal, H. V. Danesh-Meyer, B. O’Keeffe, and S. Chiong Hong, “A comparative evaluation of deep learning approaches for ophthalmology,” Sci Rep, vol. 14, no. 1, p. 21829, Sep. 2024, . [CrossRef]
- Z. Peng, Z. Li, C. Yin, R. Li, and C. He, “Near-infrared fundus imaging diagnostics device based on deep learning classification and infrared thermography in ophthalmology,” J Radiat Res Appl Sci, vol. 17, no. 2, p. 100846, Jun. 2024, . [CrossRef]
- M. M. Azizi, S. Abhari, and H. Sajedi, “Stitched vision transformer for age-related macular degeneration detection using retinal optical coherence tomography images,” PLoS One, vol. 19, no. 6 June, pp. 1–24, 2024, . [CrossRef]
- J. H. Lin Goh et al., “Comparative Analysis of Vision Transformers and Conventional Convolutional Neural Networks in Detecting Referable Diabetic Retinopathy,” Ophthalmology Science, p. 100552, May 2024, . [CrossRef]
- A. Ait Hammou, F. Antaki, M.-C. Boucher, and R. Duval, “MBT: Model-Based Transformer for retinal optical coherence tomography image and video multi-classification,” Int J Med Inform, vol. 178, no. August, p. 105178, Oct. 2023, . [CrossRef]
- K. Xu et al., “Automatic detection and differential diagnosis of age-related macular degeneration from color fundus photographs using deep learning with hierarchical vision transformer,” Comput Biol Med, vol. 167, no. August, p. 107616, Dec. 2023, . [CrossRef]
- P. Dutta, K. A. Sathi, M. A. Hossain, and M. A. A. Dewan, “Conv-ViT: A Convolution and Vision Transformer-Based Hybrid Feature Extraction Method for Retinal Disease Detection,” J Imaging, vol. 9, no. 7, p. 140, Jul. 2023, . [CrossRef]
- B. Philippi, K. Rothaus, and M. Castelli, “A vision transformer architecture for the automated segmentation of retinal lesions in spectral domain optical coherence tomography images,” Sci Rep, vol. 13, no. 1, p. 517, Jan. 2023, . [CrossRef]
- S. Alayón, J. Hernández, F. J. Fumero, J. F. Sigut, and T. Díaz-Alemán, “Comparison of the Performance of Convolutional Neural Networks and Vision Transformer-Based Systems for Automated Glaucoma Detection with Eye Fundus Images,” Applied Sciences, vol. 13, no. 23, p. 12722, Nov. 2023, . [CrossRef]
- J. He, J. Wang, Z. Han, J. Ma, C. Wang, and M. Qi, “An interpretable transformer network for the retinal disease classification using optical coherence tomography,” Sci Rep, vol. 13, no. 1, Dec. 2023, . [CrossRef]
- A. E. Hwang, D. Chen, Y. Han, L. Jia, and J. Shan, “Multi-Dataset Comparison of Vision Transformers and Convolutional Neural Networks for Detecting Glaucomatous Optic Neuropathy from Fundus Photographs,” Bioengineering, vol. 10, no. 11, p. 1266, Oct. 2023, . [CrossRef]
- S. Mallick, J. Paul, N. Sengupta, and J. Sil, “Study of Different Transformer based Networks For Glaucoma Detection,” in IEEE Region 10 Annual International Conference, Proceedings/TENCON, Institute of Electrical and Electronics Engineers Inc., 2022. [CrossRef]
- M. Wassel, A. M. Hamdi, N. Adly, and M. Torki, “Vision Transformers Based Classification for Glaucomatous Eye Condition,” in 2022 26th International Conference on Pattern Recognition (ICPR), IEEE, Aug. 2022, pp. 5082–5088. [CrossRef]
- J. Wu, R. Hu, Z. Xiao, J. Chen, and J. Liu, “Vision Transformer-based recognition of diabetic retinopathy grade,” Med Phys, vol. 48, no. 12, pp. 7850–7863, Dec. 2021, . [CrossRef]
- J. Li, J. Chen, Y. Tang, C. Wang, B. A. Landman, and S. K. Zhou, “Transforming medical imaging with Transformers? A comparative review of key properties, current progresses, and future perspectives,” Med Image Anal, vol. 85, p. 102762, Apr. 2023, . [CrossRef]
- M. Cantone, C. Marrocco, F. Tortorella, and A. Bria, “Convolutional Networks and Transformers for Mammography Classification: An Experimental Study,” Sensors, vol. 23, no. 3, p. 1229, Jan. 2023, . [CrossRef]
- R. Jahangir, T. Sakib, M. F.-U.-A. Juboraj, S. B. Feroz, and M. M. I. Sharar, “Brain Tumor Classification on MRI Images with Big Transfer and Vision Transformer: Comparative Study,” in 2023 IEEE 9th International Women in Engineering (WIE) Conference on Electrical and Computer Engineering (WIECON-ECE), IEEE, Nov. 2023, pp. 46–51. [CrossRef]
- M. Nurgazin and N. A. Tu, “A Comparative Study of Vision Transformer Encoders and Few-shot Learning for Medical Image Classification,” in Proceedings - 2023 IEEE/CVF International Conference on Computer Vision Workshops, ICCVW 2023, 2023, pp. 2505–2513. [CrossRef]
- S. I. Nafisah, G. Muhammad, M. S. Hossain, and S. A. AlQahtani, “A Comparative Evaluation between Convolutional Neural Networks and Vision Transformers for COVID-19 Detection,” Mathematics, vol. 11, no. 6, Mar. 2023, . [CrossRef]
- A. Fanizzi et al., “Comparison between vision transformers and convolutional neural networks to predict non-small lung cancer recurrence,” Sci Rep, vol. 13, no. 1, p. 20605, Nov. 2023, . [CrossRef]
- A. Asiri et al., “Advancing Brain Tumor Classification through Fine-Tuned Vision Transformers: A Comparative Study of Pre-Trained Models,” Sensors, vol. 23, no. 18, p. 7913, Sep. 2023, . [CrossRef]
- X. Xiong, B. J. Smith, S. A. Graves, M. M. Graham, J. M. Buatti, and R. R. Beichel, “Head and Neck Cancer Segmentation in FDG PET Images: Performance Comparison of Convolutional Neural Networks and Vision Transformers,” Tomography, vol. 9, no. 5, pp. 1933–1948, Oct. 2023, . [CrossRef]
- P. Sherwani, P. Nandhakumar, P. Srivastava, J. Jagtap, V. Narvekar, and H. R, “Comparative Analysis of Alzheimer’s Disease Detection via MRI Scans Using Convolutional Neural Network and Vision Transformer,” in 2023 International Conference on Artificial Intelligence and Knowledge Discovery in Concurrent Engineering (ICECONF), IEEE, Jan. 2023, pp. 1–9. [CrossRef]
- C. Ma et al., “Benchmarking and Boosting Transformers for Medical Image Classification,” in Lecture Notes in Computer Science (including subseries Lecture Notes in Artificial Intelligence and Lecture Notes in Bioinformatics), Springer Science and Business Media Deutschland GmbH, 2022, pp. 12–22. [CrossRef]
- L. Deininger et al., “A comparative study between vision transformers and CNNs in digital pathology,” Jun. 2022, . [CrossRef]
- Y. Gulzar and S. A. Khan, “Skin Lesion Segmentation Based on Vision Transformers and Convolutional Neural Networks—A Comparative Study,” Applied Sciences, vol. 12, no. 12, p. 5990, Jun. 2022, . [CrossRef]
- H. Yang et al., “Comparative Study for Patch-Level and Pixel-Level Segmentation of Deep Learning Methods on Transparent Images of Environmental Microorganisms: From Convolutional Neural Networks to Visual Transformers,” Applied Sciences, vol. 12, no. 18, p. 9321, Sep. 2022, . [CrossRef]
- Y. Yang and G. Mei, “Pneumonia Recognition by Deep Learning: A Comparative Investigation,” Applied Sciences, vol. 12, no. 9, p. 4334, Apr. 2022, . [CrossRef]
- W. Hu et al., “A comparative study of gastric histopathology sub-size image classification: From linear regression to visual transformer,” Front Med (Lausanne), vol. 9, Dec. 2022, . [CrossRef]
- A. Galdran, G. Carneiro, and M. A. G. Ballester, “Convolutional Nets Versus Vision Transformers for Diabetic Foot Ulcer Classification,” Nov. 2021, [Online]. Available: https://arxiv.org/abs/2111.06894.
- N. Park and S. Kim, “How Do Vision Transformers Work?,” ICLR 2022 - 10th International Conference on Learning Representations, Feb. 2022, [Online]. Available: http://arxiv.org/abs/2202.06709.
- S. H. Lee, S. Lee, and B. C. Song, “Vision Transformer for Small-Size Datasets,” Dec. 2021, [Online]. Available: http://arxiv.org/abs/2112.13492.
- D. Huynh, “Vision Transformers in 2022: An Update on Tiny ImageNet,” vol. 3070, pp. 1–6, May 2022, [Online]. Available: http://arxiv.org/abs/2205.10660.
- Y. Li, S. Xie, X. Chen, P. Dollar, K. He, and R. Girshick, “Benchmarking Detection Transfer Learning with Vision Transformers,” Nov. 2021, [Online]. Available: http://arxiv.org/abs/2111.11429.
- “Baidu Research Open-Access Dataset - download.” [Online]. Available: https://ai.baidu.com/broad/download.
- R. Mujib, “ARMD curated dataset 2023,” Kaggle. Accessed: Aug, vol. 31, 2023, [Online]. Available: https://www.kaggle.com/datasets/rakhshandamujib/armd-curated-dataset-2023.
- Y. G. Becerra, “Dr. Yonathan Garfias Becerra – CONDE Investigación.” Accessed: Jul. 22, 2024. [Online]. Available: https://www.condeinvestigacion.org/investigadores/dr-yonathan-garfias-becerra/.
- J. L. R. Loaiza, “Quiénes Somos | Retina y Microcirugía Ocular.” Accessed: Jul. 22, 2024. [Online]. Available: https://retinaymicrocirugiaocular.com/quienes-somos/.
- B. Shorten and T. M. Khoshgoftaar, “A survey on Image Data Augmentation for Deep Learning,” J Big Data, vol. 6, no. 1, p. 60, Dec. 2019, . [CrossRef]
- B. M. W. Powers, “Evaluation: from precision, recall and F-measure to ROC, informedness, markedness and correlation,” 2020. [CrossRef]
Figure 1.
Original ViT Architecture (Retrieved from [6]).
Figure 1.
Original ViT Architecture (Retrieved from [6]).
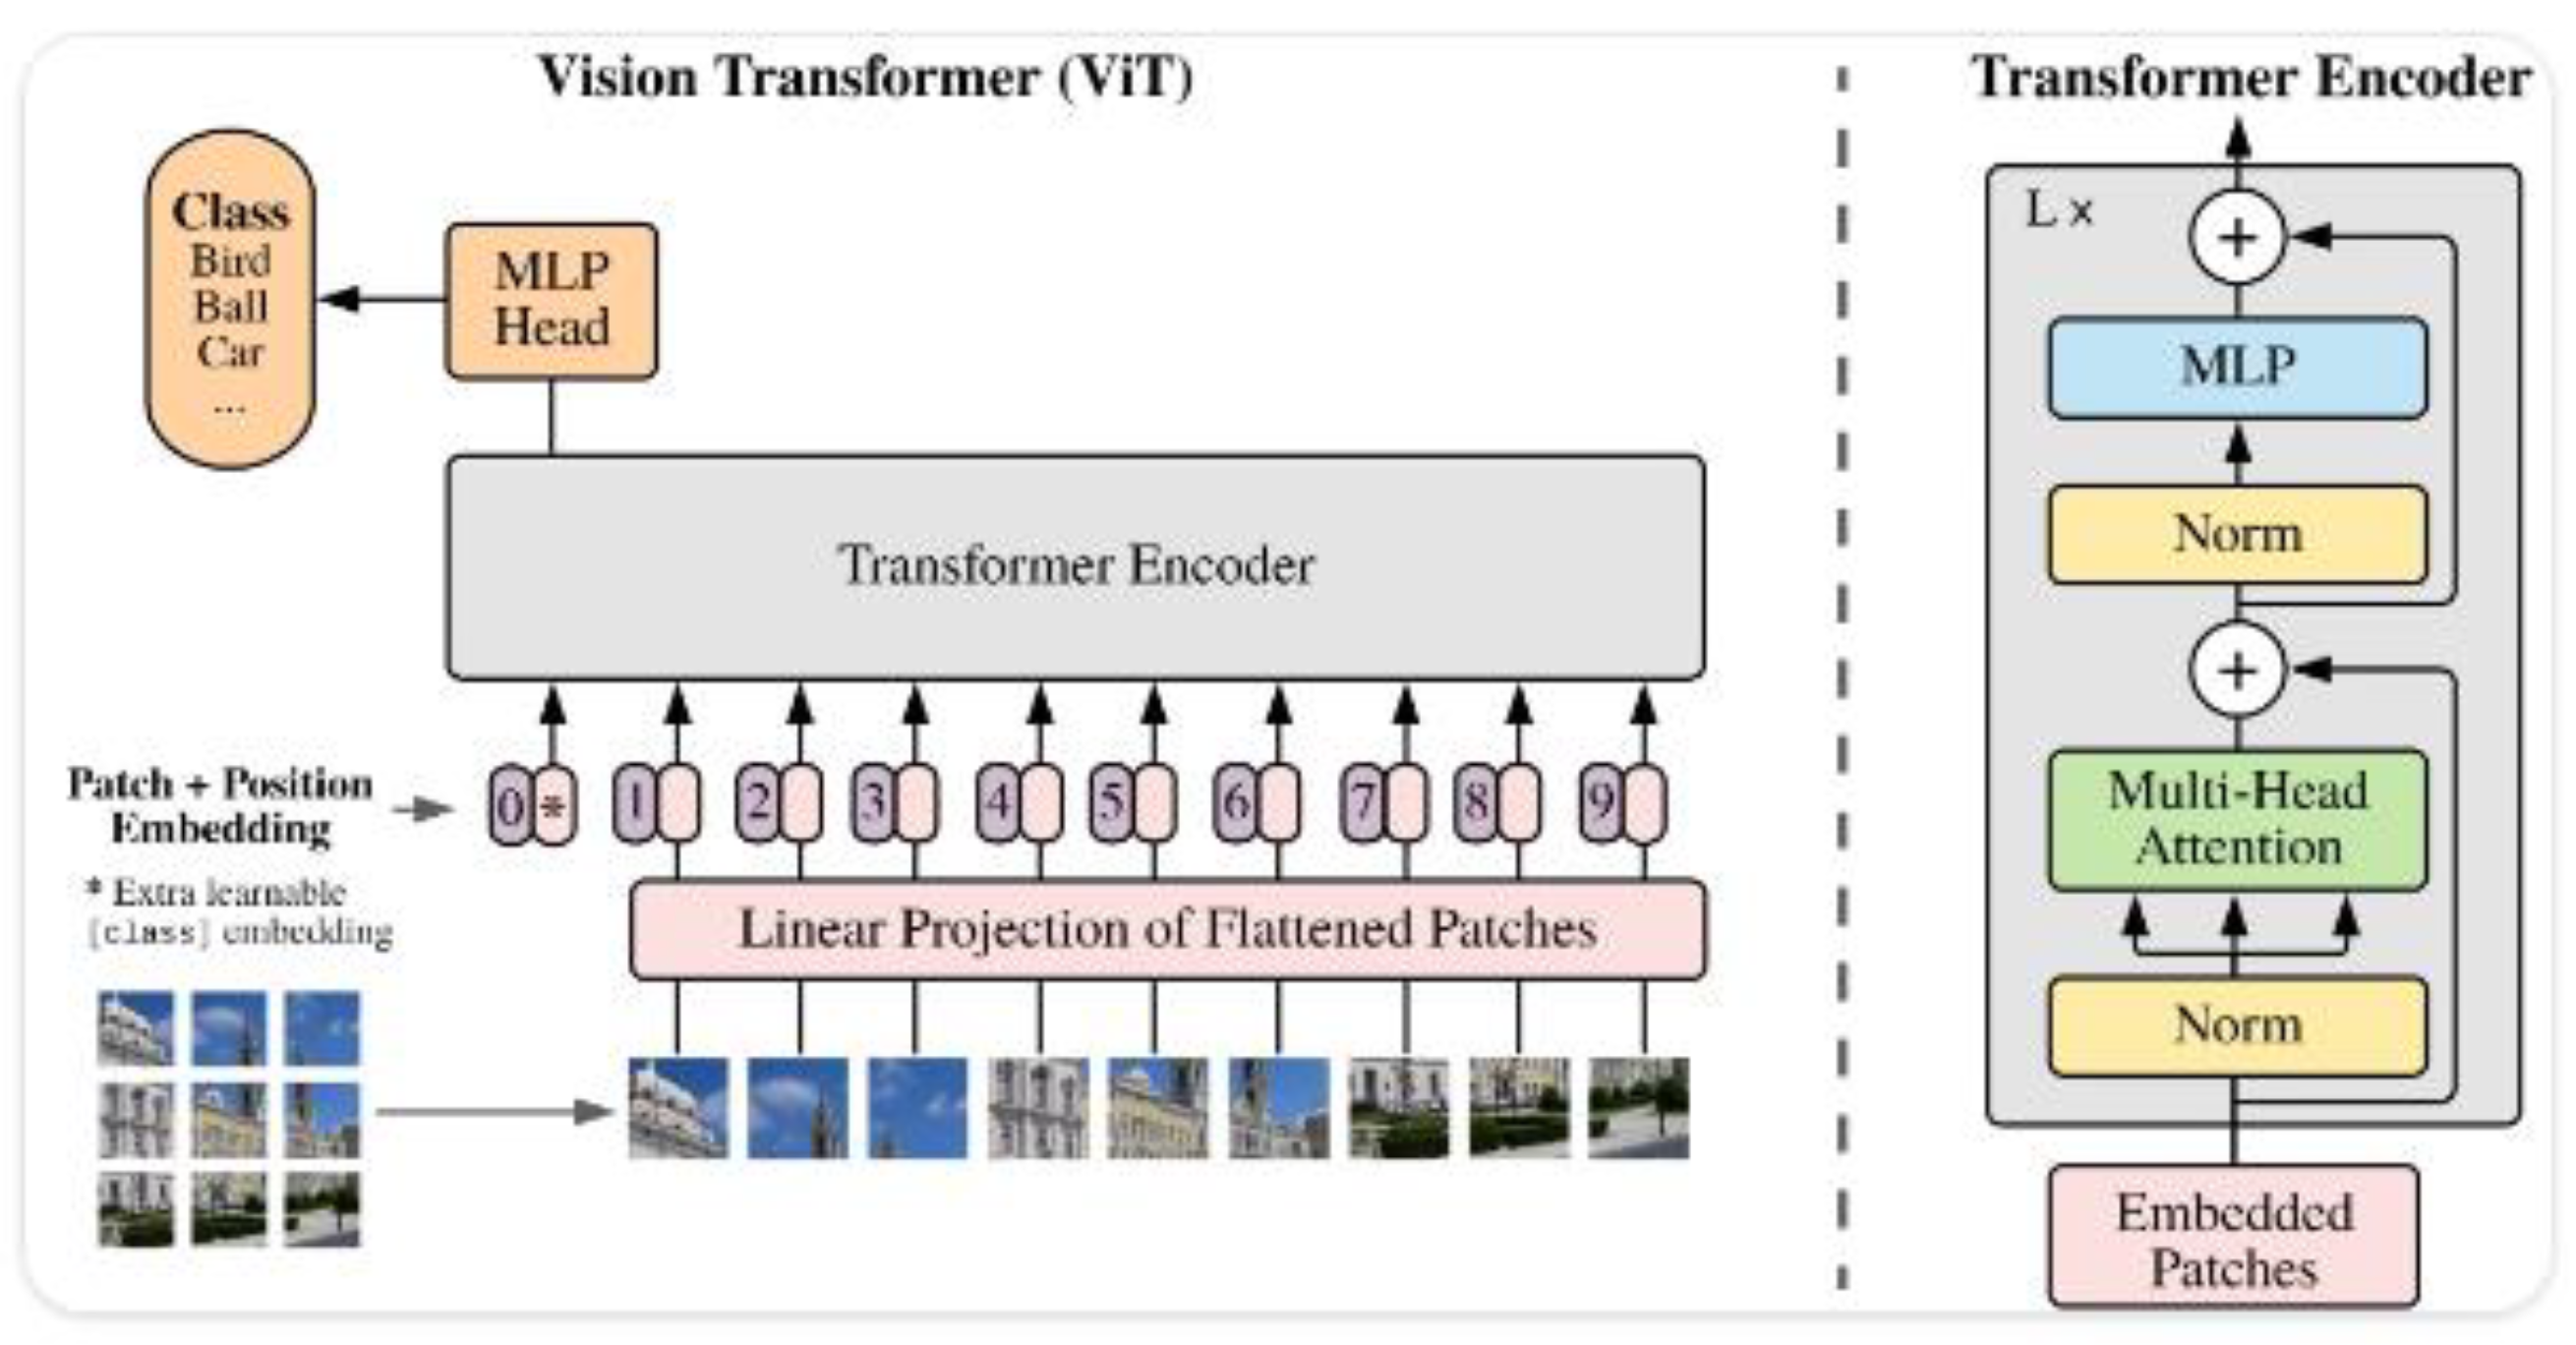
Figure 2.
Swin Transformer Architecture (Retrieved from [19]).
Figure 2.
Swin Transformer Architecture (Retrieved from [19]).
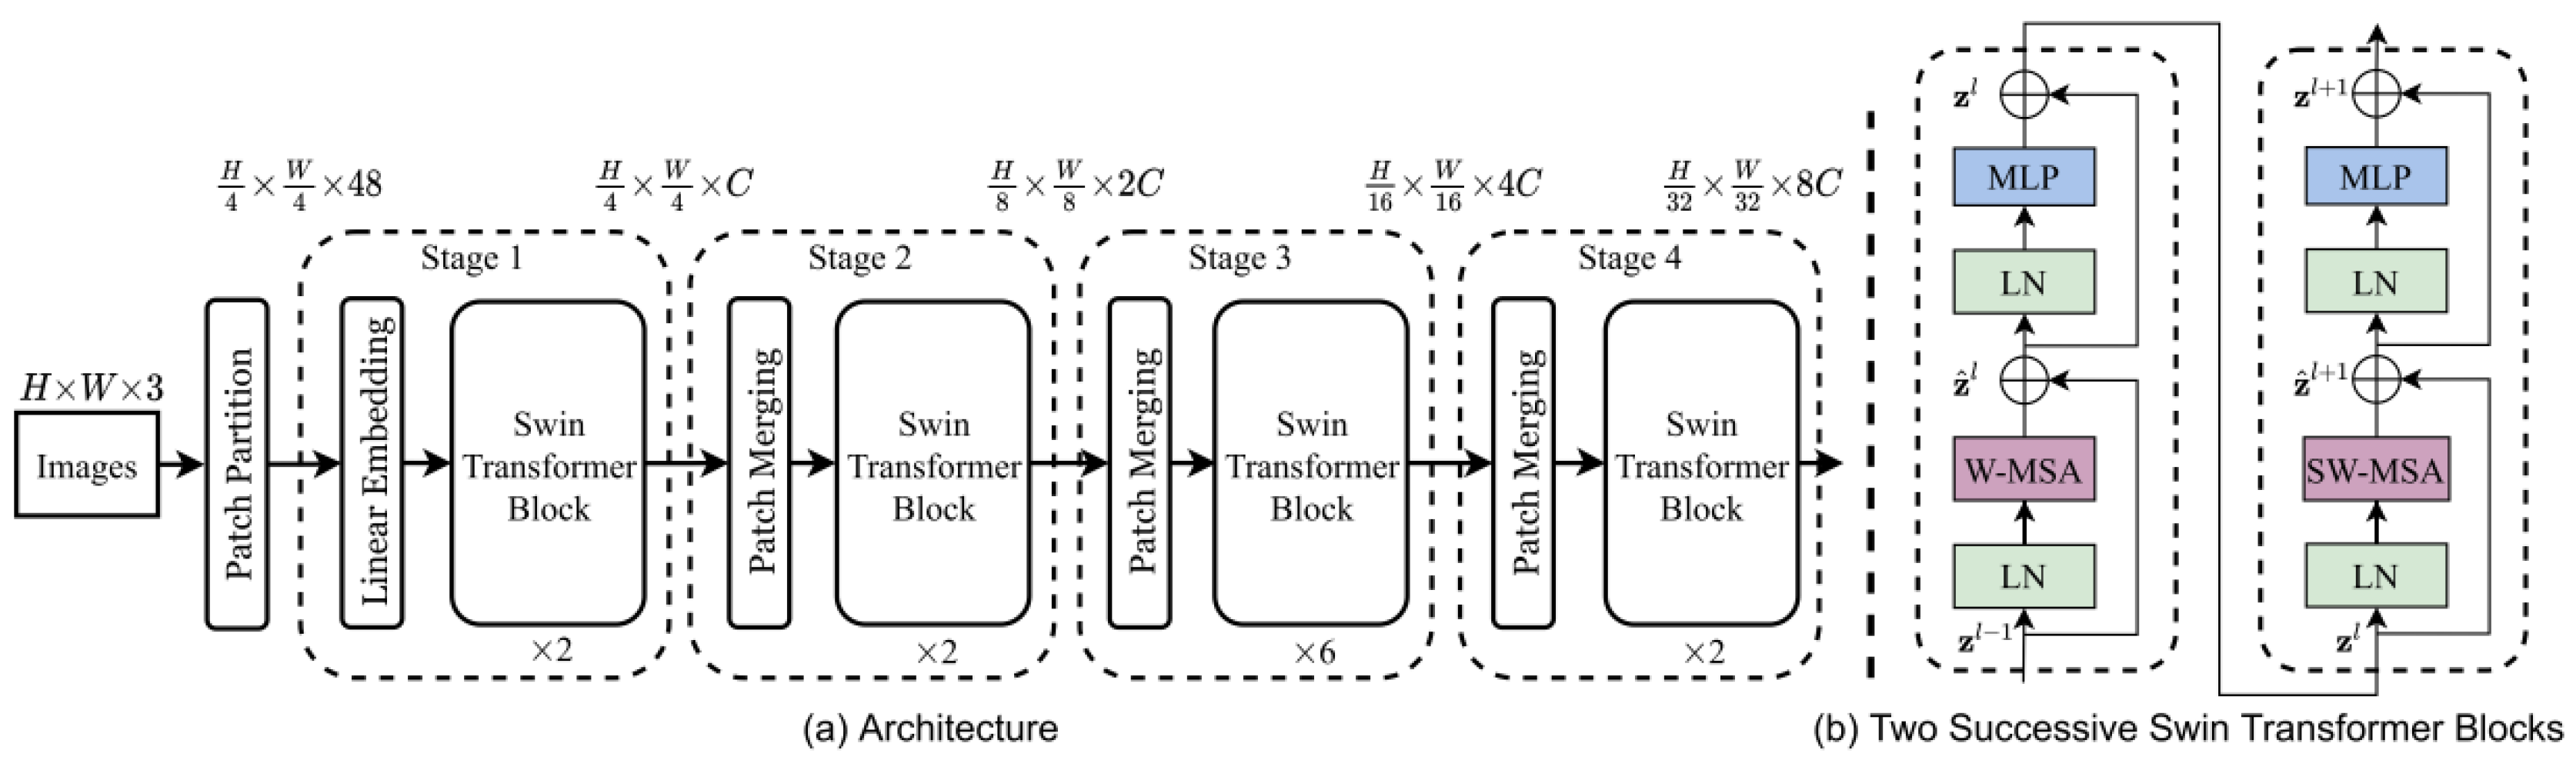
Figure 3.
BEiT Architecture (Retrieved from [20]).
Figure 3.
BEiT Architecture (Retrieved from [20]).
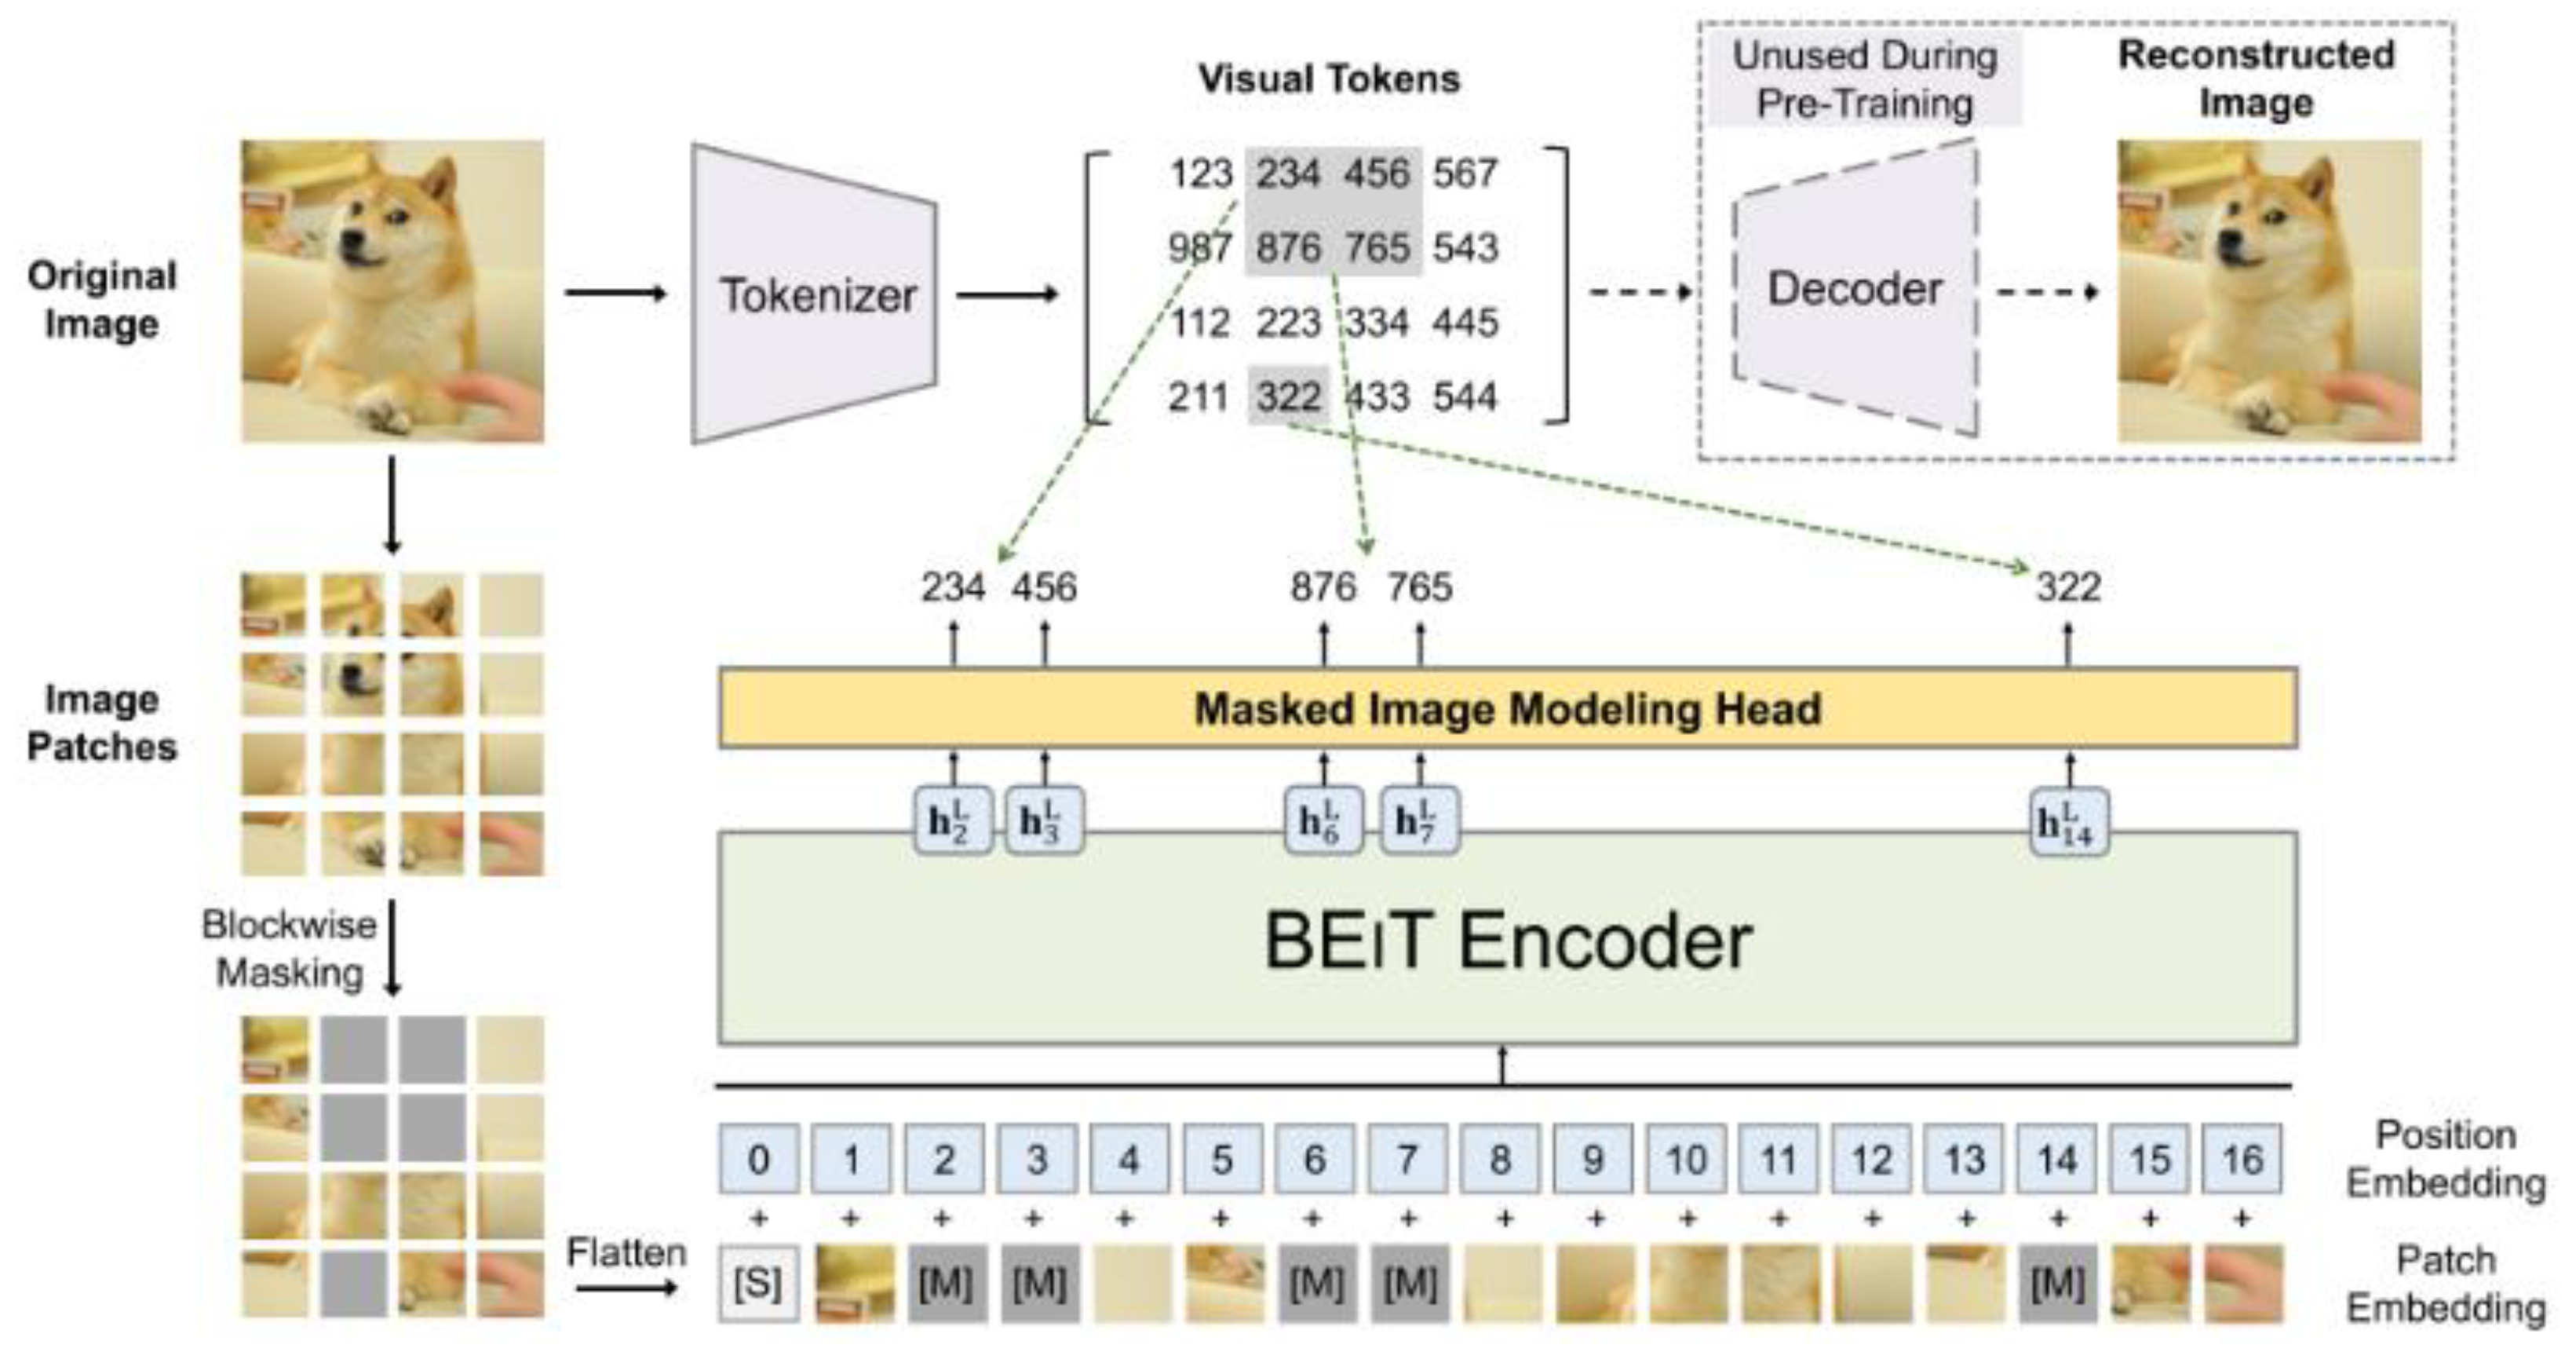
Figure 4.
Swin Transformer V2 Architecture (Retrieved from [21]).
Figure 4.
Swin Transformer V2 Architecture (Retrieved from [21]).
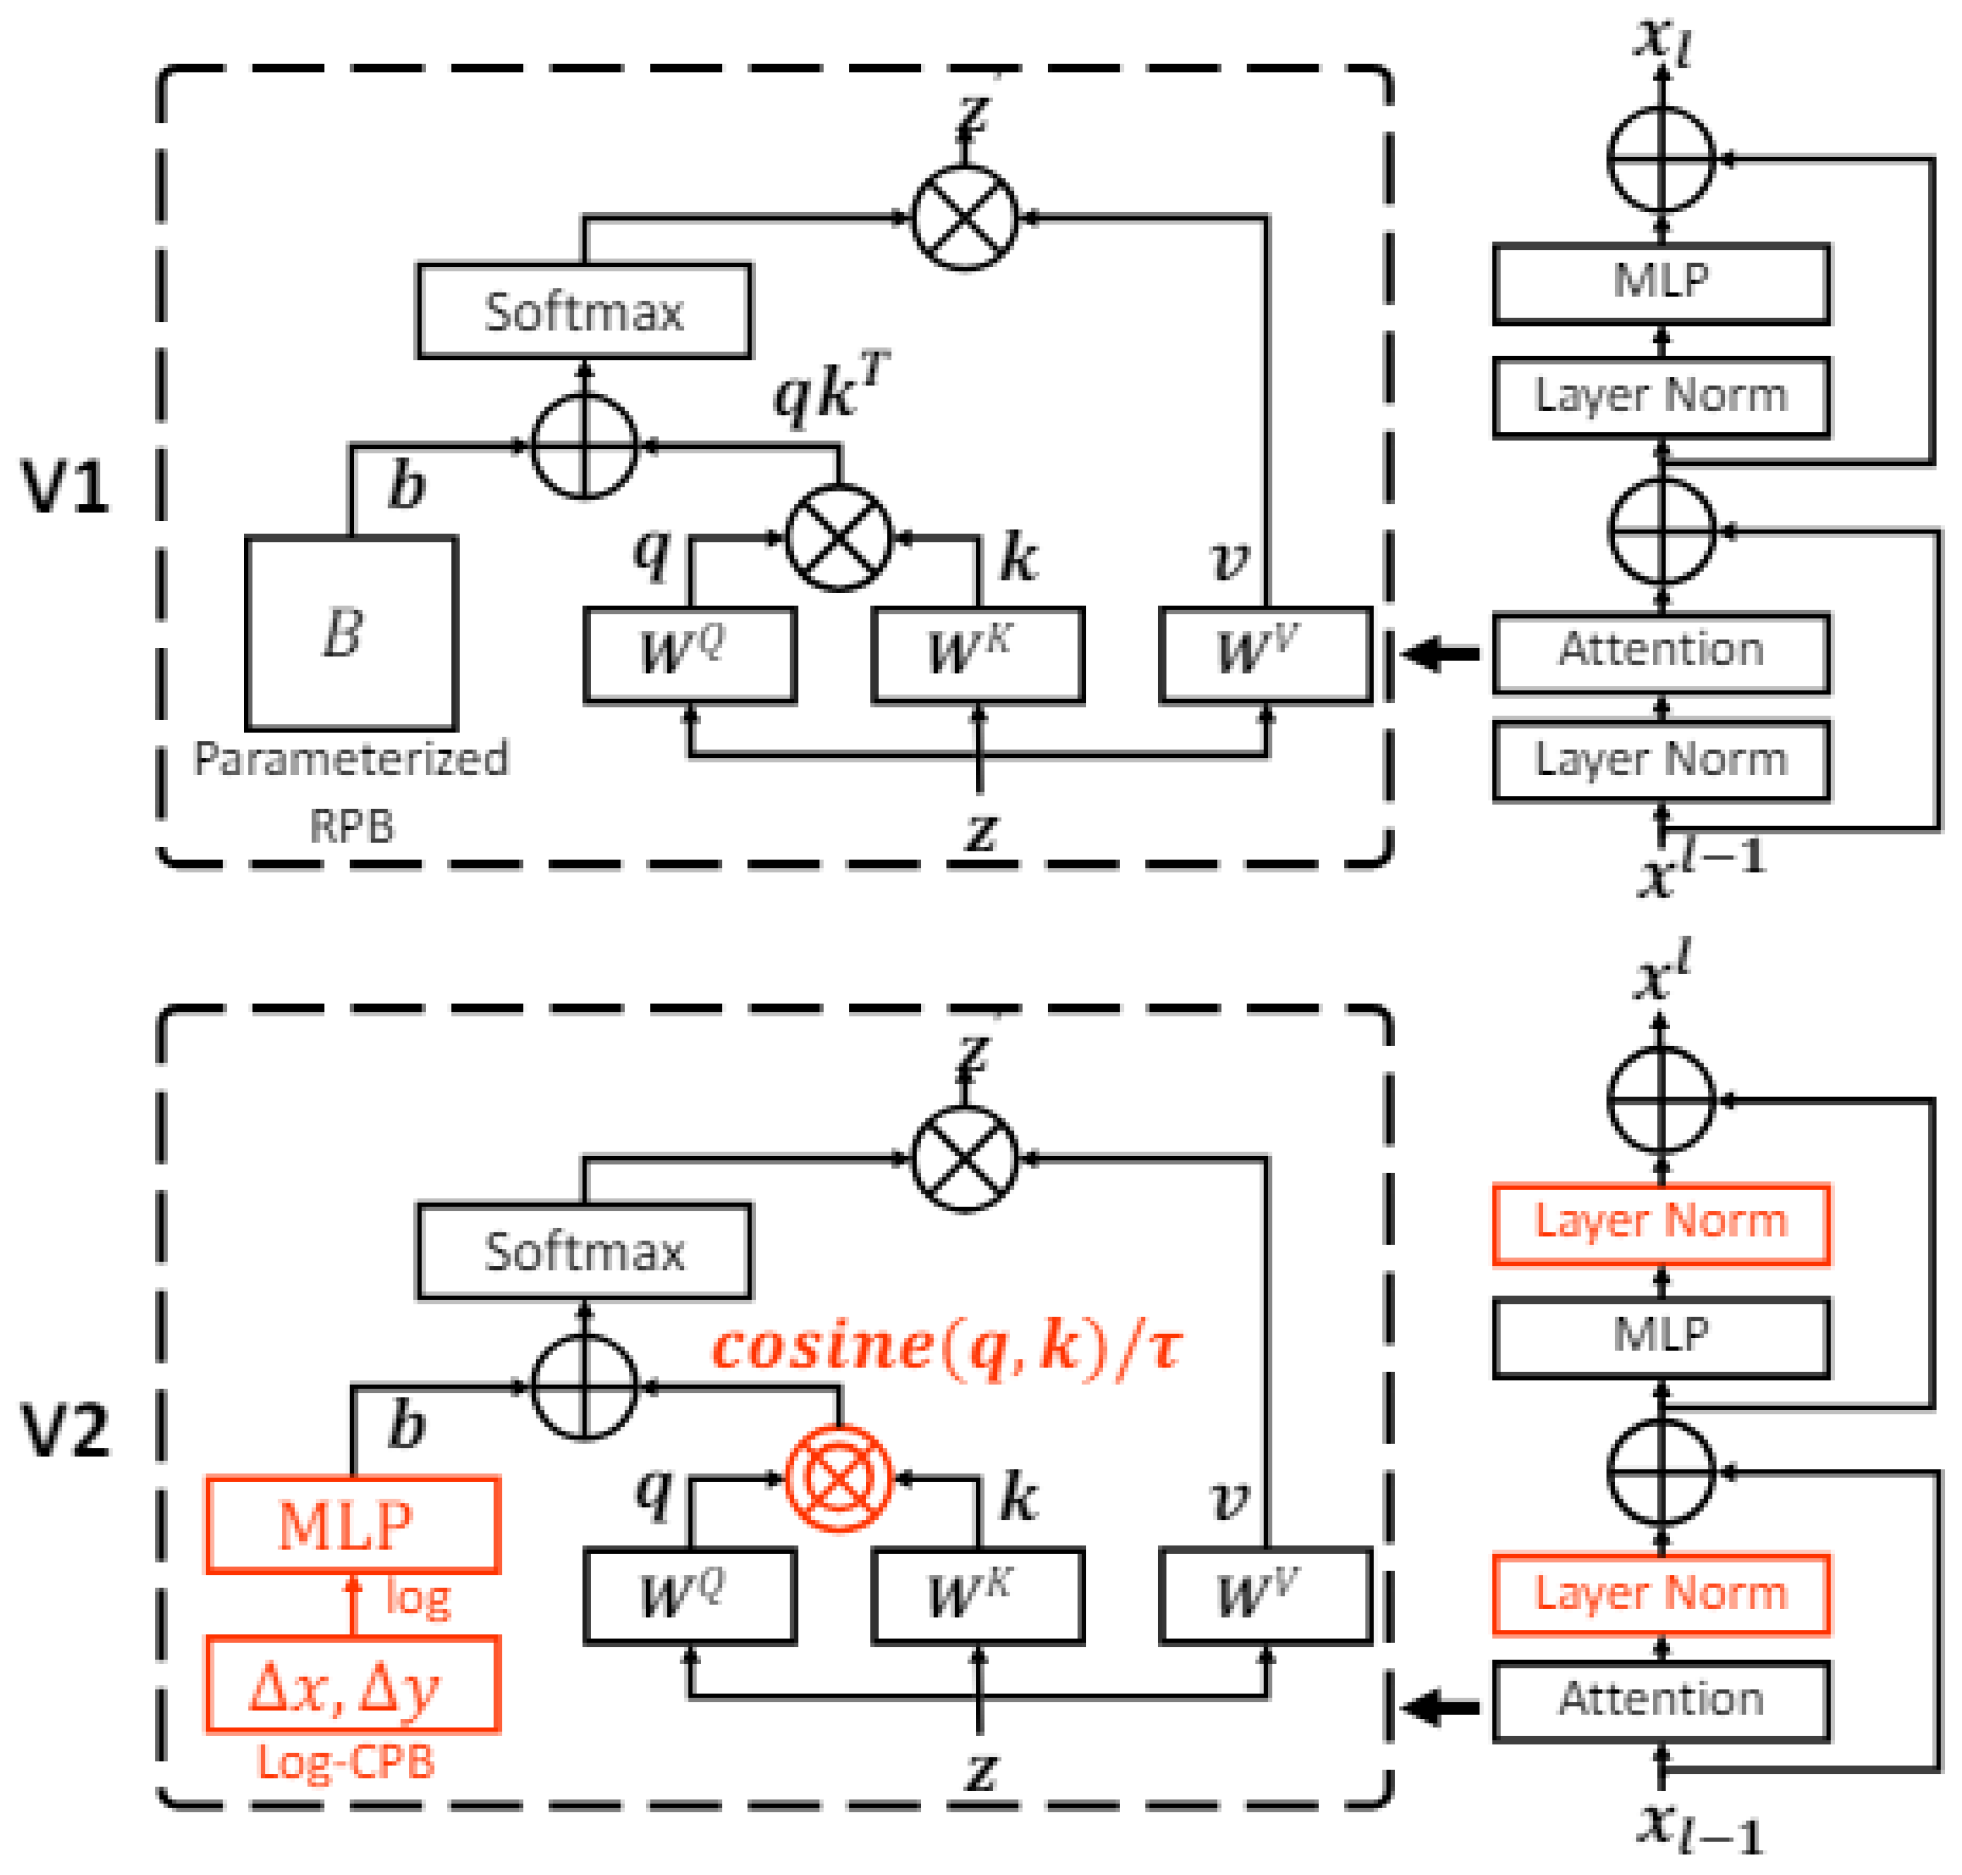
Figure 5.
SwiftFormer Architecture (Retrieved from [22]).
Figure 5.
SwiftFormer Architecture (Retrieved from [22]).
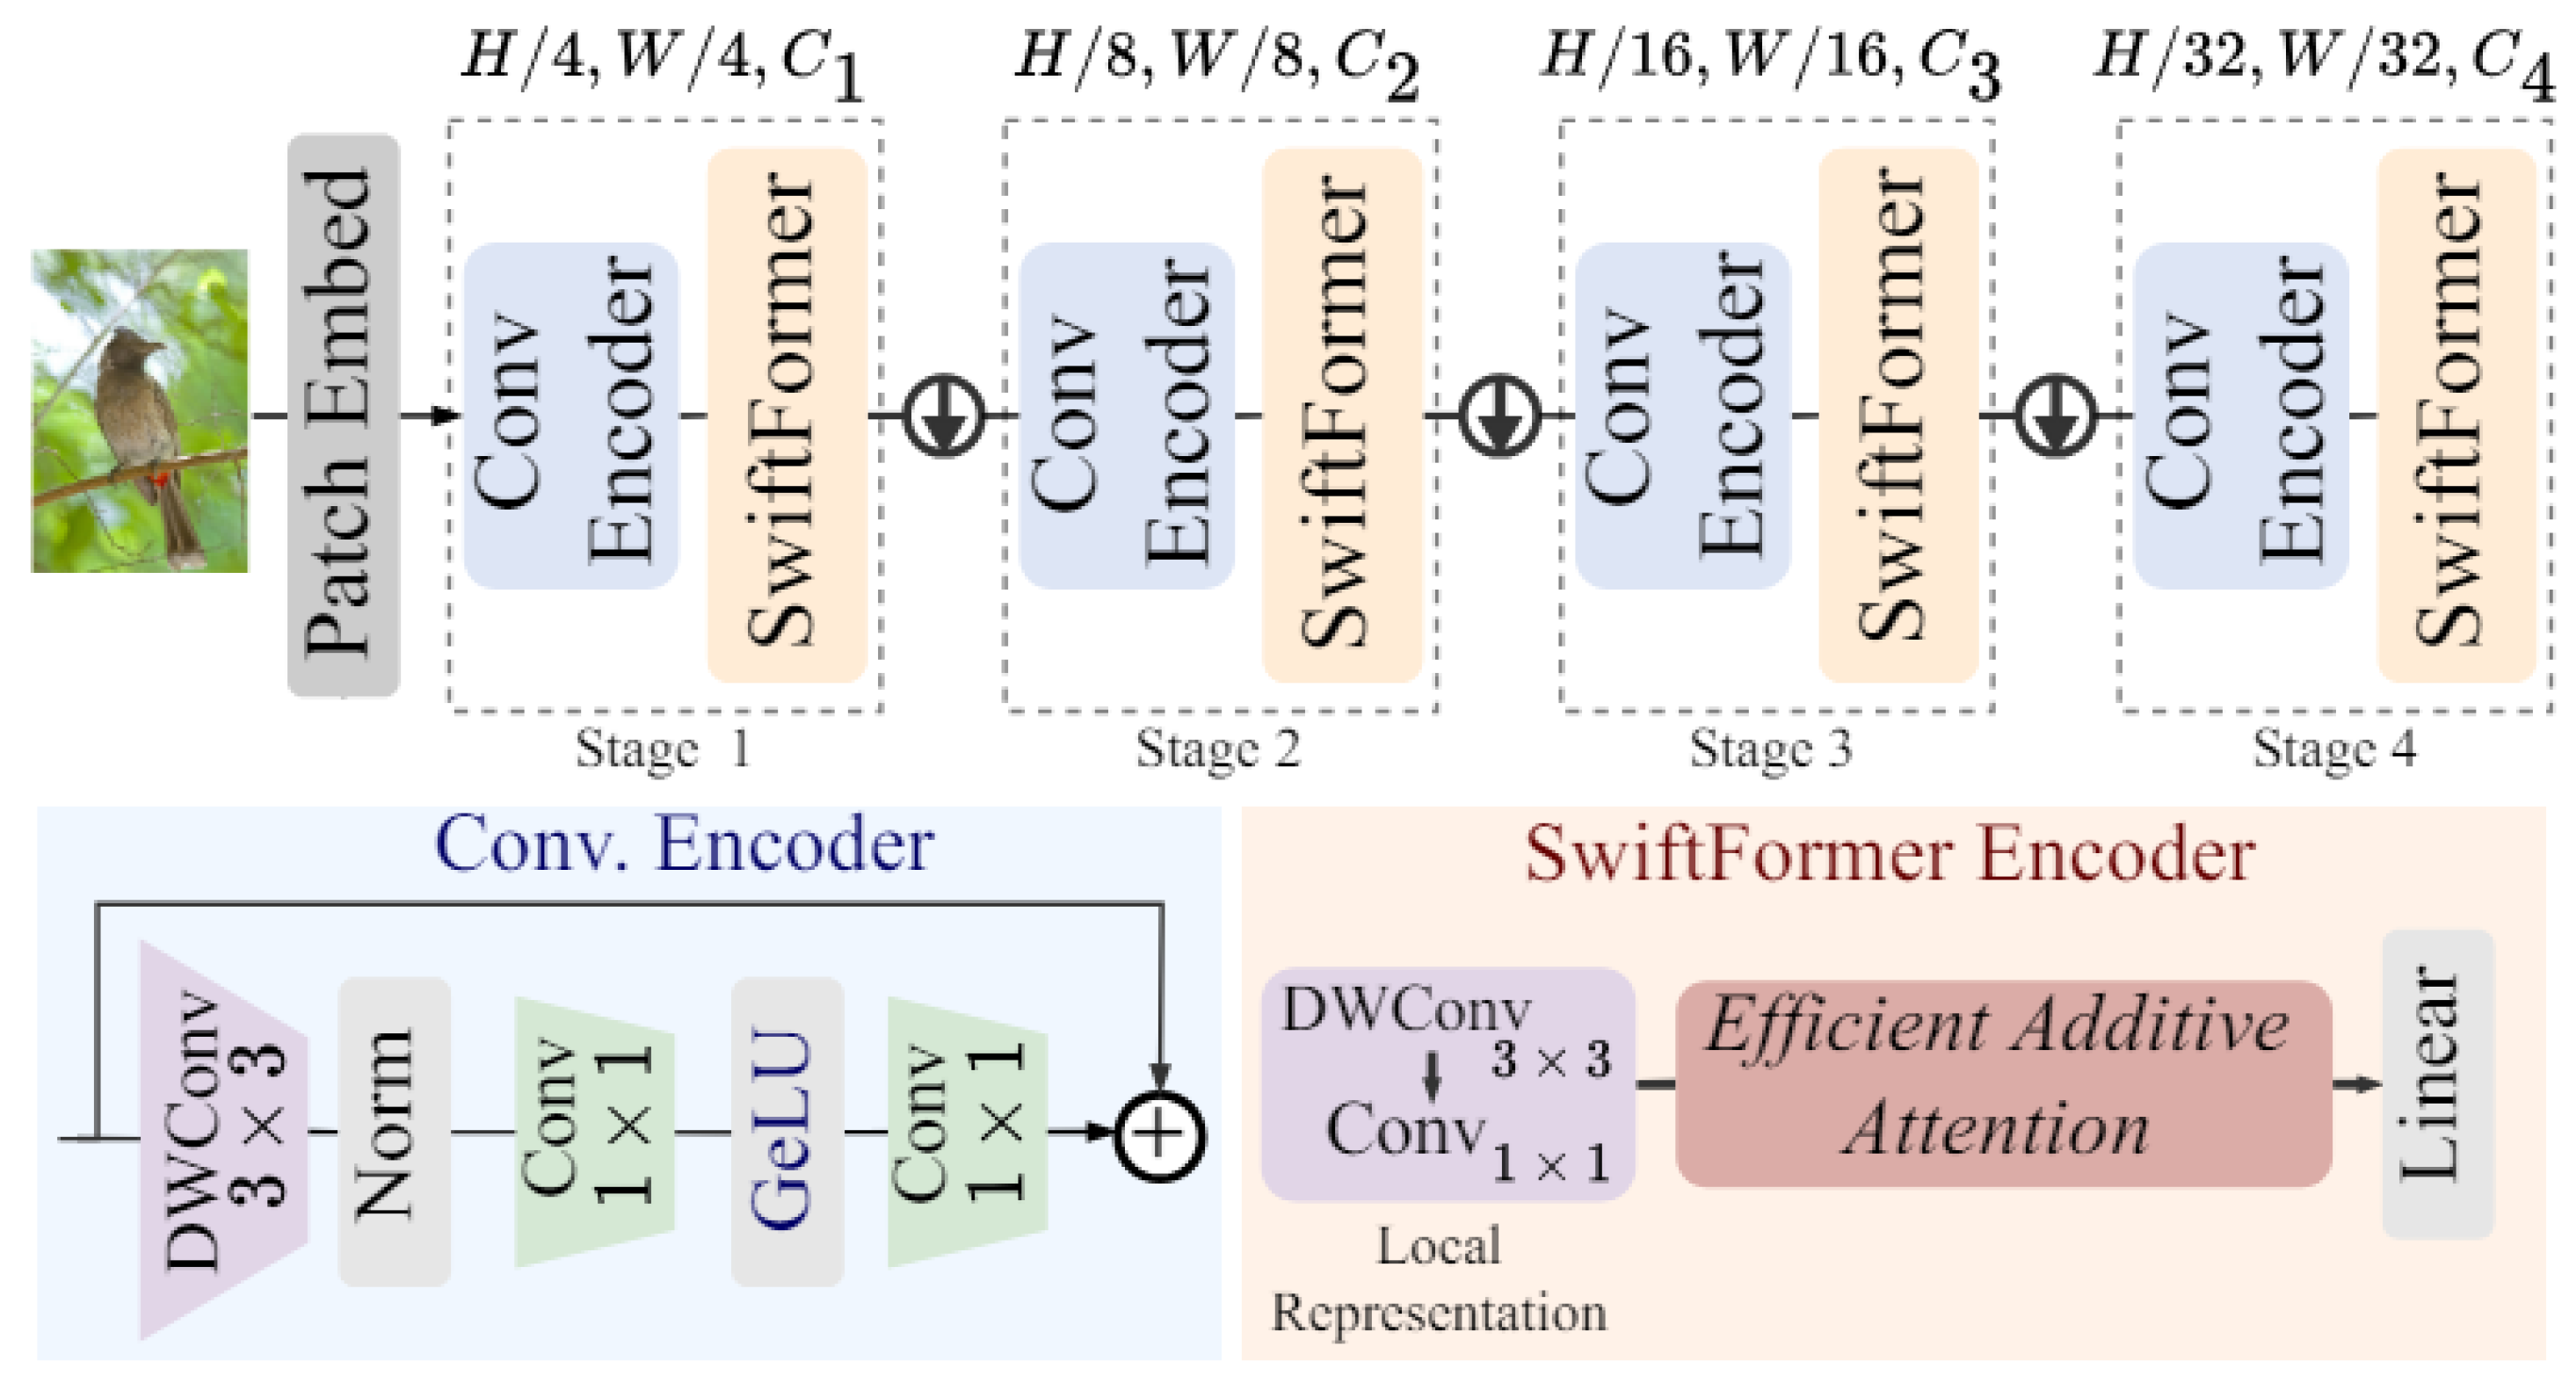
Figure 6.
Methodology for Comparatively Analyzing ViT Models.
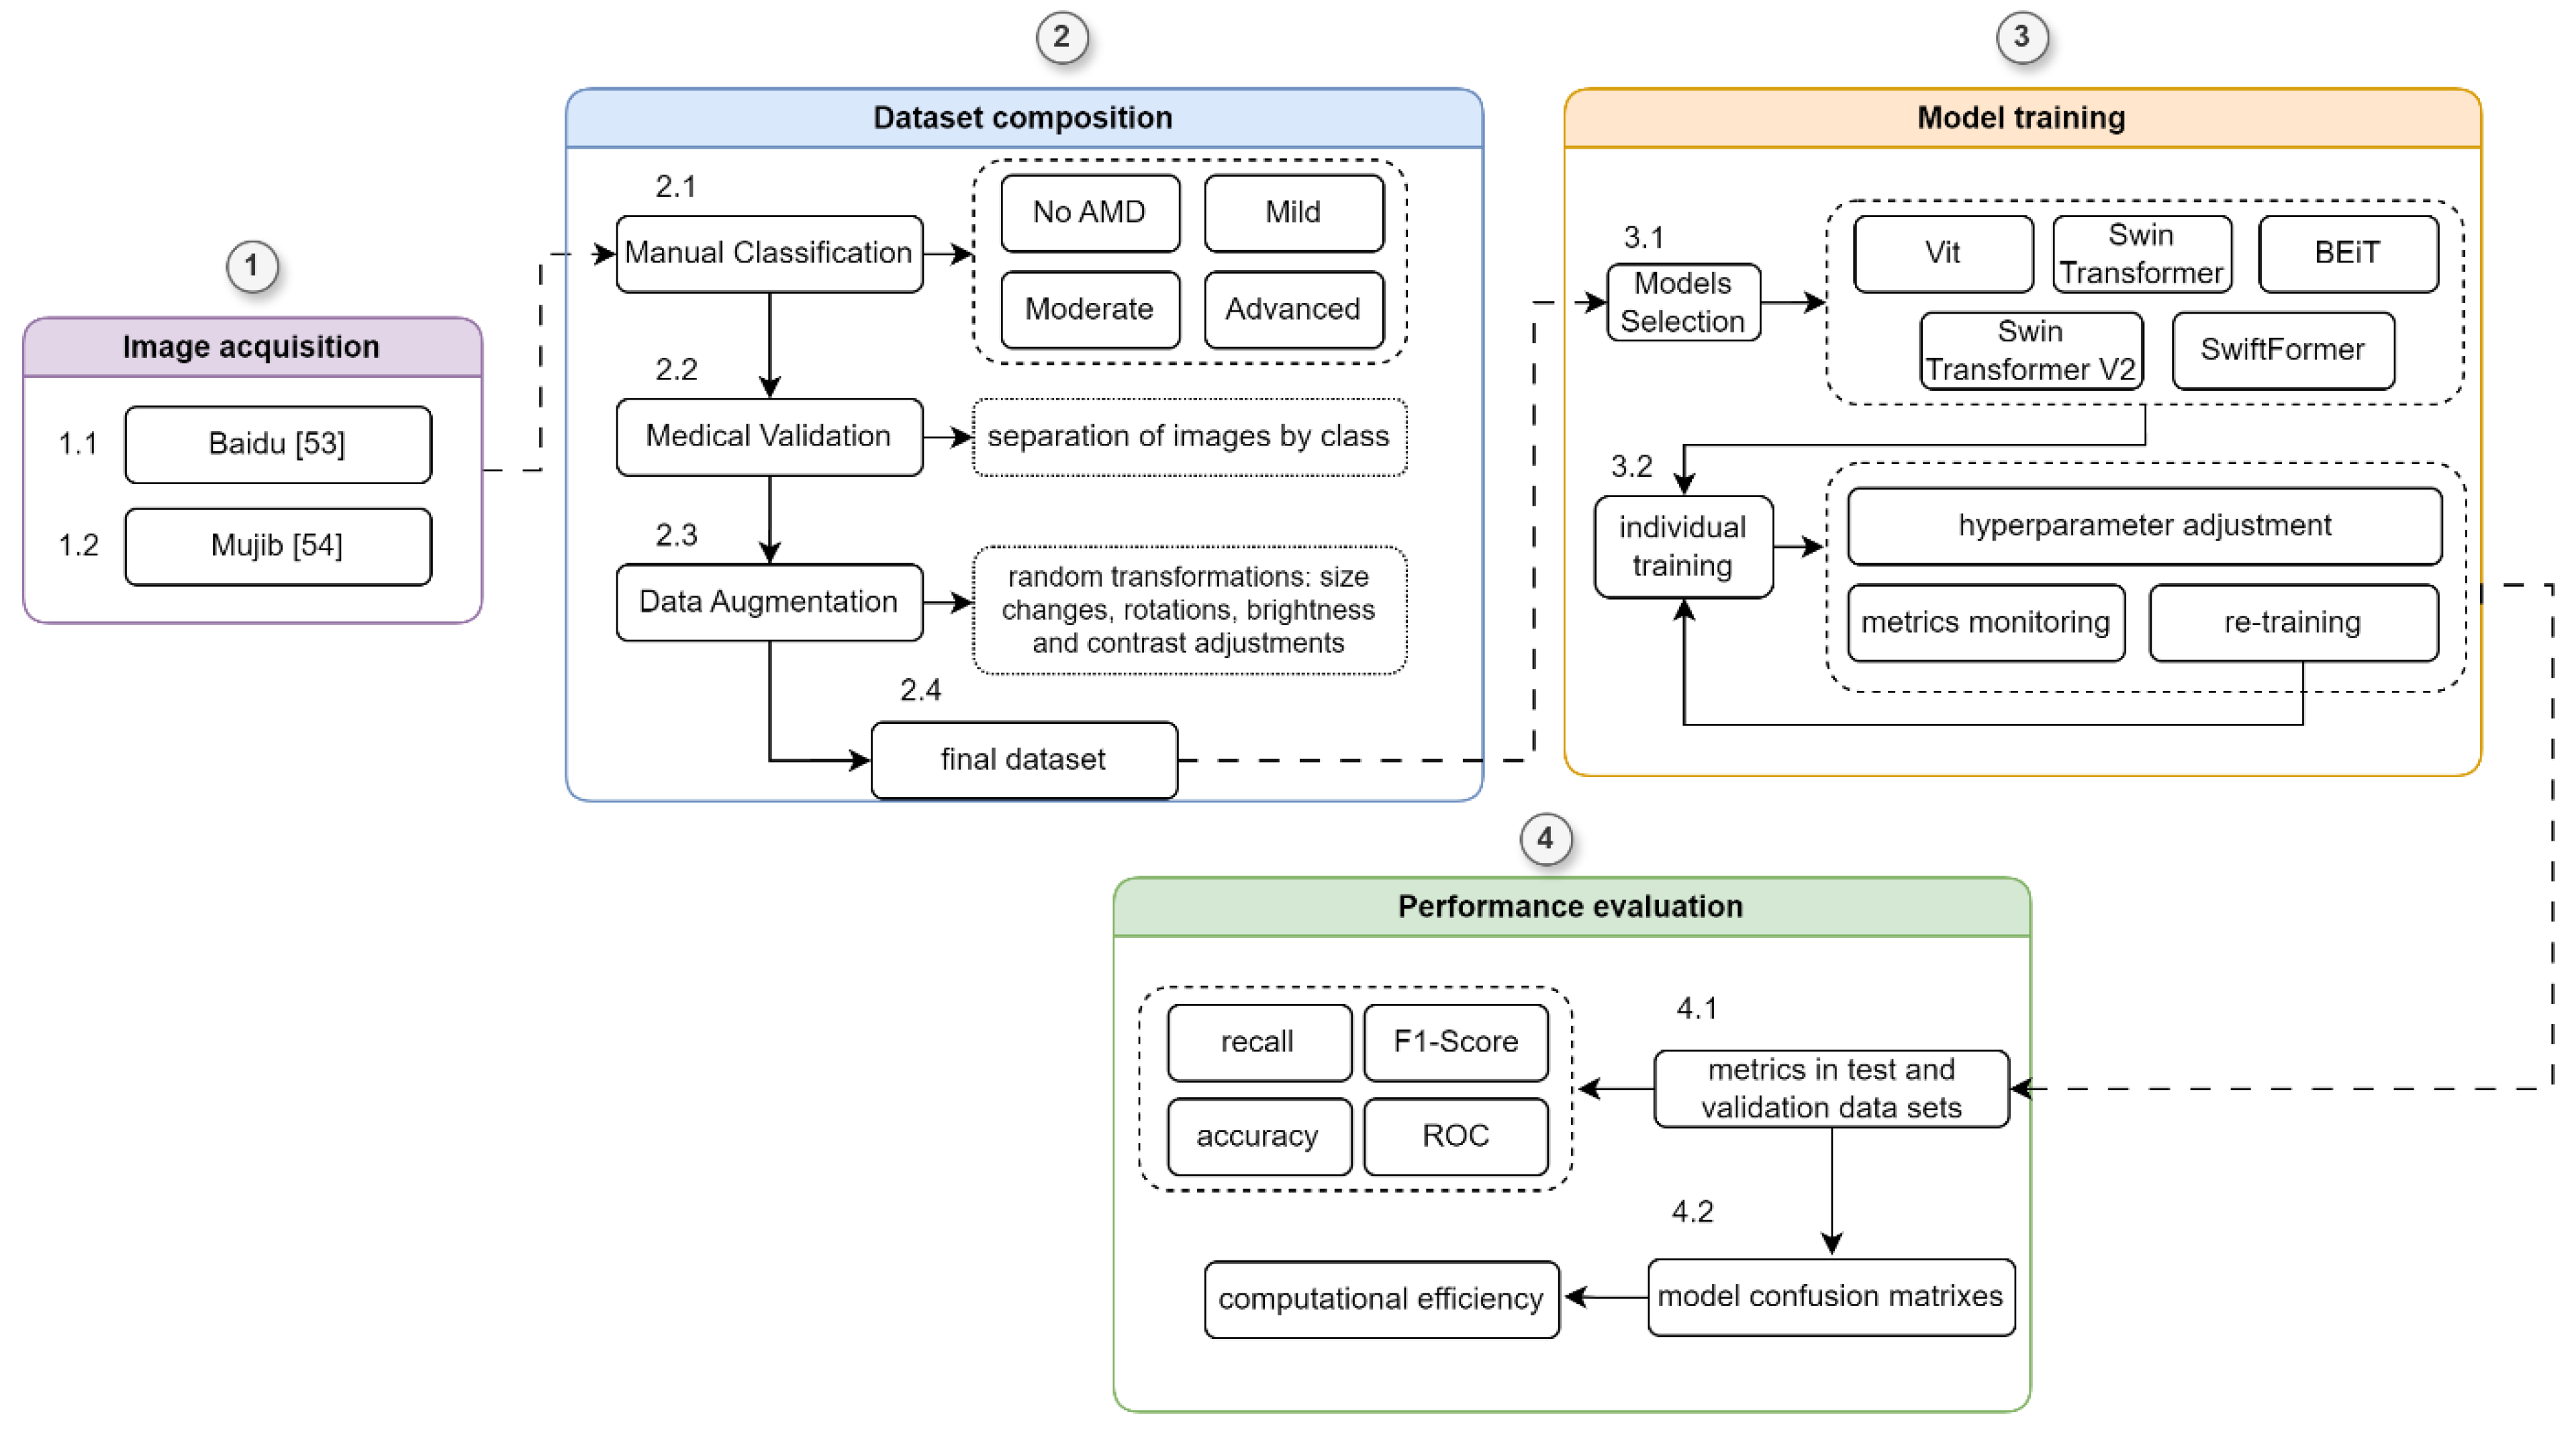
Figure 7.
Example of Images Generated with Data Enhancement.
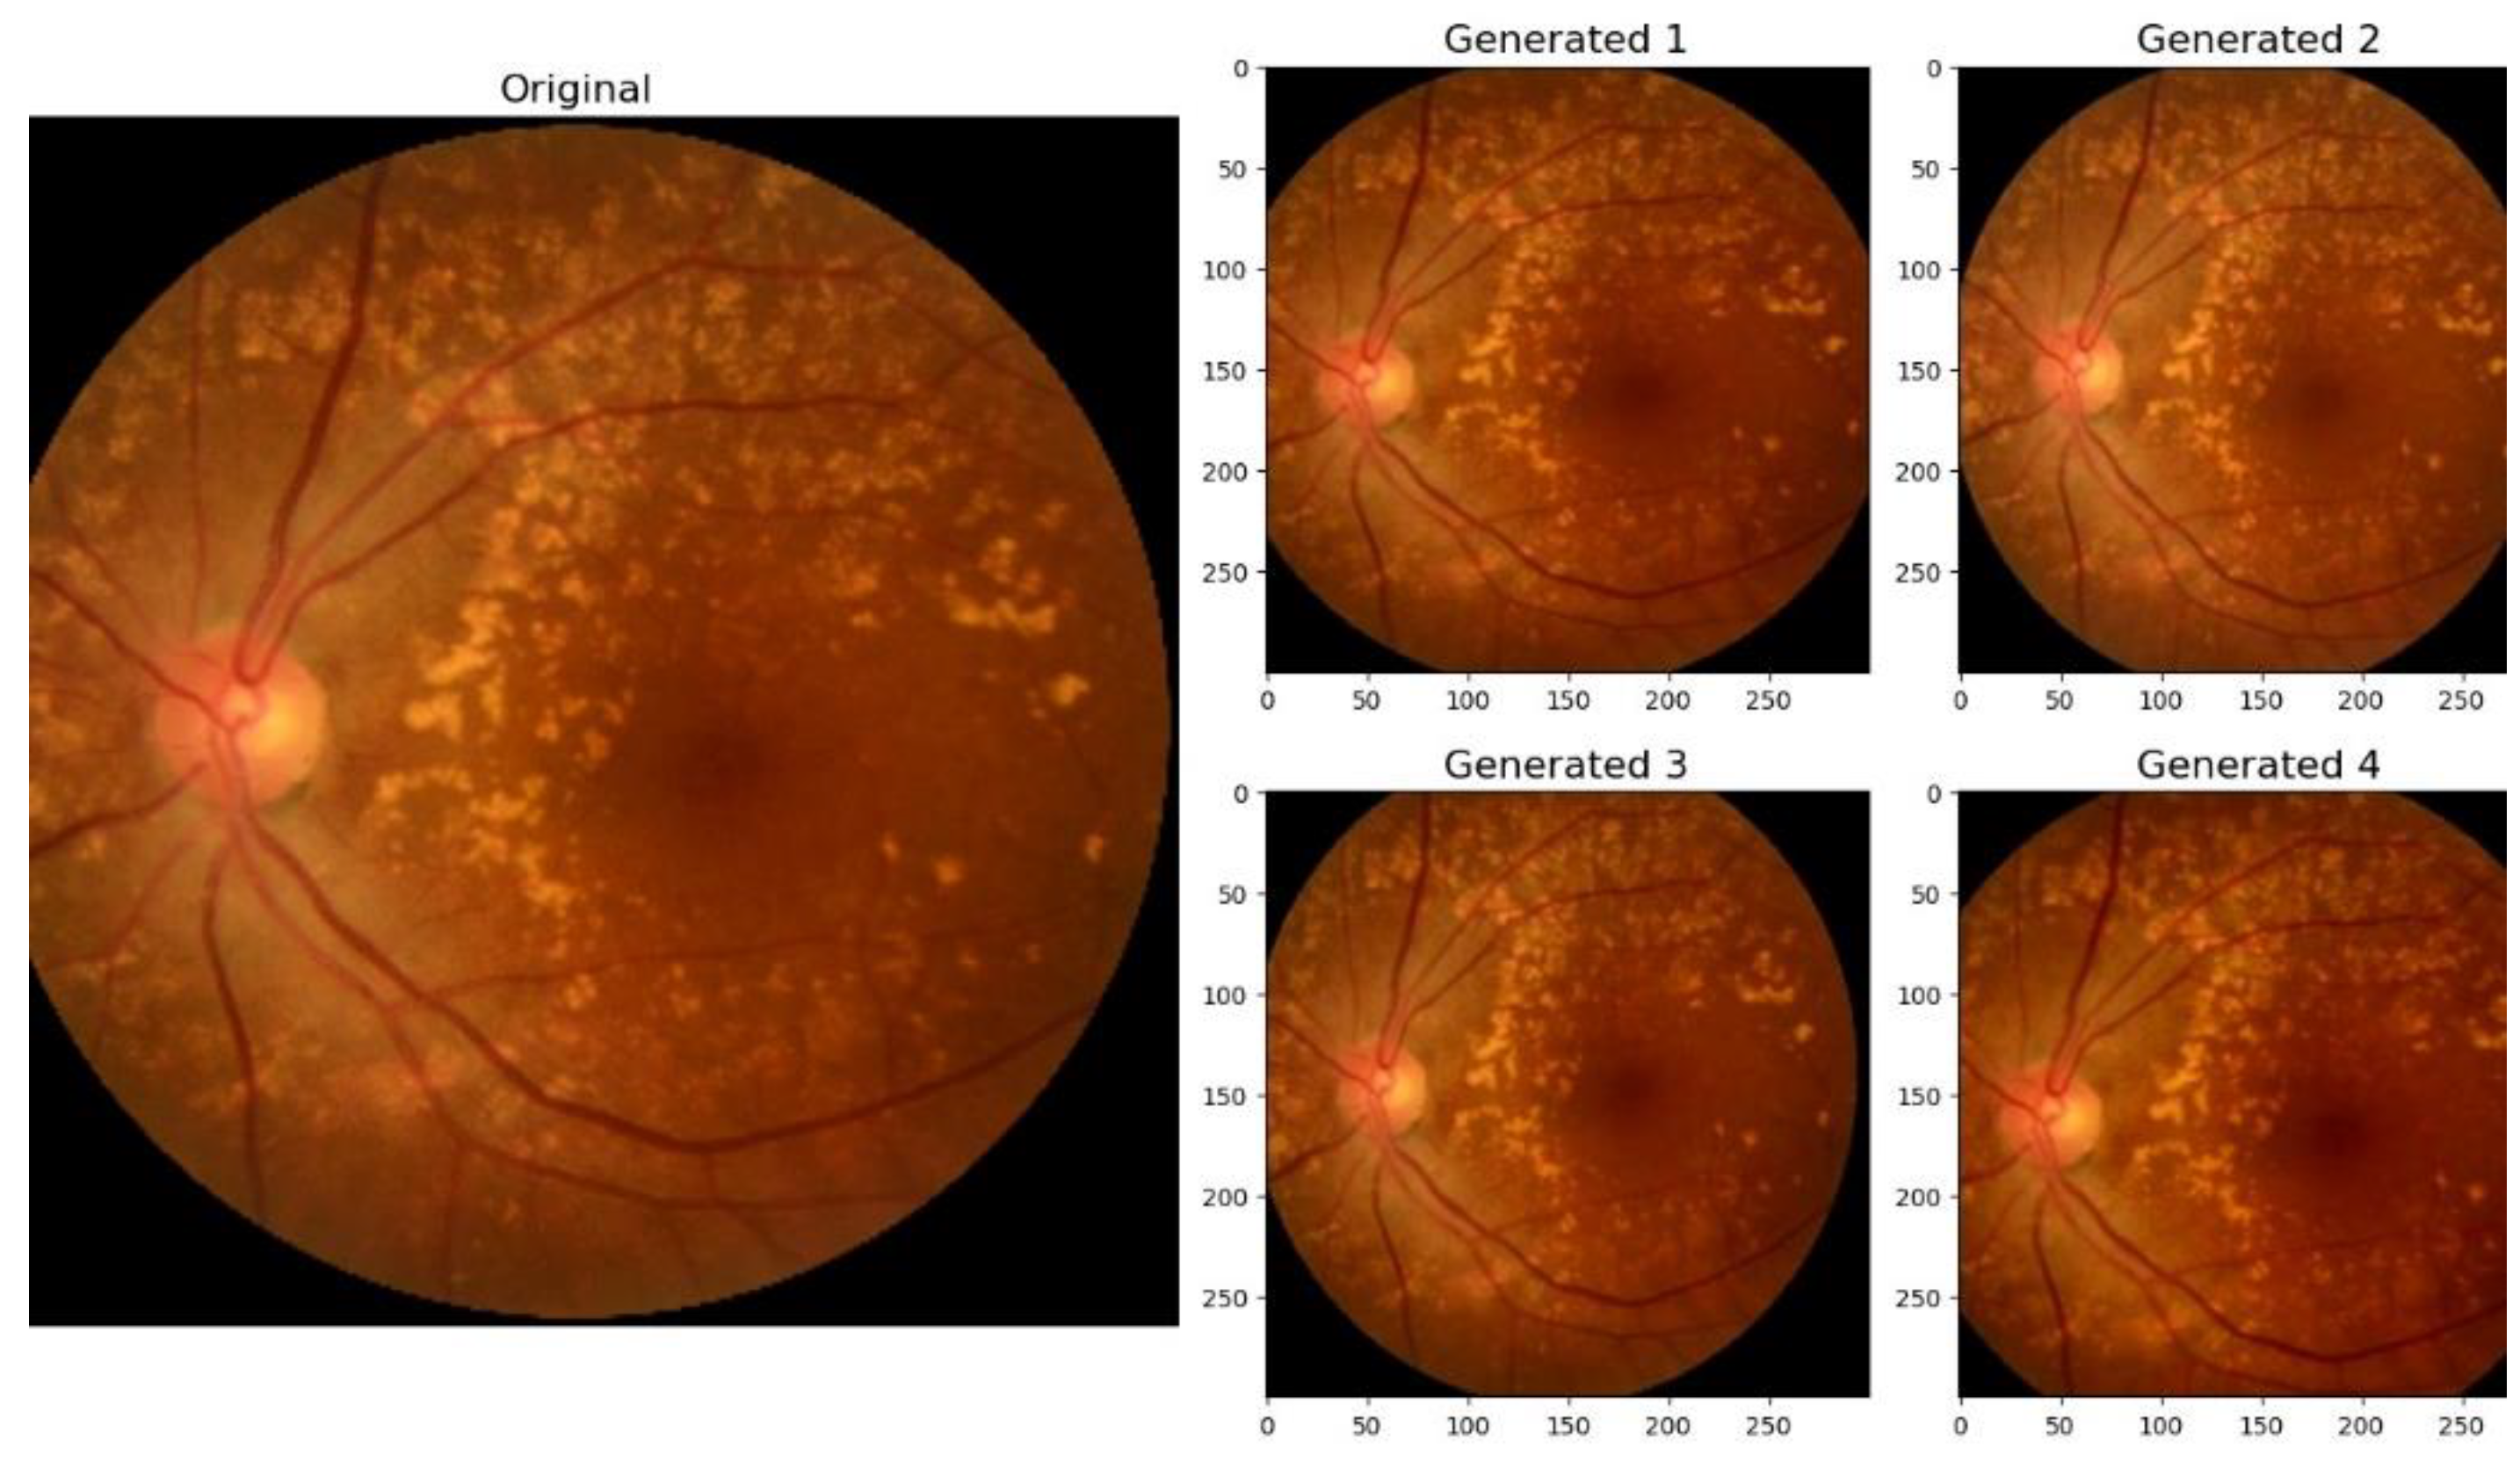
Figure 8.
Comparison of Precision by Class (AMD Stage) and Model.
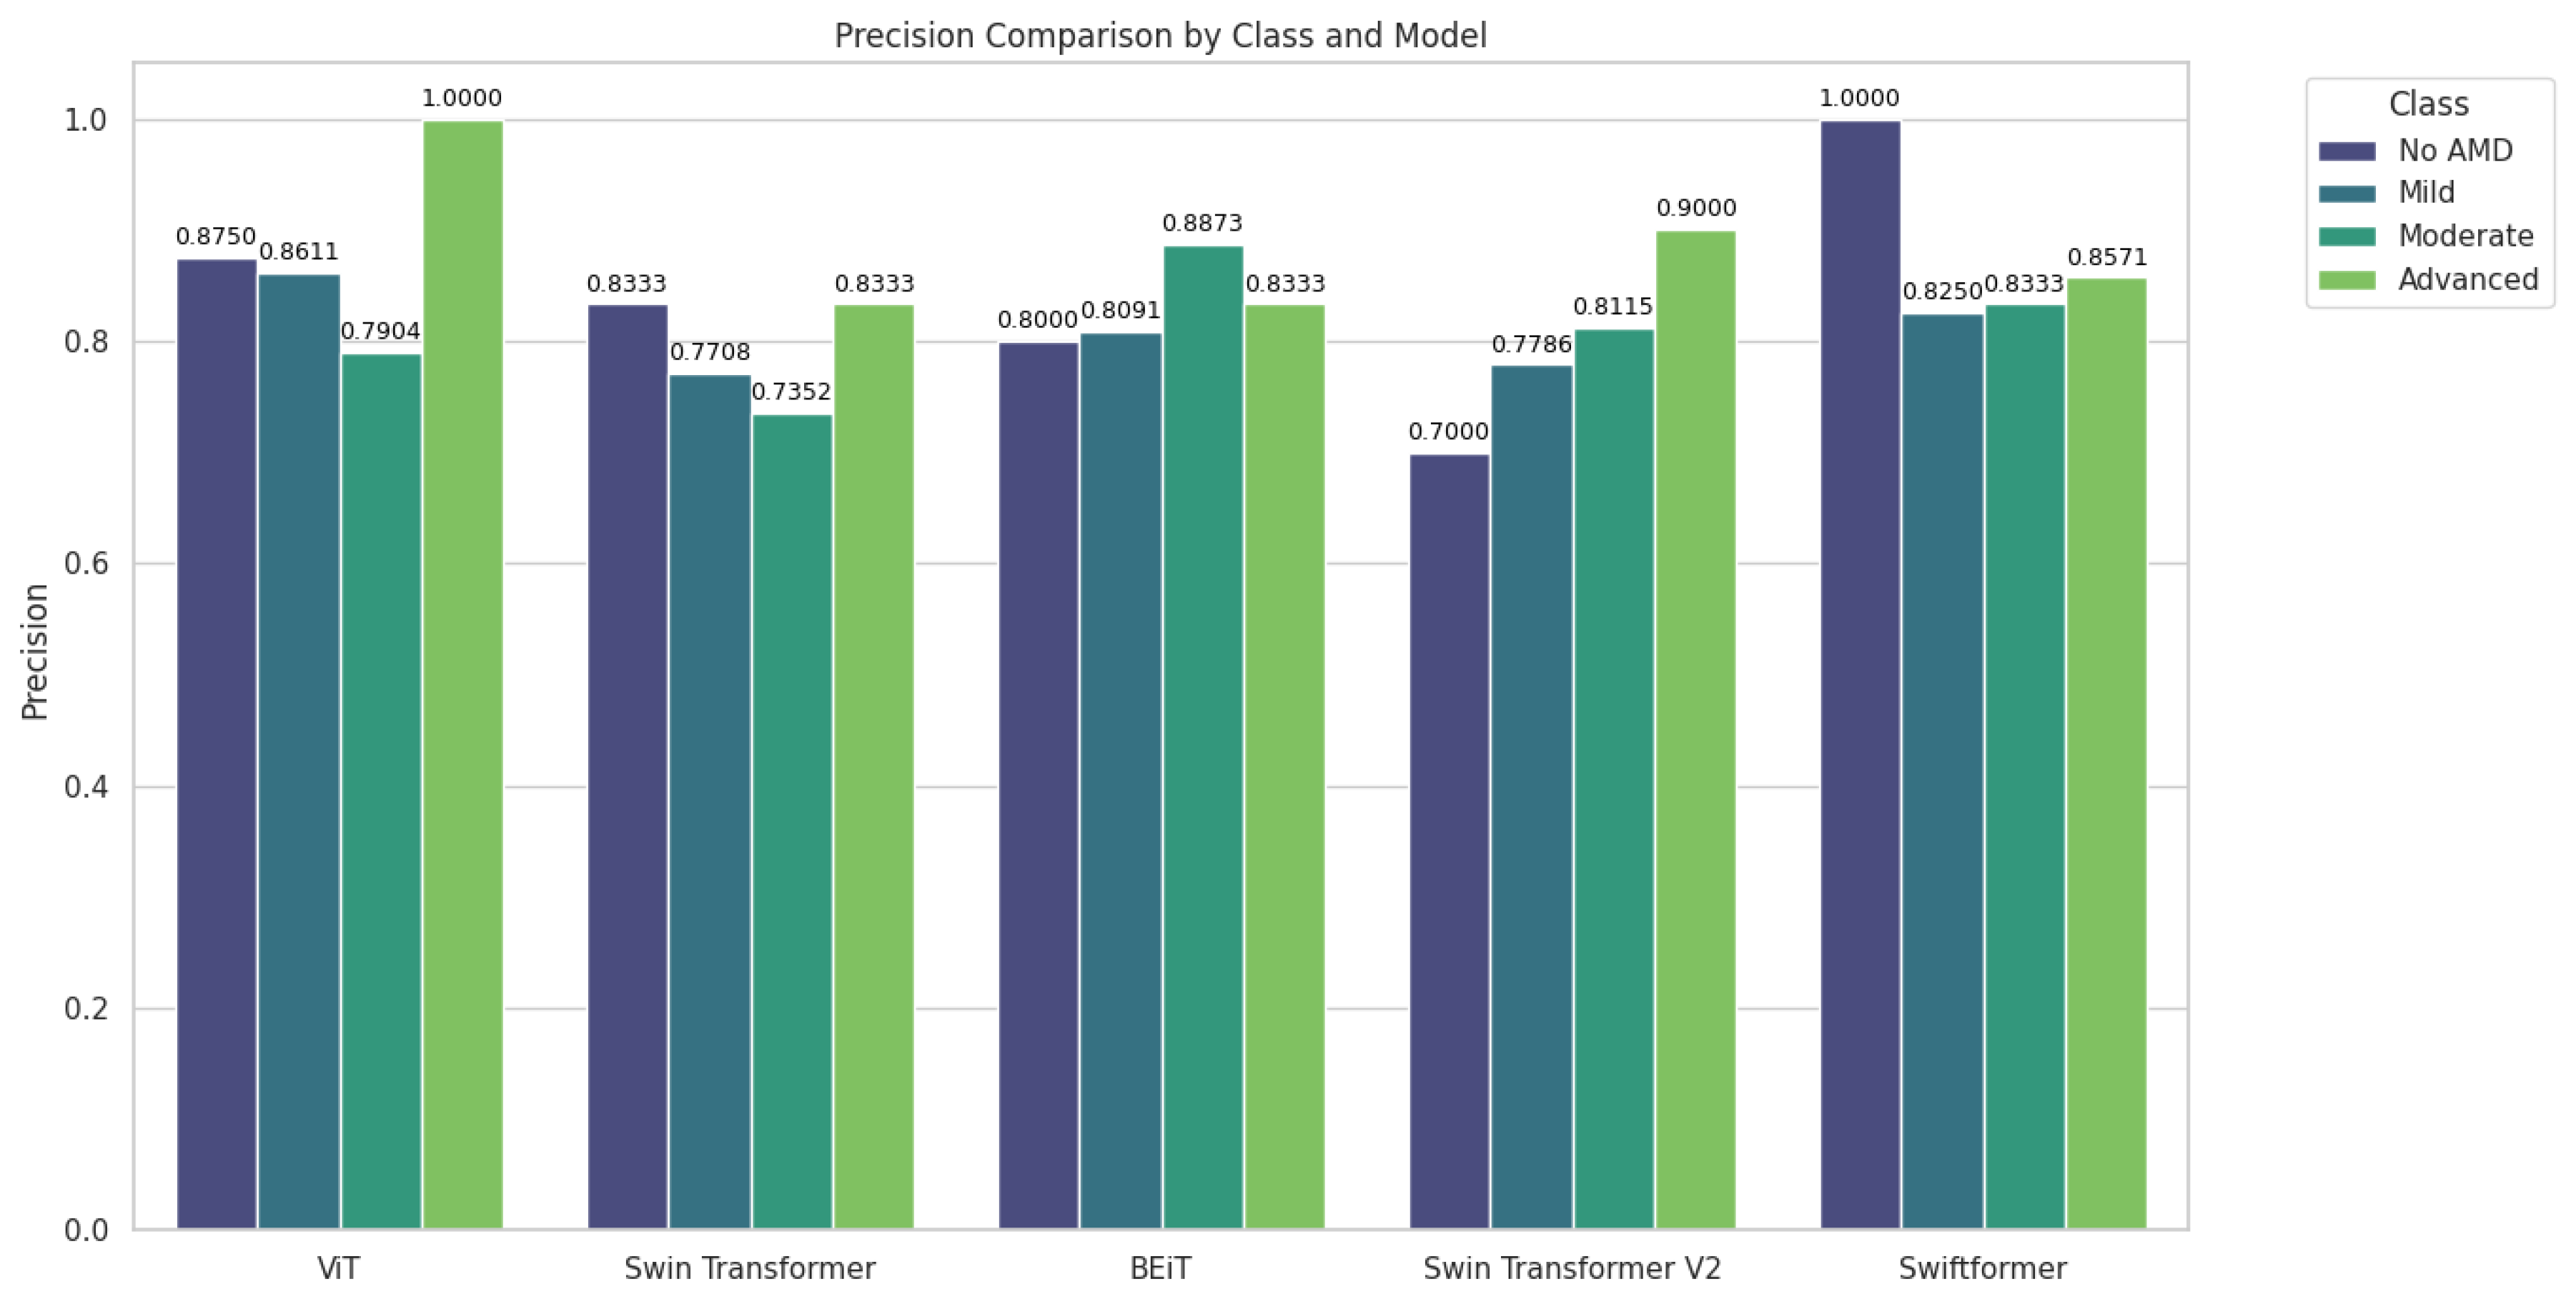
Figure 9.
Comparison of Recall by Class (AMD Stage) and Model.
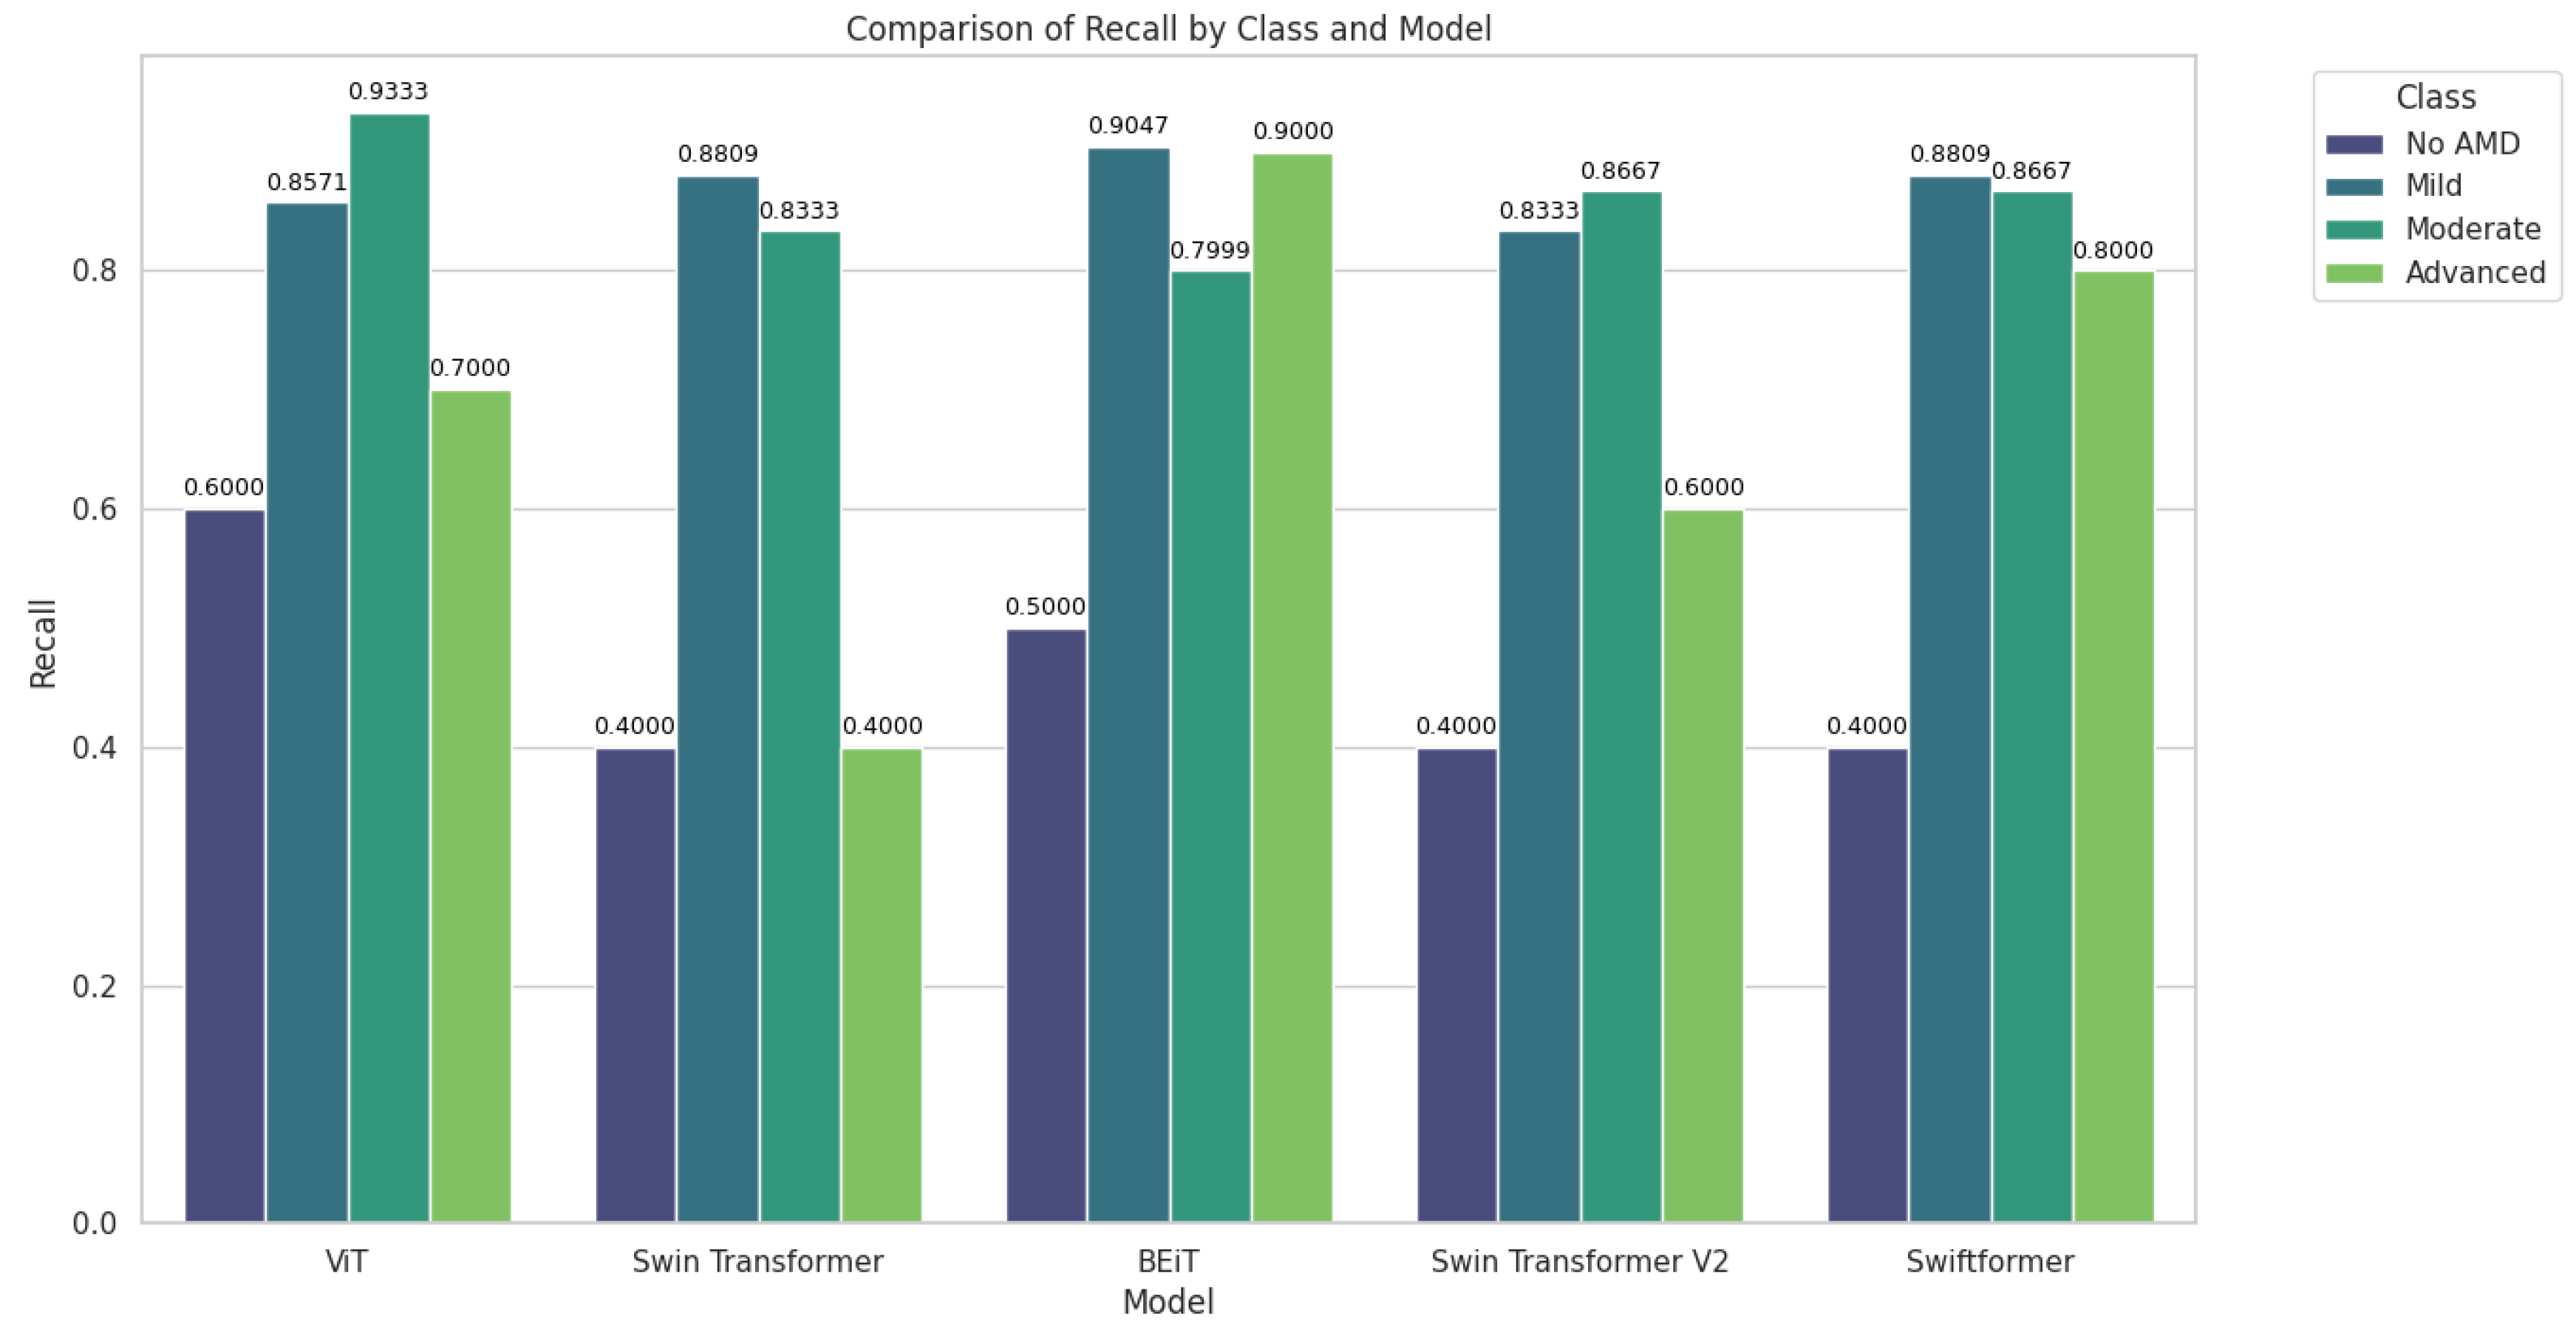
Figure 10.
Comparison of F1-Score by Class (AMD Stage) and Model.
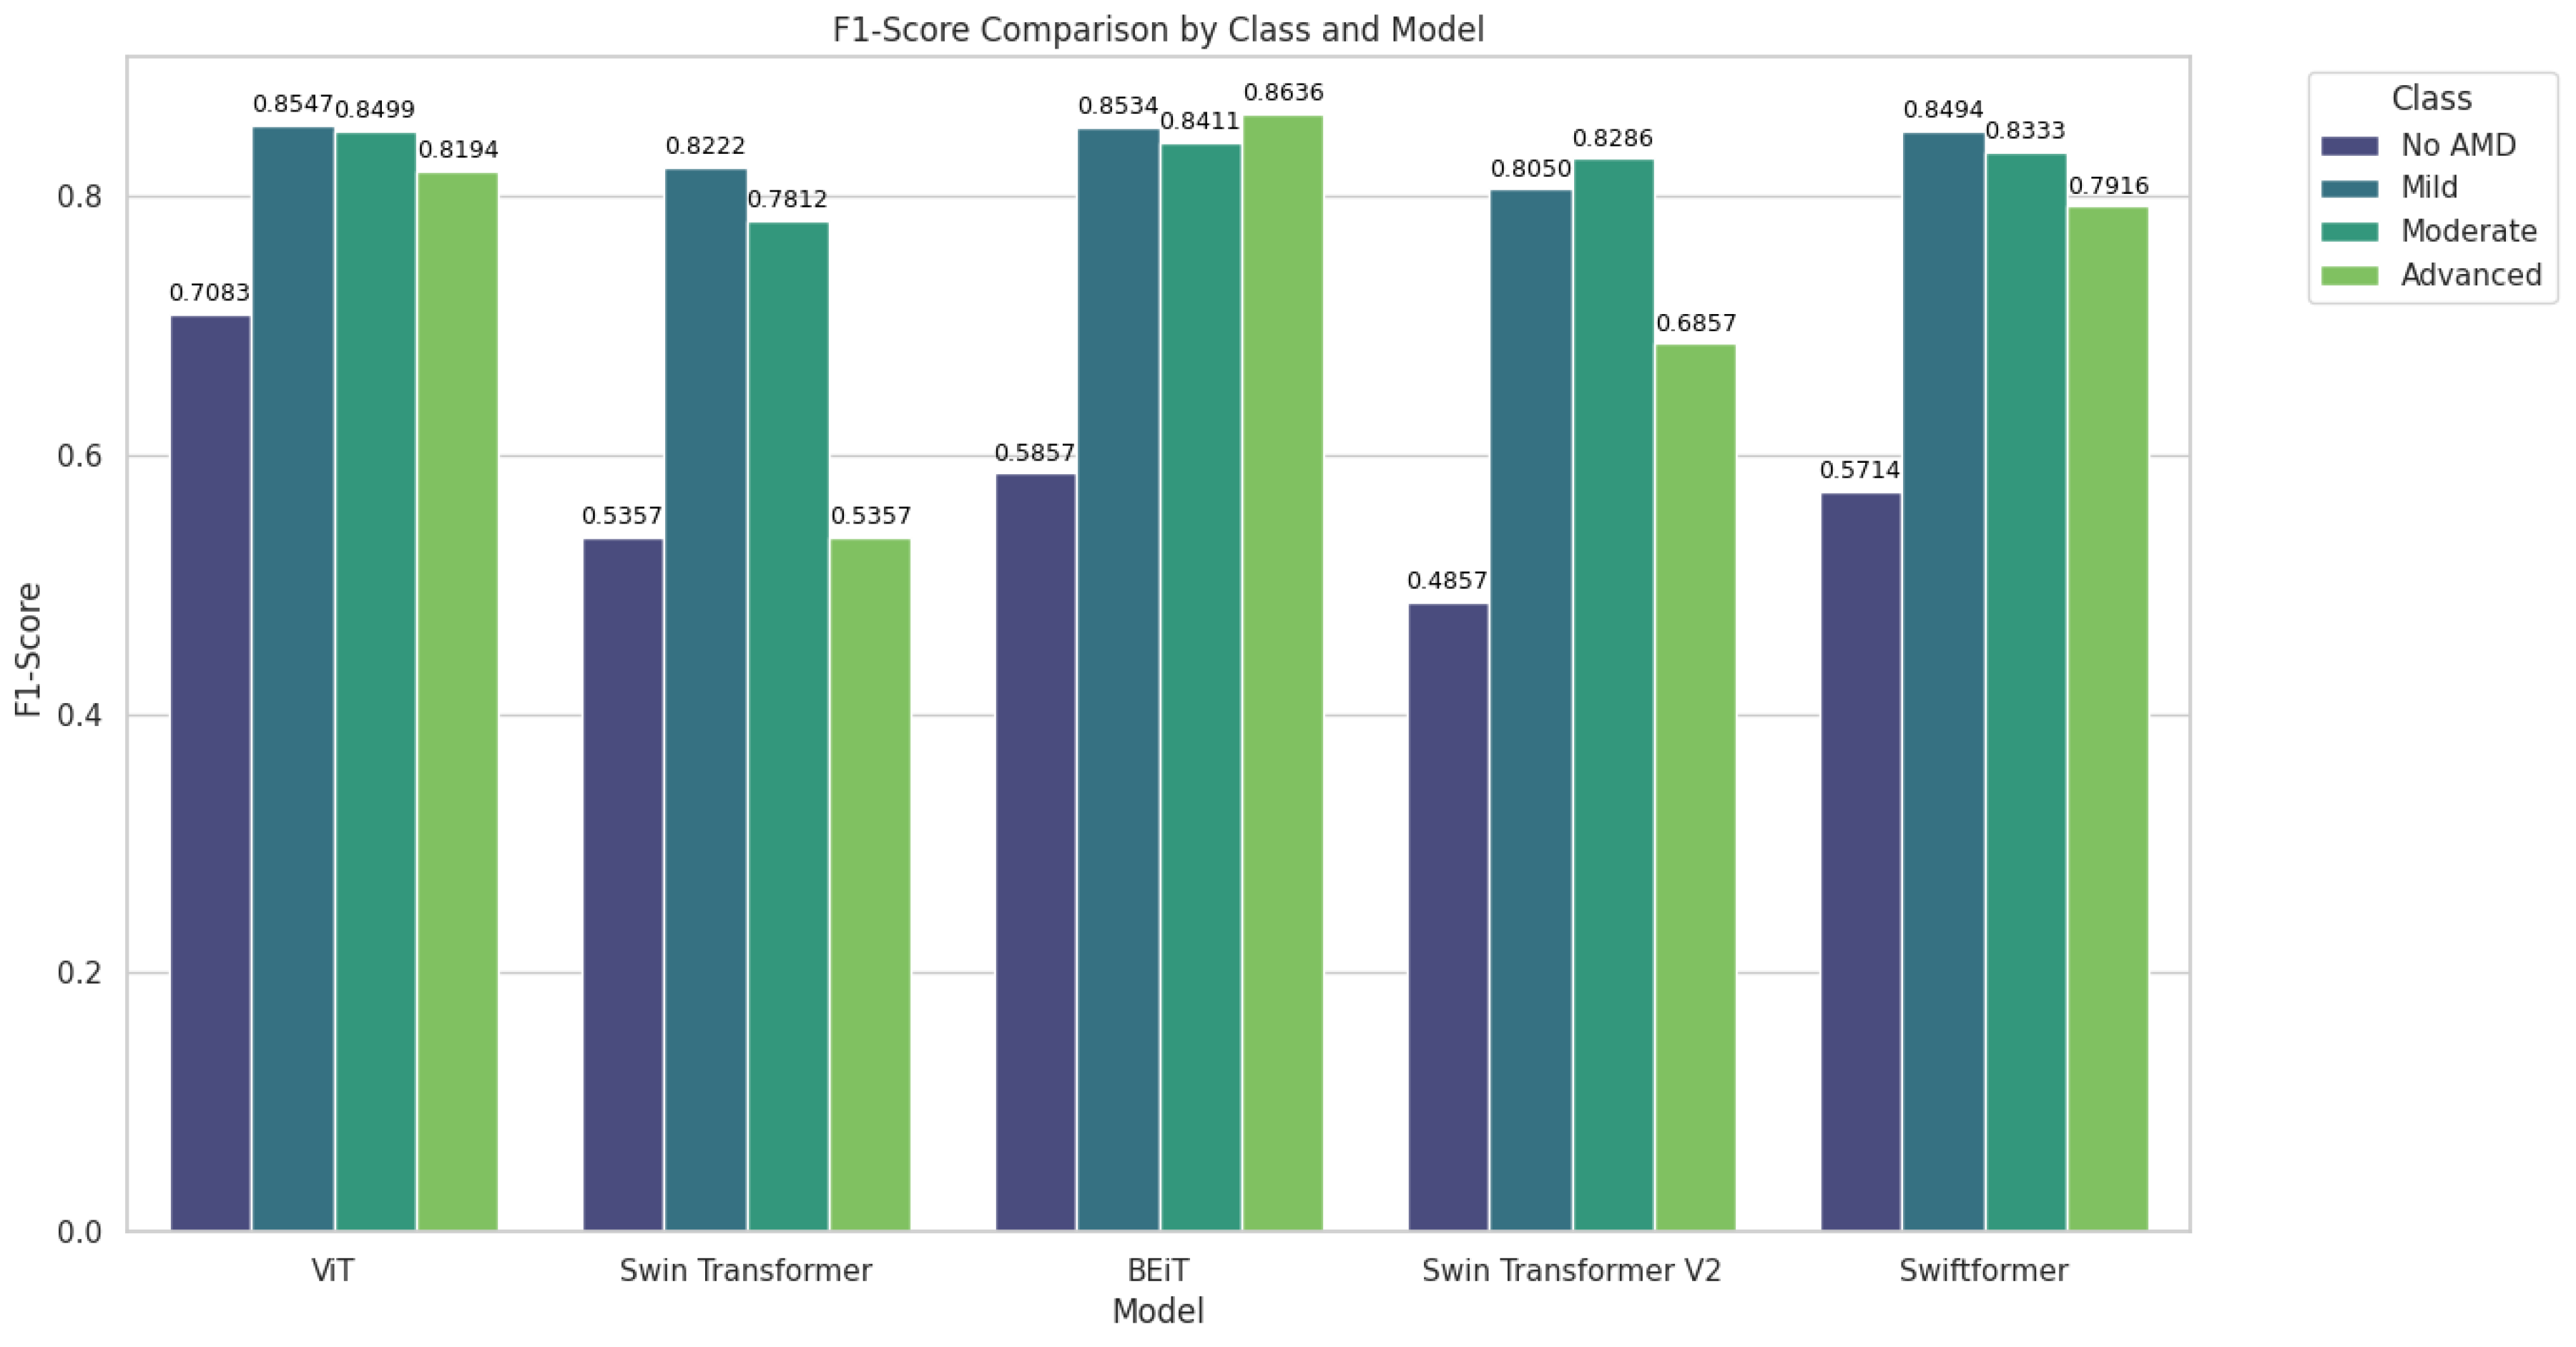
Figure 11.
Comparison of Precision in Validation and Testing.
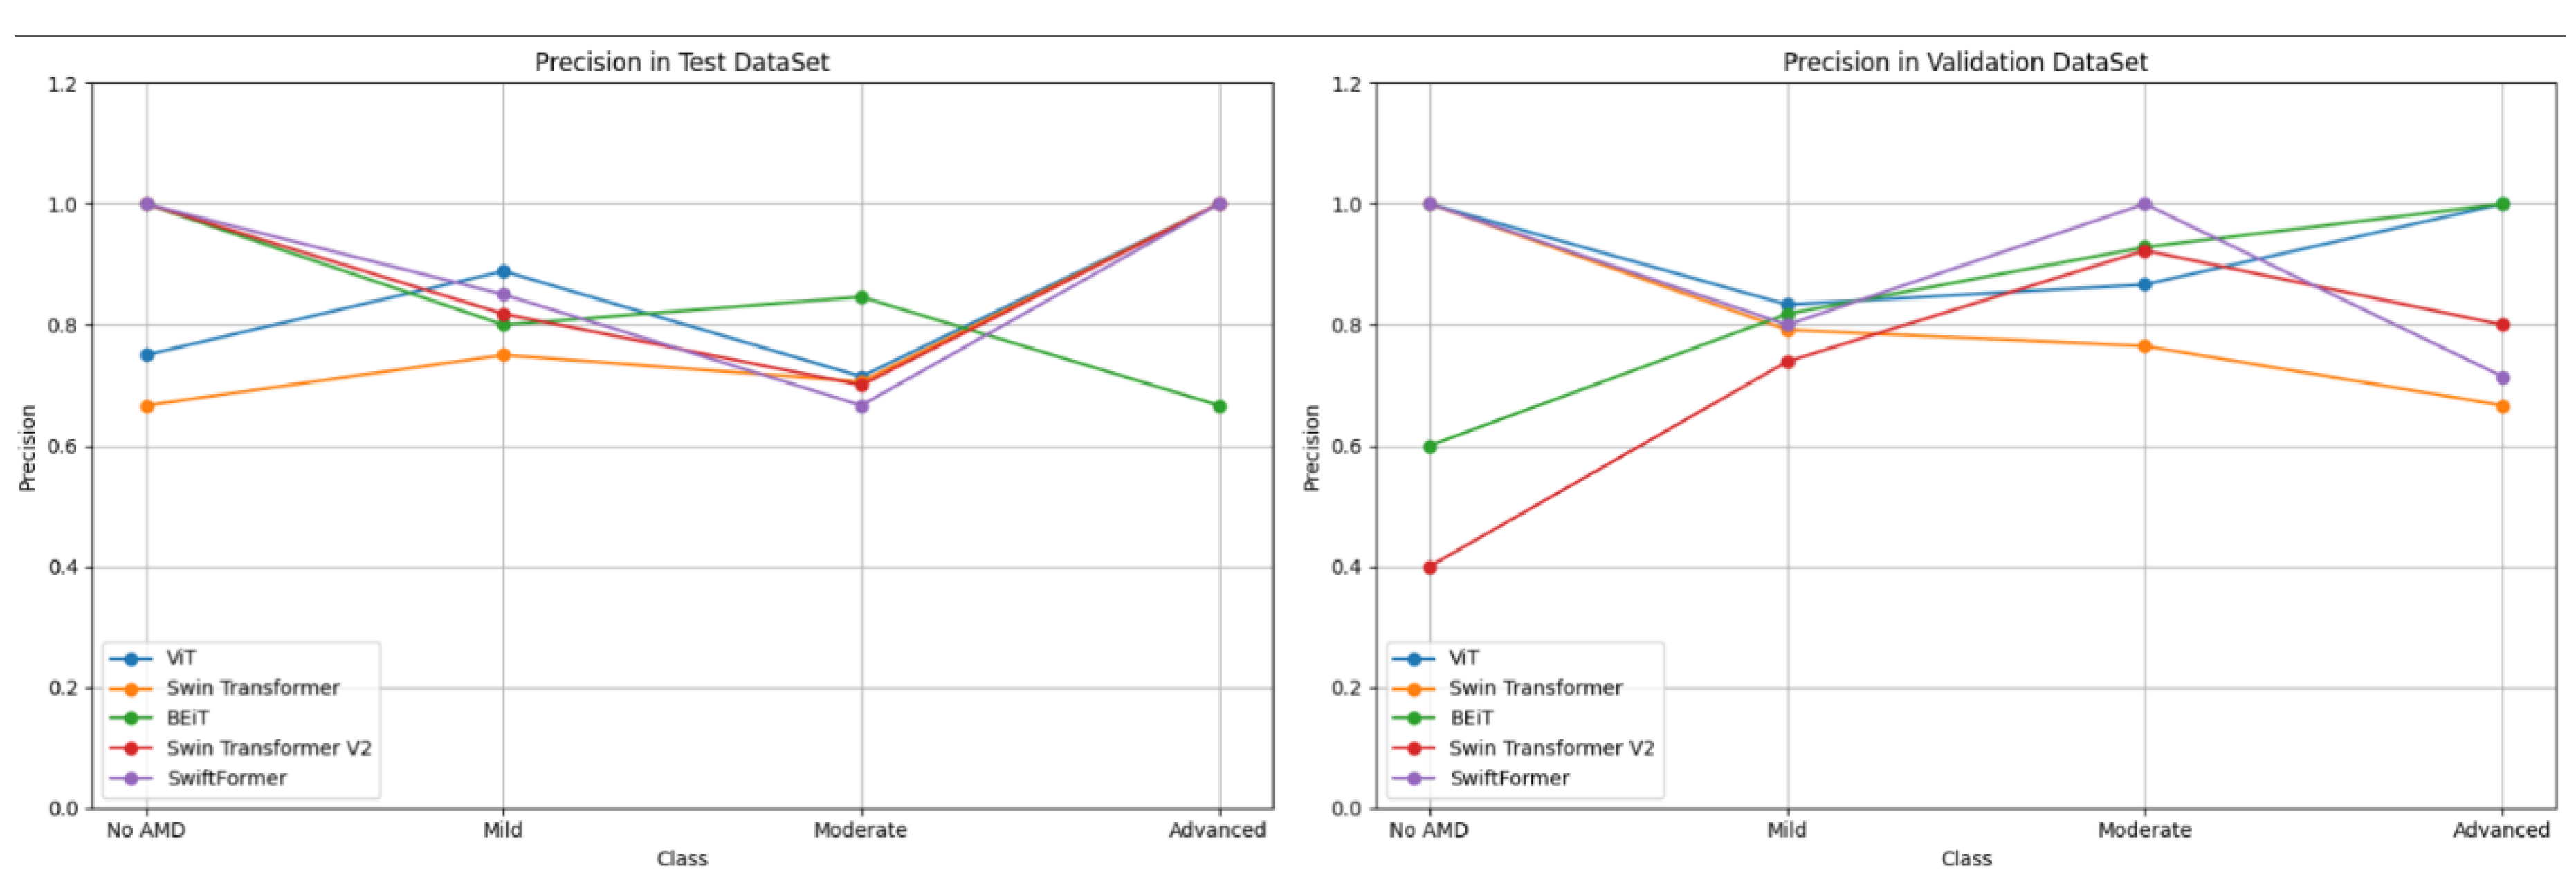
Figure 12.
Comparison of Recall in Validation and Testing.
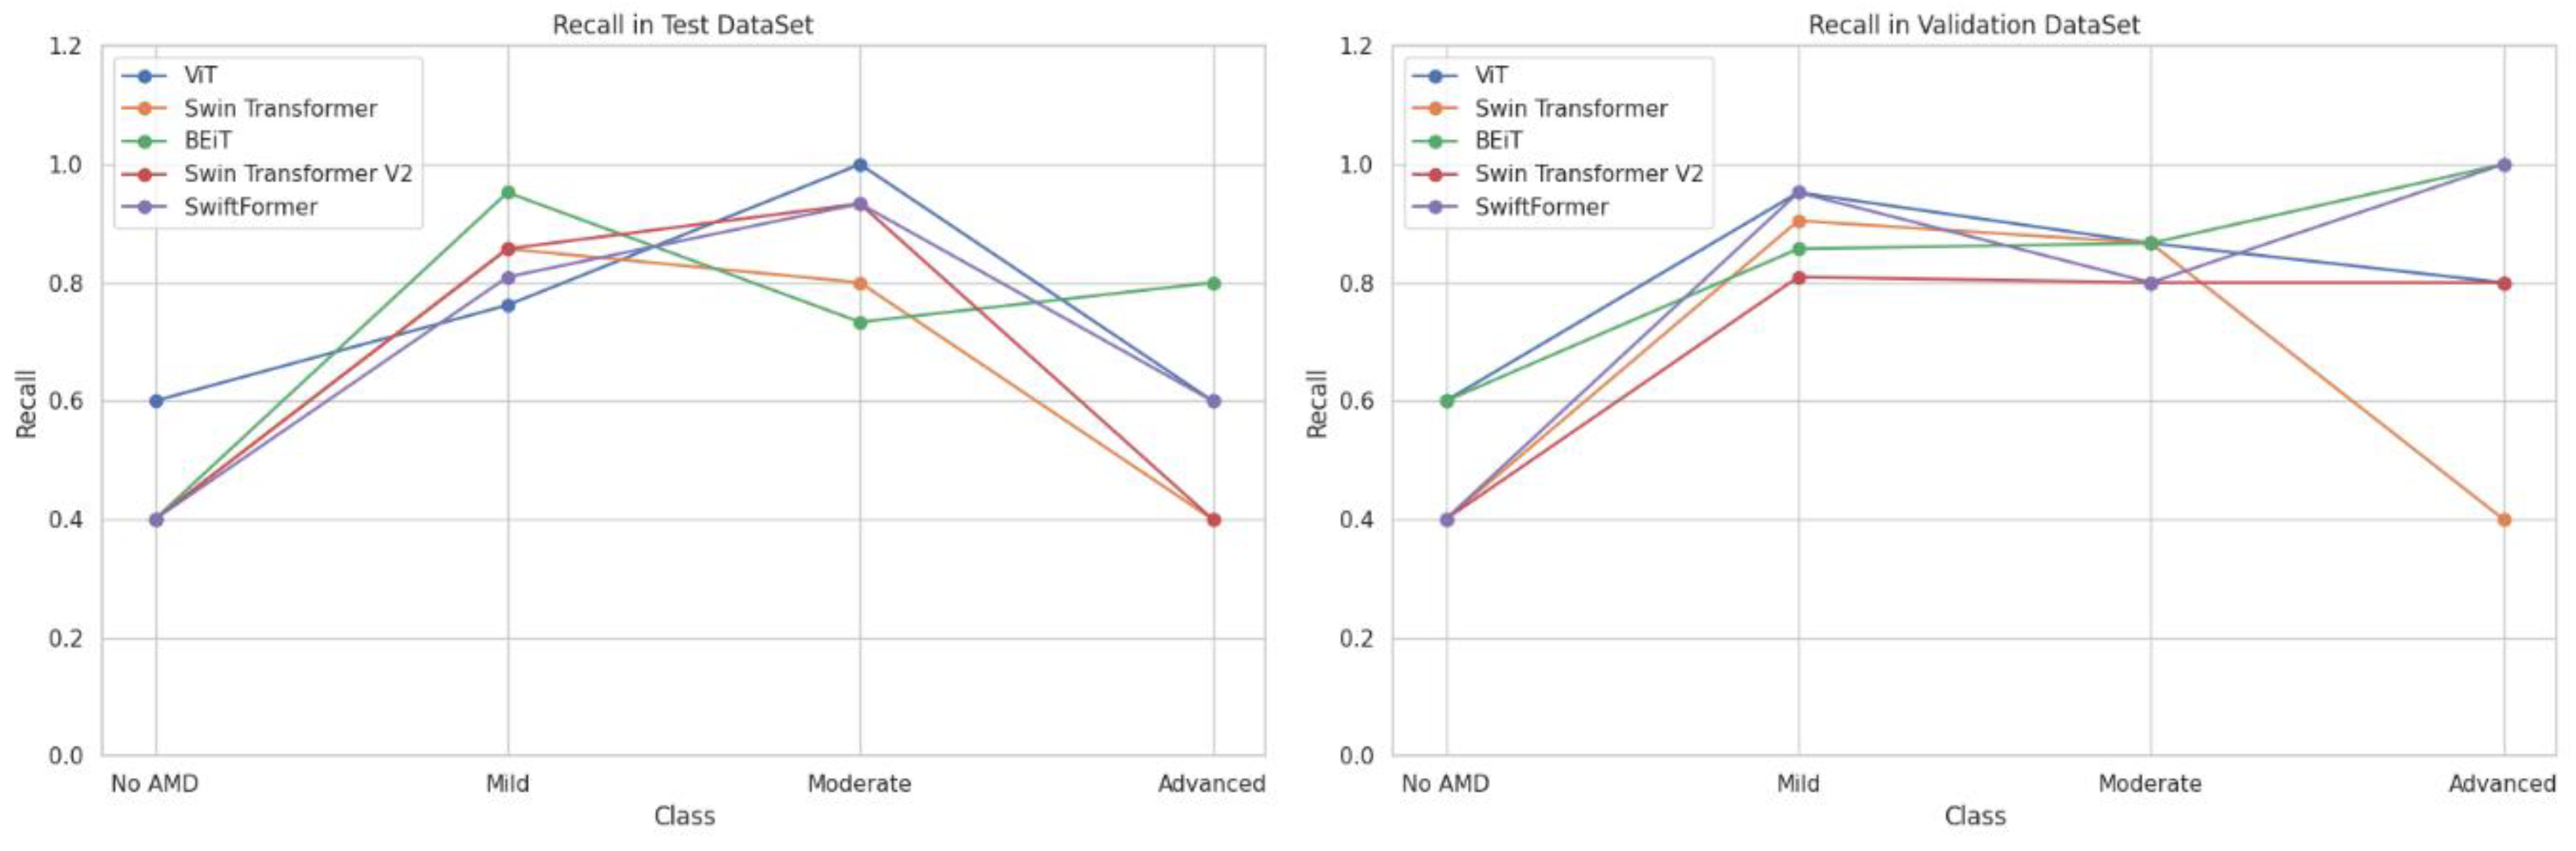
Figure 13.
Comparison of F1-Score in Validation and Testing.
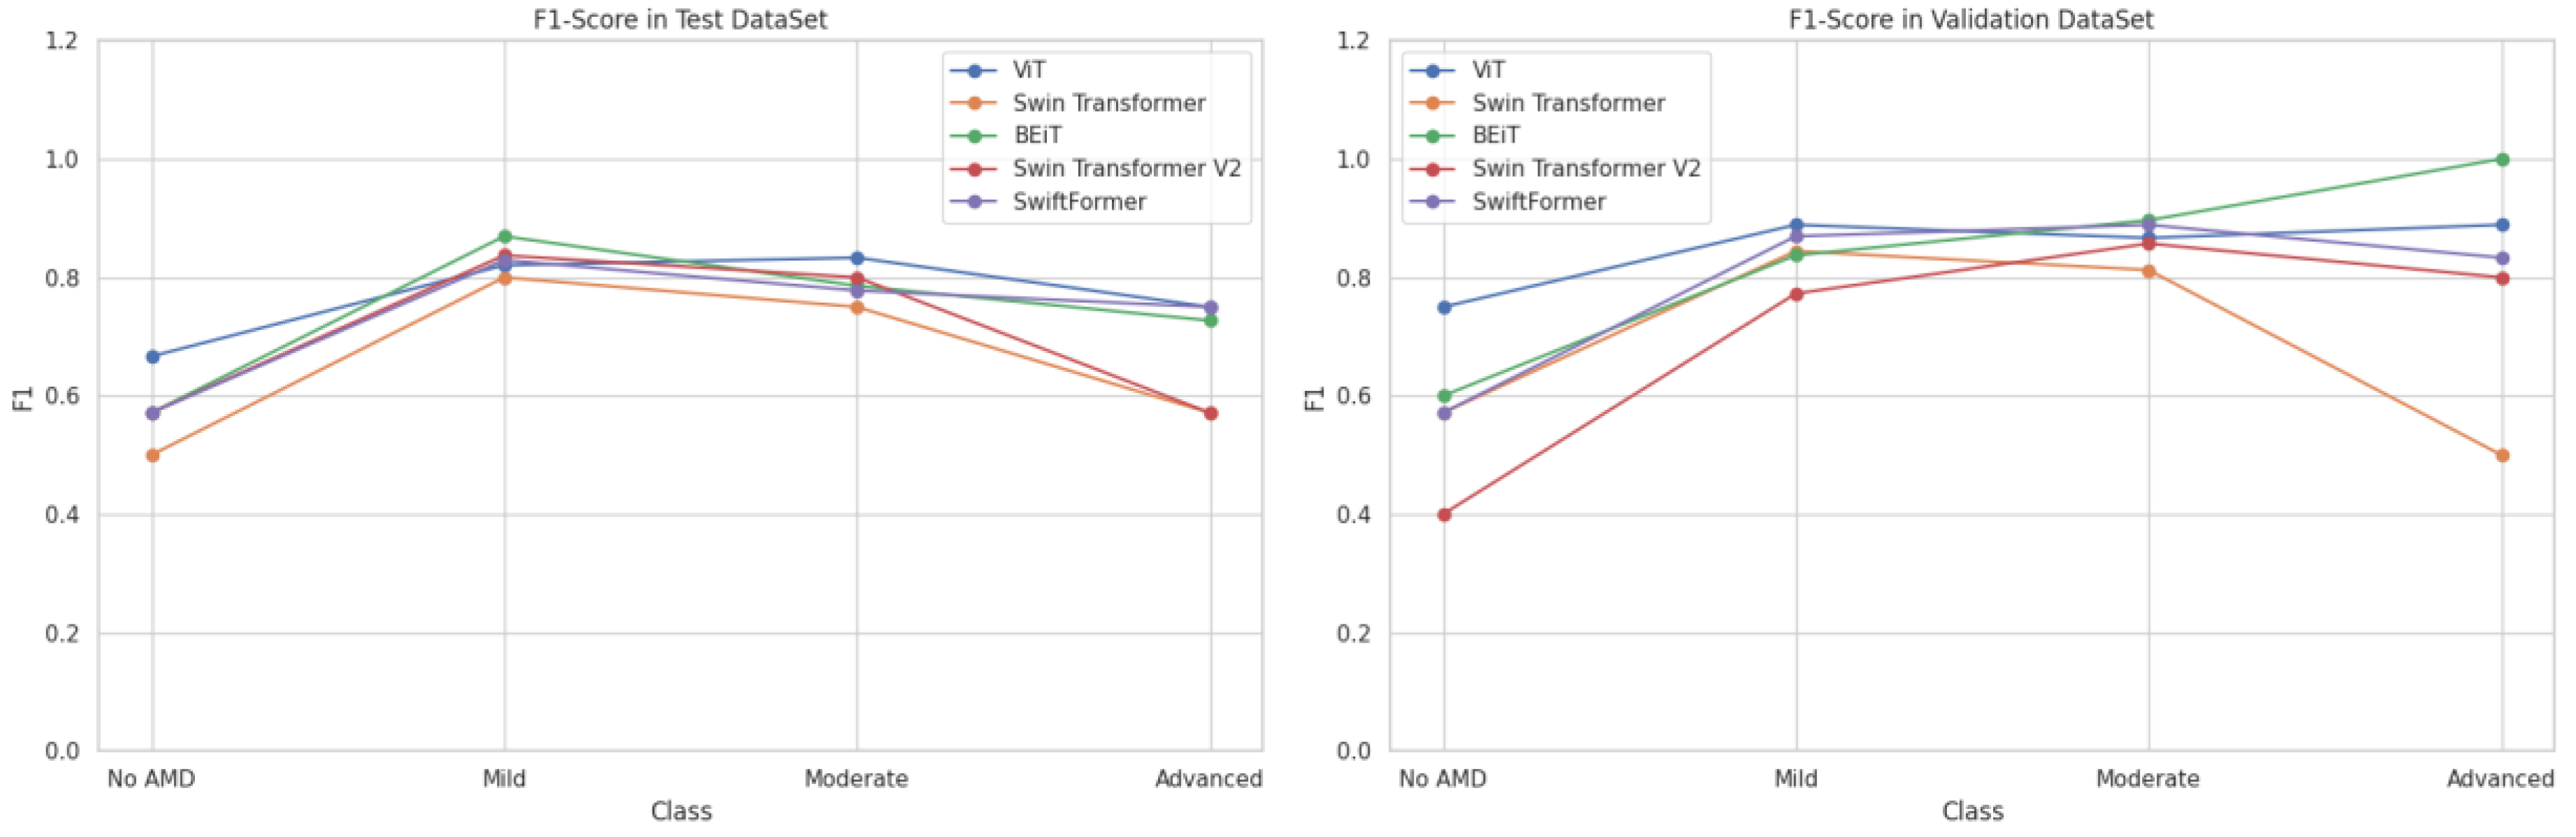
Figure 14.
Comparison of Model Precision by Class (AMD Stage).
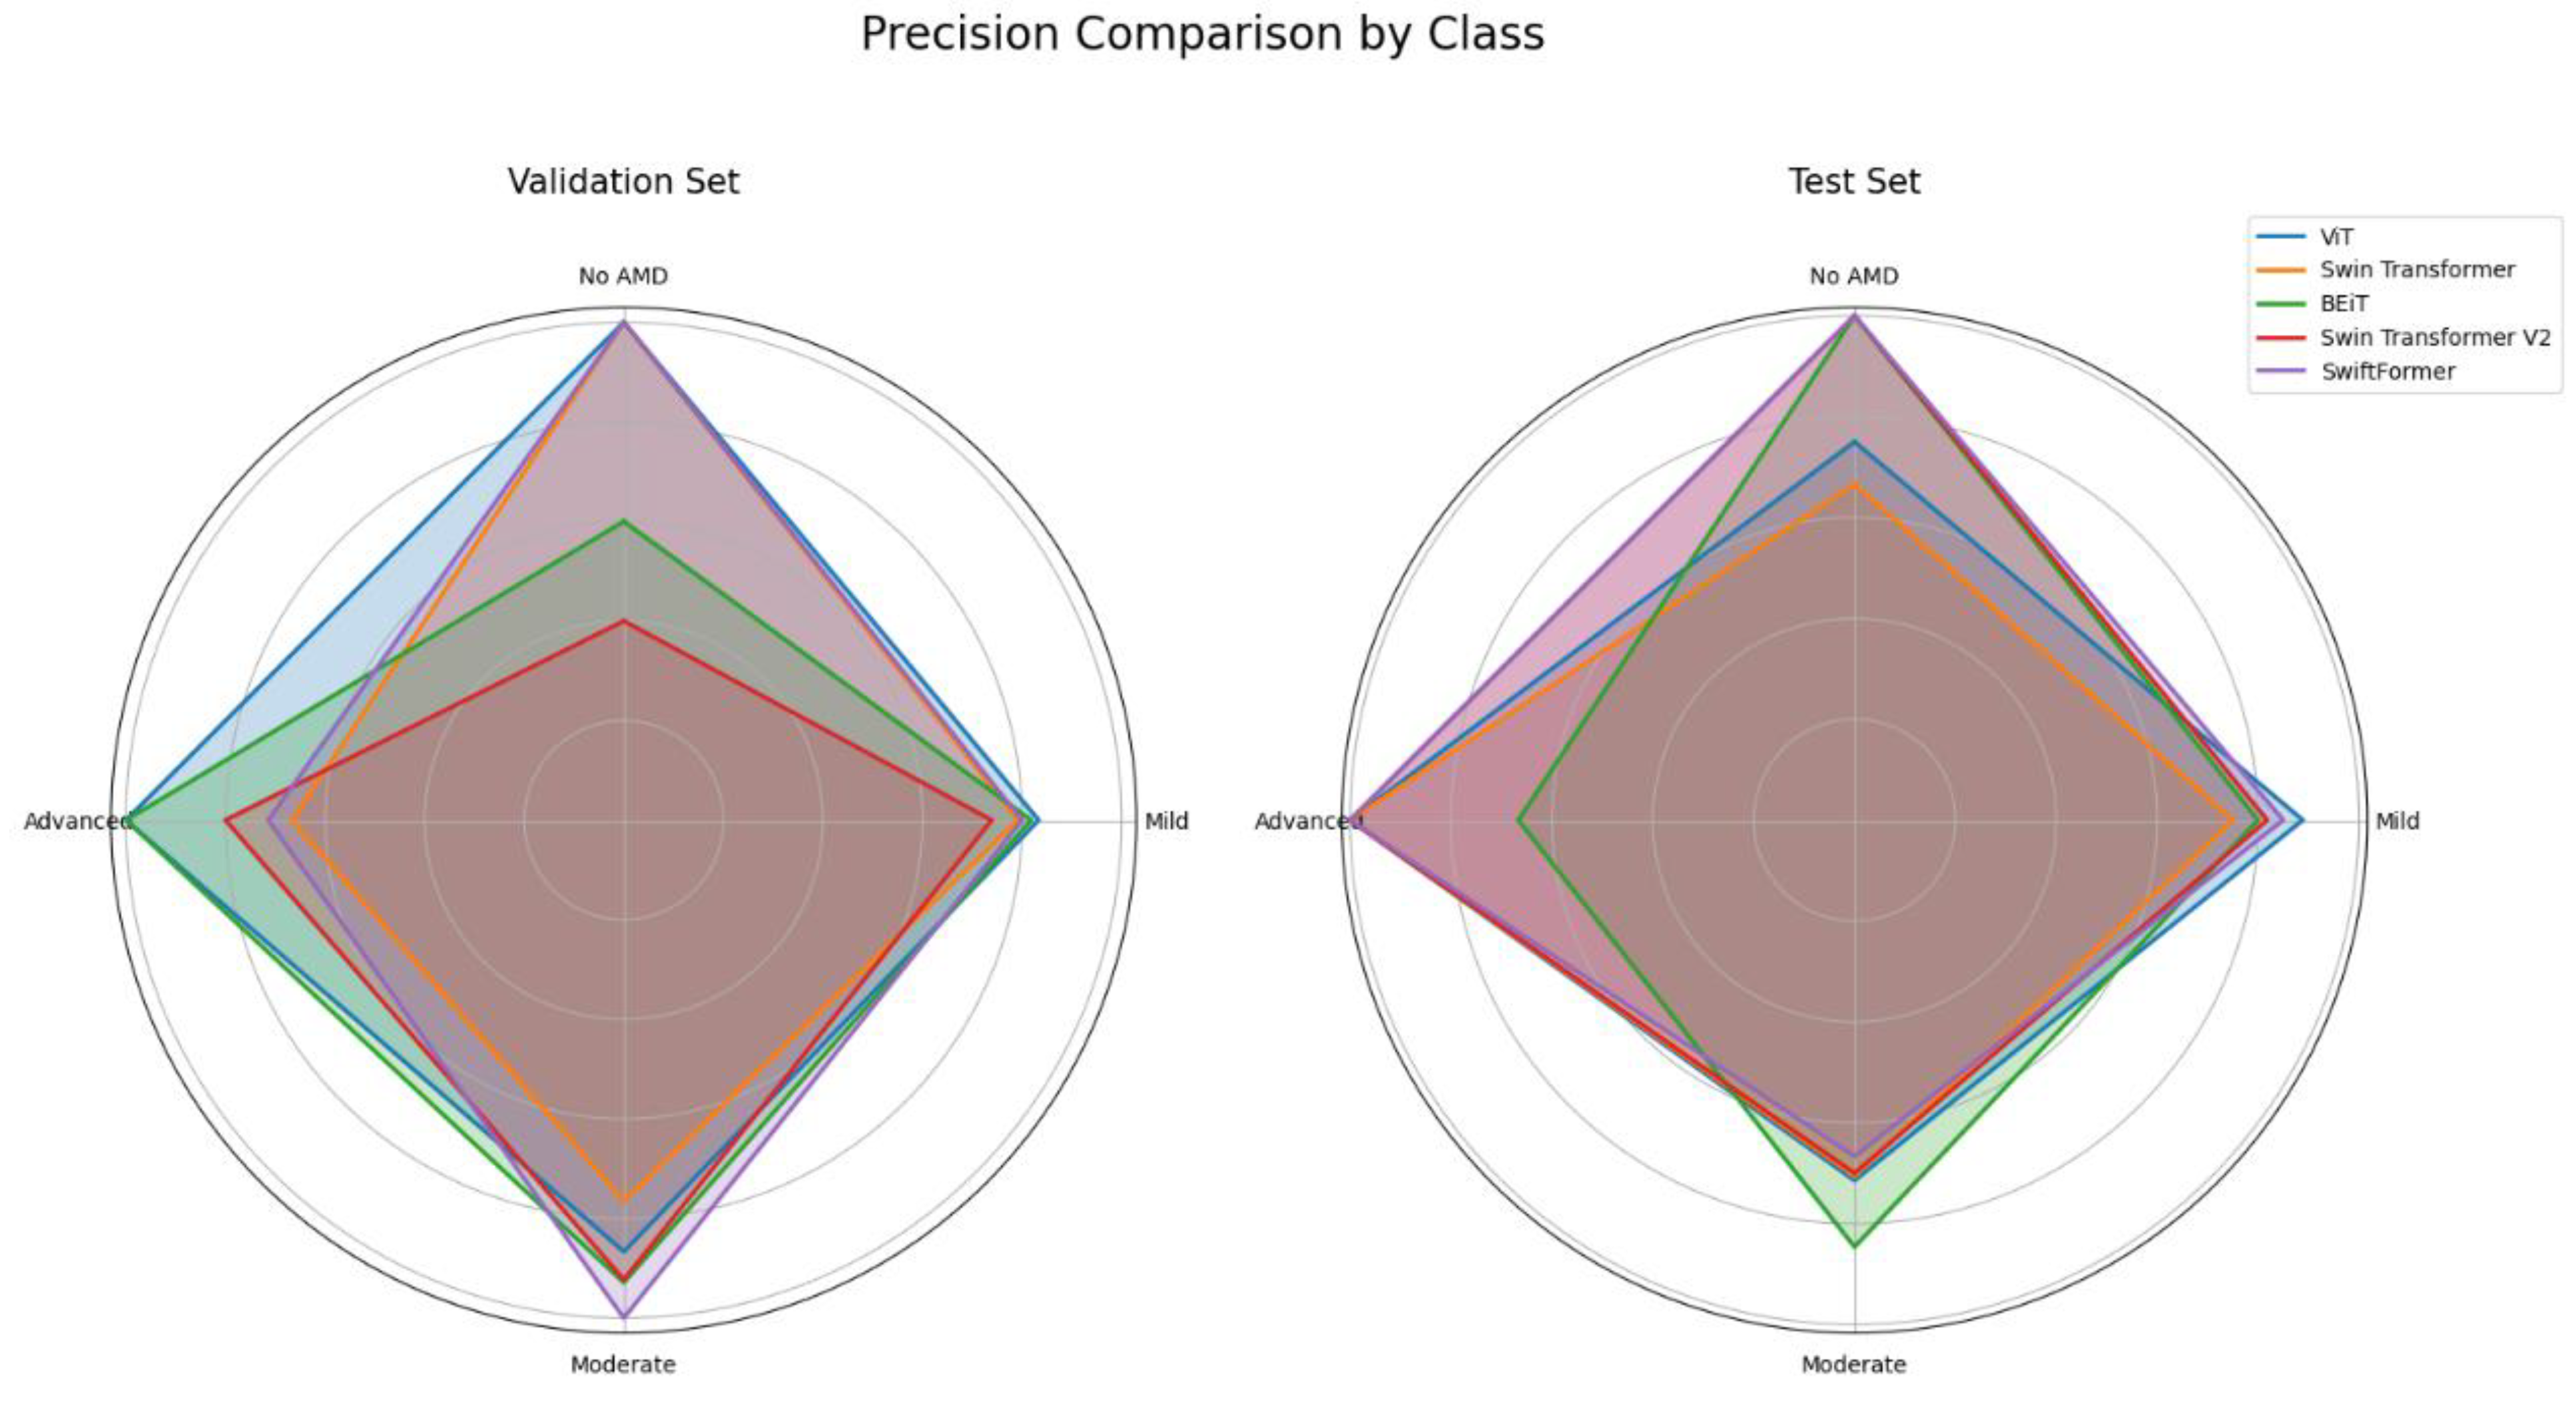
Figure 15.
Comparison of Recall by Class (AMD Stage).
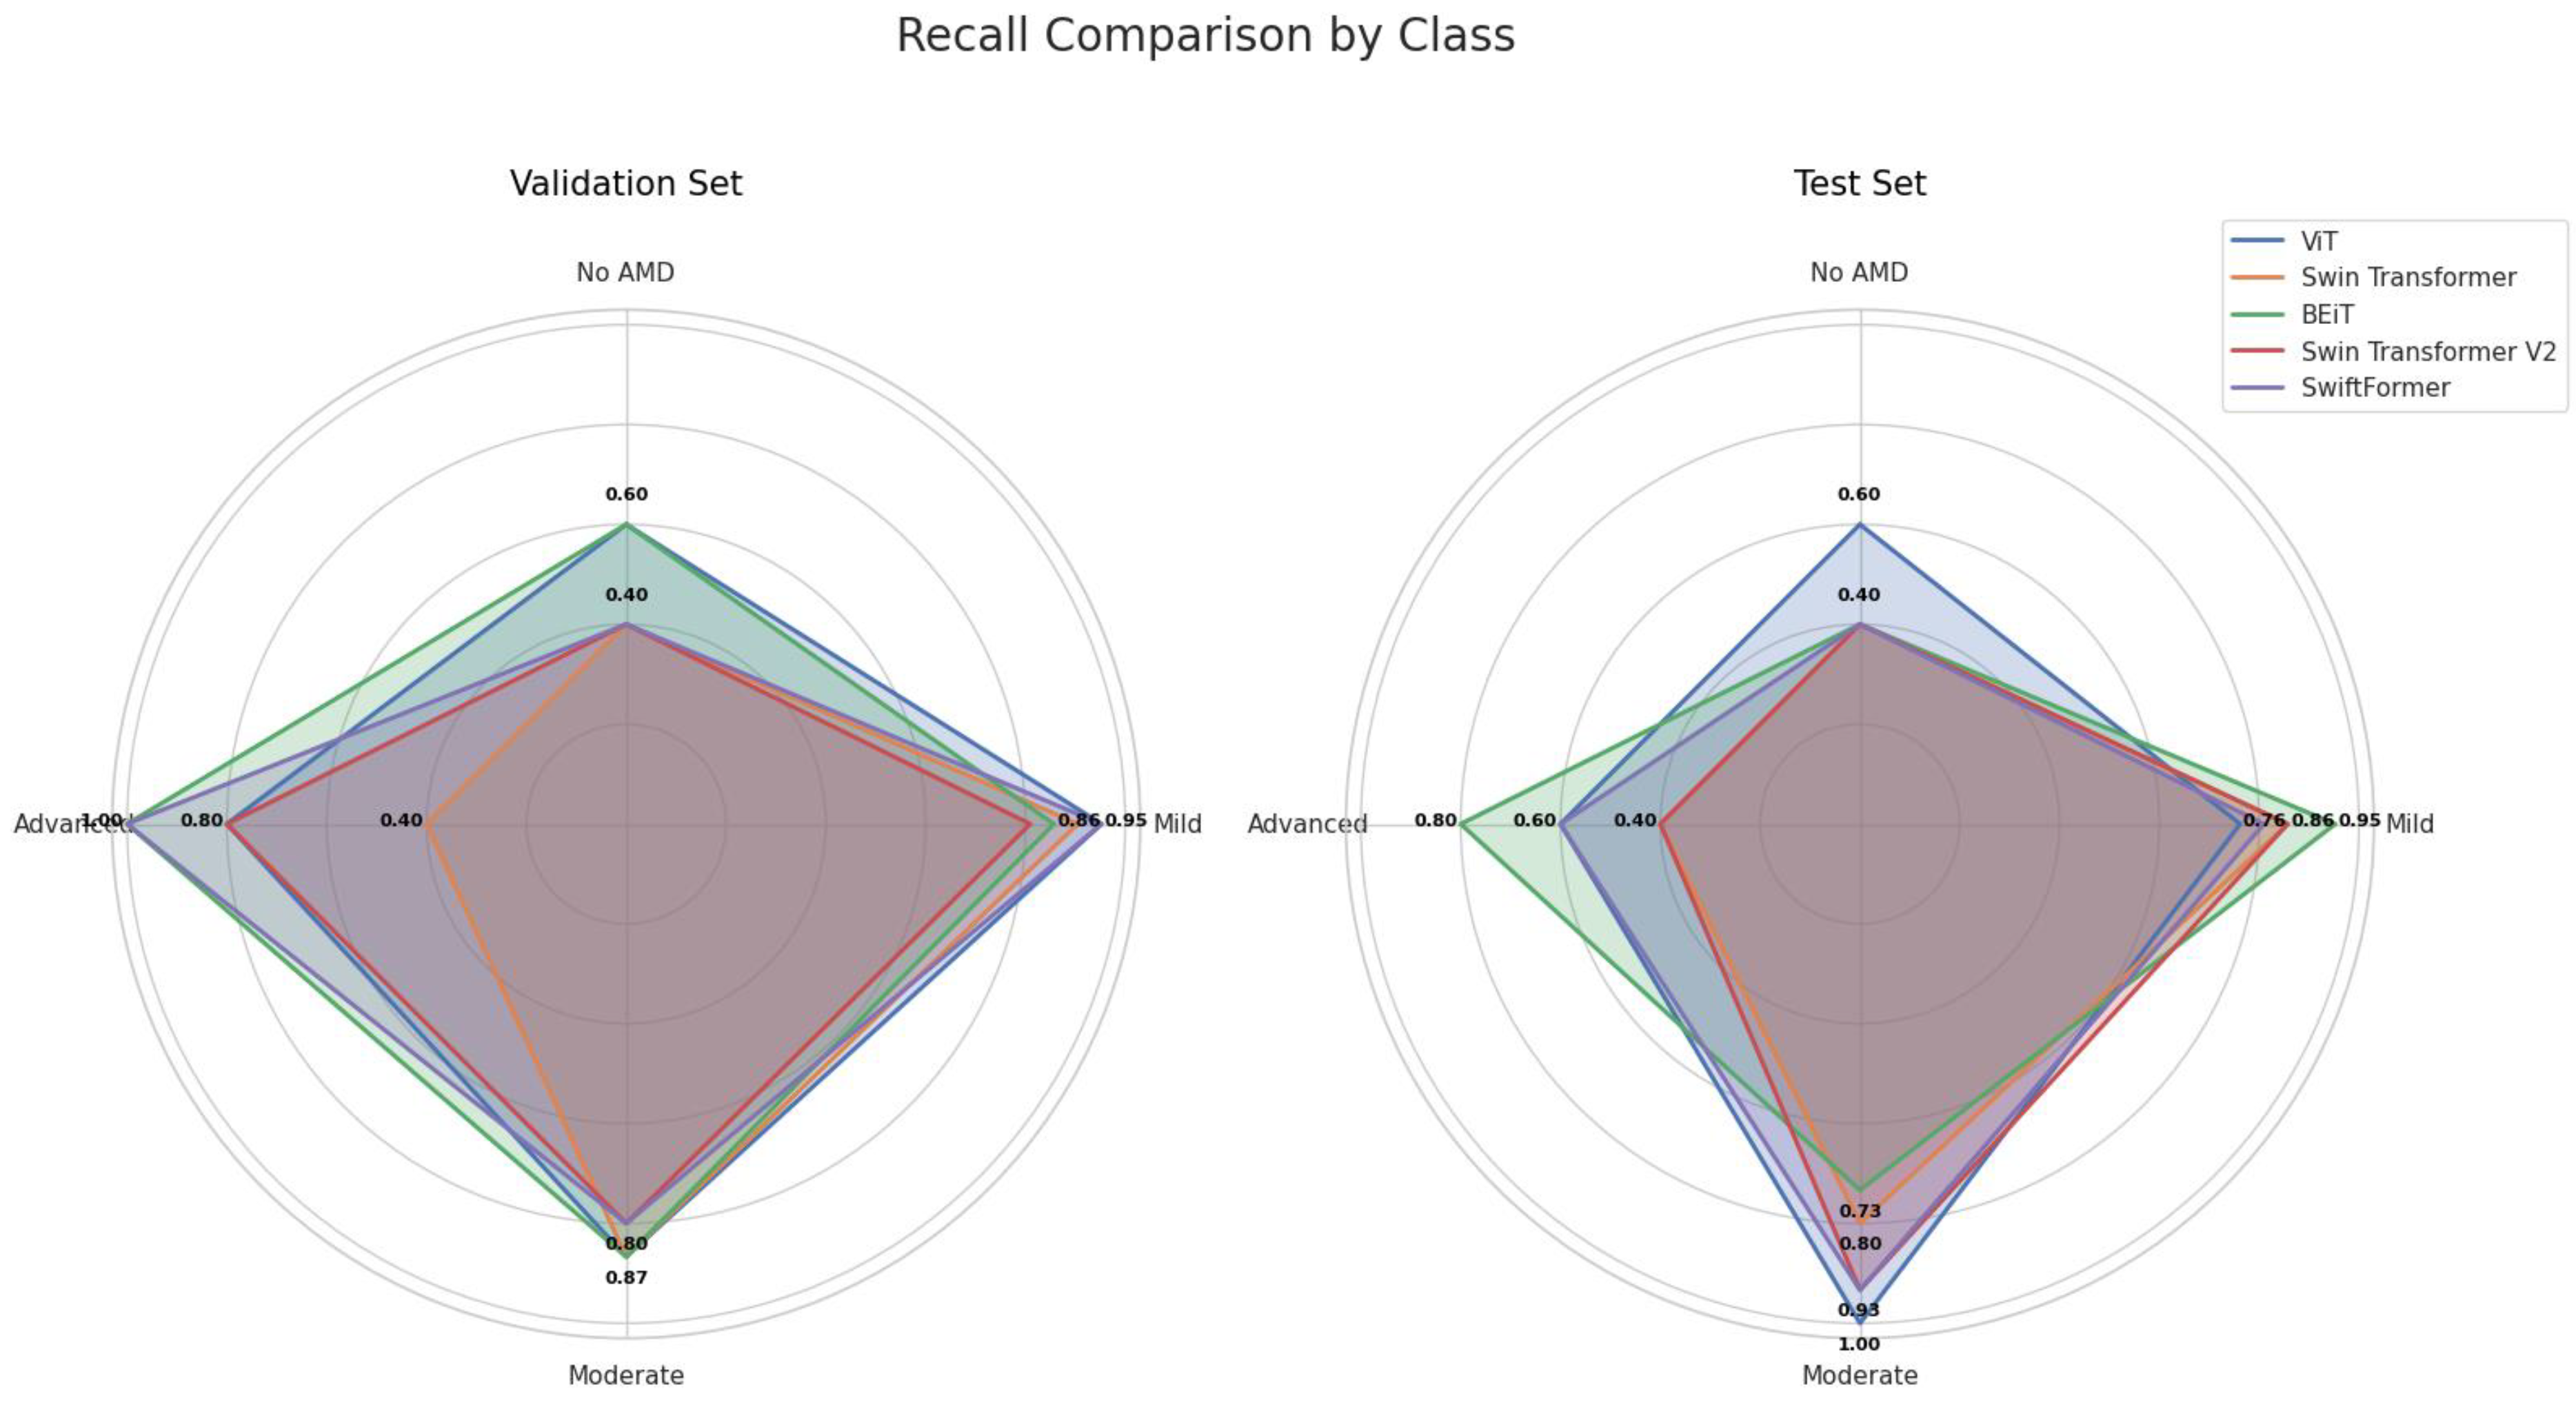
Figure 16.
Comparison of F1-Score by Class (AMD Stage).
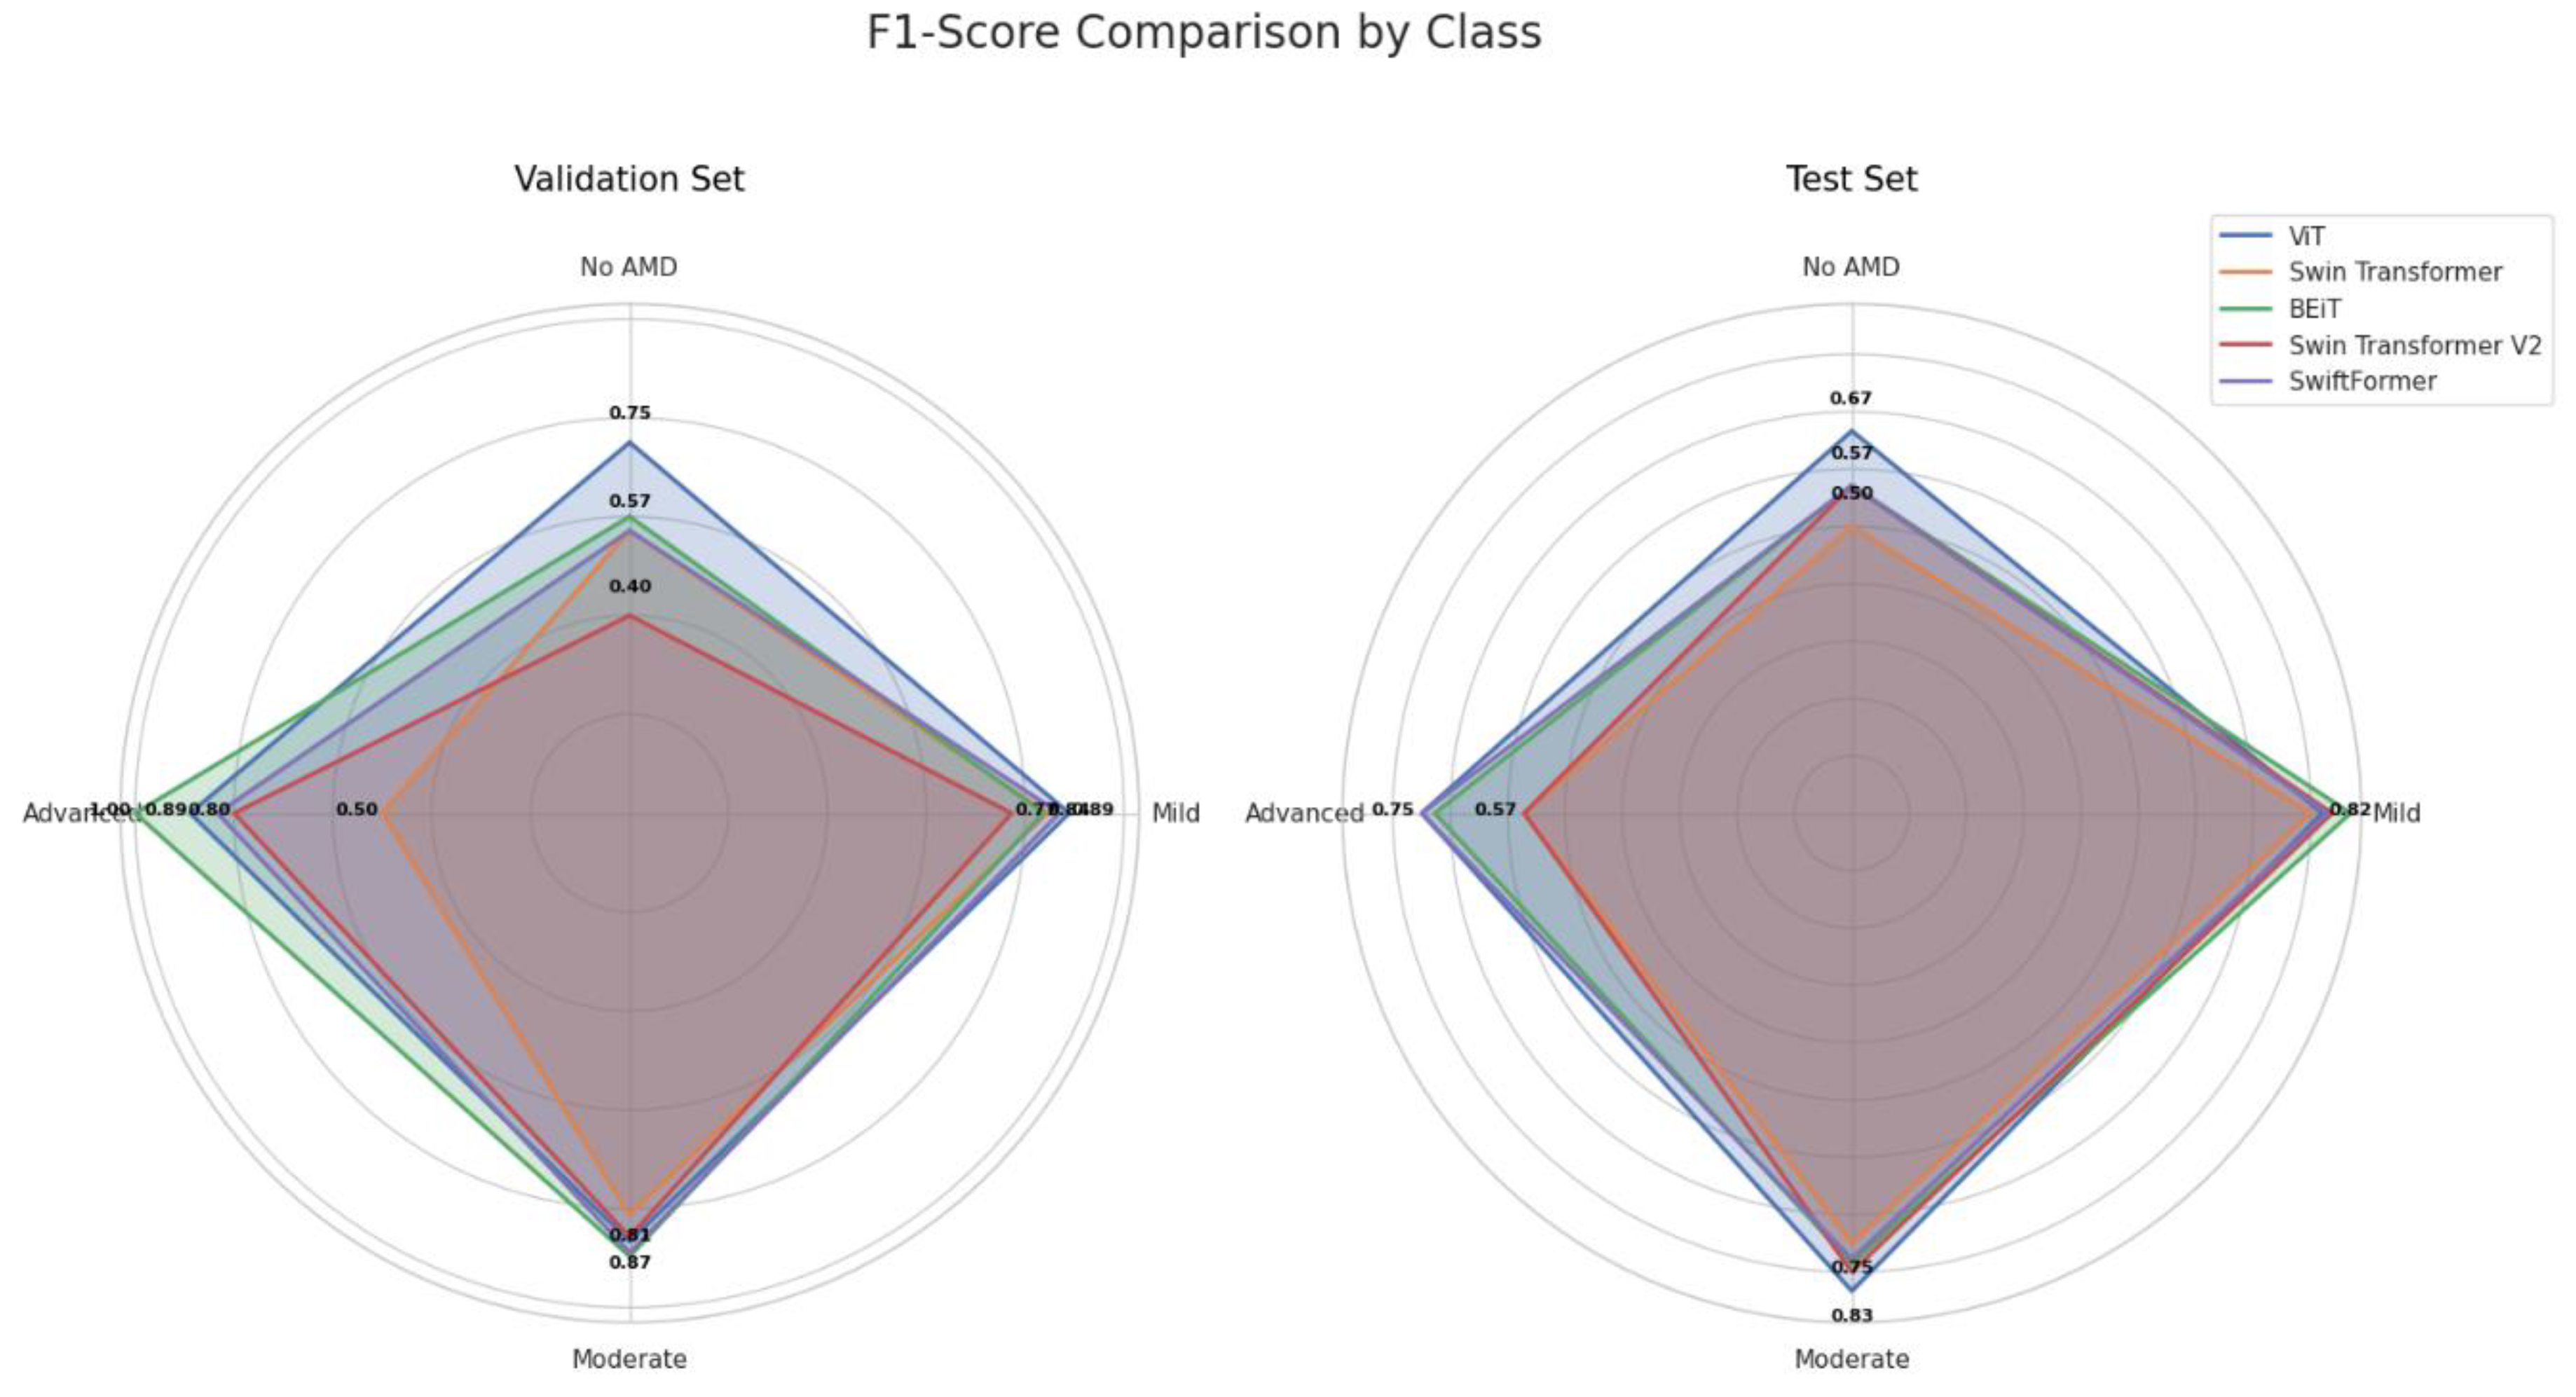
Figure 17.
Comparison of ROC for ViT Model in Validation and Testing.
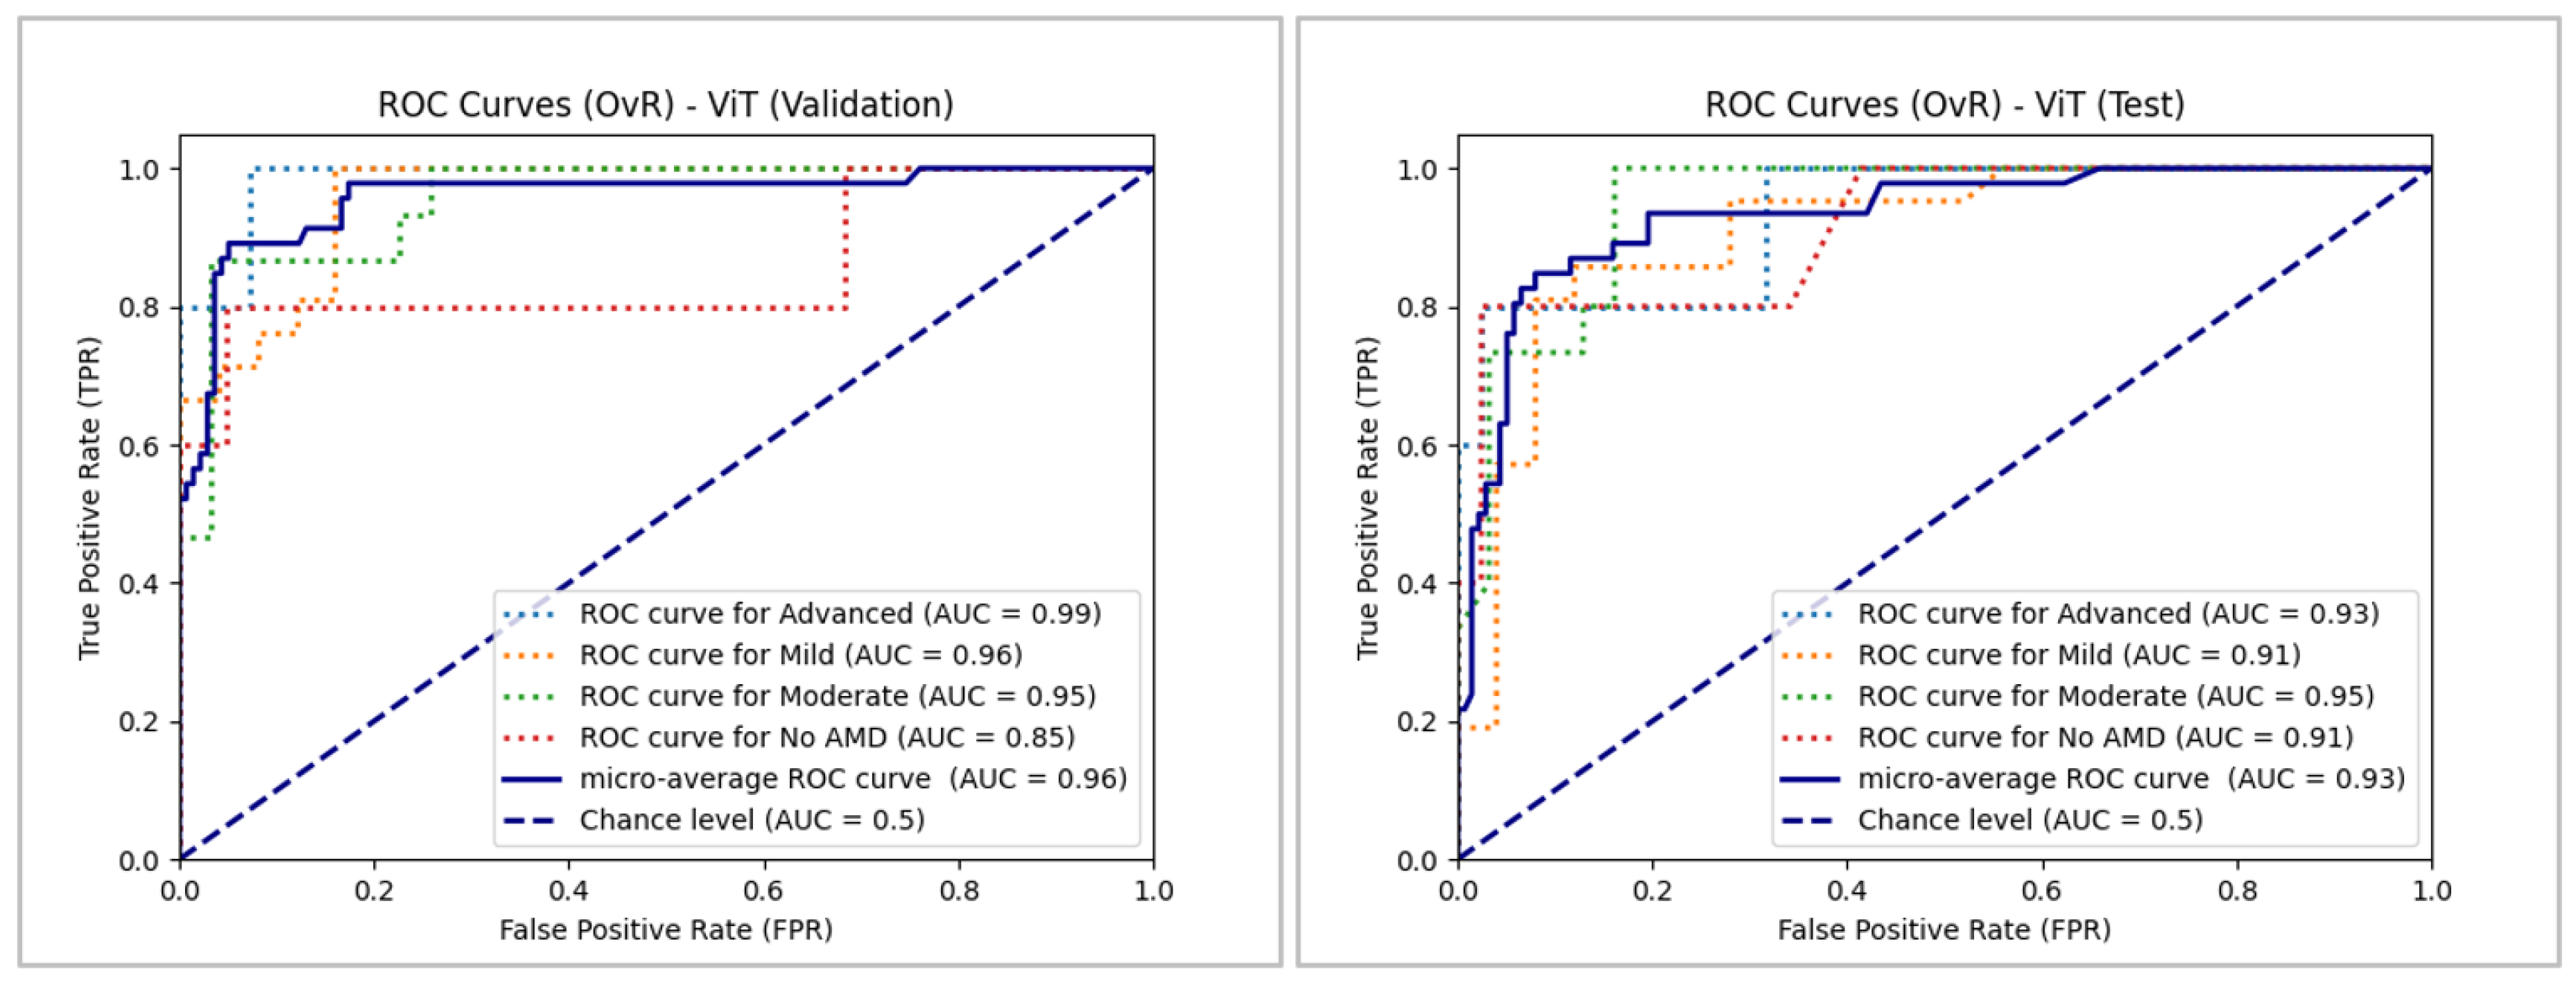
Figure 18.
Comparison of ROC for Swin Transformer Model in Validation and Testing.
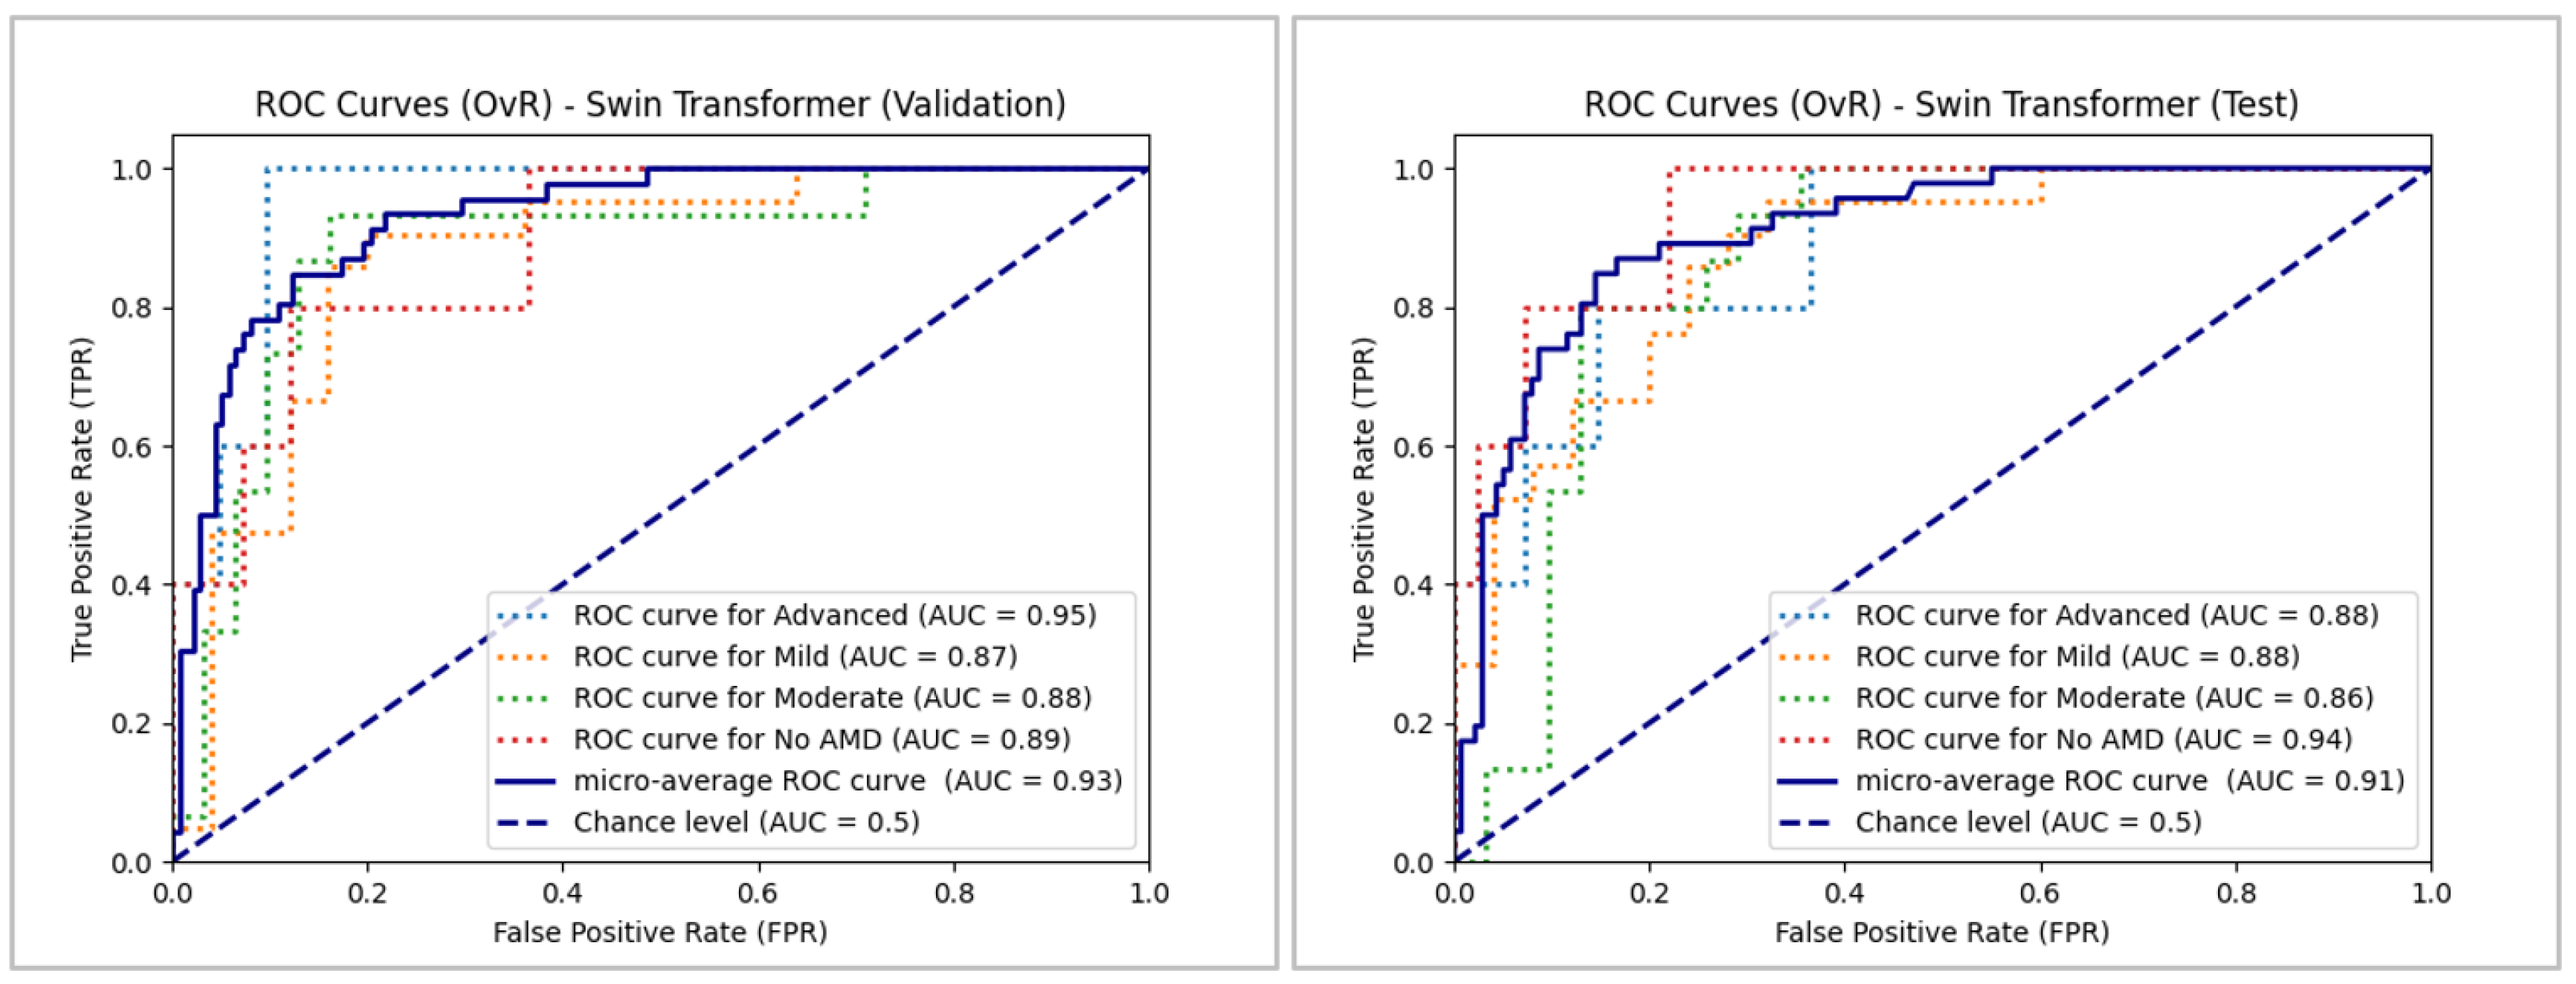
Figure 19.
Comparison of ROC for BEiT Model in Validation and Testing.
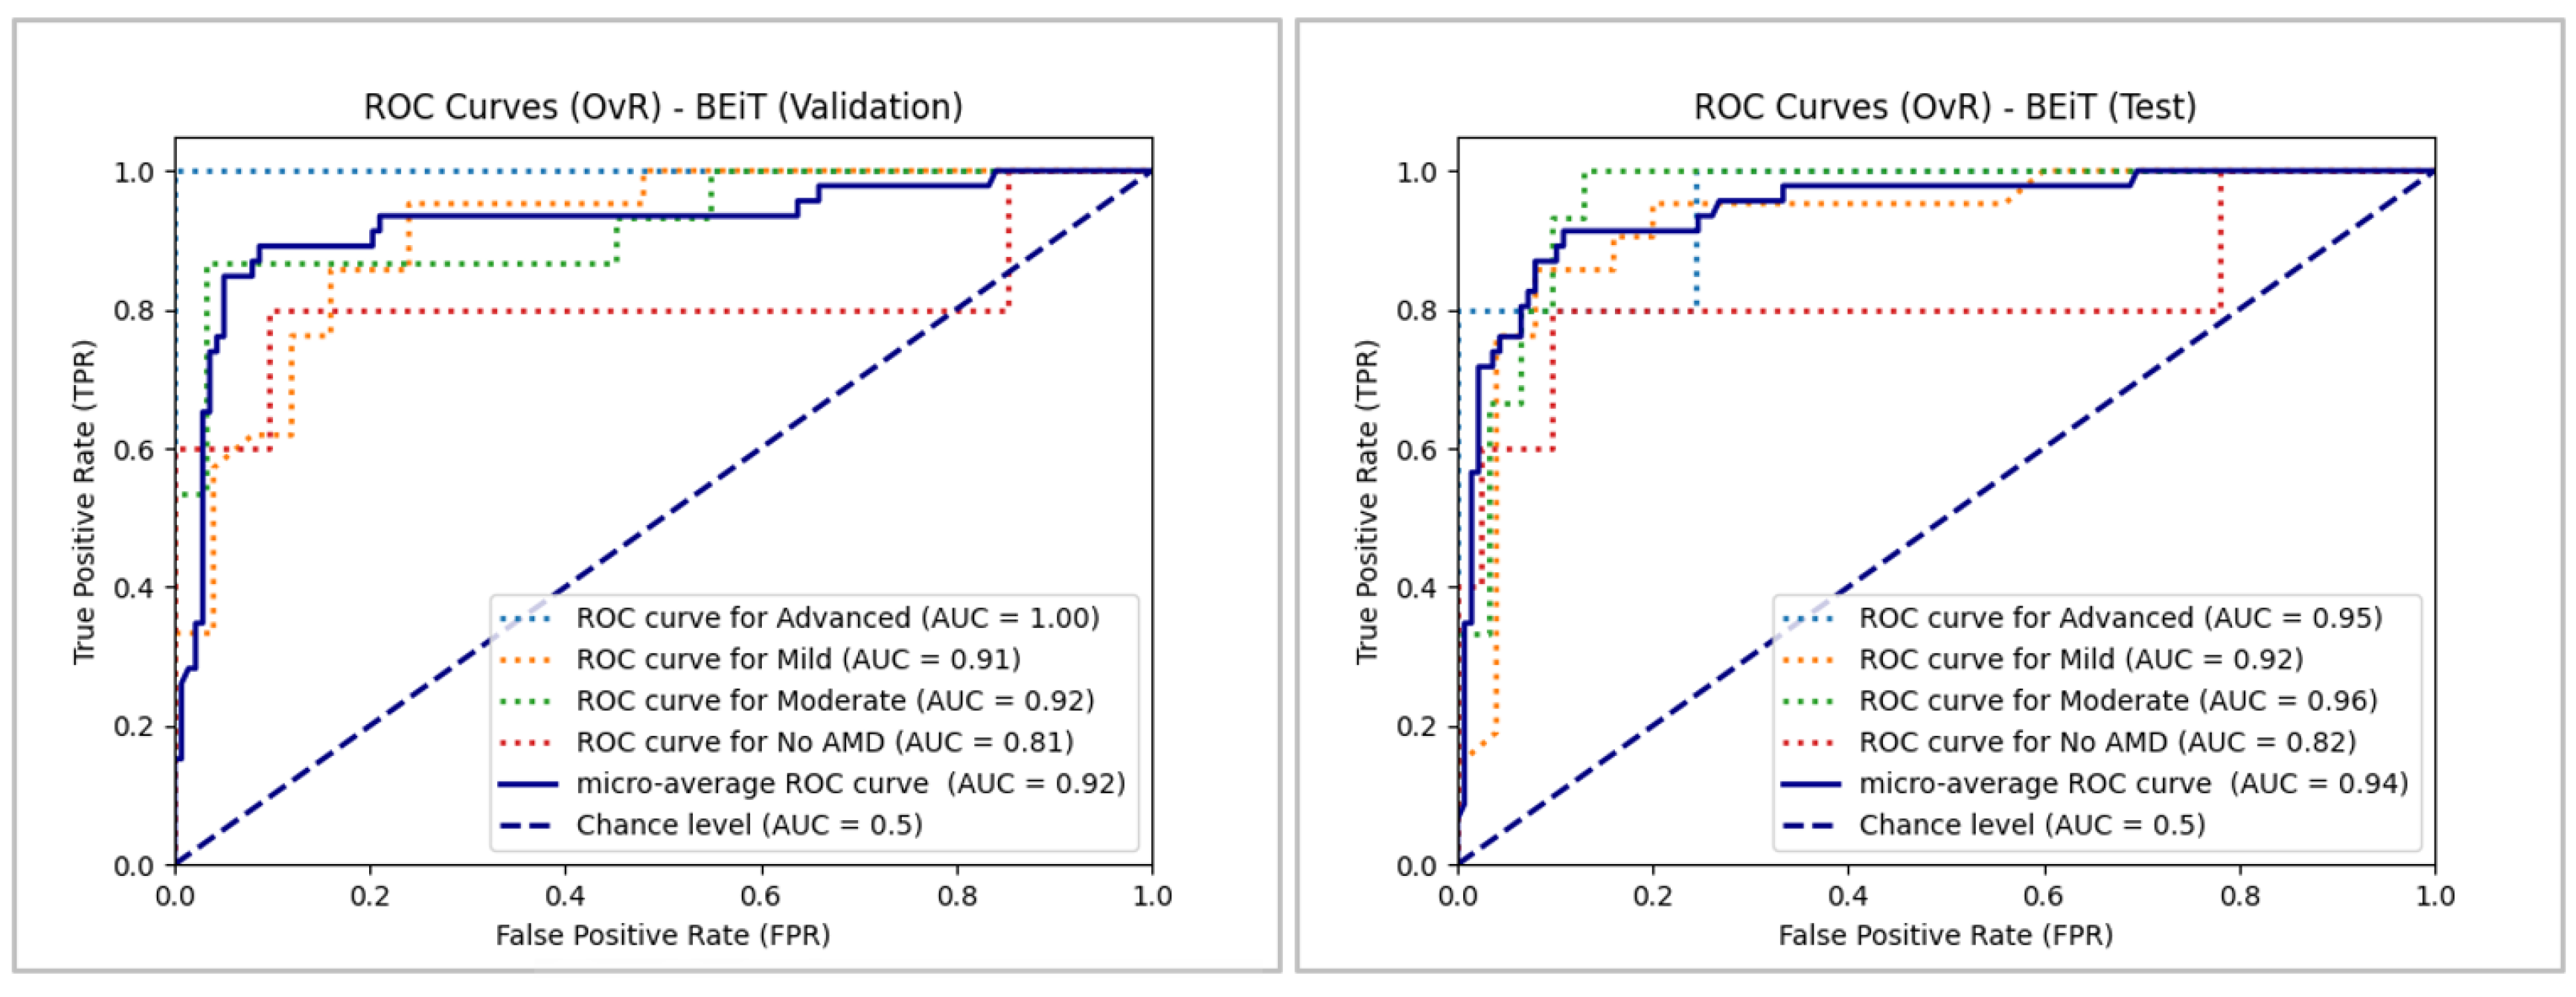
Figure 20.
ROC Comparison for Swin Transformer V2 Model in Validation and Testing.

Figure 22.
Confusion Matrices of the Analyzed ViT Models.
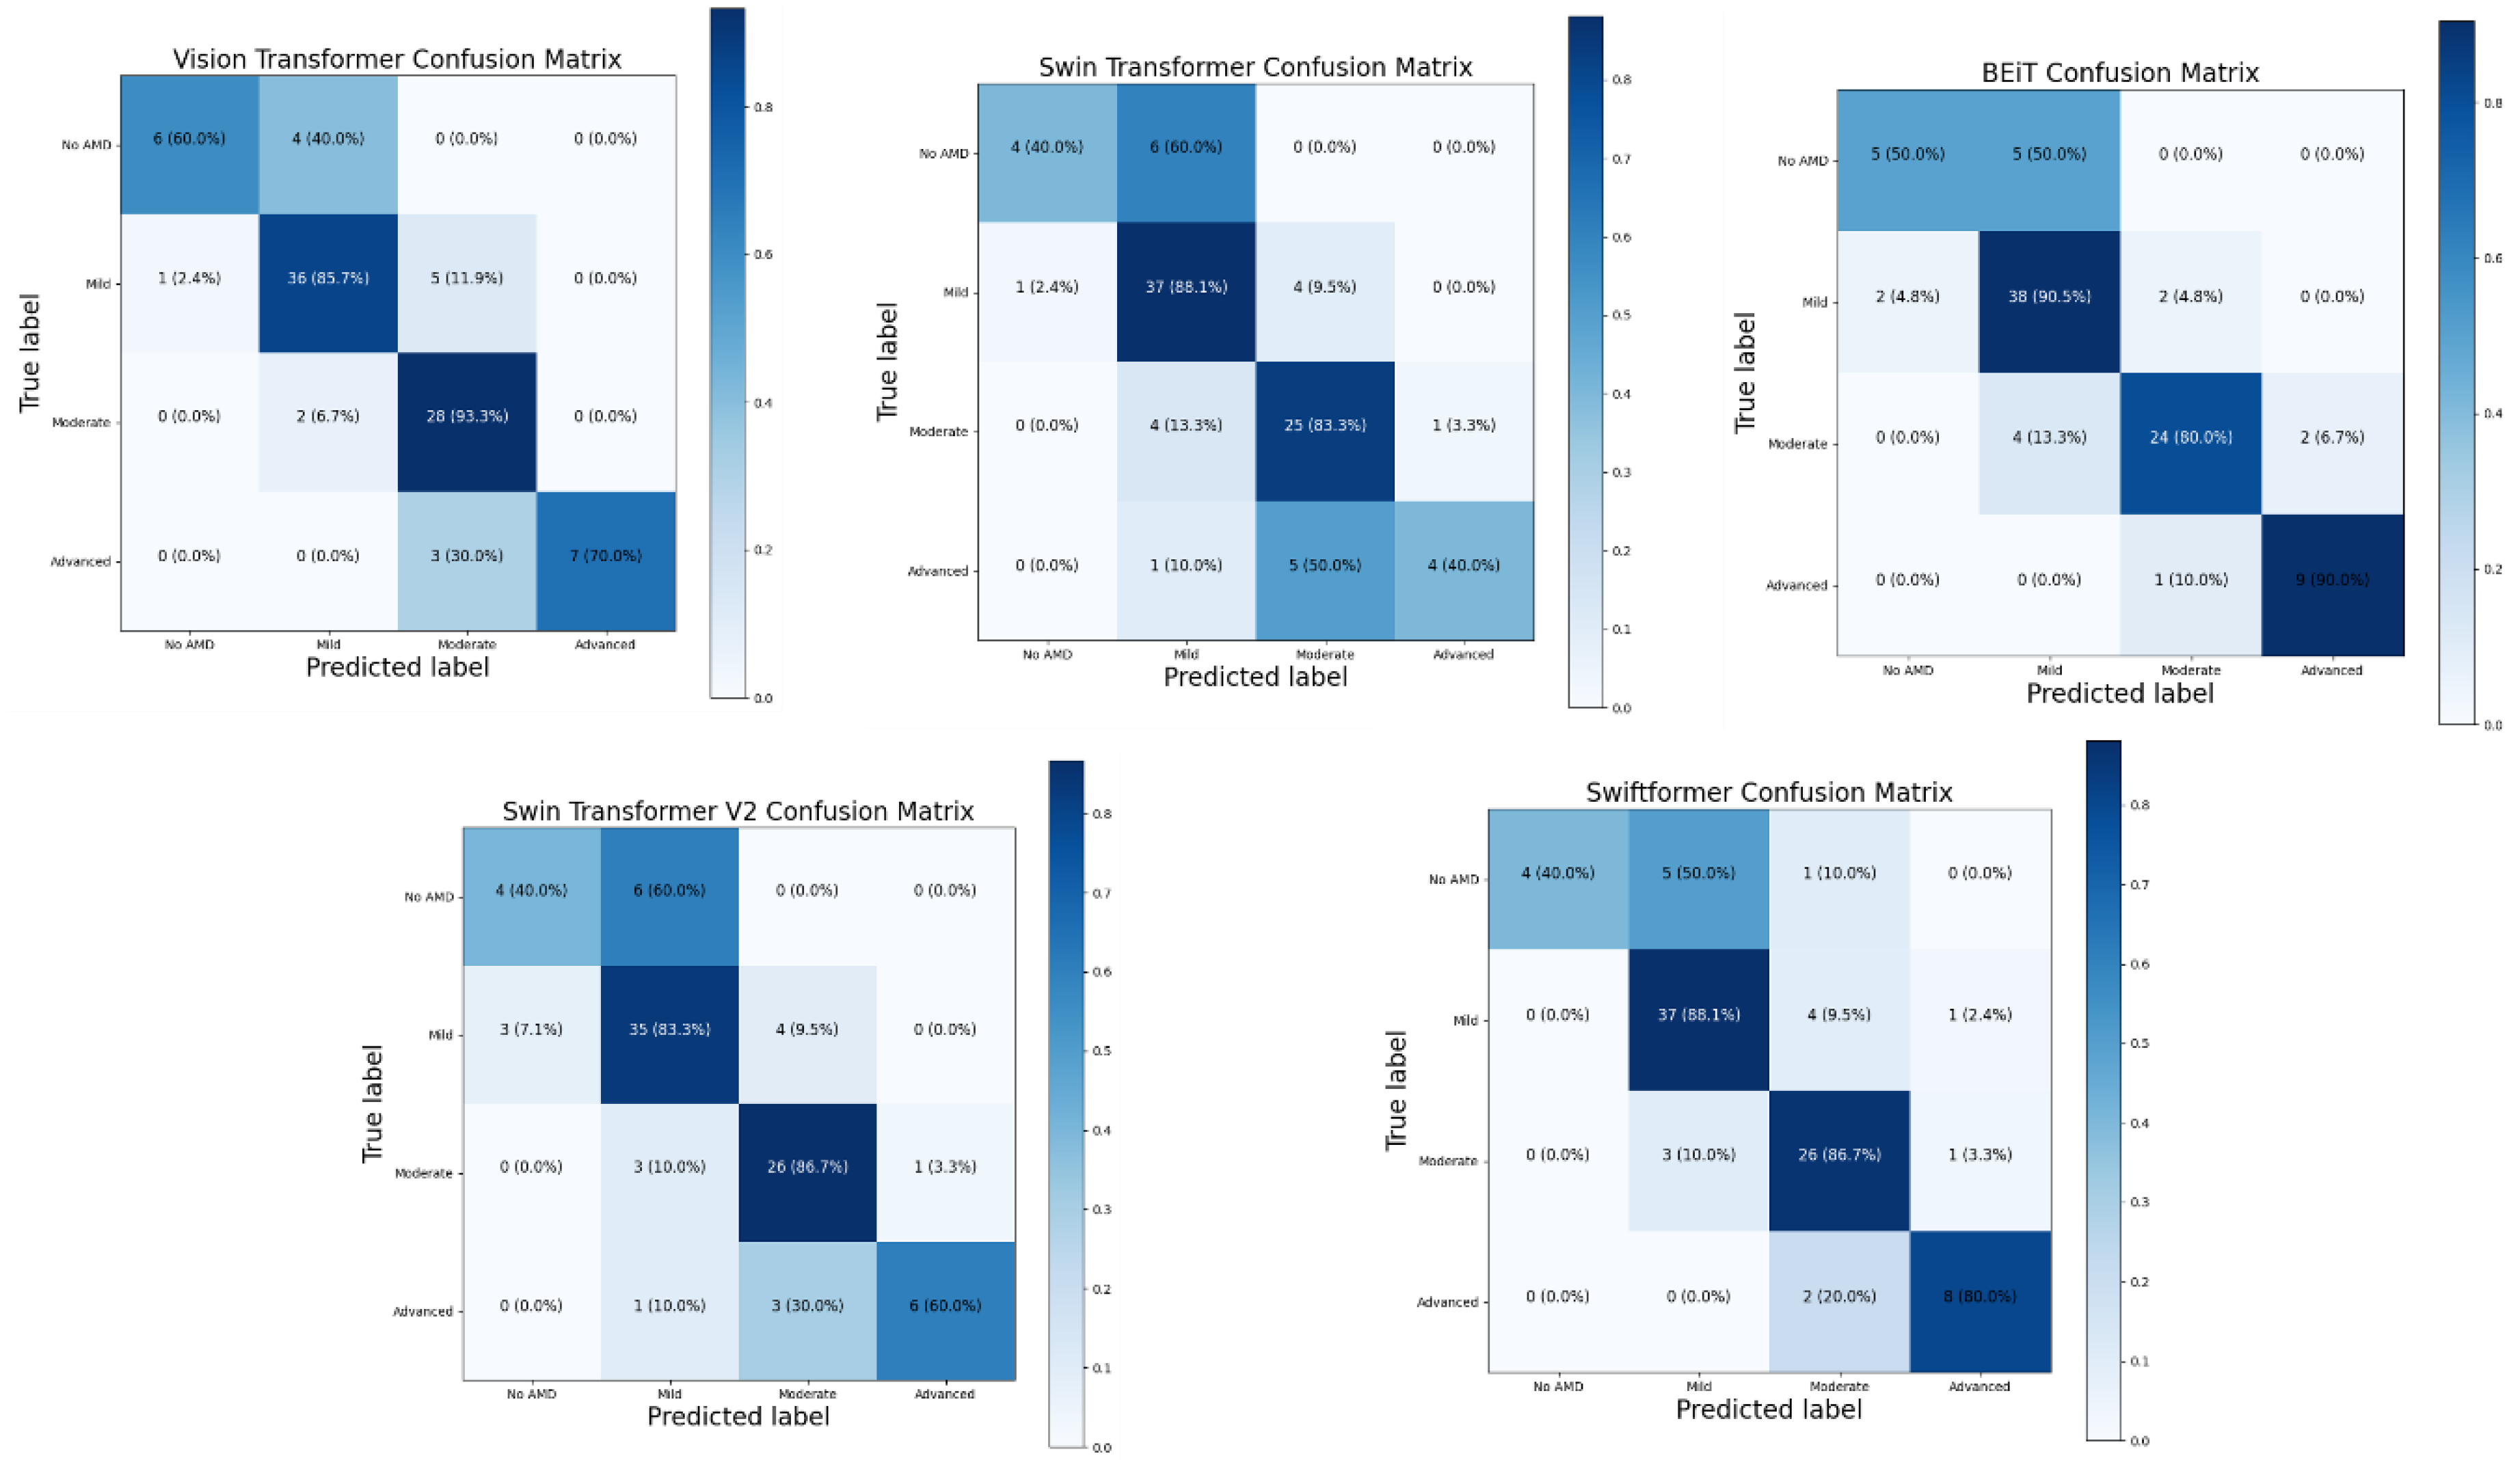

Table 1.
Summary of Literature: Healthcare Applications of ViT and CNN.
| Author | Objective | Architectures | Diseases | Images Used |
|---|---|---|---|---|
| Linde G. et al. [23] | Evaluate deep learning architectures in ophthalmological images to enhance the diagnosis and management of ocular diseases. | ViT EfficientNet ResNeSt CotNet InceptionV3 RegNet |
Diabetic Retinopathy, Glaucoma, Choroidal Neovascularization, Diabetic Macular Edema, Drusen |
OCT Images Fundus Imaging |
| Peng Z et. al. [24] | Test the efficacy of an infrared ocular diagnostic device that improves accuracy and efficiency in detecting ocular diseases. | ViT VGG16 VGG19 |
Disc Edema, Fundus Neoplasms, Pathological Myopia |
Fundus Imaging |
| Azizi M. et al. [25] | Achieve an optimal model for classifying OCT images to detect AMD using MedViT neural networks. | Micro MedViT Tiny MedViT Stitched MedViT (MedViT-based configurations) |
AMD, Drusen, Choroidal Neovascularization |
OCT Images |
| Lin Goh. et al. [26] | Compare the performance of ViTs and CNNs in detecting referable diabetic retinopathy. | VGG19, ResNet50, InceptionV3, DenseNet201, EfficientNetV2S, VAN_small, CrossViT_small, ViT_small, SWIN_tin | Diabetic Retinopathy | Fundus Imaging |
| Badr A. et al. [27] | Improve the accuracy of ViTs in classifying OCT images and videos for detecting retinal diseases. | ViT Swin Transformer Multiscale Vision Transformer (MViT) MBT_ViT MBT_SwinT MBT_MViT |
AMD, Diabetic Macular Edema, Epiretinal Membrane, Macular Hole Diabetic Retinopathy, Central Serous Chorioretinopathy |
OCT Images |
| Xu K. et al. [28] | Develop DeepDrAMD, a hierarchical transformer-based model for the detection and differential diagnosis of AMD using fundus images. |
DeepDrAMD (based on Swin Transformer) ViT CNNs (Vgg19, ResNet50, Convmixer) |
AMD Type I and Type II Macular Neovascularization |
OCT Images Fundus Imaging |
| Dutta P. et al. [29] | Develop Conv-ViT, a hybrid model to improve the detection of retinal diseases from OCT images. | Inception-V3 ResNet-50 ViT |
Choroidal Neovascularization Diabetic Macular Edema Drusen |
OCT Images |
| Philippi D. et al. [30] | Develop a ViT-based model for automatically segmenting retinal lesions in SD-OCT images. | ViT Swin-UNETR U-Net U-Net3+ |
Neovascular AMD Retinal Pigment Epithelium Detachment Intra-Retinal Fluid Subretinal Fluid |
OCT Images |
| Alayon S. et. al. [31] | Compare the efficiency of CNN and ViT in detecting glaucoma in retinal images by evaluating multiple architectures and datasets. | CNN, ViT, Hybrid CNN-ViT, ResMLP |
Glaucoma |
Fundus Imaging |
| He J. et al. [32] | Develop an interpretable and accurate model for classifying retinal diseases in OCT images. | ViT Swin Transformer |
Diabetic Retinopathy Diabetic Macular Edema Glaucoma Ocular Abnormalities |
OCT Images |
| Hwang, E. et al. [33] | Compare the performance of AI models in detecting Glaucomatous Optic Neuropathy. | ViT CNN |
Glaucomatous Optic Neuropathy | Fundus Imaging |
| Mallick S. et al. [34] | Study the use of Transformer-based networks for glaucoma detection through effective transfer learning. | ViT, Swin Transformer, ConvNext |
Glaucoma | Fundus Imaging |
| Wassel M. et al. [35] | Evaluate ViT models for classifying glaucoma in fundus images. | Cait, crossViT, XciT, ResMlp, DeiT, ViT | Glaucoma, Diabetes Cataracts, Hypertension, Pathological Myopia |
Fundus Imaging |
| Wu J. et al. [36] | Evaluate the efficacy of ViTs compared to CNNs in detecting diabetic retinopathy. | ViT Hybrid ViT DeiT |
Diabetic Retinopathy | Fundus Imaging |
| Li J. et al. [37] |
Evaluate the performance and feasibility of Transformer models in medical imaging. | Conformer, U-Net Transformer, Module Residual Transformer Multi-transSP, TransPath, i-ViT BabyNet. |
Fetal Weight Prediction Diabetic Retinopathy Detection Knee Cartilage Segmentation. |
Ultrasound, MRI Computed Tomography X-rays, Histopathology |
| Cantone M. et al. [38] | Compare the performance of CNN and Transformers in mammograph rankings. | ResNet, DenseNet, EfficientNet, SwinV2, ViT, DeiT, ConvNeXt |
Breast Cancer | Mammography |
| Jahangir R. et al. [39] | Compare the performance of Big Transfer and ViT in the classification of brain tumors. | ViT: ViT-B/16 ViT-B/32 ViT-L/16 ViT-L/32 BiT: BiT-M-R50x1 BiT-S-R50x1 BiT-M-R101x1 BiT-S-R101x1 BiT-S-R101x3 BiT-M-R101x3 BiT-S-R50x3 BiT-M-R50x3 | Brain Tumors: Meningioma, Glioma, Pituitary | Magnetic Resonance (MRI) |
| Nurgazin M. et al. [40] | Evaluate the performance of ViT models in medical image classification with few-sample learning. | ViT_tiny, ViT_small ViT_base, Mobile ViT, DeiT_base Swin_base, ResNet50, VGG16 |
Breast Tumor Tissue, Skin Lesions | Electron Microscopy |
| Nafisah S. et al. [41] | Compare CNNs and ViTs to detect COVID-19 in chest x-ray images. | Twins, Swin, Segformer | COVID-19 Pneumonia |
Chest X-Rays |
| Fanizzi A. et al. [42] | Compare the performance of deep learning architectures for predicting non-small cell lung cancer recurrence. | ViT-B Swin Resnet50 InceptionV3 DenseNet201 |
Non-Small Cell Lung Cancer | Computed Tomography |
| Asiri A. et al. [43] | Improve brain tumor classification using advanced vision models. | R50-ViT-l16 ViT-b16 ViT-l16 ViT-l32 ViT-b32 |
Brain Tumors: Meningioma, Glioma, Pituitary |
MRI |
| Xiong X. et al. [44] | Compare the performance of CNNs and ViTs for head and neck cancer segmentation. | U-Net U-Net-CBAM UNETR TransBTS VT-UNet |
Head and Neck Cancer Lesions | Positron Emission Tomography |
| Sherwani P. et al. [45] | Compare the efficacy of CNNs and ViTs for detecting Alzheimer's in MRI. | CNN ViT DeepViT CaiT |
Alzheimer’s Disease | MRI |
| Ma D. et al. [46] |
Compare the performance of transformer variants and CNNs in medical tasks. | ViT-B Swin-B |
Thoracic Diseases, Pulmonary Embolism, Tuberculosis | Chest X-Rays and Computed Tomography. |
| Deininger L. et al. [47] | Evaluate the efficacy of ViTs versus CNNs in tumor detection and tissue type in digital pathology. | ResNet18 DeiT-Tiny PathNet DINO |
Colorectal Cancer, Lymph Node, Lymphoma, Breast and Lung Cancers | Histological Images |
| Gulzar, Y. et al. [48] | Develop advanced methods of skin lesion segmentation to improve the diagnosis of melanoma. | U-Net Attention U-Net TransUNet Swin-UNet |
Melanoma-Related Skin Lesions | Dermatoscopic Examination of Skin Lesions |
| Yang, H. et al. [49] | Compare the segmentation performance of transparent images using different deep-learning methods. | U-Net++ ResNet50 ViT Seg-Net Swin-Unet Attention-UNet Trans-Unet. |
Classification of pathological images for the detection of diseases in environmental microorganisms. | Transparent Environmental Microorganisms |
| Yang Y. et al. [50] | Compare and analyze deep-learning models for pneumonia recognition. | Vit, LeNet5 AlexNet MobileNet ResNet18 |
Pneumonia | X-Rays |
| Hu W. et al. [51] | Compare linear and transform models of vision in classifying gastric pathologic images. | Linear Regression VGG16, Inception-V3, ResNet50 ViT |
Gastric Cancer | Electron Microscopy |
| Galdran A. et al. [52] | Compare the performance of ViTs and CNNs for diabetic ulcer classification. | ViT DeIT |
Diabetic Foot | Diabetic Ulcers captured with conventional smartphone cameras |
Table 2.
Comparative Analysis of ViT Models.
| Characteristic | ViT | Swin Transformer | BEiT | Swin Transformer V2 | SwiftFormer |
|---|---|---|---|---|---|
| Year of Introduction | 2020 | 2021 | 2021 | 2022 | 2023 |
| Proposer/Organization | Google Research |
Microsoft Research |
Microsoft Research | Microsoft Research | Swift AI Labs |
| Number of Parameters | 86M | 87.8M | 88M | 88M | 50M |
| Model Depth | 12 layers | 12 layers | 12 layers | 12 layers | 8 layers |
| Embedding Size | 768 | 768 | 768 | 768 | 512 |
| Number of Heads of Attention | 12 | 12 | 12 | 12 | 8 |
| Computational Complexity (GFLOPs) | 17.6 | 15.4 | 18.8 | 18.8 | 10.5 |
| Model Size (MB) | 330 | 340 | 350 | 350 | 200 |
| Speed of Inference | 4 img/s | 5 img/s | 4 img/s | 4 img/s | 8 img/s |
| Memory Requirements | 8 GB | 8 GB | 8 GB | 8 GB | 4 GB |
| Pre-training technique | Supervised pre-training | Supervised pre-training | Auto-supervised pre-training | Supervised pre-training | Efficient attention |
| Ease of Implementation | Medium | High | Medium | High | High |
| Scalability | Medium | High | High | High | High |
| Adaptability | High | High | High | High | High |
| Robustness (Variability) | Medium | High | High | High | High |
| Generalization | High | High | High | High | High |
| Noise Resistance | Medium | High | High | High | High |
| Mobile Device Compatibility | No | Partially | No | Partially | Yes |
Table 3.
Hyperparameters Used for Training ViT Models.
| Model | LR1 | TBS | EBZ | SEED | GAS | TTBS | OPT | LRST | WR | EP |
|---|---|---|---|---|---|---|---|---|---|---|
| ViT | 5.5e-05 | 32 | 32 | 42 | 4 | 128 | Adam betas= (0.9,0.999) and epsilon=1e-08 | Linear | 0.05 | 80 |
| Swin T | 5.5e-05 | |||||||||
| BEiT | 4e-05 | 0.01 | ||||||||
| Swin T V2 | ||||||||||
| SwiftFormer | 3e-4 | 0.15 |
LR=Learning Rate; TBS= Train Batch Size; EBZ= Eval Batch Size; GAS= Gradient Accumulation Steps; TTBS= Total Train Batch Size; OPT= Optimizer; LRST= Learning Rate Scheduler Type; WR= Learning Rate Scheduler Wrap Ratio; EP= Epochs.
Table 4.
Overall Accuracy of ViT Models in Validation and Testing.
| Model | Validation | Testing | Average |
|---|---|---|---|
| ViT | 0.8695 | 0.8043 | 0.8369 |
| Swin Transformer | 0.7826 | 0.7391 | 0.76085 |
| BEiT | 0.8478 | 0.8043 | 0.82605 |
| Swin Transformer V2 | 0.7608 | 0.7826 | 0.7717 |
| SwiftFormer | 0.8478 | 0.7826 | 0.8152 |
Table 5.
Precision by Class (AMD Stage) in Validation and Testing.
| Model | Class | Validation | Testing | Average |
|---|---|---|---|---|
| ViT | No AMD | 1.0000 | 0.7500 | 0.8750 |
| Mild | 0.8333 | 0.8888 | 0.8611 | |
| Moderate | 0.8666 | 0.7142 | 0.7904 | |
| Advanced | 1.0000 | 1.0000 | 1.0000 | |
| Swin Transformer | No AMD | 1.0000 | 0.6666 | 0.8333 |
| Mild | 0.7916 | 0.7500 | 0.7708 | |
| Moderate | 0.7647 | 0.7058 | 0.7353 | |
| Advanced | 0.6666 | 1.0000 | 0.8333 | |
| BEiT | No AMD | 0.6000 | 1.0000 | 0.8000 |
| Mild | 0.8181 | 0.8000 | 0.8091 | |
| Moderate | 0.9285 | 0.8461 | 0.8873 | |
| Advanced | 1.0000 | 0.6666 | 0.8333 | |
| Swin Transformer V2 | No AMD | 0.4000 | 1.0000 | 0.7000 |
| Mild | 0.7391 | 0.8181 | 0.7786 | |
| Moderate | 0.9230 | 0.7000 | 0.8115 | |
| Advanced | 0.8000 | 1.0000 | 0.9000 | |
| SwiftFormer | No AMD | 1.0000 | 1.0000 | 1.0000 |
| Mild | 0.8000 | 0.8500 | 0.8250 | |
| Moderate | 1.0000 | 0.6666 | 0.8333 | |
| Advanced | 0.7142 | 1.0000 | 0.8571 |
Table 6.
Recall by Class (AMD Stage) in Validation and Testing.
| Model | Class | Validation | Testing | Average |
|---|---|---|---|---|
| ViT | No AMD | 0.6000 | 0.6000 | 0.6000 |
| Mild | 0.9523 | 0.7619 | 0.8571 | |
| Moderate | 0.8666 | 1.0000 | 0.9333 | |
| Advanced | 0.8000 | 0.6000 | 0.7000 | |
| Swin Transformer | No AMD | 0.4000 | 0.4000 | 0.4000 |
| Mild | 0.9047 | 0.8571 | 0.8809 | |
| Moderate | 0.8666 | 0.8000 | 0.8333 | |
| Advanced | 0.4000 | 0.4000 | 0.4000 | |
| BEiT | No AMD | 0.6000 | 0.4000 | 0.5000 |
| Mild | 0.8571 | 0.9523 | 0.9047 | |
| Moderate | 0.8666 | 0.7333 | 0.8000 | |
| Advanced | 1.0000 | 0.8000 | 0.9000 | |
| Swin Transformer V2 | No AMD | 0.4000 | 0.4000 | 0.4000 |
| Mild | 0.8095 | 0.8571 | 0.8333 | |
| Moderate | 0.8000 | 0.9333 | 0.8667 | |
| Advanced | 0.8000 | 0.4000 | 0.6000 | |
| SwiftFormer | No AMD | 0.4000 | 0.4000 | 0.4000 |
| Mild | 0.9523 | 0.8095 | 0.8809 | |
| Moderate | 0.8000 | 0.9333 | 0.8667 | |
| Advanced | 1.0000 | 0.6000 | 0.8000 |
Table 7.
F1-Score by Class (AMD Stage) in Validation and Testing.
| Model | Class | Validation | Testing | Average |
|---|---|---|---|---|
| ViT | No AMD | 0.7500 | 0.6666 | 0.7083 |
| Mild | 0.8888 | 0.8205 | 0.8547 | |
| Moderate | 0.8666 | 0.8333 | 0.8500 | |
| Advanced | 0.8888 | 0.7500 | 0.8194 | |
| Swin Transformer | No AMD | 0.5714 | 0.5000 | 0.5357 |
| Mild | 0.8444 | 0.8000 | 0.8222 | |
| Moderate | 0.8125 | 0.7500 | 0.7813 | |
| Advanced | 0.5000 | 0.5714 | 0.5357 | |
| BEiT | No AMD | 0.6000 | 0.5714 | 0.5857 |
| Mild | 0.8372 | 0.8695 | 0.8534 | |
| Moderate | 0.8965 | 0.7857 | 0.8411 | |
| Advanced | 1.0000 | 0.7272 | 0.8636 | |
| Swin Transformer V2 | No AMD | 0.4000 | 0.5714 | 0.4857 |
| Mild | 0.7727 | 0.8372 | 0.8050 | |
| Moderate | 0.8571 | 0.8000 | 0.8286 | |
| Advanced | 0.8000 | 0.5714 | 0.6857 | |
| SwiftFormer | No AMD | 0.5714 | 0.5714 | 0.5714 |
| Mild | 0.8695 | 0.8292 | 0.8494 | |
| Moderate | 0.8888 | 0.7777 | 0.8333 | |
| Advanced | 0.8333 | 0.7500 | 0.7917 |
Table 8.
Comparison of Model Performance in Validation and Testing.
| Model | Class | Validation | Testing | ||||
|---|---|---|---|---|---|---|---|
| Precision | Recall | F1-Score | Precision | Recall | F1-Score | ||
| ViT | No AMD | 1.0000 | 0.6000 | 0.7500 | 0.7500 | 0.6000 | 0.6666 |
| Mild | 0.8333 | 0.9523 | 0.8888 | 0.8888 | 0.7619 | 0.8205 | |
| Moderate | 0.8666 | 0.8666 | 0.8666 | 0.7142 | 1.0000 | 0.8333 | |
| Advanced | 1.0000 | 0.8000 | 0.8888 | 1.0000 | 0.6000 | 0.7500 | |
| Swin | No AMD | 1.0000 | 0.4000 | 0.5714 | 0.6666 | 0.4000 | 0.5000 |
| Transformer | Mild | 0.7916 | 0.9047 | 0.8444 | 0.7500 | 0.8571 | 0.8000 |
| Moderate | 0.7647 | 0.8666 | 0.8125 | 0.7058 | 0.8000 | 0.7500 | |
| Advanced | 0.6666 | 0.4000 | 0.5000 | 1.0000 | 0.4000 | 0.5714 | |
| BEiT | No AMD | 0.6000 | 0.6000 | 0.6000 | 1.0000 | 0.4000 | 0.5714 |
| Mild | 0.8181 | 0.8571 | 0.8372 | 0.8000 | 0.9523 | 0.8695 | |
| Moderate | 0.9285 | 0.8666 | 0.8965 | 0.8461 | 0.7333 | 0.7857 | |
| Advanced | 1.0000 | 1.0000 | 1.0000 | 0.6666 | 0.8000 | 0.7272 | |
| Swin | No AMD | 0.4000 | 0.4000 | 0.4000 | 1.0000 | 0.4000 | 0.5714 |
| Transformer | Mild | 0.7391 | 0.8095 | 0.7727 | 0.8181 | 0.8571 | 0.8372 |
| V2 | Moderate | 0.9230 | 0.8000 | 0.8571 | 0.7000 | 0.9333 | 0.8000 |
| Advanced | 0.8000 | 0.8000 | 0.8000 | 1.0000 | 0.4000 | 0.5714 | |
| SwiftFormer | No AMD | 1.0000 | 0.4000 | 0.5714 | 1.0000 | 0.4000 | 0.5714 |
| Mild | 0.8000 | 0.9523 | 0.8695 | 0.8500 | 0.8095 | 0.8292 | |
| Moderate | 1.0000 | 0.8000 | 0.8888 | 0.6666 | 0.9333 | 0.7777 | |
| Advanced | 0.7142 | 1.0000 | 0.8333 | 1.0000 | 0.6000 | 0.7500 | |
Table 9.
Computational Efficiency of the Analyzed Models.
| Model | Training Time (mins) | Inference Time (ms/img) | Memory Consumption (GB) | Parameters (M) | FLOPs (GFLOPs) | Energy Efficiency (W) |
|---|---|---|---|---|---|---|
| ViT | 17.38 | 14.31 | 7.53 | 86.39 | 17.58 | 175.82 |
| Swin Transformer | 9.92 | 23.23 | 5.52 | 27.52 | 4.51 | 169.78 |
| BEiT | 17.55 | 14.62 | 7.70 | 85.76 | 17.58 | 177.56 |
| Swin Transformer V2 | 13.45 | 37.14 | 7.37 | 27.58 | 5.96 | 174.04 |
| SwiftFormer | 4.60 | 14.19 | 3.86 | 23.14 | 0.61 | 131.46 |
Disclaimer/Publisher’s Note: The statements, opinions and data contained in all publications are solely those of the individual author(s) and contributor(s) and not of MDPI and/or the editor(s). MDPI and/or the editor(s) disclaim responsibility for any injury to people or property resulting from any ideas, methods, instructions or products referred to in the content. |
© 2024 by the authors. Licensee MDPI, Basel, Switzerland. This article is an open access article distributed under the terms and conditions of the Creative Commons Attribution (CC BY) license (http://creativecommons.org/licenses/by/4.0/).
Copyright: This open access article is published under a Creative Commons CC BY 4.0 license, which permit the free download, distribution, and reuse, provided that the author and preprint are cited in any reuse.


