
Submitted:
20 November 2024
Posted:
20 November 2024
You are already at the latest version
Abstract
Gait trainers are increasingly used in rehabilitation for patients with lower extremity impairments; however, current control strategies often neglect the inertial forces from the body’s vertical motion, limiting effective force compensation. This results in deviations in the unloading force of rehabilitation devices, disrupting the patient’s natural gait. We introduce an estimation technique to predict vertical inertial forces generated by body movement, enabling rehabilitation robots to actively compensate for inertia during therapy. Our approach utilizes widely available sensors, such as smartphones, providing a cost-effective alternative to traditional multi-sensor setups, reducing wiring, and minimizing movement restrictions, thus enhancing data collection and preserving natural gait. Additionally, this technique has potential applications for Low Gravity training in NASA’s Active Response Gravity Offload System (ARGOS), supporting astronaut training by simulating reduced gravity conditions.
Keywords:
Rehabilitation robotics
; gait analysis
; gait trainers
; lower-limb assistance
; body weight support
; gait phase detection
; center of mass height
; ground reaction force
; active dynamic motion
1. Introduction
Paralysis or muscle weakness often results in walking disabilities, as affected individ- uals cannot independently support their body weight [1,2]. Effective gait rehabilitation systems, therefore, need to fully or partially support the patient’s weight. While walking, patients experience forces and stresses on their legs, which Body Weight Support (BWS) systems are designed to alleviate. Numerous studies have evaluated the therapeutic efficacy of gait rehabilitation systems incorporating weight support, demonstrating their potential in reducing strain and aiding patient recovery [3,4,5,6]. Consequently, enhancing the efficiency and effectiveness of robot-assisted gait rehabilitation remains a prominent research focus, driving the development of novel methods and techniques to optimize patient treatment. The patient’s body acts as an inertial load when connected to the body-weight sup- port (BWS) system. While a static force from the patient’s weight is exerted on the BWS, vertical movements during the gait cycle produce inertial forces proportional to the body’s acceleration, as illustrated in Figure 1. These inertial forces can impact the BWS system’s functionality, introducing significant deviations from the intended unloading force, espe- cially at natural walking speeds and with typical body masses. Additionally, the inertia introduced by the BWS system itself may lower the natural frequency of movement, thereby impeding the patient’s ability to achieve a natural gait pattern [7,8].
The patient’s body acts as an inertial load when connected to a Body Weight Support (BWS) system. A static force is applied to the BWS system by the patient’s weight, while vertical movements during walking generate inertial forces proportional to body acceleration, as illustrated in Figure 1. These inertial forces can compromise the performance of the BWS system, causing significant deviations in the unloading force, particularly at natural walking speeds and typical human body mass. In addition, the BWS system can add inertia, reducing the natural frequency of movement and potentially disrupting patient gait [7,8]. In gait rehabilitation, effective unloading strategies must account for both the patient’s partial body weight and the inertial forces introduced by the BWS system and the compensated mass, ensuring that the patient experiences a consistent reduction in effective mass during dynamic movements. This approach promotes natural gait by maintaining balanced ratios of weight unloading and inertia compensation, supporting natural movement patterns essential for effective therapy.
A force controller can effectively mitigate parasitic effects such as friction, stiction, and the combined weight of the patient and device. However, incorporating the force controller within a feedback loop can introduce stability challenges, complicating the achievement of inertia compensation [6,10,11]. Common solutions include using additional sensors to detect instantaneous accelerations of the inertia being compensated and incorporating model-based feed-forward compensators to address stability issues. An example is the Gravity-Assist device developed by Hammad et al., an end-effector type device with a series elastic actuation system connected to an exoskeleton that dynamically compensates for vertical inertial forces generated by the patient’s body during walking [9]. This approach enables smoother vertical assistance and promotes a more natural gait by reducing discomfort. However, the need for body harnesses and acceleration measurement units strapped to the torso can restrict natural body movements such as arm swing and affect muscle activity, impacting the sense of free movement and potentially leading to discomfort with extended use. Additionally, such sensors can be costly. To address these issues, we propose an estimation technique that uses widely available sensors in smartphones, enabling a low-cost, patient-preferred solution that minimizes sensor placement complexity, reduces wiring, and preserves the patient’s freedom of movement, both physically and mentally, during rehabilitation.
The rest of the paper is organized as follows. Section 1 discusses the methodology implemented to carry out the following research. Section 2 discusses some important considerations and research assumptions which are to be taken into account. Section 3 discusses the results and finally, Section 4 concludes the paper and highlights future research work.

Table 1.
Volunteer data for three subjects standing and walking on treadmill at various speeds.
| Volunteer | Weight (kg) | Height (m) | Age |
|---|---|---|---|
| 1 | 46 | 1.58 | 16 |
| 2 | 51 | 1.80 | 18 |
| 3 | 48.5 | 1.67 | 17 |
2. Methodology
In this section, we first describe our concept of CoM displacement estimation. We then discuss some pre-filtering mechanisms such as removing the effect of gravity on the sensor readings and finally, we describe our algorithm in detail on how to extract required gait features from raw acceleration data recorded through a smartphone based accelerometer. Initially conducted subsequent researches use Inertia Measurement Units (IMU’s) to measure the vertical inertia of the patient [9], the technique involved holding the patient’s torso rigidly to accurately measure the vertical generated inertia during rehabilitation therapy. Such an approach not only negatively effects the patient’s natural gait pattern and freedom of walking but can ultimately result in improper gait recovery.
In addition, the Inertial Forces acquired for compensation using such an approach are not completely reliable due to gait kinematics, without human Gait Phase Estimation (GPE) inertia compensation is not possible. We propose the measurement of Inertia using a sensor-less technique by utilizing easily available day-to-day devices such as smartphones, smartwatches etc. this enables us to easily collect sensor data without the need of restricting patients natural freedom of walking. The proposed method for extracting gait features in our tehcnique through GPE can be seen in Figure 1 and is described in detail below. There are two stages in which this method can be divided into: (i) step detection and (ii) gait analysis. Data acquisition is described in detail in the Section 2.1. Once the accelerometric data has been gathered and compiled using the smartphone, the acceleration signals are pre-processed to remove effect of gravity and bring the data to zero-mean position for gait feature extraction (see Section 2.2). Next, the gait parameters are classified by extracting the descriptive features from the signals, as it is described in detail in the Section 2.3. Finally, the estimated vertical acceleration data extracted from the smartphone is multiplied with the volunteer mass and then compared to the actual Ground Reaction Force (GRF) data from the foot insole for validation.
2.1. Volunteer Testing
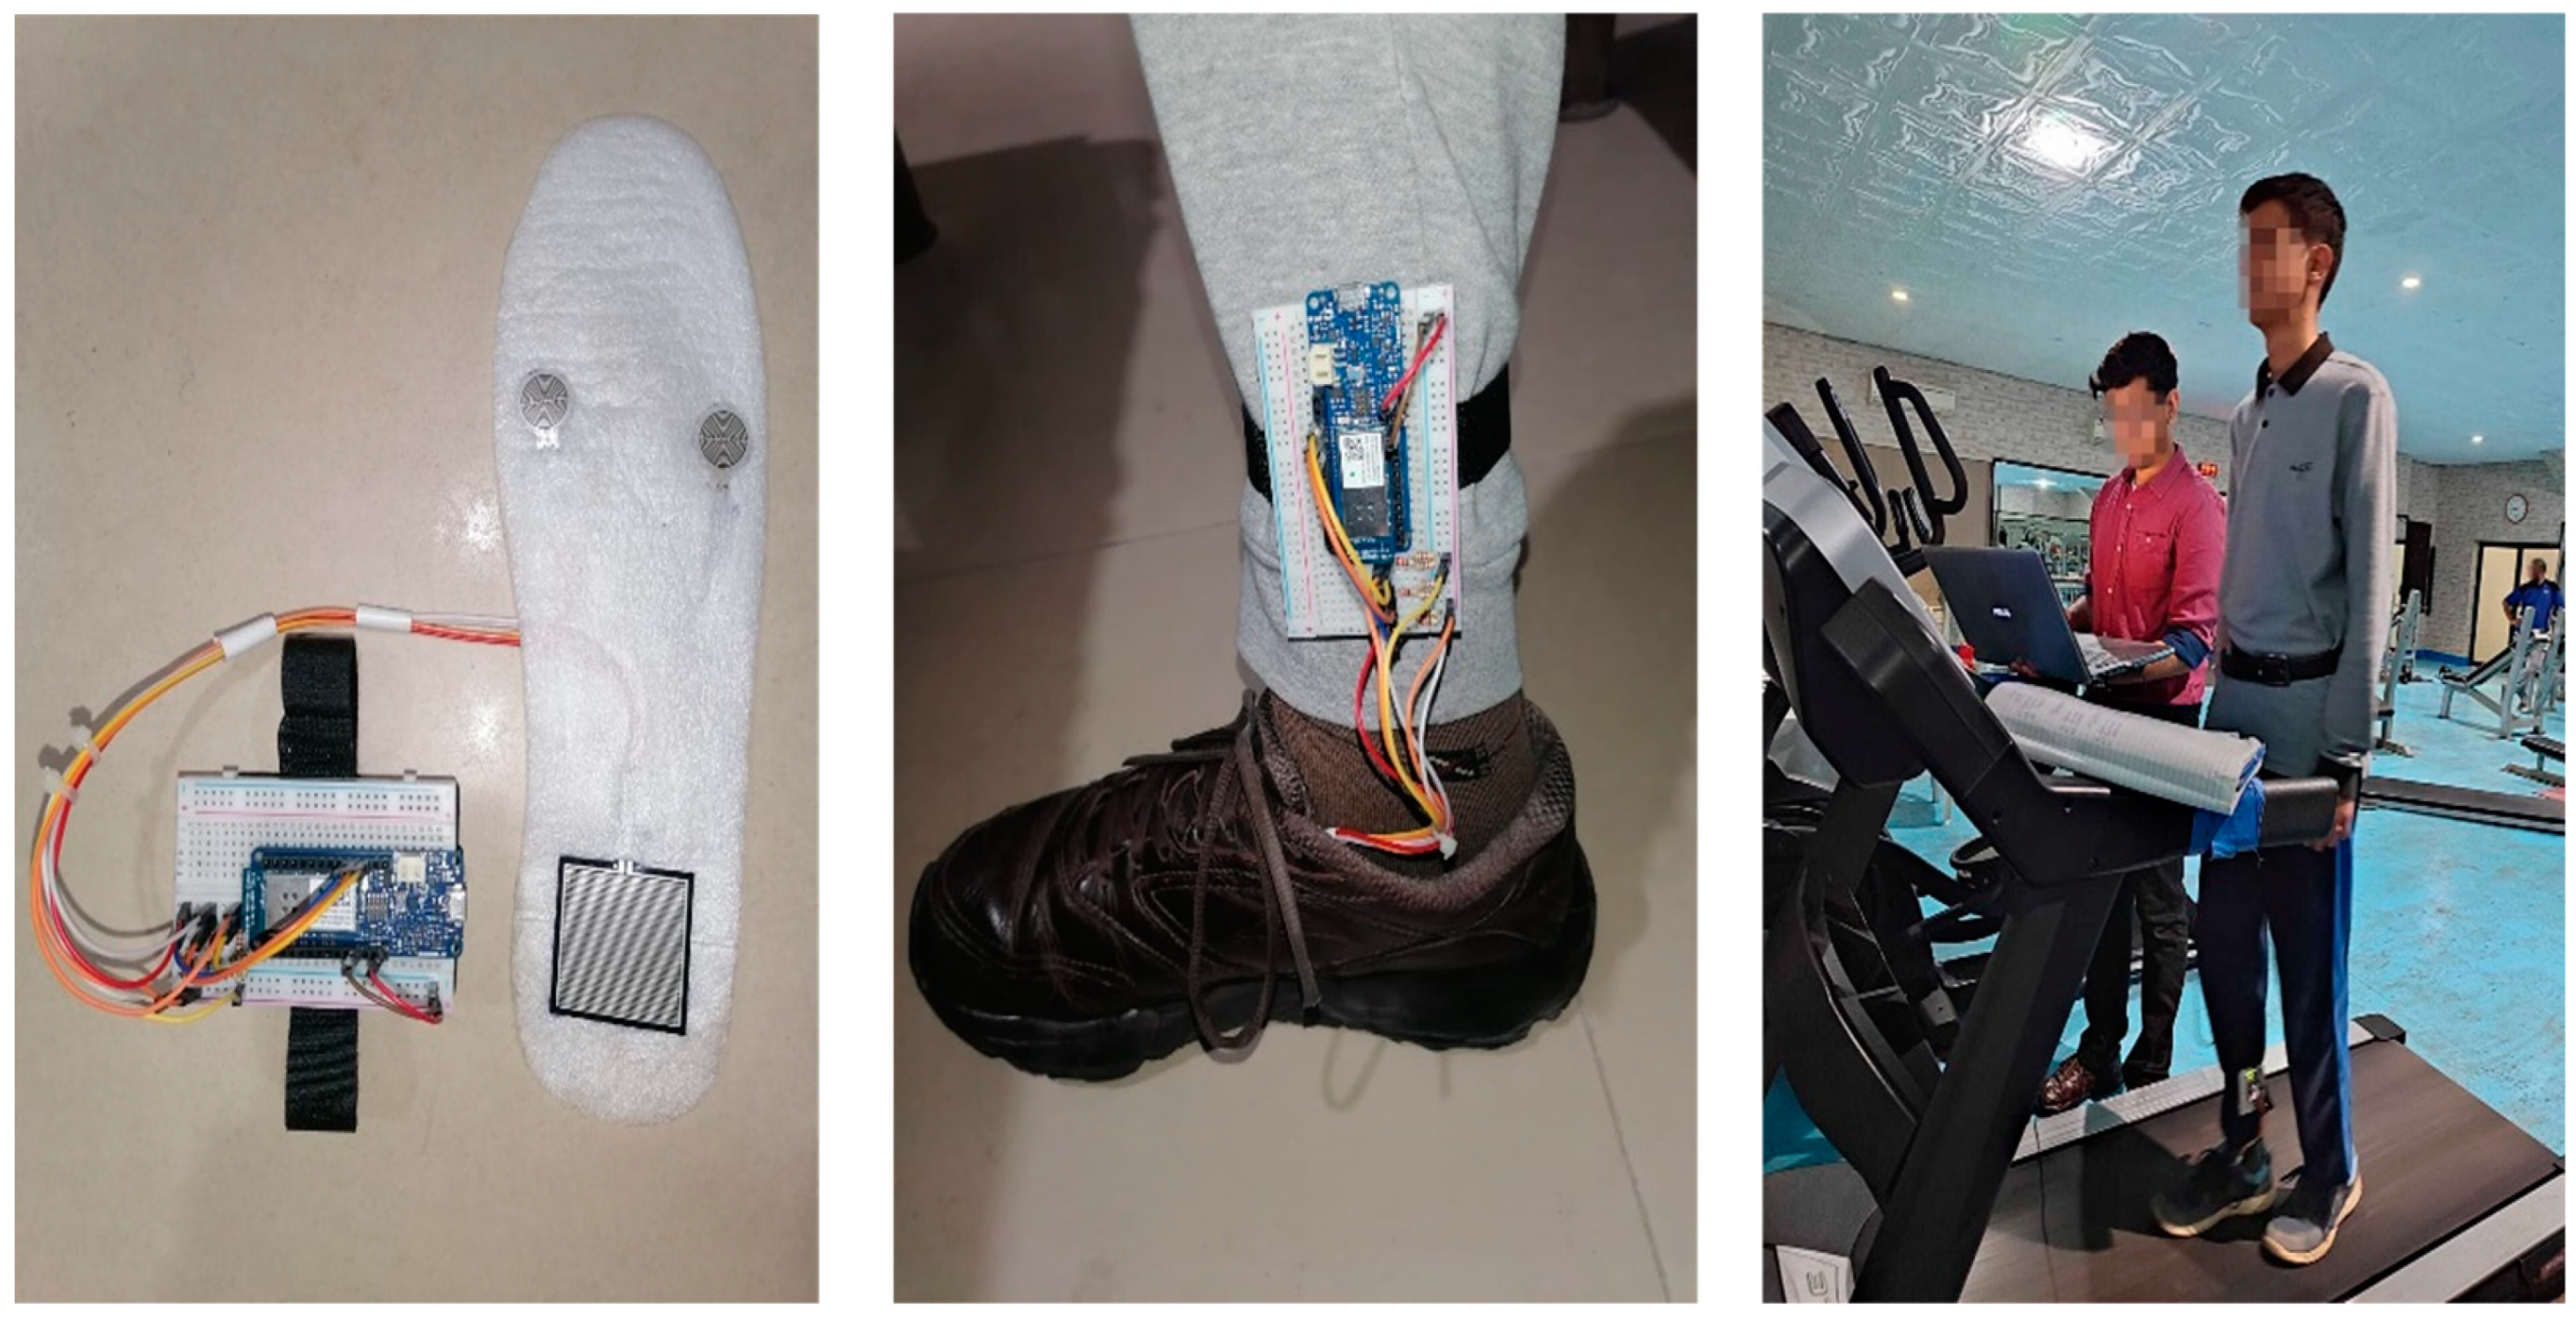
For this study, 3 healthy males without any foot disorders, with ages ranging from 16 to 18 years old and weighing in between 46 to 51 kg volunteered as test subjects. To provide information of the sample data, the age, gender, and the weight of the test subjects was recorded. Before the experiment was conducted, a briefing about the experimental procedure was given to the test subjects along with some time for them to get familiarized with the procedure. The test subjects were instructed to stand on the treadmill and start walking at their natural walking speeds from standing position (as shown in Figure 7). Test subjects underwent 3 different tests at different waking speeds 0.5 mph (0.223 m/s), 0.75 mph (0.335 m/s) and 1 mph (0.447 m/s) respectively. To minimize the error, three readings were taken for every type of test. The readings included number of steps recorded simultaneously while walking for a total walk time of 1 minute.
2.2. Experimental Setup
Two devices were used for data capturing in the following research, a smartphone that incorporates an accelerometer sensor and a custom developed foot insole using Force Sensi- tive Resistors (FSR’s). For acquiring acceleration data the smartphone featured an Android operating system and used MATLAB Mobile Suite (The MathWorks, Inc.). The second device was a custom developed foot insole using FSR’s for recording GRF data simultane- ously. The FSR’s used were Interlink 402 & 406, each FSR was calibrated individually and placed under foot regions of interest having high Plantar Pressure Distribution (PPD) (see Figure 2). The sampling rate of both devices was 20 Hz. It is also important to note that only volunteers with weight well under 55 kg were selected for the experimentation due to the measurement limitation of the developed foot insole of upto 60 kg only.
2.3. Gait Analysis
During this stage, the acceleration signals recorded using the smartphone during the experiment are imported into MathWorks MATLAB (R2022a) (Mathworks, Massachusetts, USA) for data analysis and processing. Another purpose of this study was to check if the vertical CoM Displacement could be estimated accurately while only using the accelerometer data, hence the Gyroscope and angle data were not used. Next, to measure the aspects of the acceleration signal from each walking trial post test, an algorithm was developed, for (Step 1) the vertical (Y-Axis) accelerometeric data from the smartphone sensor is imported and pre-processed according to the further Steps 3-4 for Step Detection (see Figure 3).
2.3.1. Step 3: Zero Normalization
In the steady state, acceleration measured along the axis influenced by gravity must be equal to the earth’s gravitational force. However, acceleration recorded by smartphone based accelerometer sensors is not stable over the time. Therefore, the acceleration is zero normalized by subtracting the respective mean as shown in the following equation and any constant effects, such as gravity, can be removed by subtracting the mean from the data.
where AM = Acceleration Magnitude
Normalized Acceleration = AM - mean(AM)
2.3.2. Step 4: Step Detection
Detecting the heel contact events is the second step of the gait analysis. To detect a heel contact event automatically, we first low pass filter the vertical acceleration by the 4th order zero lag Butterworth filter with a cut frequency of 5 Hz. We can then identify the transitional positions where the acceleration changes from positive to negative. Using the Signal Processing Toolbox in MATLAB, we can finally find the local maxima of the acceleration magnitude data and peaks with a minimum height above one standard deviation are considered to be steps (see Figure 4). This threshold is tuned experimentally to match the patient’s level of movement while walking, hardness of floor surfaces, etc. The acceleration gait data from 10 healthy volunteers is collected and has been used to test the proposed threshold based heel strike detection algorithm.
2.3.3. Spatio-Temporal Characteristics
After the heel contacts are detected, we obtain the number of steps by counting these contacts.
Number of Steps = Total number of heel contacts
We calculate the cadence by using the number of steps and dividing it by the walking time,
Cadence = # of Steps / Walking Time
We obtain the walking velocity by dividing the walking distance by walking time,
Walking Velocity = Walking distance / Walking Time
We obtain the mean step length by dividing the walking distance by the number of steps.
Mean Step Length = Walking Distance / # of Steps
We obtain the step time by calculating the difference between each consecutive peaks.
Step Time = Time between adjacent peaks
We obtain the step velocity from the simple relationship between Step time and Step length values,
Step Velocity = Step length / Step Time
Finally, after precisely identifying the Total number of steps and the Step Time taken during the experimentation, this data can now be used in the Gait Phase Estimation (GPE) technique to estimate the Vertical CoM Displacement, Velocity and Acceleration proposed in the section below.
2.4. Human Gait Phase Estimation (GPE)
Pedobarography can be defined as the study of the relationship between the plantar foot pressure and the supporting surface. It is studied and applied in the gait analysis and human posture or in the bio-mechanical analysis of human walking. Pedobarography is acknowledged and extensively practiced by Several research groups for its potential and clinically applied in patient analysis/diagnosis. As a matter of fact, recent studies on foot biomechanics have indicated that plantar foot pressure distributions are crucial in determining the unnatural gait. The pressure acting on the soles of the feet while stepping on the surface of the ground can be referred to as the human foot plantar pressure. This bio- mechanical parameter is profoundly accepted and is considered reliable in the study and diagnosis of several foot disorders. Furthermore, the crucial information of both the static and dynamic mechanical behavior of the human foot is also provided by this parameter.
The vertical position of the CoM is measured with respect to the plane of the walkway. A smartphone based accelerometer was used to estimate the vertical CoM in the experiment, the vertical CoM position was measured from a smartphone on the posterior surface of the body, the smartphone placement was selected as close to the estimated CoM position for the experiment preferably the (L3-L4) lumbar regions, but by assuming pelvic tilt is negligible and the upper body above the pelvis was assumed to be rigid the COM was determined in the following way. The difference between the measured maximum and minimum vertical positions gives us the peak-to-peak amplitude. The measured vertical position of the CoM is defined as the vertical distance waveform which is sinusoidal in nature, as it varies with time (see Figure 5). It can be estimated by the proposed Trigonometric approach to determine the vertical position of the CoM precisely at every step while walking. Using patient Anthropometric data and the patient Step Length extracted from the smartphone gait data, we can estimate the vertical peak-to-peak displacement of the CoM using Pythagorean Theorem (see Figure 6),
z2 = x2 + y2
Having known the Step Length and the patient Waist height, we can precisely estimate the maximum downward CoM displacement during the swing phase which occurs periodically when both feet are wide apart in a gait cycle (starts when the foot initially leaves the ground and ends when the same foot touches the ground again).
w2 = x2 + (Step Length/2)2
The Swing phase displacement acquired is then subtracted from the Waist Height to finally obtain the peek-to-peek CoM variation(∆h),
hCoM = Waist Height - Swing Phase Vertical Displacement
After acquiring the Vertical CoM Displacement, we can now easily obtain the Vertical CoM Velocity and Acceleration using the Step Time extracted from the smartphone gait data,
Vertical CoM Velocity = CoM Displacement / Step Time
Vertical CoM Acceleration = CoM Velocity / Step Time
Finally, the Vertical Inertial Forces can now be estimated by multiplying the Vertical CoM Acceleration with the Patient Mass for final validation.
where vCoMa = Vertical CoM Acceleration
Vertical Inertial Force = Patient Mass * vCoMa
2.5. Important Considerations & Research Assumptions
A few important research assumptions illustrated in Figure 7 below should be high- lighted. (a) The average knee bending during walking should be considered since the total range of motion of the knee is dependent on various parameters such as the hamstring tightness, soft-tissue restraints, and active insufficiency among different patients. Every gait pattern is analytically inconsistent and differs from the other based on multiple factors such as body physique, weight, foot balance, impairments, walking speed, terrain etc. It is geometrically assumed that the patient extends both his legs completely during each step and is not bent, and that every step taken is symmetrical. (b, c & d) The human body is made up of multiple layers of soft tissues, the mobile sensors cannot be rigidly attached to the patient which would lead to discomfort and possi- bly worsen lower back pain. This causes the mobile phone to tilt leading to vector reading decomposition in multiple axis resulting in the inconsistency of readings as depicted in (c) and (d). Hence it is assumed that pelvic tilt is negligible and the upper body above the pelvis was also assumed to be rigid.
Figure 7.
Important assumptions and considerations. (a) Knee flexion (b) Skin compliance (c) Smartphone orientation and (d) Vector decomposition.
Figure 7.
Important assumptions and considerations. (a) Knee flexion (b) Skin compliance (c) Smartphone orientation and (d) Vector decomposition.
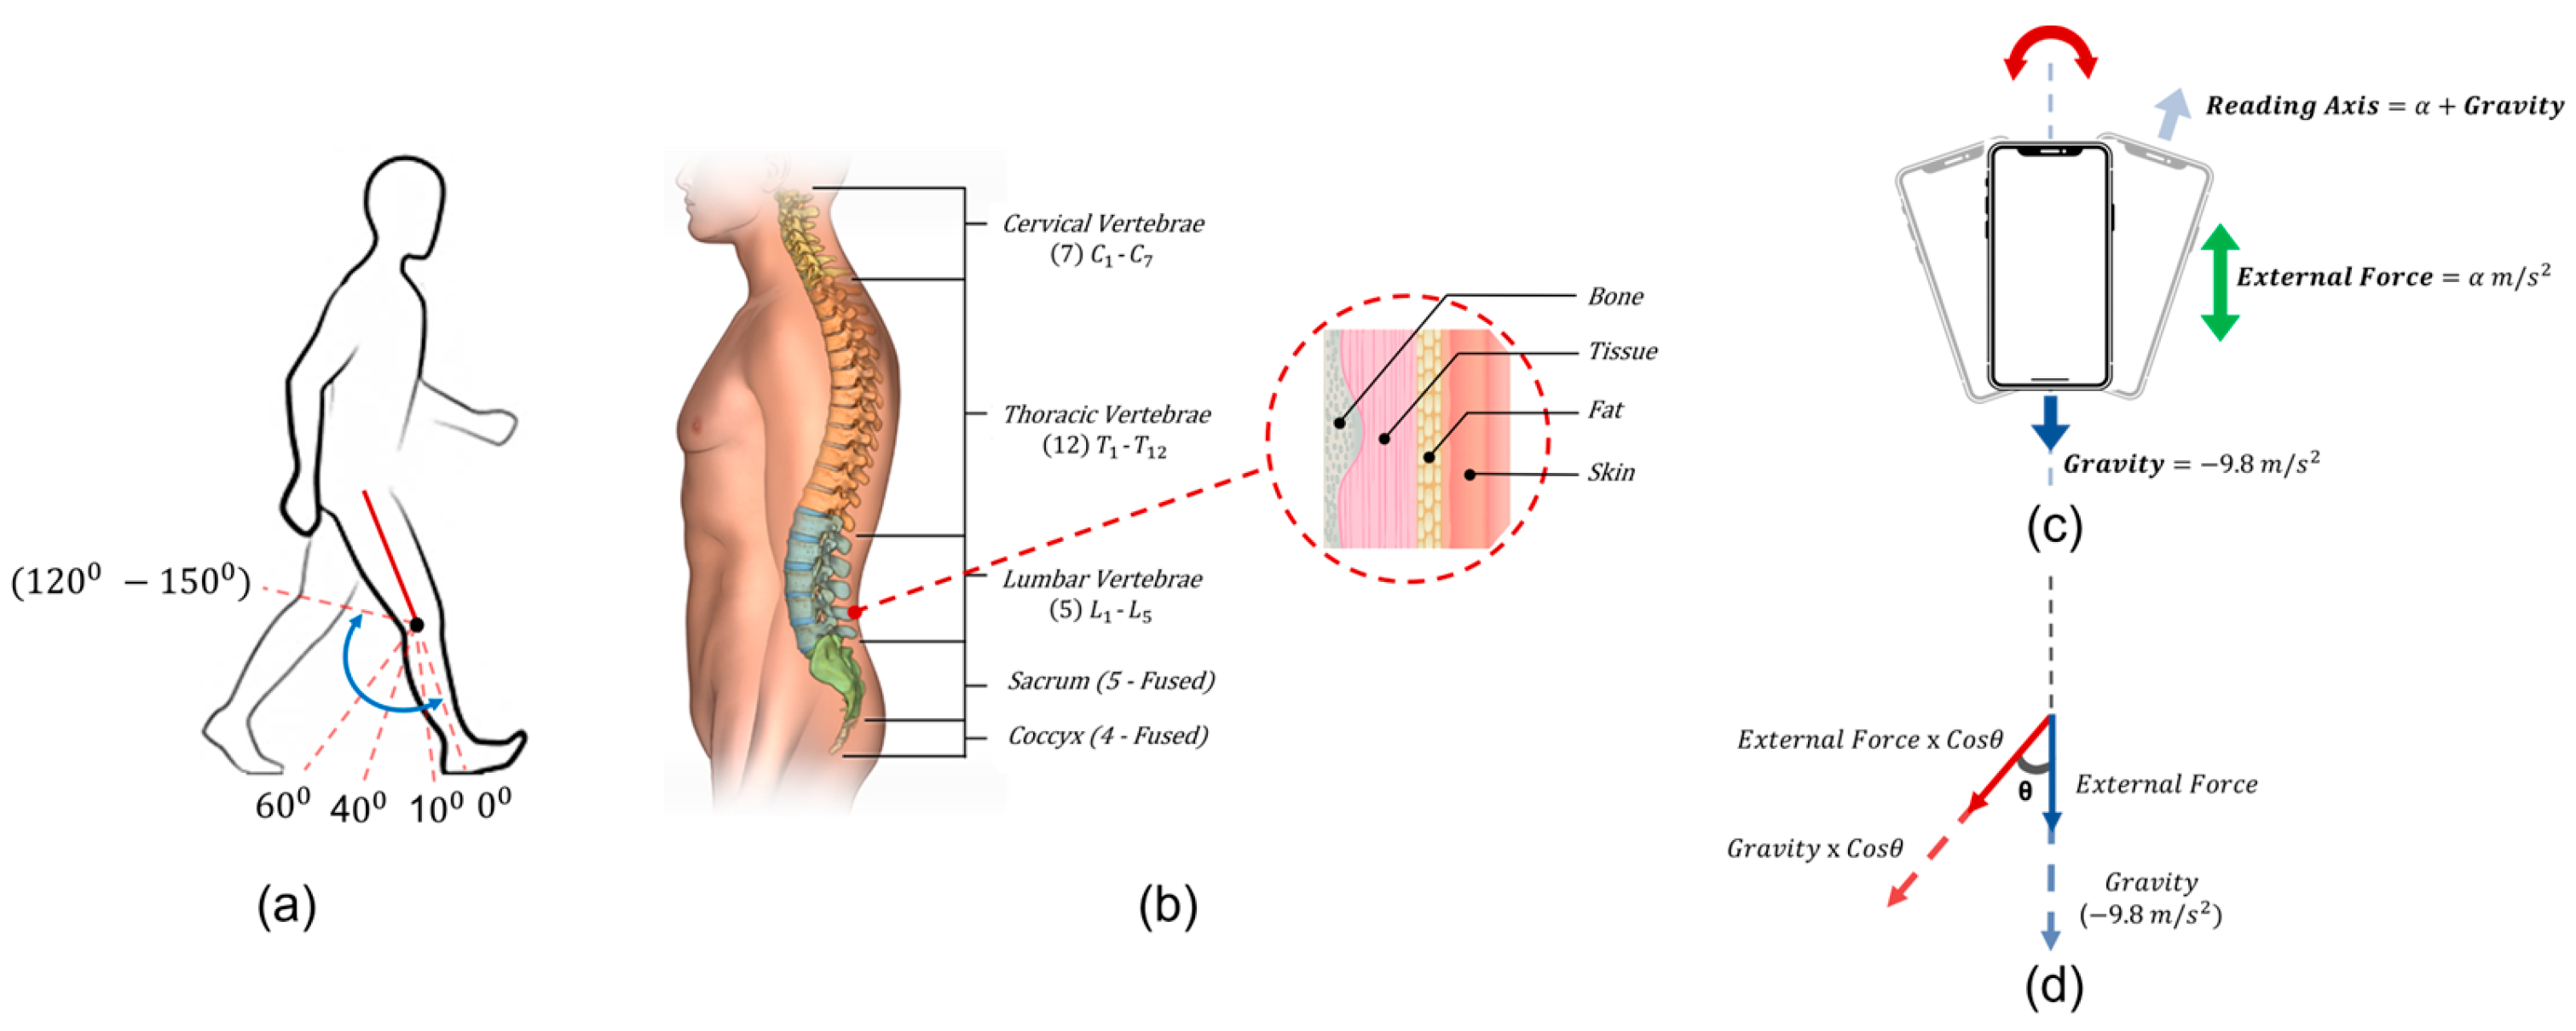
Figure 8.
Estimated vertical Displacement, Velocity and Acceleration through GPE.
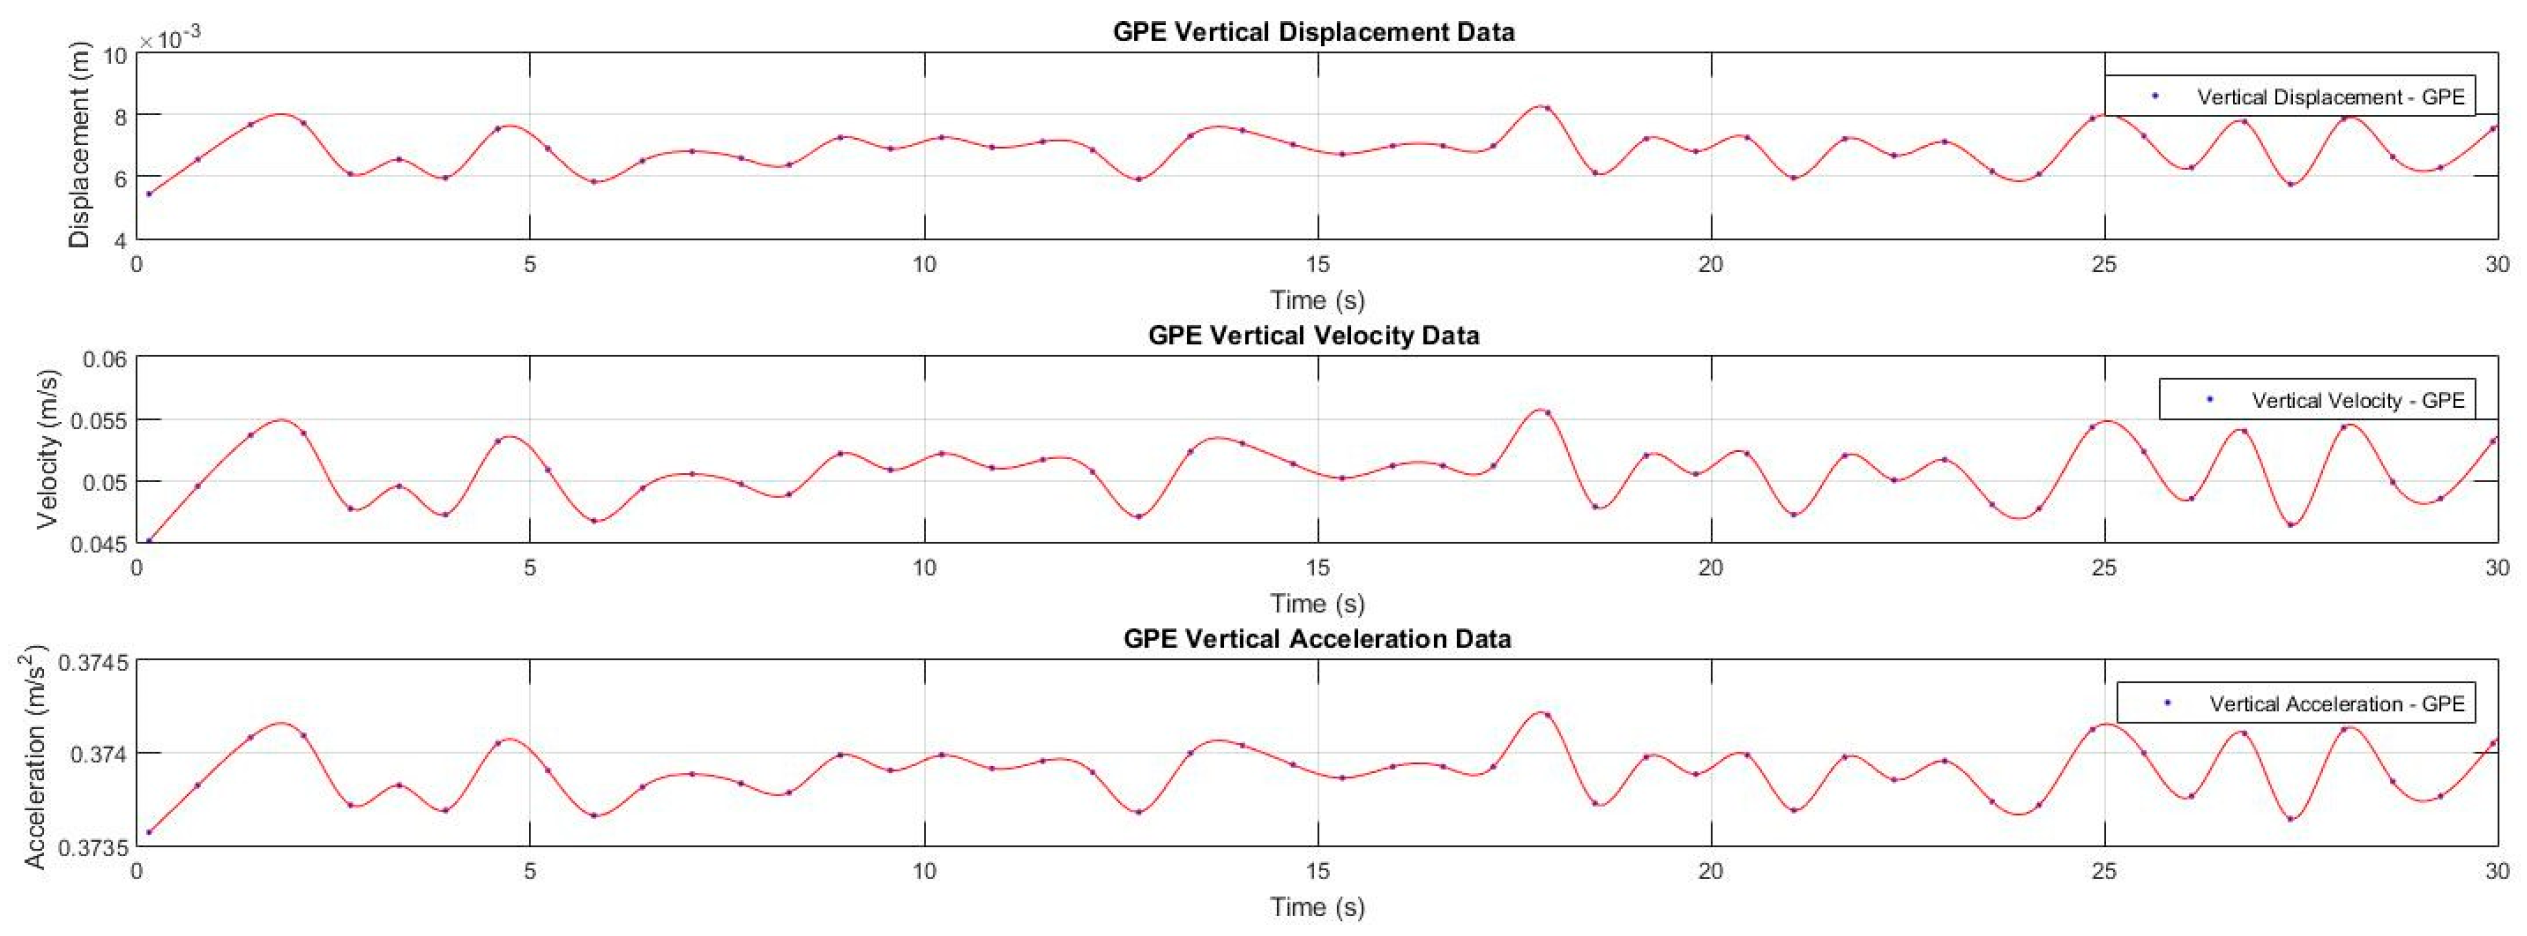
Figure 9.
Developed Foot insole (left), inserted insole and shin mounted DAQ (center) and volunteer testing (right).
Figure 9.
Developed Foot insole (left), inserted insole and shin mounted DAQ (center) and volunteer testing (right).
2.6. Foot Insole
The designed insole uses 03 FSR’s per foot placed under selected plantar pressure points after research studies conducted (see Figure 2) with a Voltage Divider circuit in- tegrated with an Arduino MKR1000 which can measure foot pressure data. The device utilizes raw Analog Data from the FSR’s and converts them into mapped voltages ranging from 0-5mV (Max input Voltage) as illustrated in Figure 10. The FSR’s used were accurately calibrated for measuring human body weight up to 60 kg. The relating equation derived from obtained FSR Voltages and Weights was used to map the voltages onto relevant body weights. The resulting individual FSR output Force readings were then added together to find the Total Ground Reaction Force (GRF) using the following relation,
Total GRF = FFSR1 + FFSR2 + FFSR3
2.6.1. Sensor Selection
There are several situations that utilize pressure measurement. In foot orthotics, the information about gait mechanics is provided and it has a wide range of applications i.e., in clinical aspects and in sports. The difference between a healthy and pathological gait pattern is seemingly invisible to the naked eye. The following insole uses Interlink Force-sensing resistors (FSR’s) 402 and 406 as sensors which are used to get an idea about patient weight distribution and Ground Reaction Forces (GRFs). Due to the use of such thin and flexible sensors, overall changes in shoe features such as foot space are notably insignificant and cause no discomfort to the users. The overall setup uses a mini-Arduino strapped to the patient’s shin weighing roughly 35 grams and utilizes minimum wiring clutter making it patient-friendly and suitable for research laboratories, clinics, and daily outdoor/indoor activities
2.6.2. Calibration
Calibrating the force sensors is the first step in designing the smart insole. The sensors will be used to detect the vertical GRFs during the gait cycle. Both the 402 and 406 force sensors were calibrated as follows. We first need to use a voltage divider circuit that has a sensor to convert the resistance change (due to the force application) of the sensor to a voltage value, which can be obtained by microcontrollers. Next, a custom tool was CNC machined by setting dimensions as per active areas of both FSR 402 and 406 (see Figure 11), this was done to apply static loads on the active areas of both FSR’s for calibration. The setup included a weighing machine, both FSR’s were placed onto the weighing scale and were connected to the analog ports of the Arduino MKR1000. Static loads were added with increments of 5 kg’s up to 60 kg, the analog values of the FSR’s were averaged for 1000 readings and recorded for each load. Next, after the readings for all the loads have been acquired each load was decreased in similar increments of 5kg and recorded for hysteresis analysis. The output voltage from the FSR’s was plotted which exhibits an exponential relationship with the applied force. Finally, the data sets were then taken to MathWorks MATLAB for extracting the calibration curve’s (see Figure 12) mathematical function through MATLAB Curve Fitting Tool. The acquired equations were then used to convert the FSR readings into the corresponding applied GRF’s by the foot. FSR 402 post calibration equation,
FSR 402 = 0.0004685 ∗ e0.01158∗FSR402 Analog Reading
FSR 406 post calibration equation,
FSR 406 = 0.02274 ∗ e0.00777∗FSR406 Analog Reading
3. Results & Discussion
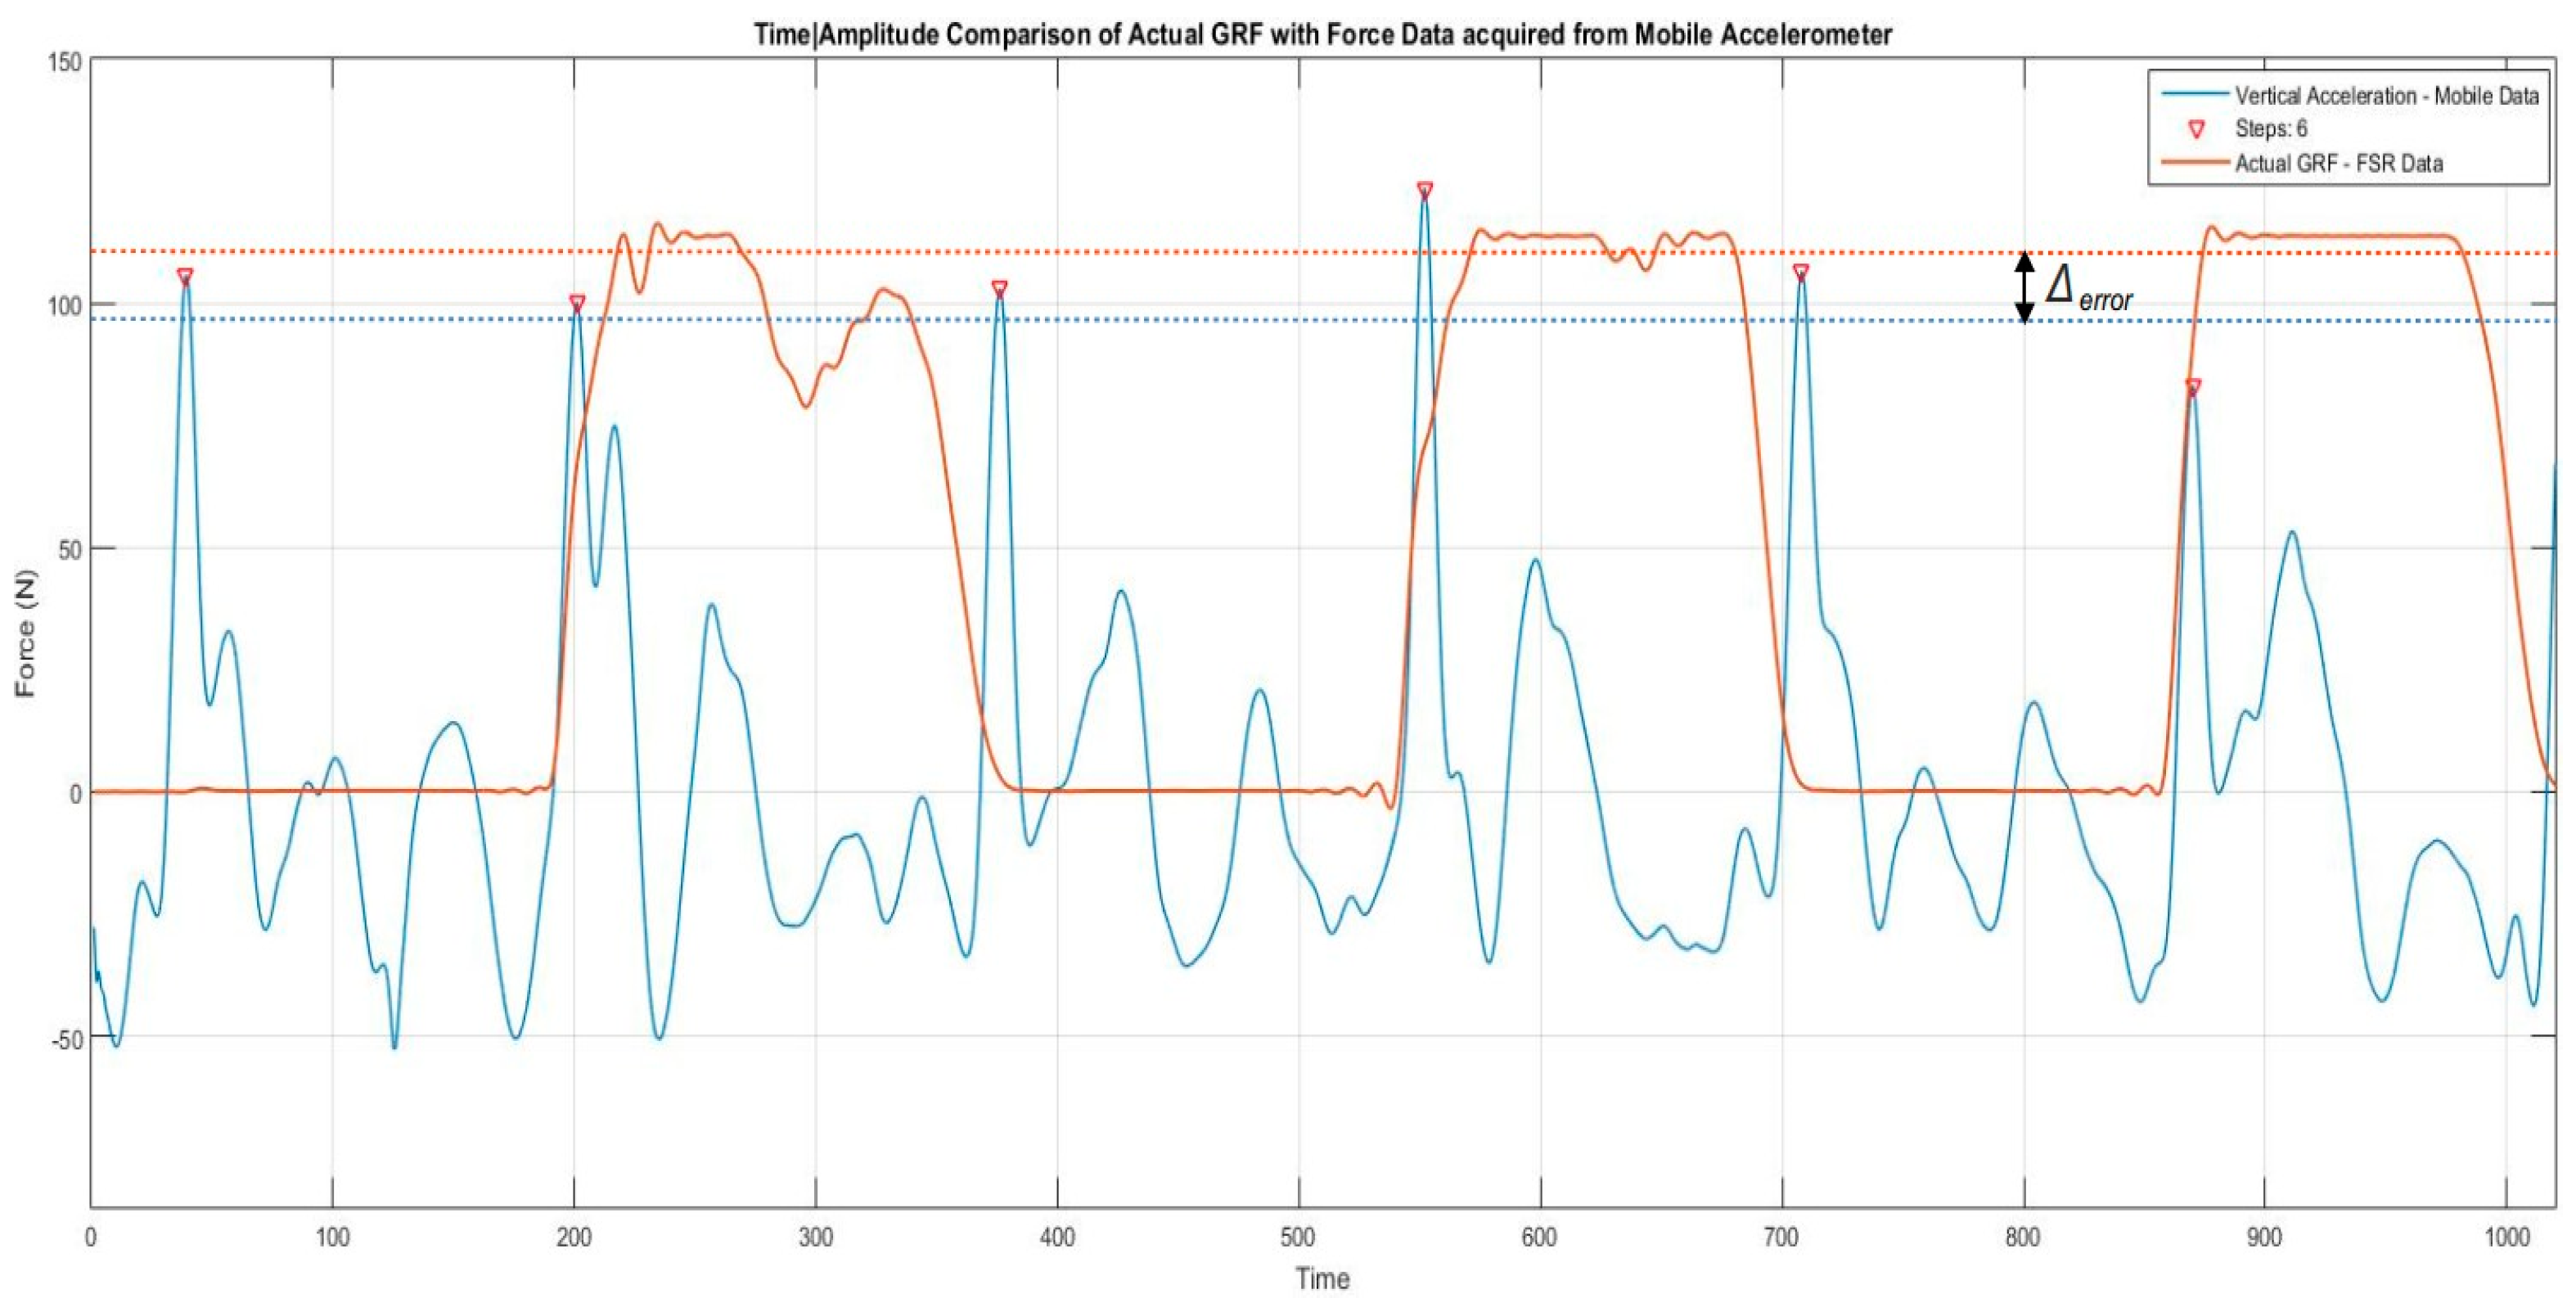
After collecting the volunteer data from the smartphone, we first identified steps taken from the raw smartphone data. Table 2 lists the steps identified and manually counted steps to identify the efficacy of step identification, the maximum error in steps was (01) step showing the reliability of our step identification technique. Next, using our GPE algorithm we estimated the Vertical Displacement, Velocity and Acceleration for each given velocity, a sample result for volunteer 1 at 0.75 mph can be seen in Figure 8. Next, the vertical Ground Reaction Forces (GRF’s) have to be verified. The estimated vertical Acceleration through GPE was multiplied by the volunteers mass to provide us with the estimated vertical Inertial Forces. The Ground Reaction Force data logged from the FSR’s include volunteer weight plus added inertia (Weight + Inertial Force). Subtracting the volunteer weight from FSR logged GRF data will result in purely logged vertical inertial forces and then finally we compare them directly together for our validation. Table 3 lists the comparison between actual GRF from the insole and estimated GRF from GPE of volunteer 1 at different walking speeds, the corresponding difference in Mass has also been highlighted. The actual and estimated readings are quite similar but the difference in both readings is due to FSR reading inaccuracies. It can also be seen in Table 4, post calibration results of the FSR shows a Maximum error of (5.8 kg) which is quite high. These inaccuracies can be significantly reduced by acquring custom made FSR which are capable of higher measurement ranges.
However, the reliability of this validation approach used for the experimental data can be seen in the Figure 13. It illustrates the comparison of the magnitude of vertical Inertial Forces from the raw Accelerometric data with the actual GRF from the FSR’s in the foot insole. Furthermore, it is important to note in the comparison that the GRF’s occur at every alternate step since the GRF data is being obtained from the foot insole device worn on a (single) foot. The aforementioned outcomes are a result of multiple experiments and analysis conducted on the volunteer gait data to support our proposed technique.
Figure 13.
FSR 406 Calibration curve.
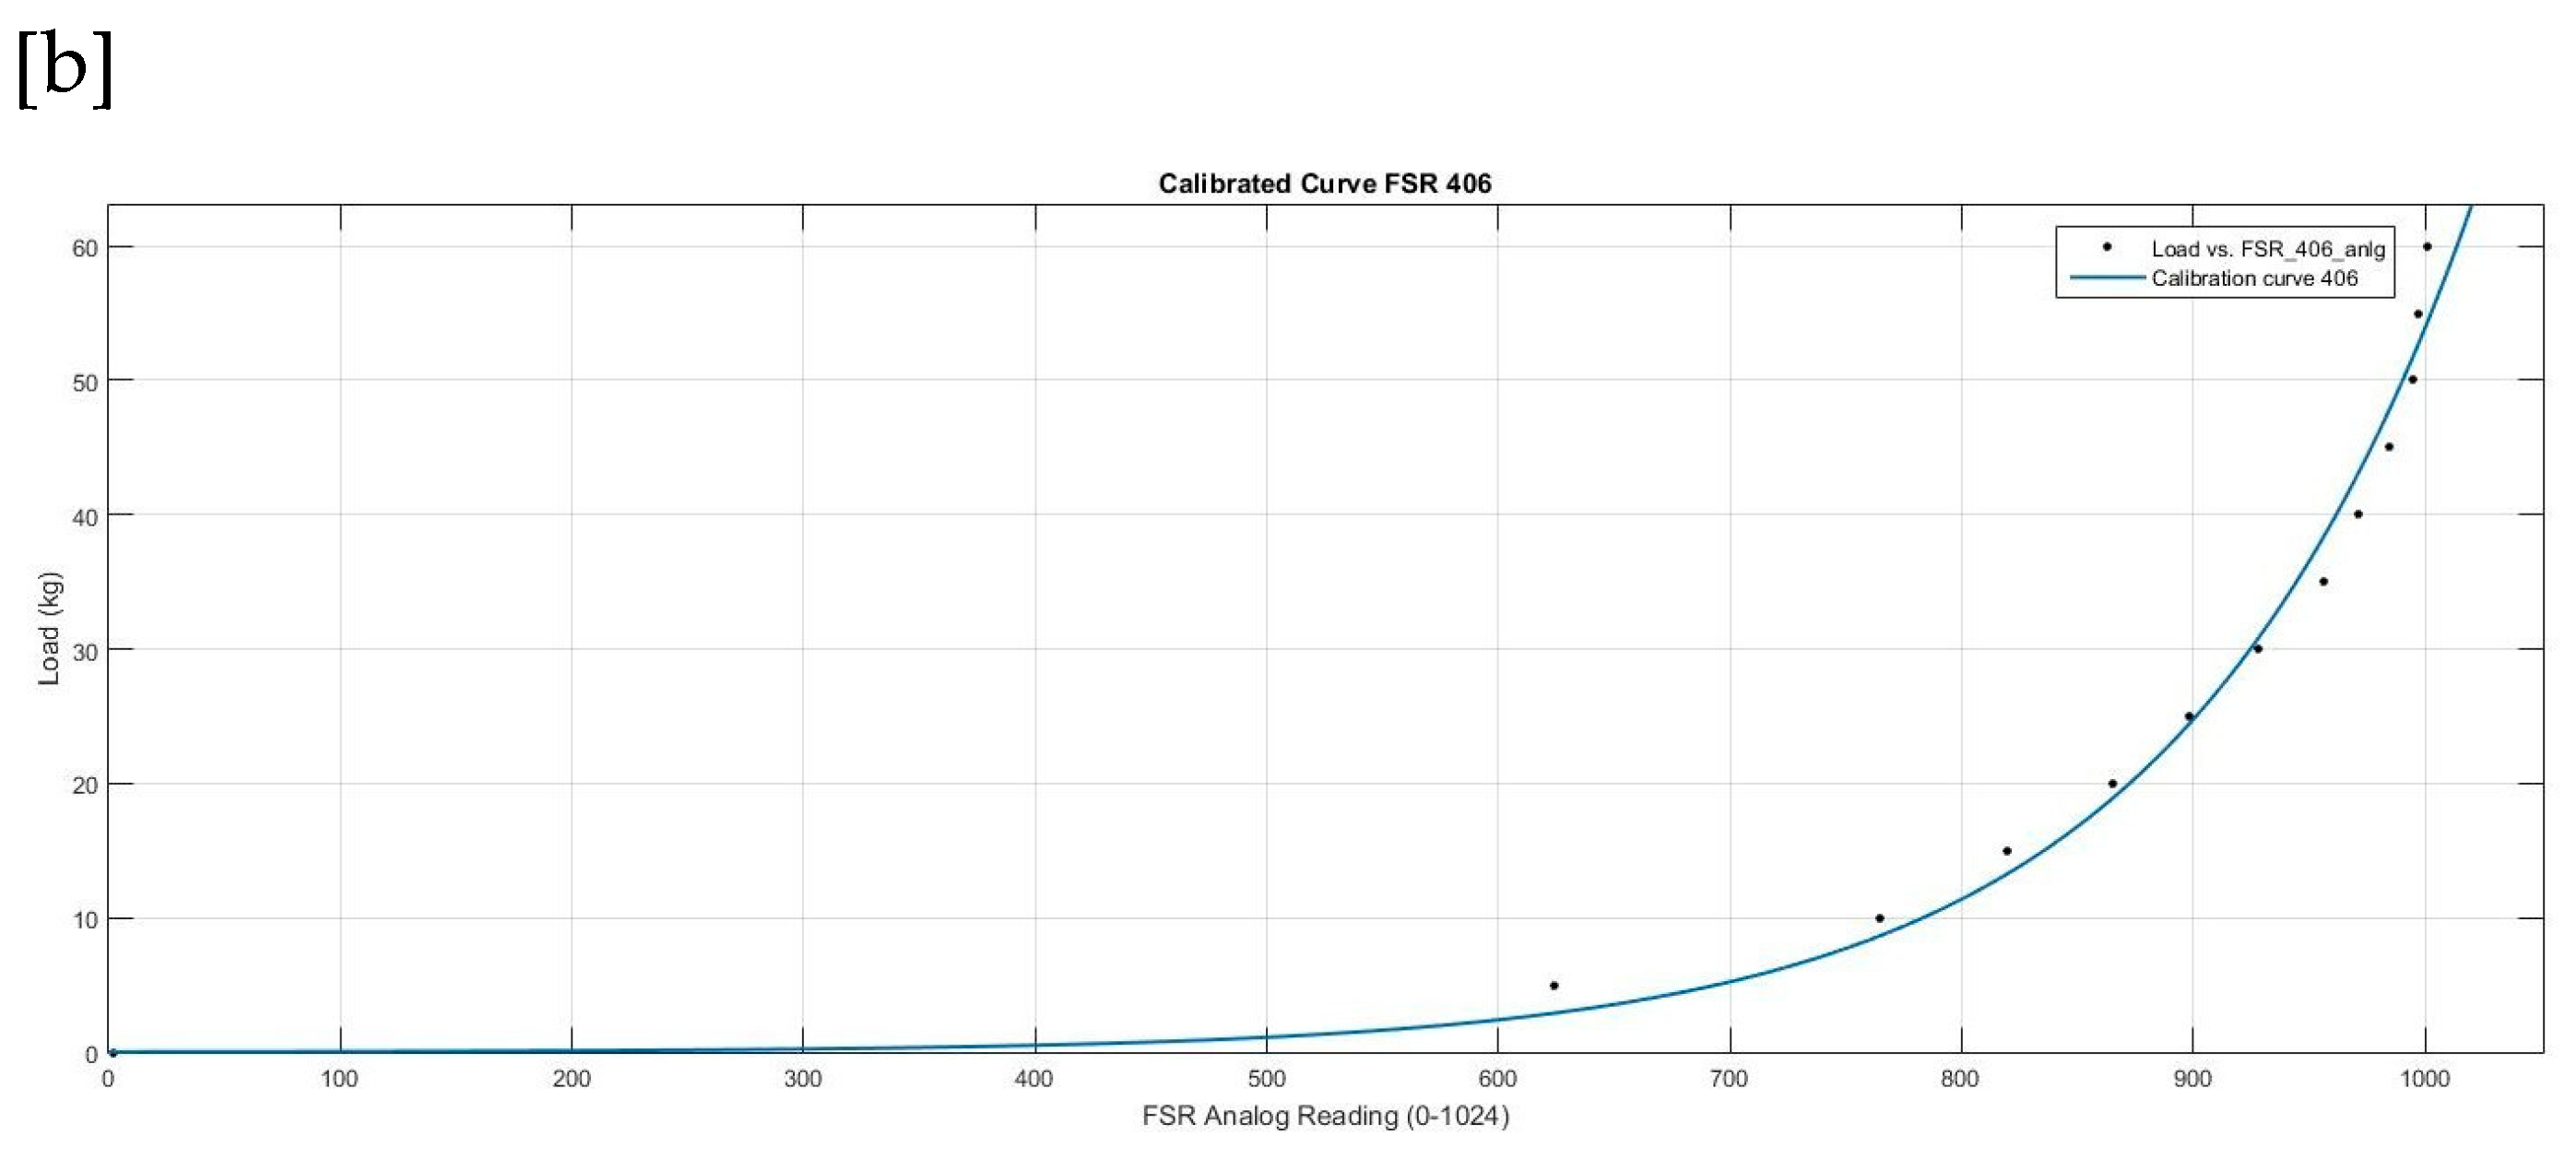
Figure 14.
FSR post calibration curves.
Figure 15.
Comparison of actual GRF’s from foot insole with IF’s from smartphone based data.
4. NASA - Active Response Gravity Offload System (ARGOS)
The NASA’s Active Response Gravity Offload System (ARGOS) uses a system similar to an overhead bridge crane and is designed to simulate environments having reduced gravity, like the Lunar, Martian, or microgravity [10]. The ARGOS continuously offloads a portion of the human payload’s weight by using an inline load cell during all dynamic motions, for example walking, running, and jumping under the effect of Lunar, Martian and a wide range of microgravity activities. The ARGOS maintains a vertical offload force by using a cable angle sensor and actively tracking and following the payload’s motion. However, ARGOS does not compensate for the added inertial forces in its unloading force generated during these dynamic activities. It is conjectured that the following technique can be useful in accurately simulating the effects of gravity on the human payload during different microgravity activities, such that the person feels a more realistic experience of the low-gravity feeling induced during simulation.
5. Conclusions
Inertial compensation has been largely overlooked in body-weight support (BWS) control strategies. This research introduces a novel approach for measuring inertia using a smartphone-based sensor technique, which, along with the developed gait phase estimation (GPE) algorithm, operates on raw accelerometric data from smartphones without any physical restrictions on the patient, thus preserving natural gait movement. The validation of this technique, however, highlighted limitations in the foot insole sensors due to their restricted measurement ranges, which led to inaccuracies in ground reaction force (GRF) readings. Future assessments should incorporate custom-made force-sensing resistors (FSRs) with higher measurement capacities to enhance the accuracy of the GPE algorithm. The proposed technique provides a foundation for further research in this domain. Planned future work includes evaluating the effects of inertia compensation on gait kinematics, integrating the GPE technique into BWS devices for patients with gait impairments, and assessing its impact when using estimated inertial force (IF) values as reference actuation inputs. Additionally, since the GPE algorithm has only been tested at low walking speeds, further analysis at higher speeds is recommended to fully evaluate its effectiveness in gait feature extraction.
Subject: Request for APC Waiver/Reduction for Submission of Manuscript Dear Chief Editor!
I am writing to respectfully request a waiver or reduction of the Article Processing Charge (APC) for our manuscript titled “Estimating Vertical Inertial Forces for Inertia Compensation during Gait Rehabilitation Therapy,” which we are submitting to Biomechanics. Our research explores a novel estimation technique for vertical inertial forces in gait rehabilitation, offering valuable insights into cost-effective, patient-friendly solutions that could benefit both clinical practitioners and patients.
Due to limited funding available for our project, we would greatly appreciate any financial assistance you can provide. A relaxation of the APC would significantly help in enabling us to publish our findings and contribute to the broader research community in biomechanics and rehabilitation technology.
Thank you for considering our request. We look forward to the opportunity to contribute to:
Biomechanics. Regards
Atif Mahmood
Corresponding Author
References
- Guralnik, J.M.; Ferrucci, L.; Simonsick, E.M.; Salive, M.E.; Wallace, R.B. Lower-extremity function in persons over the age of 70 years as a predictor of subsequent disability. New Engl. J. Med. 1995, 332, 556–562. [Google Scholar] [CrossRef] [PubMed]
- Chiu, H.C.; Chern, J.Y.; Shi, H.Y.; Chen, S.H.; Chang, J.K. Physical functioning and health-related quality of life: before and after total hip replacement. Kaohsiung J. Med. Sci. 2000, 16, 285–292. [Google Scholar] [PubMed]
- Barbeau, H.; Visintin, M. Optimal outcomes obtained with body-weight support combined with treadmill training in stroke subjects. Arch. Phys. Med. Rehabil. 2003, 84, 1458–1465. [Google Scholar] [CrossRef] [PubMed]
- Mehrholz, J.; Thomas, S.; Elsner, B. Treadmill training and body weight support for walking after stroke. Cochrane Database Syst. Rev. 2017, 2017, CD002840. [Google Scholar] [CrossRef] [PubMed]
- Mao, Y.-R.; Lo, W.L.; Lin, Q.; Li, L.; Xiao, X.; Raghavan, P.; Huang, D.-F. The effect of body weight support treadmill training on gait recovery, proximal lower limb motor pattern, and balance in patients with subacute stroke. BioMed Res. Int. 2015, 2015, 175719. [Google Scholar] [CrossRef] [PubMed]
- Gangopadhyay, S.; Saha, S.; Sengupta, M.; Maity, B.; Chakrabarti, D. Effect of Body Weight Support Treadmill Training on Gait Recovery, Lower Limb Function and Dynamic Balance in Patients with Chronic Stroke: A Randomised Controlled Trial. J. Clin. Diagn. Res. 2021, 15, 2021. [Google Scholar] [CrossRef]
- Pennycott, A.; Wyss, D.; Vallery, H.; Riener, R. Effects of added in- ertia and body weight support on lateral balance control during walking. In Proceedings of the 2011 IEEE International Conference on Rehabilitation Robotics, Zurich, Switzerland, 29 June–1 July 2011; pp. 1–5. [Google Scholar]
- Aguirre-Ollinger, G.; Colgate, J.E.; Peshkin, M.A.; Goswami, A. Design of an active one-degree-of-freedom lower-limb exoskeleton with inertia compensation. Int. J. Robot. Research 2011, 30, 486–499. [Google Scholar] [CrossRef]
- Munawar, H.; Patoglu, V. Gravity-assist: A series elastic body weight support system with inertia compensation. In Proceedings of the 2016 IEEE/RSJ International Conference on Intelligent Robots and Systems (IROS)e, IEEE; 2016; pp. 3036–3041. [Google Scholar]
- National Aeronautics and Space Administration (NASA), Active Response Gravity Offload System (ARGOS). Available online: https://www.nasa.gov/centers/johnson/engineering/integrated_environments/active_response_gravity/#:~:text=Photo%20credit%3A%20NASA,to%20an%20overhead%20bridge%20crane (accessed on 22 May 2022).
- Tarihci Cakmak, E.; Yaliman, A.; Torna, G.; Sen, E.I. The effectiveness of bodyweight- supported treadmill training in stroke patients: randomized controlled trial. Neurol. Sci. 2024, 45, 1–9. [Google Scholar] [CrossRef] [PubMed]
- Inai, T.; Kobayashi, Y.; Sudo, M.; Yamashiro, Y.; Ueda, T. Errors in Estimating Lower-Limb Joint Angles and Moments during Walking Based on Pelvic Accelerations: Influence of Virtual Inertial Measurement Unit’s Frontal Plane Misalignment. Sensors 2024, 24, 5096. [Google Scholar] [CrossRef]
- Saito, A.; Noyori, S.; Toyofuku, T.; Kobayashi, Y.; Kizawa, S. Center-of-gravity velocity estimation using lower limb muscle forces during walking. J. Biomech. Sci. Eng. 2024, 19, 24-00061. [Google Scholar] [CrossRef]
- Saito, A.; Noyori, S.; Toyofuku, T.; Kobayashi, Y.; Kizawa, S. Center-of- gravity velocity estimation using lower limb muscle forces during walking. J. Biome- Chanical Sci. Eng. 2024, 19, 24-00061. [Google Scholar] [CrossRef]
Figure 1.
Net force on the human body during (a) Standstill and (b) Walking.
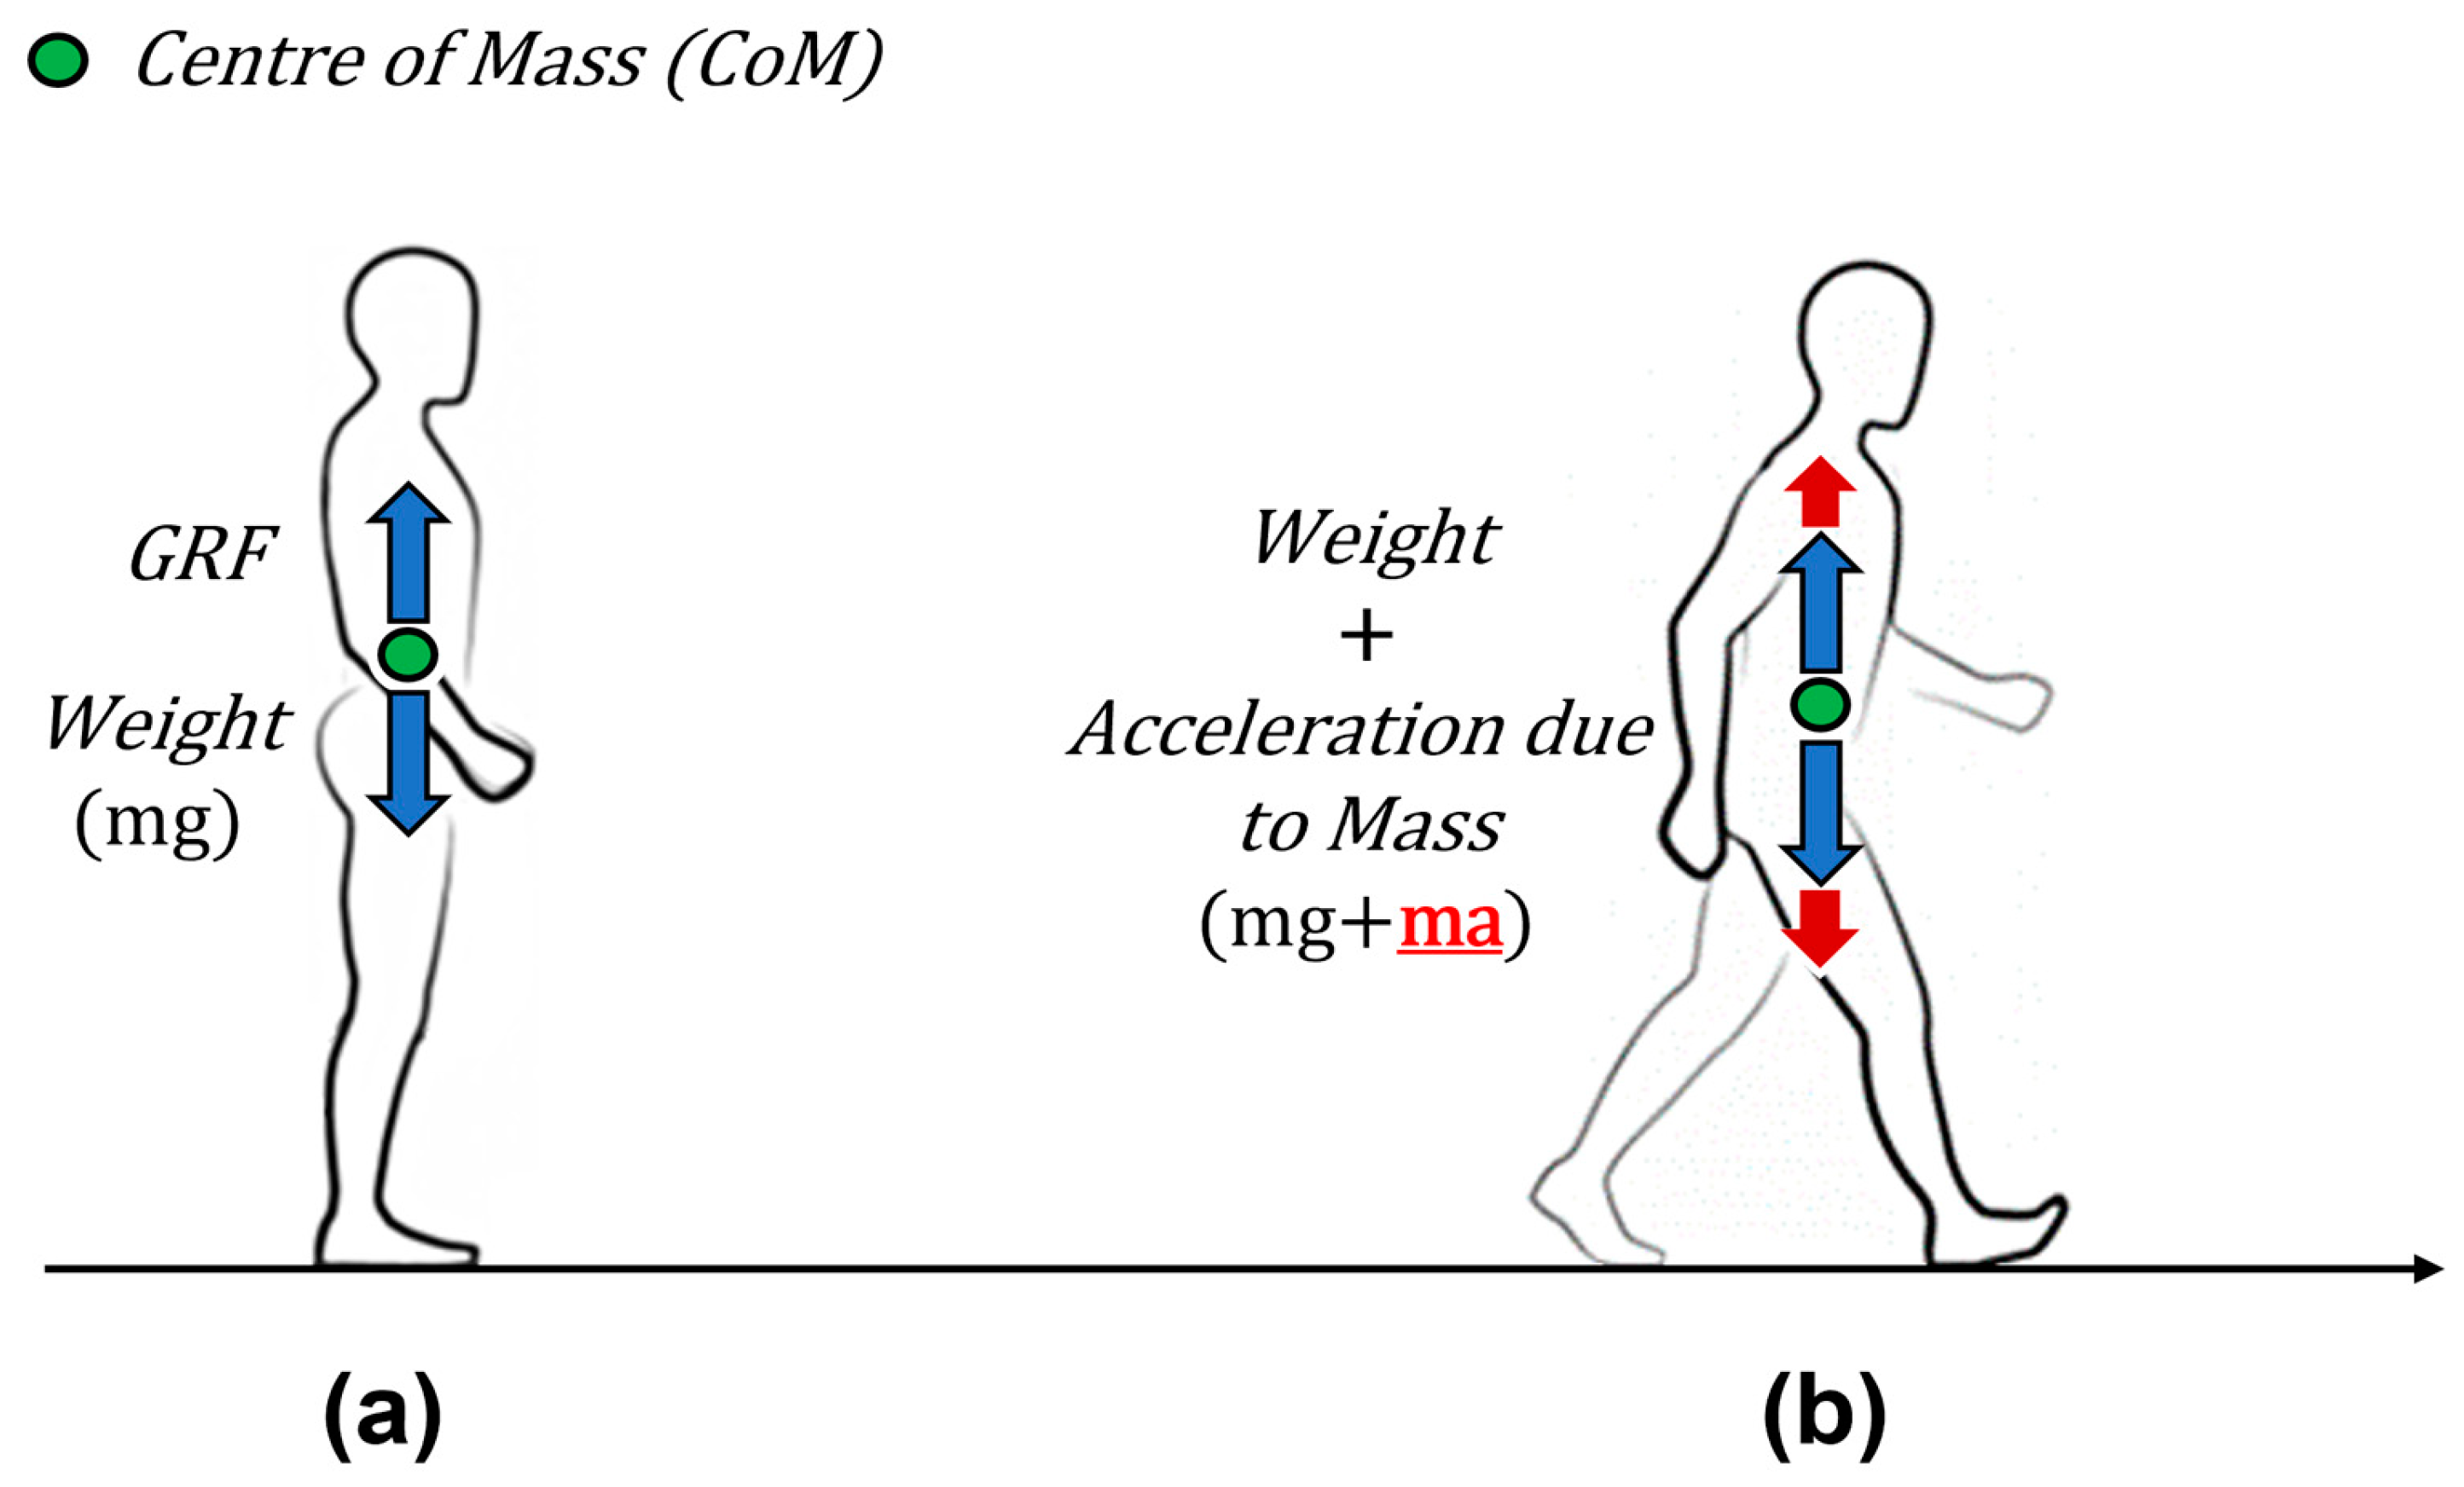
Figure 2.
Custom designed foot insole with FSR placements under preferred foot regions (1),(2) & (3) having high Plantar Pressure Distribution (PPD).
Figure 2.
Custom designed foot insole with FSR placements under preferred foot regions (1),(2) & (3) having high Plantar Pressure Distribution (PPD).
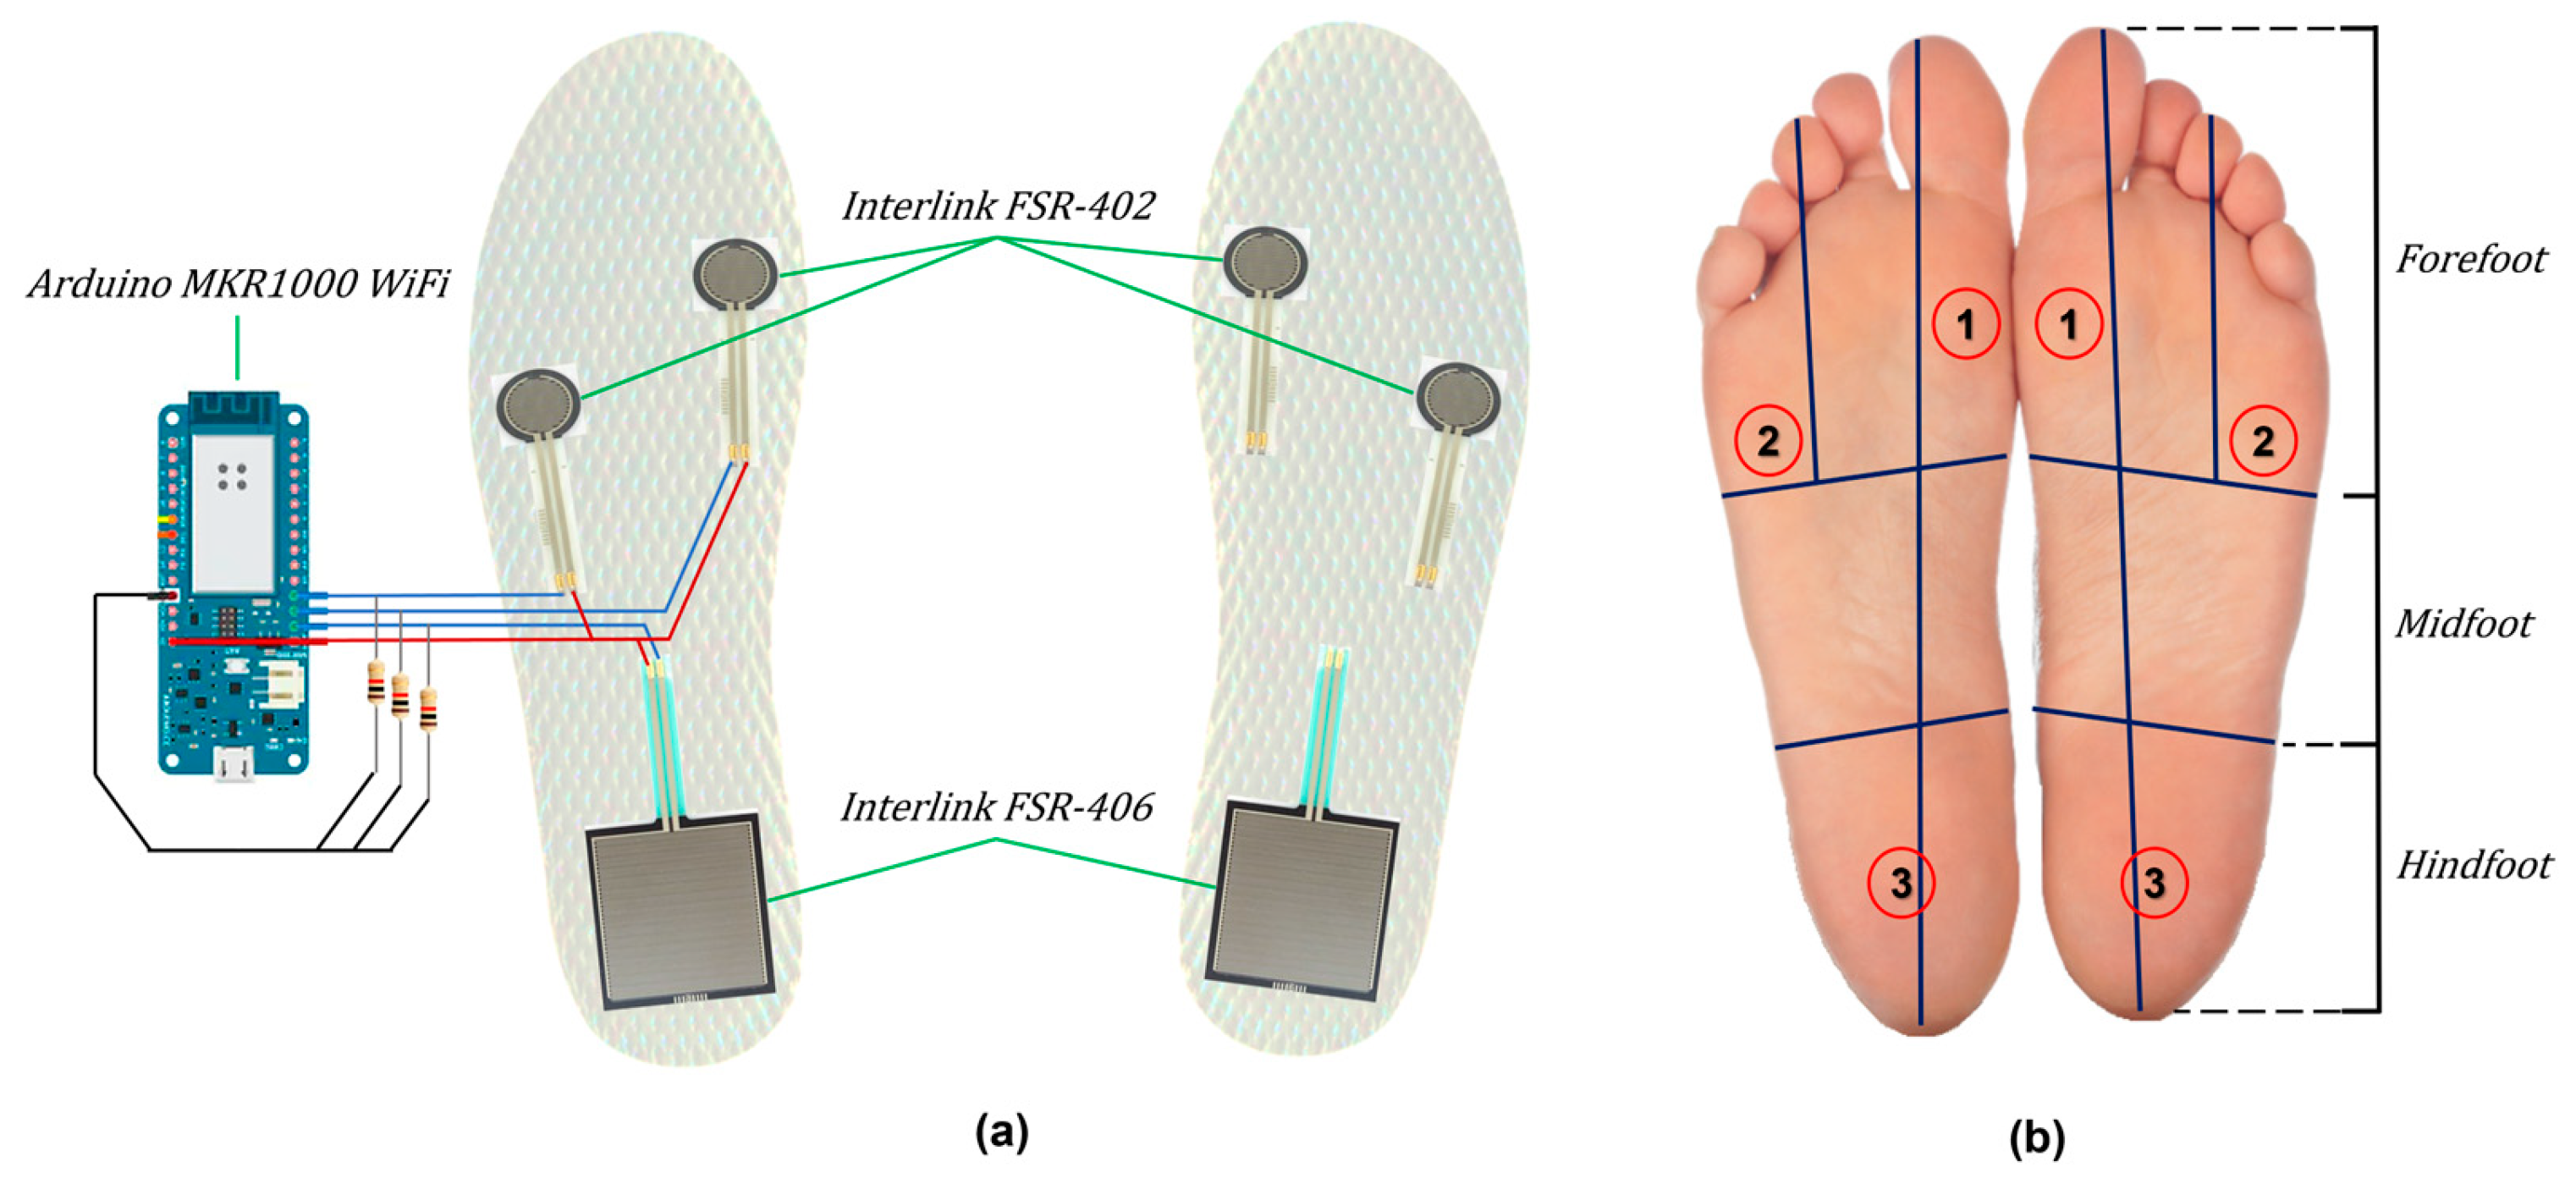
Figure 3.
Proposed gait recognition method. This method is divided into two stages: (i) step detection (steps 1–4) and (ii) gait analysis (steps 5–6).
Figure 3.
Proposed gait recognition method. This method is divided into two stages: (i) step detection (steps 1–4) and (ii) gait analysis (steps 5–6).
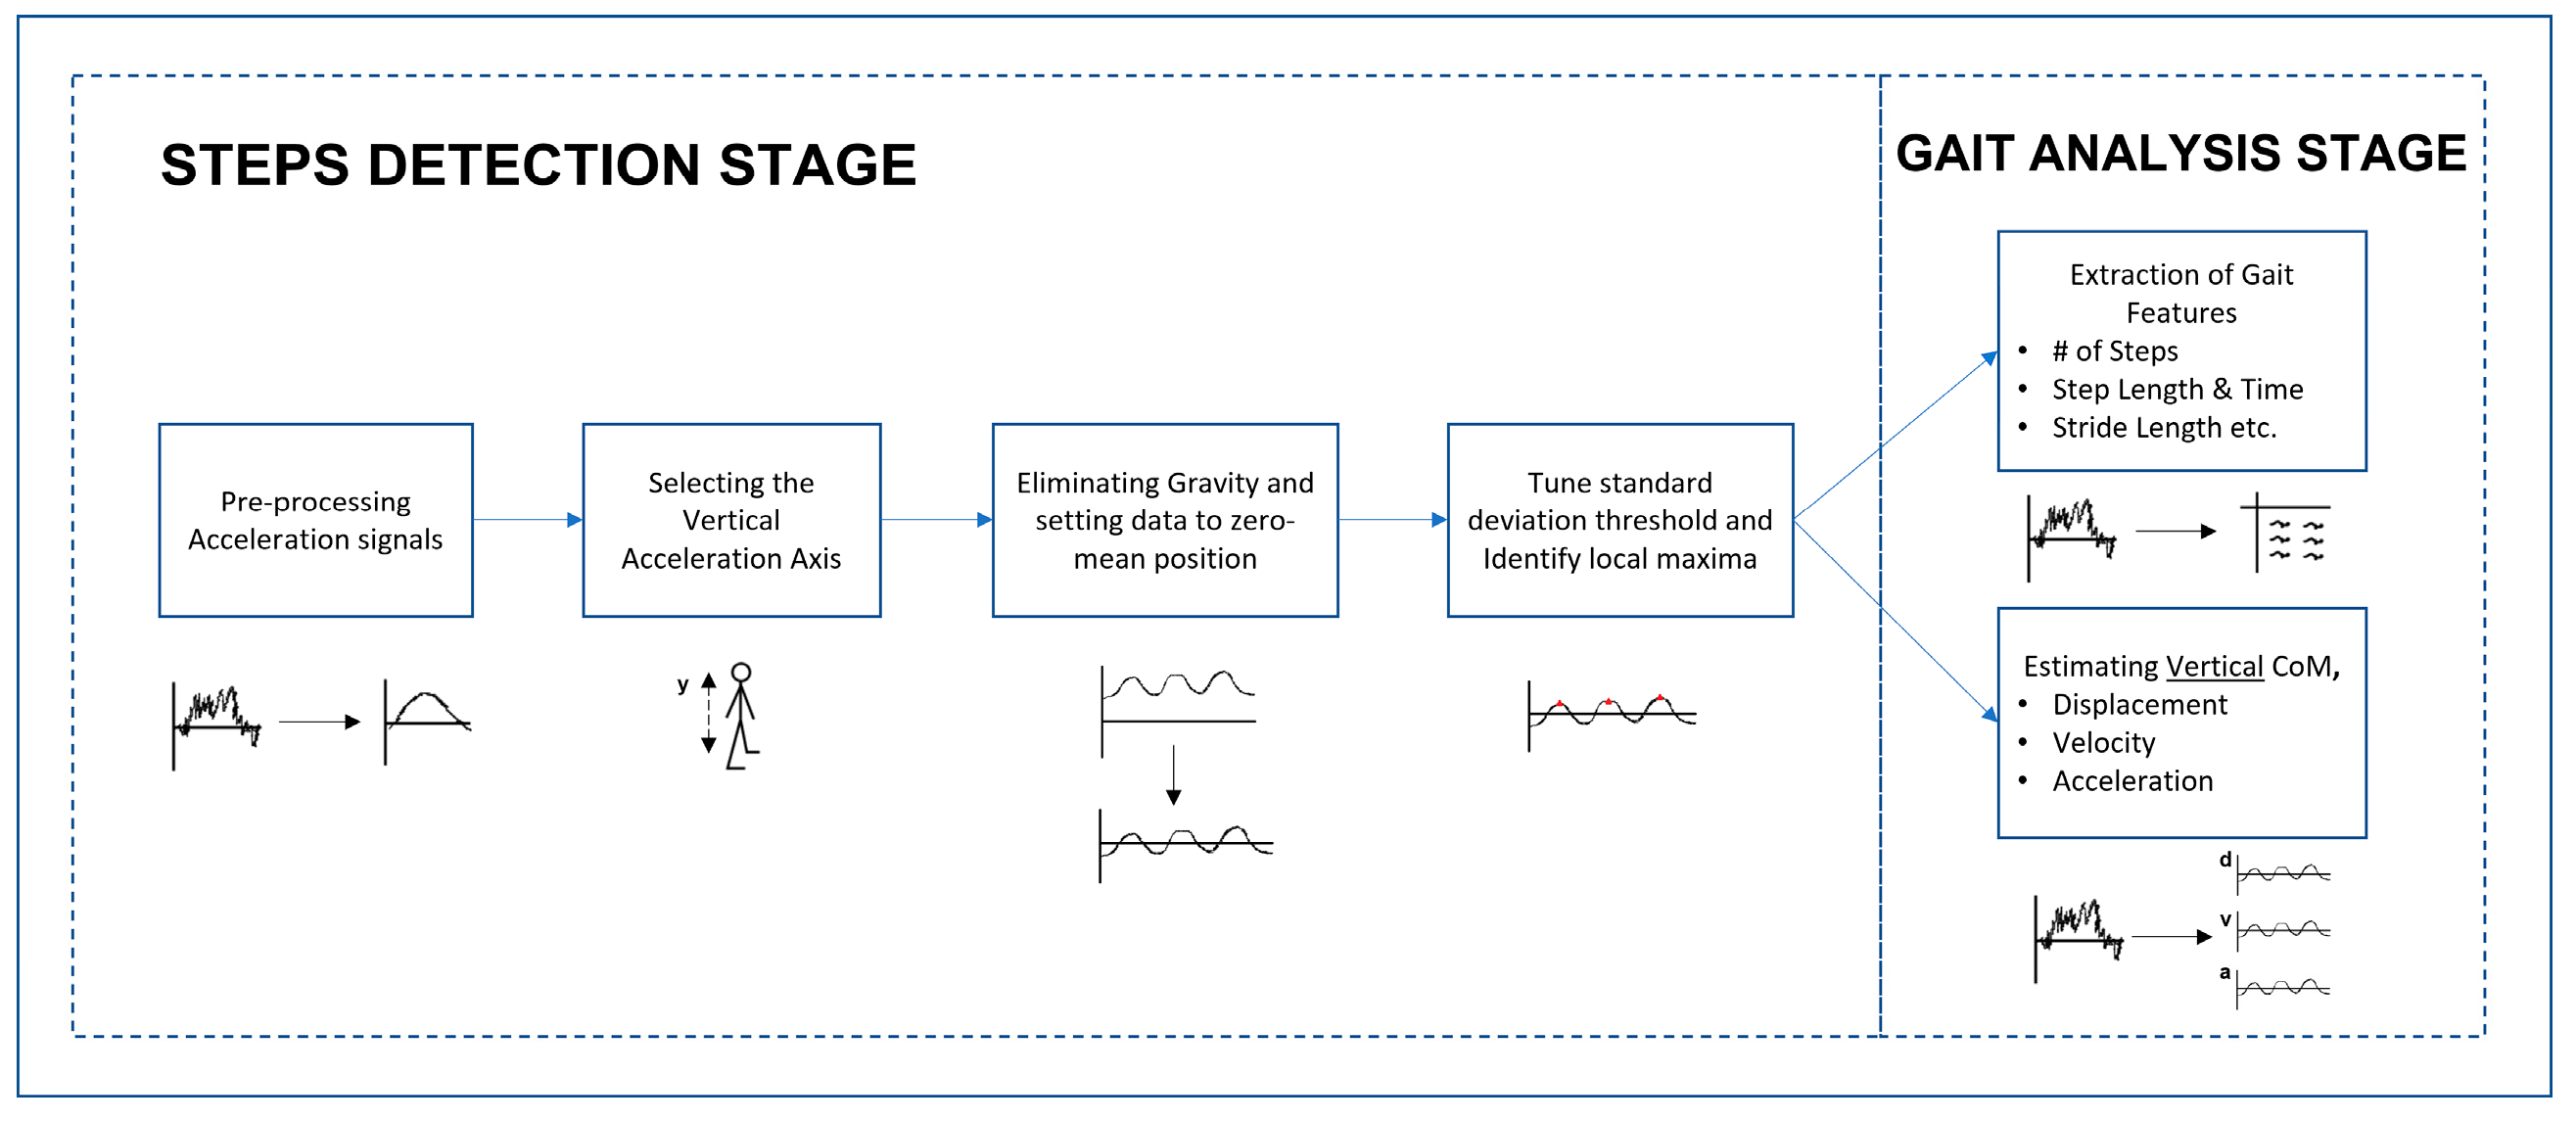
Figure 4.
The results of gait feature analysis can be seen in this plot. The X axis in the plot is the Time; the Y axis is the Vertical Acceleration. The blue trace is the vertical acceleration after low pass filtering and the heel contact events are indicated by the red triangles, steps that are taken while walking are corresponded to each peak.
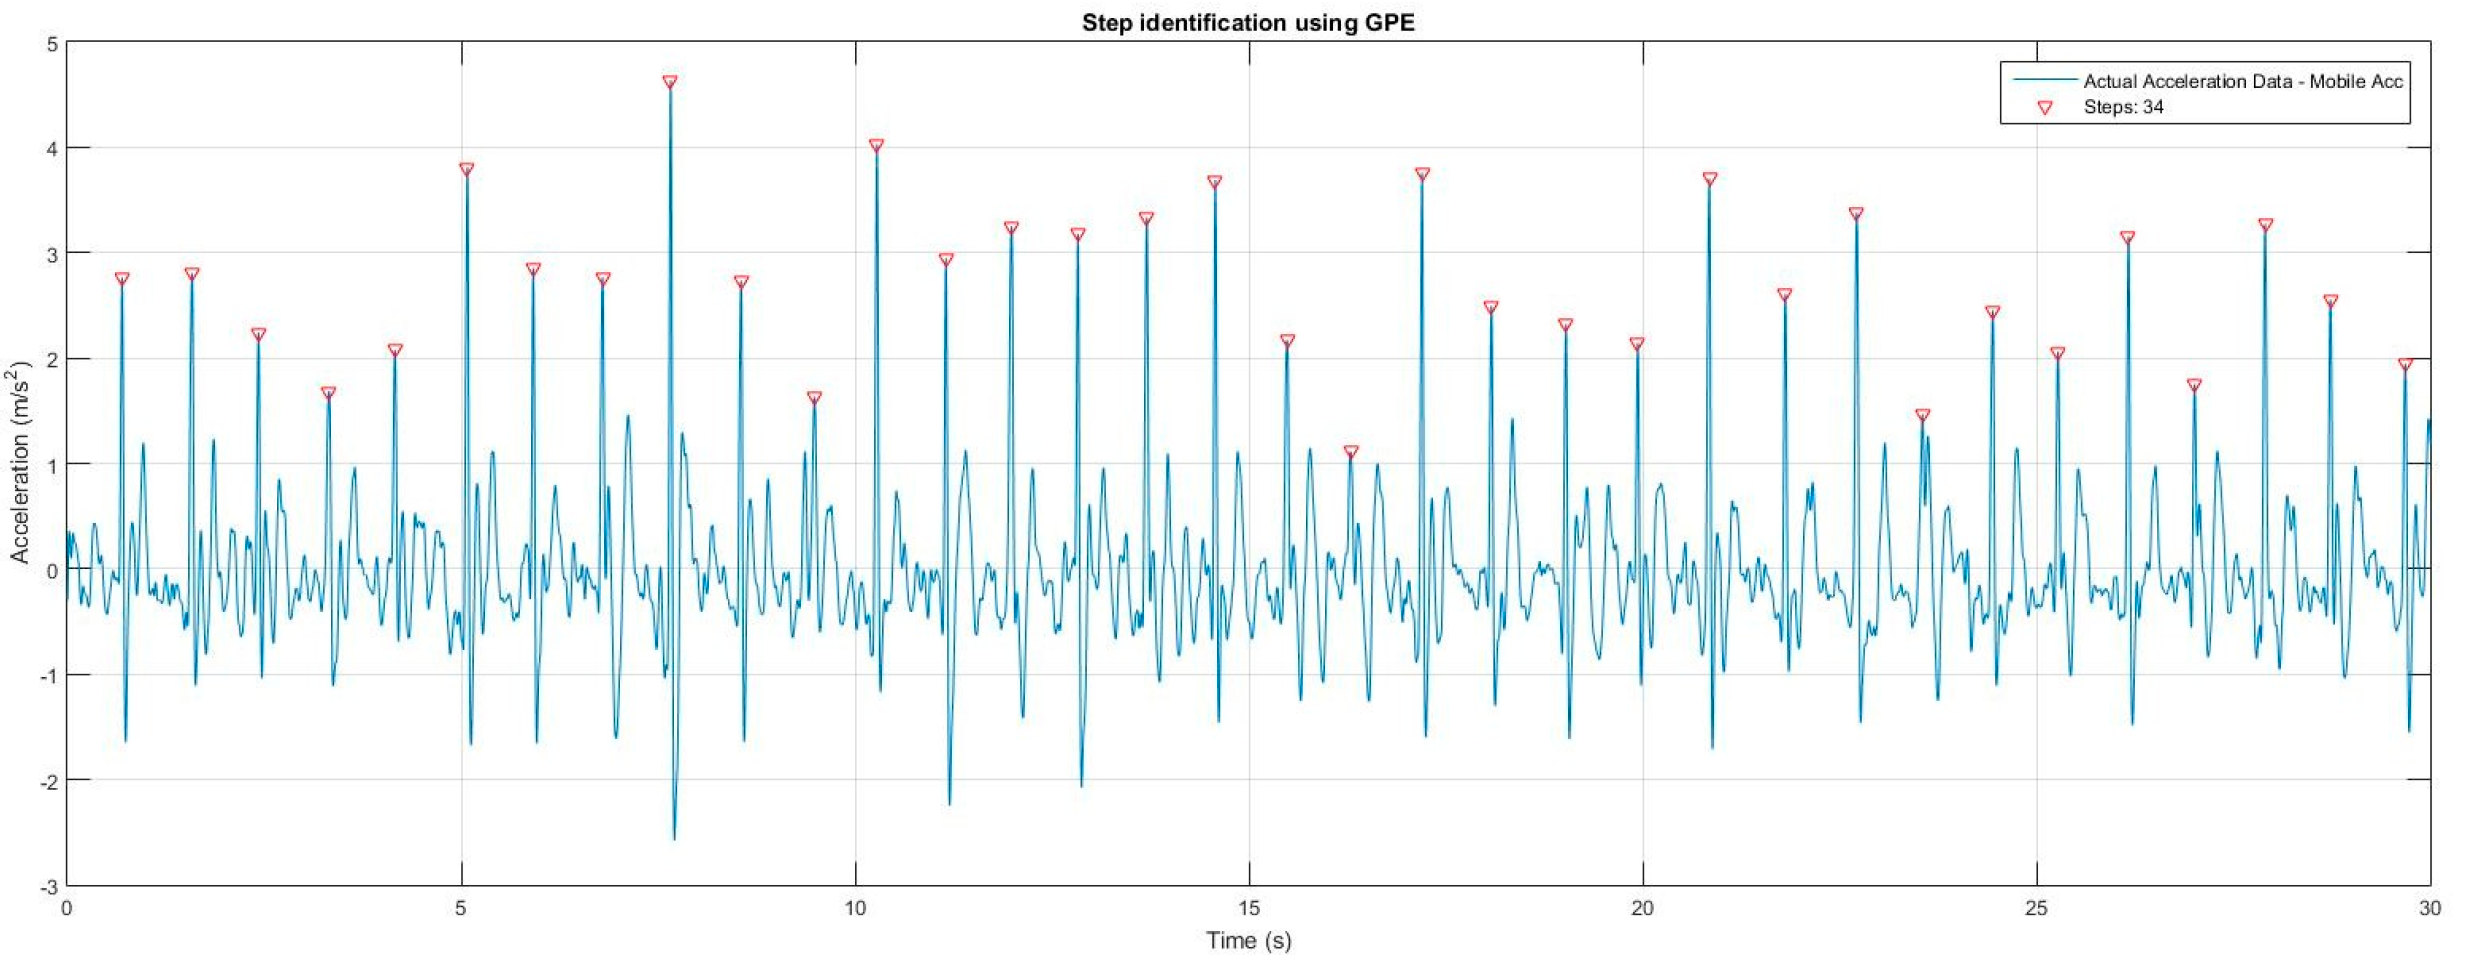
Figure 5.
Illustration of Trigonometric approach in determining Center of Mass (CoM) displacement while walking.
Figure 5.
Illustration of Trigonometric approach in determining Center of Mass (CoM) displacement while walking.
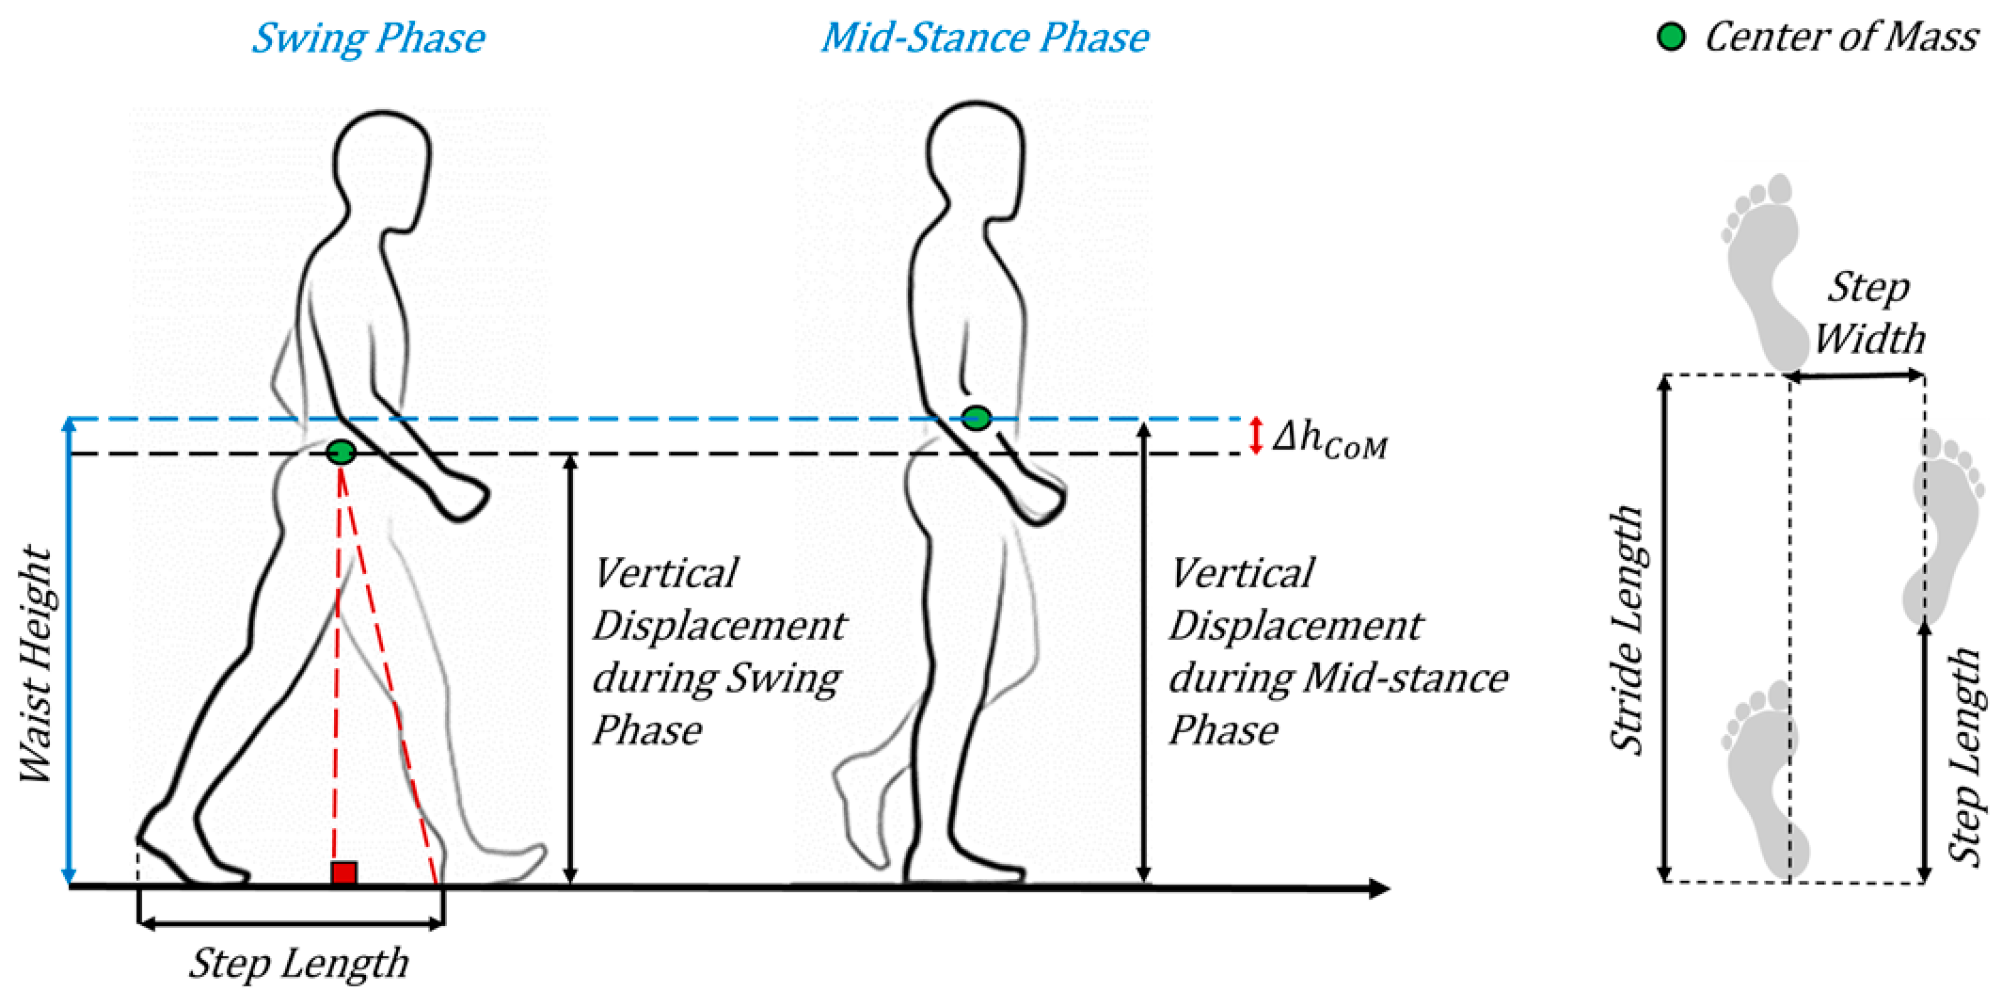
Figure 6.
Finding the vertical displacement through trigonometry using Waist Height and Step Length during the swing phase.
Figure 6.
Finding the vertical displacement through trigonometry using Waist Height and Step Length during the swing phase.
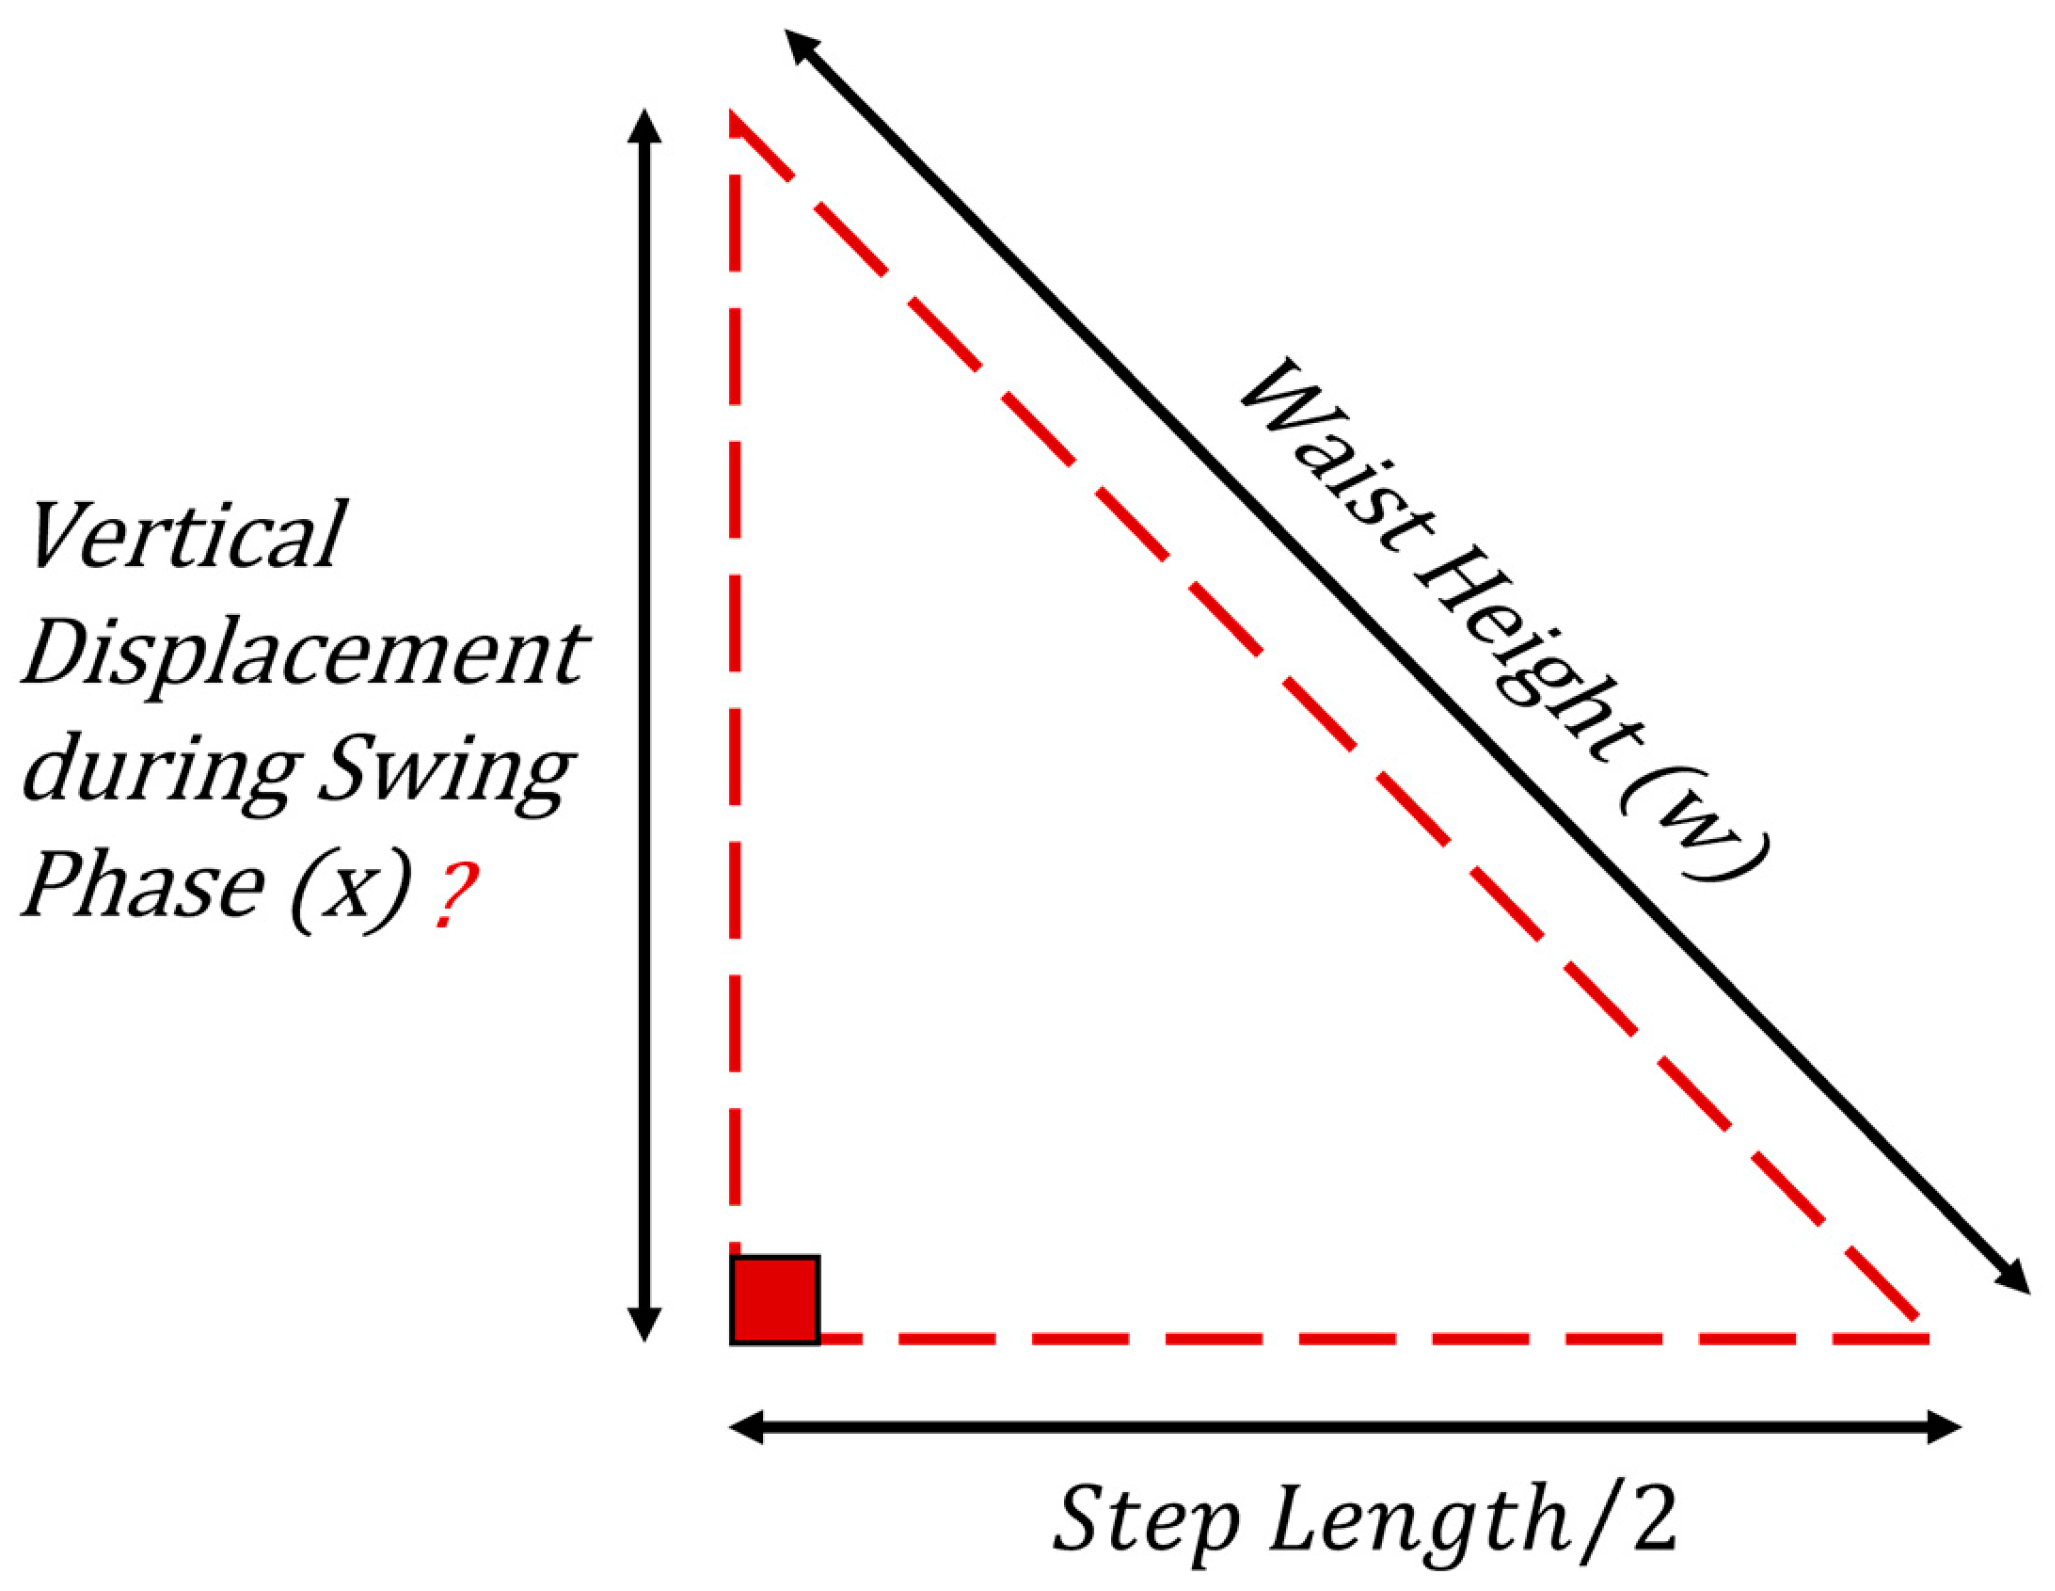
Figure 10.
Arduino MKR1000 Input signal processing flow diagram.
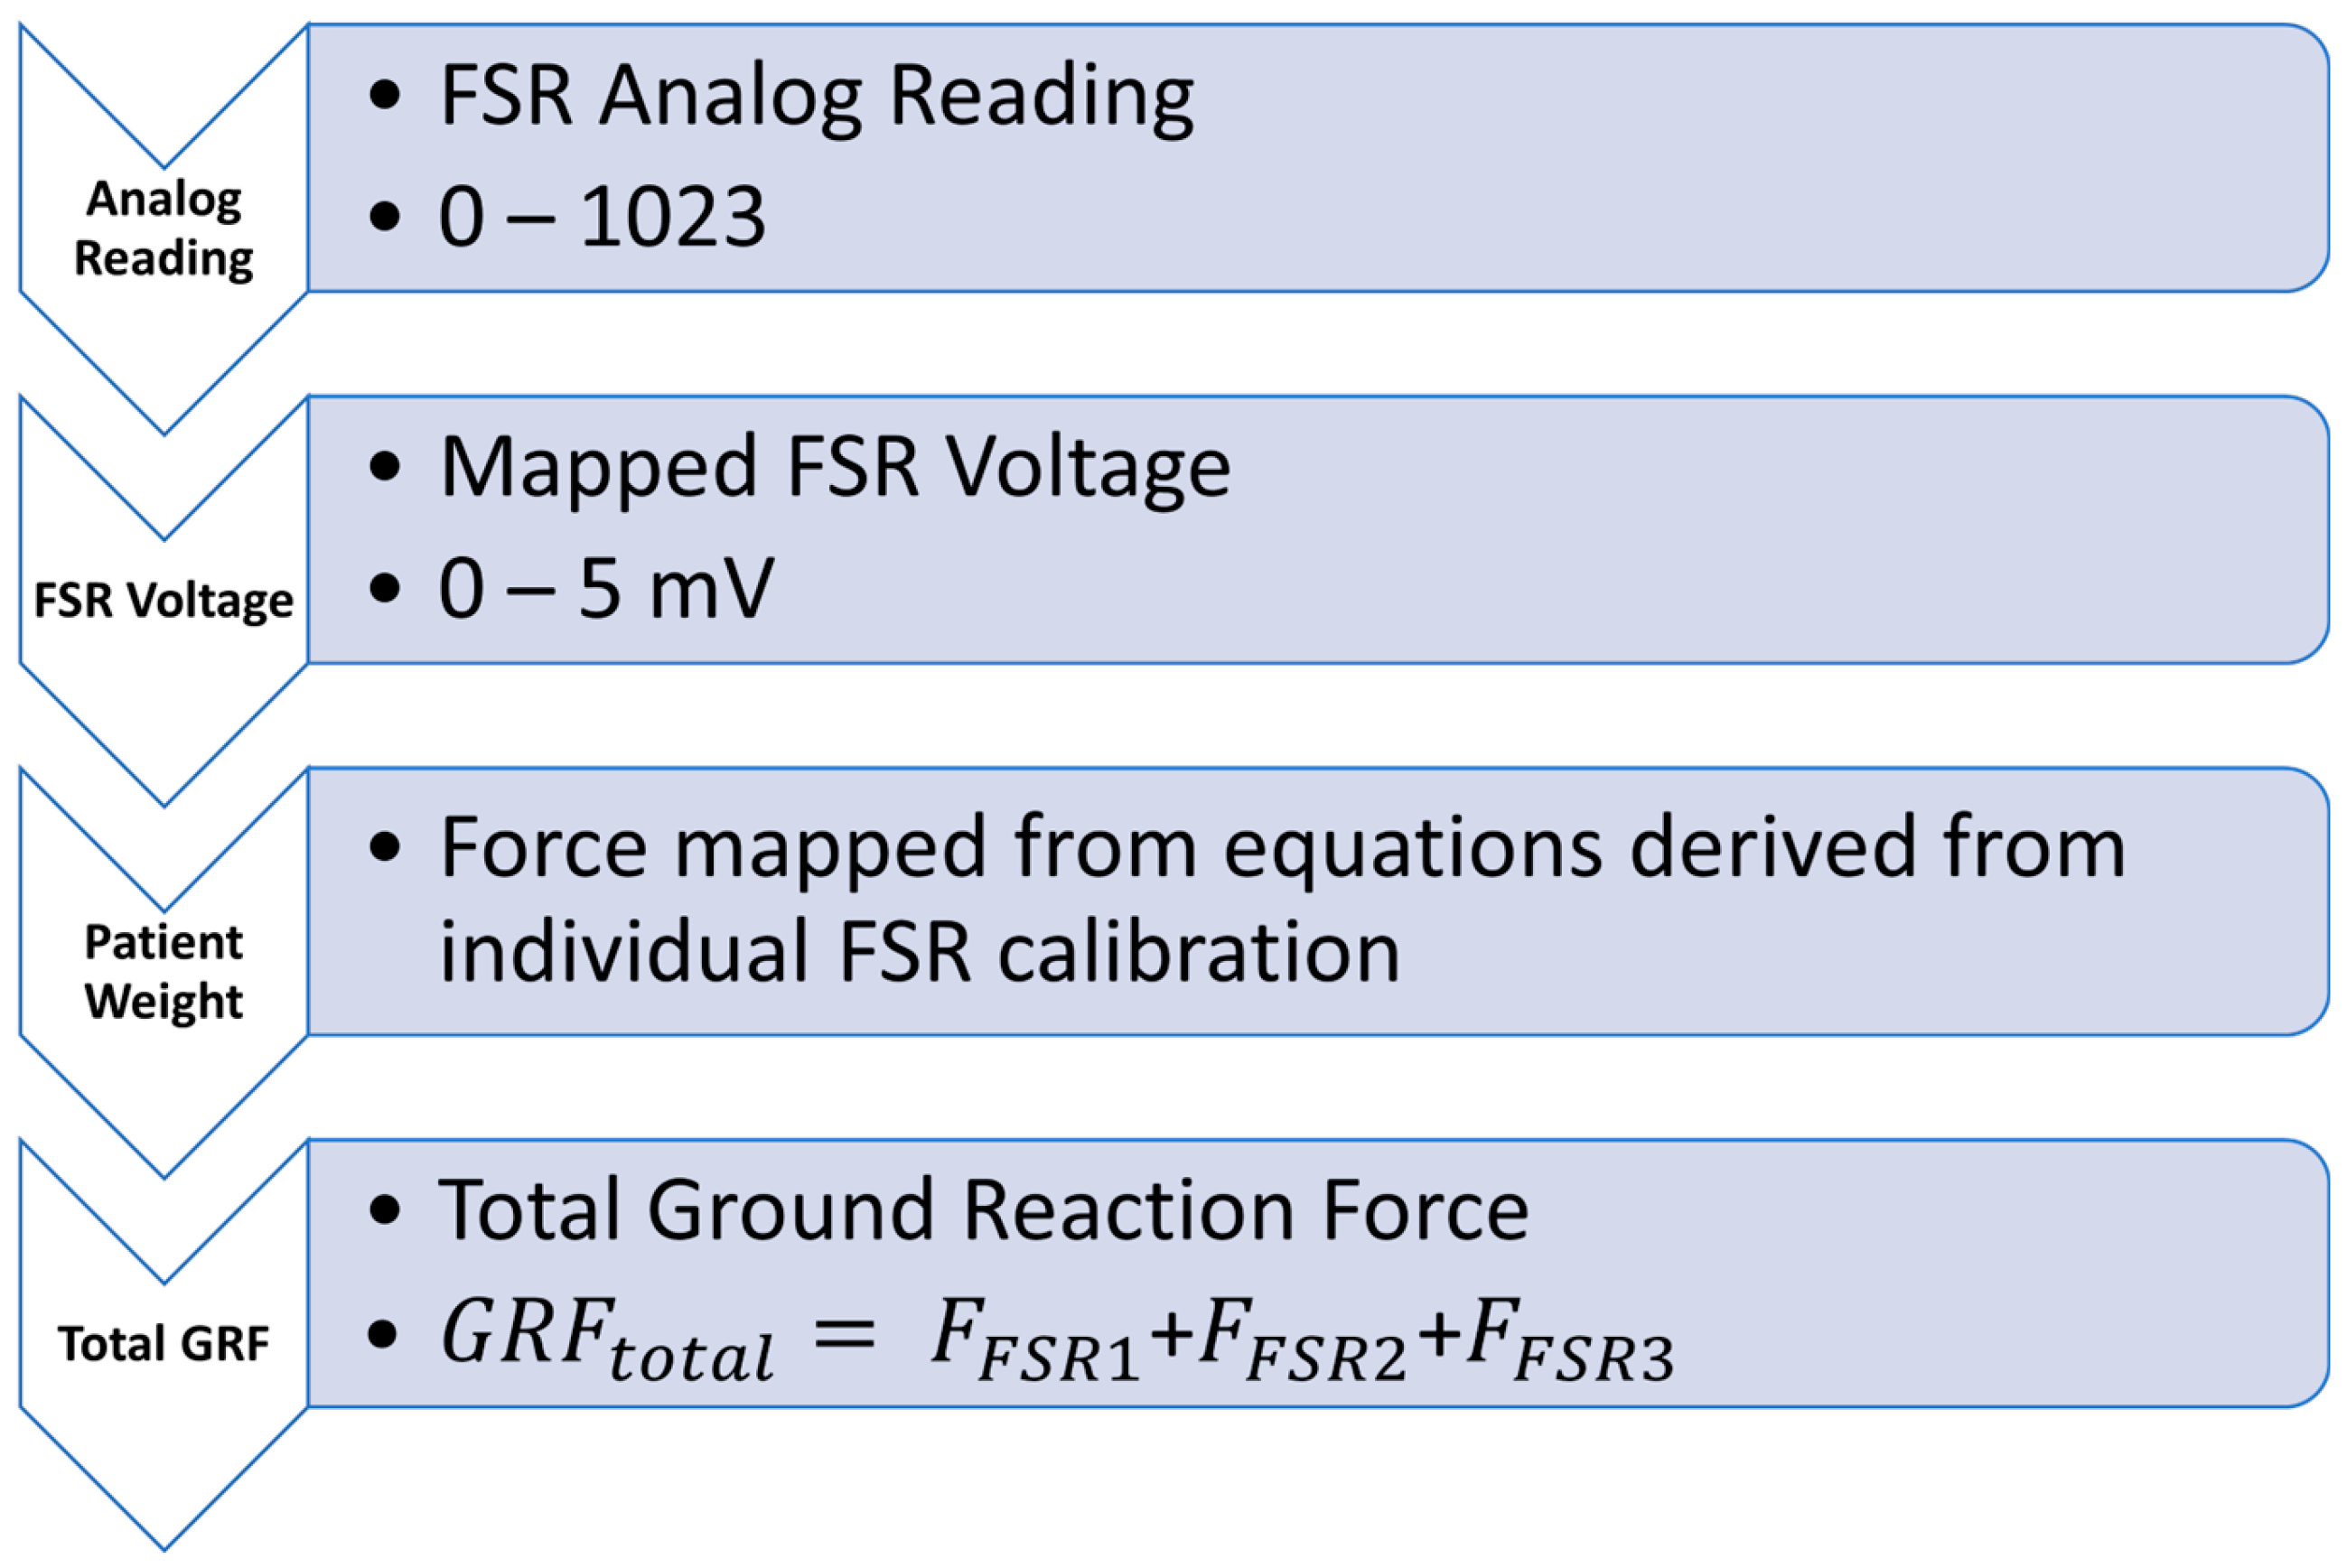
Figure 11.
Custom designed CNC block for static load application on FSR’s.
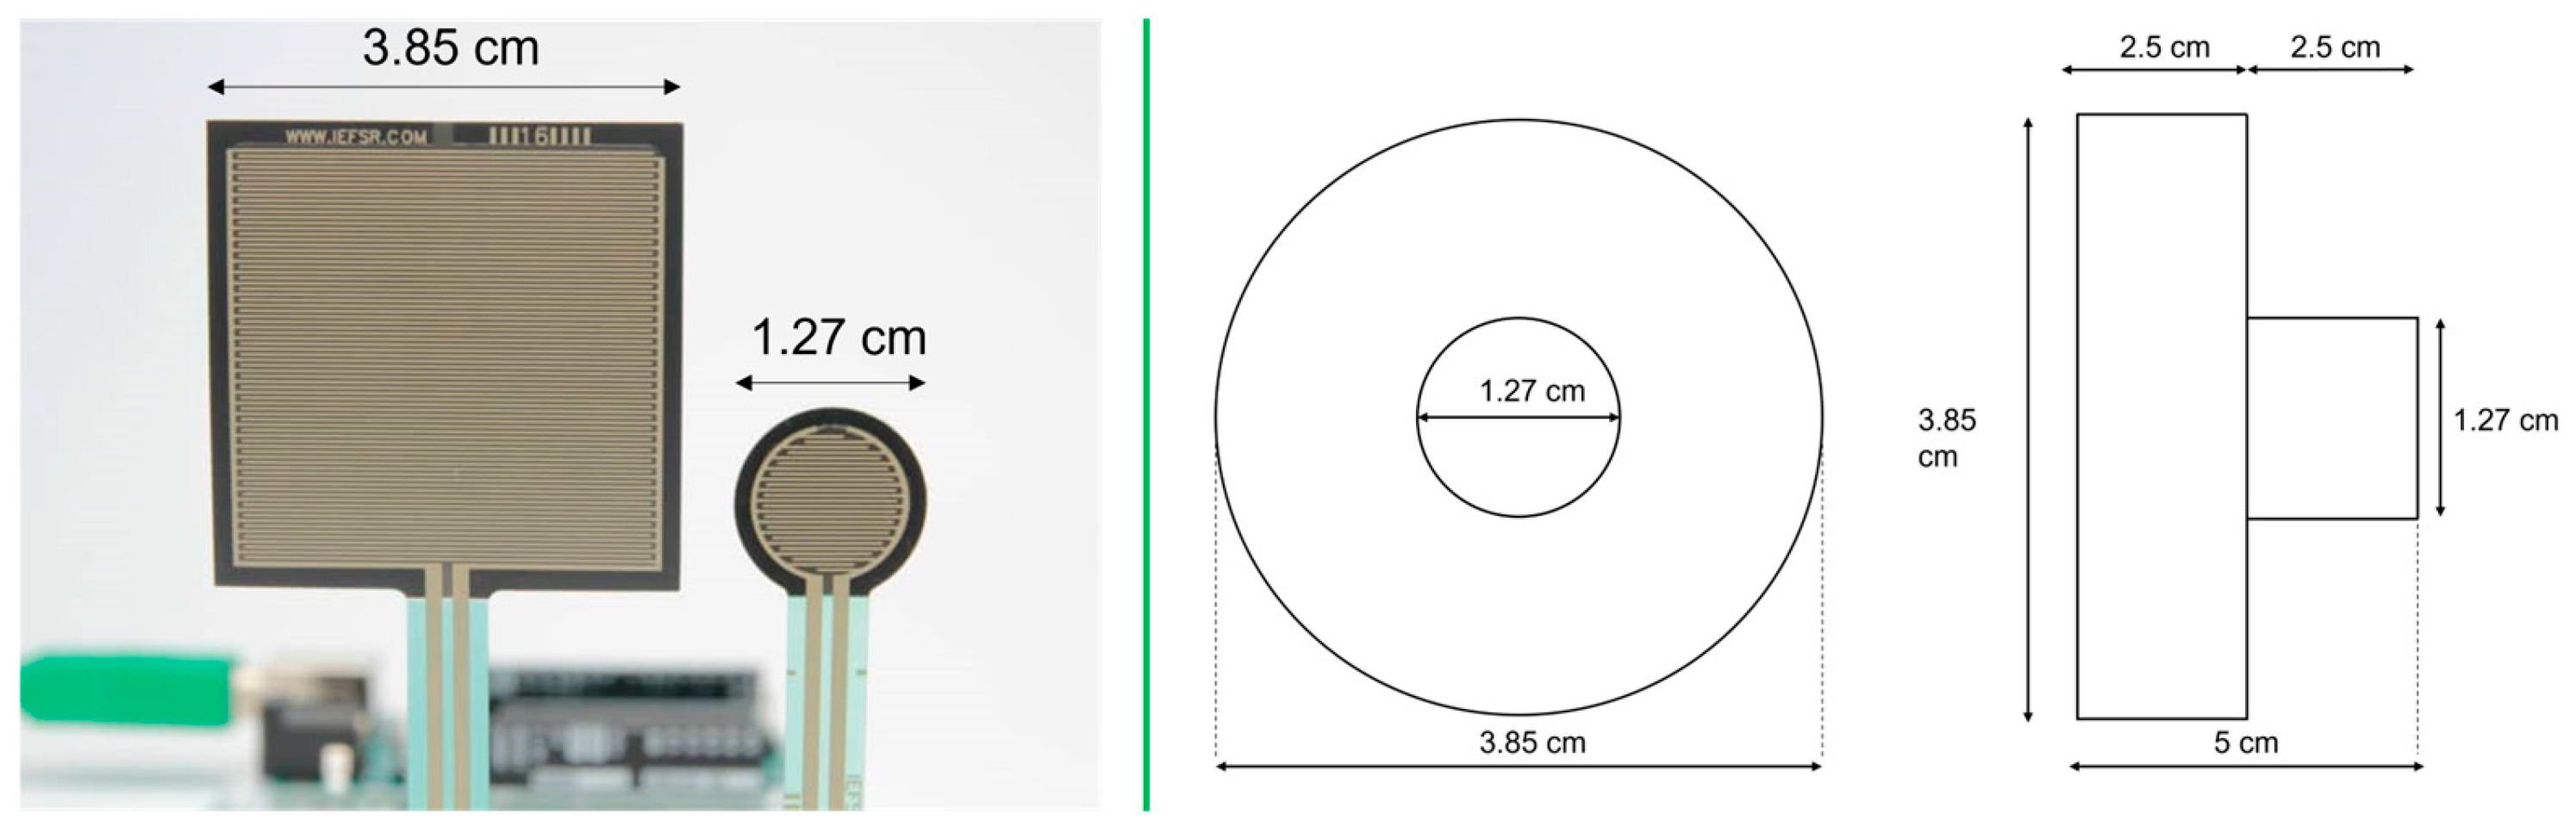
Figure 12.
FSR 402 Calibration curve.
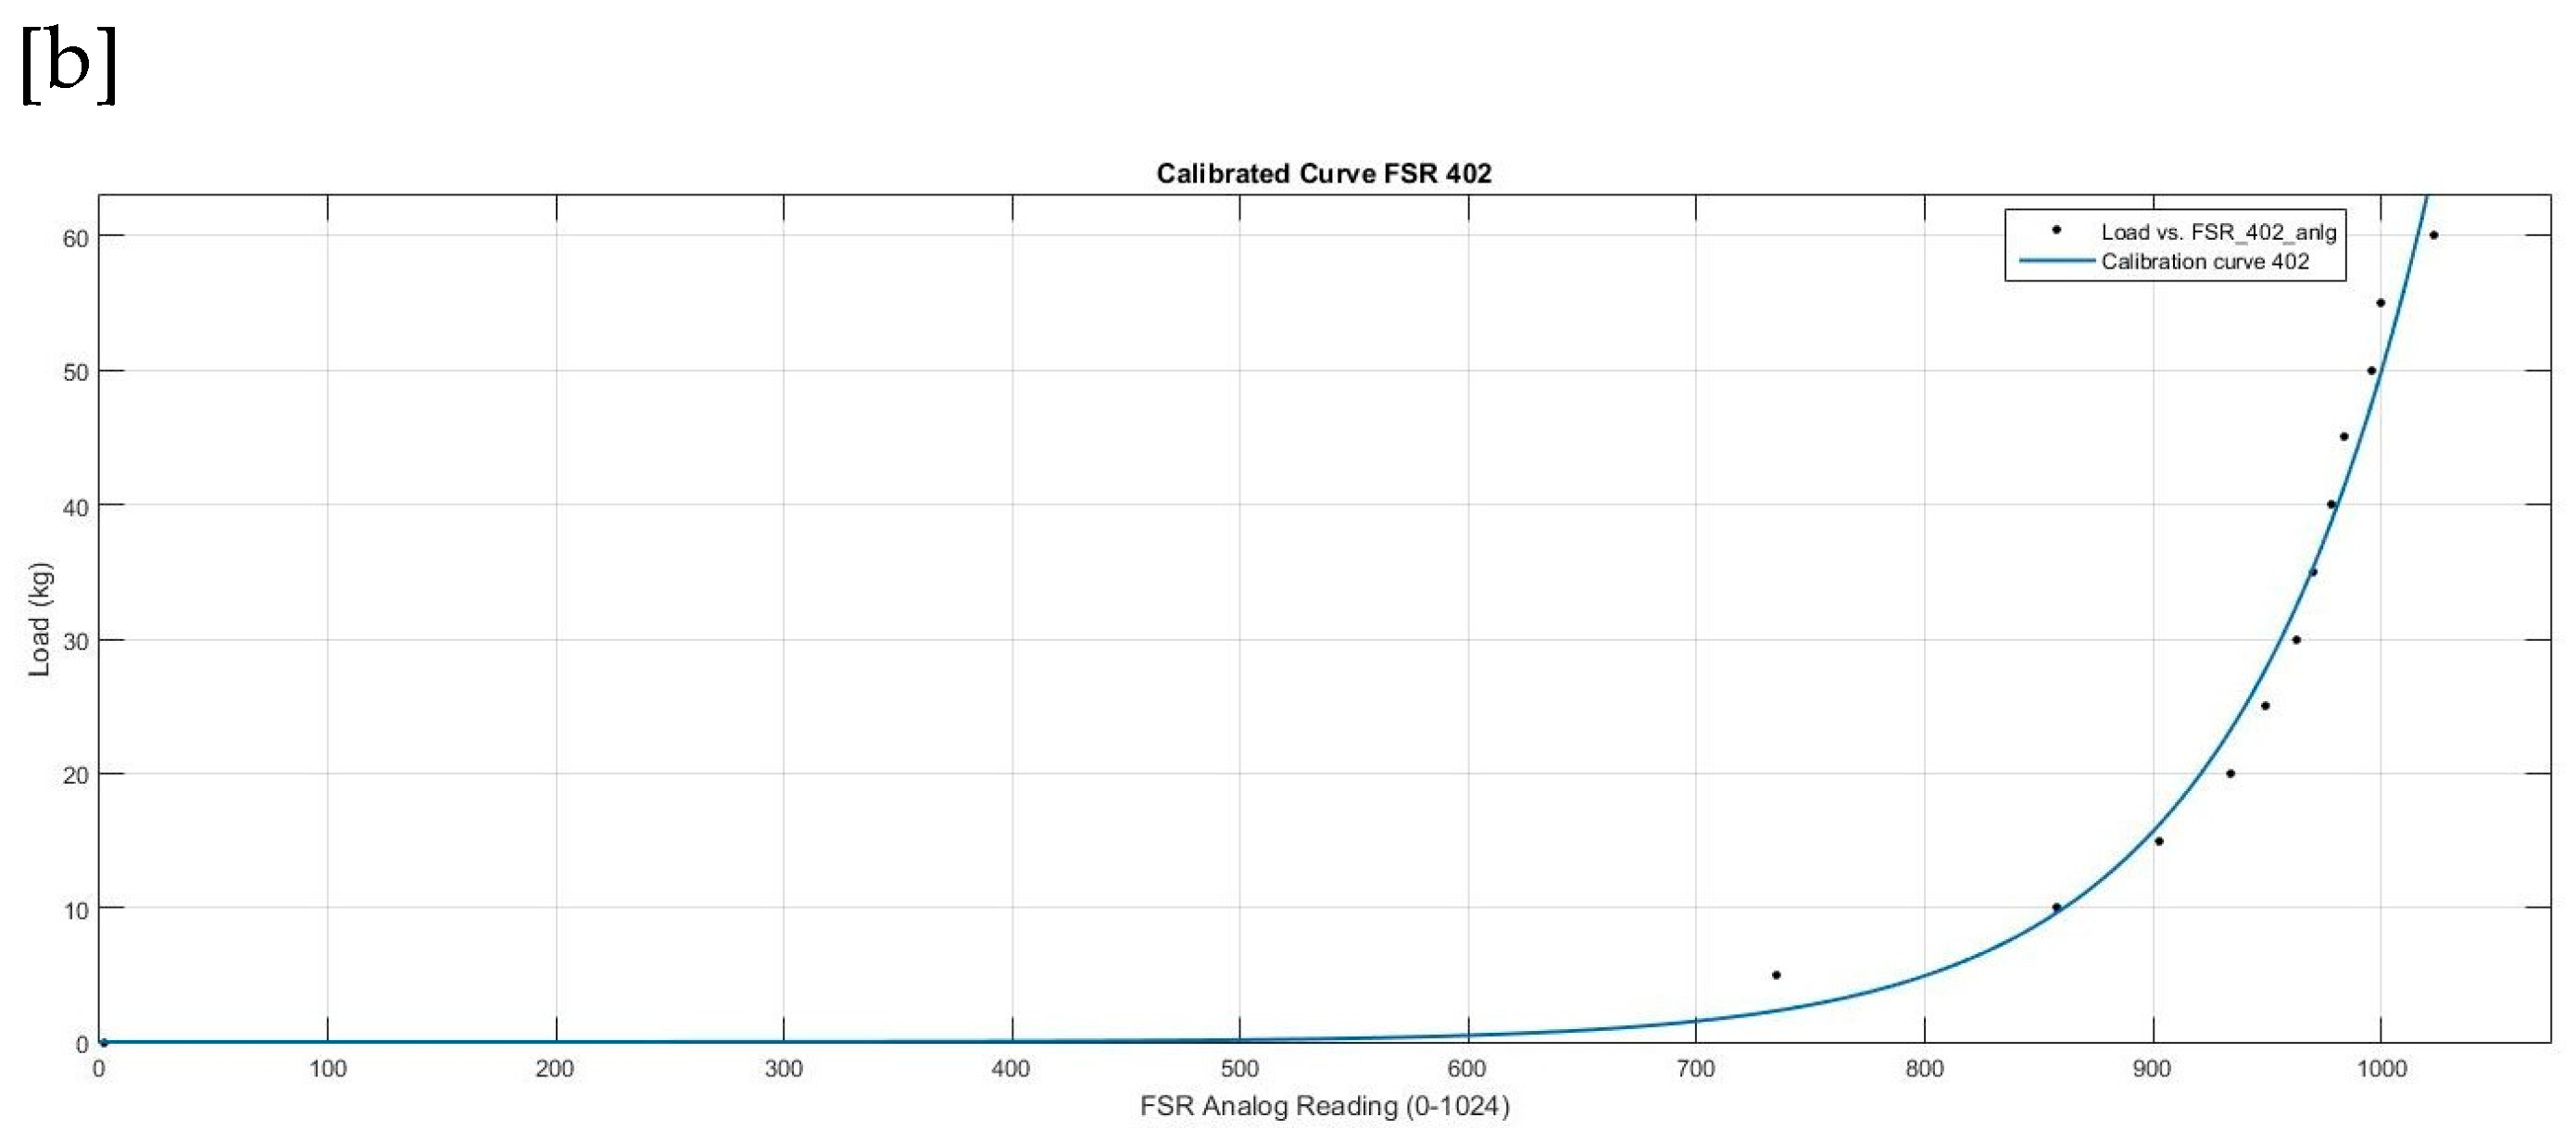
Table 2.
Step detection results through Gait Analysis on three test subjects.
| Volunteer | Walking Speed | Walking Time | Steps taken | Steps estimated - GPE | Error (steps) | Maximum Error: |
|---|---|---|---|---|---|---|
| 0.5 mph (0.223 m/s) | 72 | 71 | 1 | |||
| 1 | 0.75 mph (0.335 m/s) | 90 | 90 | 0 | ||
| 1 mph (0.447 m/s) | 99 | 98 | 1 | |||
| 0.5 mph | 57 | 57 | 0 | |||
| 2 | 0.75 mph | 60 seconds | 68 | 68 | 0 | 01 Step |
| 1 mph | 80 | 81 | -1 | |||
| 0.5 mph | 67 | 66 | 1 | |||
| 3 | 0.75 mph | 77 | 76 | 1 | ||
| 1 mph | 82 | 83 | -1 |
Table 3.
Comparing magnitudes of Inertial Forces extracted from Smartphone Accelerometric Data with IF’s estimated through GPE.
Table 3.
Comparing magnitudes of Inertial Forces extracted from Smartphone Accelerometric Data with IF’s estimated through GPE.
| Volunteer | Walking Speed | Mean Actual IF (N) | Mean Predicted IF (N) | Difference, (∆error)(N) | Corresponding Difference in Mass (kg) |
|---|---|---|---|---|---|
| 0.5 mph (0.223 m/s) | 18.25 | 9.26 | 8.99 | 0.917 | |
| 1 | 0.75 mph (0.335 m/s) | 26.94 | 17.19 | 9.75 | 1.00 |
| 1 mph (0.447 m/s) | 26.01 | 18.94 | 10.06 | 1.03 |
Table 4.
FSR post calibration results.
| Load Applied (kg) | Output Result (kg) | Difference (kg) |
|---|---|---|
| 0 | 0 | 0 |
| 5 | 6.7 | 1.7 |
| 10 | 12.9 | 2.9 |
| 15 | 16.3 | 1.3 |
| 20 | 21.9 | 1.9 |
| 25 | 24.4 | -0.6 |
| 30 | 34.8 | 4.8 |
| 35 | 40.4 | 5.4 |
| 40 | 45.8 | 5.8 |
| 45 | 49.4 | 4.4 |
| 50 | 53.9 | 3.9 |
| 55 | 56.2 | 1.2 |
| 60 | 58.8 | -1.2 |
Max error: 5.8. Min error: 1.2.
Disclaimer/Publisher’s Note: The statements, opinions and data contained in all publications are solely those of the individual author(s) and contributor(s) and not of MDPI and/or the editor(s). MDPI and/or the editor(s) disclaim responsibility for any injury to people or property resulting from any ideas, methods, instructions or products referred to in the content. |
© 2024 by the authors. Licensee MDPI, Basel, Switzerland. This article is an open access article distributed under the terms and conditions of the Creative Commons Attribution (CC BY) license (http://creativecommons.org/licenses/by/4.0/).
Copyright: This open access article is published under a Creative Commons CC BY 4.0 license, which permit the free download, distribution, and reuse, provided that the author and preprint are cited in any reuse.


