
Submitted:
19 November 2024
Posted:
20 November 2024
You are already at the latest version
Abstract
This investigation presents the mechanical and tribological behaviors of DIN 1.2344 and WP7V tool steels, quenched in a salt bath after an austenitization of 1050 °C, followed by a triple tempering for 2 hours. Mechanical properties were evaluated using Rockwell C, Vickers, and nanoindentation, besides unnotched impact tests, according to the SEP 1314 guidelines. The wear tests were conducted in a tribometer configured for a reciprocating setup, with a frequency of 5 Hz, load of 25 N, and time of 60 minutes, at room temperature and 200 °C. As counterbodies, alumina balls of 5 mm in diameter were used. The wear tracks were evaluated through scanning electron microscopy, EDS, interferometry, and Raman spectroscopy. Friction and wear behaviors were affected by the variation in temperature testing for softer steels, the higher the temperature, the better the tribological performance. The harder steels were not sensitive to the temperature testing. These effects depend on maintaining iron oxide (hematite) at the contact.
Keywords:
Tool Steel
; Reciprocating
; Tribology
1. Introduction
The development of new classes of steels used as hot stamping tools in Germany and Europe was due to the DIN 1.2344 and DIN 1.22367 steel performances were not sufficient in terms of wear resistance. In this fashion, WP7V steel, widely used by the largest hot stamping companies in Germany and Europe, deserves to pay attention.
The service life of tools used for hot stamping and cutting is not just a question of wear resistance and resistance to thermal fatigue. There are other requirements to be met that vary from tool to tool, since in addition to offering high hardness and good wear resistance, they must also have sufficient toughness to prevent cracking due to thermal and mechanical overloads [1].
Tool steels' properties can be improved by controlling quenching heat treatment, with austenitizing temperatures of 1000 °C to 1060 °C. Subsequent tempering produces large changes in the microstructure and enables a wide range of properties to be achieved. Heat treatment is used not only to increase hardness but also to increase strength and toughness [2].
A comparison between DIN 1.2344, DIN 1.2367, and WP7V steels was presented in the study by Escher and Wilzer [1]. The DIN 1.2344 tool steel is the most widely used globally for processes such as forging and hot extrusion of steel as well as hot extrusion of aluminum and hot stamping tooling. It presents a combination of high toughness, good mechanical resistance, hot wear, and lower costs. About DIN 1.2344, DIN 1.2367 steel has a lower content of carbon, vanadium, and silicon and a higher content of molybdenum, giving it superior hot mechanical resistance and together with its good toughness and thermal conductivity ends up generating an exceptional resistance to thermal fatigue, very important in tooling for aluminum injection, hot forging of steels as well as an alternative to DIN 1.2344 in hot stamping tooling. WP7V has a much higher carbon, chromium, and vanadium content than the others and should have lower impact toughness and thermal conductivity than the other two steels, but superior wear resistance.
Adhesive and abrasive wear are generally the wear mechanisms that limit tool life in dry metal forming operations. Therefore, production experience in tool steel and coating combinations, as well as experimentation, are the means to select the optimum tool steel for the application [3].
In a study by Hardell and Prakash [4] presenting sliding tests of tool steels against high-strength steel using temperatures of 40, 400, and 800 °C, they observed from the results that friction and wear of the pairs are temperature dependent. Friction decreased, while tool steel wear increased with increasing temperature.
Gracia-Escosa et al. [5] observed oxidative wear mechanisms during the pin-on-disc test in addition to adhesion and abrasion. Abrasive wear is probably caused by the formation and fracture of oxides at high temperatures.
Cui et al. [6] performed wear tests on AISI H13 steel heat-treated with different tempering temperatures. The tests were carried out at room temperature, 200 °C and 400 °C. As results considered, the wear rate at 200 °C was substantially lower than at room temperature and 400 °C, attributed to the protection of tribo-oxides. At room temperature, only a little oxide appeared on the worn surfaces. At a temperature of 200 °C, the predominant tribo-oxides are Fe3O4 and Fe2O3.
Hardell et al. [7] observed in their studies that the results of sliding wear tests showed a reduction in wear by three orders of magnitude and in friction by 50% when the temperature was increased from room temperature to 400 °C. This was attributed to forming a composite layer involving a hardened layer and a protective oxide layer. Reciprocating sliding facilitated the formation of a continuous oxide layer on both interacting surfaces compared to unidirectional sliding.
Considering the relevance of oxide role in the tribological behavior of tool steels at high-temperatures, we investigate the tribological behavior of tool steels usually employed for hot stamping dies, in a reciprocating sliding test at room temperature and 200 °C. For comparative purposes, two levels of hardness were investigated.
2. Materials and Methods
2.1. Tool Steels
Two kinds of tool steel, DIN 1.2344 (X40CrMoV5-1) and WP7V, were investigated, supplied in blank form with dimensions of 55 mm x 240 mm x 250 mm and 55 mm x 200 mm x 325 mm, respectively, and machined in the dimensions of 36 mm x19 mm x 8 mm. The wear surface was ground with Sa ≤ 0.23 µm.
The chemical composition of steels (Table 1) was determined using a Bruker Tasman spectrometer, according to ASTM E415 [8].
The tool steel samples were quenched using a salt bath at Angra Tecnologia em Materiais, from 1050 °C for 20 minutes as an autenitization step. After quenching, 3 cycles of tempering were performed for 2 hours, obtaining hardness and microhardness values, according to Table 2.
The microstructure of heat-treated steels is shown in Figure 1. The presence of tempered martensite with small amounts of carbides is observed. Similar features were presented elsewhere for AISI H13 steel [6] and DIN 1.2346 steel [9].
Nanohardness measurements were also performed. The measurements occurred randomly in the central region of the sample, corresponding to the wear tracks. For the instrumented indentation technique, a universal nanomechanical testing equipment ZHN from Zwick/Roell (Zwick/Roell, Ulm, Germany) was used. In this test, a Berkovich-type pyramidal indenter was used, with a load of 50 mN in a 5 x 6 matrix with a spacing of 30 µm x 30 µm.
Figure 2 shows that within the indentation matrix, random measurements were detected, indicating the presence of carbides on the microstructure of the WP7V steel samples of 48.5 and 54 HRC. The found values of 15.7 and 16.7 GPa, respectively, fall within the range of those reported by Casellas et al [10] for M7C3 stoichiometry, meaning that probably we measured this kind of carbide also.
Another relevant aspect from Figure 2 is that the metallic matrix hardness values of 1.2344 and WP7V steels treated for a low hardness level are similar, allowing the comparison of WP7V with a reference material.
2.2. Impact Test
For the impact tests, unnotched 10±0.1 x 55±1 x 7±0.1 mm samples were prepared according to SEP 1314 (Stahl-Eisen-Prüfblatt SEP 1314- April 1990). The contact surface with the impact hammer was ground for Ra ≤ 0.2µm. All samples were prepared following the same cutting orientation. The impact test was performed on the Time 800 J testing machine. The fractured surfaces were analyzed in a scanning electron microscope (Zeiss EVO-MA15, Oberkochen, Germany) to verify the predominant fracture mode.
Table 3 presents the results of the impact test. The results are within the expectation: the higher the hardness, the lower the absorbed impact energy.
Figure 3 shows the fractographies of unnotched samples.
Figure 3 shows the fracture aspects characterized as mixed, with proportions between semi-cleavage and micro-cavities, besides transgranular aspects. The variation in hardness from 48.5 to 57 HRC had little effect on the impact behavior of WP7V steel, both in the predominance of fracture aspects and the average impact resistance values. Mixed fracture is frequently reported in the literature for AISI H13 steel (1.2344), and the works of [2, 11-14] can be cited.
It is worth noting the much higher deviation for the conditions of 48.5 and 54 HRC, which may be related to variations along the extraction sections of the test specimens. It is possible to state that there is a greater presence of micro-cavities for the hardness of 54 HRC, while in the case of the condition of 57 HRC, a significant number of facets that characterize the transgranular fracture are present.
About DIN 1.2344 and WP7V steels for the lower hardness range, DIN 1.2344 steel presented an impact resistance of approximately 2.6 times greater than WP7V steel.
2.3. Tribological Experiments
The tribological tests were performed in reciprocating mode, under dry conditions, using the UMT Multi-Specimen Test System tribometer, model CETR, from the manufacturer Bruker (Bruker, Campbell, USA). The equipment used a load cell with a load capacity of 2 to 200 N and a resolution of 10 mN. A support with a long hollow shaft that extends into the chamber is used to fix the ball. The shaft restricts the heat transfer from the ball to the load cell. The load cell is also protected by a heat sink mounted between the support and the cell. The average values of the coefficient of friction (COF) were measured and acquired through the equipment software.
The testing conditions were a frequency of 5 Hz, testing time of 60 minutes, load of 25 N, and temperature of 200 °C, in addition to room temperature (RT). Alumina balls (Al2O3) with 5 mm diameter were used as counterbodies.
The samples were ultrasonically cleaned in hexane and isopropyl alcohol and dried before testing.
For the room and high-temperature tests, a chamber was used, which is part of a drive/chamber combination of the equipment. It is mounted on the linear reciprocating drive structure. A heating element and a temperature sensor are located inside the chamber. A temperature controller uses the output of the temperature sensor to control the chamber temperature. The chamber has an access slot in the top cover to allow the attachment of the sample, held in place by two pins, to a load cell.
The high-temperature tests involved an initial heating sequence of each sample lasting approximately 17 minutes. The test was only performed after reaching the selected temperature.
The specific wear rate (SWR) was determined based on the measured wear volume of the worn tracks. The width, depth, and area of the worn tracks (Figure 4) were measured using a non-contact white light 3D profilometer, model Talysurf CCI Lite Non-contact 3D Profilometer (Taylor Hobson, Leicester, UK).
The specific wear rate (SWR) was calculated using equations (1) and (2) according to ASTM G133-05 [15].
The total sliding distance (L) is given by equation 2.
Where f is the frequency in Hz, t is the total sliding duration in sec, and l is the stroke length in mm.
After tribological tests, the worn surfaces were characterized using a scanning electron microscope, 3D profilometer, and Raman microscopy. Raman spectroscopy were performed on a WITec alpha 300R Confocal Raman Microscope (WITec, Ulm, Germany) with a lateral resolution of 200 nm and a vertical resolution of 500 nm.
3. Results and Discussion
3.1. Friction and Wear Determination
Figure 5 shows the behavior of the coefficient of friction (COF) for each test condition. The average COF was calculated by running 3 tests, considering only the stable region of the curve, i.e., removing the running-in region, and is presented in Table 4.
The results show that in the tests with the softest steels, the increase in the test temperature reduced the COF values. A peak in the COF signal was observed for the tests conducted at RT. On the other hand, harder steels were not sensitive to the effect of temperature.
Through interferometry analysis, the width of the wear tracks was measured and presented in Table 5.
Figure 6 shows the specific wear rate (SWR) for the tests at RT and 200 °C.
Looking at Figure 6, the wear rates can be separated as a function of hardness level. This fact is more evident for tests performed at room temperature. Even though, for tests conducted at 200 °C the harder steels (54/57 HRC) performed better than the softer ones. Comparing the effect of temperature, the softer steels were more sensitive to this testing variable, and one can say the harder steels were practically insensitive to the temperature variation. Figure 7 and Figure 8 illustrate the SEM analysis of the wear tracks in the tests at room temperature and 200 °C.
Figure 7 shows the predominance of adhesive wear, in addition to the presence of abrasive and oxidative wear. On the other hand, Figure 8 presents the predominance of adhesive and abrasive wear.
Figure 9 and Figure 10 show the SEM/EDS analyses of the wear tracks, evidencing the presence of oxides in all wear tracks, corroborated by the Raman spectroscopy analysis.
In the wear tracks of Figure 9 and Figure 10, the presence of an oxide layer is observed, with a darker contrast in the SEM images, with distinct characteristics for the test conditions and hardness, as can be seen through the EDS analyses by mapping O and Fe at the indicated points. An oxide tribolayer formed from oxidized wear debris of the tool steel stands out mainly in the test conditions with hardnesses of 54 and 57 HRC at a temperature of 200 °C. This fact was observed by Macêdo et al. [16] in their study. Another condition verified is the presence of Al, probably detached from the alumina balls, observed for all the tracks of the tests at room temperature. On the opposite, any trace of this element was detected after tests performed at 200 °C.
Figure 11 presents the Raman spectra for the worn surfaces of WP7V steel.
In Figure 11, bands located around 221, 287, 390, 504, 604, and 658 cm-1 are identified, which correspond to the vibrational modes related to hematite (Fe2O3), a condition also verified elsewhere [17-20]. No difference was observed in changing the temperature of tests.
3.2. Ball Wear Characterization
Figure 12 and Figure 13 show the images of the wear ball caps of the samples in the tests at room temperature and at a temperature of 200 °C, respectively.
The largest diameter measured in Figure 12 was for the ball used against the DIN 1.2344 steel test. The smallest one was that of WP7V steel with 54 HRC. The diameter values follow the same trend as the wear rate behavior for the test conditions at room temperature.
Practically, there is no variation in the measured diameter of worn balls after tests performed at 200 °C, which agrees with the less variation in the wear rates of tool steels. The transfer of material from the tool steels, represented by the lighter tone of the images, to the respective test ball can also be observed in all conditions studied. For the tests at a temperature of 200 °C, there is a lower transfer represented by the greater incidence of dark tones.
Figure 14 and Figure 15 show the SEM/EDS analyses of the worn balls, after room temperature and 200 °C tests, respectively.
In Figure 14 practically all analyzed points contain oxygen, showing that iron oxide was predominant. However, darker areas are composed by the presence of aluminum, and they were noted with more intensity after tests against lower tool steels. On the other hand, in Figure 15 these darker areas are observed with much more frequency for all tested conditions. These observations will be crucial for describing the role of oxides on the tribological performance of tool steels.
3.3. Discussion
The selection of a temperature of 200 °C for conducting the reciprocating sliding tests was based on the most probable temperature of surface dies during the hot stamping processing [21]. However, when one desires to reduce the real system to a lab scale, it is imperative to consider the possibility of reaching high flash temperatures during the lab tests. An impressive attempt to reproduce the wear mechanisms at high temperatures from real to lab scale was due by Milan et al. [22]. They found that the oxidative mechanisms were only reached in the lab-scale if the tests were conducted at room temperature, it was impossible to see similar mechanisms when the same temperature of hot rolling milling was employed at the lab test.
In this fashion, it is very important to check the behaviors of tool steels here as a function of the testing temperature. Figure 16 summarizes these effects depending on the hardness level. Both friction and wear decreased when tests were conducted at 200 °C for softer steels. An unlike behavior was determined for harder steels: they were insensitive to the temperature.
The explanation for the behaviors described in Figure 16 is only possible by checking the wear mechanisms. The initial contact depends on the deformation level. It is expected a relatively softening of tools steels at 200 °C. Therefore, an initial flattening of alumina balls was observed in all cases at room temperature tests, with more intensity when the contact was made with softer tool steels (Figure 12). The friction signal for these conditions – softer steels tested at room temperature – was the highest amongst all tested conditions, meaning that the friction component of deformation was the highest. Another clue for this initial condition of contact was the presence of aluminum at the wear tracks, removed from the balls.
This high level of deformation is implied in a high level of adhesion from the tool steel to the alumina balls. SEM/EDS analysis confirmed the adhesion because of the initial contact steps. Further, these transferred layers were oxidized, and they are composed in their most by hematite (Figure 12). Then, there is a tribolayer of iron oxide adhered to aluminum oxide. The continuity of contact gave rise to a partial removal of iron oxide, exposing the alumina ball surface again. For softer steels, the higher level of deformation allows the eggshell effect, helping the removal of iron oxide, and increasing the wear. Harder steels, with less deformation, were able to keep the iron oxide in contact longer, reducing wear.
The increase in the temperature reduces the initial flattening of alumina balls. Friction values become lower, and a consequence is the less transfer of debris to the balls. Therefore, all further steps described for room temperature tests are less intense, and the level of hardness was not as significant as observed for room temperature tests.
The order of wear mechanisms is summarized and illustrated in Figure 17, for tests performed at room temperature, justifying all descriptions made in Figure 16.
A last aspect to consider regards the material selection based on mechanical properties. Considering the improvement in tribological performance reached with WP7V steel, and keeping a minimum level of toughness, the hardest condition – 57 HRC - is not indicated, once the performance was similar or worse compared to the 54 HRC one.
4. Conclusions
Considering the tribological behavior of WP7V tool steel with different hardness under reciprocating sliding tests, we can put forward the following conclusions:
- Tribological behavior of tools steels under reciprocating sliding tests depends on the hardness level for tests performed at room temperature.
- Friction values at high-temperature tests were not sensitive to the hardness level of tested steels.
- For the softer tool steels, the effect of temperature testing was sensitive. The higher the temperature, the lower the friction and wear of tool steels.
- To keep the toughness at a considerable level, WP7V steel cannot be indicated for use at 57 HRC, since the performance of 54 HRC condition was similar or even better.
Author Contributions
Conceptualization, G.P. and F.G.A-F.; methodology, R.B.; validation, R.B., and G.P.; formal analysis, G.P.; investigation, R. B.; writing—original draft preparation, R.B.; writing—review and editing, G.P. and F.G.A-F.; supervision, G.P. and F.G.A-F.; project administration, G.P.; funding acquisition, G.P. and F.G.A-F. All authors have read and agreed to the published version of the manuscript.
Funding
G. Pintaude acknowledges CNPq through Process 310523/2020-6.
Data Availability Statement
The data supporting the provided results can be available upon request by contacting the corresponding author.
Acknowledgments
The authors would like to thank Metalli Aços Especiais Ltda. for donating the tool steels; Angra Tecnologia em Materiais Ltda. for carrying out the heat treatments; Villares Metals S.A. for carrying out the unnotched impact tests; the Multiuser Center for Materials Characterization – CMCM of UTFPR-CT for the scanning electron microscopy and interferometry analysis; the Center for Electron Microscopy – CME of UFPR for the Raman analysis; and C.M. Lepienski for helping with nanoindentation measurements.
Conflicts of Interest
The authors declare no conflict of interest.
References
- Escher, Ch.; Wilzer, J.J. Tool steel for hot stamping of high strength automotive body parts. Dörrenber Edelstahl GmbH, Qualitätszentrale, 51766 Engelskirchen 2015, 219–228. [CrossRef]
- Jagota, V.; Sharma, R.K. Impact of austenitizing temperature on the strength behavior and scratch resistence of AISI H13 steel. The Instituition of Engineers India 2020, 101, 93–104. [Google Scholar] [CrossRef]
- ASM Metals Handbook. Friction, lubrication, and wear technology. United States of America: ASM International 2, v. 18, 1992, 1150 p.
- Hardell, J.; Prakash, B. High-temperature friction and wear behaviour of different tool steels during sliding against Al–Si-coated high-strength steel. Tribol. Int. 2008, 41, 663–671. [Google Scholar] [CrossRef]
- Gracia- Escosa, E.; Garcia, I.; Damborenea, J.; Conde, A. Friction and wear behavior of tool steels sliding against 22MnB5 steel. J. Mater. Res. Technol. 6 (3) 2017, 241–250. [CrossRef]
- Cui, X.H.; Wang, S.Q.; Wei, M.X.; Yang, Z.R. Wear characteristics and mechanisms of H13 steel whith various tempered structures. Journal of Materials Engineering and Performance 2011, 20(6), 1055–1062. [Google Scholar] [CrossRef]
- Hardell, J.; Hernandez, S.; Mozgovoy, S.; Pelcastre, L.; Courbon, C.; Pralash, B. Effect of oxide layers and near surface transformations on friction and wear during tool steel and boron steel interaction at high temperatures. Wear 2015, 303-331, 223–229. [CrossRef]
- ASTM E415-21. Standard test method for analysis of carbon and low-alloy steel by spark atomic emission spectrometry. ASTM International 2021, West Conshohocken, PA.
- Schwingenschlogl, P.; Niederhofer, P; Merklein, M., Investigation on basic friction and wear mechanisms within hot stamping considering the influence of tool steel and hardness. Wear 2019, 426-427, 378–389. [CrossRef]
- Casellas D, Caro J, Molas S, Prado JM, Valls I. Fracture toughness of carbides in tool steels evaluated by nanoindentation. Acta Materialia. 2007, 55(13), 4277-86. [CrossRef]
- Ning, A.G.; Liu, Y.; Gao, R.; Yue, S.; Wang, M.; Guo, H. Effect of austenitizing condition on mechanical properties, microstructure and precipitation behavior of AISI H13 steel. Journal of Iron and Steel Research International 2022, 31, 143–156. [Google Scholar] [CrossRef]
- Zhou, W.; Zhu, J.; Zhang, Z. Austenite grain growth behaviors of la-microalloyed H13 steel and its effect on mechanical properties. Metallurgical and Materials Transactions A 2020, 51A, 4662–4673. [Google Scholar] [CrossRef]
- Wang, J.; Xu, Z.; Lu, X. Effect of the quenching and tempering temperatures on the microsctructure and mechanical properties of H13 steel. Journal of Materials Engineering and Performance 2020, 29, 1849–1859. [Google Scholar] [CrossRef]
- Ma, D.S.; Zhou, J.; Chen, Z.Z.; Zhang, Z.K.; Chen, Q.A.; Li, D.H. Influence of thermal homogenization treatment on structure and impact toughness of H13 ESR steel. Journal of Iron and Steel Research International 2009, 16, 56–60. [Google Scholar] [CrossRef]
- ASTM G133-05 (Reapproved 2016), Standard test method for linearly reciprocating ball-on-flat sliding wear. ASTM International, West Conshohocken, PA 2016.
- Macêdo, G.; Pelcastre, L.; Prakash, B.; Hardell, J. Effect of temperature on the tribological behaviour of additively manufactured tool materials in reciprocating sliding against cemented carbide. Wear 2024, 552–553. [Google Scholar] [CrossRef]
- Jubb, A. M.; Allen, H. C. Vibrational spectroscopic characterization of hematite, maghemite, and magnetite thin films produced by vapor deposition. Applied Materials & Interfaces 2010, 2, 2804–2812. [Google Scholar] [CrossRef]
- Chicot, D.; Mendoza, J.; Zaoui, A.; Louis, G.; Lepingle, V.; Roudet, F.; Lesage, J. Mechanical properties of magnetite (Fe3O4), hematite (α-Fe2O3) and goethite (α-FeO. OH) by instrumented indentation and molecular dynamics analysis. Materials Chemistry and Physics 2011, 129, 862–870. [Google Scholar] [CrossRef]
- Brunetti, C.; Belotti, L.P; Miyoshi, M.H.; Pintaúde, G.; D’Oliveira, A.S.C.M. Influence of Fe on the room and high-temperature sliding wear of NiAl coatings. Surface & Coatings Technology 2014, 258, 160–167. [Google Scholar] [CrossRef]
- Writzl V, Rovani AC, Pintaude G, Lima MS, Guesser WL, Borges PC. Scratch resistances of compacted graphite iron with plasma nitriding, laser hardening, and duplex surface treatments. Tribology International 2020, 143, 106081. [CrossRef]
- Hoffmann, H.; So, H.; Steinbeiss, H. Design of hot stamping tools with cooling system. CIRP Annals 2007, 56, 269–272. [Google Scholar] [CrossRef]
- Milan, J. C. G.; Carvalho, M. A.; Xavier, R. R.; Franco, S. D.; De Mello, J. D. B. Effect of temperature, normal load and pre-oxidation on the sliding wear of multi-component ferrous alloys. Wear 2005, 259(1-6), 412–423. [CrossRef]
Figure 1.
Microstructures of studied tool steels: (a) DIN 1.2344 of 46 HRC; (b) WP7V of 48.5 HRC; (c) WP7V of 54 HRC; (d) WP7V of 57 HRC.
Figure 1.
Microstructures of studied tool steels: (a) DIN 1.2344 of 46 HRC; (b) WP7V of 48.5 HRC; (c) WP7V of 54 HRC; (d) WP7V of 57 HRC.
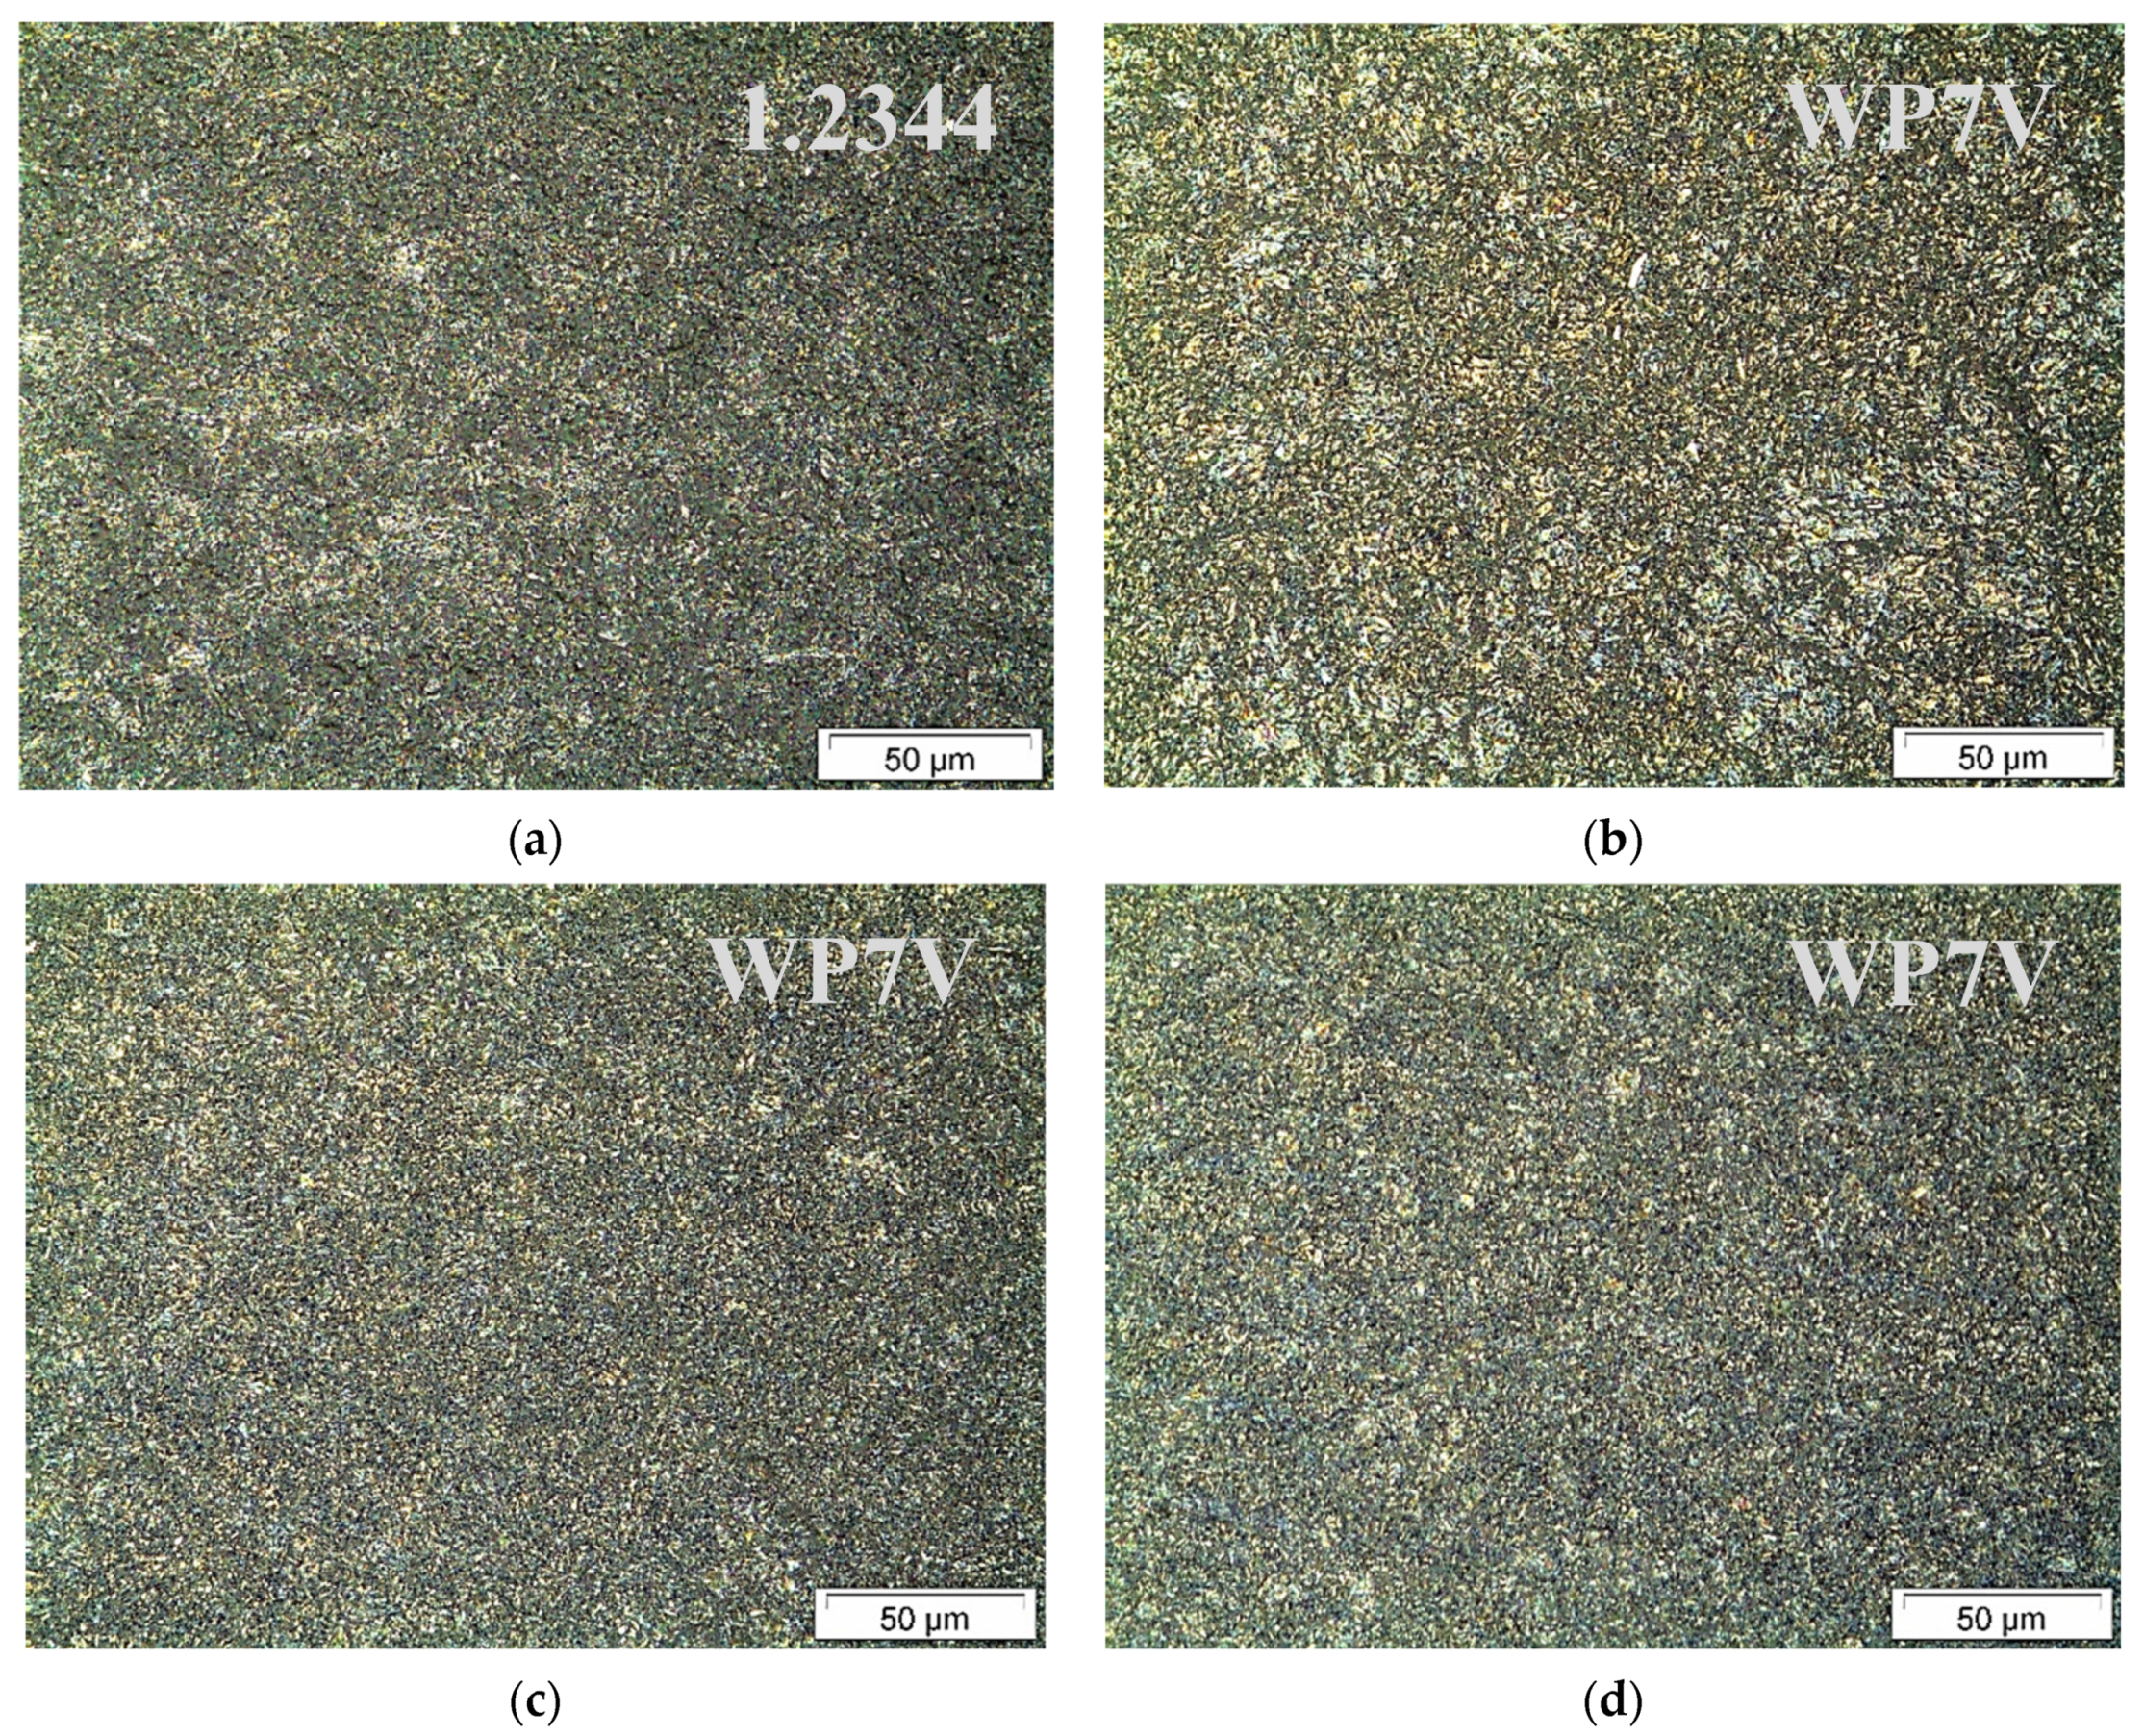
Figure 2.
Nanohardness values of studied tool steels.
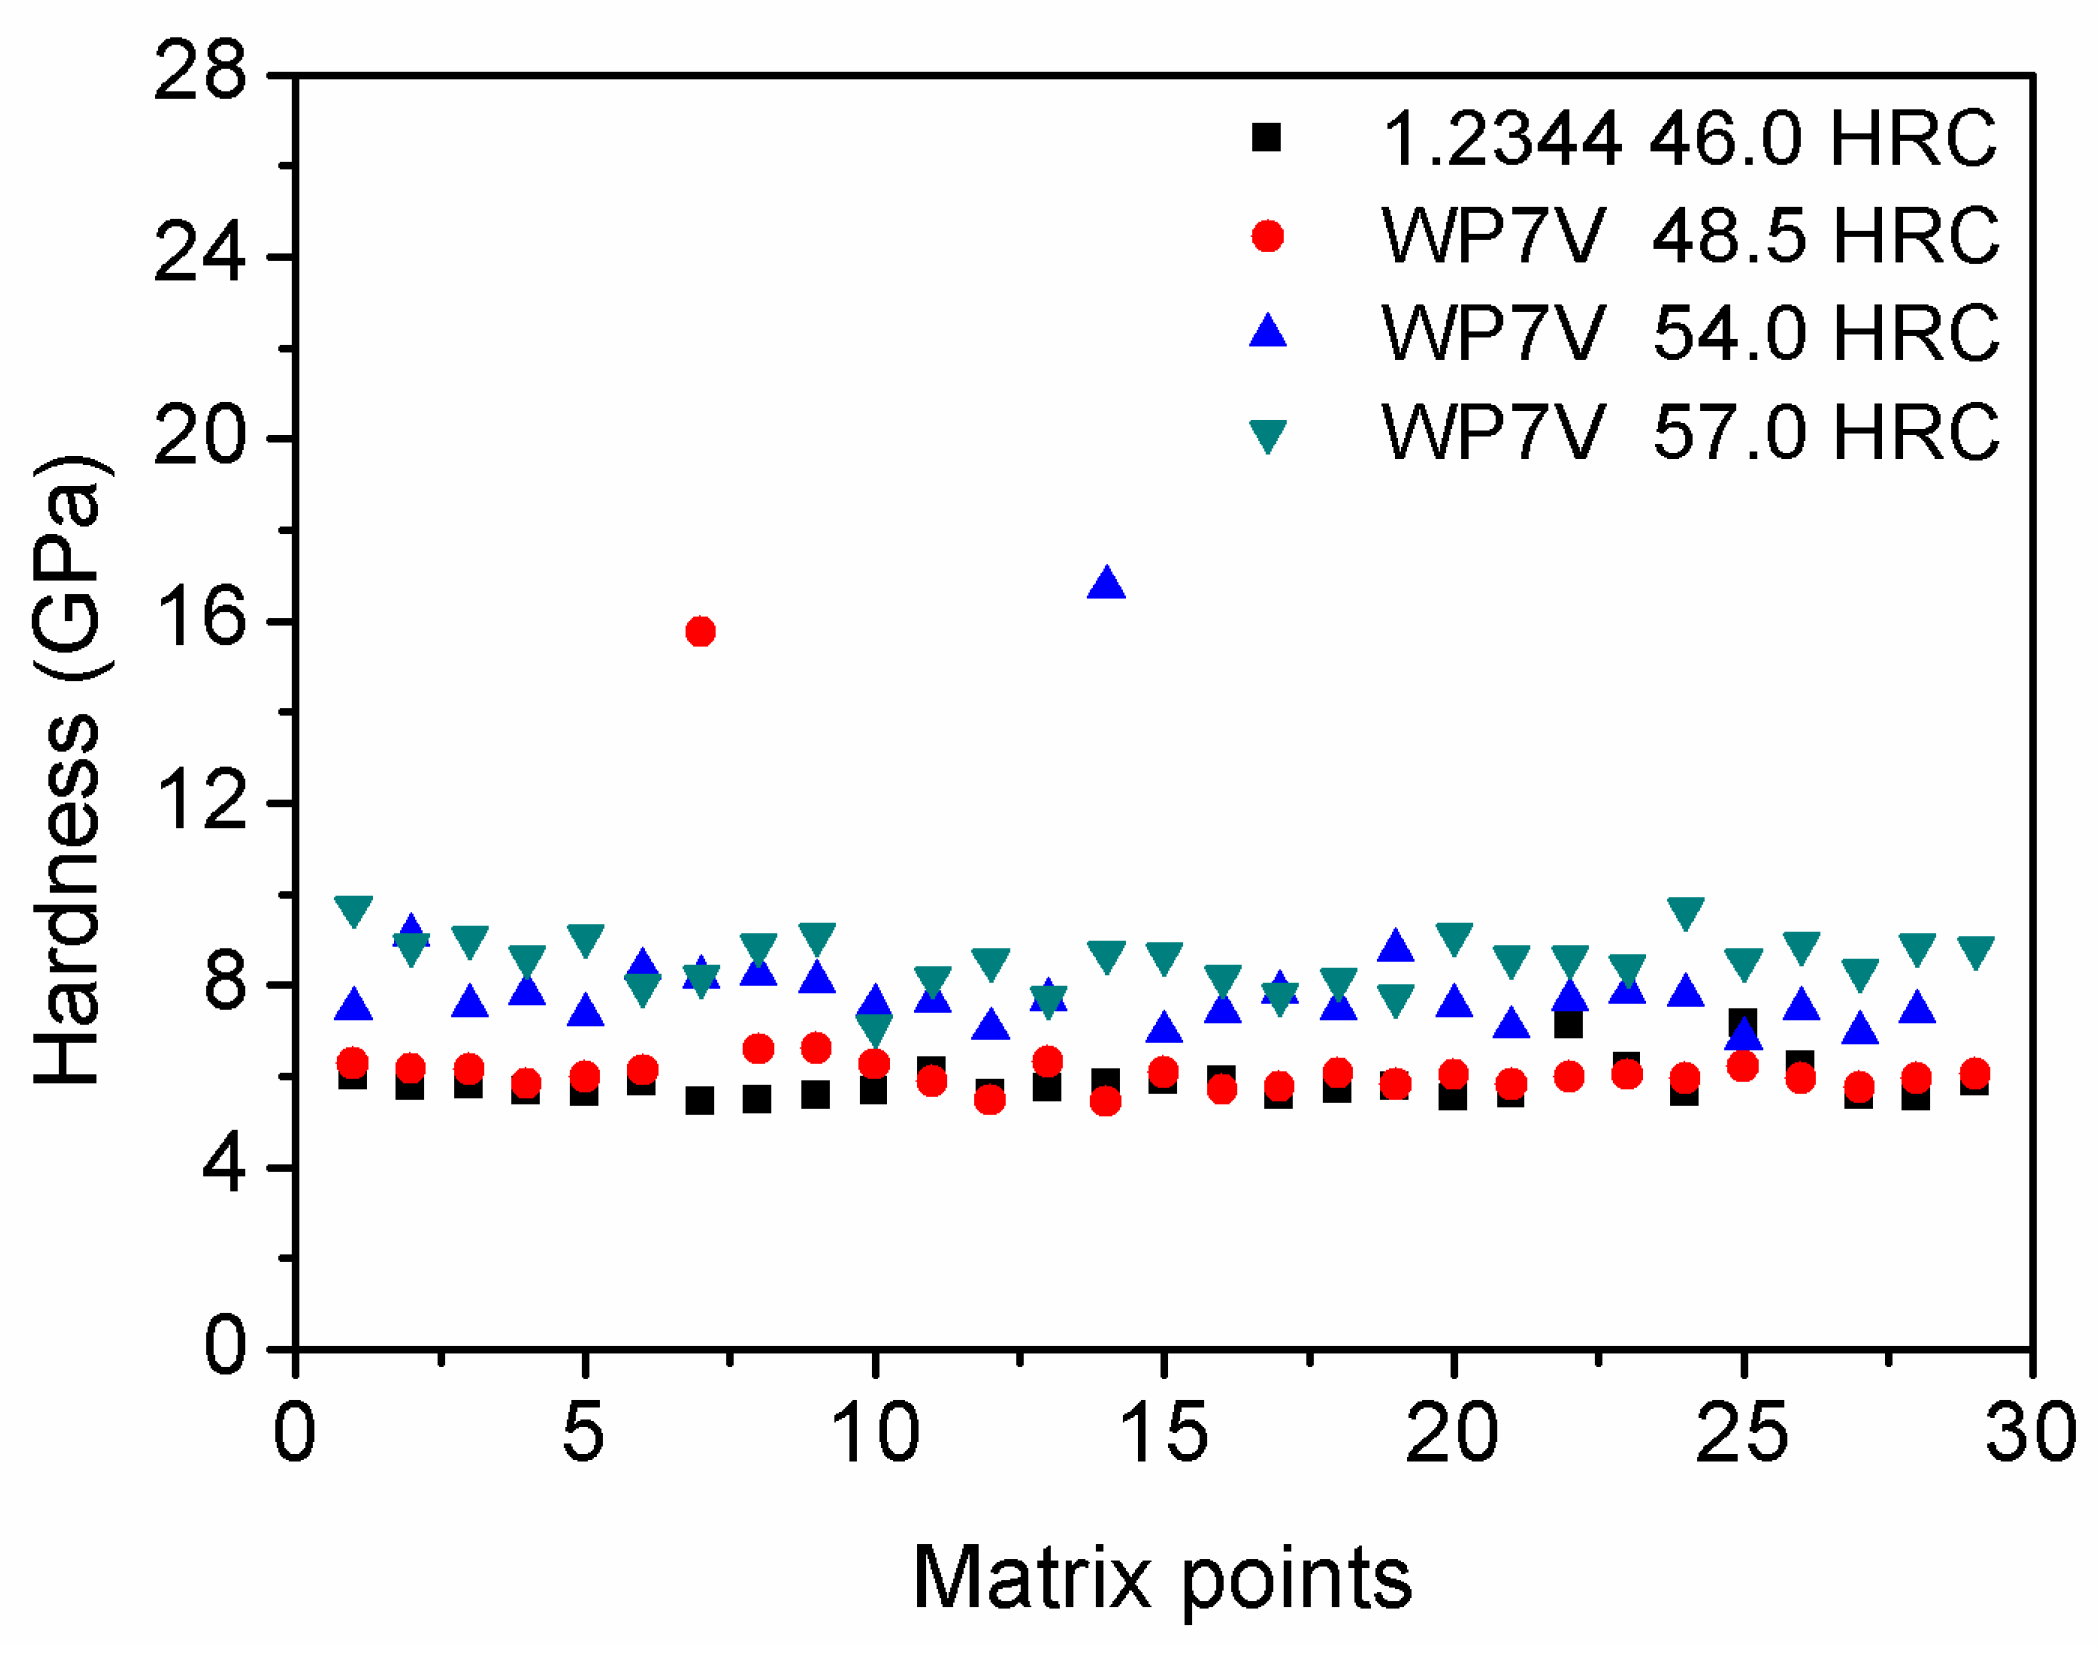
Figure 3.
Fractographies of the unnotched impact test of tool steels. (a) DIN 1.2344 of 46 HRC; (b) WP7V of 48.5 HRC; (c) WP7V of 54 HRC; (d) WP7V of 57 HRC.
Figure 3.
Fractographies of the unnotched impact test of tool steels. (a) DIN 1.2344 of 46 HRC; (b) WP7V of 48.5 HRC; (c) WP7V of 54 HRC; (d) WP7V of 57 HRC.
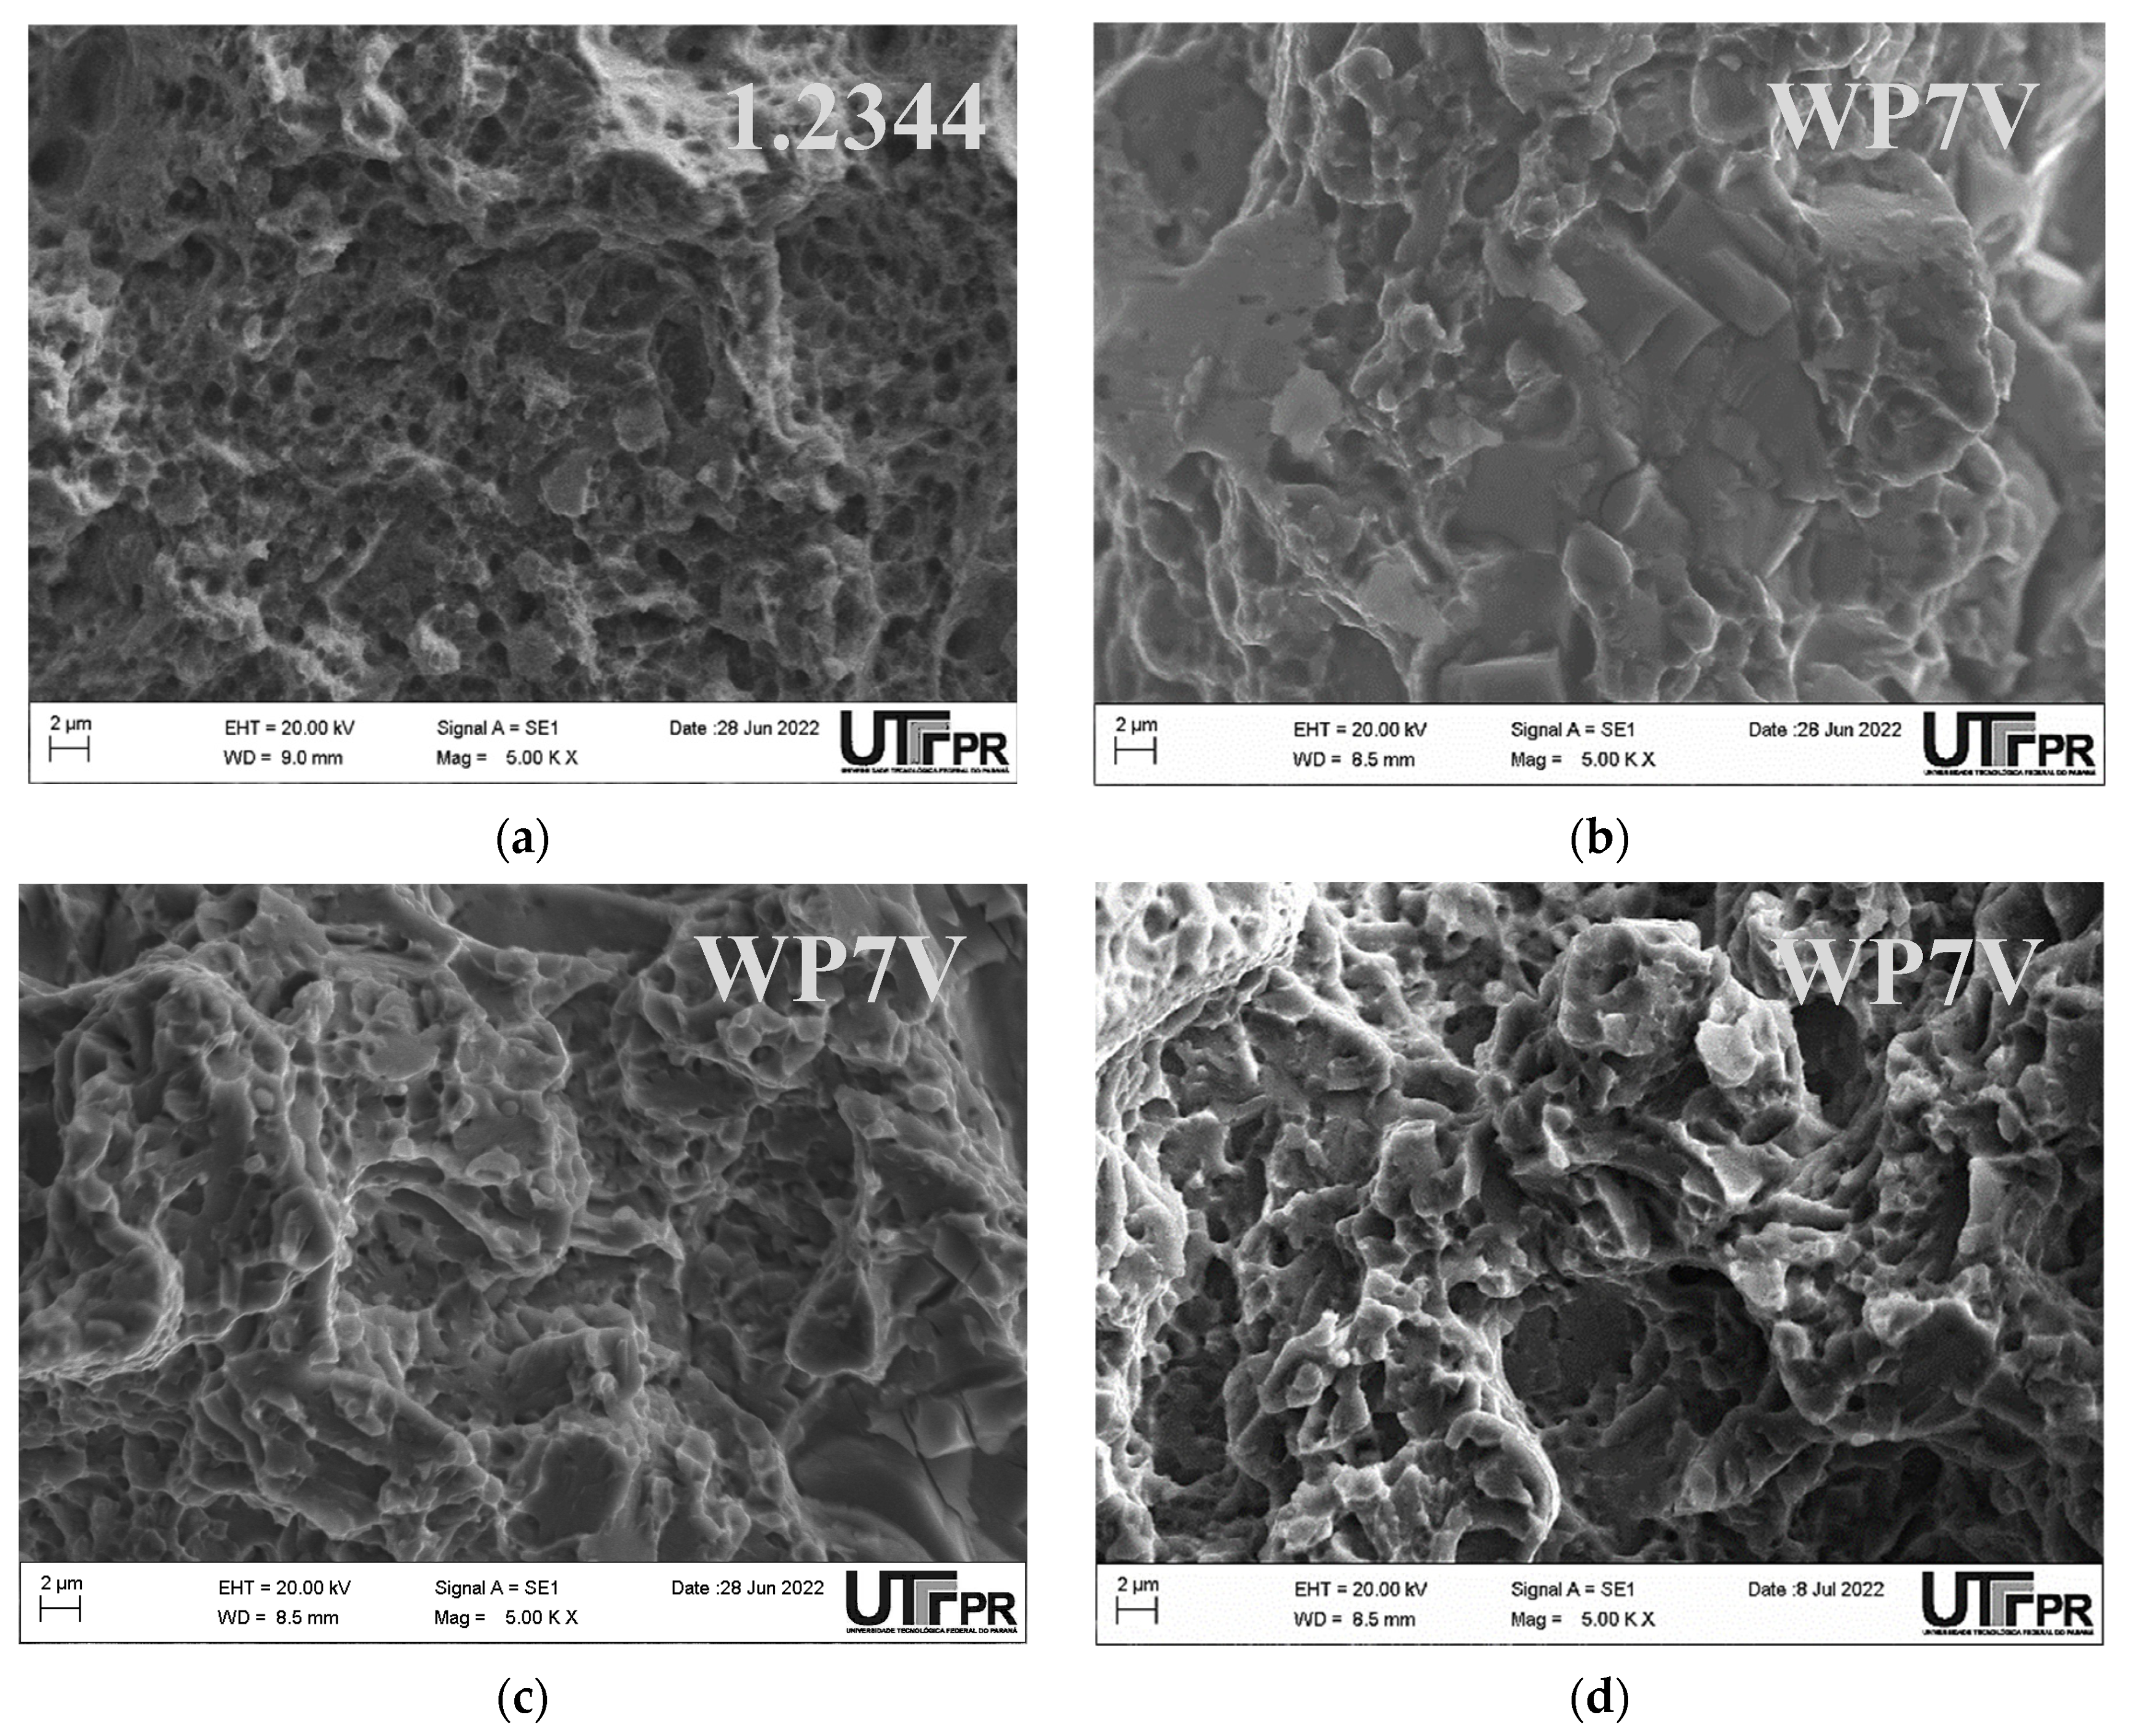
Figure 4.
Example of a 3D profile of wear track.
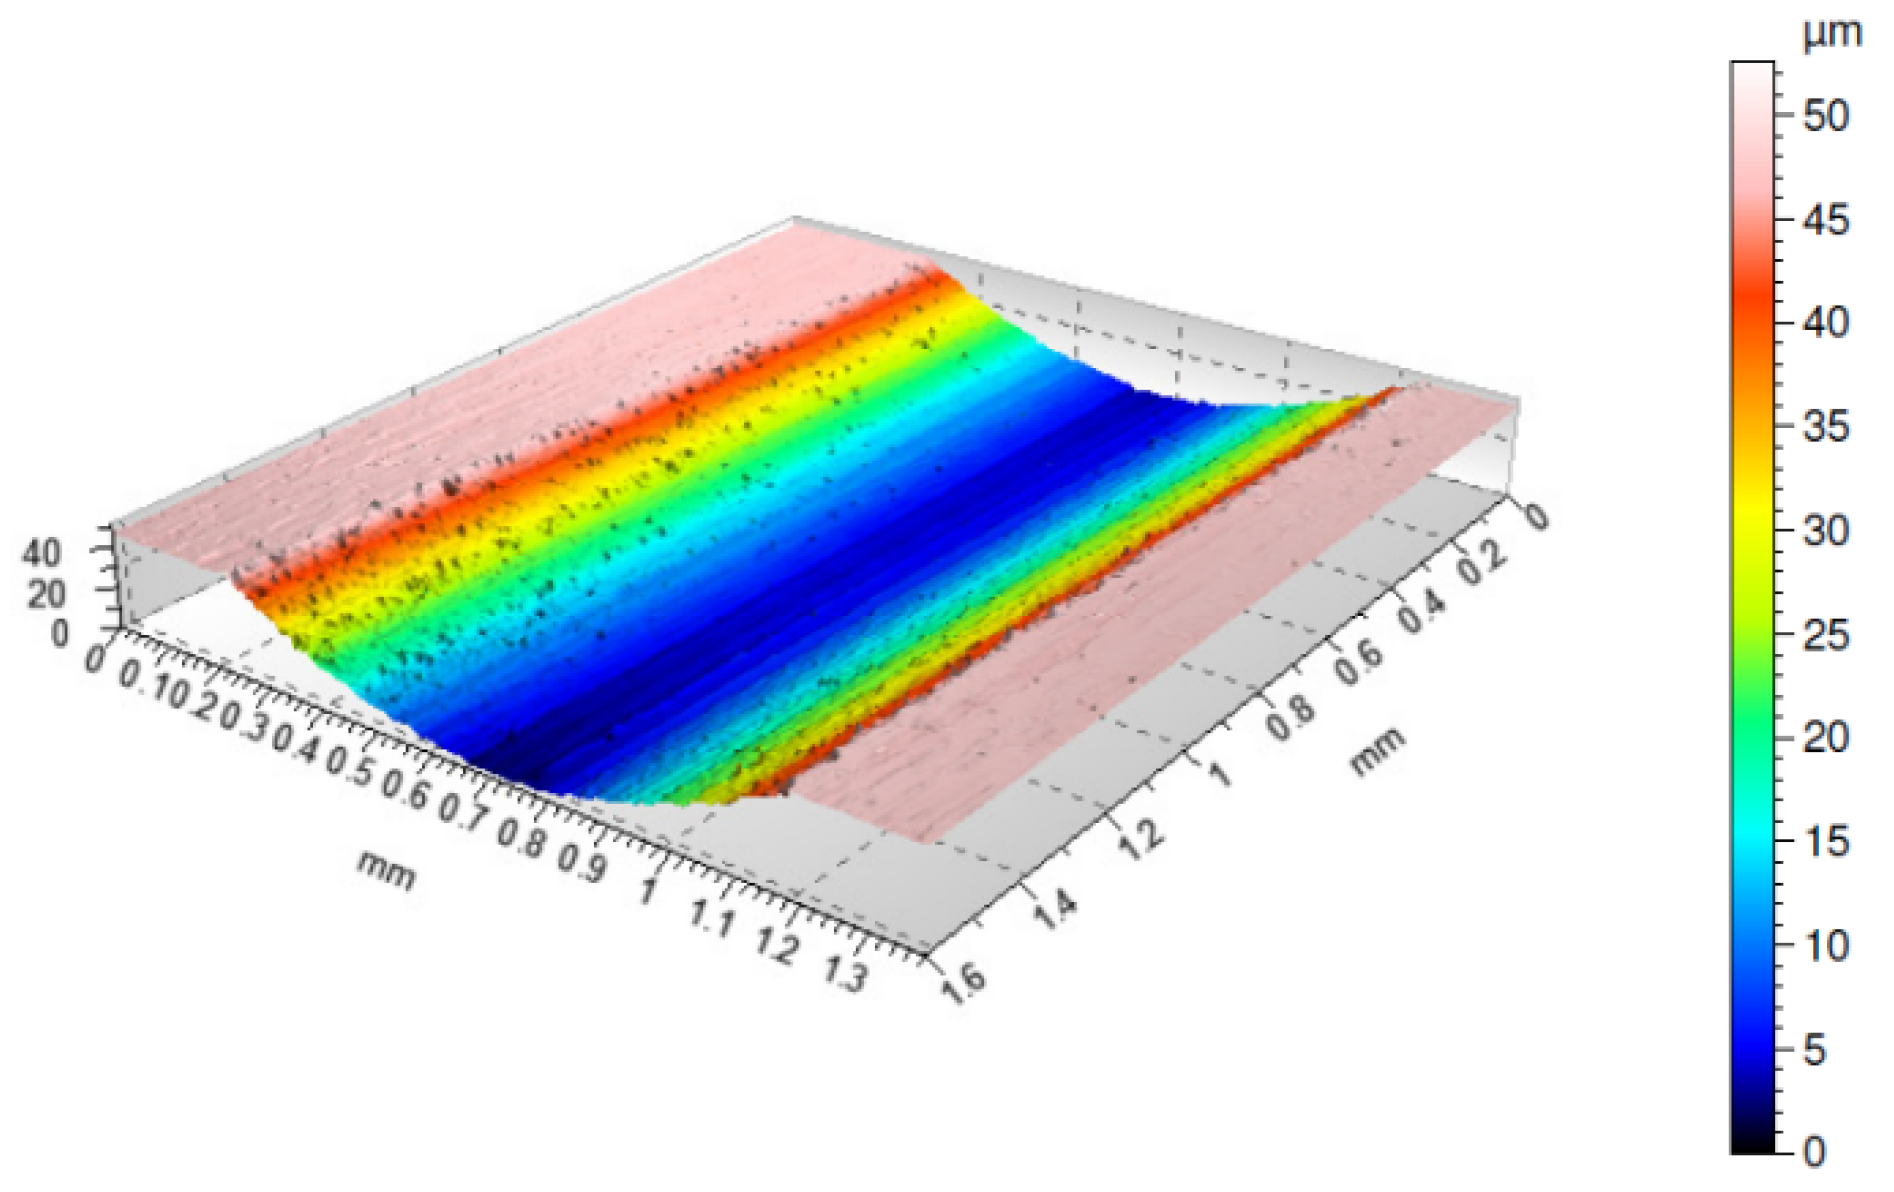
Figure 5.
Evolution of coefficient of friction along with testing time: (a) Low hardness level; and (b) High hardness level.
Figure 5.
Evolution of coefficient of friction along with testing time: (a) Low hardness level; and (b) High hardness level.
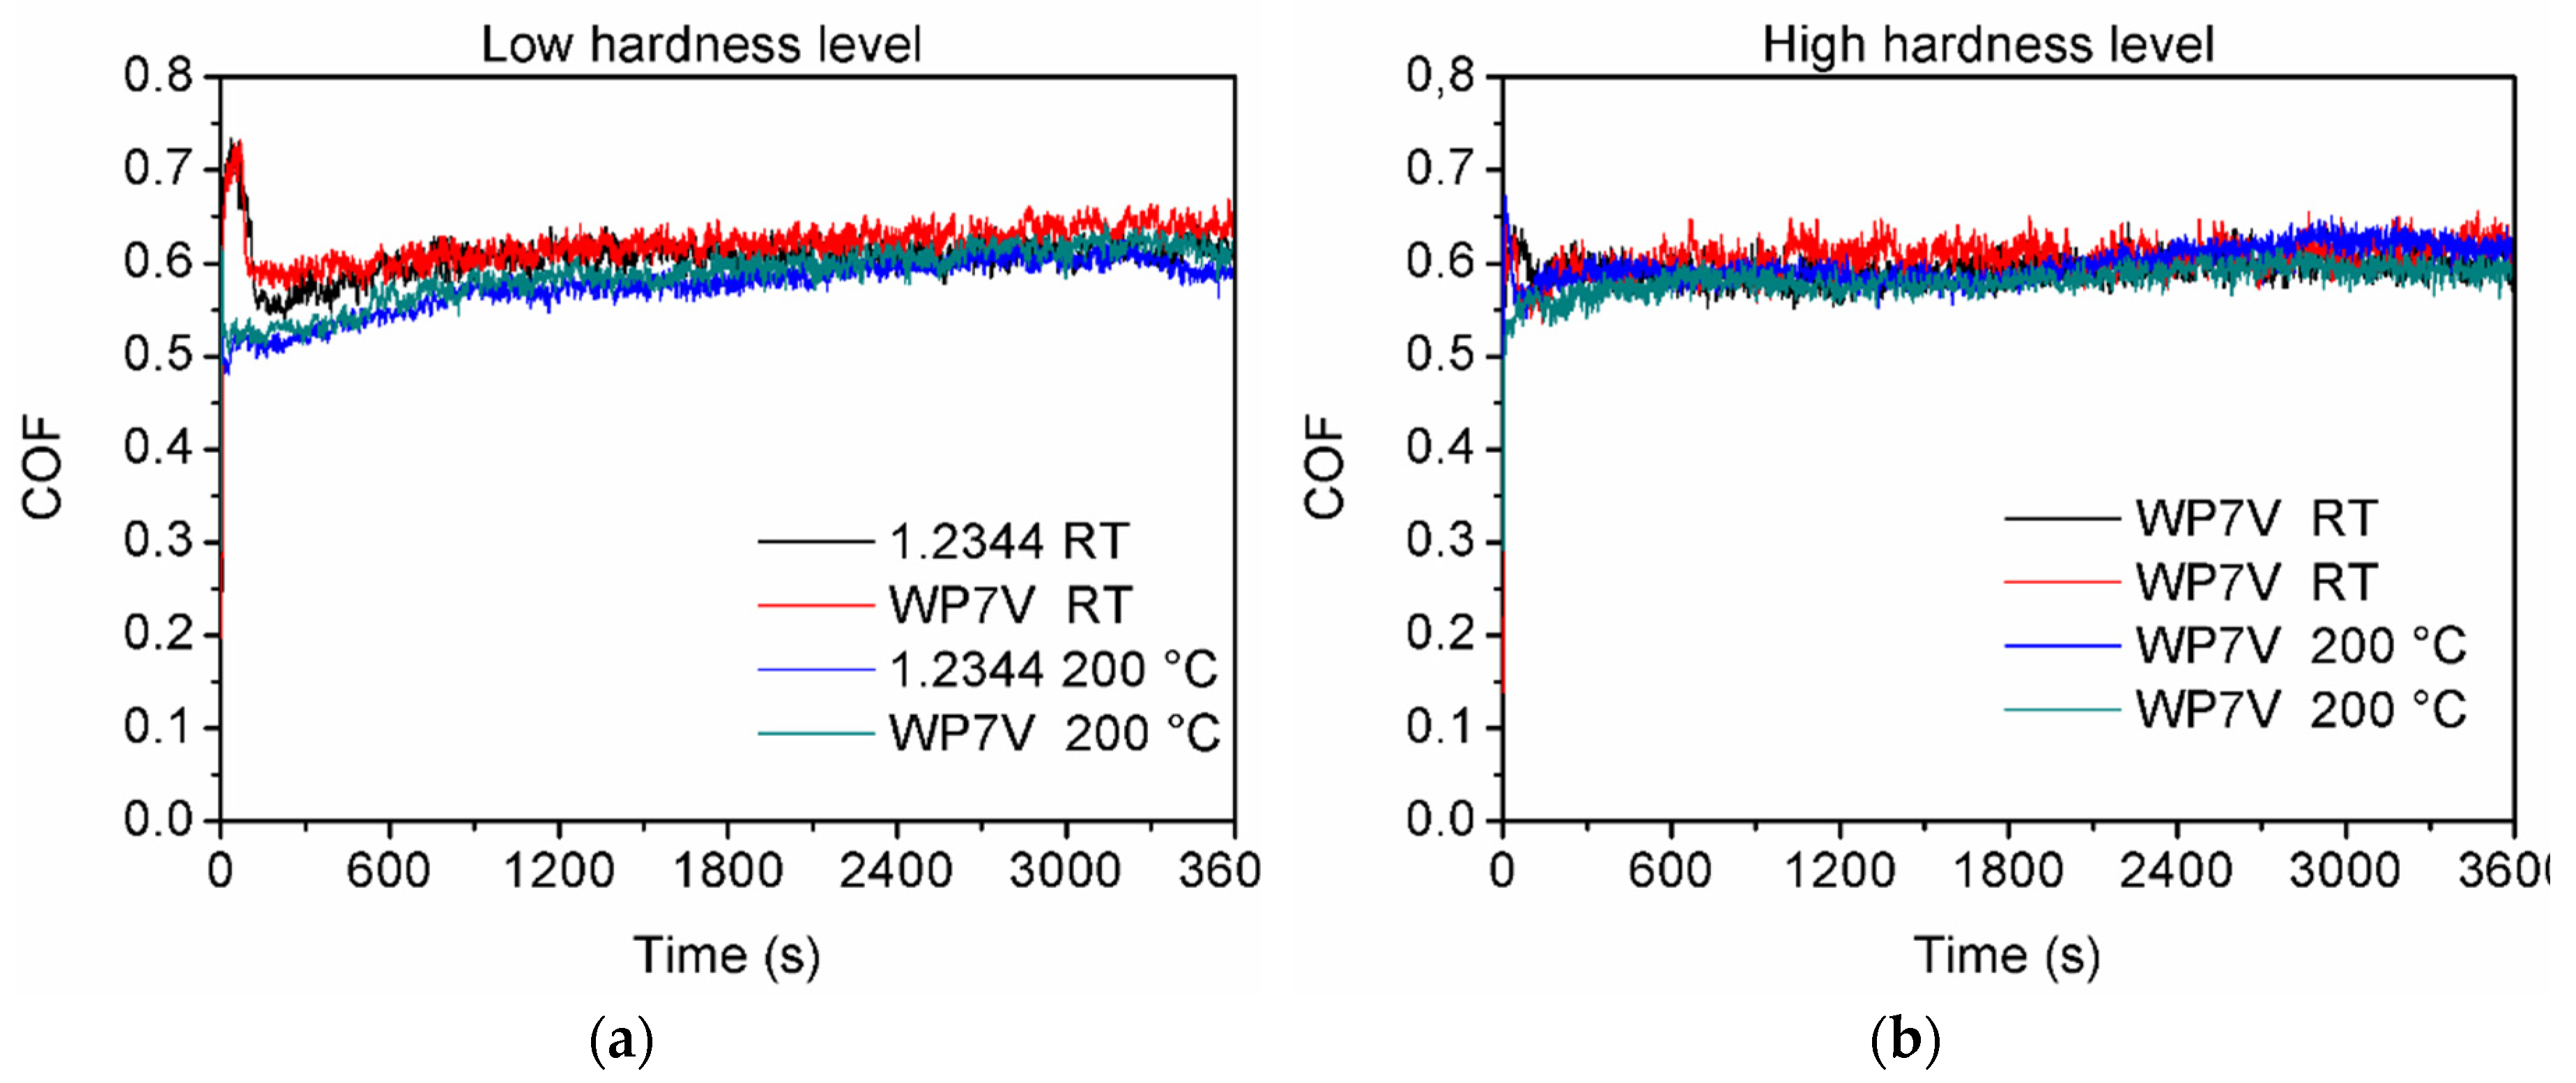
Figure 6.
Average wear rates (mm3/N.m) determined for tool steels under reciprocating test rig.
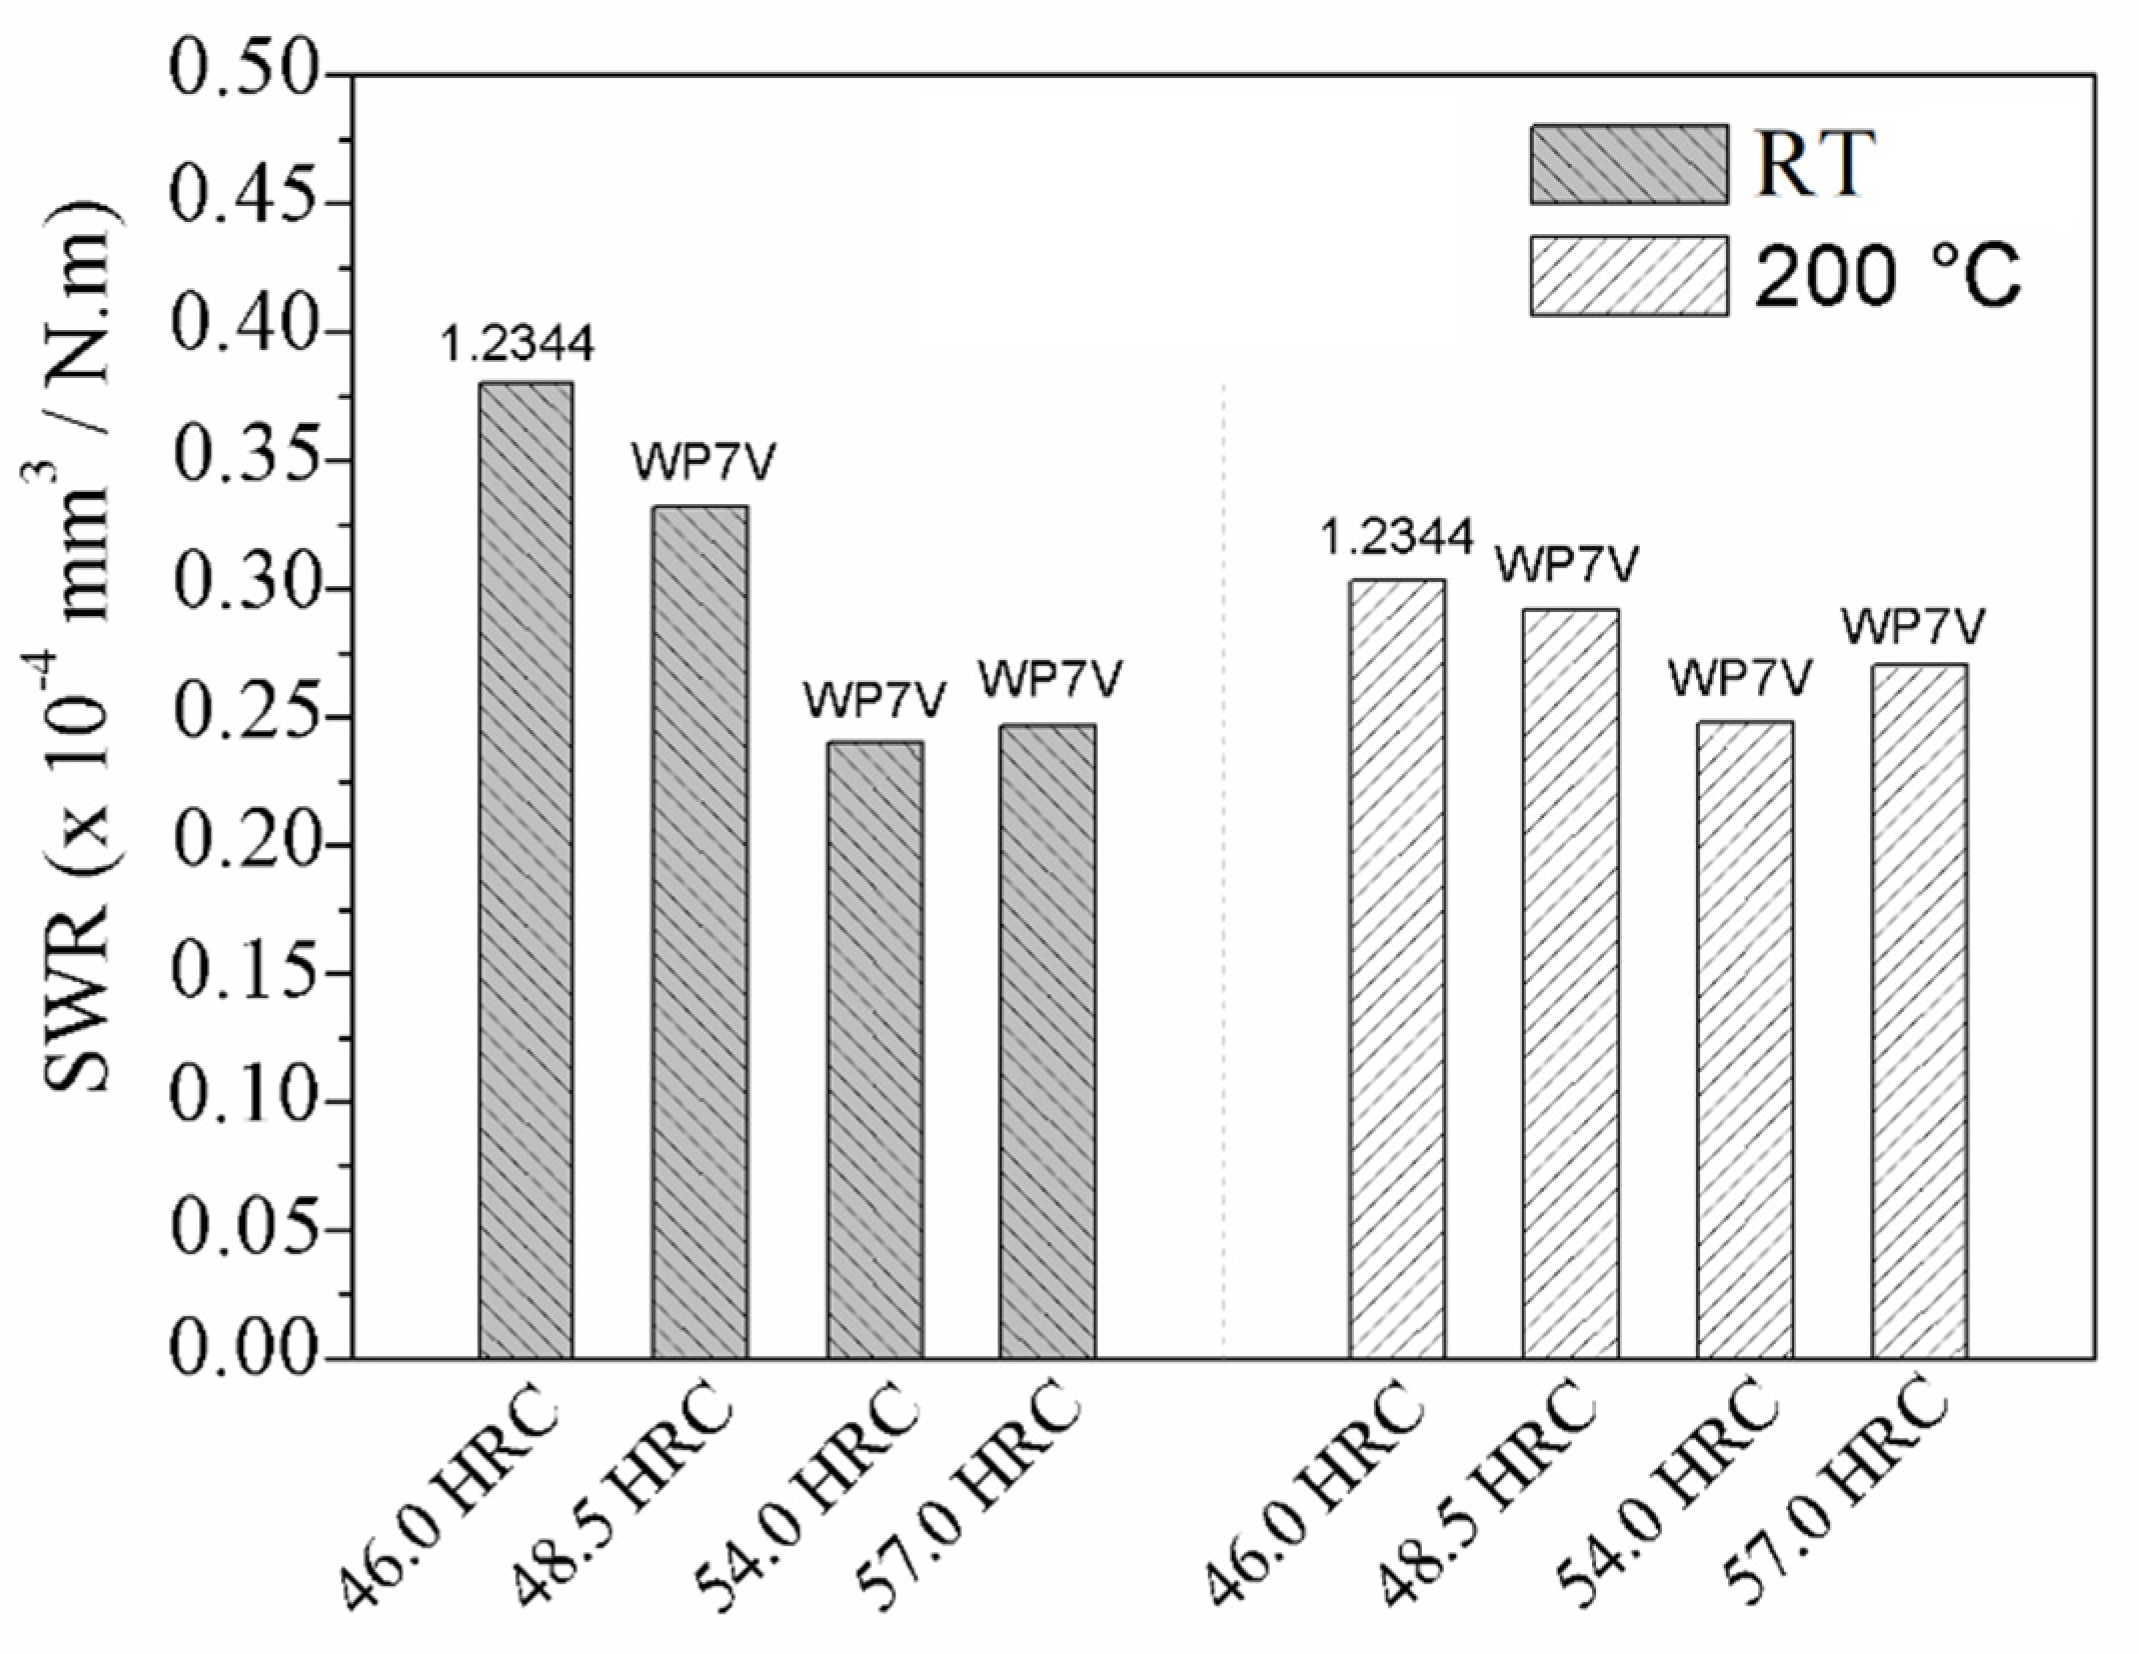
Figure 7.
Wear tracks at room temperature: (a) DIN 1.2344 of 46 HRC; (b) WP7V of 48.5 HRC; (c) WP7V of 54 HRC; (d) WP7V of 57 HRC.
Figure 7.
Wear tracks at room temperature: (a) DIN 1.2344 of 46 HRC; (b) WP7V of 48.5 HRC; (c) WP7V of 54 HRC; (d) WP7V of 57 HRC.
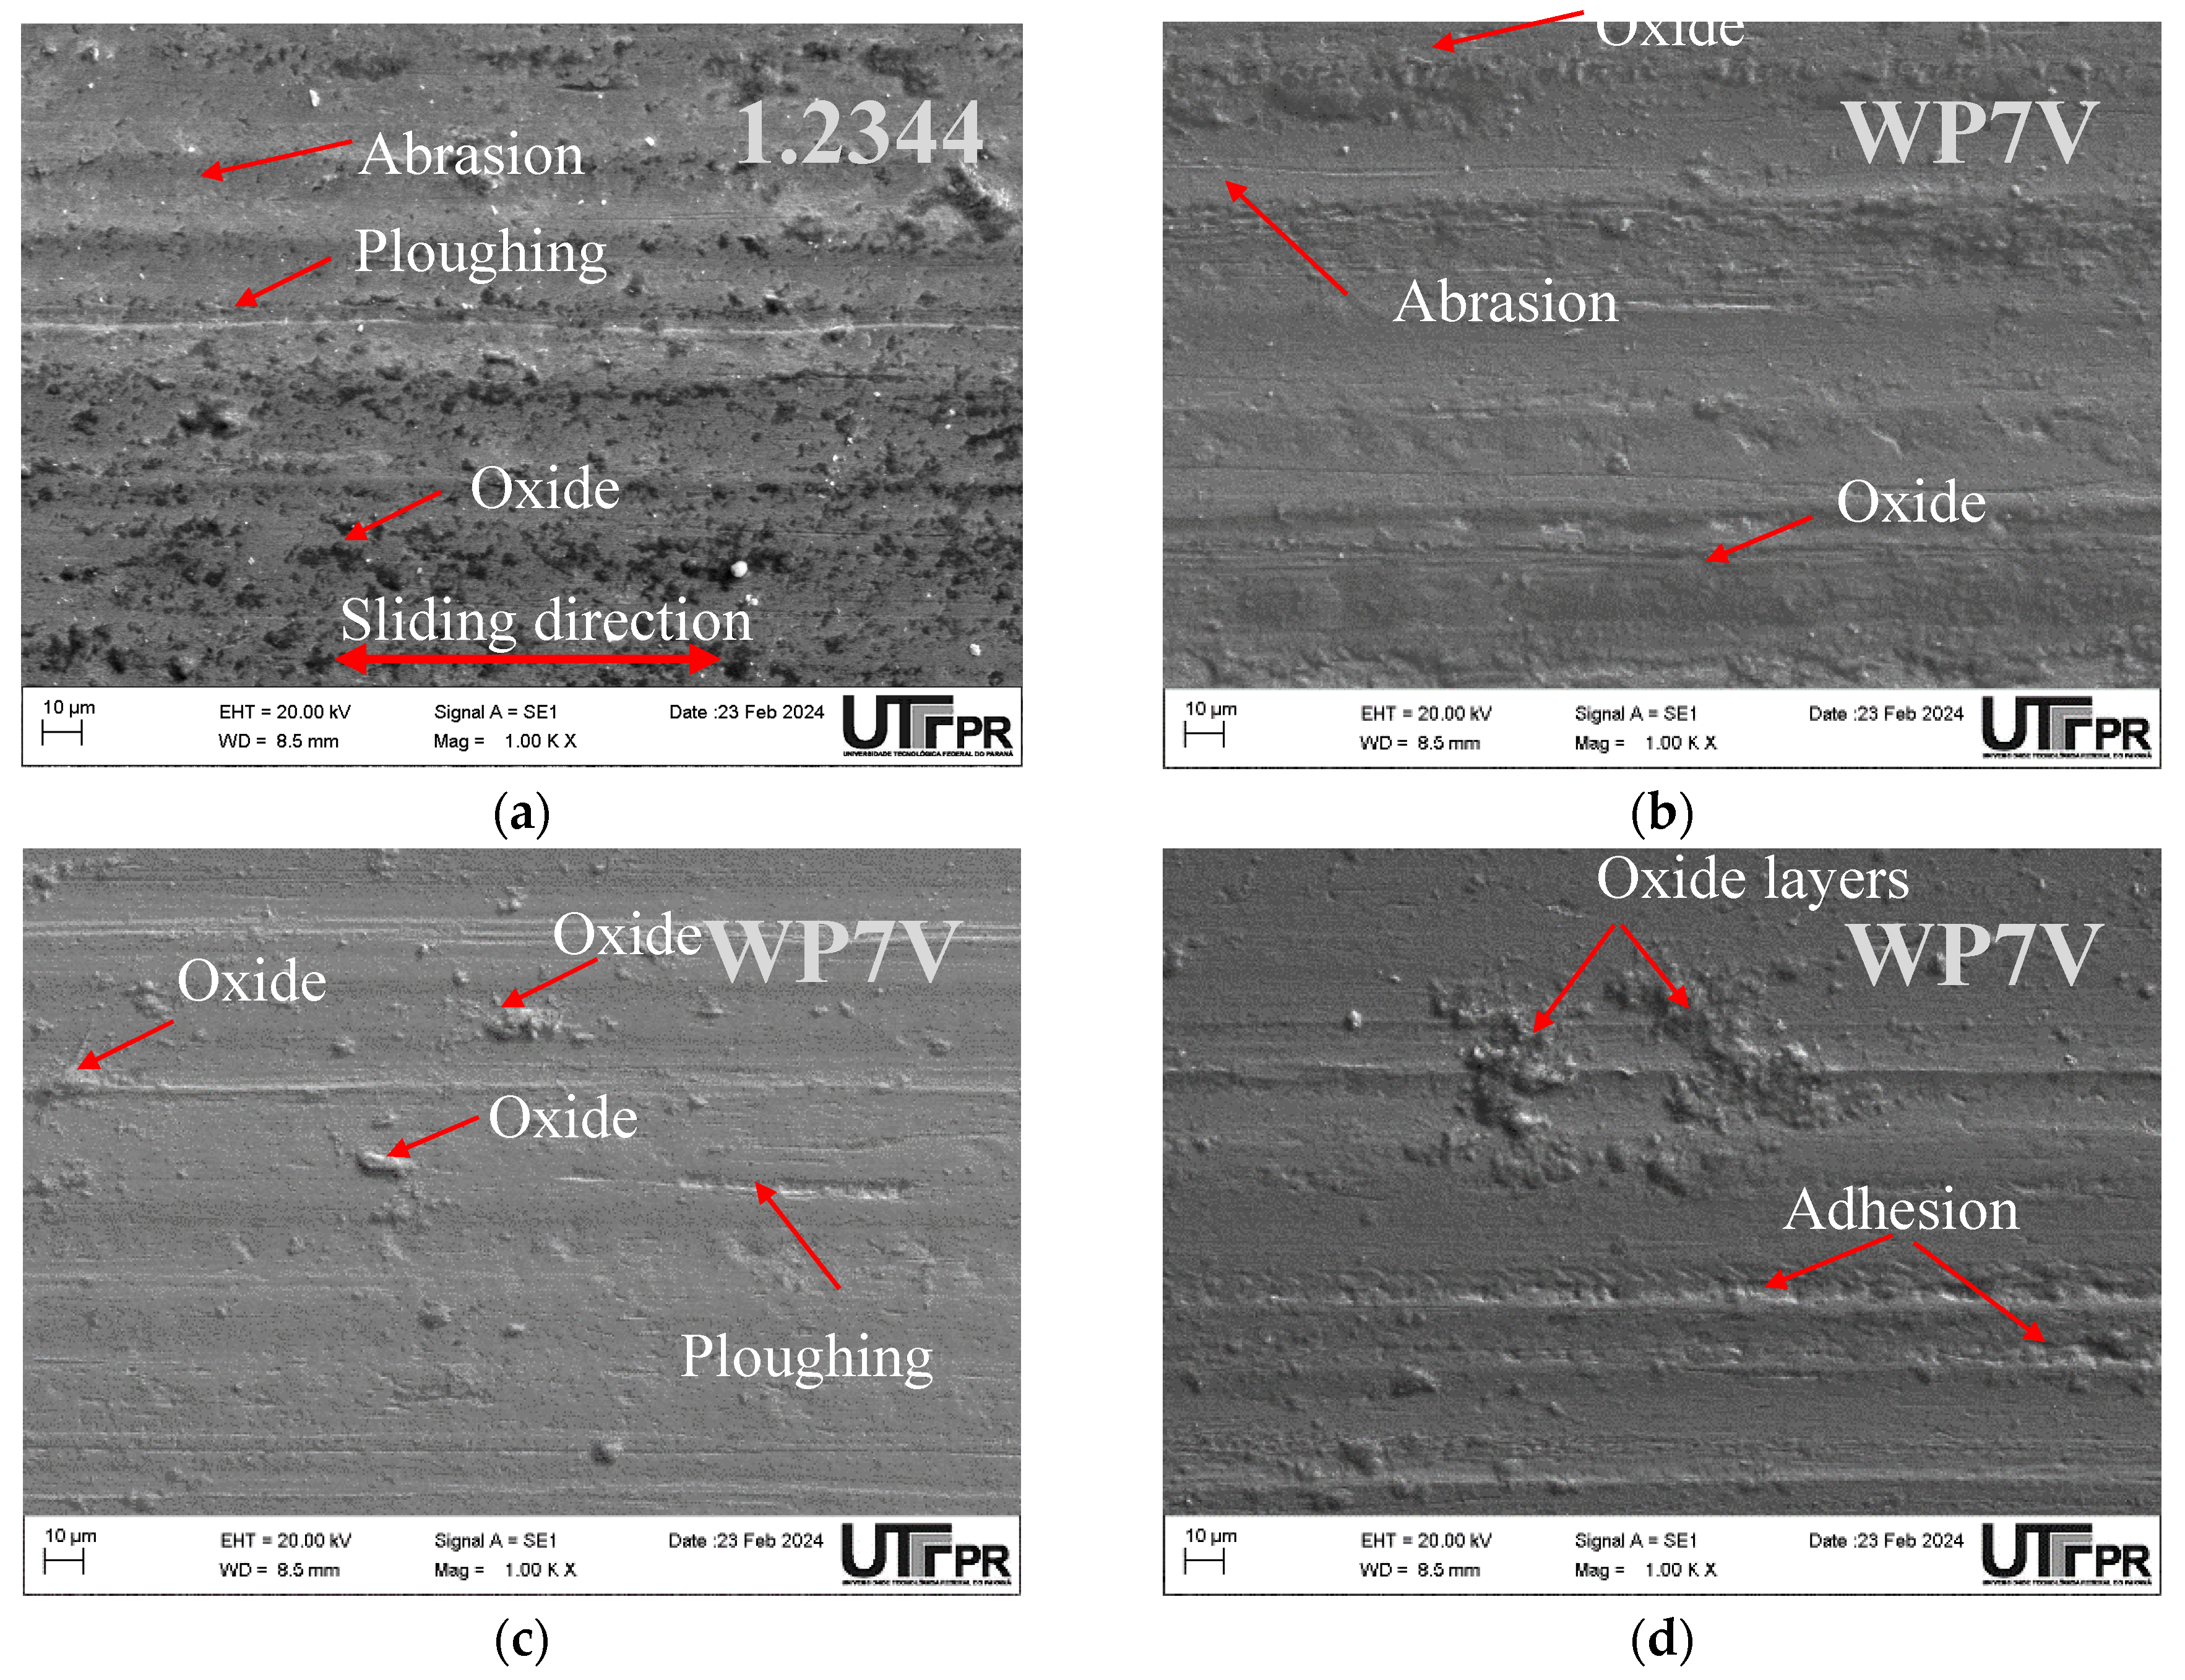
Figure 8.
Wear tracks at the temperature of 200 °C. (a) DIN 1.2344 of 46 HRC; (b) WP7V of 48.5 HRC; (c) WP7V of 54 HRC; (d) WP7V of 57 HRC.
Figure 8.
Wear tracks at the temperature of 200 °C. (a) DIN 1.2344 of 46 HRC; (b) WP7V of 48.5 HRC; (c) WP7V of 54 HRC; (d) WP7V of 57 HRC.
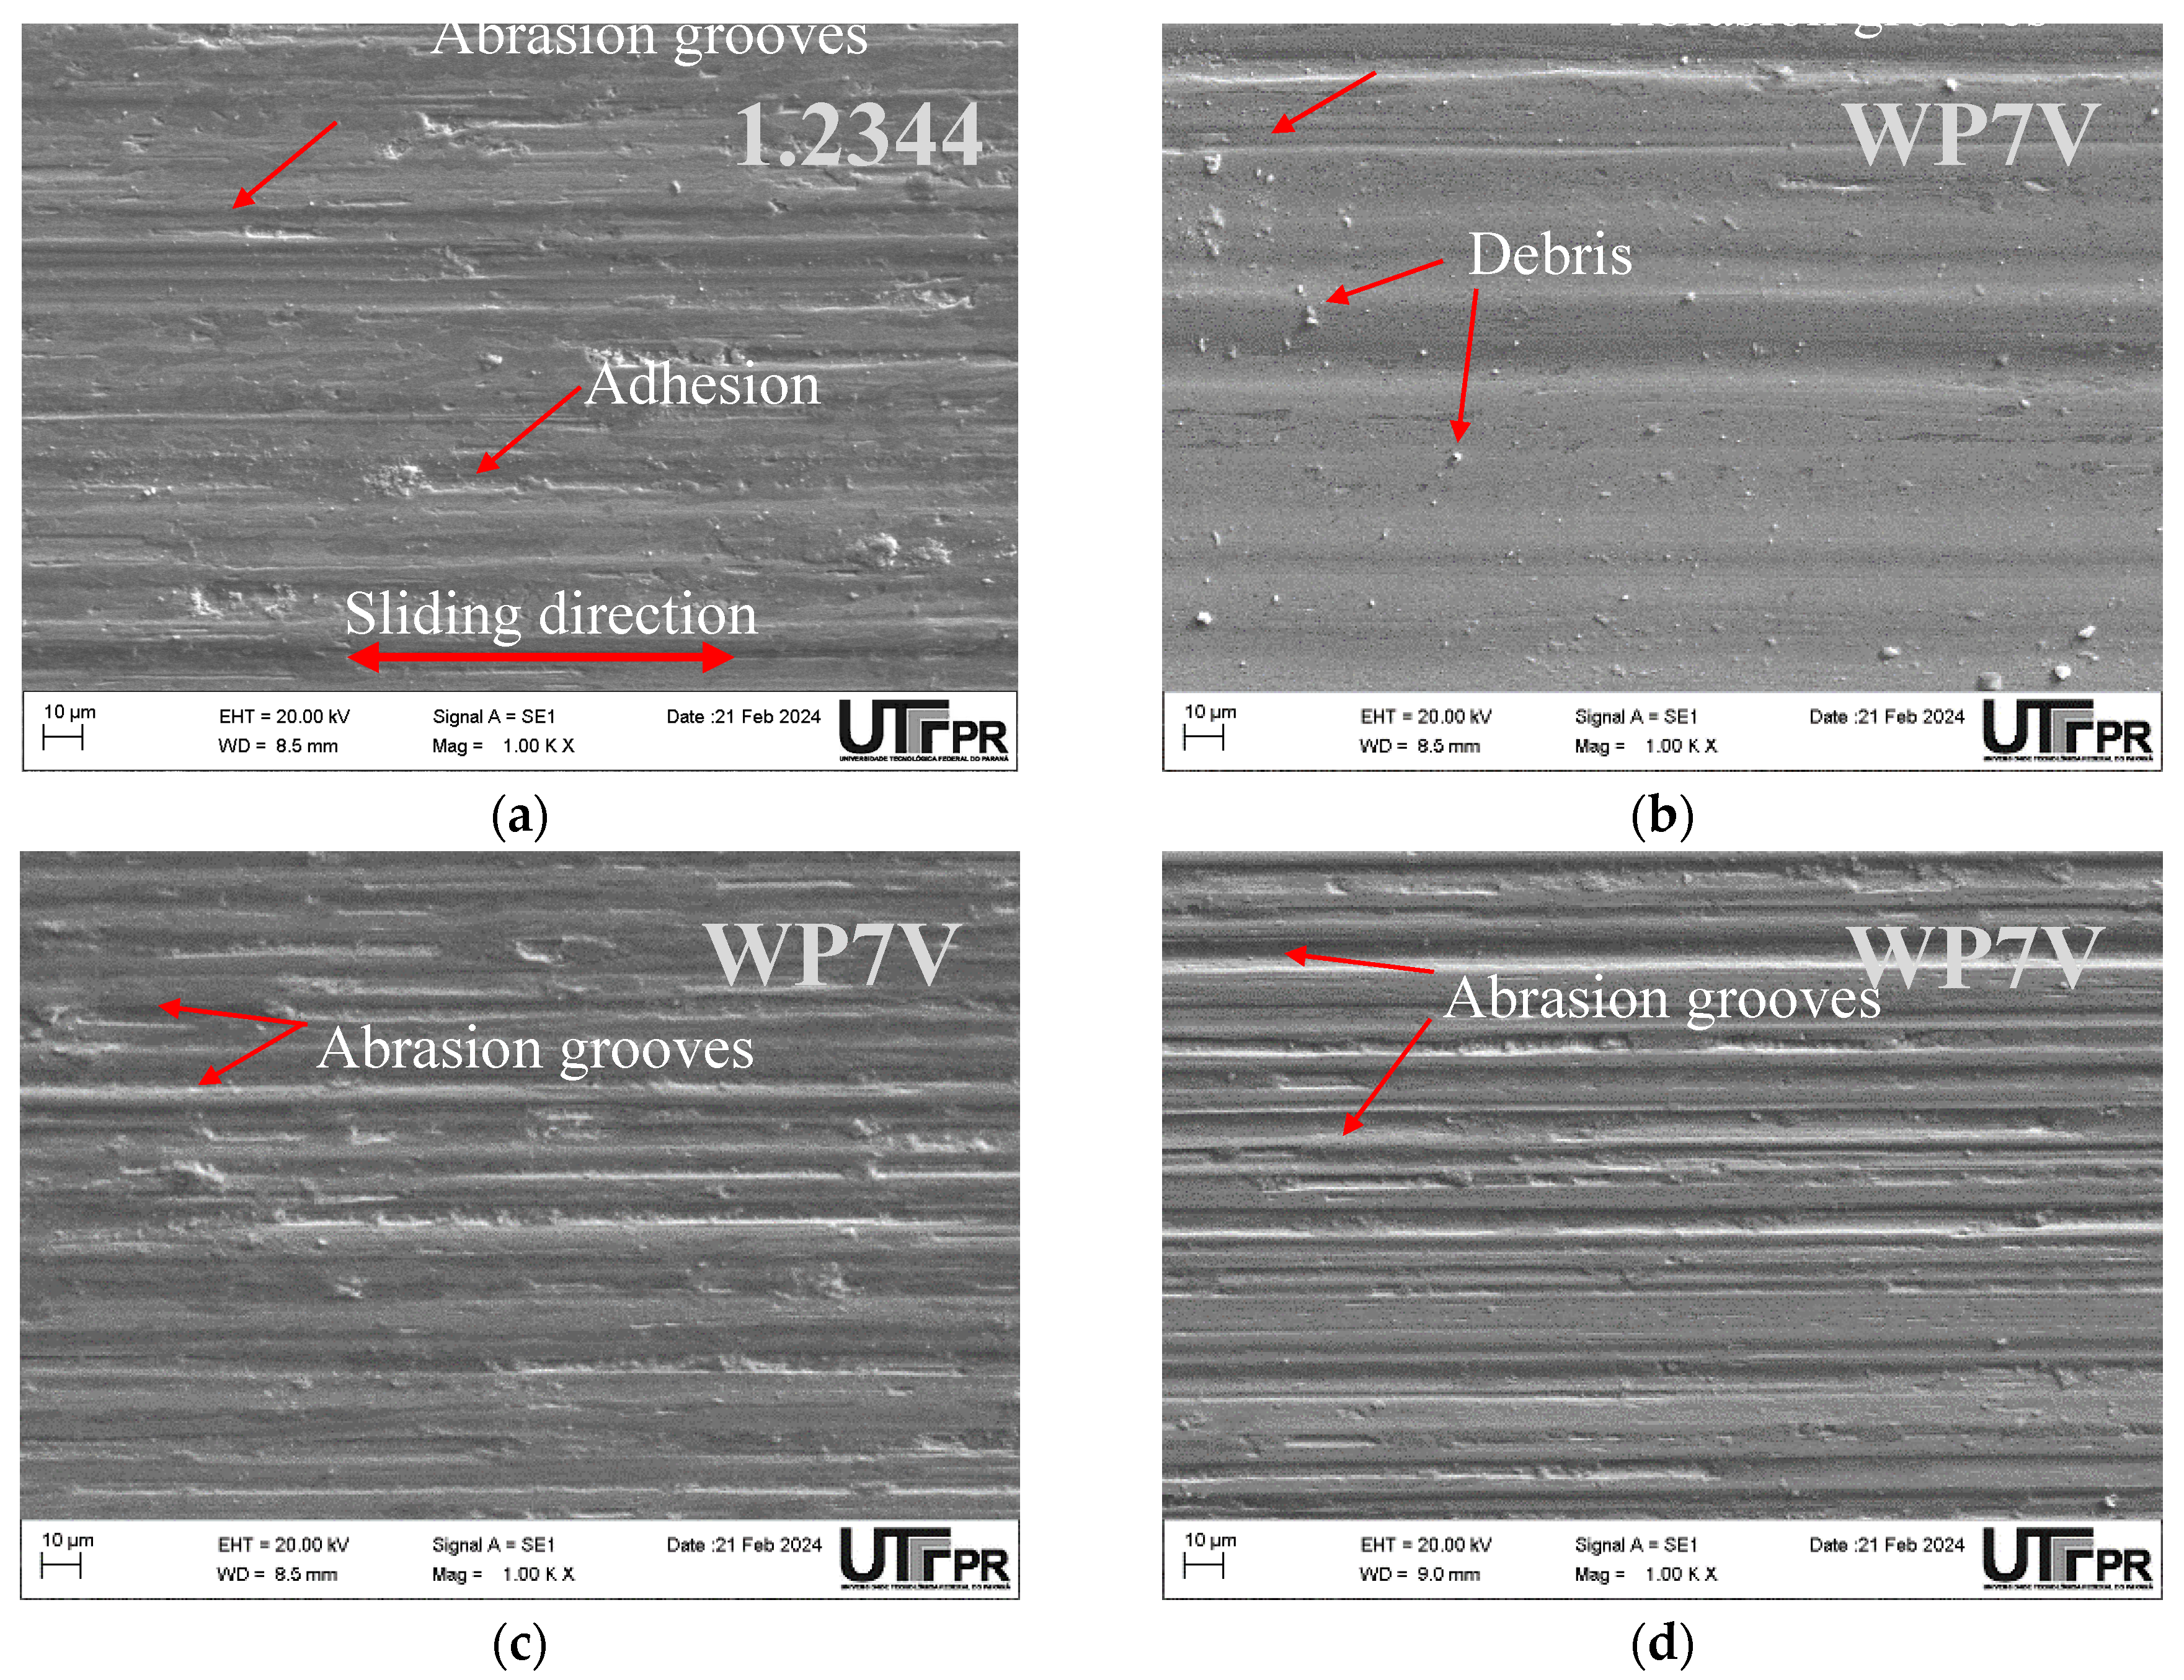
Figure 9.
EDS analysis of wear tracks under room temperature test conditions. (a) DIN 1.2344 of 46 HRC; (b) WP7V of 48.5 HRC; (c) WP7V of 54 HRC; (d) WP7V of 57 HRC.
Figure 9.
EDS analysis of wear tracks under room temperature test conditions. (a) DIN 1.2344 of 46 HRC; (b) WP7V of 48.5 HRC; (c) WP7V of 54 HRC; (d) WP7V of 57 HRC.
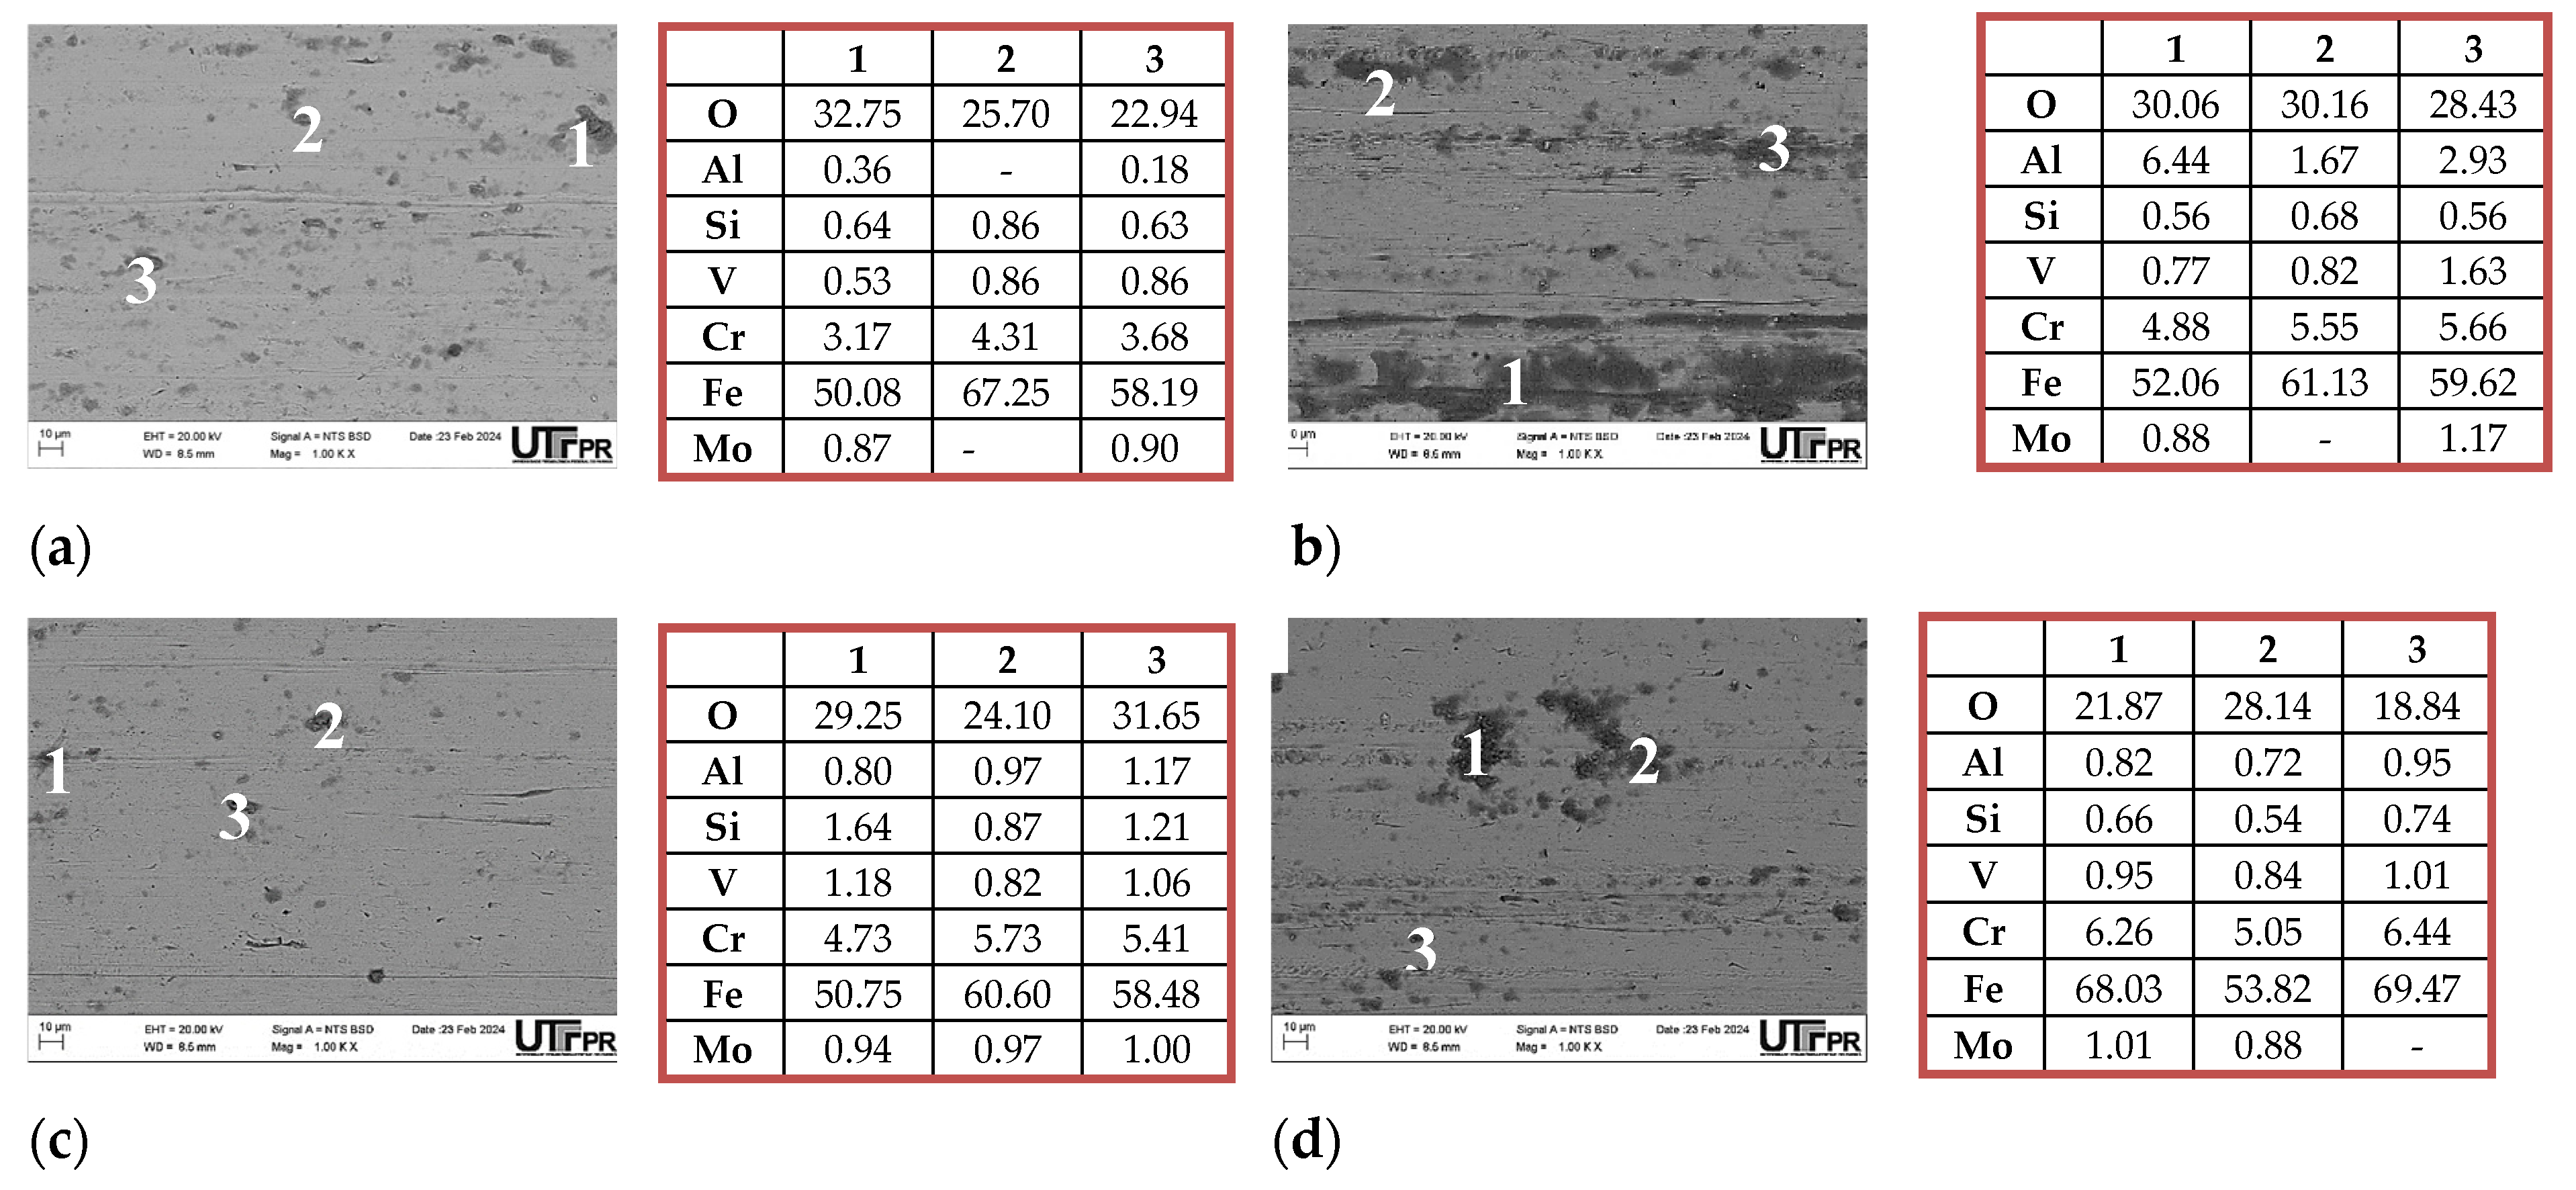
Figure 10.
EDS analysis of wear tracks under test conditions at a temperature of 200 °C. (a) DIN 1.2344 of 46 HRC; (b) WP7V of 48.5 HRC; (c) WP7V of 54 HRC; (d) WP7V of 57 HRC.
Figure 10.
EDS analysis of wear tracks under test conditions at a temperature of 200 °C. (a) DIN 1.2344 of 46 HRC; (b) WP7V of 48.5 HRC; (c) WP7V of 54 HRC; (d) WP7V of 57 HRC.
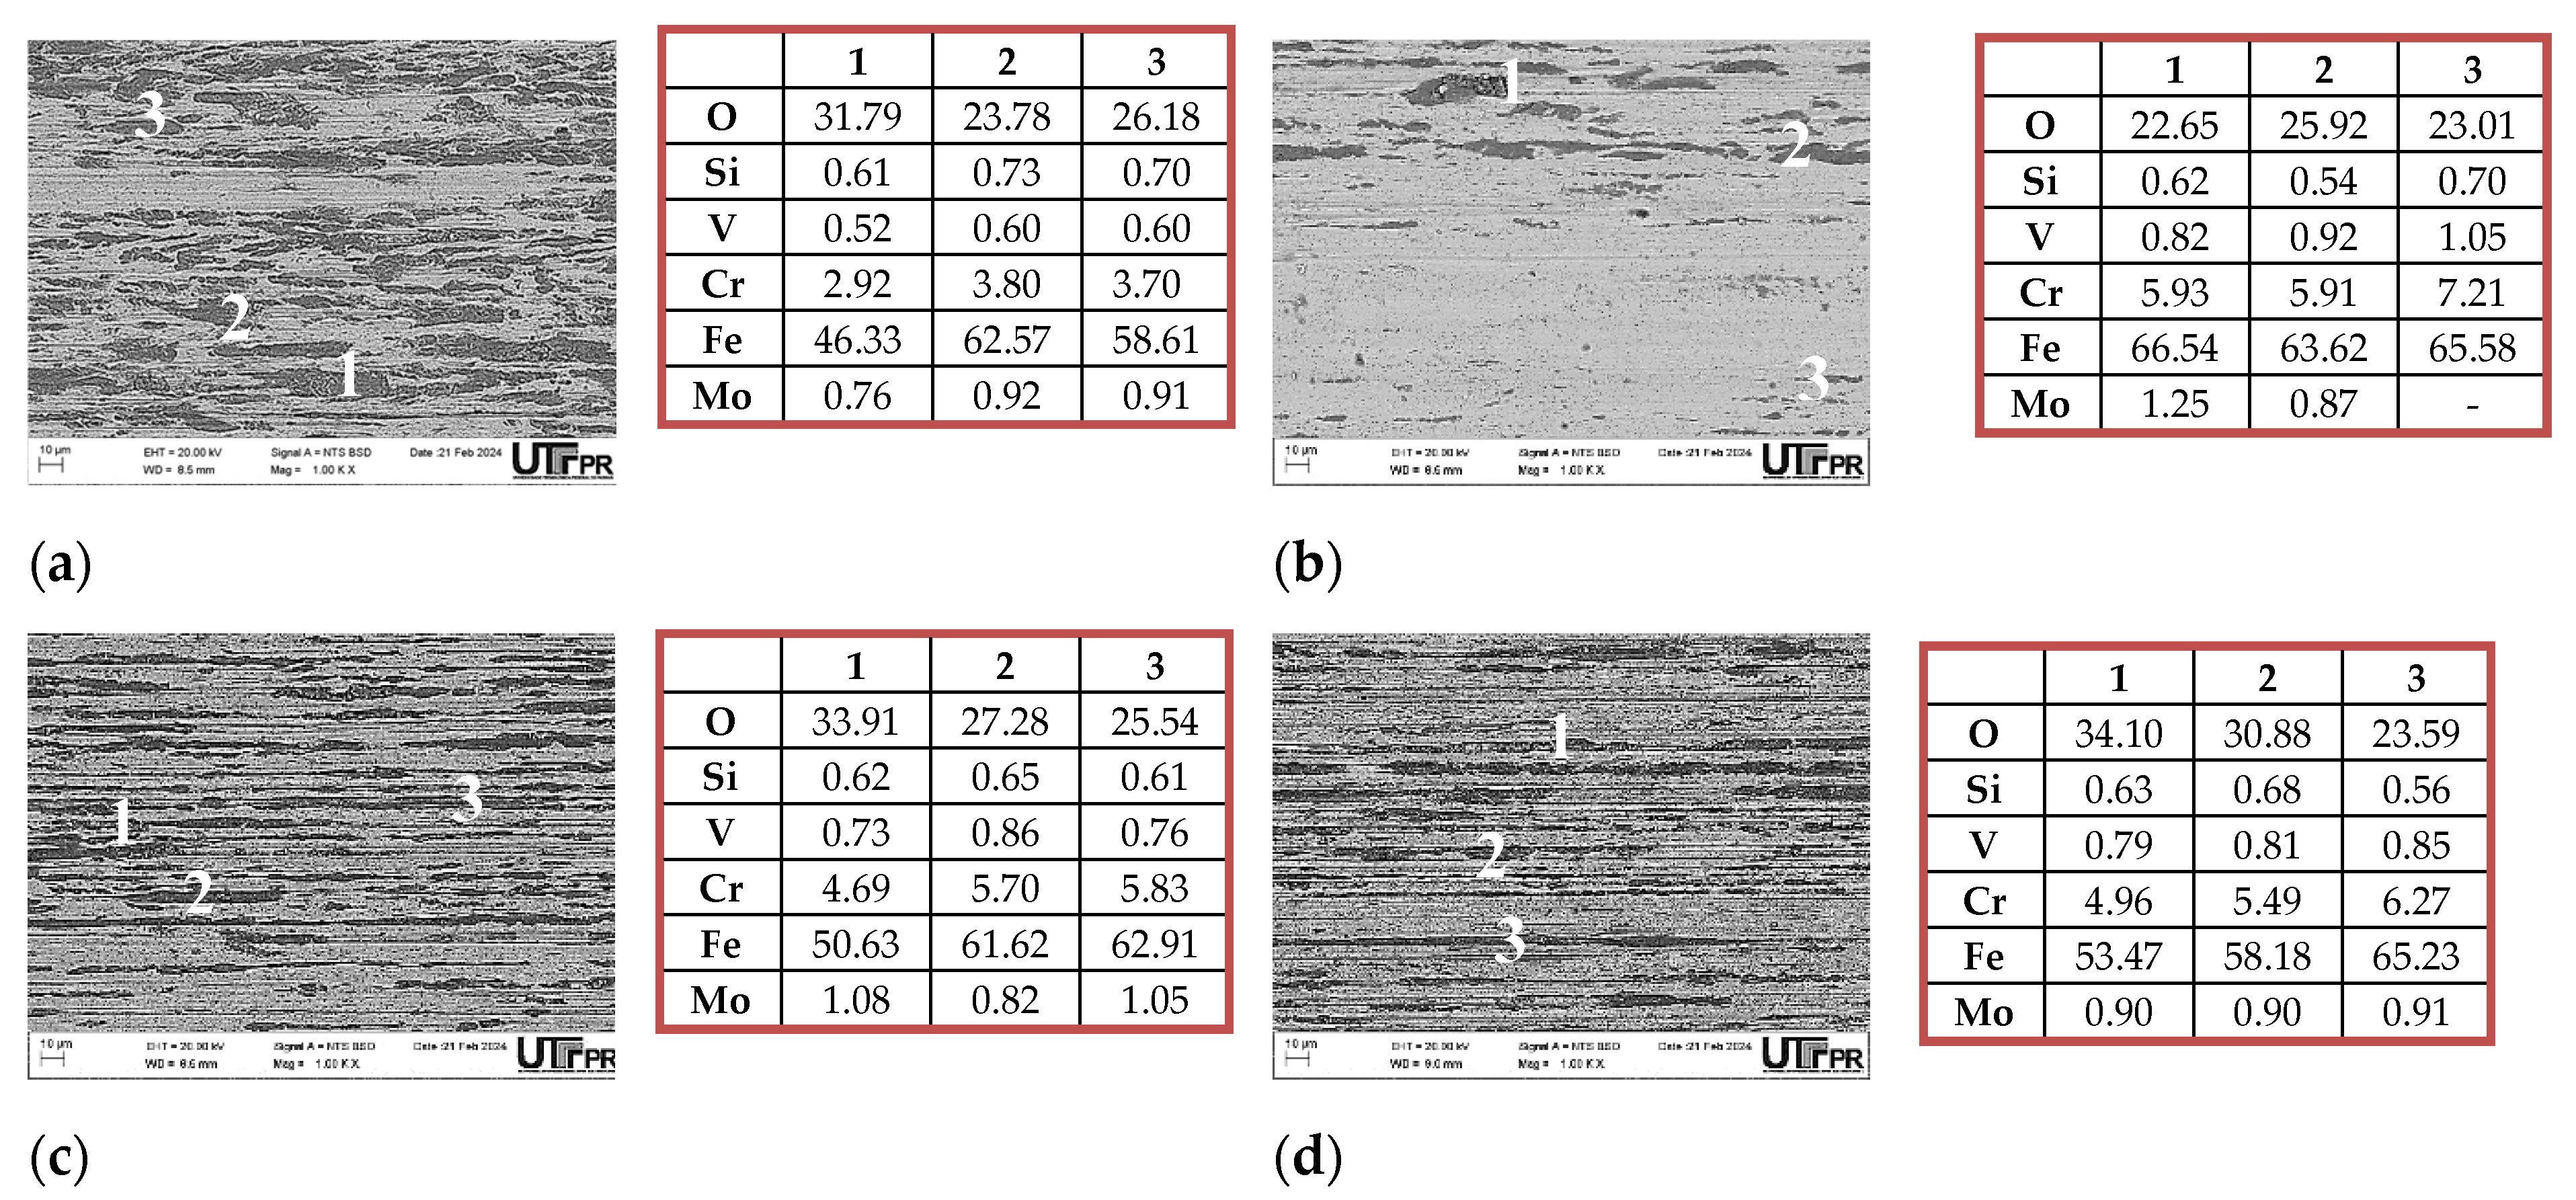
Figure 11.
Raman shift of wear-tested. (a) Room Temperature (RT); (b) 200 °C.
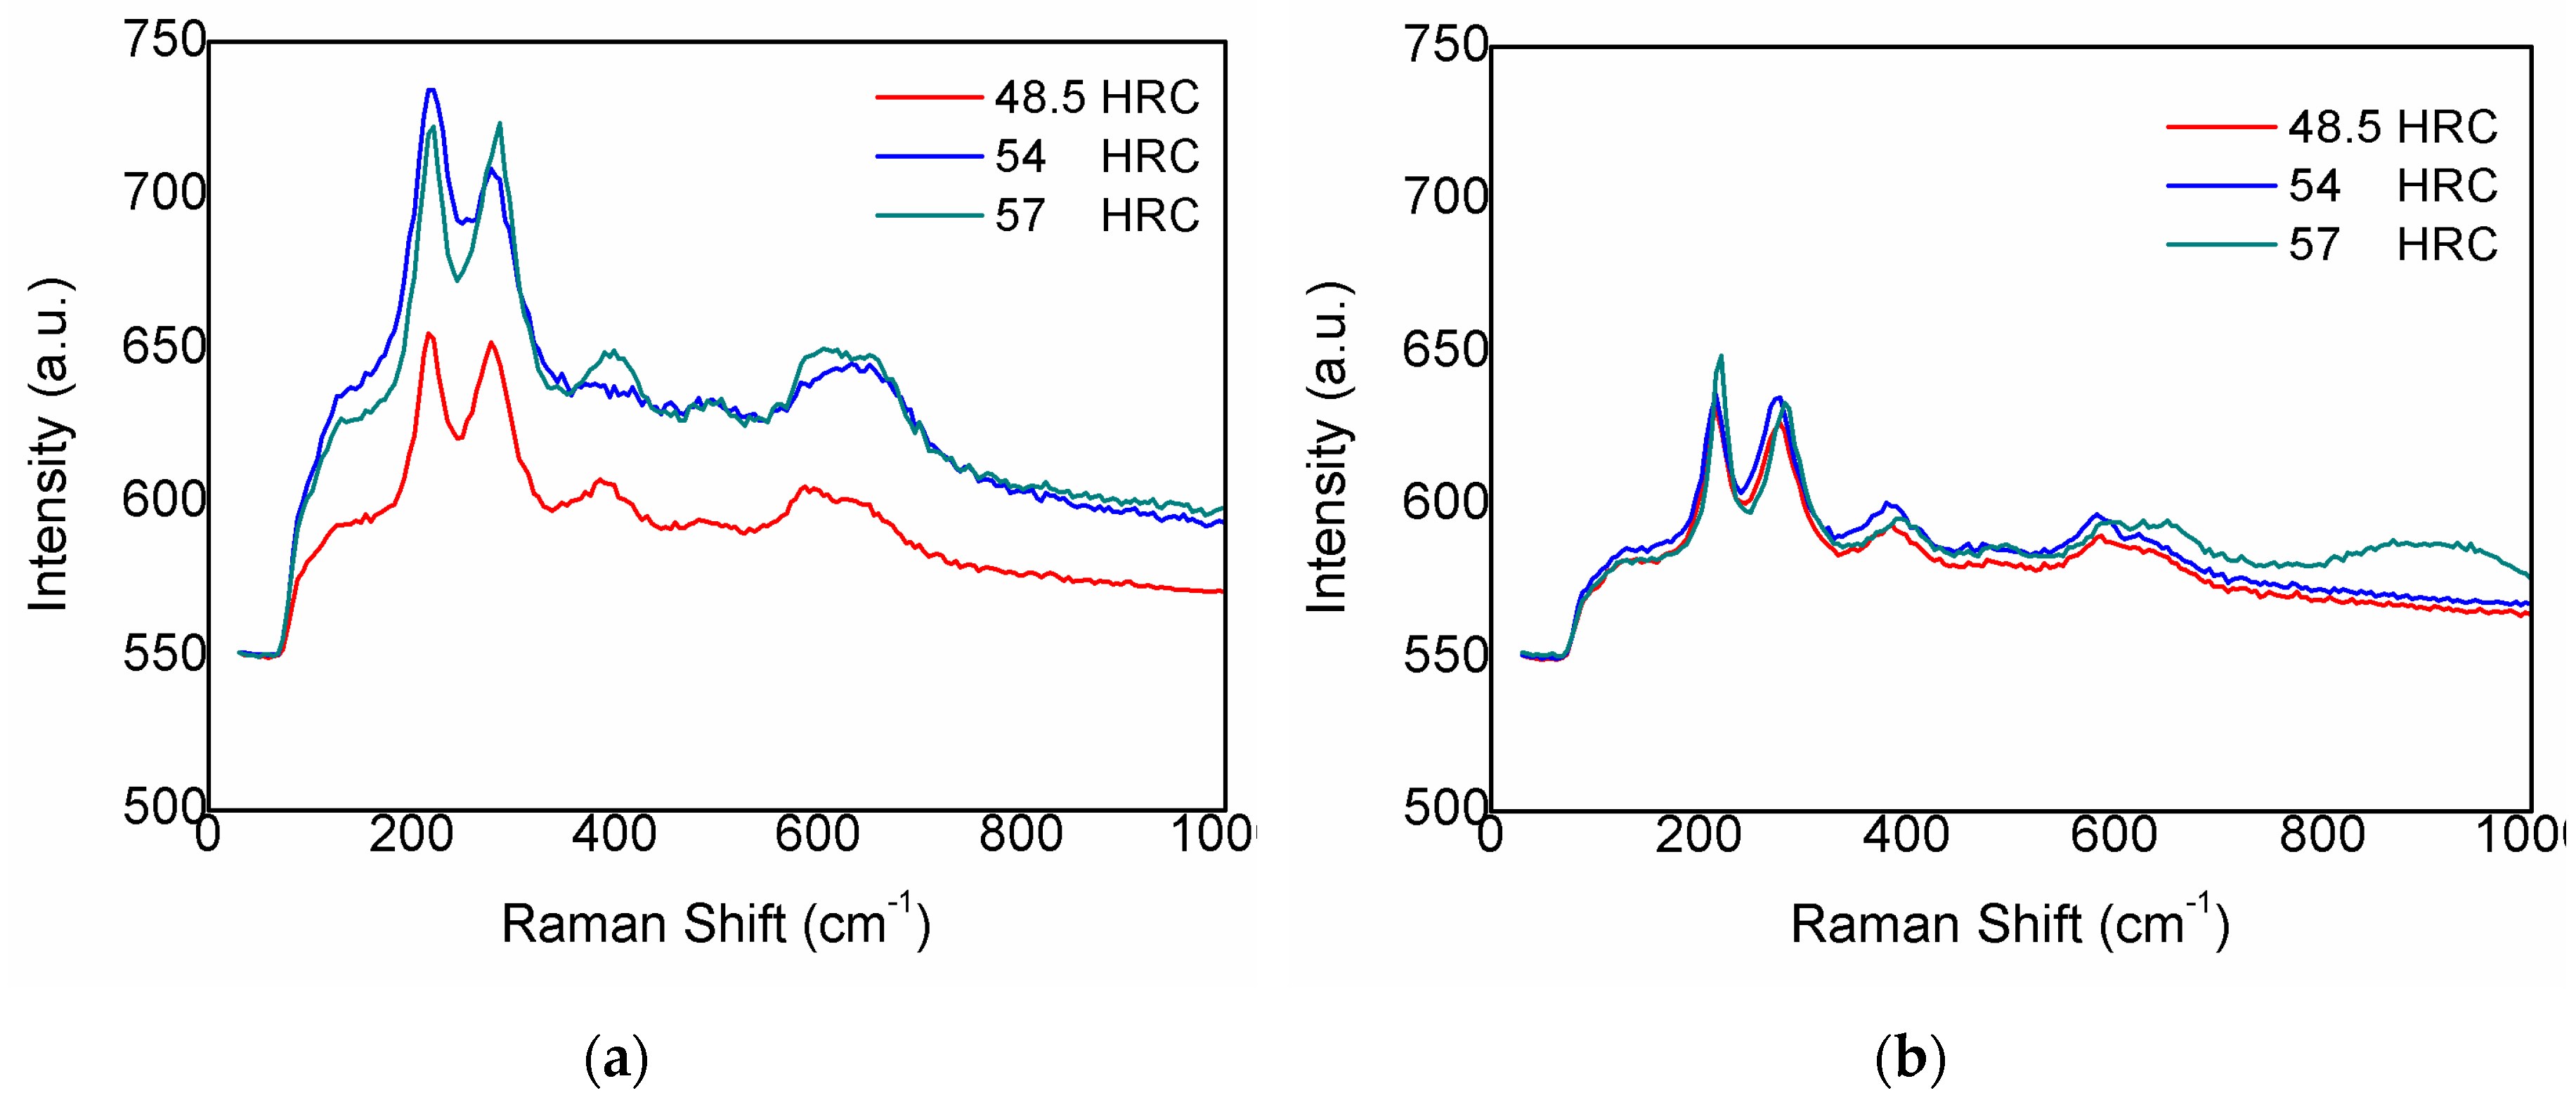
Figure 12.
Worn balls from room temperature tests: (a) DIN 1.2344 of 46 HRC; (b) WP7V of 48.5 HRC; (c) WP7V of 54 HRC; (d) WP7V of 57 HRC.
Figure 12.
Worn balls from room temperature tests: (a) DIN 1.2344 of 46 HRC; (b) WP7V of 48.5 HRC; (c) WP7V of 54 HRC; (d) WP7V of 57 HRC.
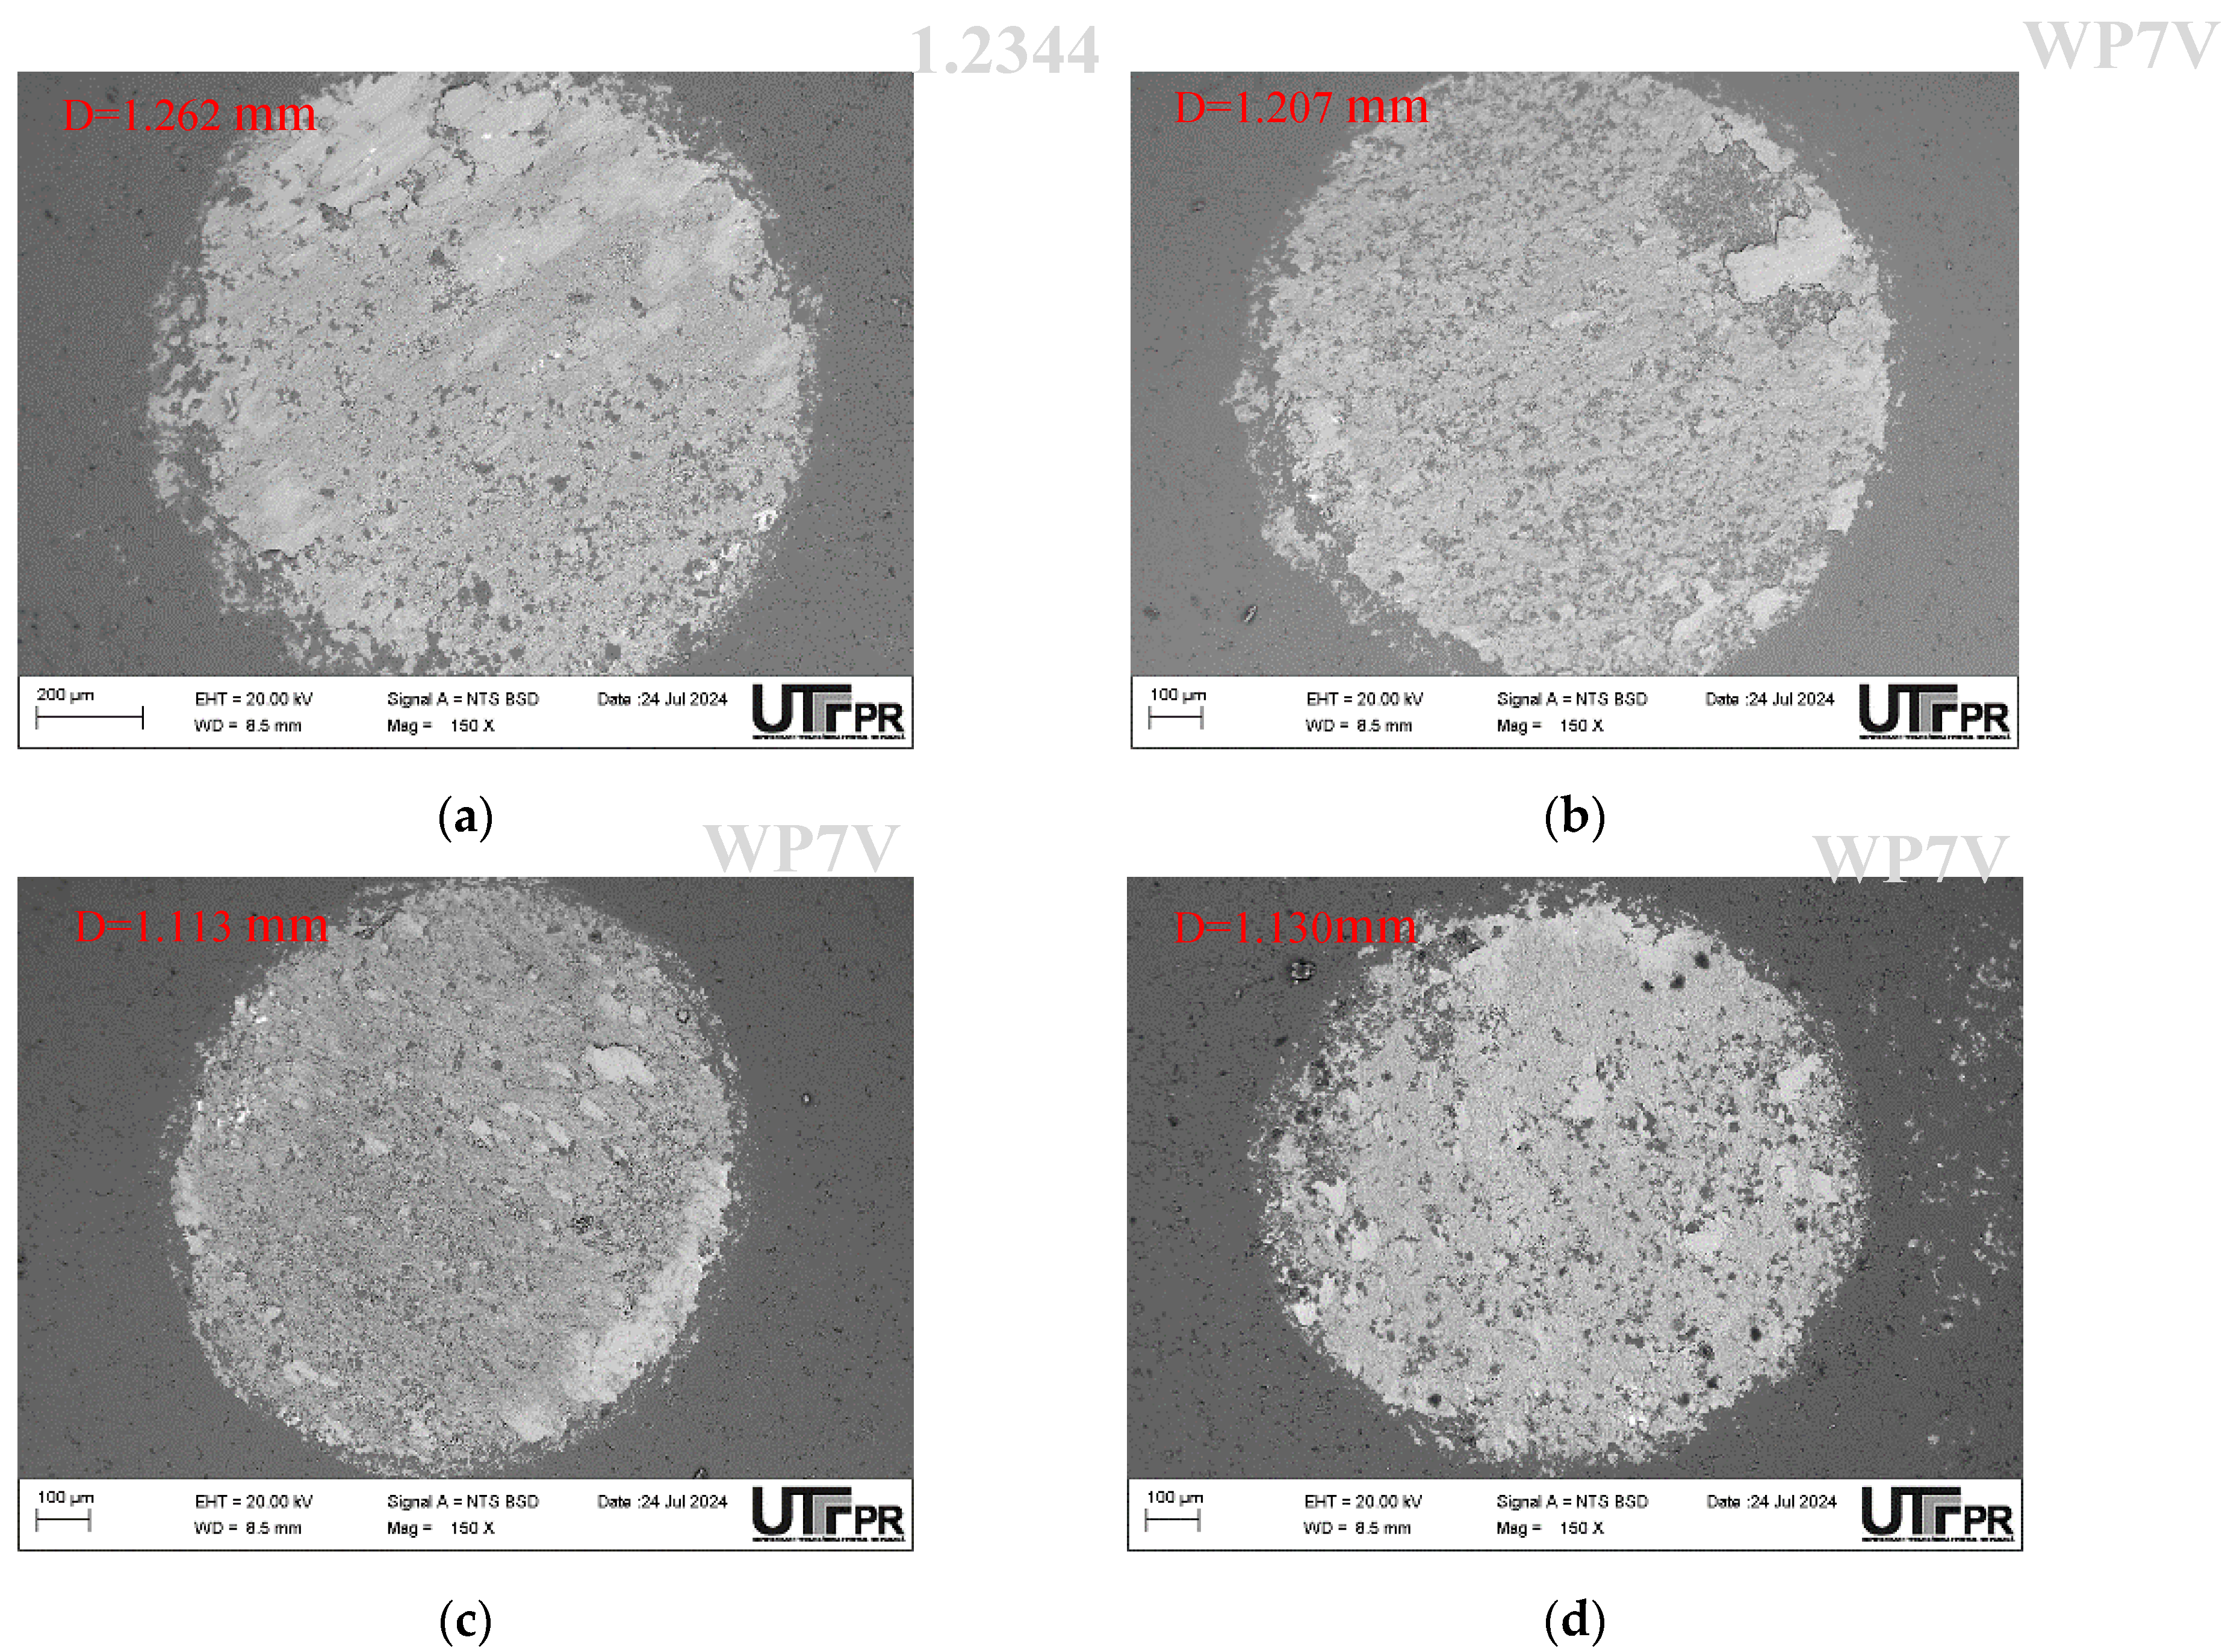
Figure 13.
Worn balls from tests at a temperature of 200 °C: (a) DIN 1.2344 of 46 HRC; (b) WP7V of 48.5 HRC; (c) WP7V of 54 HRC; (d) WP7V of 57 HRC.
Figure 13.
Worn balls from tests at a temperature of 200 °C: (a) DIN 1.2344 of 46 HRC; (b) WP7V of 48.5 HRC; (c) WP7V of 54 HRC; (d) WP7V of 57 HRC.
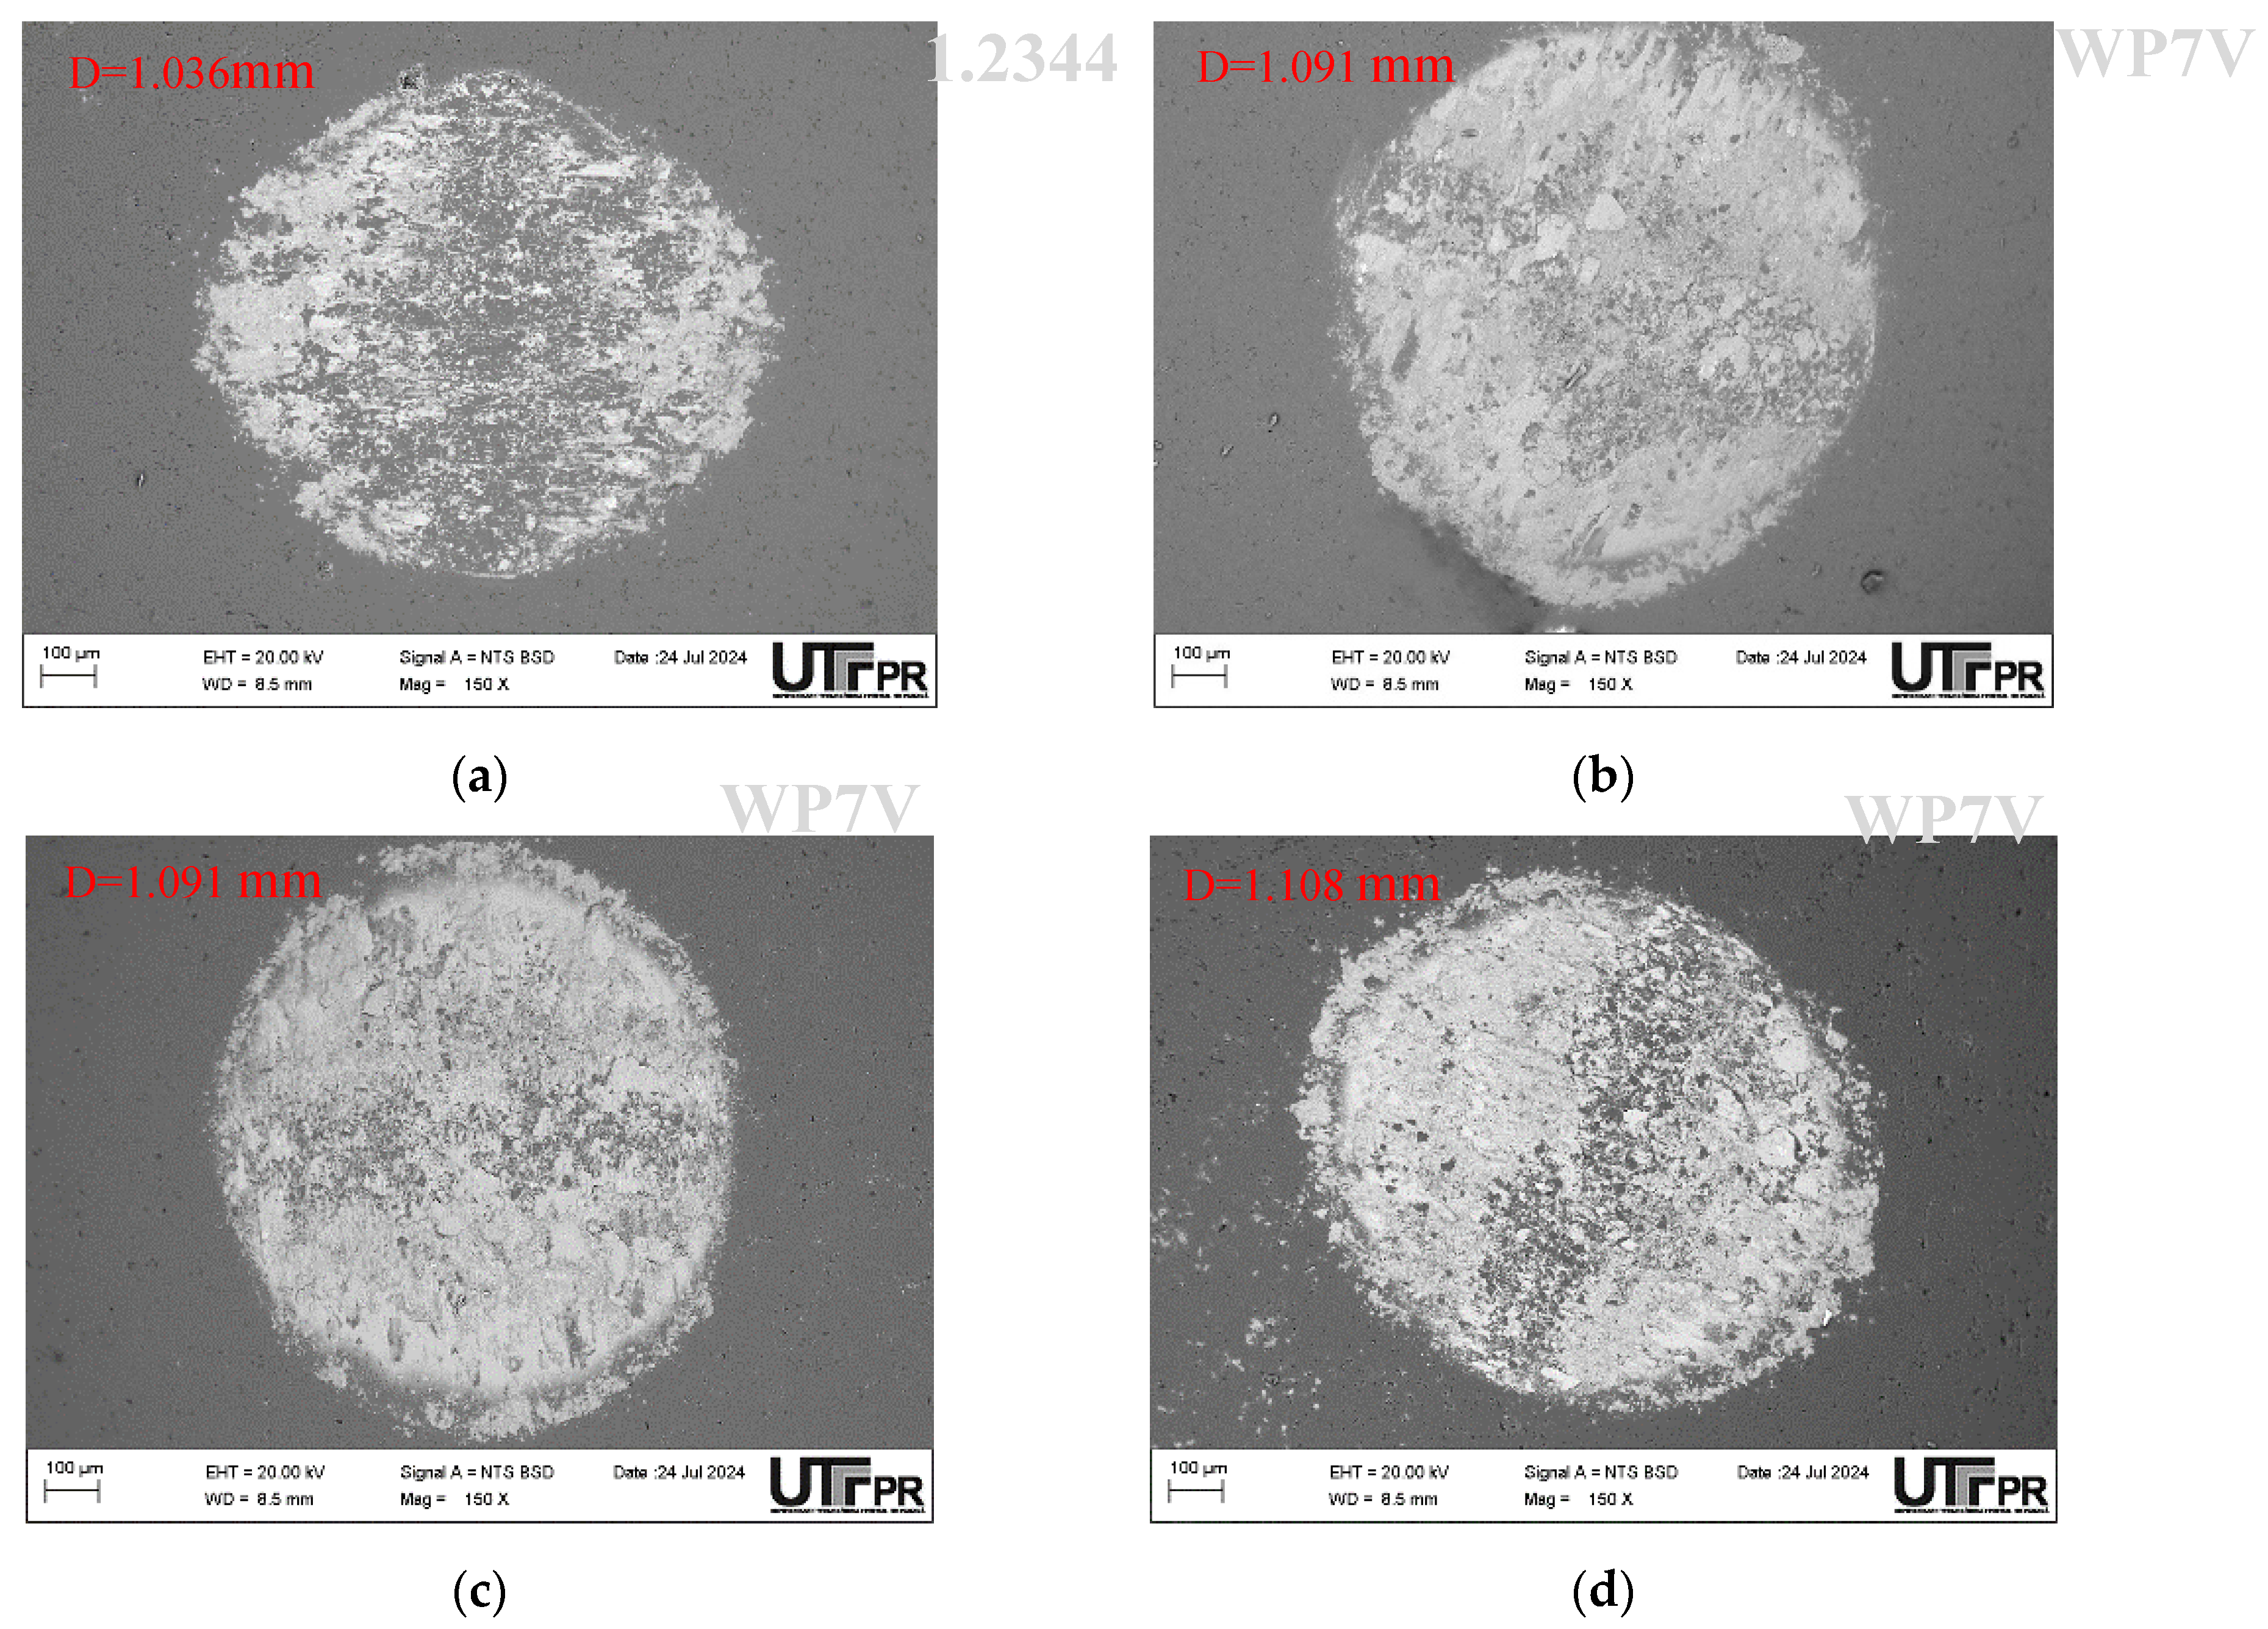
Figure 14.
EDS analysis of worn balls under room temperature tests: (a) DIN 1.2344 of 46 HRC; (b) WP7V of 48.5 HRC; (c) WP7V of 54 HRC; (d) WP7V of 57 HRC.
Figure 14.
EDS analysis of worn balls under room temperature tests: (a) DIN 1.2344 of 46 HRC; (b) WP7V of 48.5 HRC; (c) WP7V of 54 HRC; (d) WP7V of 57 HRC.
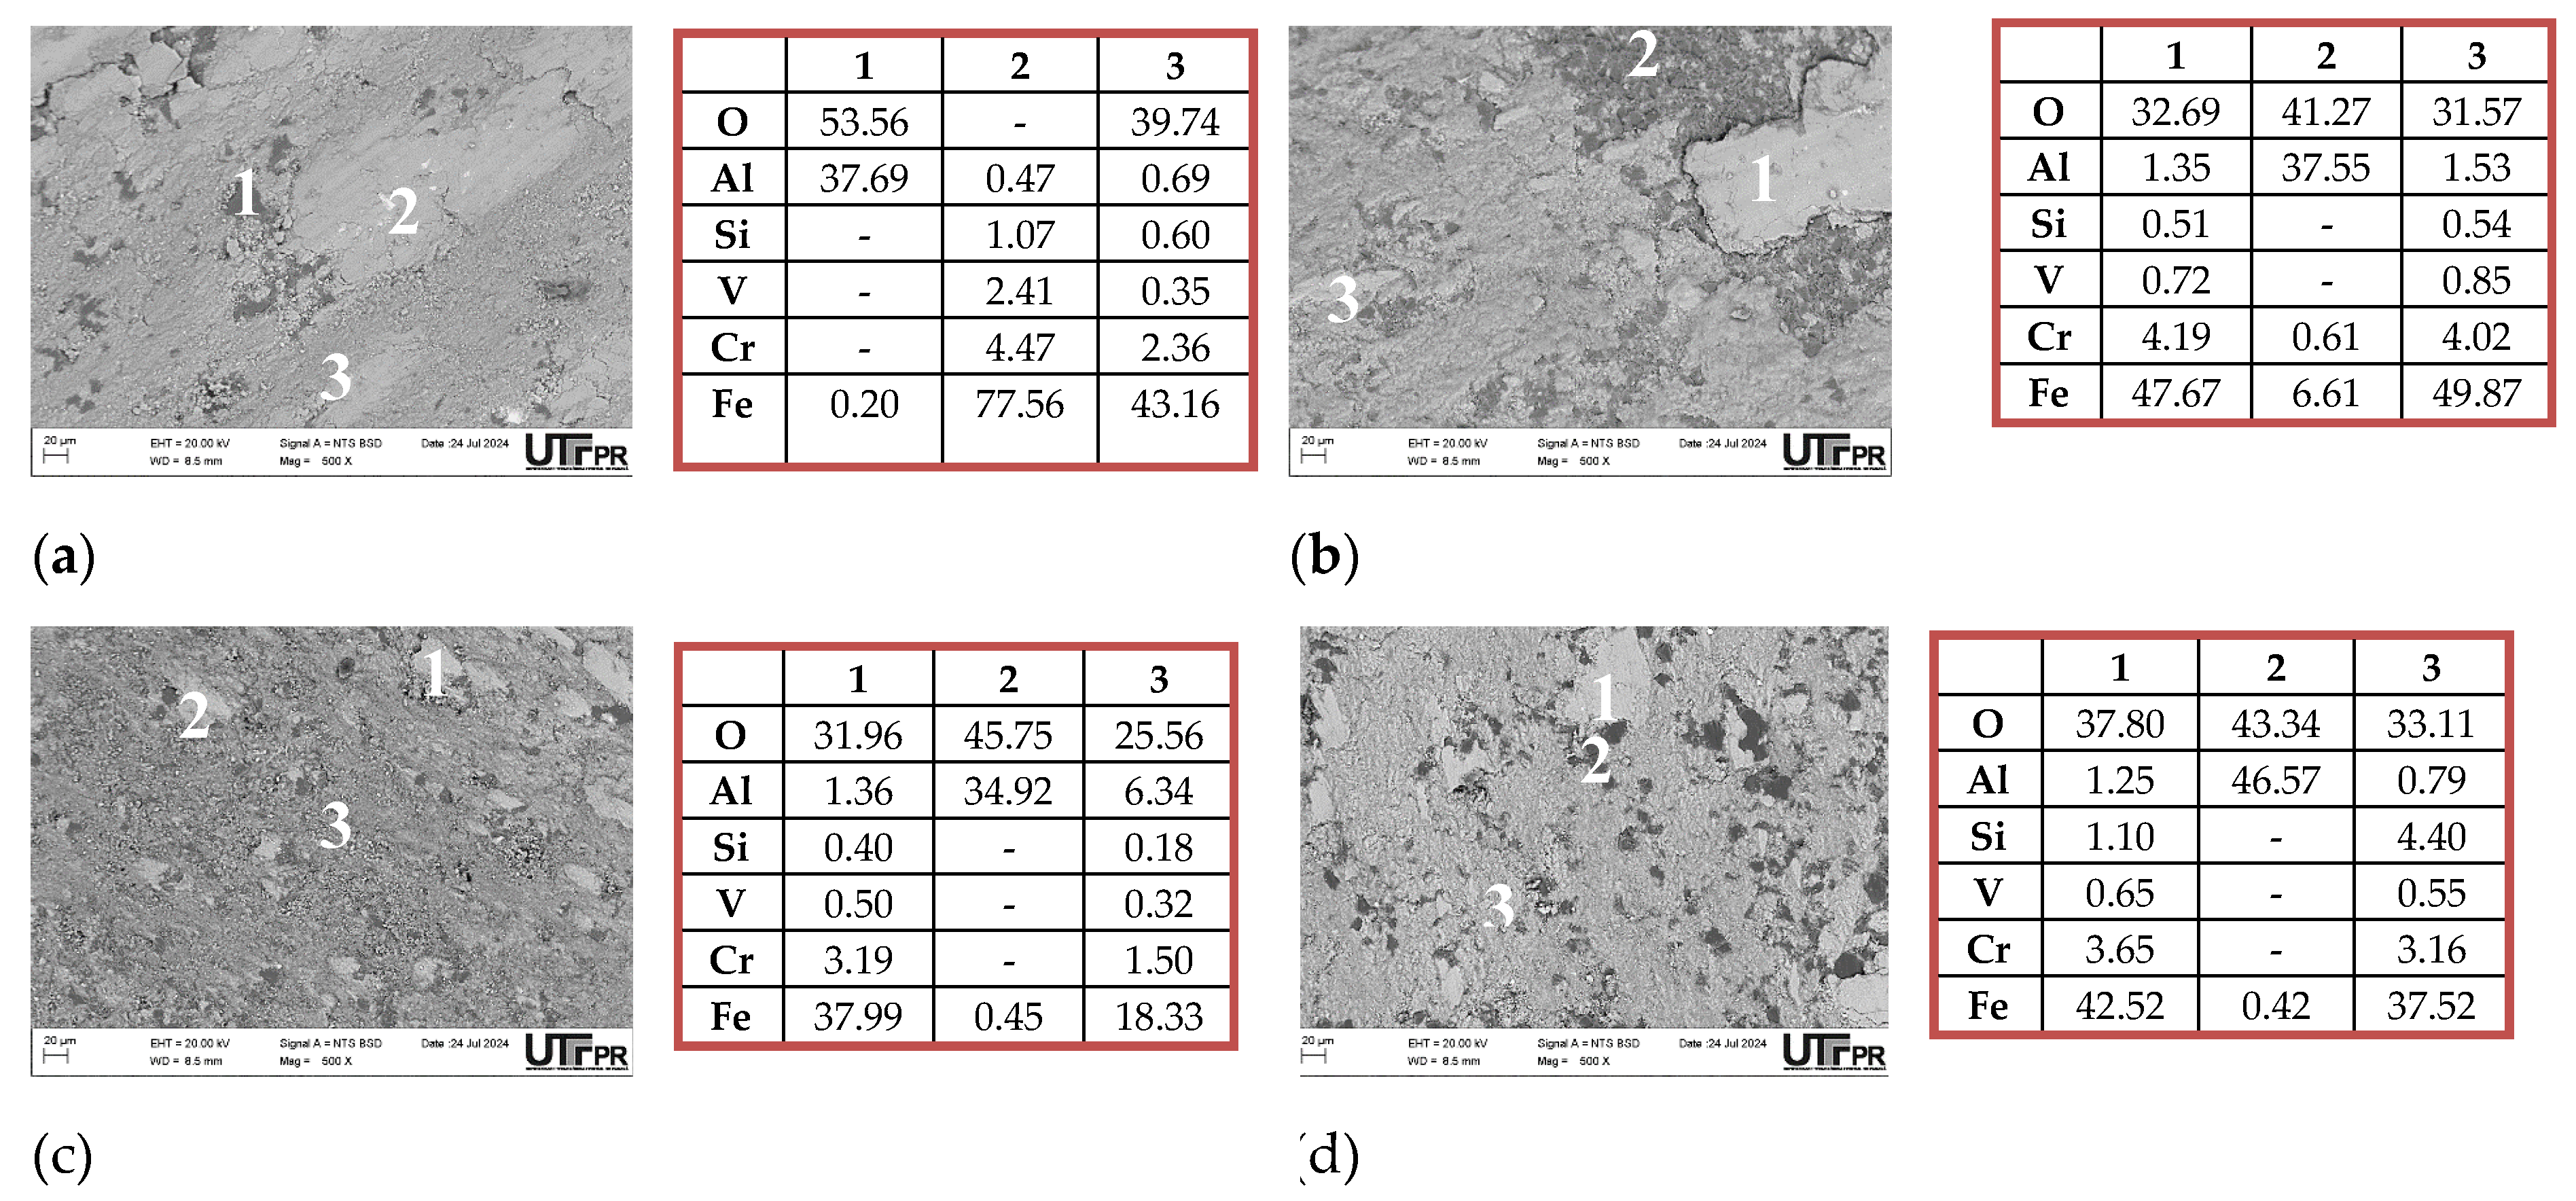
Figure 15.
EDS analysis of worn balls under 200 °C tests: (a) DIN 1.2344 of 46 HRC; (b) WP7V of 48.5 HRC; (c) WP7V of 54 HRC; (d) WP7V of 57 HRC.
Figure 15.
EDS analysis of worn balls under 200 °C tests: (a) DIN 1.2344 of 46 HRC; (b) WP7V of 48.5 HRC; (c) WP7V of 54 HRC; (d) WP7V of 57 HRC.
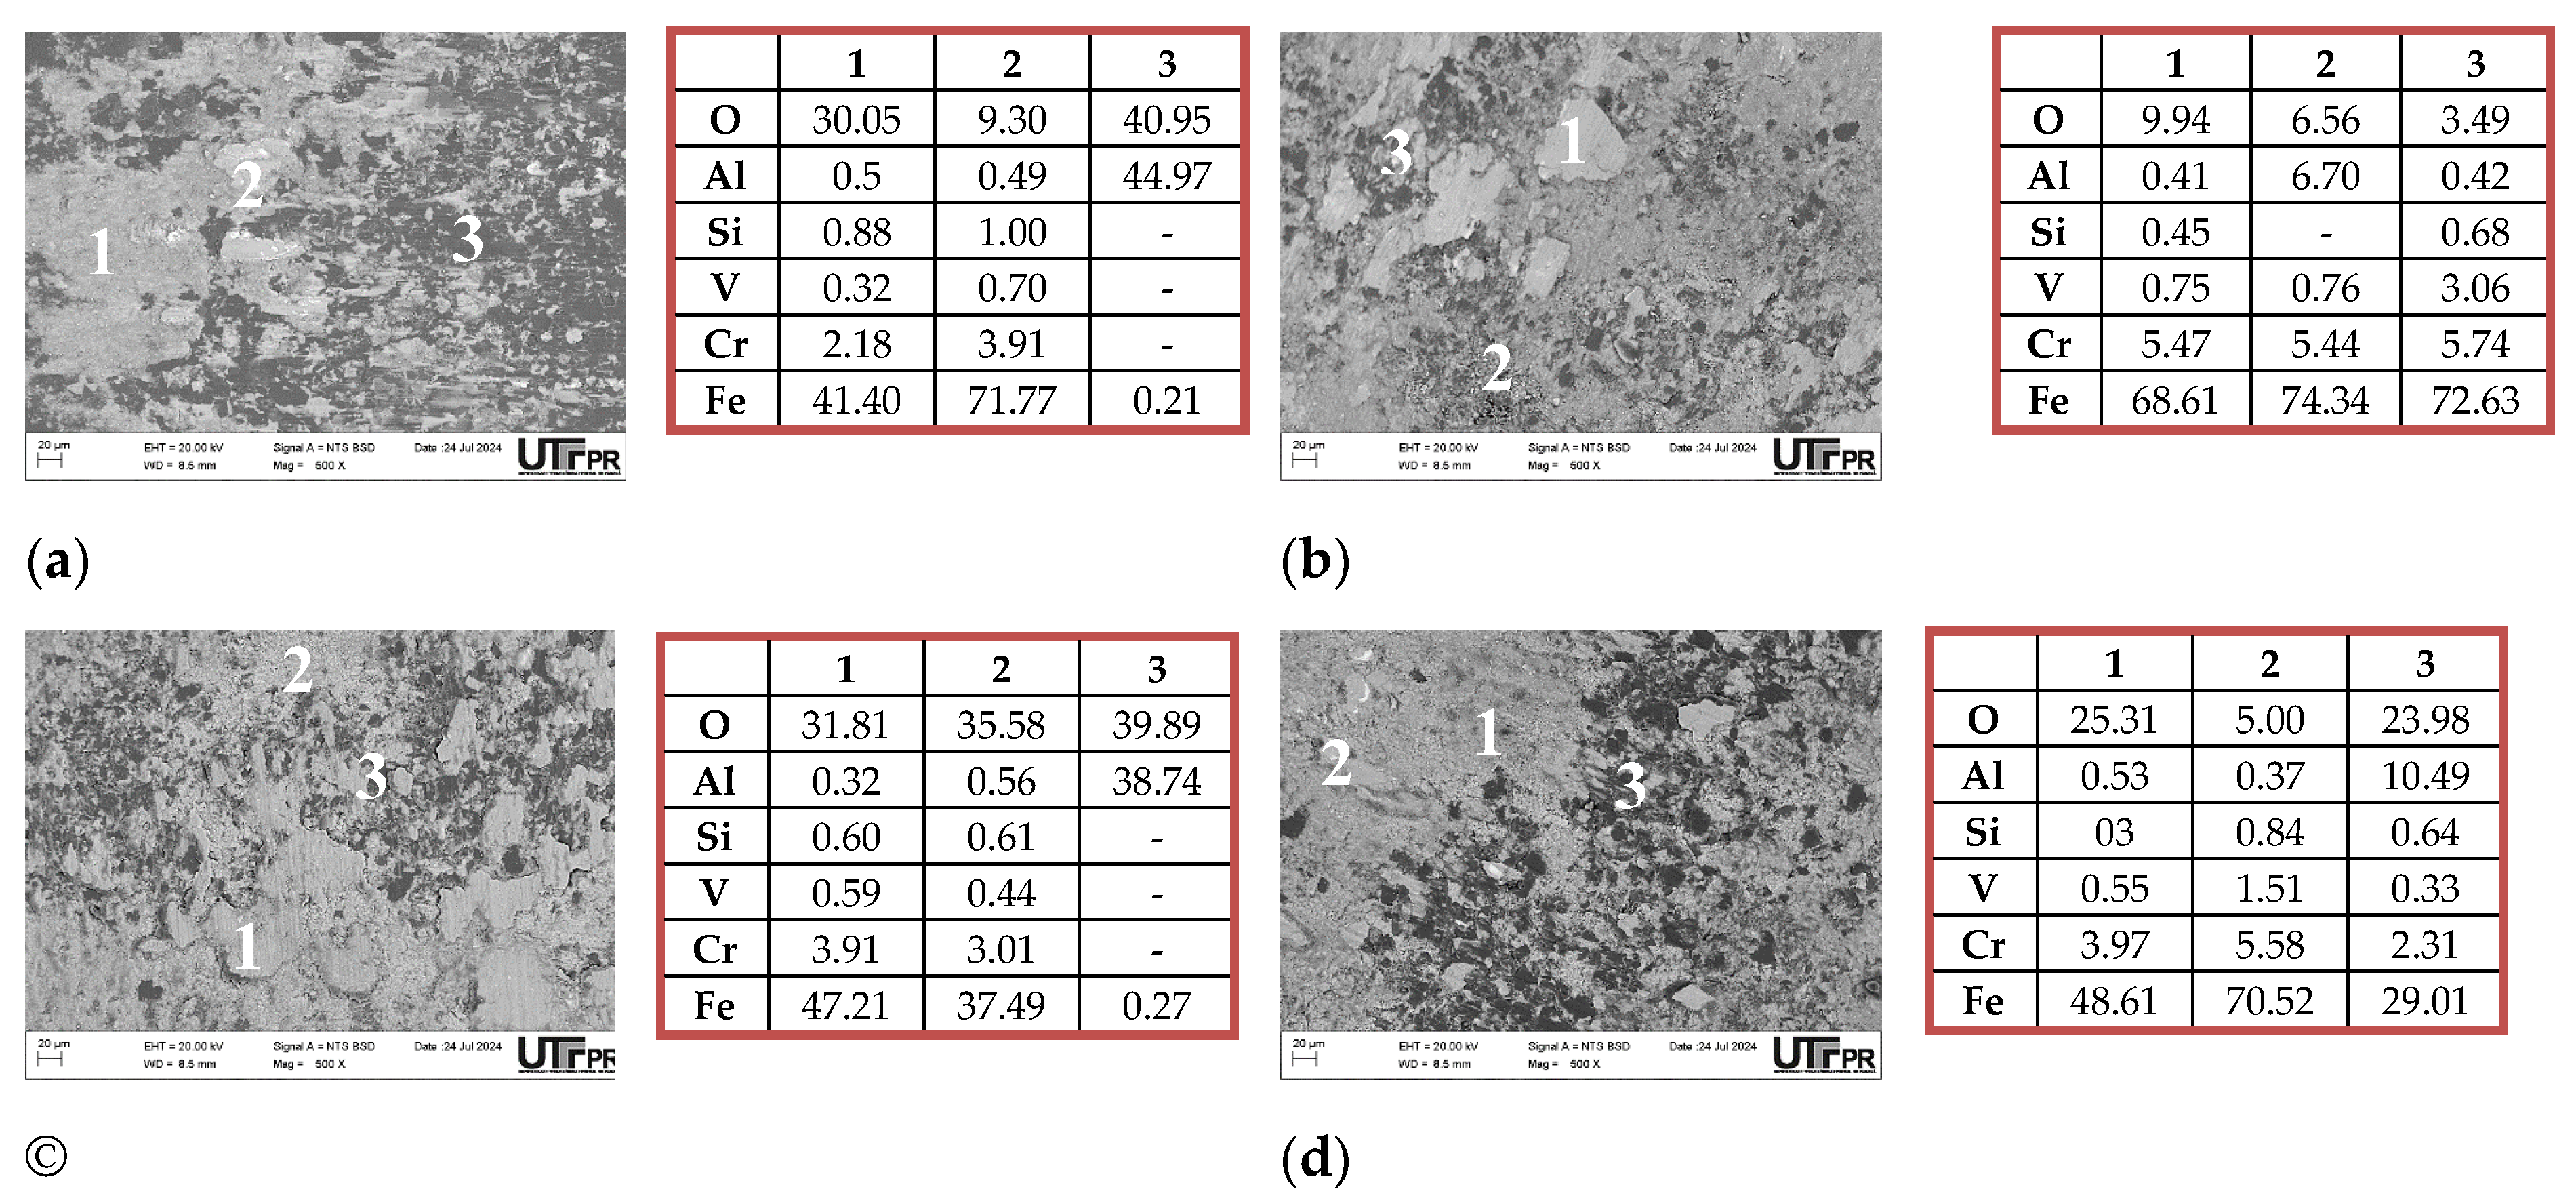
Figure 16.
Summary of tribological behaviors as a function of test temperature.
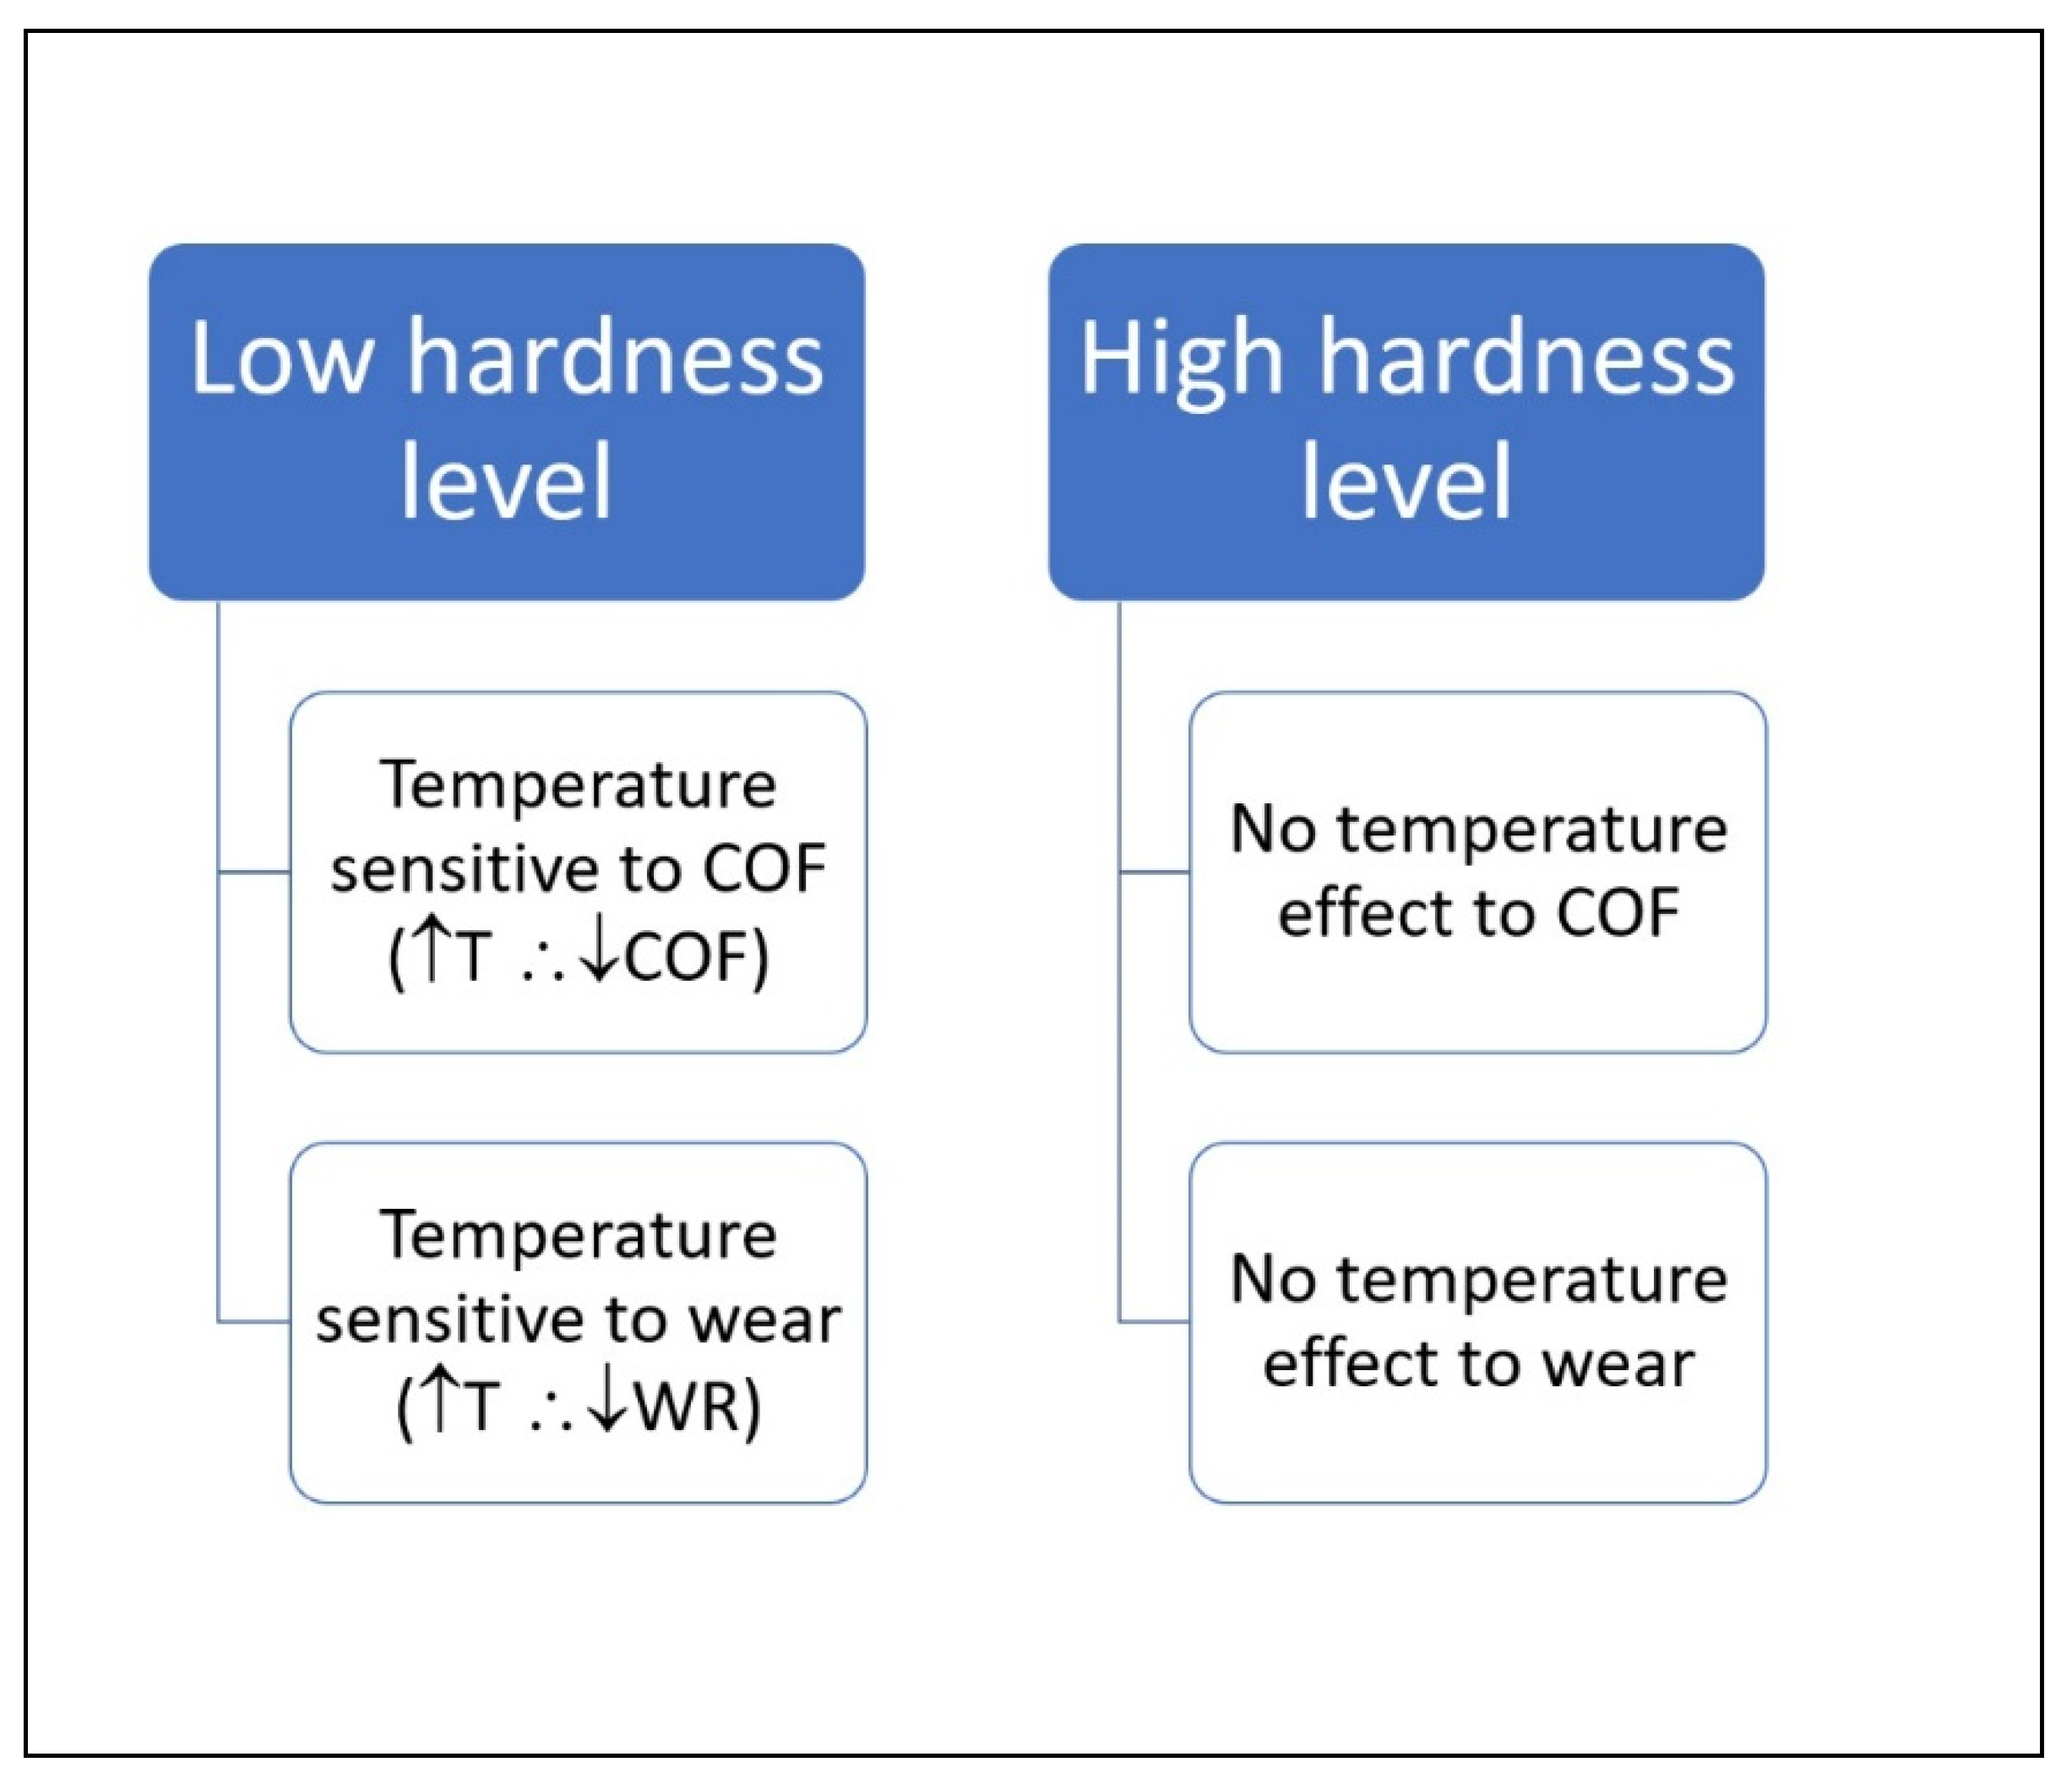
Figure 17.
Summary of the wear mechanisms for the RT condition. Softer tool steels experienced all steps, while harder tool steels only the two initial ones, predominantly.
Figure 17.
Summary of the wear mechanisms for the RT condition. Softer tool steels experienced all steps, while harder tool steels only the two initial ones, predominantly.
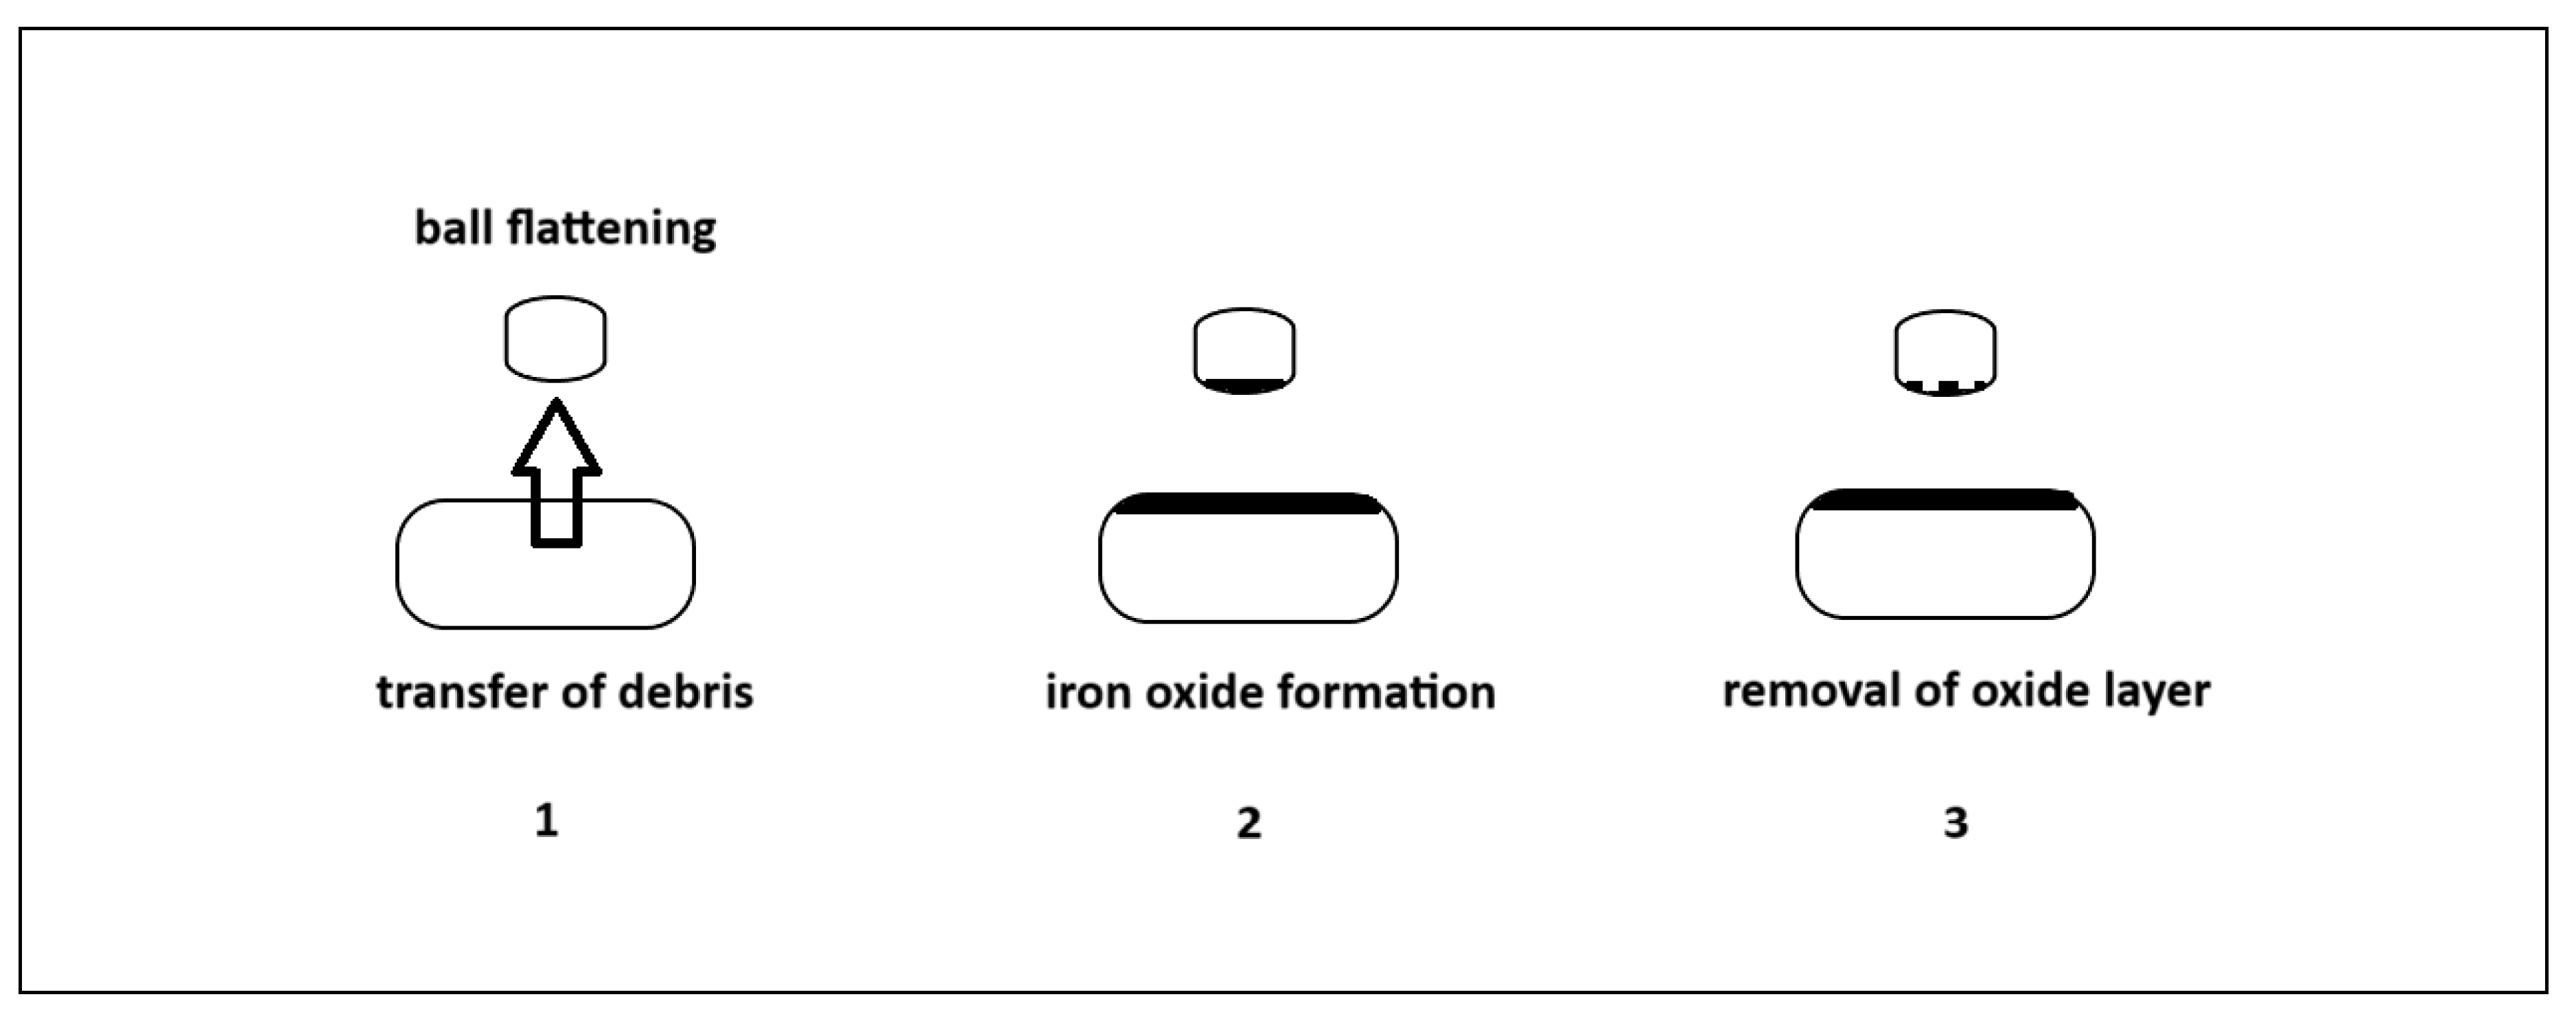

Table 1.
Chemical composition of DIN 1.2344 and WP7V tool steels.
| Tool steel | C | Si | Mn | Cr | Mo | V | W | S | P |
|---|---|---|---|---|---|---|---|---|---|
| 1.2344 | 0.365 | 0.933 | 0.354 | 4.888 | 0.999 | 0.898 | 0.057 | 0.014 | 0.012 |
| WP7V | 0.466 | 0.869 | 0.373 | 7.361 | 1.110 | 1.215 | 0.119 | 0.012 | 0.020 |
Table 2.
Average hardness values in HRC and HV scales.
| Level | Tool steel | Hardness (HRC) | Microhardness (HV0.3) |
|---|---|---|---|
| Low hardness | 1.2344 | 46 ± 0.7 | 501 ± 6.9 |
| WP7V | 48.5 ± 0.3 | 499 ± 9.5 | |
| High hardness | WP7V | 54.0 ± 0.2 | 599 ± 1.1 |
| 56.9 ± 0.2 | 674 ± 13 |
Table 3.
Average absorbed energy values of DIN 1.2344 and WP7V tool steels.
| Level | Tool Steel | Hardness (HRC) | Unnotched impact test |
|---|---|---|---|
| Low hardness | 1.2344 | 46 | 152 ± 37 |
| WP7V | 48.5 | 58.2 ± 24 | |
| High hardness | WP7V | 54 | 45 ± 23 |
| 57 | 30.5 ± 4.5 |
Table 4.
Average COF values for tests at room temperature and 200 °C.
| Level | Tool steel | RT | 200 °C |
|---|---|---|---|
| Low hardness | 1.2344 | 0.601±0.008 | 0.589±0.009 |
| WP7V | 0.62±0.02 | 0.59±0.01 | |
| High hardness | WP7V | 0.597±0.006 | 0.603±0.002 |
| 0.609±0.0012 | 0.589±0.005 |
Table 5.
Average track width values in (mm) for tests at room temperature and 200 °C.
| Level | Tool Steel | RT | 200 °C |
|---|---|---|---|
| Low hardness | 1.2344 | 1.28±0.03 | 0.96±0.05 |
| WP7V | 1.31±0.01 | 0.92±0.01 | |
| High hardness | WP7V | 1.19±0.04 | 0.88±0.002 |
| 1.18±0.03 | 0.91±0.01 |
Disclaimer/Publisher’s Note: The statements, opinions and data contained in all publications are solely those of the individual author(s) and contributor(s) and not of MDPI and/or the editor(s). MDPI and/or the editor(s) disclaim responsibility for any injury to people or property resulting from any ideas, methods, instructions or products referred to in the content. |
© 2024 by the authors. Licensee MDPI, Basel, Switzerland. This article is an open access article distributed under the terms and conditions of the Creative Commons Attribution (CC BY) license (http://creativecommons.org/licenses/by/4.0/).
Copyright: This open access article is published under a Creative Commons CC BY 4.0 license, which permit the free download, distribution, and reuse, provided that the author and preprint are cited in any reuse.


