
Submitted:
18 November 2024
Posted:
20 November 2024
You are already at the latest version
Abstract
Physical activity undertaken by different groups of individuals results in the rearrangement of microbiota composition towards a symbiotic microbiota profile. This applies to both healthy and diseased individuals. Multiple myeloma (MM), one of the more common hematological malig-nancies, predominantly affects older adults. Identifying an appropriate form of physical activity for this patient group remains a challenge. The aim of the study was to investigate the impact of a 6-week Nordic Walking (NW) training program combined with a 10/14 time restricted eating regimen on the gut microbiota composition of multiple myeloma patients.
The study included healthy individuals as the control group (n=16; mean age 62.19 ± 5.4) and patients with multiple myeloma in remission (MM group; n=16; mean age 65.00 ± 5.13, mean disease duration 57 months). The training intervention was applied to the patient group and consisted of three moderate-intensity sessions per week, individually tailored to the estimated physical capacity of each participant.
Taxonomic composition was determined using 16S rRNA sequencing (V3-V9 regions). The microbiota composition was compared between the patient group and the control group. The gut microbiota of the patients was predominantly represented by the phyla Firmicutes, Actinobacteria, Verrucomicrobia, Proteobacteria, and Bacteroidetes. The training, combined with intermittent fasting, stimulated an increase in biodiversity and taxonomic rearrangement of gut microbiota species. The observed changes confirm the safety and beneficial effects of the proposed intervention in the patient group during the plateau phase of multiple myeloma.
Keywords:
physical activity
; Nordic walking
; multiple myeloma
; time restricted eating
; intestinal microbiota
; haematological malignancies
; gut microbiome
1. Introduction
In recent years, there has been increasing interest in the taxonomic composition of microorganisms (microbiota) and their physiological potential (enzymes, toxins, metabolic products, etc.) as determined by their genome (microbiome). Modern genetic material sequencing technologies Thanks to modern genetic material sequencing technologies [1,2,3] , it is possible to gain detailed knowledge about the composition of gut microbiota. Next-generation sequencing (NGS) allows for the parallel sequencing of thousands of DNA samples, which significantly shortens sequencing time, and, when combined with nanopore technology, provides information about the nucleotide composition of long sequences, gene content in the analyzed pool, and thus knowledge about the microbiome or microbiota when taxonomic composition is being studied. In studies on species composition, bacterial taxonomy most commonly uses 16S rRNA gene sequencing [4,5,6]. At least 800 different bacterial taxa at the species level have been identified from the feces of healthy individuals [7]. The stability of microbiota composition is low and undergoes constant changes in response to external factors such as nutritional status, environmental factors, lifestyle, health condition, or diseases [4].
A review of the literature on physical activity and its impact on the rearrangement of microbiota composition indicates an increase or emergence of populations of microorganisms considered to have a positive impact on human health (so-called symbiotic microbiota) [4,5,6,8]. The effect of physical activity on microbiota composition has been described for various forms of physical activity or physical training. Studies conducted by the Bressa team indicate a change in the microbiota profile in healthy individuals who engage in low-dose but continuous physical activity, leading to an increase in the abundance of bacteria considered beneficial for health (e.g., Bifidobacterium spp., Roseburia hominis, Akkermansia muciniphila, Faecalibacterium prausnitzii) [5]. A review of studies on the impact of physical exercise or physical activity in both healthy individuals and patients (chronic diseases – such as obesity, metabolic syndrome, diabetes, atherosclerosis, liver dysfunction, and inflammatory bowel disease (IBD)) on gut microbiota indicates a rearrangement of the microbiota profile in both populations. The direction and scope of changes are determined by the health status and the intensity and duration of physical exercise [6]. The evaluation of data presented by Humińska-Lisowska et al. [8] shows that changes in microbiota in the group of healthy, fit, and physically active individuals—strength and endurance athletes, as well as the control group—indicate similar microbiota features in all participants, confirming mutual positive interactions. However, in the group with a high volume of training or endurance exercises, an increase in populations of carbohydrate-degrading bacteria was observed. Researchers noted that microbiota diversity correlates with VO2max. They also found that performance parameters, most strongly VO2max, are positively correlated with species such as Bifidobacterium longum, Bifidobacterium adolescentis, and Prevotella. A negative correlation of VO2max was estimated for Bacteroides. Endurance loads (endurance sports and associated training) show a correlation with the presence of butyrate producers among short-chain fatty acids (Blautia wexlerae, Eubacterium rectale, Intestinimonas timonensis), which is associated with the power output of physically active individuals.
Studies already performed on the gut microbiota in patients with multiple myeloma have indicated a correlation between its composition and the immunological specificity of the gut environment [9,10,11,12], as well as a distinct microbiota composition compared to healthy individuals [13,14]. In a group of patients with multiple myeloma, Korde et al. observed a positive effect of physical activity on the patient’s health during successive cycles of treatment [15]. Patients in this study were continuously monitored, their physical activity level was assessed based on the number of steps taken per day. Prior to the introduction of the therapeutic cycle, activity was at the level of 4,818 steps in the cohort under 65 years of age and 6,000 steps/day in the older cohort. After the last studied cycle, activity ranged from 6,300 to 7,300 steps/day, which, as the authors noted, positively influenced the treatment process. Activity trends were associated with improvements in physical functioning and overall health status. A negative correlation was also observed between physical activity levels and disease burden symptom scores [15]. Surprisingly, older patients showed greater increases in activity (+260 steps/24 h per cycle) compared to patients in the >65 years cohort (+116 steps/24 h per cycle).
Another significant factor affecting the gut microbiota is time-restricted eating (TRE) [16]. It is already known that the TRE/Time Restricted Feeding (TRF) approach is essential for the targeted utilization of nutrients and the metabolism of the host’s nutritional status through modulation of the gut microbiota and circadian rhythms. This approach has shown a widespread effect in restoring gut microbiota dysbiosis. TRE/TRF may also contribute to the prevention of metabolic diseases by modulating the Clock-Bmal1 pathway, synchronizing hormonal signals, regulating the Sirt1 pathway, inhibiting mTOR signaling, and modulating nutrient-sensing receptors associated with the gut microbiota. This type of diet has already been studied in groups of patients undergoing Nordic walking (NW) training, indicating beneficial effects [17,18]. Furthermore, the potential for combining training interventions in the form of NW with TRE in patients with multiple myeloma has already been suggested [19].
Considering the impact of physical activity on the rearrangement of the gut microbiota profile, we aimed to determine whether a 6-week Nordic walking training combined with a dietary change involving the introduction of TRE (10/14) would induce positive changes in the gut microbiota of patients with multiple myeloma. Referring to the literature, we hypothesized that the microbiota of healthy individuals would differ from that of patients, with a lower diversity in the patient group compared to healthy individuals. Similarly, the microbiota of patients before and after the training cycle would differ in terms of species composition and abundance. We also hypothesized that the diversity of the microbiota in patients would be stimulated by the proposed dietary and training interventions.
2. Materials and Methods
2.1. Characteristics of the Patient Group and Healthy Controls
The study protocol received a positive opinion from the Bioethics Committee. Each participant in the project was informed about the purpose and methods of the study and provided written consent to participate. Participants were given the option to withdraw from the study at any stage without providing a reason.
The study group consisted of 20 patients in the plateau phase of multiple myeloma, recruited from the Department of Hematology at the Jagiellonian University Collegium Medicum in Kraków. Patients were selected for participation in the project by the attending physician based on a list of inclusion and exclusion criteria. The inclusion criteria for this group were as follows: multiple myeloma in the plateau phase, without cytostatic treatment; bisphosphonate therapy was permitted; generally good health status with no contraindications for outdoor physical activity, specifically Nordic walking training; supplementation of vitamin D and calcium according to standard protocols. The exclusion criteria included: significant liver and kidney damage, acute respiratory or other infections, any other malignant cancer, recent fall resulting in injury, and antibiotic therapy in the last 3 months.
The control group was created by selecting healthy volunteers of a similar age from the general population who met the following criteria: no antibiotic therapy in the 3 months prior to the study, no infectious diseases or acute inflammatory conditions, no uncontrolled chronic diseases, diabetes, or contraindications to physical activity. Out of the selected group, 20 participants, 2 withdrew without providing a reason. From the study group, 4 individuals were excluded due to the use of antibiotic therapy less than 3 months prior to joining the project. Figure 1 shows the patient flow diagram. The basic characteristics of the project participants are presented in Table 1.
2.2. Nordic Walking Training Protocol
The Nordic Walking (NW) training was conducted by an experienced instructor, skilled in working with seniors and oncology patients, outdoors during the spring and summer period. The intensity of the training was planned at 60-70% of HRmax, individually calculated using the Nes formula [20].
Blood pressure measurements were taken before each session. The intensity of the training was monitored using sport testers (M400, Polar, Finland), with user data input, including permissible heart rate levels. If these levels were exceeded, the device emitted an audible signal, and the instructor adjusted the intensity of the participant’s exercises to ensure that the heart rate did not exceed the designated range for moderate-intensity effort.
The planned 6-week health training cycle consisted of 18 training sessions, each lasting approximately 60 minutes, conducted three times a week in the morning. In successive training sessions (starting from session 4), the duration of each session was gradually increased (up to 45 minutes), as well as the distance covered by the participants, while maintaining proper Nordic walking technique.
The description of the training session: (1) Warm-up: 10 minutes (Borg scale 6-8: light effort). It included general exercises for the upper and lower limbs and the trunk, as well as stretching exercises adapted to the needs of the group. (2) Main part: up to 45 minutes, with intensity set at 60-70% HRmax (Borg scale 10-12: moderate effort, allowing for easy conversation). This part consisted of exercises with poles aimed at learning and reinforcing Nordic walking technique. The next stage was walking with poles, maintaining proper Nordic walking technique. With each successive training session, the walking time was gradually increased until reaching a maximum of 45 minutes. During this part, patients strictly adhered to recommendations regarding the maximum heart rate they could achieve during training. (3) Cool-down: 5 minutes (Borg scale 6-8, light effort). Patients performed stretching exercises for different body parts.
2.3. Time Restricted Eating
The dietary modification in the form of fasting was implemented daily. Participants were instructed to refrain from consuming food for 14 hours each day within individually chosen time windows. The eating window lasted for 10 hours. No other dietary restrictions were specified. Patients were advised not to change their eating habits and to continue with their self-composed diet. To ensure adherence to the dietary regimen, the Time-Restricted Eating (TRE) was monitored by the trainer during each training session.
2.4. Stool Collection, DNA Extraction and Sequencing
Participants were provided with sterile plastic containers for stool sample collection. The samples were collected just before the start of the training and on the last day of the physical sessions. The samples were stored at -80°C until DNA isolation. DNA isolation was performed using the Fecal DNA Extraction Kit (IBI Scientific, USA), with an additional custom modification. A sample (approximately 200 mg) was suspended in 800 µl of ST1 buffer, vortexed for 20-30 seconds, and then incubated for 5 minutes at 70°C. In the next step, the sample was vortexed at maximum speed in a horizontal position for 5 minutes at room temperature, followed by centrifugation for 4 minutes at room temperature (6000 x g). The supernatant (550 µl) was transferred to a new 1.5 ml tube and centrifuged again for 1 minute (8000 x g). Next, 500 µl of the supernatant was transferred to a new 1.5 ml tube, 150 µl of ST2 buffer was added, vortexed for 5 seconds, and incubated at 0-4°C for 5 minutes. After cooling, the sample was centrifuged at 15,000 x g for 5 minutes at room temperature. The supernatant (500 µl) was transferred to the inhibitor removal column and centrifuged for 1 minute at 16,000 x g. To the sample, 800 µl of ST3 buffer was added, mixed thoroughly for 10-15 seconds, and 700 µl was transferred to the GD column. The sample was centrifuged at 16,000 x g for 2 minutes, and the GD column was transferred to a 2 ml tube. Then, 400 µl of ST3 buffer was applied to the GD column and centrifuged at 16,000 x g for 30 seconds. The GD column was washed twice with 600 µl of Wash Buffer, centrifuged at 16,000 x g for 30 seconds. The GD column was transferred to a 2 ml tube and centrifuged at 16,000 x g for 3 minutes. DNA was eluted using 55 µl of Elution Buffer; after incubation for 6 minutes at room temperature, the sample was centrifuged at 16,000 x g for 3 minutes.
2.5. Sequencing and Bioinformatics
The V3-V9 regions of the 16S rRNA gene were amplified using the universal primers 337F and 1391R. The resulting amplicons were subjected to sequencing using nanopore technology with the native barcoding 1D protocol. Sequencing was performed on R9.4.1 flowcells with default settings. Taxonomic classification of the obtained reads was carried out using the ublast algorithm (genXone). This classification is based on comparing read sequences with the database (NCBI). If the genomic sequence of the searched organism had not been previously deposited in the databases (NCBI), it was not displayed in the classification results. Reads derived from organisms not present in the database were assigned to another, most similar sequence, e.g., a sequence representing a higher taxonomic level, or discarded. The taxonomic classification table was created in a format compatible with the interactive Pavian taxonomic classification browser (available online at: https://fbreitwieser.shinyapps.io/pavian). The sample diversity index, separated by the cutoff level as the minimum number of reads for a taxon (0: no cutoff, 5, 15, 30, 50), method used for index creation: Simpson index. Cluster analysis was performed using ClustVis (http://biit.cs.ut.ee/clustvis).
2.6. Statistical Analysis
In the statistical analysis, alpha- and beta-diversity indices were estimated. Three alpha-diversity indices were calculated: Shannon diversity index, Fisher’s index, and Simpson’s index (Simpson 1-D). Beta-diversity was characterized using the Bray-Curtis dissimilarity metric and the Wittaker index. The PerMANOVA test (Permutational MANOVA, also known as NPMANOVA) was used for comparison of sample groups, as well as ANOVA tests (including Mann-Whitney and Kruskal-Wallis tests). A p-value < 0.05 was considered statistically significant. Additionally, to determine which taxa are primarily responsible for the observed differences between sample groups, the SIMPER tool [21] was used. An Indicator Species Analysis (IndVal) [22] was also conducted to identify symptomatic taxa. The statistics were performed using PAST4.17 software.
3. Results
3.1. Microbiota Composition Diversity
The global assessment of alpha-diversity in the studied sample, as well as within the control group (CG), the group of patients with multiple myeloma (MM) before starting the Nordic walking training program (MMA), and after completing the Nordic walking program (MMB), indicates greater species diversity along with a decrease in taxonomic rank (the highest for species: Species, the lowest for phylum: Phylum). Attention is drawn to the lower level of alpha-diversity (Simpson 1-D and Shannon H) in the control group compared to the patient group (MMA, MMB) at the phylum taxonomic rank. This trend is reversed when considering the alpha-diversity structure at the genus (Genus) and species (Species) levels, where higher diversity coefficients are observed in the control group and lower in the patient group. Interestingly, the diversity coefficients in the patient group after completing the training cycle approached those in the control group at the Species, Genus, and Family ranks. Higher values of the estimated indices indicate greater species diversity and their more or less even distribution (Figure 2). Moreover, statistically significant differences were observed between the studied groups for all estimated alpha-diversity indices at the species and genus levels. Statistically significant differences were also found when comparing the microbiota of the control group and the patient group before starting the NW training for the aforementioned taxonomic ranks (Table 2).
The analysis indicated that for the Phyllum taxon, the Deinococcus-Thermus and Thermotogae phyla were symptomatic for the MyelomaA (MMA) group at a significance level of p<0.05 when comparing all groups with each other. The Deinococcus-Thermus phylum was also a significant taxon for MyelomaA (MMA) compared to MyelomaB (MMB). Furthermore, the Armatimonadetes, Nitrospirae, Chrysiogenetes, Rhodothermaeota, and Dictyoglomi phyla appeared only in the MyelomaA group, while Lentisphaerae was observed only in the MyelomaB group. It should be noted, however, that these taxa appeared in small quantities. A comparison of all study groups at the Class level revealed the taxonomic indicator Verrucomicrobiae, Deinococci, Verrucomicrobiae, and Ardenticatenia for the MyelomaA group. Only in this group was the presence of Caldilineae, Chrysiogenetes, Dictyoglomia, Rhodothermia, Thermodesulfovibrionia, Thermomicrobia, Fimbriimonadia, Opitutae, and Ardenticatenia also recorded. The Deinococci and Actinomycetia classes were indicator taxa for the MyelomaA group when compared with the control group (CG), and Deinococci was also significant when compared to the MyelomaB group. The Lentisphaeria class appeared only in the MyelomaB group, while the indicator taxa for the CG group were the classes Acidithiobacillia, Chitinophagia, Limnochordia, Longimicrobia, Thermodesulfobacteria, and Vicinamibacteria, although the abundance of these classes was minimal.
The mean taxon-specific divergences were estimated. The overall mean divergence calculated using all taxa at the Phylum level was 34.97, at the Class level 38.94, and at the Family level 46.75. Two Phylum groups, Firmicutes and Actinobacteria, accounted for the majority of the divergence between the study groups at the phylum level, while within the Class level, the main contributors were Clostridia and Actinomyceta. Among the families, Lachnospiraceae and Bifidobacteriaceae were responsible for the observed divergence between the groups (Figure 3, Figure 4 and Figure 5).
The microbiota of patients before starting the training was most notably represented by taxa classified into the phylum Firmicutes, Actinobacteria, Verrucomicrobia, Proteobacteria, and Bacteroidetes (Figure 6). After the 6-week training period combined with TRE, a rearrangement of the microbiota composition occurred. An increase in the abundance of taxa from the phyla Proteobacteria, Bacteroidetes, and Actinobacteria was observed. Additionally, the population of microorganisms classified into the phylum Fusobacteria was noted in the MyelomaB patient group. Interestingly, a decrease in the population of bacteria from the phylum Verrucomicrobia was observed. The population of Firmicutes in the studied microbiota samples showed similar abundance values both before and after the training-dietary intervention cycle. Actinobacteria showed a decrease in abundance after the training period. In this phylum, the increase mainly concerned the class Coriobacteriia, while a decrease was noted among the Actinomycetia class taxa (Figure 7). Taxa most abundantly represented after the training period compared to the pre-training period belonged to the classes Clostridia, Negativicutes, Erysipelotrichia (phylum Firmicutes), Coriobacteria, Nitriliruptoria, Rubrobacteria (phylum Actinobacteria), Gammaproteobacteria (phylum Proteobacteria), Coriobacteria, Blastocatellia, Acidimicrobiia (phylum Actinobacteria), Bacteroidia, Cytophagia (phylum Bacteroidetes) (Figure 6). At the family level, the rearrangement of microbiota st”mula’ed by physical activity concerned Lachnospiraceae and Bifidobacteriaceae (Figure 8).
The percentage distribution of taxa within the phylum level, calculated for all studied groups, was dominated by the phyla Firmicutes (66%) and Actinobacteria (28%). At the class level, the dominant taxa were Clostridia, Actinomycetia, Coriobacteriia, and Bacilli, together accounting for over 90% of all taxa in the microbiota of the studied sample. At the family level, the dominant taxa were Lachnospiraceae, Bifidobacteriaceae, and Coriobacteriaceae (Figure 9).
Comparison of CG and the patient group MM before (MMA) and after the implementation of the training and dietary program (MMB) revealed significant differences at all taxonomic levels of the studied microbiota (F, p<0.05) (Figure 10). Statistically significant changes were also observed in the microbiota of the patient group before and after the implementation of the NW program, as well as between the control group and patients (MMA) at the family, order, genus, and species levels. A similar pattern was observed when comparing the control group with the patient group MMB, with no significant differences at the phylum, class, and order levels (Table 3).
Estimation of the overall level of beta-diversity indicated significant differences between the studied groups (Table 4). The microbiota of the patients in the initial phase (MMA) and final phase (MMB) of the NW program differed at the phylum and class levels. No differences were observed at lower taxonomic levels. Statistically significant changes appeared between the control group and the patient groups MMA and MMB at the family, order, genus, and species levels, with significant differences also observed at the phylum level in the comparison between the control group and patients MMB (Figure 10).
The analysis of the microbiota composition in the group of patients with multiple myeloma indicates an abundance of bacteria belonging to the families Lachnospiraceae, Bifidobacteriaceae, Streptococcaceae, Clostridiaceae, and Erysipelotrichaceae. After 6 weeks of NW training, the gut microbiota composition in this group of patients changed both quantitatively and qualitatively. A statistically significant decrease was observed in the abundance of the families Streptococcaceae and Erysipelotrichaceae. The family Akkermansiaceae showed a decrease, while Enterobacteriaceae, Coriobacteriaceae, and Peptostreptococcaceae increased. Bacteria classified into Fusobacteriaceae were detected in the group of patients after the training cycle.
4. Discussion
The richness of microorganisms inhabiting the gut is influenced by many factors originating from the external environment (e.g., diet, physical activity) [5,23] as well as internal factors. A significant impact on its composition is the health status [24], including cancer diseases [10,25]. Zhang et al. [14] indicate that in the group of patients with multiple myeloma, the microbiota is most abundantly represented by taxa belonging to the phyla Bacteroidetes and Firmicutes. The results of our study confirm the presence of Firmicutes, but Bacteroidetes constitutes only 1.59% to 2.44%. For Actinobacteria, represented in the cited study at less than 1% [14], our group of patients showed approximately 62%. Pepeljugoski et al. (2019) report that Odoribacter and Lactobacillus are genera represented in MM patients, while Blautia and Faecalibacterium are less represented in the microbiota compared to the microbiota of healthy individuals.
The results presented in this study suggest that physical activity (NW training) combined with TRE, to which the patient group was subjected, can stimulate a rearrangement of the microbiota composition towards a microbiome profile found in healthy individuals. The amount of Faecalibacterium increased more than tenfold (from 0.32% to 4.70%) and Prevotella (from 0.03% to 0.39%).
A characteristic feature of the microbiota composition in individuals suffering from hematological diseases, including MM, is the high prevalence of bacteria from the Firmicutes phylum and low levels of Proteobacteria [26]. Our study on the microbiota composition of MM patients confirms these earlier observations. Pianko et al. [27] highlight the association of the genus Eubacterium with a reduction in MM symptoms or even the risk of developing MM. Thus, the observed more than fivefold increase in the amount of Eubacterium bacteria in the group of patients subjected to NW + TRE training is noteworthy. Further studies may confirm the positive, health-promoting effects of combining training and fasting.
In our previous studies, we indicated that the form of exercise in the form of NW training is safe for patients with MM. The average intensity of the NW training we adopted was based on previously obtained results, suggesting that it has a beneficial effect on blood parameters related to oxidative damage of macromolecules, gene expression associated with iron metabolism [28], and may contribute to favorable, clinically significant changes in indicators such as the concentration of 25-OH-D vitamin [29]. There are also reports that high-intensity exercise may increase inflammation in the gut and lead to an increase in the number of associated bacteria [30,31], which would be undesirable in patients with multiple myeloma. In the microbiota of the studied group of multiple myeloma patients, after completing 6 weeks of NW training, a 15-fold increase in the number of Prevotella genus bacteria and a 4-fold increase in Bifidobacterium adolescentis were observed, which may suggest, as Humińska-Lisowska et al. [8] indicate, an improvement in performance indicators, mainly VO2max, in the studied group. The negative correlation of VO2max, estimated by Humińska-Lisowska et al. for Bacteroides, may also indicate stimulation of endurance in the studied group of MM patients, as the training + TRE reduced the population of this genus by one-third. Results from other studies in a similar age group of healthy individuals, where moderate-intensity exercise was applied, are, however, ambiguous. In the study by Morita et al. [32], contrary to our findings, it was shown that moderate-intensity aerobic walking training conducted for 12 weeks in a group of women over 65 years of age led to an increase in the amount of Bacteroides. In the study by Erlandson et al. [33] involving individuals aged 50-75 years, a 24-week cardiovascular and resistance training program led to an increase in Bifidobacterium, which was consistent with the results presented in this study, but also reduced the amount of Prevotella, contrary to our findings. However, it is important to note that in the aforementioned studies, different training forms were used, and the duration of the intervention was longer than in our study. The main reason for the observed differences in post-training effects between our results and the cited studies is the fact that the baseline microbiota of healthy individuals differs from that of patients, which may also contribute to differences in outcomes. Therefore, future projects should focus on how training series of different durations affect the microbiome.
As studies indicate, many factors related to diet influence the composition of the gastrointestinal microbiota. The popularized form of dietary modification in the form of TRE is also a recognized factor in this regard [16,34]. Despite the lack of change in the quality of consumed food products, the change consisting of maintaining a shortened feeding window influences both the quality and quantity of the microbiome. In the review paper by Perez-Gerdel [35], it was described that changes induced by different fasting schemes positively affect the diversity and abundance of the gut microbiota. This has a direct impact on hormonal signaling, circadian rhythm, a variety of metabolic processes, but also neuronal response and immune-inflammatory pathways [16].
Other authors, however, suggest that after reviewing the available literature, we still do not have a complete picture of the impact of TRE on the microbiome. The results gathered and analyzed by Paukkonen et al. [36] were heterogeneous, and the bacteria on which intermittent fasting (IF) had a statistically significant impact varied considerably depending on the study. Perez-Gerdel [35] also postulates that the available data currently pertains to short-term interventions. They also pointed out that some of the positive changes induced by fasting return to baseline. The addition of increased physical activity may therefore serve as a stimulus to augment the positive effects of TRE and/or as a factor prolonging the beneficial effect on the composition and quality of the microbiome.
To the best of our knowledge, the current study is the first attempt to examine the impact of combining two interventions: training and TRE on the gut microbiome. Previous attempts focused on isolated interventions or the combination of TRE with varying degrees of dietary modification. One such study was conducted by Mohr, who evaluated the impact of intermittent fasting (IF) and protein stimulation (P) [37]. In randomized controlled trials, they described the impact of IF and a calorie-restricted diet on the microbiological composition of stool and plasma metabolomic markers in overweight/obese women and men. The abundance of Christensenellaceae microorganisms and metabolites of amino acids promoting fat oxidation increased with IF-P.
5. Conclusions
The applied training intervention, combined with TRE, stimulated an increase in microbiota biodiversity and a rearrangement of the gut microbiota towards a symbiotic microbiota.
Firmicutes is a bacterial phylum group that is abundantly and stably represented in the gut microbiota of MM patients. Its presence was observed in patients both before starting the NW+TRE training program and after its completion, which may confirm the association of this group with the disease and indicate its dysbiotic nature. The positive effect of the 6-week NW training and fasting on the microbiota of individuals with MM, as observed in this pilot study, suggests the need for further exploration of this topic. Continued observations regarding, among other factors, different types of activities, exercise intensity, training cycle duration, and feeding window length would help optimize the program and training recommendations for patients with multiple myeloma. The observed rearrangement of the microbiota composition in MM patients towards a symbiotic microbiota appears to be an important element in supporting disease remission.
Author Contributions
Conceptualization, A.P. and O.C-L.; methodology, A.Z-N., M.Ż; software, T.P. and A.D.; validation, A.S., A.P. and O.C-L.; formal analysis, K.M.; investigation, A.P.; O.C-L. and A.D.; resources, A.Z-N.; data curation, K.M; writing—original draft preparation, A.Z-N.; M-Ż.; writing—review and editing, A.P.; T.P.; A.S. and A.J. visualization, K.M.; supervision, A.J.; project administration, A.P.; funding acquisition, A.P. and T.P. All authors have read and agreed to the published version of the manuscript.
Funding
This research was funded within the framework of the program of the Ministry of Science and Higher Education (Poland) under the name “Regional Initiative for Perfection” within the years 2019–2022, project no. 022/RID/2018/19 in the total of 11,919,908 PLN (internal number: 55/PB/RID/2023).
Institutional Review Board Statement
The study was conducted in accordance with the Declaration of Helsinki, and approved by the Ethics Committee of Regional Chamber of Physicians in Krakow (no. 59/KBL/OIL/2024).
Informed Consent Statement
Informed consent was obtained from all subjects involved in the study.
Data Availability Statement
We encourage all authors of articles published in MDPI journals to share their research data. In this section, please provide details regarding where data supporting reported results can be found, including links to publicly archived datasets analyzed or generated during the study. Where no new data were created, or where data is unavailable due to privacy or ethical restrictions, a statement is still required. Suggested Data Availability Statements are available in section “MDPI Research Data Policies” at https://www.mdpi.com/ethics.
Acknowledgments
The authors would like to thank all the participants of the project and Jakub Deląg, a qualified NW trainer, who conducted the trainings. The authors would also like to thank the Foundation All4Myeloma (https://szpiczak.org/pl/) for funding the purchase of Nordic walking training equipment and co-sponsoring the APC fee.
Conflicts of Interest
The authors declare no conflicts of interest. The funders had no role in the design of the study; in the collection, analyses, or interpretation of data; in the writing of the manuscript; or in the decision to publish the results.
References
- Van Belkum, A.; Broadwell, D.; Lovern, D.; Petersen, L.; Weinstock, G.; Dunne, W.M. Proteomics and Metabolomics for Analysis of the Dynamics of Microbiota. Expert Rev. Proteomics 2018, 15, 101–104. [Google Scholar] [CrossRef] [PubMed]
- Manrique, P.; Bolduc, B.; Walk, S.T.; Van Oost, J. Der; De Vos, W.M.; Young, M.J. Healthy Human Gut Phageome. Proc. Natl. Acad. Sci. USA 2016, 113, 10400–10405. [Google Scholar] [CrossRef] [PubMed]
- Costa, M.; Weese, J.S. Methods and Basic Concepts for Microbiota Assessment. Vet. J. 2019, 249, 10–15. [Google Scholar] [CrossRef] [PubMed]
- Cerdá, B.; Pérez, M.; Pérez-Santiago, J.D.; Tornero-Aguilera, J.F.; González-Soltero, R.; Larrosa, M. Gut Microbiota Modification: Another Piece in the Puzzle of the Benefits of Physical Exercise in Health? Front. Physiol. 2016, 7, 51. [Google Scholar] [CrossRef]
- Bressa, C.; Bailén-Andrino, M.; Pérez-Santiago, J.; González-Soltero, R.; Pérez, M.; Montalvo-Lominchar, M.G.; Maté-Muñoz, J.L.; Domínguez, R.; Moreno, D.; Larrosa, M. Differences in Gut Microbiota Profile between Women with Active Lifestyle and Sedentary Women. PLoS One 2017, 12, 1–20. [Google Scholar] [CrossRef]
- Cataldi, S.; Bonavolontà, V.; Poli, L.; Clemente, F.M.; De Candia, M.; Carvutto, R.; Silva, A.F.; Badicu, G.; Greco, G.; Fischetti, F. The Relationship between Physical Activity, Physical Exercise, and Human Gut Microbiota in Healthy and Unhealthy Subjects: A Systematic Review. Biology (Basel). 2022, 11, 479. [Google Scholar] [CrossRef] [PubMed]
- Qian, G.; Ho, J.W.K. Challenges and Emerging Systems Biology Approaches to Discover How the Human Gut Microbiome Impact Host Physiology. Biophys. Rev. 2020, 12, 851–863. [Google Scholar] [CrossRef]
- Huminska-Lisowsk, K.; Zielinska, K.; Mieszkowski, J.; Michalowska-Sawczy, M.; Cieszczyk, P.; Labaj, P.P.; Wasag, B.; Fraczek, B.; Grzywacz, A.; Kochanowicz, A.; et al. Microbiome Features Associated with Performance Measures in Athletic and Nonathletic Individuals: A Case-Control Study. PLoS One 2024, 19, 1–21. [Google Scholar] [CrossRef]
- Antoine Pepeljugoski, C.; Morgan, G.; Braunstein, M. Analysis of Intestinal Microbiome in Multiple Myeloma Reveals Progressive Dysbiosis Compared to MGUS and Healthy Individuals. Blood 2019, 134, 3076–3076. [Google Scholar] [CrossRef]
- Jasiński, M.; Biliński, J.; Basak, G.W. The Role of the Gut Microbiome in Pathogenesis, Biology, and Treatment of Plasma Cell Dyscrasias. Front. Oncol. 2021, 11, 1–10. [Google Scholar] [CrossRef]
- Zhang, L.; Xiang, Y.; Li, Y.; Zhang, J. Gut Microbiome in Multiple Myeloma: Mechanisms of Progression and Clinical Applications. Front. Immunol. 2022, 13, 1–13. [Google Scholar] [CrossRef] [PubMed]
- Linares, M.; Hermouet, S. Editorial: The Role of Microorganisms in Multiple Myeloma. Front. Immunol. 2022, 13, 1–4. [Google Scholar] [CrossRef] [PubMed]
- Jian, X.; Zhu, Y.; Ouyang, J.; Wang, Y.; Lei, Q.; Xia, J.; Guan, Y.; Zhang, J.; Guo, J.; He, Y.; et al. Alterations of Gut Microbiome Accelerate Multiple Myeloma Progression by Increasing the Relative Abundances of Nitrogen-Recycling Bacteria. Microbiome 2020, 8, 1–21. [Google Scholar] [CrossRef] [PubMed]
- Zhang, B.; Gu, J.; Liu, J.; Huang, B.; Li, J. Fecal Microbiota Taxonomic Shifts in Chinese Multiple Myeloma Patients Analyzed by Quantitative Polimerase Chain Reaction (QPCR) and 16S RRNA High-Throughput Sequencing. Med. Sci. Monit. 2019, 25, 8269–8280. [Google Scholar] [CrossRef]
- Korde, N.; Tavitian, E.; Mastey, D.; Lengfellner, J.; Hevroni, G.; Zarski, A.; Salcedo, M.; Mailankody, S.; Hassoun, H.; Smith, E.L.; et al. Association of Patient Activity Bio-Profiles with Health-Related Quality of Life in Patients with Newly Diagnosed Multiple Myeloma: A Prospective Observational Cohort Study. eClinicalMedicine 2023, 57, 101854. [Google Scholar] [CrossRef]
- Zeb, F.; Osaili, T.; Obaid, R.S.; Naja, F.; Radwan, H.; Cheikh Ismail, L.; Hasan, H.; Hashim, M.; Alam, I.; Sehar, B.; et al. Gut Microbiota and Time-Restricted Feeding/Eating: A Targeted Biomarker and Approach in Precision Nutrition. Nutrients 2023, 15, 1–23. [Google Scholar] [CrossRef]
- Czerwińska-Ledwig, O.; Kryst, J.; Ziemann, E.; Borkowska, A.; Reczkowicz, J.; Dzidek, A.; Rydzik, Ł.; Pałka, T.; Żychowska, M.; Kupczak, W.; et al. The Beneficial Effects of Nordic Walking Training Combined with Time-Restricted Eating 14/24 in Women with Abnormal Body Composition Depend on the Application Period. Nutrients 2024, 16, 1–17. [Google Scholar] [CrossRef]
- Kortas, J.A.; Reczkowicz, J.; Juhas, U.; Ziemann, E.; Świątczak, A.; Prusik, K.; Olszewski, S.; Soltani, N.; Rodziewicz-Flis, E.; Flis, D.; et al. Iron Status Determined Changes in Health Measures Induced by Nordic Walking with Time-Restricted Eating in Older Adults– a Randomised Trial. BMC Geriatr. 2024, 24, 1–11. [Google Scholar] [CrossRef]
- Czerwińska-Ledwig, O.; Żychowska, M.; Jurczyszyn, A.; Kryst, J.; Deląg, J.; Borkowska, A.; Reczkowicz, J.; Pałka, T.; Bujas, P.; Piotrowska, A. The Impact of a 6-Week Nordic Walking Training Cycle and a 14-Hour Intermittent Fasting on Disease Activity Markers and Serum Levels of Wnt Pathway-Associated Proteins in Patients with Multiple Myeloma. J. Clin. Med. 2024, 13, 2771. [Google Scholar] [CrossRef]
- Nes, B.M.; Janszky, I.; Wisløff, U.; Støylen, A.; Karlsen, T. Age-Predicted Maximal Heart Rate in Healthy Subjects: The HUNT Fitness Study. Scand. J. Med. Sci. Sport. 2013, 23, 697–704. [Google Scholar] [CrossRef]
- CLARKE, K.R. Non-parametric Multivariate Analyses of Changes in Community Structure. Aust. J. Ecol. 1993, 18, 117–143. [Google Scholar] [CrossRef]
- Dufrêne, M.; Legendre, P. Species Assemblages and Indicator Species: The Need for a Flexible Asymmetrical Approach. Ecol. Monogr. 1997, 67, 345–366. [Google Scholar] [CrossRef]
- Muralidharan, J.; Moreno-Indias, I.; Bulló, M.; Lopez, J.V.; Corella, D.; Castañer, O.; Vidal, J.; Atzeni, A.; Fernandez-García, J.C.; Torres-Collado, L.; et al. Effect on Gut Microbiota of a 1-y Lifestyle Intervention with Mediterranean Diet Compared with Energy-Reduced Mediterranean Diet and Physical Activity Promotion: PREDIMED-Plus Study. Am. J. Clin. Nutr. 2021, 114, 1148–1158. [Google Scholar] [CrossRef] [PubMed]
- Thursby, E.; Juge, N. Introduction to the Human Gut Microbiota. Biochem. J. 2017, 474, 1823–1836. [Google Scholar] [CrossRef] [PubMed]
- D’angelo, G. Microbiota and Hematological Diseases. Int. J. Hematol. Stem Cell Res. 2022, 16, 164–173. [Google Scholar] [CrossRef]
- Ciftciler, R.; Ciftciler, A.E. The Importance of Microbiota in Hematology. Transfus. Apher. Sci. 2022, 61, 2021. [Google Scholar] [CrossRef]
- Pianko, M.J.; Devlin, S.M.; Littmann, E.R.; Chansakul, A.; Mastey, D.; Salcedo, M.; Fontana, E.; Ling, L.; Tavitian, E.; Slingerland, J.B.; et al. Minimal Residual Disease Negativity in Multiple Myeloma Is Associated with Intestinal Microbiota Composition. Blood Adv. 2019, 3, 2040–2044. [Google Scholar] [CrossRef]
- Czerwińska-Ledwig, O.; Jurczyszyn, A.; Piotrowska, A.; Pilch, W.; Antosiewicz, J.; Żychowska, M. The Effect of a Six-Week Nordic Walking Training Cycle on Oxidative Damage of Macromolecules and Iron Metabolism in Older Patients with Multiple Myeloma in Remission—Randomized Clinical Trial. Int. J. Mol. Sci. 2023, 24, 1–15. [Google Scholar] [CrossRef]
- Czerwińska-Ledwig, O.; Gradek, J.; Deląg, J.; Jurczyszyn, A. The Effect of a 6-Week Nordic Walking Training Cycle on Myeloma-Related Blood Parameters, Vitamin 25(OH)D3 Serum Concentration and Peripheral Polyneuropathy Symptoms in Patients with Multiple Myeloma. Clin. Lymphoma Myeloma Leuk. 2021, 21, S114–S115. [Google Scholar] [CrossRef]
- Dziewiecka, H.; Buttar, H.S.; Kasperska, A.; Ostapiuk–Karolczuk, J.; Domagalska, M.; Cichoń, J.; Skarpańska-Stejnborn, A. Physical Activity Induced Alterations of Gut Microbiota in Humans: A Systematic Review. BMC Sports Sci. Med. Rehabil. 2022, 14, 1–22. [Google Scholar] [CrossRef]
- Bonomini-Gnutzmann, R.; Plaza-Díaz, J.; Jorquera-Aguilera, C.; Rodríguez-Rodríguez, A.; Rodríguez-Rodríguez, F. Effect of Intensity and Duration of Exercise on Gut Microbiota in Humans: A Systematic Review. Int. J. Environ. Res. Public Health 2022, 19. [Google Scholar] [CrossRef] [PubMed]
- Morita, E.; Yokoyama, H.; Imai, D.; Takeda, R.; Ota, A.; Kawai, E.; Hisada, T.; Emoto, M.; Suzuki, Y.; Okazaki, K. Aerobic Exercise Training with Brisk Walking Increases Intestinal Bacteroides in Healthy Elderly Women. Nutrients 2019, 11. [Google Scholar] [CrossRef] [PubMed]
- Erlandson, K.M.; Liu, J.; Johnson, R.; Dillon, S.; Jankowski, C.M.; Kroehl, M.; Robertson, C.E.; Frank, D.N.; Tuncil, Y.; Higgins, J.; et al. An Exercise Intervention Alters Stool Microbiota and Metabolites among Older, Sedentary Adults. Ther. Adv. Infect. Dis. 2021, 8, 1–11. [Google Scholar] [CrossRef]
- Pieczyńska-Zając, J.M.; Malinowska, A.; Łagowska, K.; Leciejewska, N.; Bajerska, J. The Effects of Time-Restricted Eating and Ramadan Fasting on Gut Microbiota Composition: A Systematic Review of Human and Animal Studies. Nutr. Rev. 2024, 82, 777–793. [Google Scholar] [CrossRef]
- Pérez-Gerdel, T.; Camargo, M.; Alvarado, M.; Ramírez, J.D. Impact of Intermittent Fasting on the Gut Microbiota: A Systematic Review. Adv. Biol. 2023, 7, 2023. [Google Scholar] [CrossRef] [PubMed]
- Paukkonen, I.; Törrönen, E.N.; Lok, J.; Schwab, U.; El-Nezami, H. The Impact of Intermittent Fasting on Gut Microbiota: A Systematic Review of Human Studies. Front. Nutr. 2024, 11. [Google Scholar] [CrossRef]
- Mohr, A.E.; Sweazea, K.L.; Bowes, D.A.; Jasbi, P.; Whisner, C.M.; Sears, D.D.; Krajmalnik-Brown, R.; Jin, Y.; Gu, H.; Klein-Seetharaman, J.; et al. Gut Microbiome Remodeling and Metabolomic Profile Improves in Response to Protein Pacing with Intermittent Fasting versus Continuous Caloric Restriction. Nat. Commun. 2024, 15, 1–20. [Google Scholar] [CrossRef]
Figure 1.
Patient diagram flow.
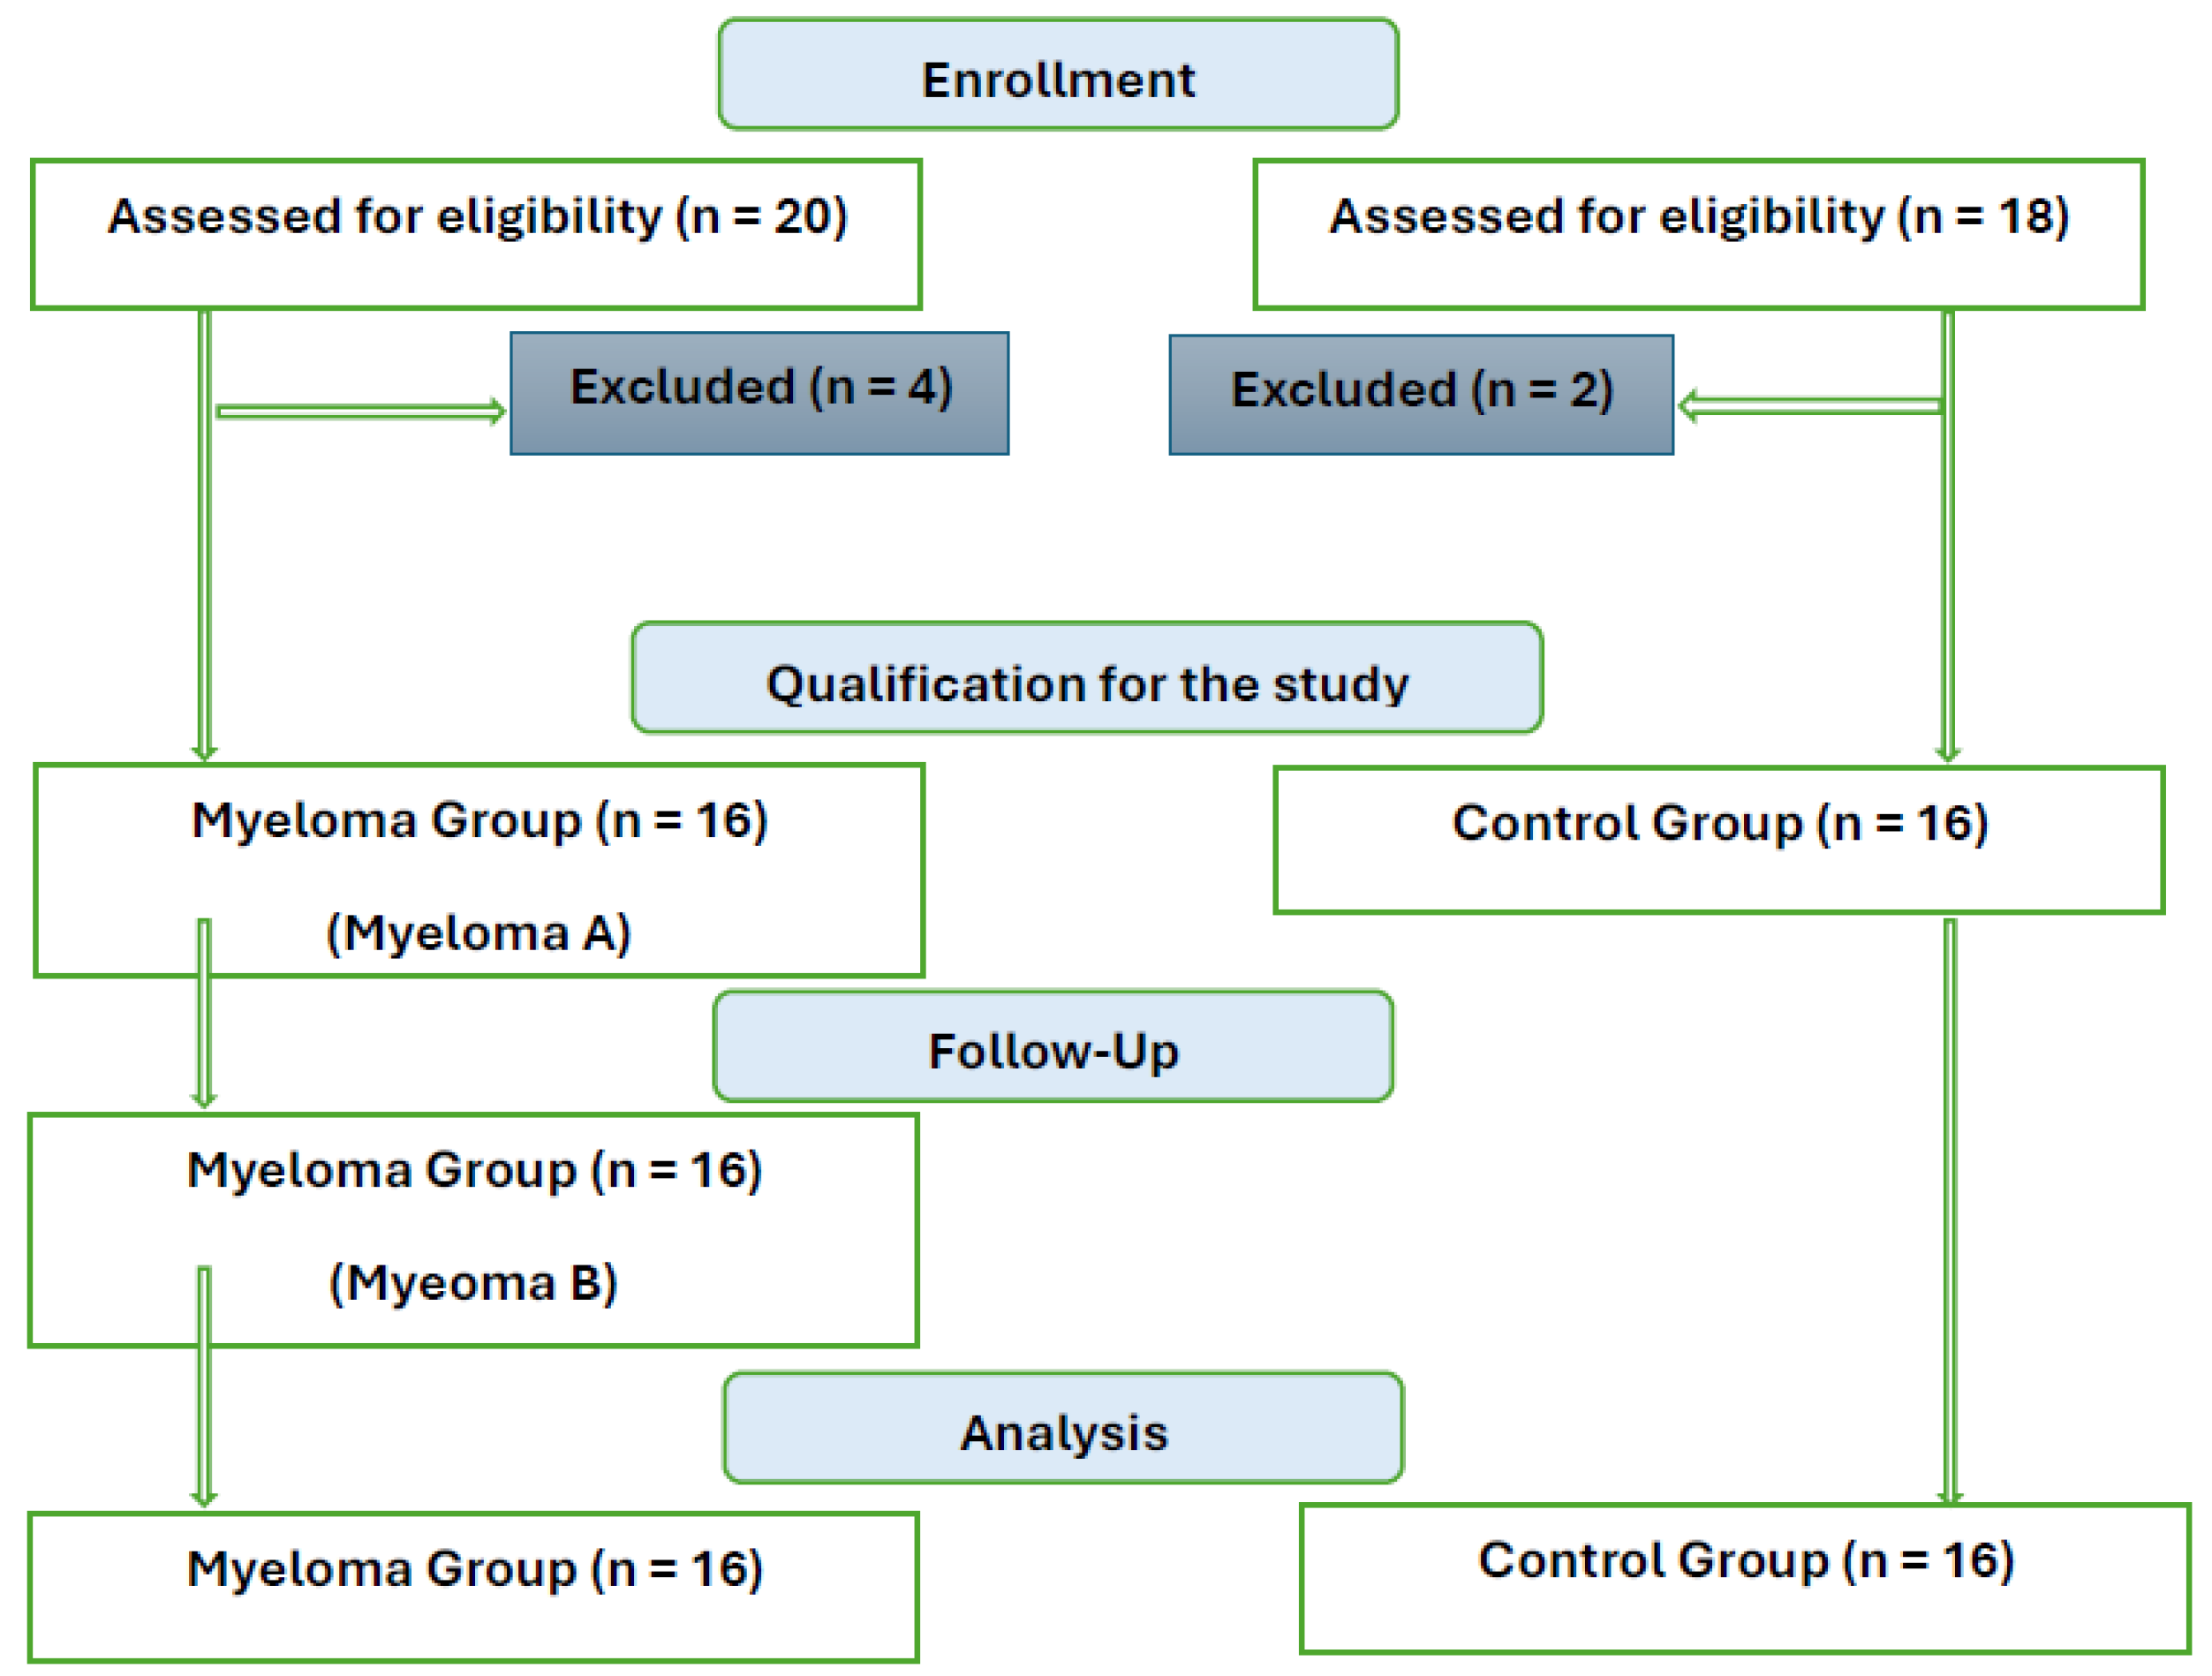
Figure 2.
Graph for the studied alpha-diversity metrics: Simpson’s Index (1-D), Shannon Index, and Fisher-alpha parameter (median) considering the taxonomic levels of the microbiota and the division of the study sample into groups (MyelomaA – group of patients before starting the NW program, MyelomaB – group of patients after completing the Nordic walking program, control).
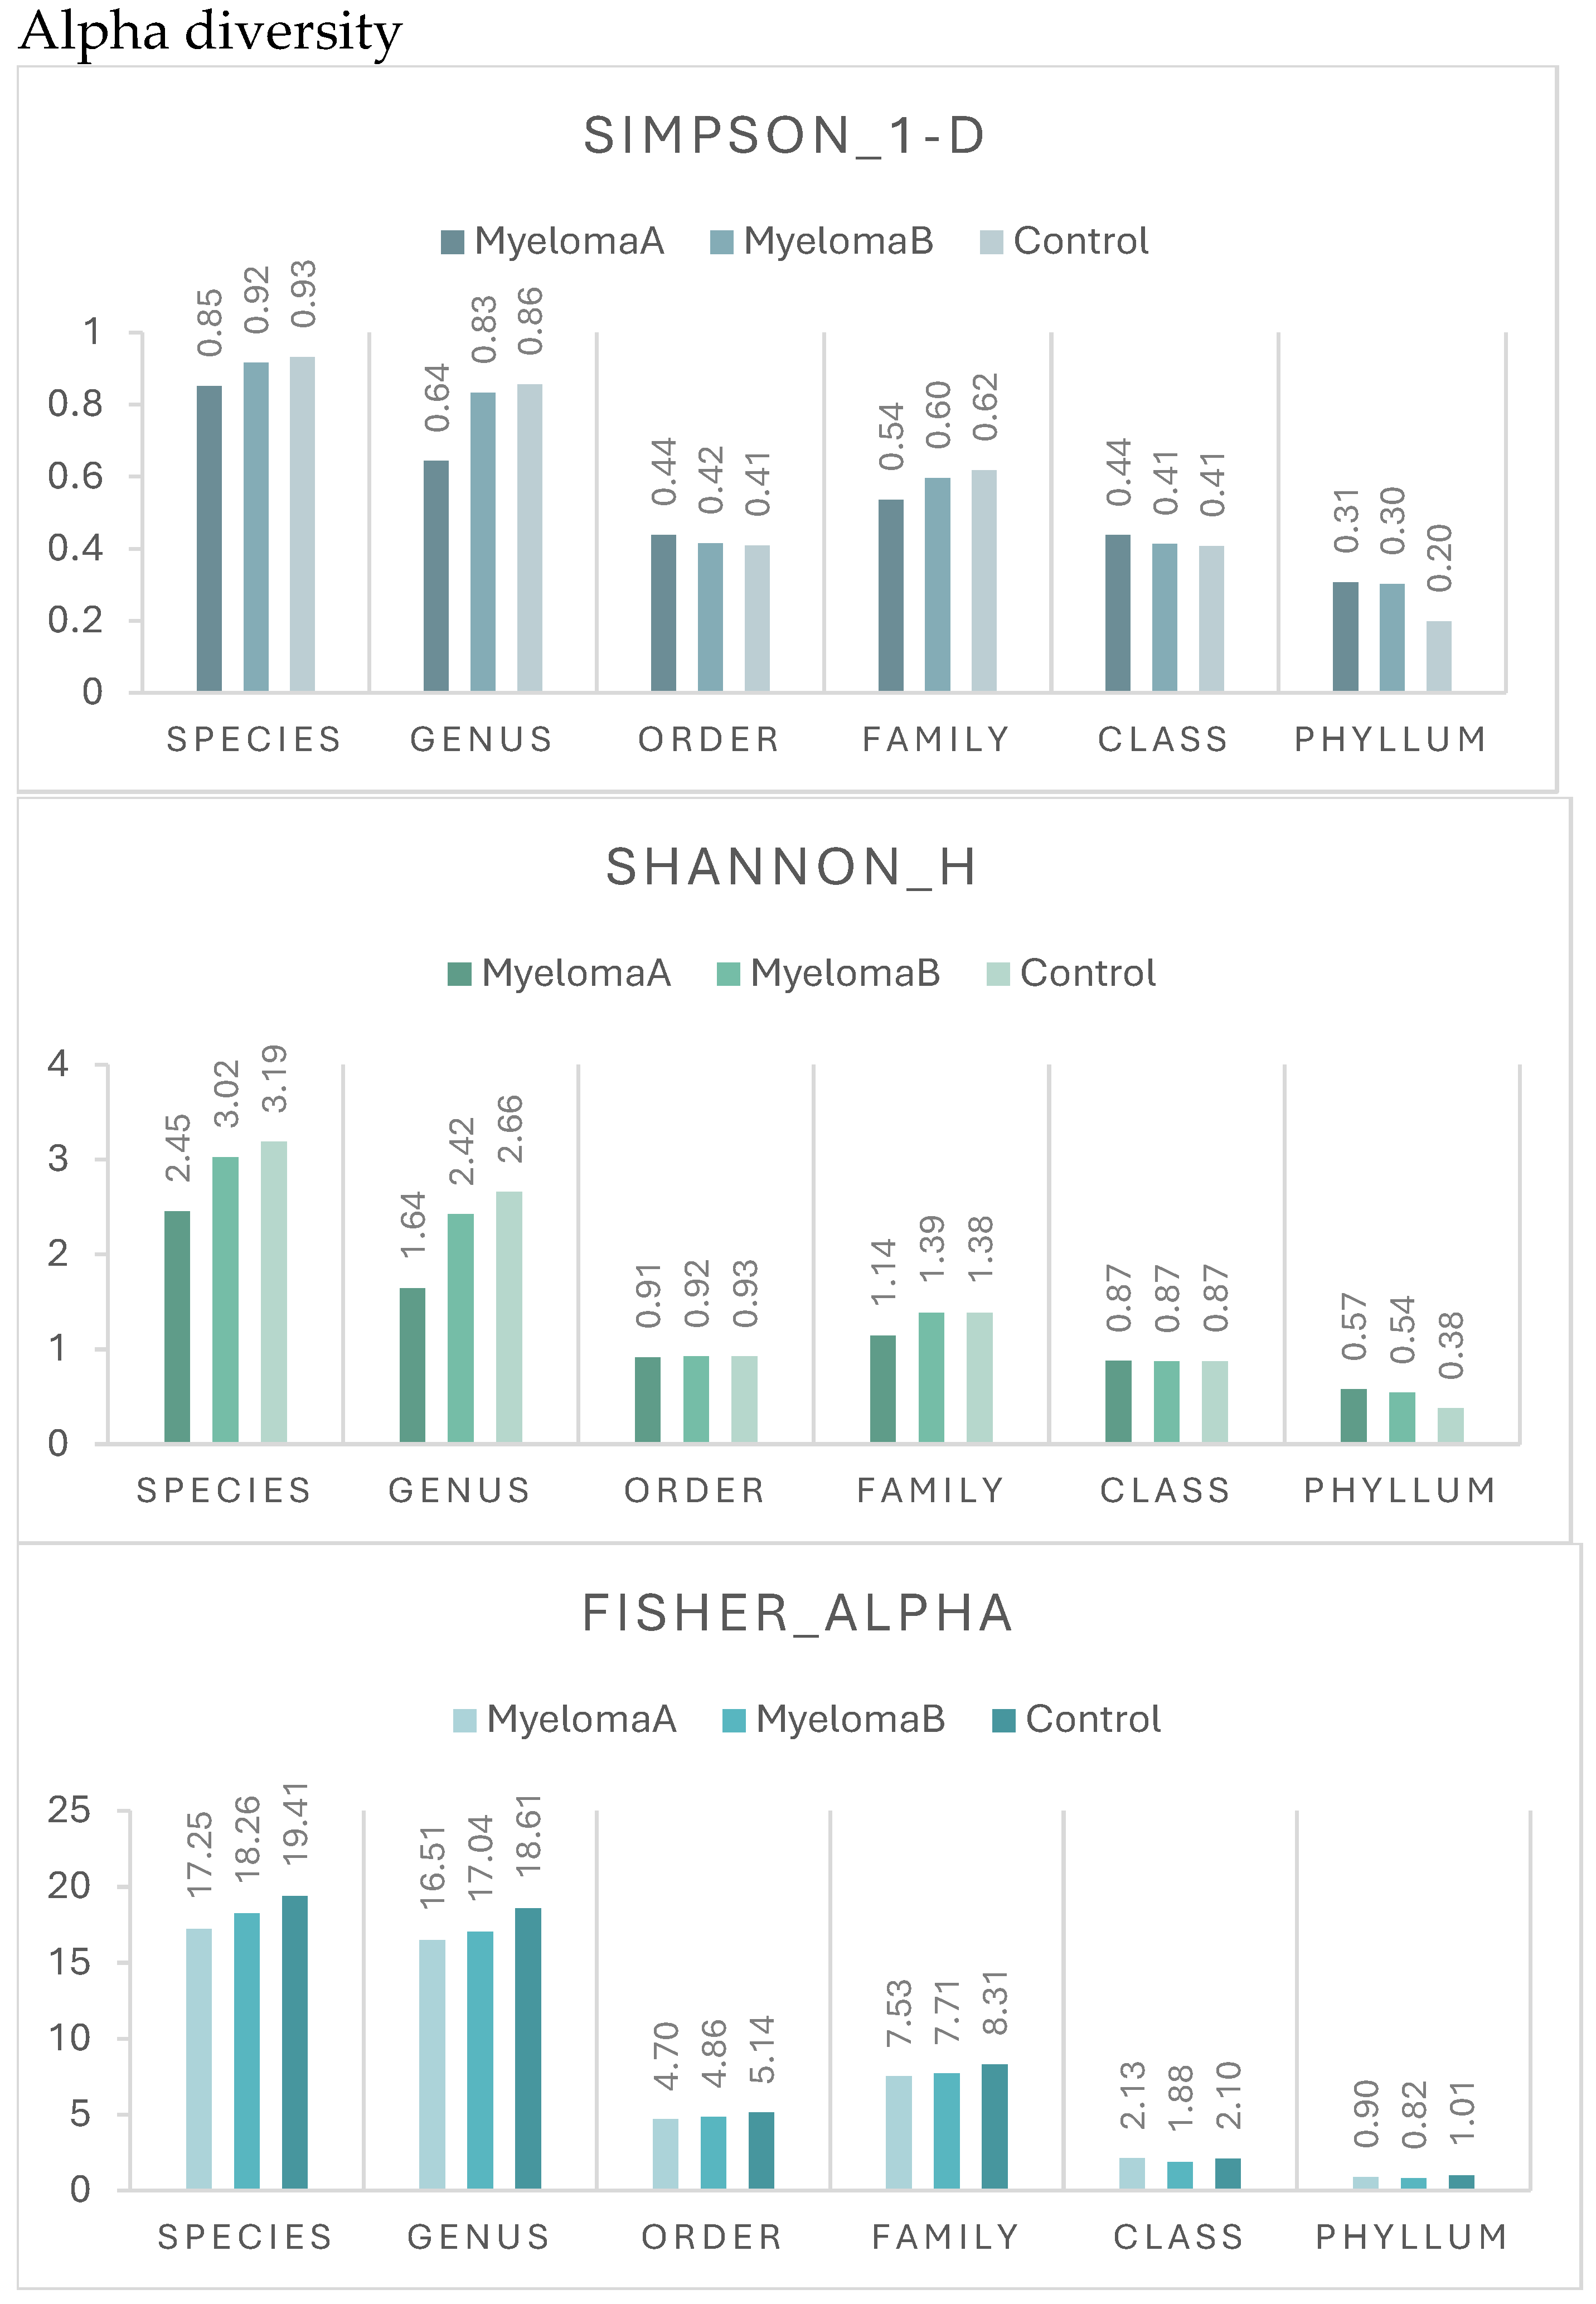
Figure 3.
Mean divergence between the study groups (MMA, MMB, Control) at the phylum level.
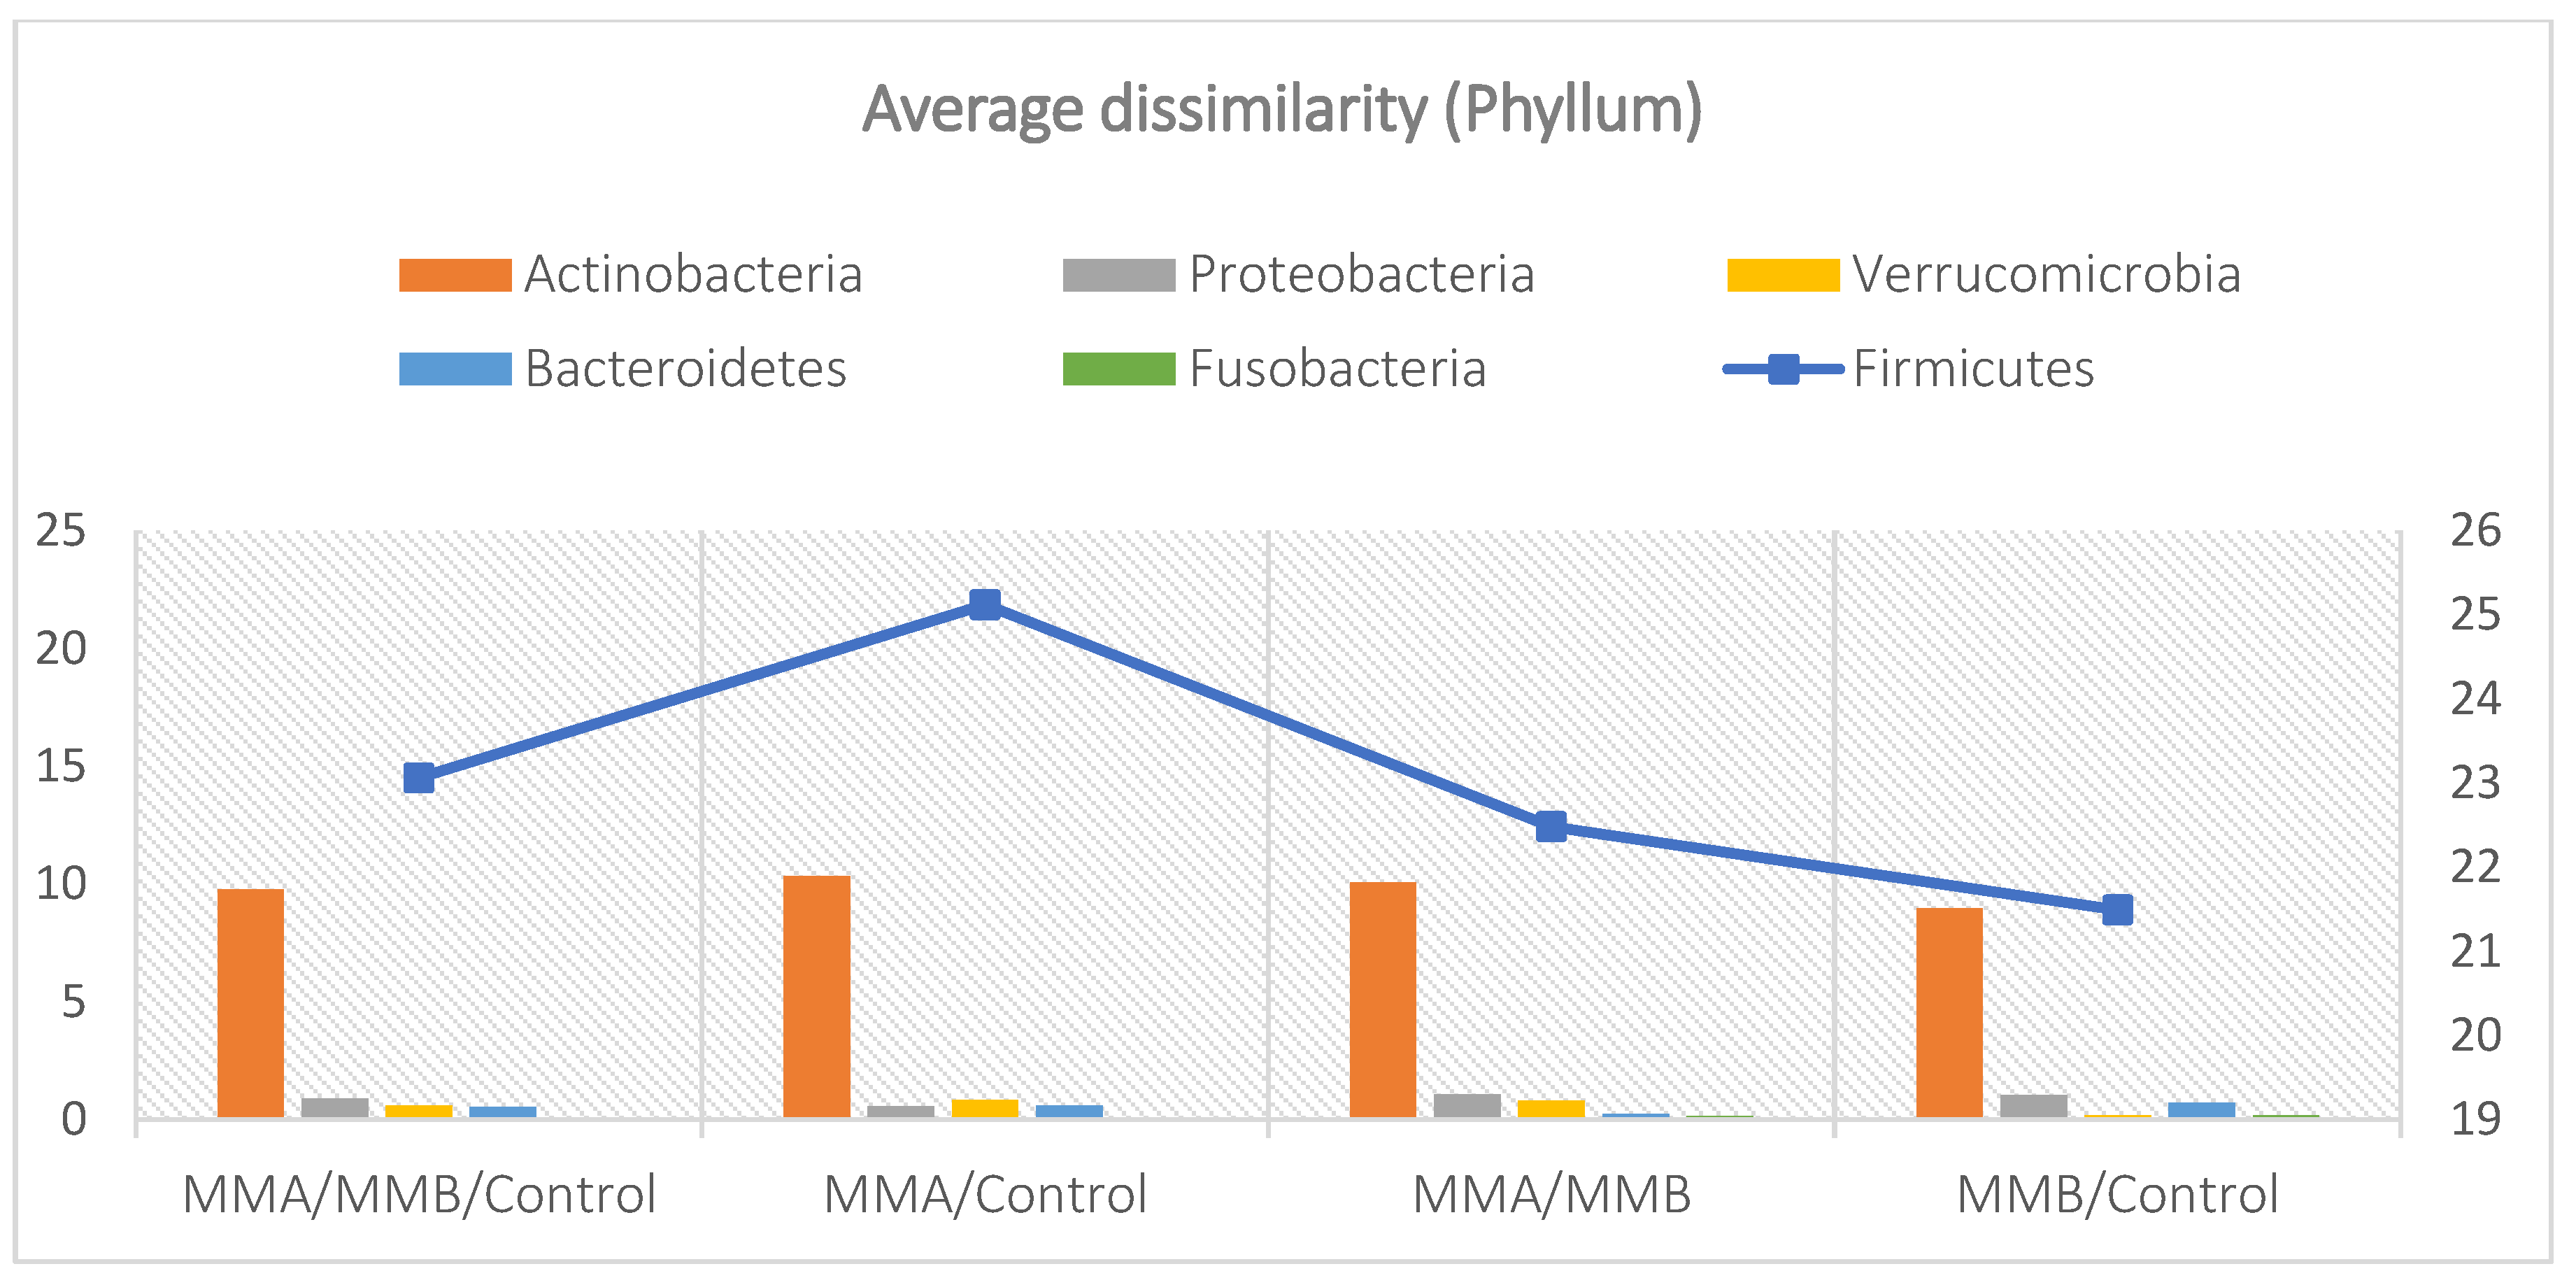
Figure 4.
Mean divergence between the study groups (MMA, MMB, Control) at the class level.
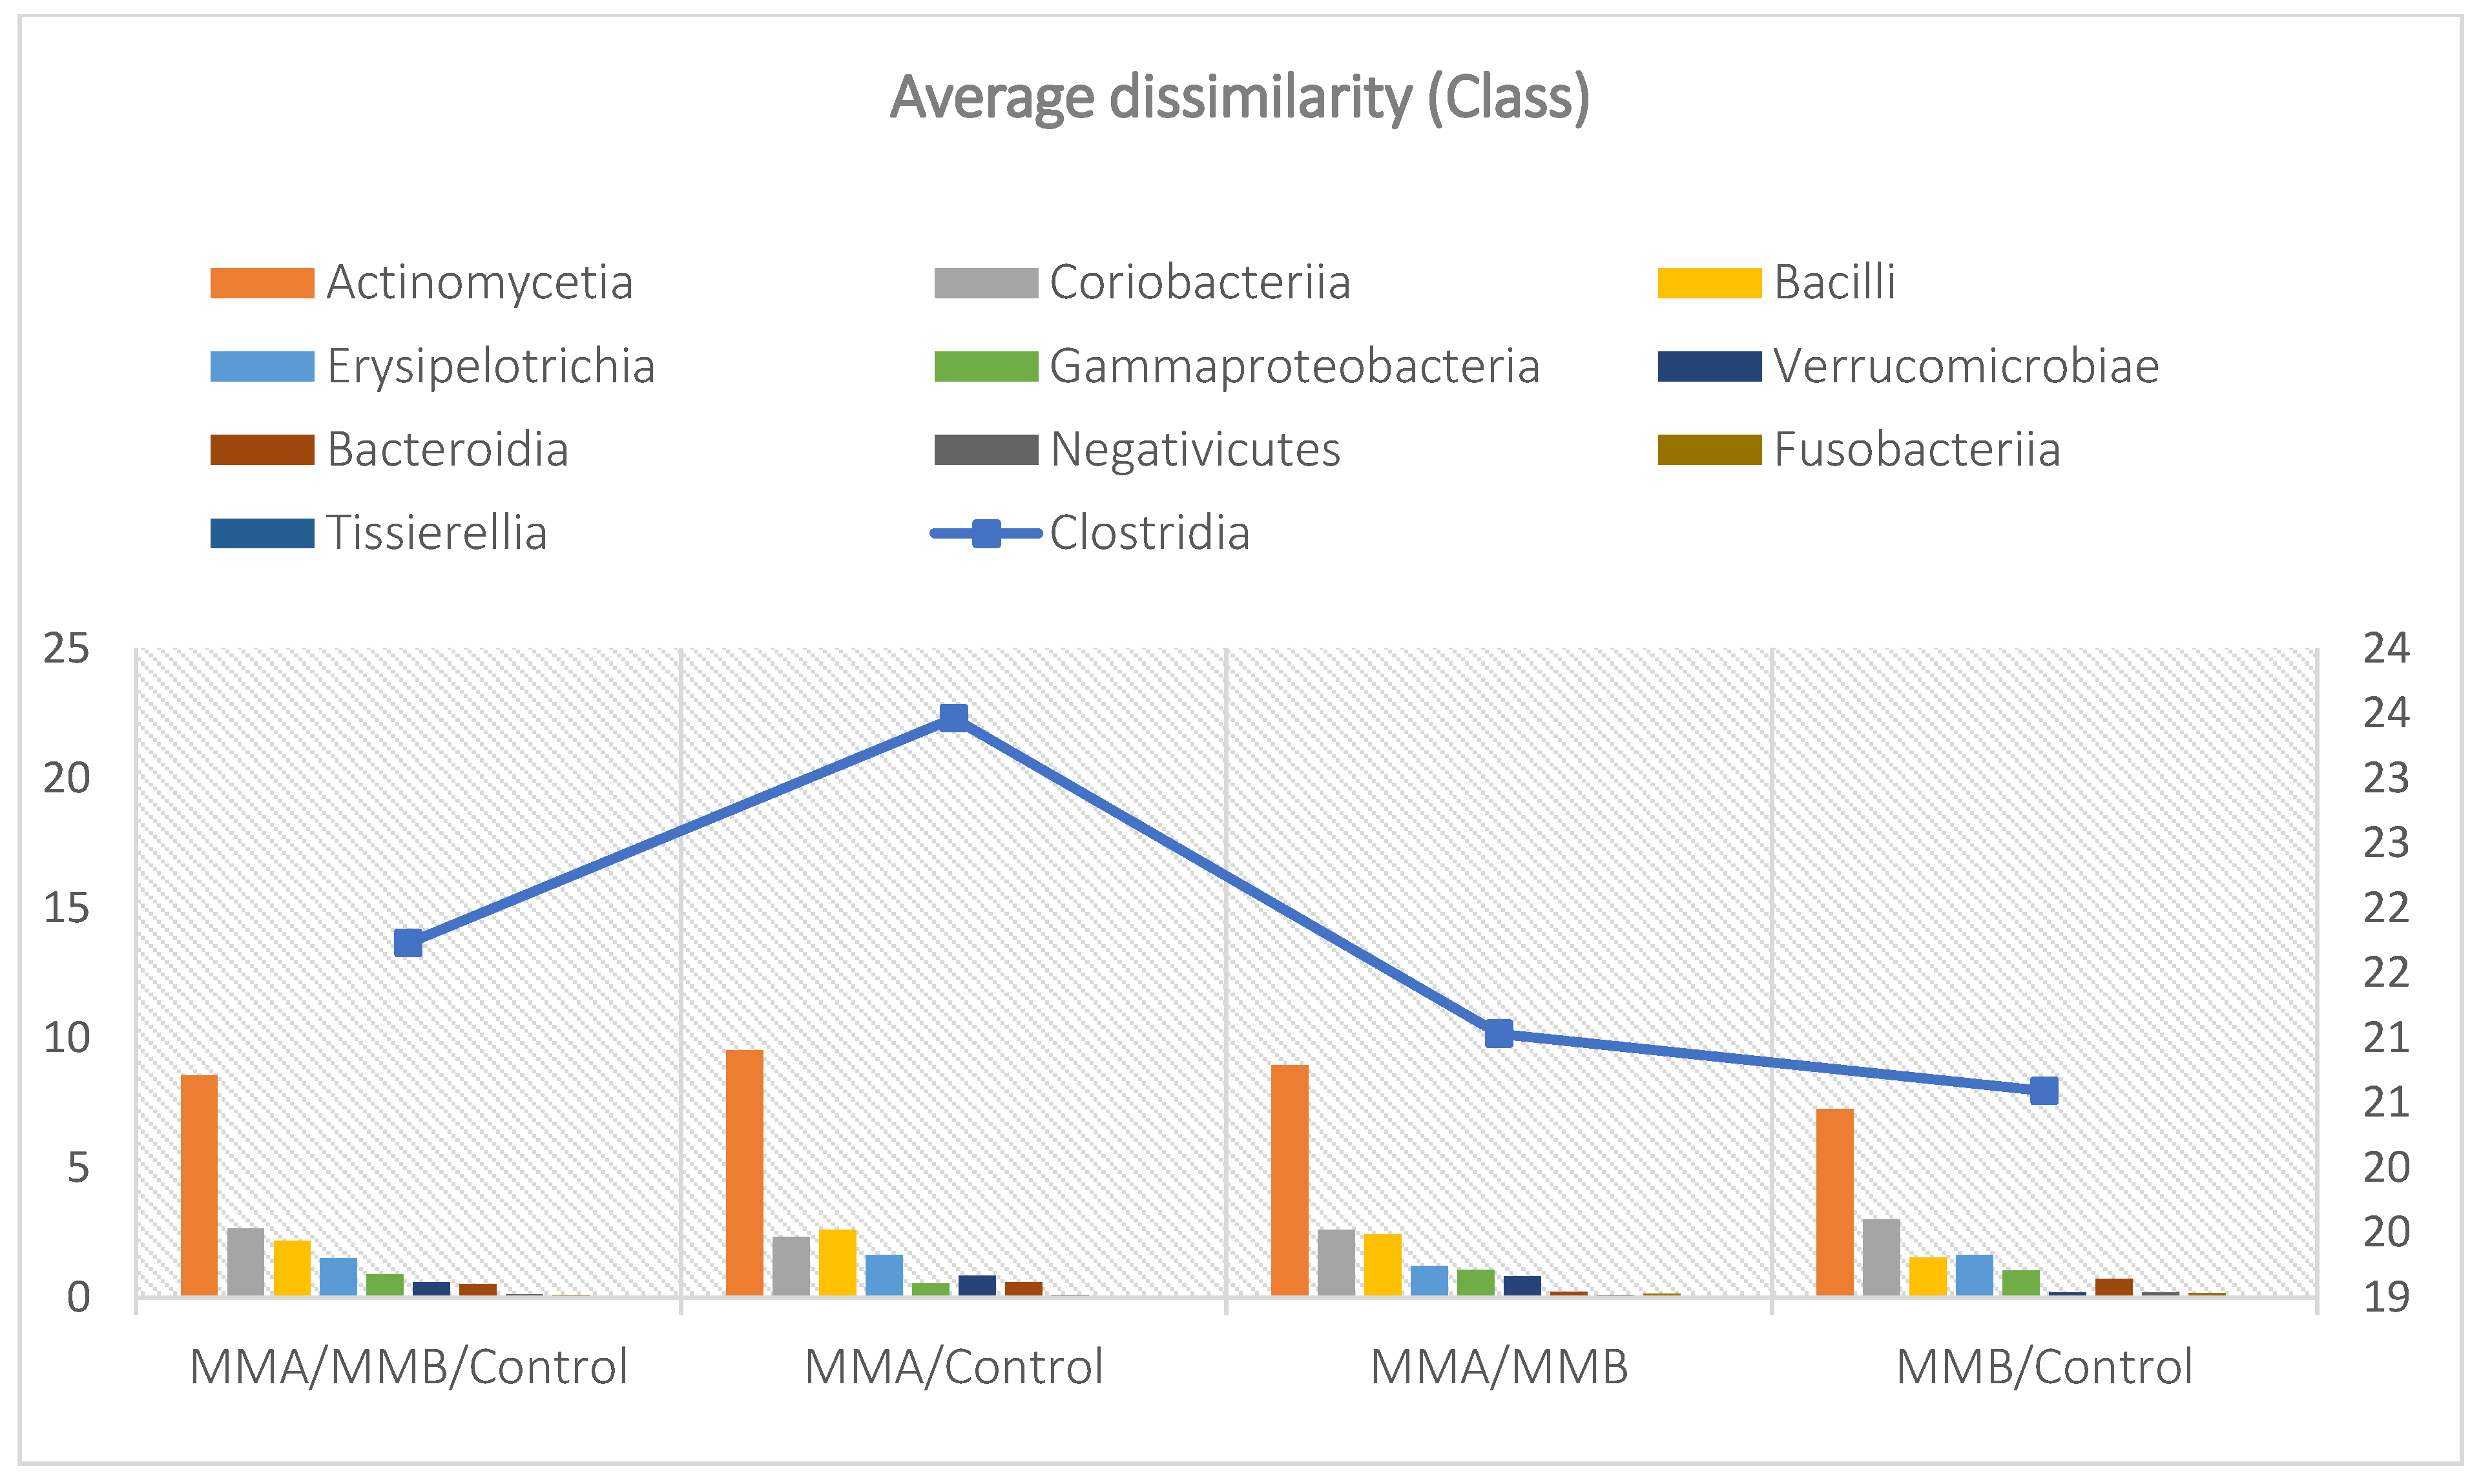
Figure 5.
Mean divergence between the study groups (MMA, MMB, Control) at the family level.
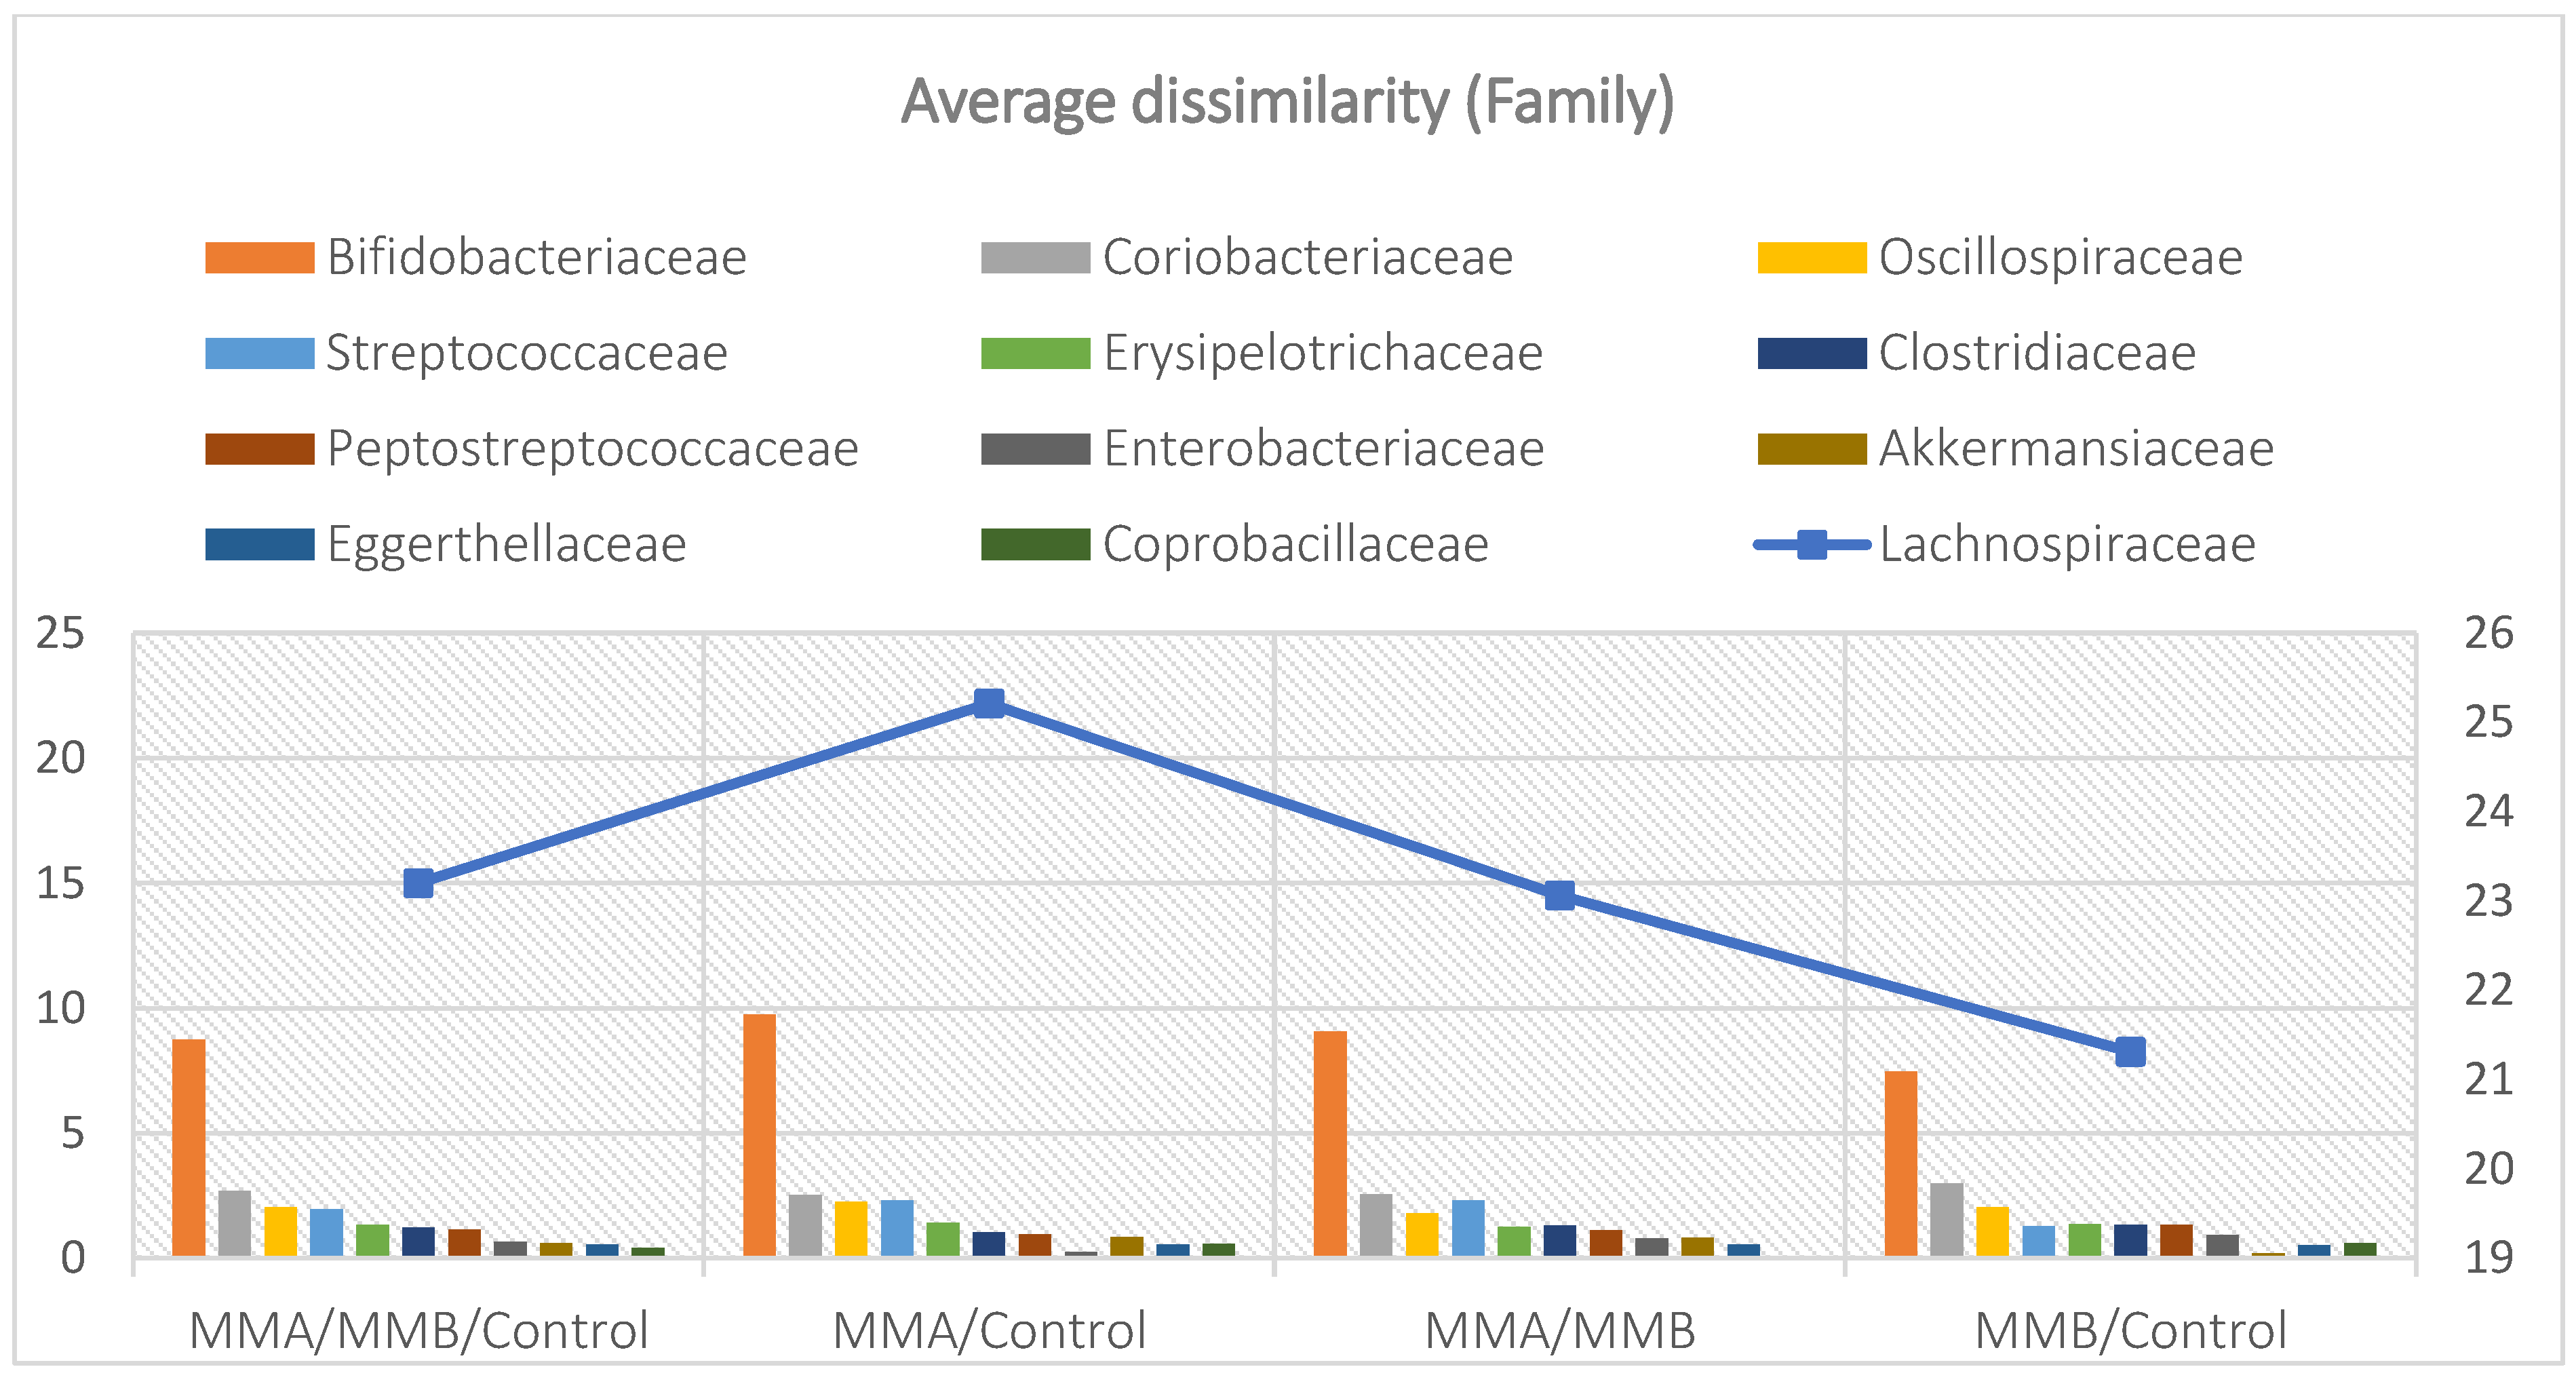
Figure 6.
Average abundance of taxa within phyla for each group expressed as percentage (A) and quantitatively (number of reads) (B).
Figure 6.
Average abundance of taxa within phyla for each group expressed as percentage (A) and quantitatively (number of reads) (B).
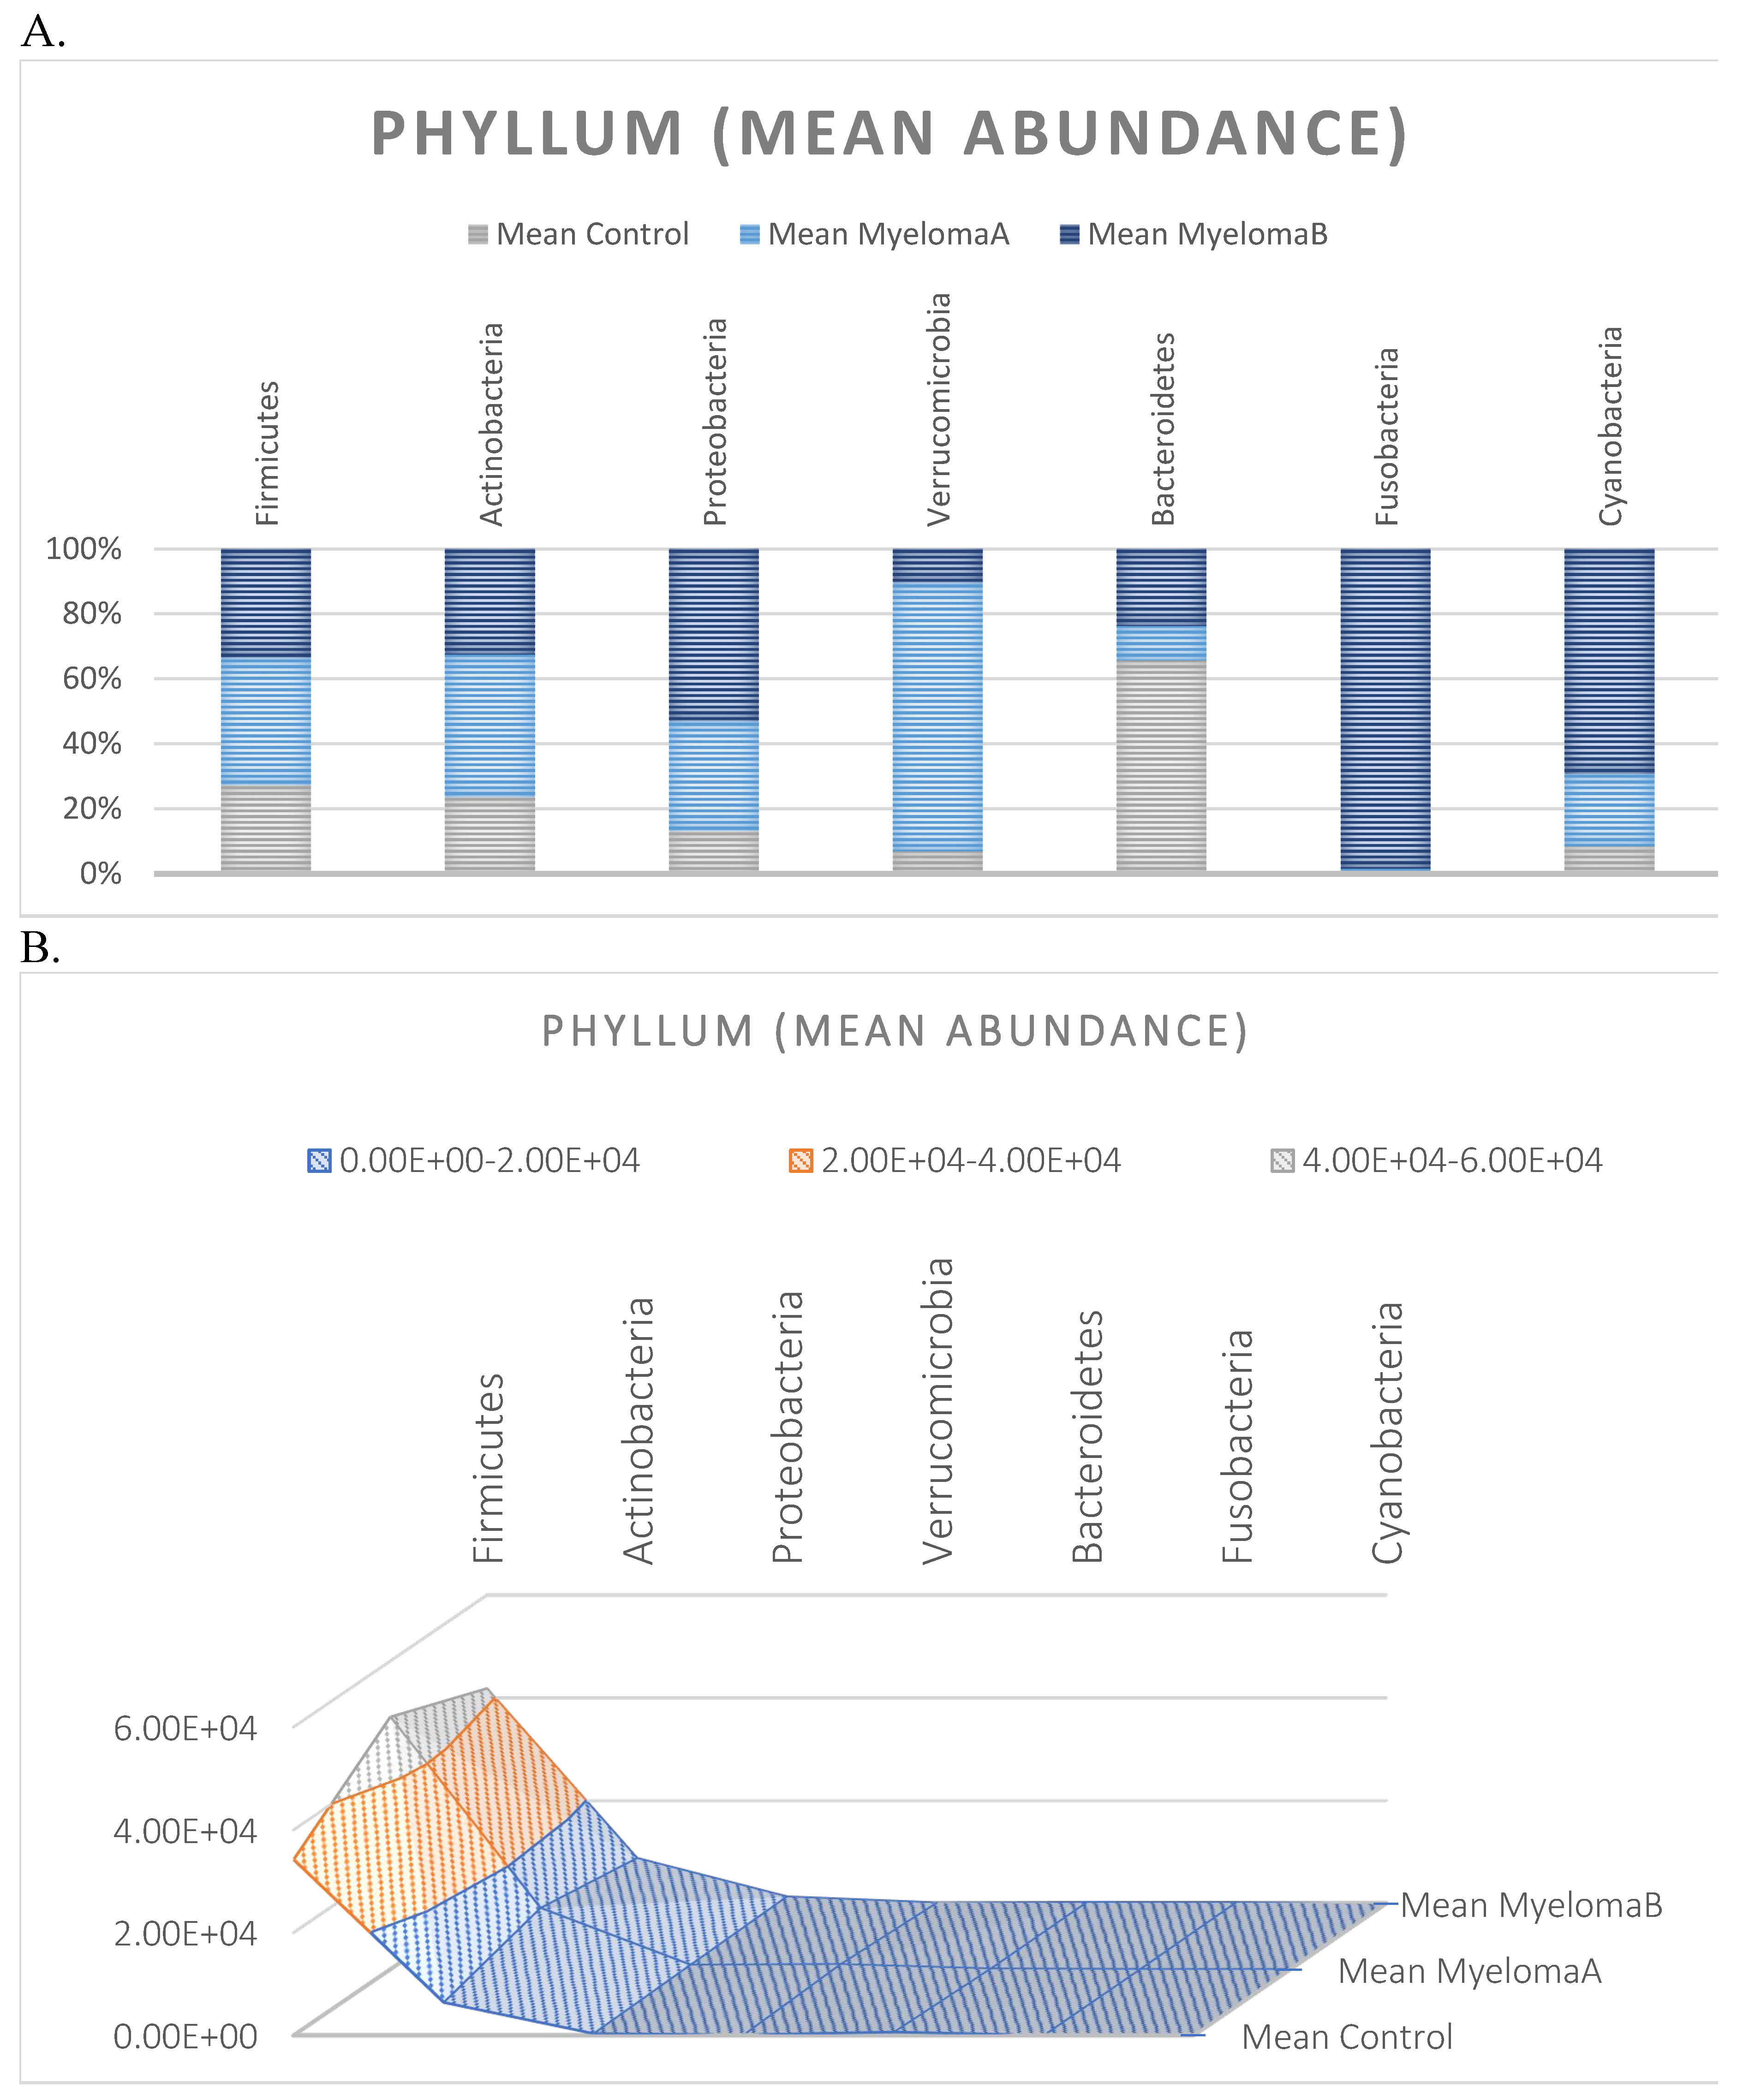
Figure 7.
Average abundance within classes for each group expressed as percentage (A) and quantitatively (number of reads) (B).
Figure 7.
Average abundance within classes for each group expressed as percentage (A) and quantitatively (number of reads) (B).
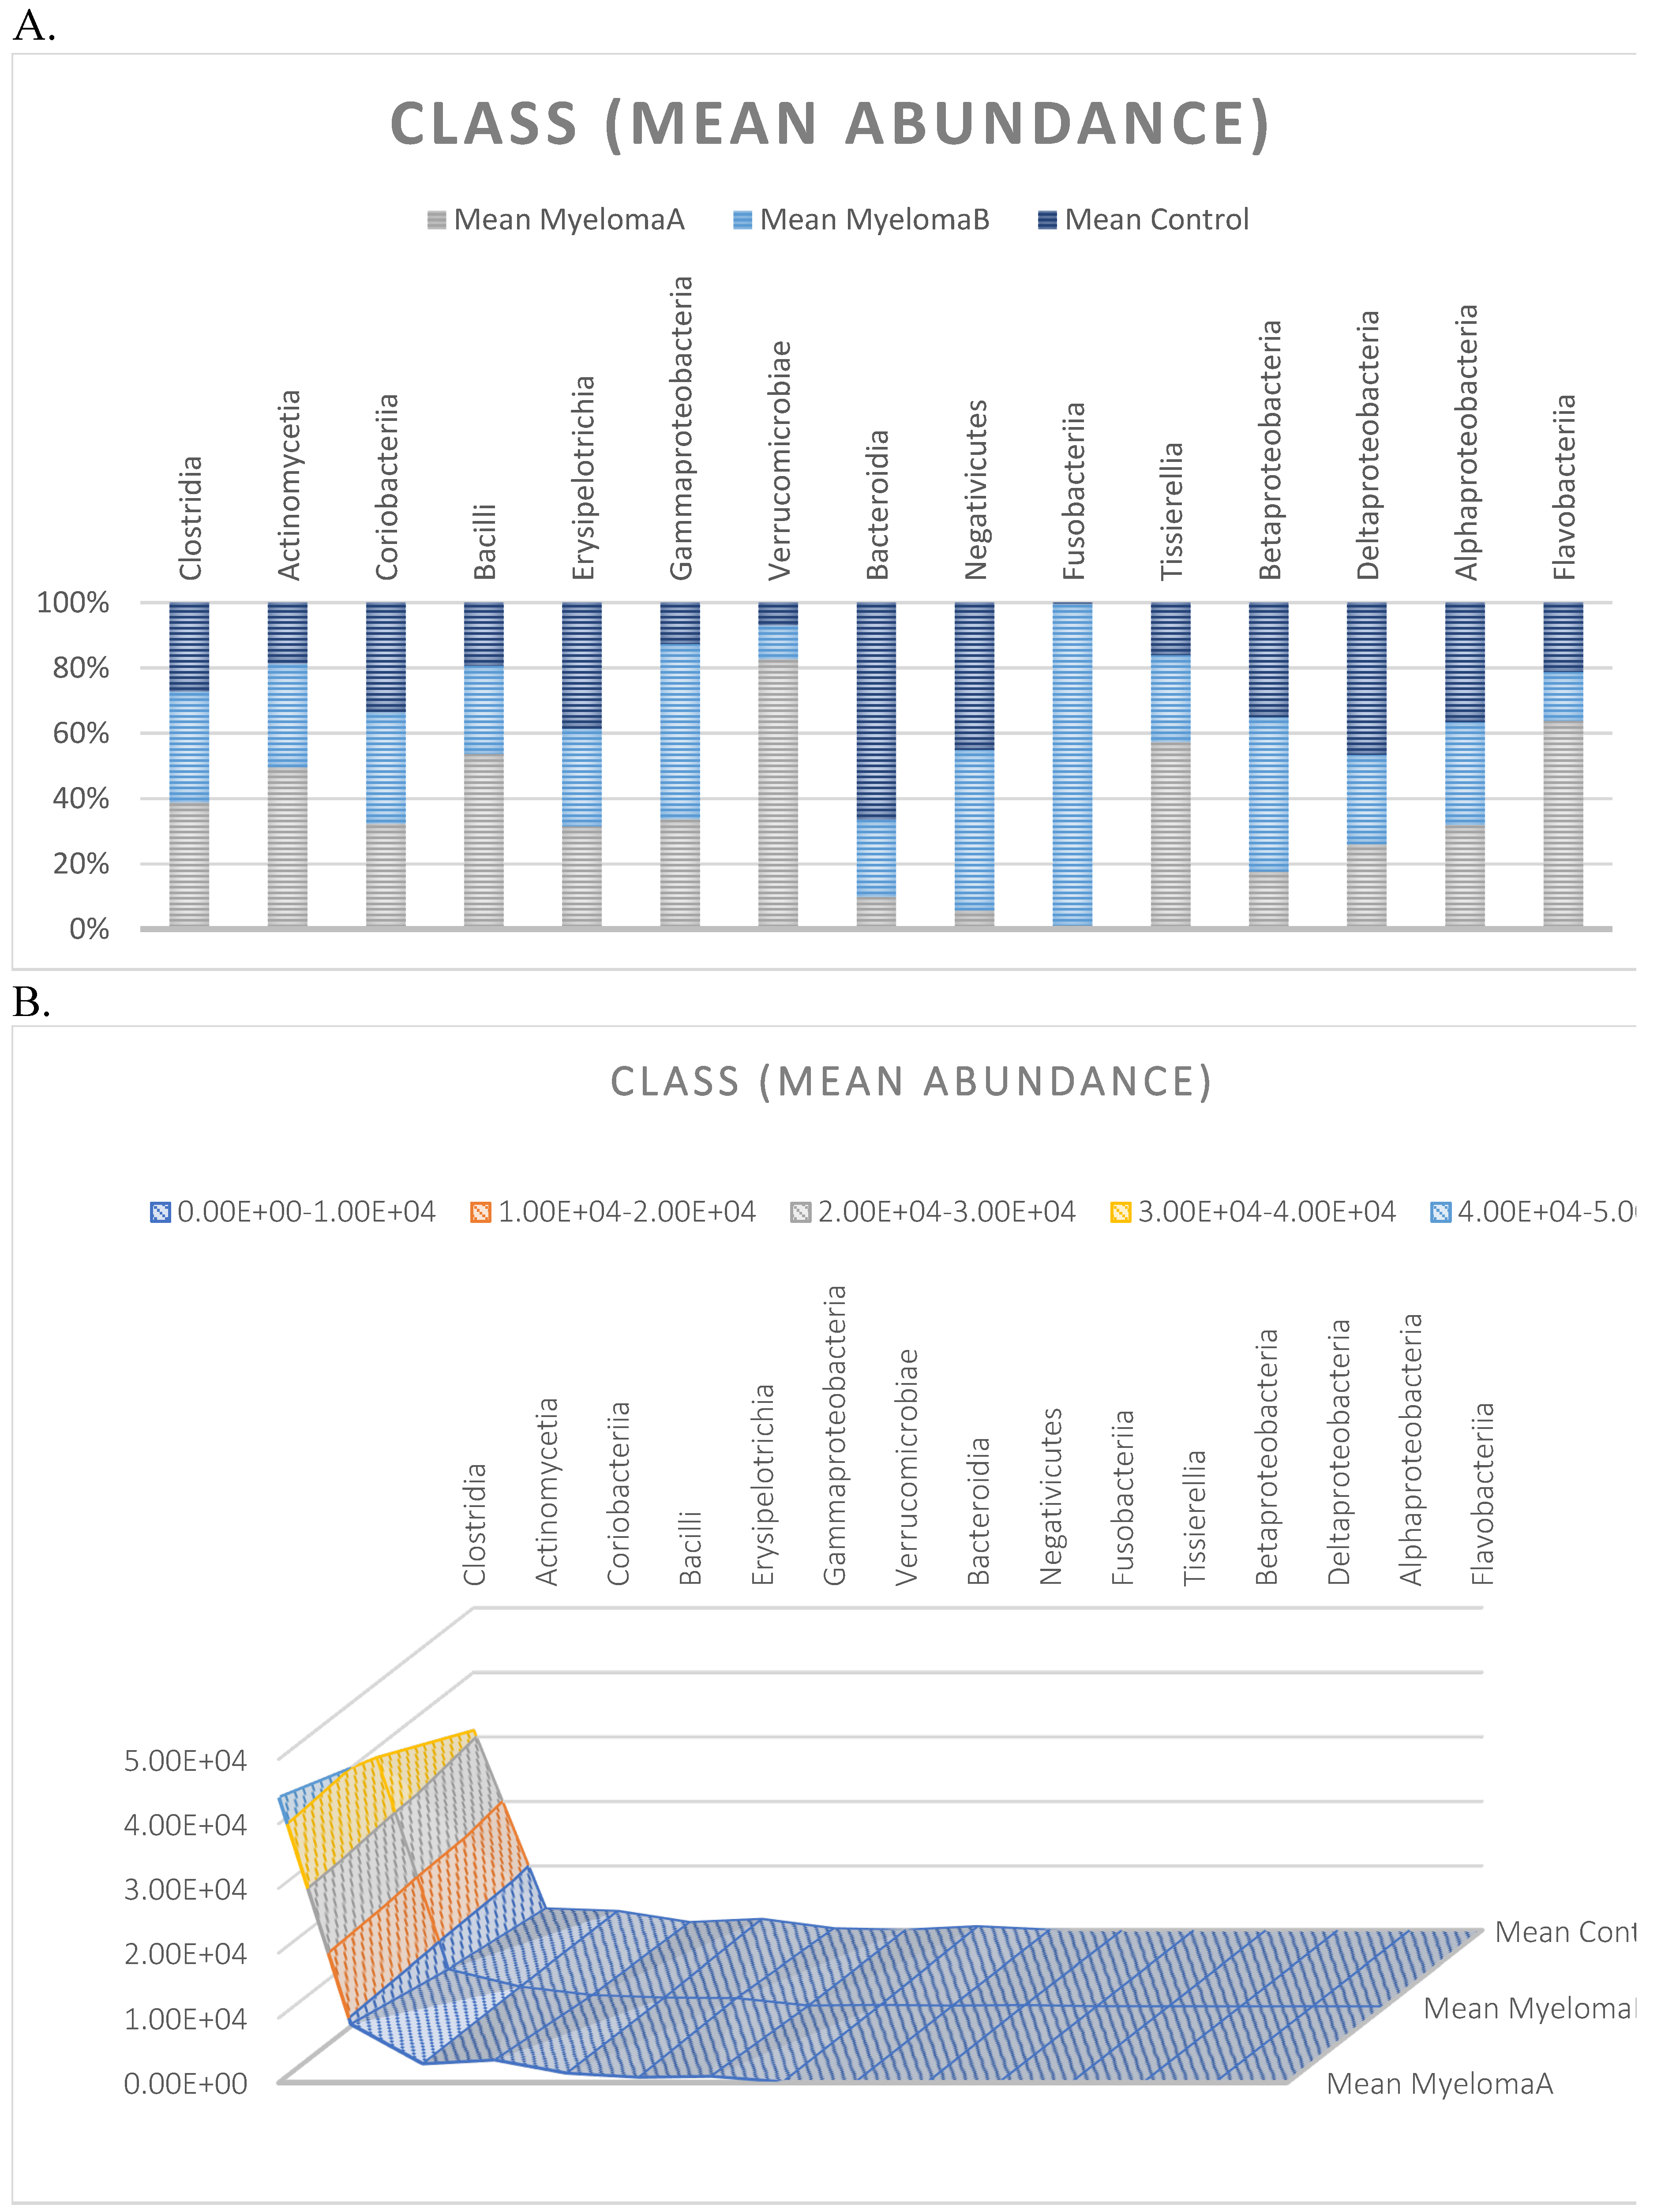
Figure 8.
Average abundance within families for each group expressed as percentage (A) and quantitatively (number of reads) (B).
Figure 8.
Average abundance within families for each group expressed as percentage (A) and quantitatively (number of reads) (B).
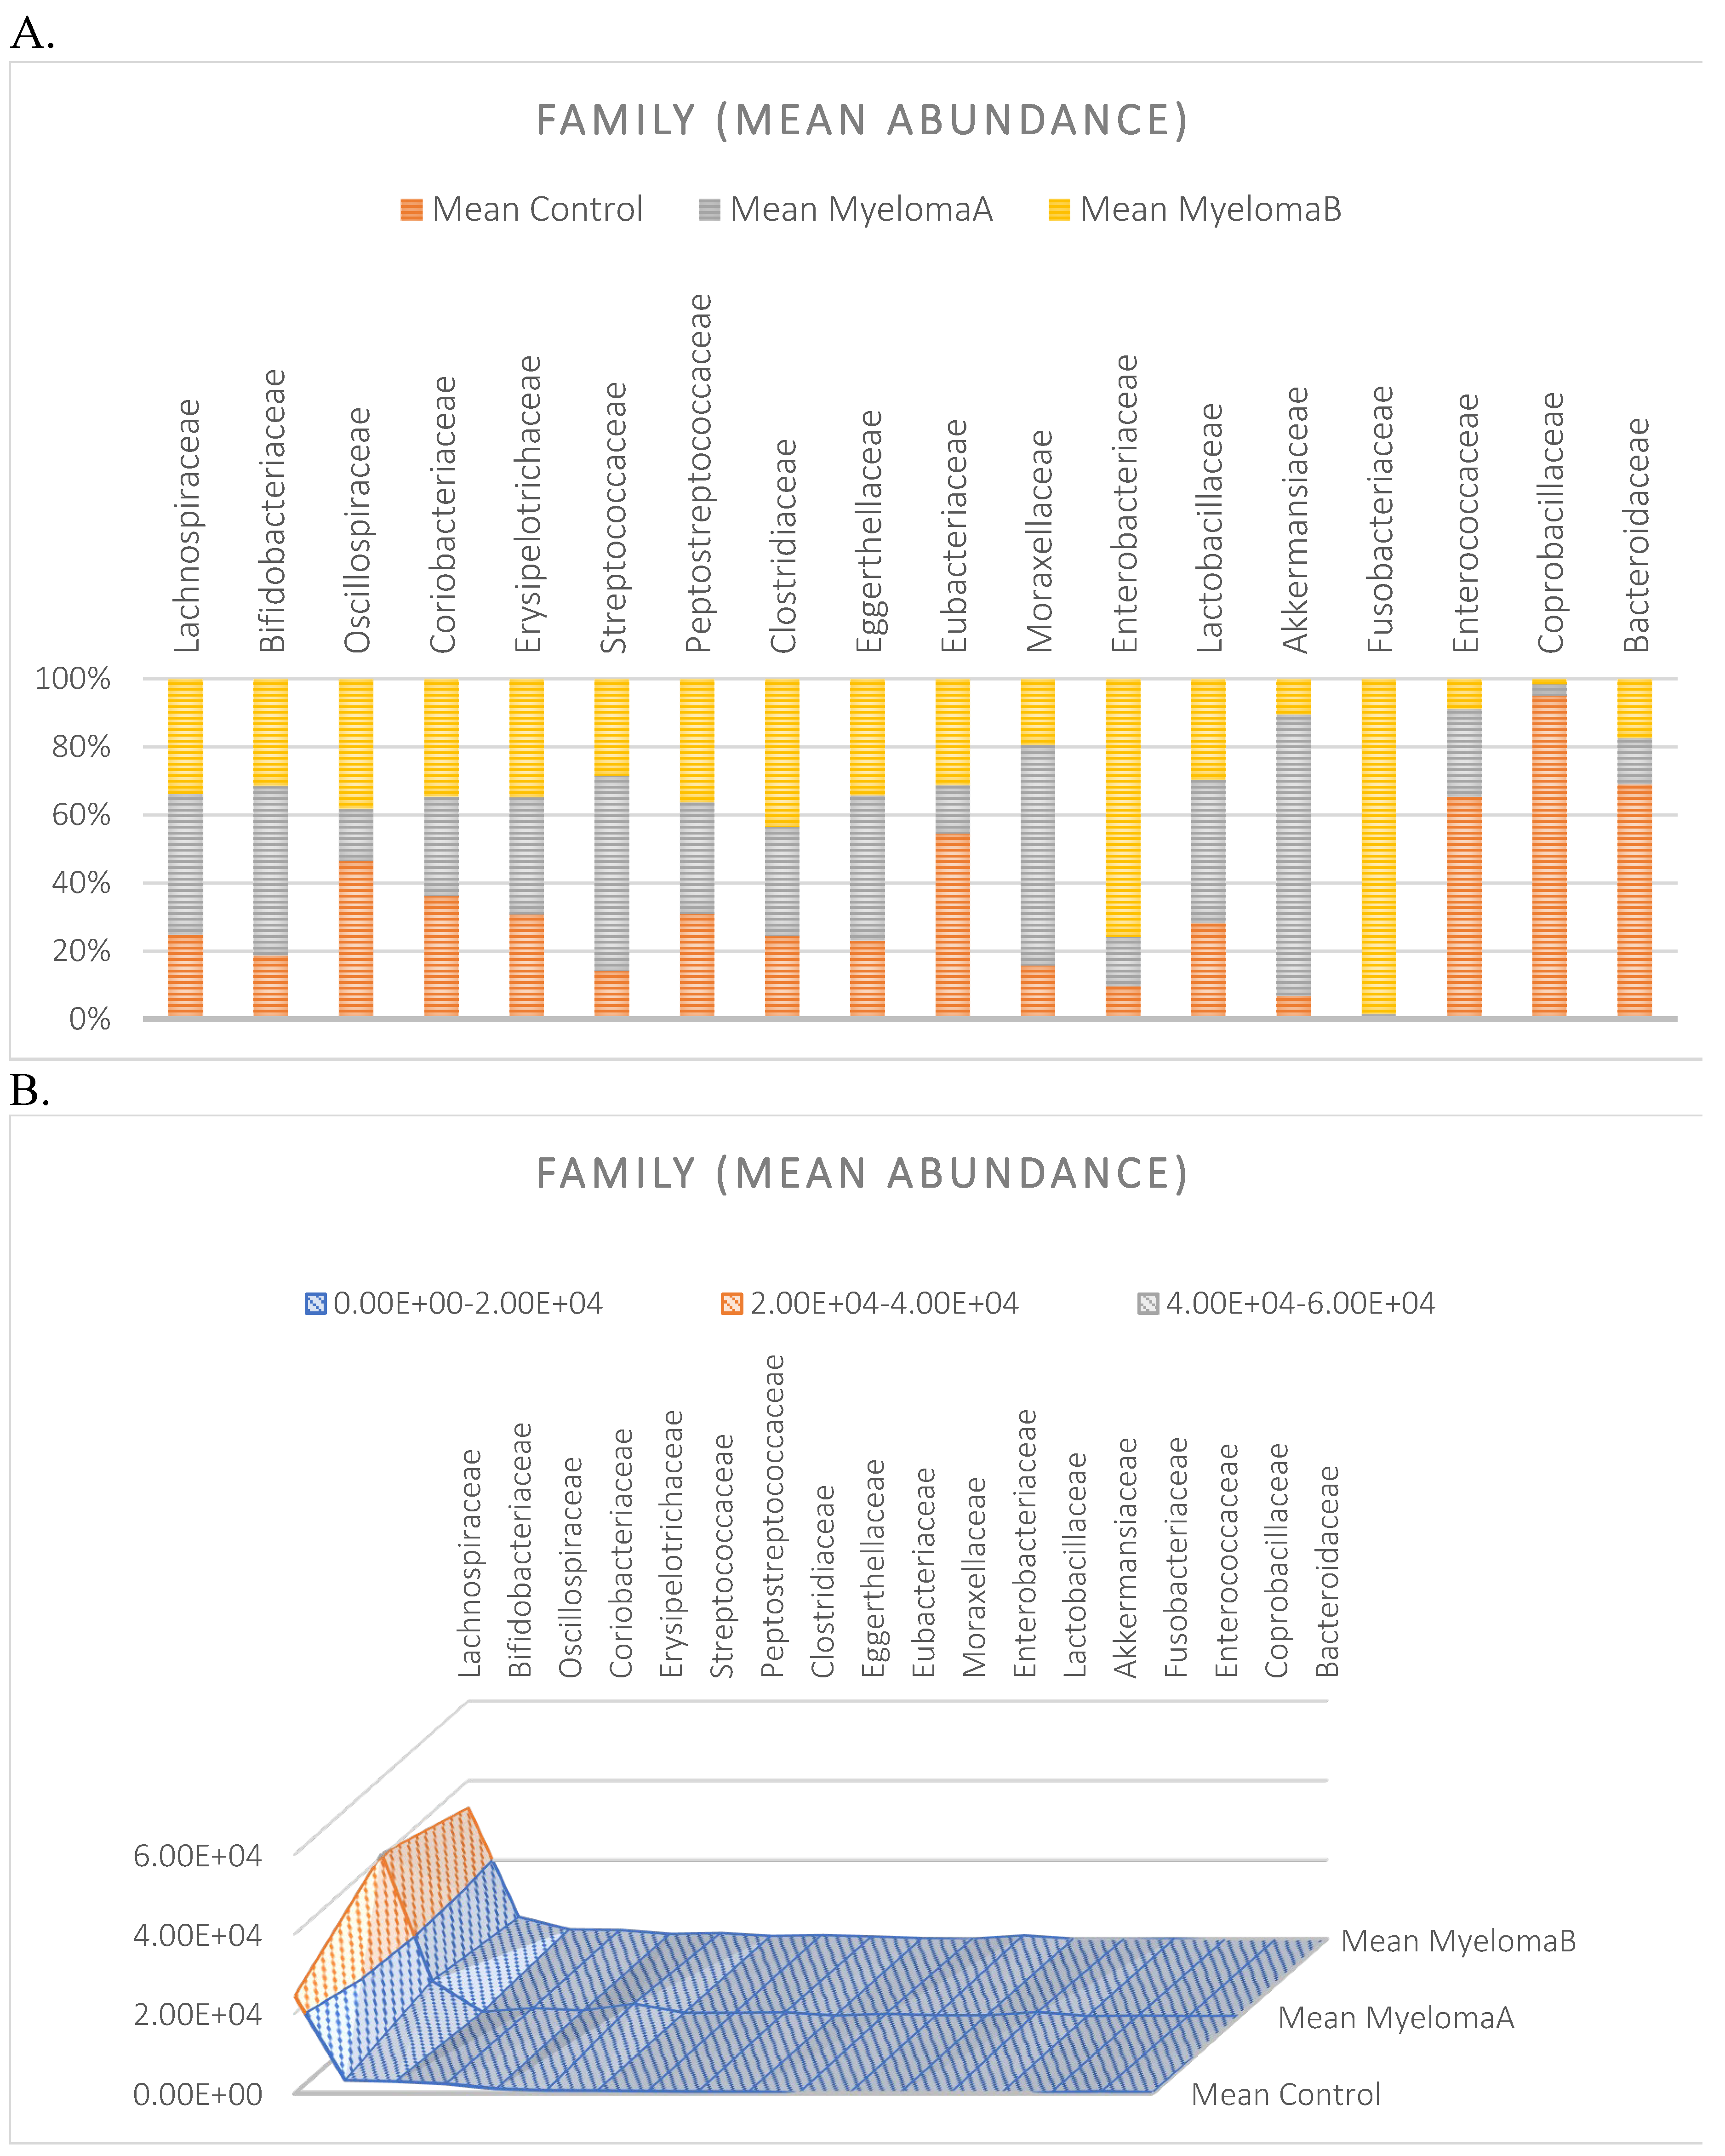
Figure 9.
The percentage contribution of taxa within the taxonomic ranks (Phylum, Class, Family) with respect to the group divisions: MMA, MMB, Control. Phylum level based on the microbiota analysis of all studied samples (A); Phylum level based on the microbiota analysis of the studied groups: MMA, MMB, Control (B). Class level based on the microbiota analysis of all studied samples (C); Class level based on the microbiota analysis of the studied groups: MMA, MMB, Control (D). Family level based on the microbiota analysis of all studied samples (E); Family level based on the microbiota analysis of the studied groups: MMA, MMB, Control (F).
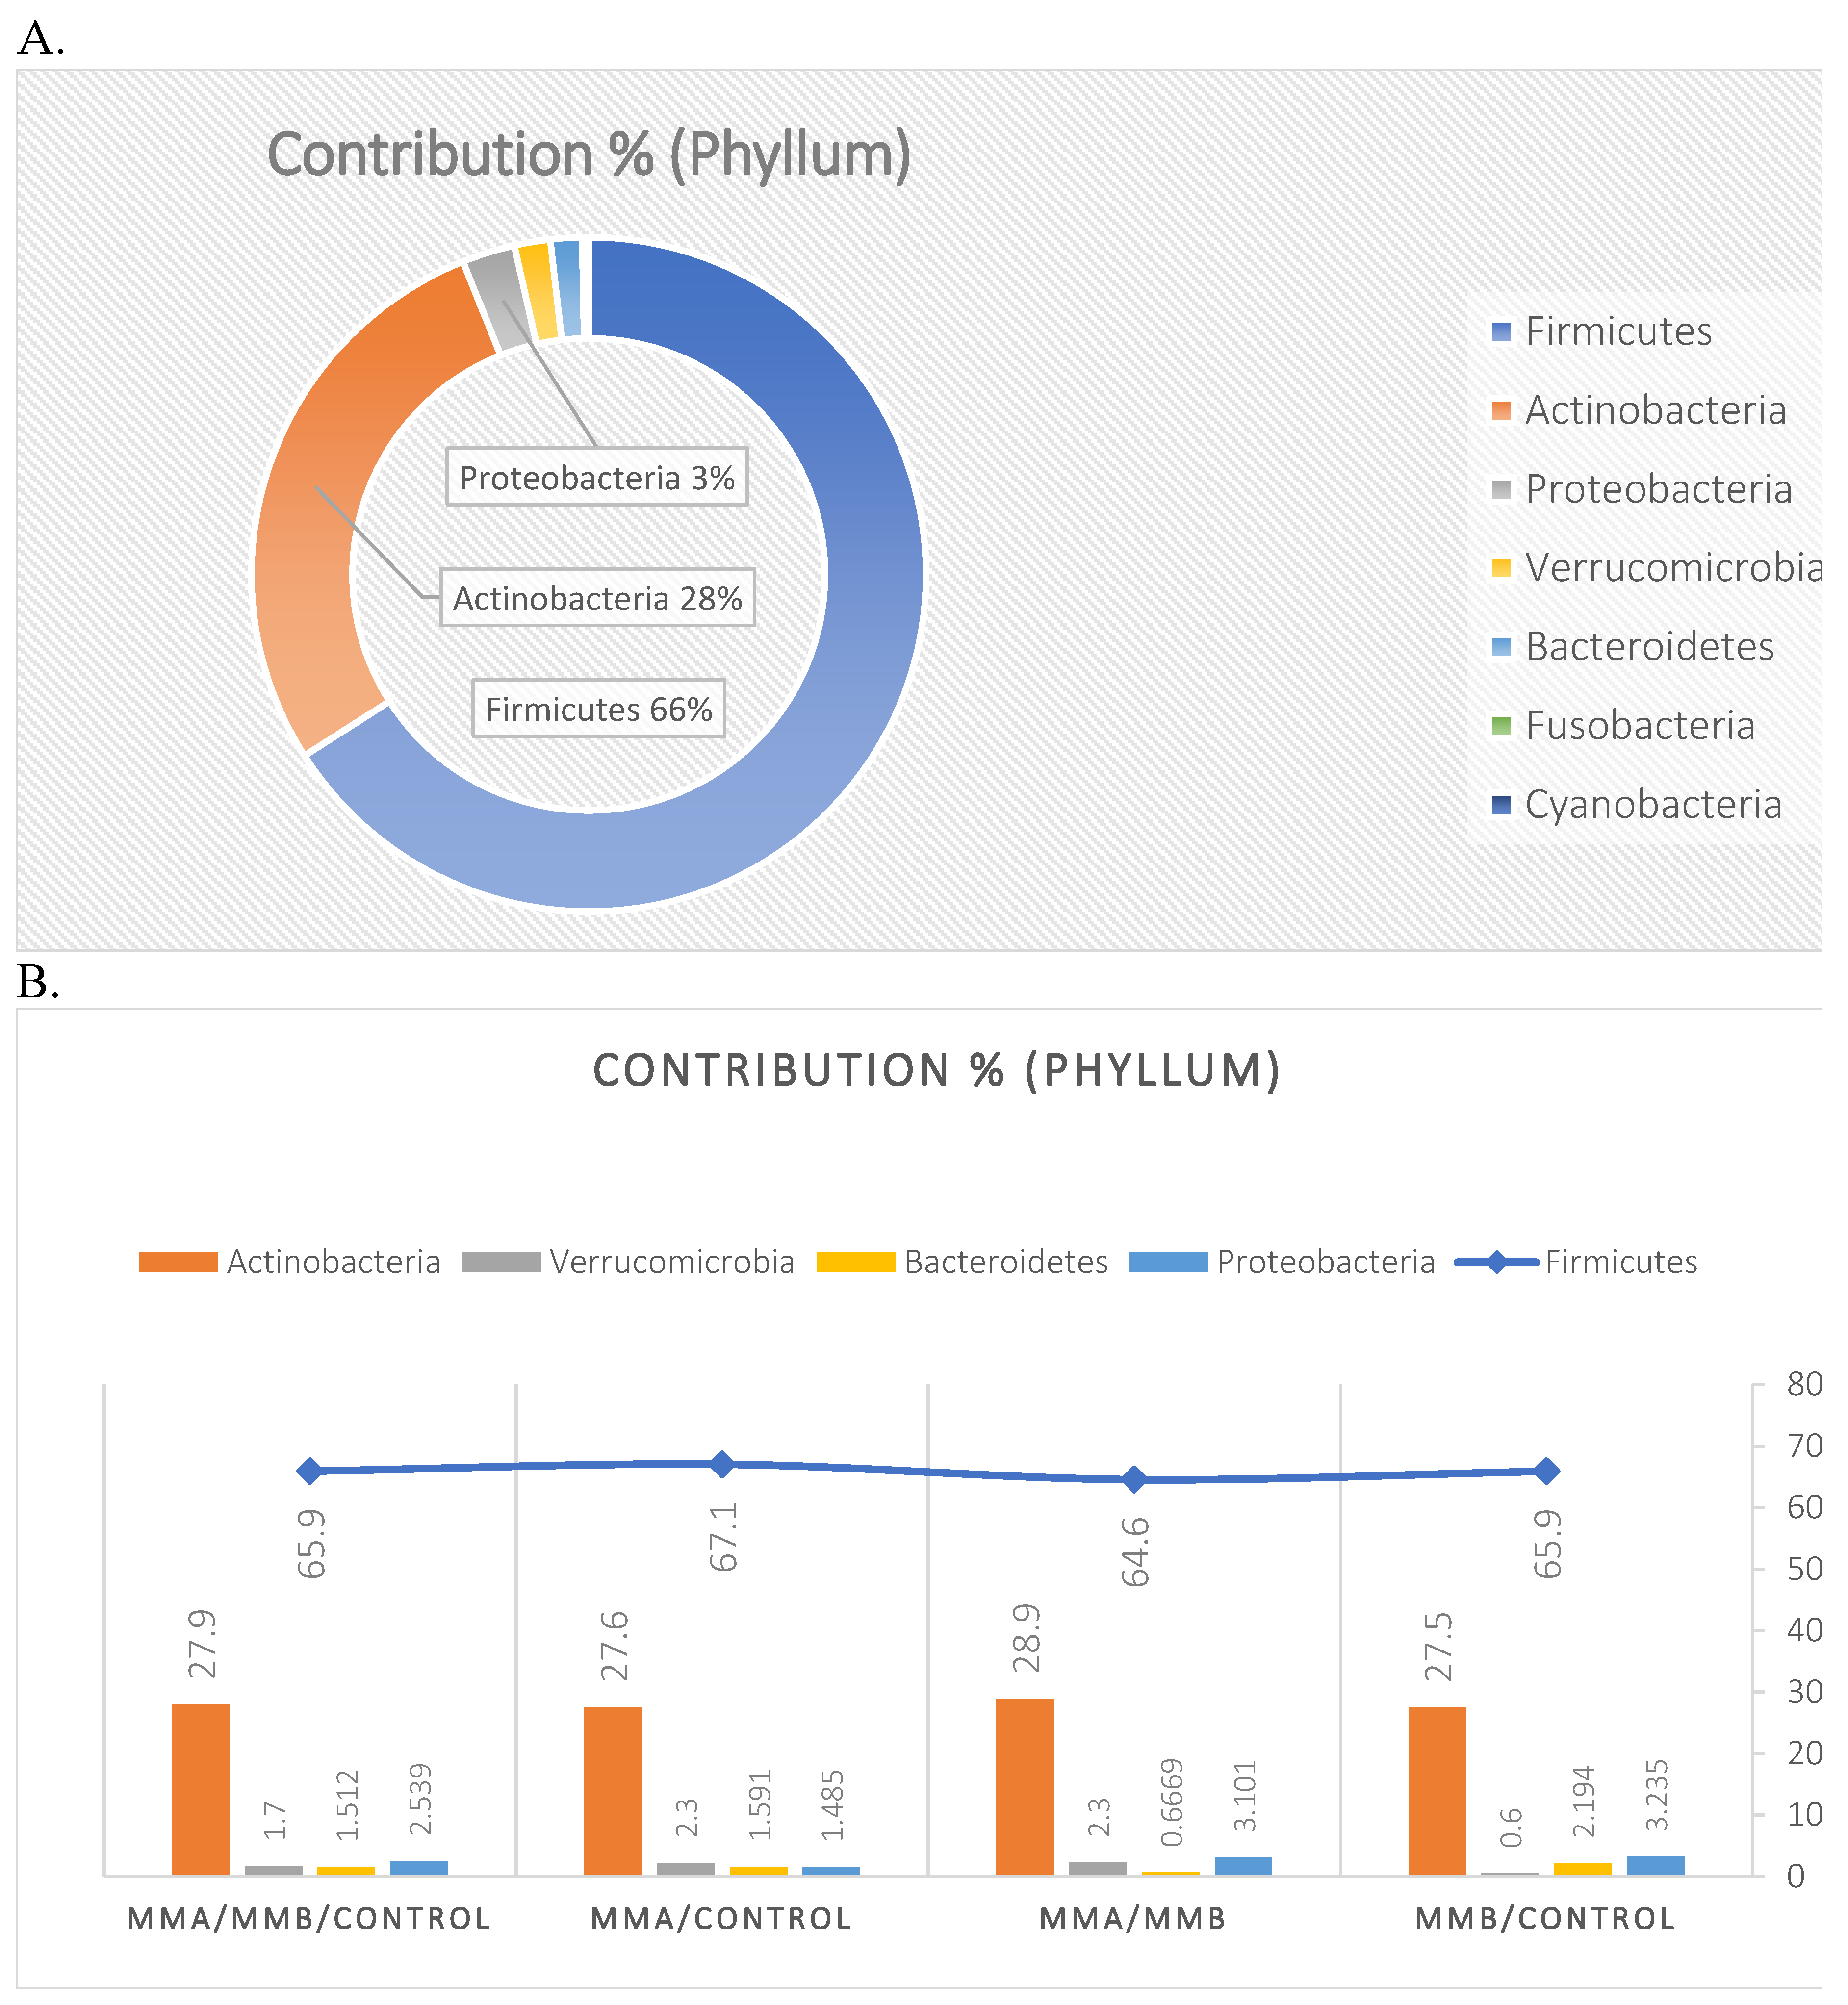
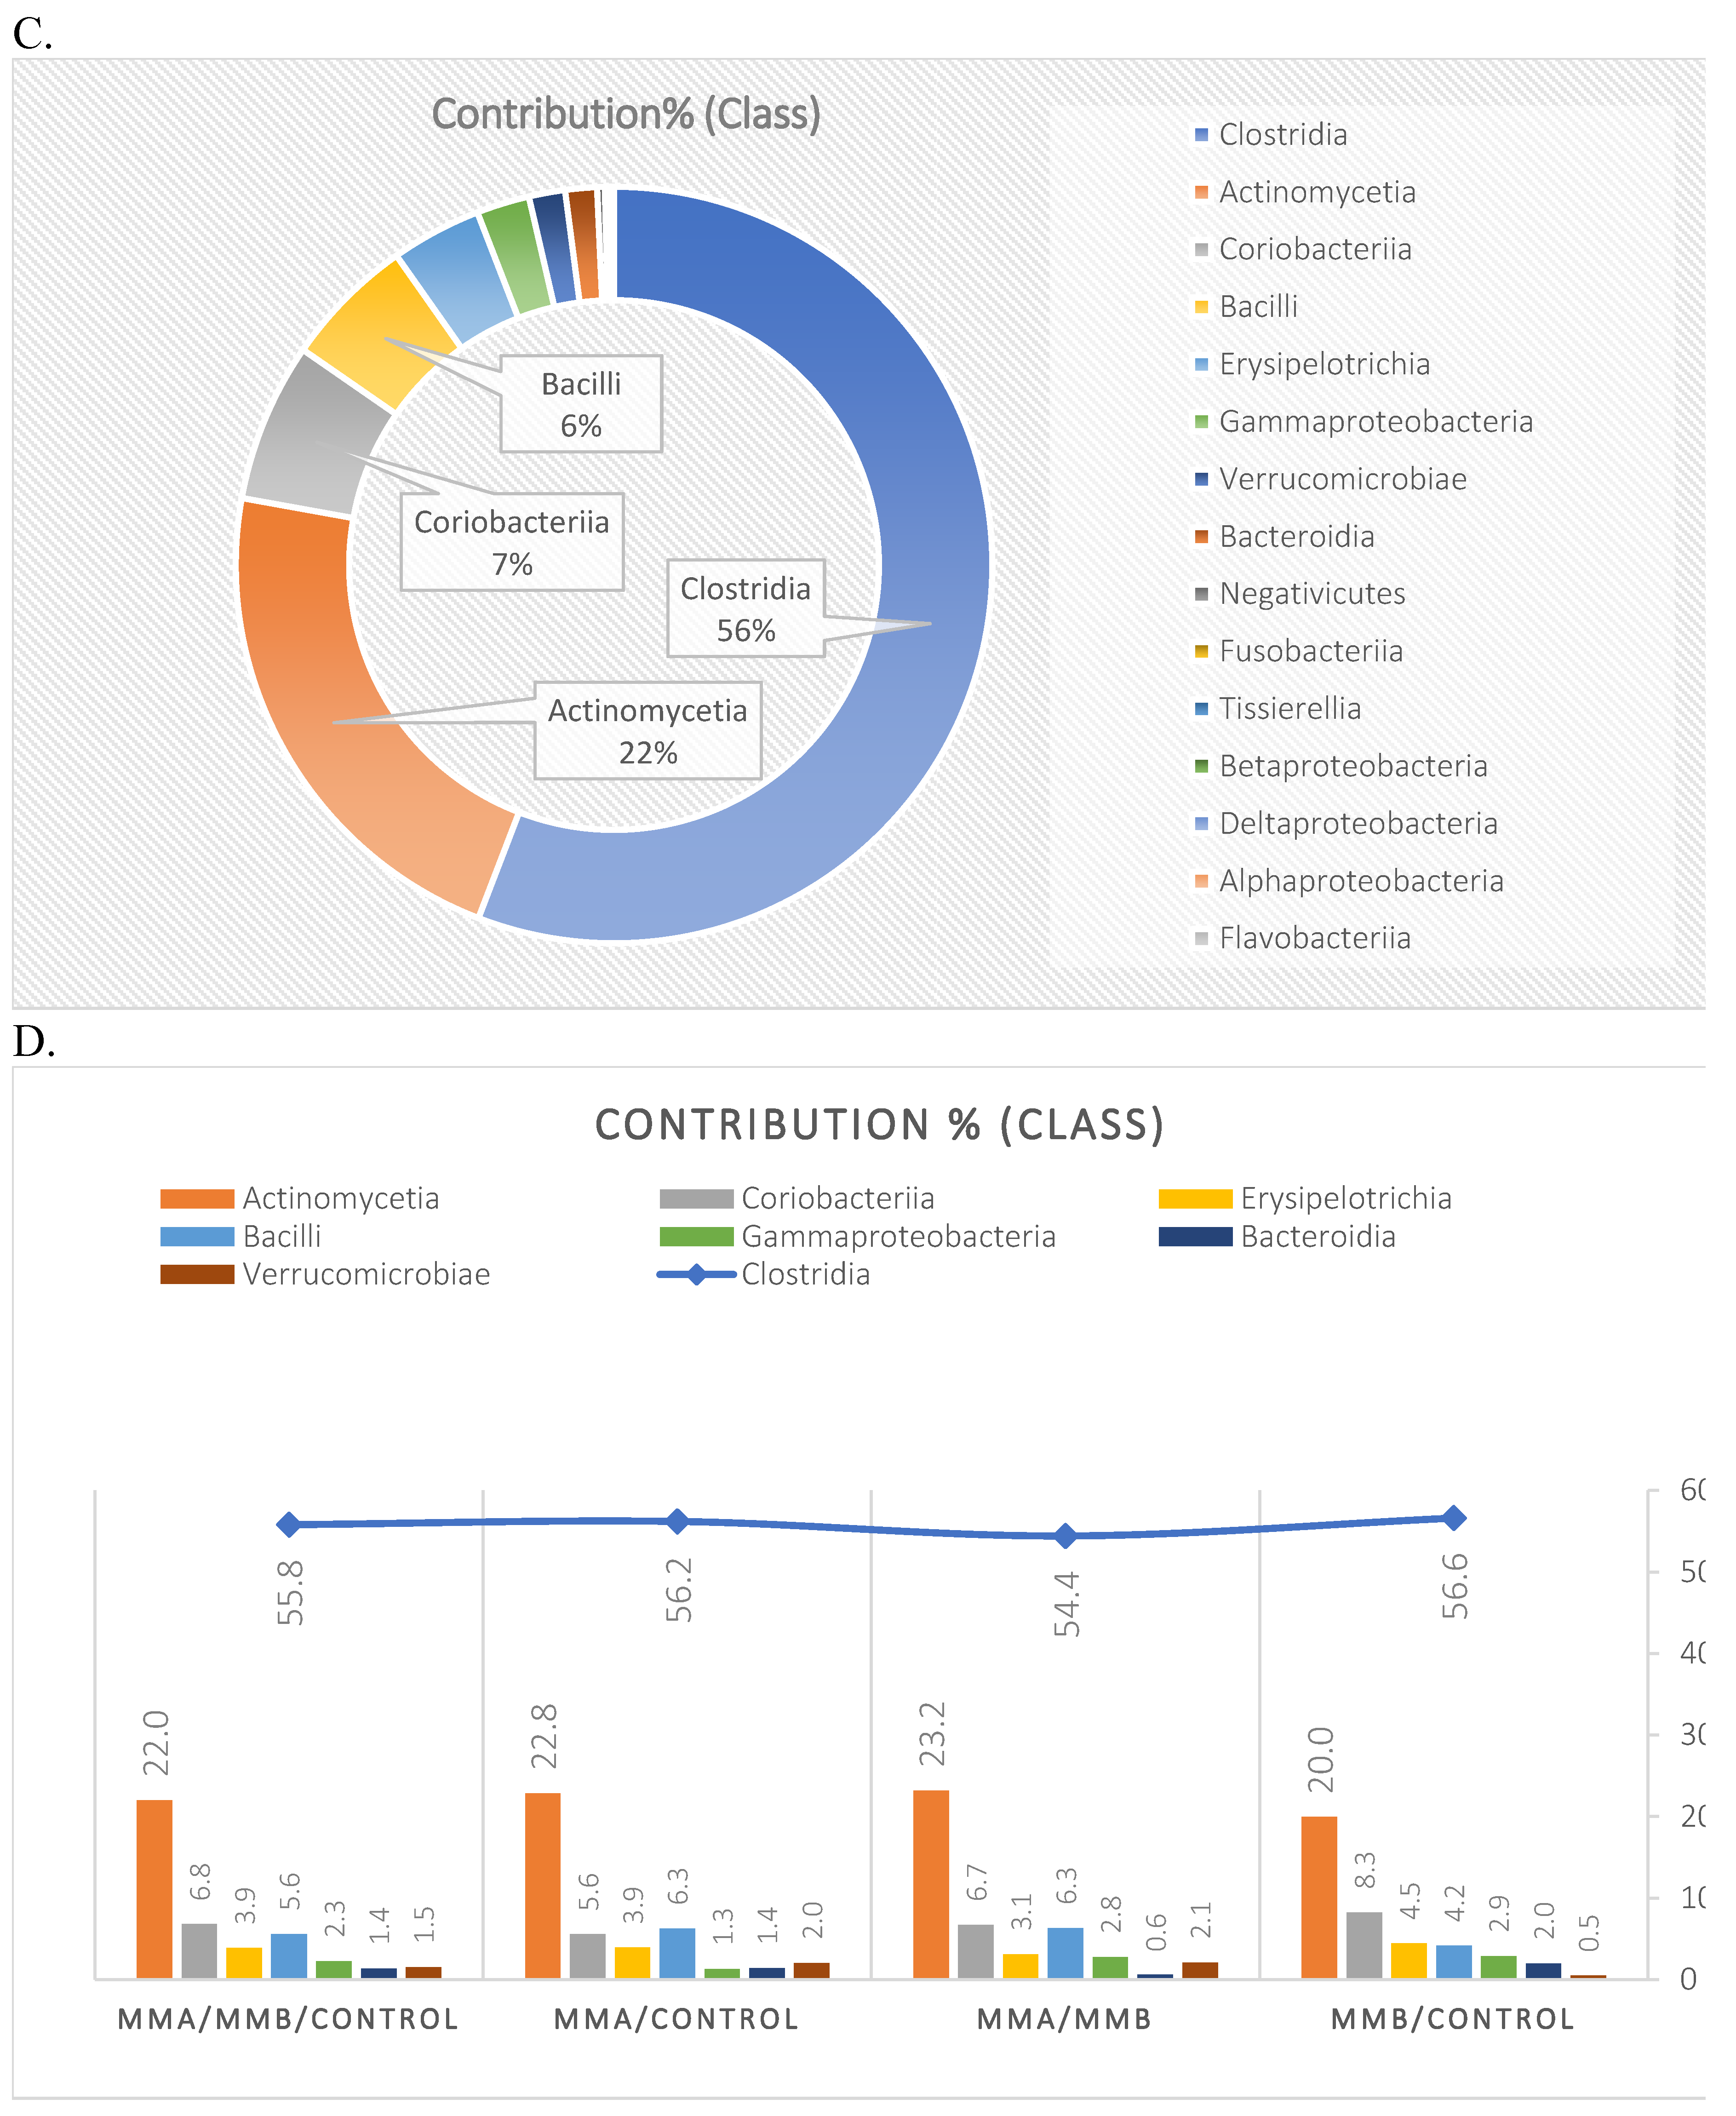
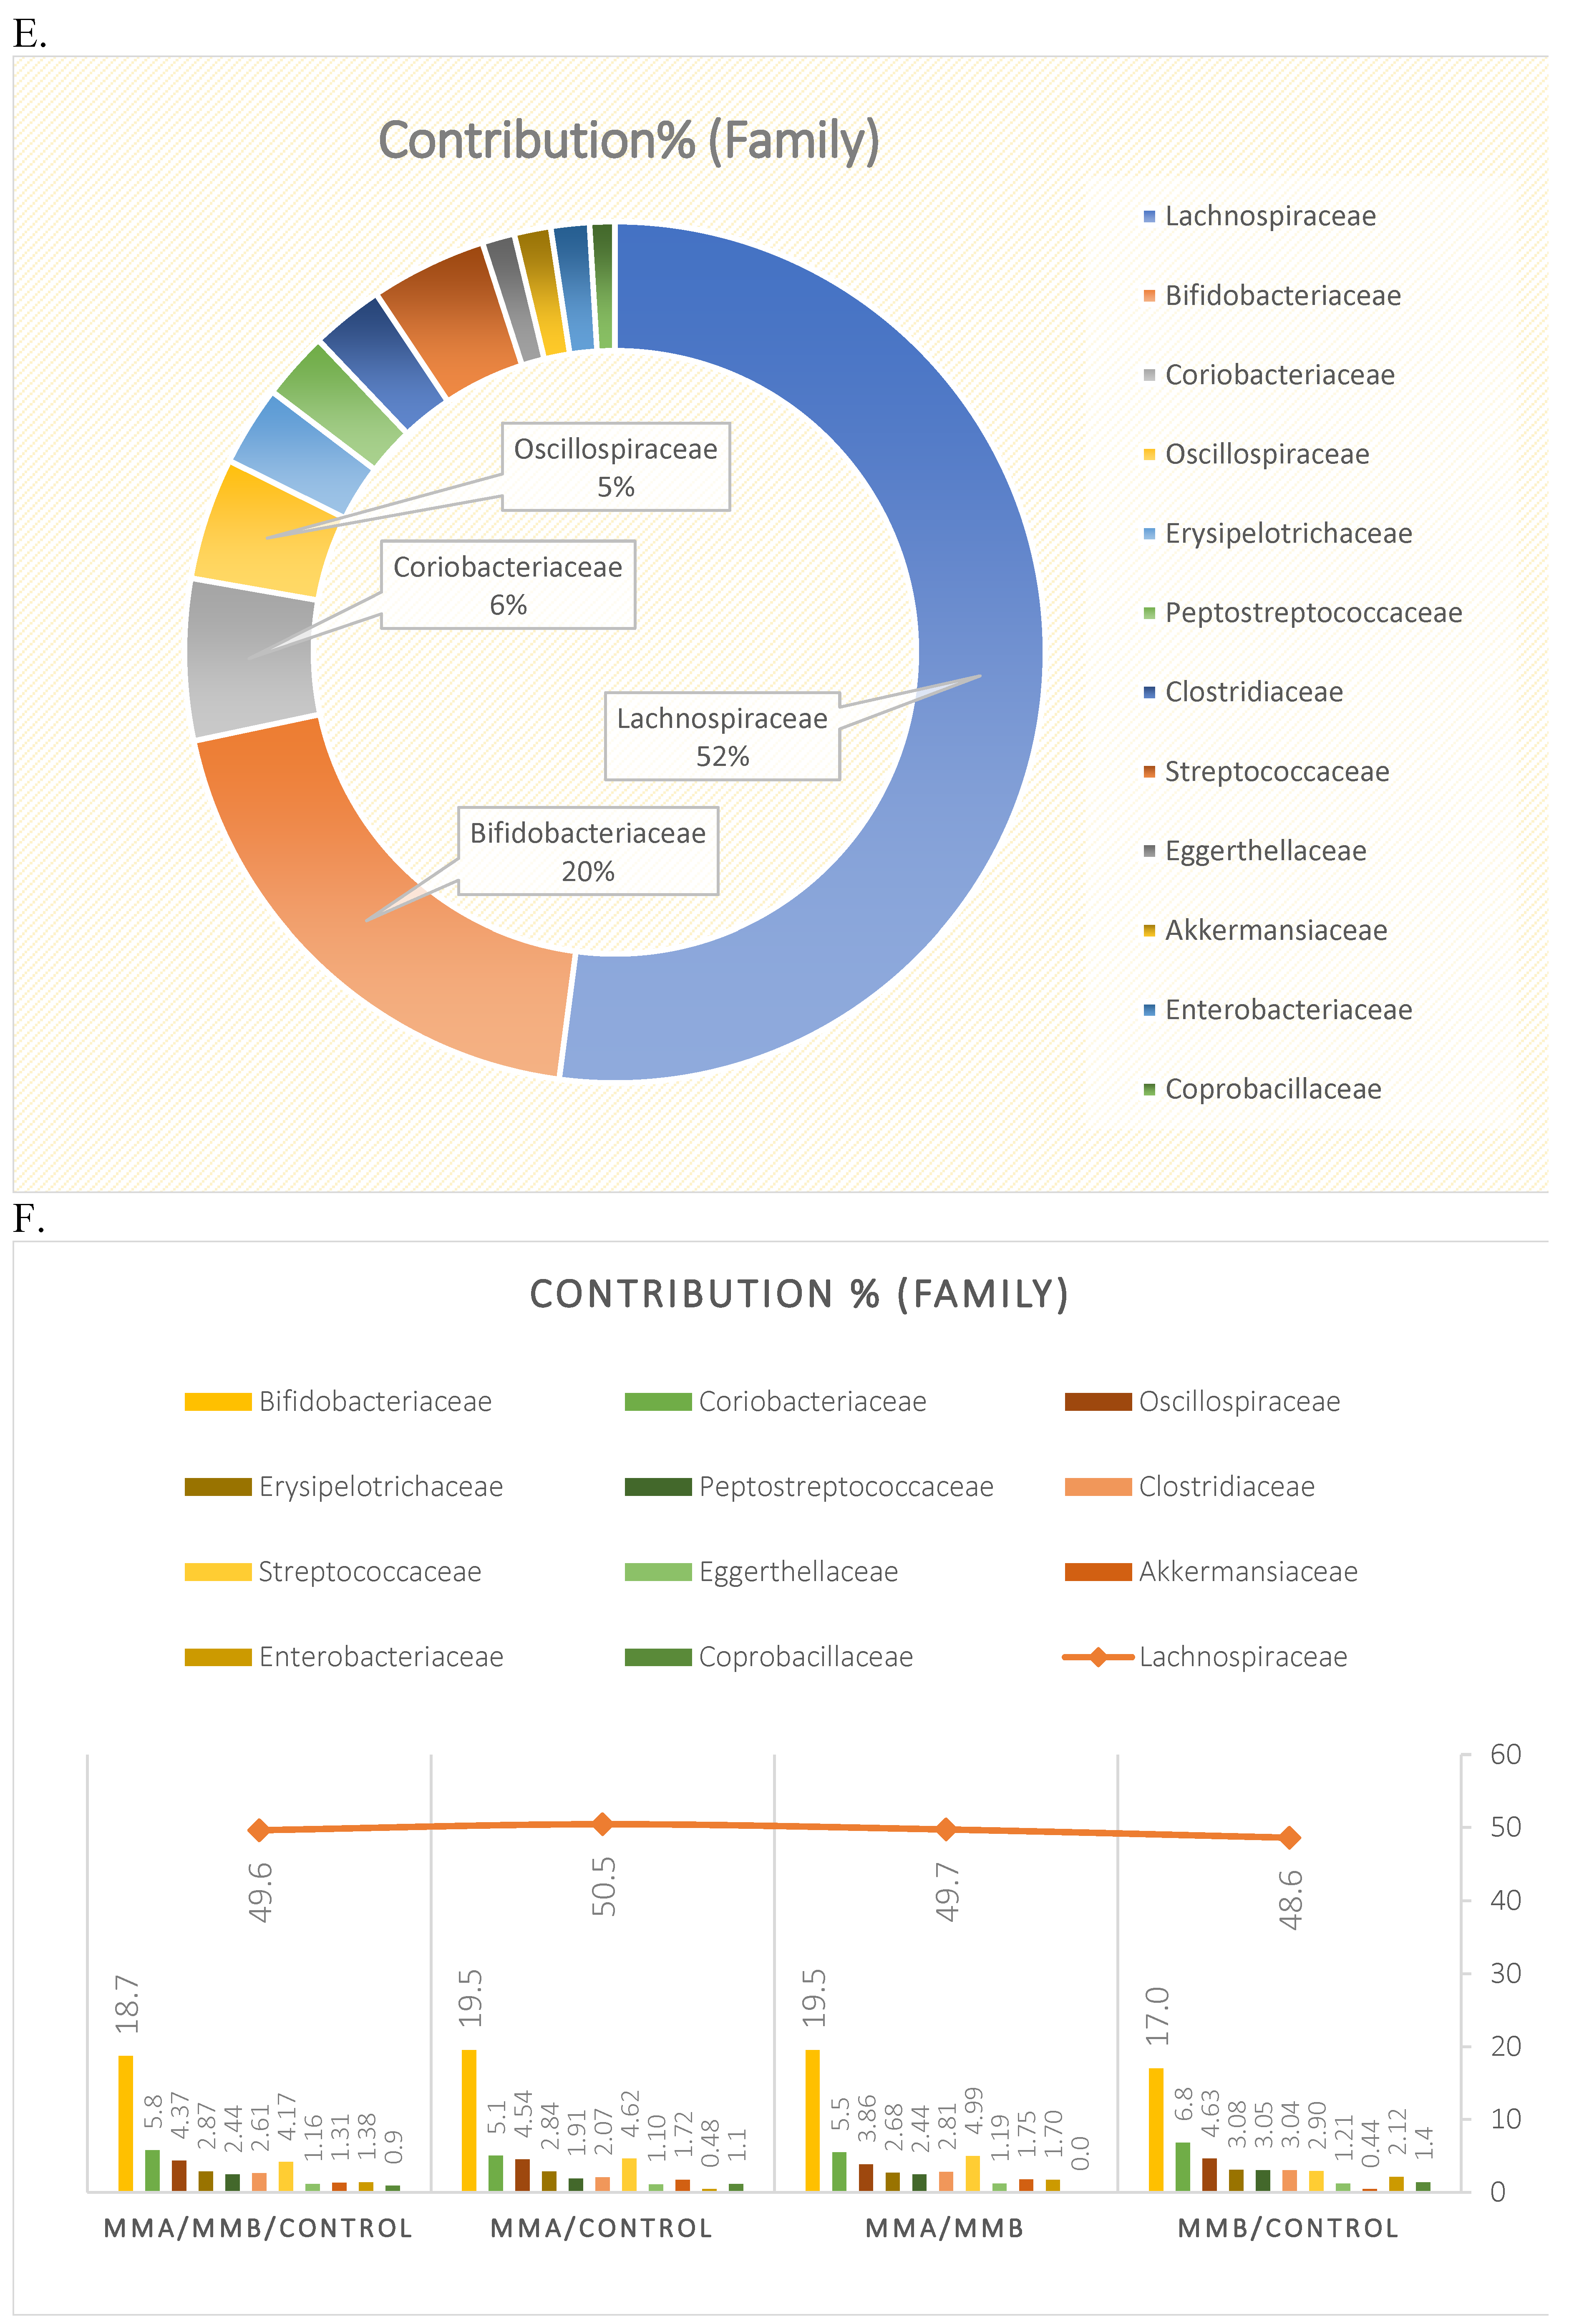
Figure 10.
Boxplot for the matrix of Wittaker’s statistical data, including different taxonomic levels of the studied microbiota in the MyelomaA, MyelomaB, and Control groups.
Figure 10.
Boxplot for the matrix of Wittaker’s statistical data, including different taxonomic levels of the studied microbiota in the MyelomaA, MyelomaB, and Control groups.
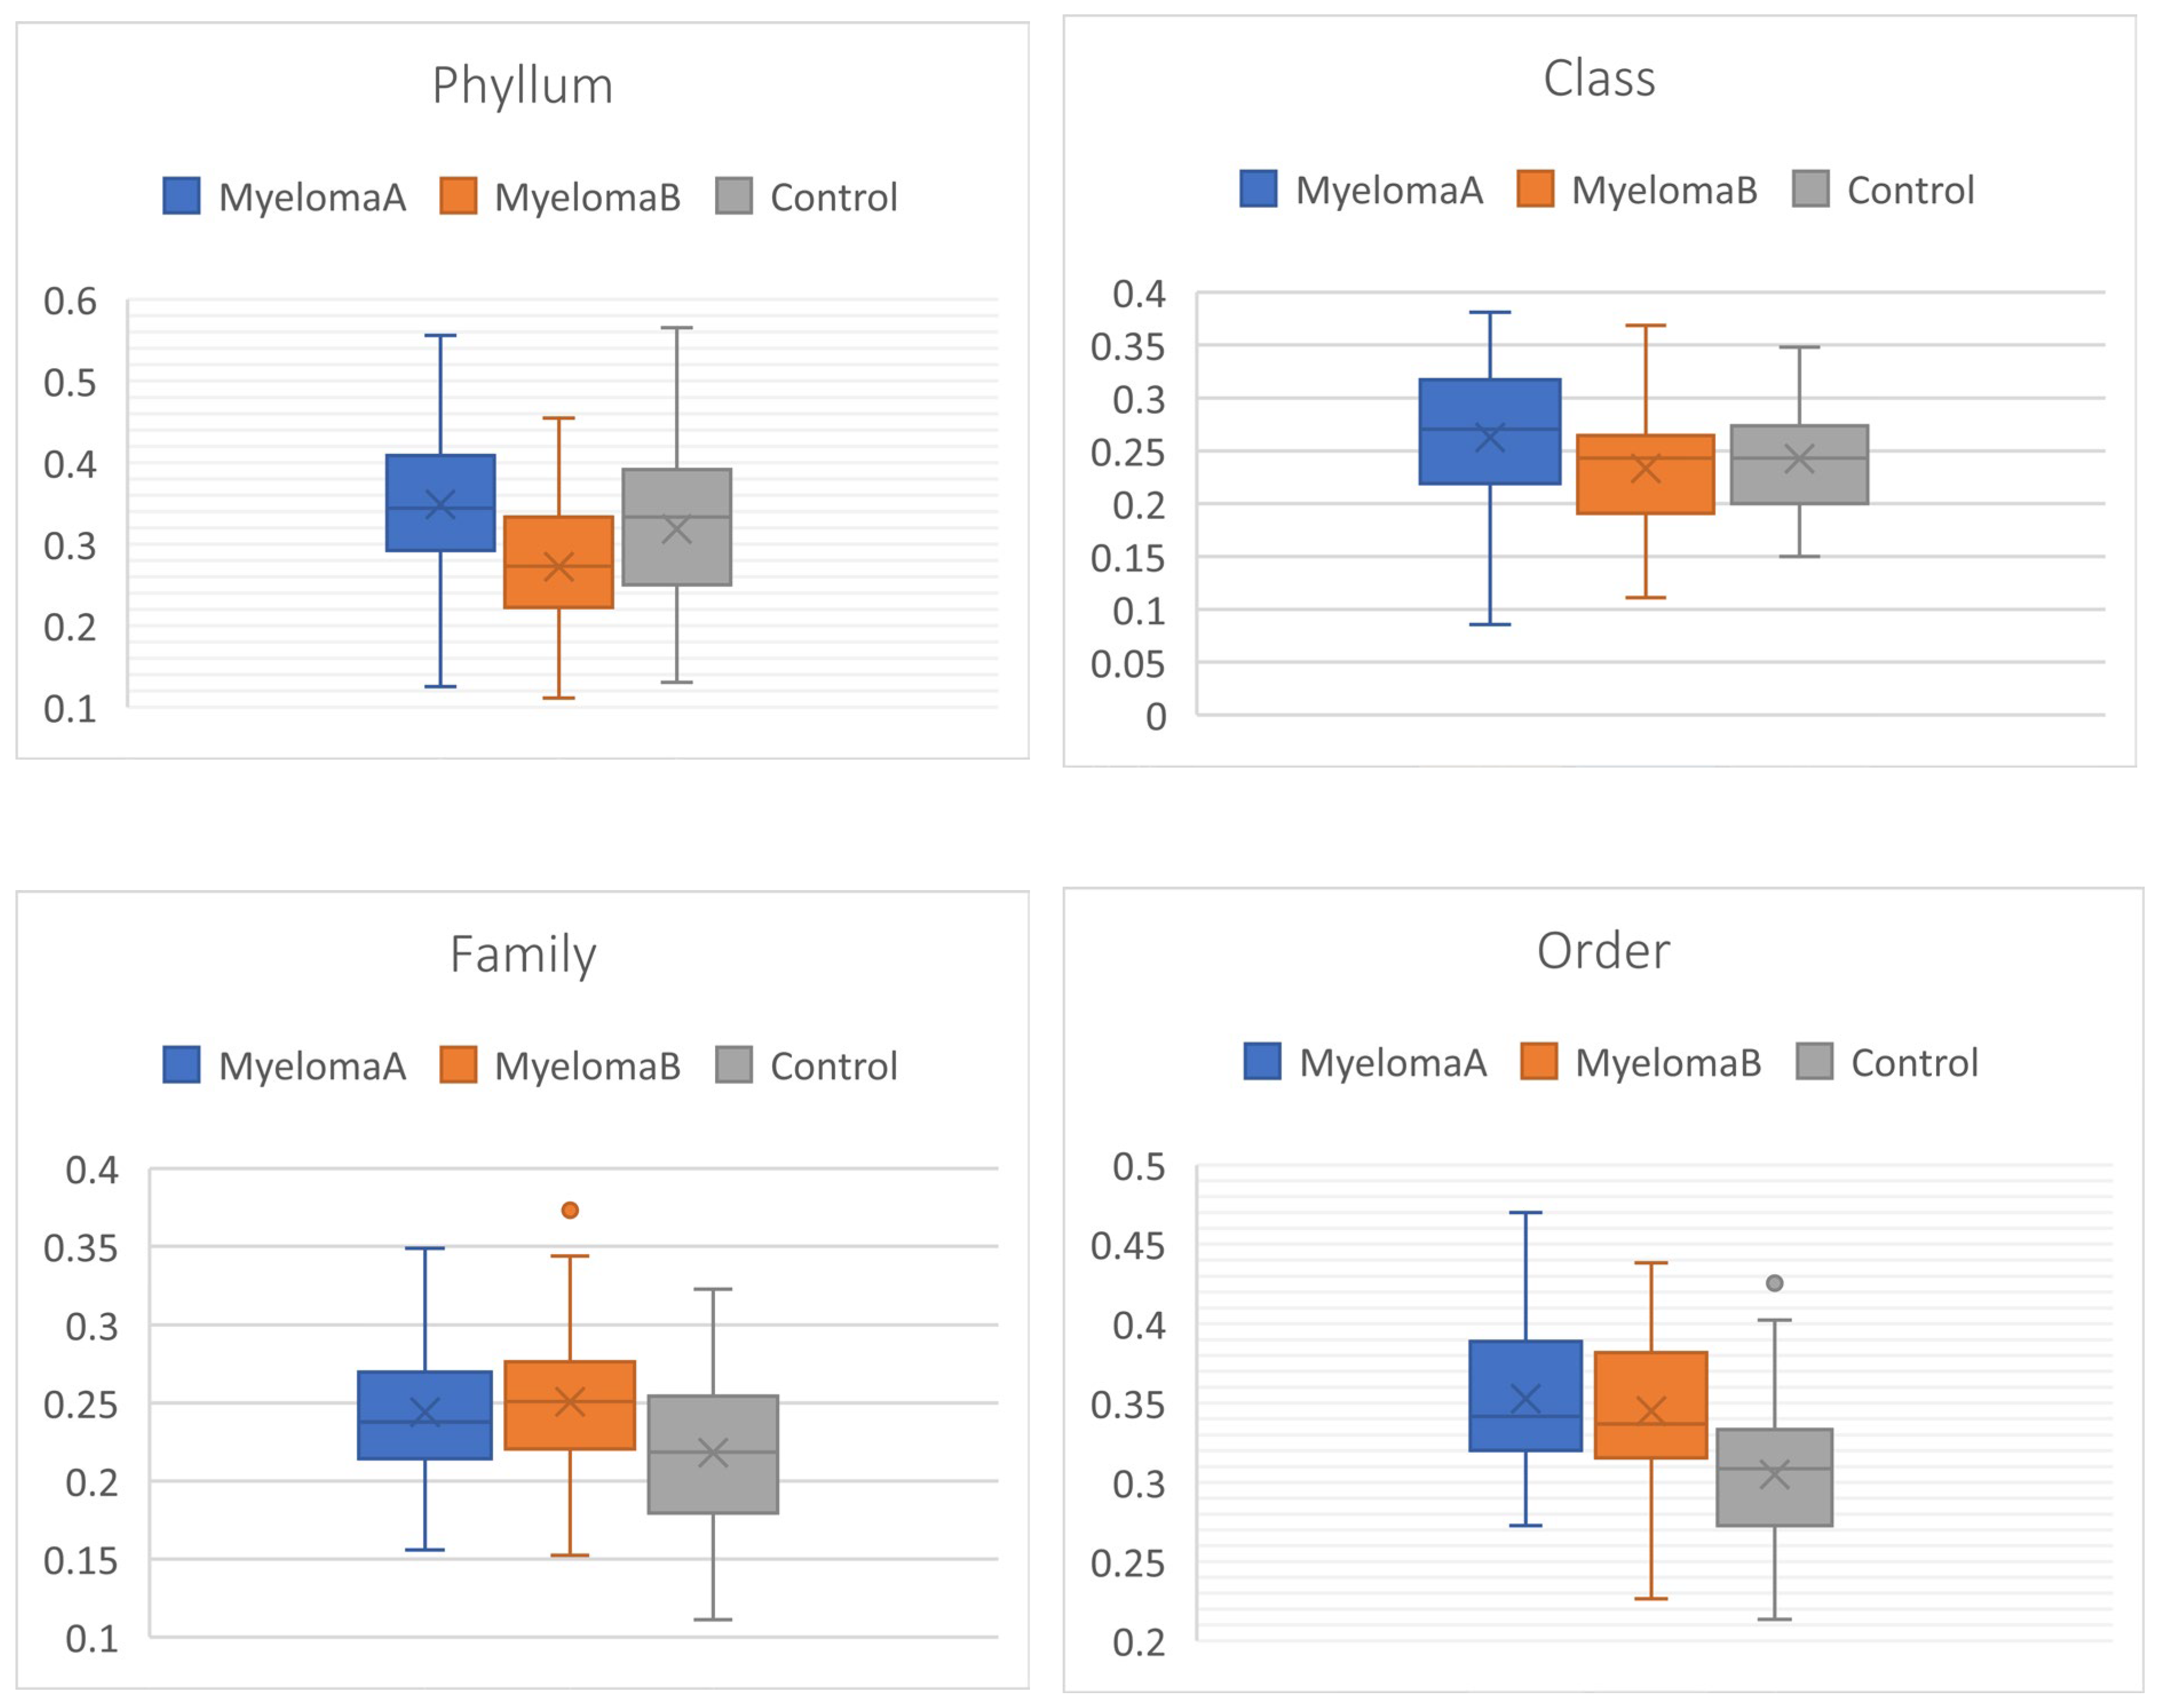
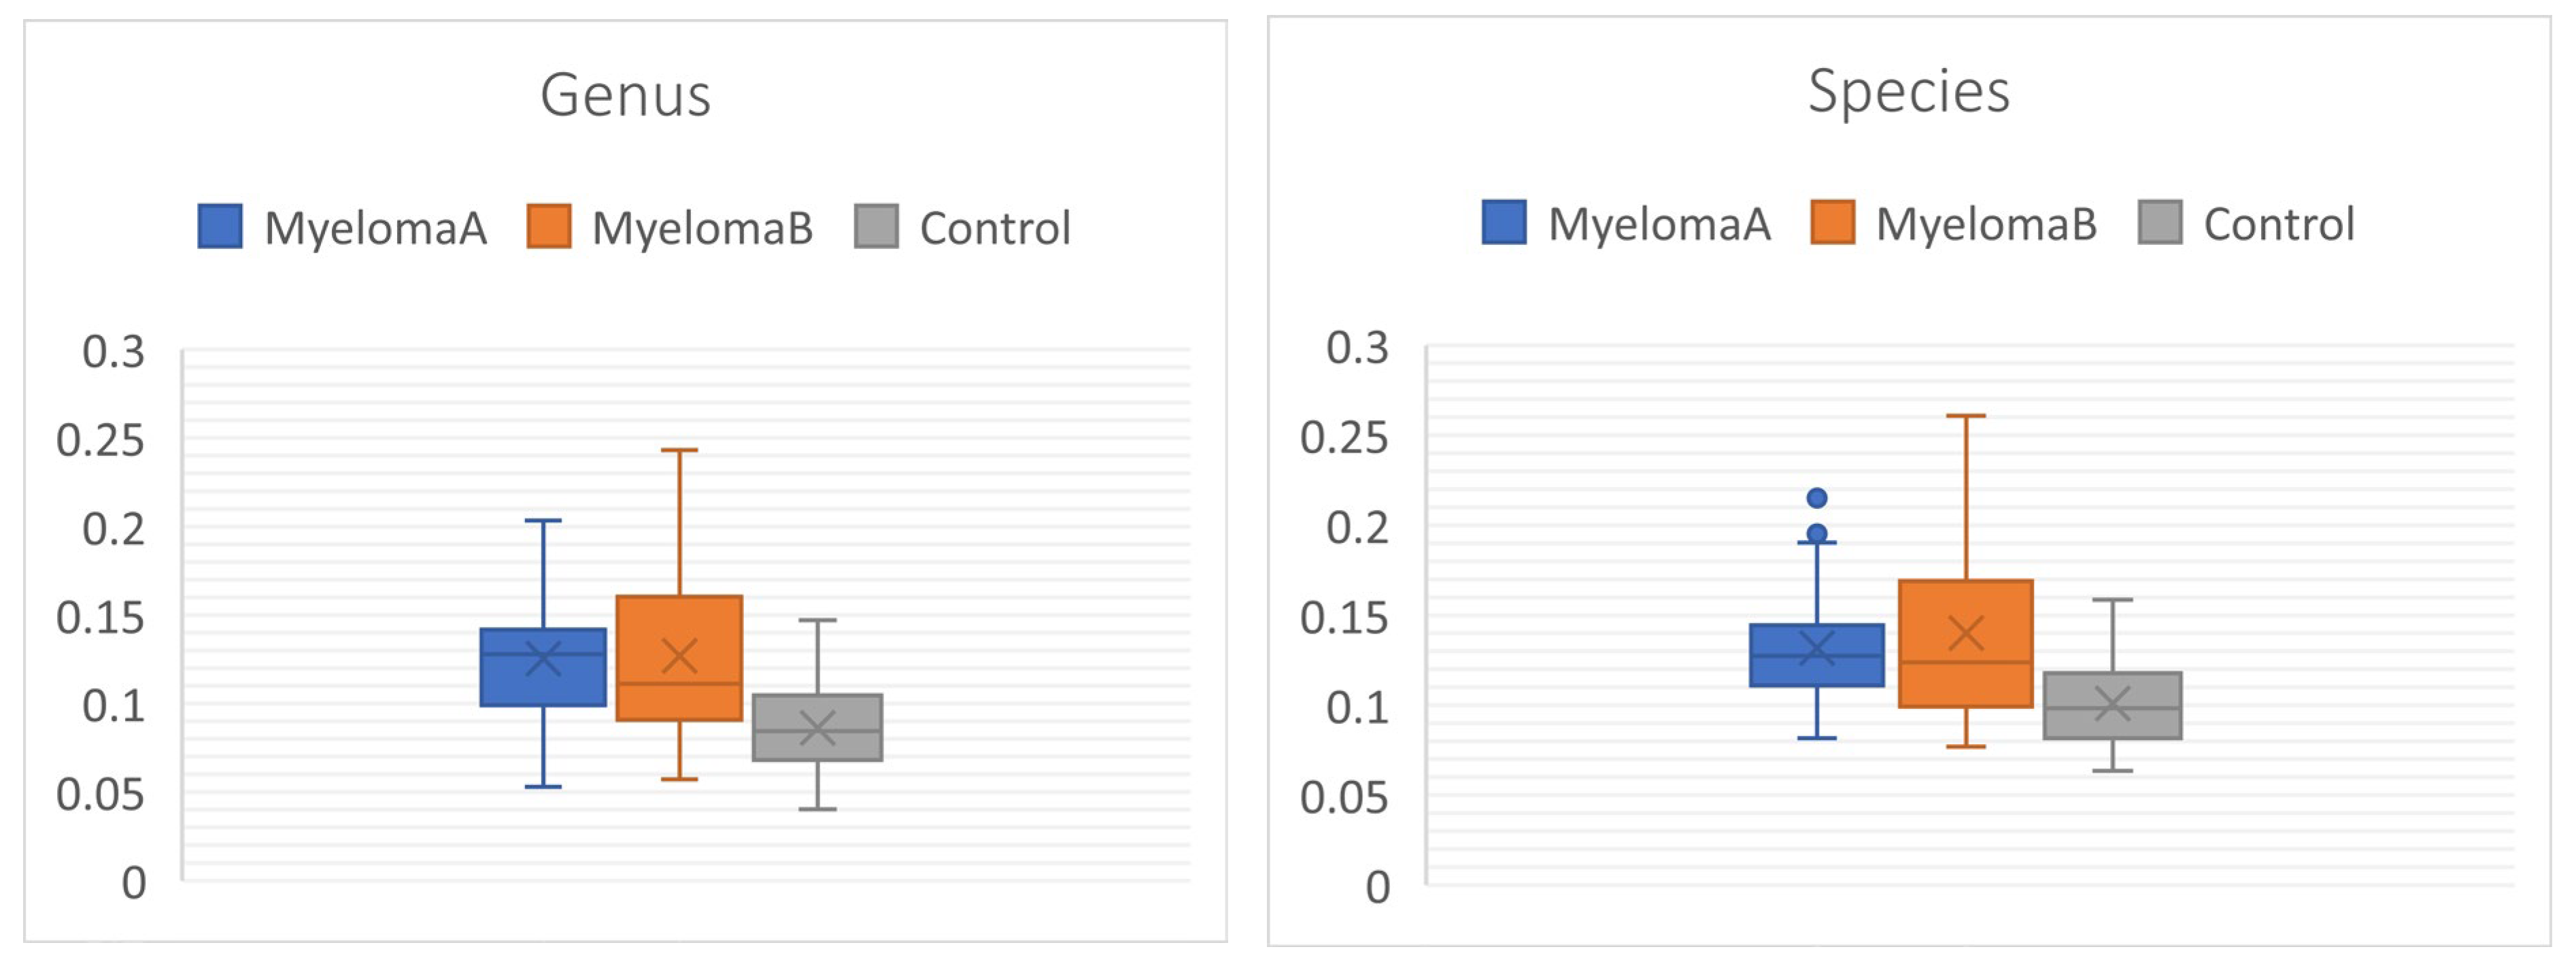

Table 1.
Basic characteristics of selected groups: Multiple Myeloma group (MM) and comparison group (CG).
Table 1.
Basic characteristics of selected groups: Multiple Myeloma group (MM) and comparison group (CG).
| Group | Mean | SD | Independent Samples T-Test | |||
| BH [cm] | CG | 165.56 | 9.02 | 0.497 | ||
| MM | 163.27 | 11.16 | ||||
| BM [kg] | CG | 81.36 | 9.09 | 0.598 | ||
| MM | 80.24 | 13.31 | ||||
| LBM [kg] | CG | 49.79 | 5.51 | 0.734 | ||
| MM | 51.72 | 10.36 | ||||
| SLM [kg] | CG | 45.25 | 5.02 | 0.651 | ||
| MM | 47.42 | 9.78 | ||||
| TBW [%] | CG | 44.32 | 1.29 | 0.270 | ||
| MM | 46.19 | 4.62 | ||||
| BMI | CG | 29.64 | 2.60 | 0.836 | ||
| MM | 30.07 | 3.54 | ||||
| Body fat [%] | CG | 38.89 | 2.03 | <0.001* | ||
| MM | 30.84 | 3.27 | ||||
| Age [years] | CG | 62.19 | 5.40 | 0.070 | ||
| MM | 65.00 | 5.13 | ||||
Table 2.
Assessment of the significance of differences between the studied groups (MMA – group of patients before starting the NW program, MMB – group of patients after completing the Nordic walking program, CG – control group).
Table 2.
Assessment of the significance of differences between the studied groups (MMA – group of patients before starting the NW program, MMB – group of patients after completing the Nordic walking program, CG – control group).
| ALPHA DIVERSITY | ||||
| Kruskal-Wallis test for equal (p) | Mann-Whitney pairwise (p) | |||
| Indeks | MMA-MMB | MMA-CG | MMB-CG | |
| Species | ||||
| Simpson_1-D | 0.004* | 0.300 | 0.002* | 0.519 |
| Shannon_H | 0.002* | 0.378 | 0.001* | 0.428 |
| Fisher_alpha | 0.031* | 1.000 | 0.050* | 0.127 |
| Genus | ||||
| Simpson_1-D | 0.012* | 0.472 | 0.006* | 0.948 |
| Shannon_H | 0.005* | 0.378 | 0.003* | 0.428 |
| Fisher_alpha | 0.012* | 0.472 | 0.006* | 0.948 |
| Order | ||||
| Simpson_1-D | 0.791 | 1.000 | 1.000 | 1.000 |
| Shannon_H | 0.908 | 1.000 | 1.000 | 1.000 |
| Fisher_alpha | 0.820 | 1.000 | 1.000 | 1.000 |
| Family | ||||
| Simpson_1-D | 0.564 | 1.000 | 0.806 | 1.000 |
| Shannon_H | 0.262 | 1.000 | 0.255 | 1.000 |
| Fisher_alpha | 0.343 | 1.000 | 0.472 | 1.000 |
| Class | ||||
| Simpson_1-D | 0.765 | 1.000 | 1.000 | 1.000 |
| Shannon_H | 0.851 | 1.000 | 1.000 | 1.000 |
| Fisher_alpha | 0.716 | 1.000 | 1.000 | 1.000 |
| Phyllum | ||||
| Simpson_1-D | 0.959 | 1.000 | 1.000 | 1.000 |
| Shannon_H | 0.859 | 1.000 | 1.000 | 1.000 |
| Fisher_alpha | 0.146 | 1.000 | 1.000 | 0.112 |
* - statistically significant value.
Table 3.
Bray-Curtis Dissimilarity between the studied groups (PerMANOVA test).
| Bray-Curtis distance | |||||
|---|---|---|---|---|---|
| PERMANOVA | F | p | MMA-MMB | MMA-CG | MMB-CG |
| Phyllum | 1.475 | 0.071* | 0.026* | 0.694 | 1.000 |
| Class | 1.778 | 0.026* | 0.020* | 0.111 | 1.000 |
| Family | 3.679 | 0.000* | 0.004* | 0.000* | 0.002* |
| Order | 2.787 | 0.000* | 0.009* | 0.001* | 0.134 |
| Genus | 5.453 | 0.000* | 0.000* | 0.000* | 0.001* |
| Species | 3.307 | 0.000* | 0.000* | 0.001* | 0.038* |
* - statistically significant value.
Table 4.
Differences between the studied groups based on the data matrix for the Wittaker index (Kruskal-Wallis test).
Table 4.
Differences between the studied groups based on the data matrix for the Wittaker index (Kruskal-Wallis test).
| Whittaker global beta diversity | |||||
|---|---|---|---|---|---|
| Level | Indeks | p | MMA-MMB | MMA-CG | MMB-CG |
| Phyllum | 2.055 | 3.11E-06* | 0.000* | 0.128 | 0.002* |
| Class | 1.956 | 1.50E-02* | 0.018* | 0.175 | 0.480 |
| Family | 0.505 | 3.90E-05* | 0.809 | 0.003* | 0.000* |
| Order | 1.663 | 4.31E-10* | 1.000 | 0.000* | 0.000* |
| Genus | 0.170 | 9.40E-13* | 1.000 | 0.000* | 0.000* |
| Species | 0.256 | 1.04E-10* | 1.000 | 0.000* | 0.000* |
* - statistically significant value.
Disclaimer/Publisher’s Note: The statements, opinions and data contained in all publications are solely those of the individual author(s) and contributor(s) and not of MDPI and/or the editor(s). MDPI and/or the editor(s) disclaim responsibility for any injury to people or property resulting from any ideas, methods, instructions or products referred to in the content. |
© 2024 by the authors. Licensee MDPI, Basel, Switzerland. This article is an open access article distributed under the terms and conditions of the Creative Commons Attribution (CC BY) license (http://creativecommons.org/licenses/by/4.0/).
Copyright: This open access article is published under a Creative Commons CC BY 4.0 license, which permit the free download, distribution, and reuse, provided that the author and preprint are cited in any reuse.


