Submitted:
19 November 2024
Posted:
19 November 2024
You are already at the latest version
Abstract
Promoting smallholding farmers to use improved storage technology is pivotal to enhancing the sustainable agri-food system. Studies suggest that hermetic storage technology reduces post-harvest storage losses, improves grain quality, and enhances food security. However, weak causal evidence is prevalent due to confounding and endogeneity issues in such studies. Hence, this study examines the impact of hermetic storage bags through a randomized encouragement design, the instrumental variable (IV) approach, among 692 smallholding farmers in Nepal, where maize is one of the major food crops. Farmers were encouraged by offers of 100% and 50% sub-sidies on the price of up to three Purdue Improved Crop Storage (PICS) bags. We found that an additional unit of the hermetic storage bag increases maize storage by 42.84 kg and reduces post-harvest storage losses by 10 kg (32.92 % reduction) for the farmers encouraged with a 100% subsidy. It increases maize storage by 39.2 kg of the farmers encouraged with a 50% subsidy, with no significant effect on post-harvest storage losses in this group compared to the control group. Thus, it is essential to encourage farmers to adopt improved storage technologies to increase storage and reduce post-harvest losses. It can contribute to enhancing local food security.
Keywords:
storage quantity
; post-harvest storage losses
; randomized encouragement design
; hermetic storage technology
; hermetic storage bags
; LATE
1. Introduction
Addressing food loss (FL) is vital for building up sustainable agriculture and agri-food systems. As outlined in Sustainable Development Goal 12, global leaders committed to halving per capita food waste at the retail and consumer levels and reducing food losses throughout production and supply chain, including post-harvest losses, by 2030. The Food Loss Index includes post-harvest storage losses (PHLs) as part of the value chain, with approximately 14% of the world's food lost between harvest and the retail stage [1,2]. A projection highlights that by 2050, feeding a population of 9.1 billion will require over 70% increase in food production [3,4,5]. That’s why, mitigating post-harvest losses becomes imperative.
The evidence suggests that improved storage (hermetic storage technology) such as metal silos and hermetic storage bags (e.g., Grain Pro bags and Purdue Improved Crop Storage (PICS) bags) reduces post-harvest losses and alleviates food insecurity [6,7]. Also, it boosts household food availability and supply [8], further strengthening food security. [9] emphasized that introducing hermetic storage bags is simple and cost-effective for smallholding farmers. PICS is a hermetically sealed bag comprising three layers; one outer is polypropylene, and two inner layers are high-density polyethylene (HDPE). It is a cost-effective and chemical-free storage technology for grain storage. Inside the storage, a depletion of Oxygen and accumulation of Carbon Dioxide or Nitrogen takes place, which creates suffocation for living organisms [8,10,11].
PHLs encompass both quantitative and qualitative losses, diminishing economic value, and deteriorating taste and nutritional content [12,13]. Under unfavourable conditions, PHLs can reach up to 80% of the product [14]. Smallholding farmers have faced post-harvest losses in the field, during processing and storage [12]. Storage losses account for the maximum fraction of all post-harvest losses for cereals in developing countries and detrimentally affect farmer’s livelihoods [5].
Maize is a staple food crop for over 4.5 billion individuals in 94 developing nations, alongside wheat and rice, insisting at least 30 percent calorie requirement in dietary [14]. It became a major worldwide commodity and has a significant and incremental role in global agri-food systems, supplying human food consumption and animal feeding sources [15]. Estimated storage losses of maize is 20-30 percent due to insect pests, mostly the maize weevil (Sitophilus zeamais), larger grain borer (Prostephanus Trunca-tus), angoumois grain moth (Sitotroga cereallela), and the lesser grain weevil (Sitophilus oryzae) impacting negatively on food security and income generation [14].
The global challenges due to storage losses in maize, particularly caused by insect pests, underscore the importance of assessing the impact of storage technology on smallholding farmers in regions like Nepal. In Nepal, the maize weevil and the Angoumois grain moth are the main concerns of farmers during the post-harvest storage of maize [16]. Lack of proper post-harvest storage systems causes maize storage losses in the mid-hills region where maize plays an important role in local livelihood providing food and animal feed. This region dominated by smallholding farmers still heavily relies on traditional storage methods with a high infestation of insect pests on storage. Hence, encouraging smallholding farmers to adopt hermetic storage technology, could be an effective solution to reduce storage losses, and enhance local food security.
Maize is the second largest staple cereal crop in Nepal after rice. The maize-growing summer season is from February/ April to July/ August, but sometimes, due to local geographical and climatic conditions, it concludes at the end of September. The cultivation area comprises 985,565 hectares with an annual production quantity of 3,106,397 metric tons and a 3.15 Mt/ha yield in 2021/22 [17]. Maize covers 28.83%of production and 28.27 % of the cultivation area of cereal crops. It contributed 7.6 % of the Agriculture Gross Domestic Product (AGDP) in 2022/23 [18]. The agriculture sector contributes 24.7% of the National Gross Domestic Product (GDP) in 2023/24 [19]. Previous studies show that there is a varying pattern of consumption of maize in Nepal. [20] found that 60 % of production is for food consumption, 25% for animal feed, 3% for seed, and the rest, 12% for selling in the hilly districts.
The majority of the farmers store their maize using traditional storage systems, which vary by region and locality. [16] emphasize that the traditional storage method is responsible for post-harvest storage losses. Maize is traditionally stored outdoors (e.g., on a Thangro/Suli- a timber or bamboo rack) and in indoor structures (e.g., in sacks, Kuniyu- an open semi-structure for storing maize in sheaths, and Kotha/Bhakari- a cylindrical storage made from bamboo splits) [21]. Piling up on the tree in front of the house and hanging on the veranda in the group are also traditional outdoor storage practices. The outdoor storage is open to moisture and rain and is vulnerable to insect pest infestation.
Traditional methods are less attentive to physical protection from storage pests, intensifying post-harvest losses (Bhandari et al., 2015; Upadhyay et al., 2002). The maize weevil and Angoumois moth pose significant challenges to farmers during storage in Nepal [16]. The findings of numerous past surveys in Nepal varied due to agro-climatic conditions and survey methods (Upadhyaya et al., 2002). In hilly districts of Nepal as a whole, storage losses range from 10 to 20 % of the total production of maize [16,22]. Additionally, [23] reported a substantial post-harvest loss of maize, reaching up to 19.5% ±12.5%, attributed to pests and disease cobs in the mid-western and far-western mid-hills of Nepal. Despite the recent emphasis on government policies, programs, and plans across all three federal, provincial, and local governments with a specific focus on agricultural value chain development, challenges in post-harvest management persist.
Recent, government policies, programs, and plans aim to modernize the agriculture sector with greater insistence on this sector. The Prime Minister Agriculture Modernization Project (PMAMP); a ten-year program, aims to encourage farmers to adopt improved and new technologies [24]. This project implemented development programs for Small Commercial Agricultural Production Centers (Pocket), Commercial Agricultural Production Centers (Block), Commercial Agricultural Production and Processing Centers (ZONE), and Comprehensive Commercial Agricultural Production and Industrial Centers (Super Zone) for major agricultural products including maize. In 2022/23, PMAPM implemented supporting programs (e.g. subsidies of up to 85% in agriculture equipment, marketing support for agri-products, storage infrastructure, and establishing processing industries)[25].
Similarly, the Agriculture Development Strategy (ADS), 2015-2035 of Nepal focuses on value chain development at all levels and enhancing food security nationwide [26], it is a 20-year agriculture strategic plan, that includes a 10-year action plan and roadmap based on assessment of the present and past performance of the agriculture sector. Value chain development is one of the flagship programs of this among four. Lack of information, the nascent market of hermetic storage technology (HST), and economic factors are the main reasons for not adopting new technologies. However, hermetic storage bags (PICS bags and Super grain bags) were commercially introduced as viable alternatives [27,28]. Hence, to change storage behavior and reduce post-harvest storage losses, it is necessary to encourage smallholding farmers to adopt alternative storage techniques that are sustainable, straightforward, and cost-effective to use.
There is a growing literature dwelling on various aspects of post-harvest storage technology. Recent empirical studies are mostly associated with the determinant of the adoption of hermetic storage technology. For example, [29] found that age, awareness, extension contact, information sources, radio sources, cowpea income, and bag availability are associated with hermetic storage bag adoption among cowpea farmers in northern Nigeria. [30] concluded that household size and training on post-harvest handling and storage have a positive influence on the selection of hermetic storage technologies, such as silos and hermetic bags. In contrast, the gender of household heads and the distance to the input provider have a negative relationship in Rwanda. [31] emphasized that the decision to adopt PICS bags was positively associated with cooperative membership, the education level of household heads, livestock size, crop income, extension services, and the storage capacity of PICS bags. However, it was negatively associated with farmland size, maize production quantity, non-food expenditure of households, the demand for agricultural inputs, and the cost of PICS bags in Northern Ethiopia. [32] suggested that learning from social networks (e.g., friends and relatives) and extension agents makes farmers more likely to adopt PICS bags faster. Cooperative membership is effective in post-harvest technology adoption in China [33].
[31,34]focus on the profitability of using PICS bags. [35] add that prior awareness of hermetic storage technology leads higher willingness to pay for and adopt it. Laboratory experiments emphasized the effectiveness of PICS bags in controlling insects, limiting damage, and preserving the quality of maize and shea nuts [36,37]. [38] emphasized that hermetic storage technology is a satisfactory way to minimize the loss from insect damage grains. [39] demonstrated that a PICS bag with triple layers is efficient in maintaining the quality of maize about aflatoxin and mold contamination. [40] demonstrated benefits of adopting improved storage technology outweigh the traditional physical storage system in India.
There have been several impact evaluations of storage technology. However, there is no rigorous causal evidence on storage and post-harvest storage losses. For example, [41] conducted a randomized controlled trial (RCT) in Kenya to assess the effect of a group storage intervention aimed to addressing storage constraints, specifically the collective storage of maize in hermetic bags. They found that farmers in the treatment group were 23% points more likely to store maize compared to the control group. However, they did not find a statistically significant effect on the quantity of maize stored. Similarly, [42] conducted RCT and found a significant effect of hermetic plastic bag intervention combined with training on storage losses. Since the decision to adopt new technology is not random [43,44], it might create some biased effects and also be associated with awareness of the technology [35]. In addition, most of the previous studies estimated the intention-to-treat (ITT) effects, the effect of being assigned random treatment [7,8,10,45,46]. Such studies were mostly focused in Africa and few in Asia. Further, there is no existence of causal evidence of storage technology on storage and post-harvest storage losses in Nepal.
Thus, this study aims to assess the impact of PICS bags on storage quantity and self-reported post-harvest storage losses. To address the existing knowledge gap in the literature, we use a randomized encouragement design (RED) function as an instrumental variable (IV) approach, to measure the impact of PICS bag adoption on the outcomes of interest. The IV approach can address the issue of endogeneity [47] and reconcile the ITT effect which is the causal impact of random assignment for receiving treatment regardless of non-compliance. However, IV considers non-compliance [47,48,49,50].For this study, we randomly offered a 100% and a 50% subsidy on the price of up to three PICS bags to the smallholding farmers.
2. Materials and Methods
2.1. Study Site
We conducted this study at Mathagadhi rural municipality, which is located 25 km away from the headquarters of Palpa district, Lumbini province, Nepal. This area lies in the mid-hills of the mid-western part of Nepal (see Figure 1: Study Site Map). Mathagadhi Rural Municipality is a local government and has 8 wards. Wards are the smallest administrative level in Nepal. Geographically it is the largest local government in size in the Palpa district out of 10, with an area of 215.49 square km. The settlements in the wards are scattered on the slopes of the folds of hills generally above 1500 metres from sea level where the main mode of travel is on foot. For many, travelling to the Municipality office for public services, including agricultural services and the market in the vicinity could be a day’s work.
We selected this study area due to three reasons. First, according to the [51], about 84 percent of its active populations are engaging in the agriculture sector. Second, maize is the second-largest crop in production, which plays a vital role in the local food security and livelihood as a whole, being the source of food and animal feed, and used as an ingredient in religious functions and other cultural activities. The dried stalks and kernels are used as fuel. The farmers are practising traditional storage, as mentioned in the previous section. They are facing insect pest problems with huge post-harvest losses. Third, according to the government official of Mathagadhi rural municipality, it has a program to subsidize hermetic storage bags in the near future. Thus, our findings may guide them to take the decision.
2.2. Data and Sampling Strategy
We used primary, cross-sectional data collected through a pre-structured questionnaire. We conducted a baseline survey from 25th August to 7th September 2023, the time farmers start storing the maize after the harvest. jointly with local researchers using both paper-pencil-based and a computer-assisted field entry (CAFÉ) approach. During the baseline survey, we collected socio-demographic data such as age, education years, gender, family income, maize production quantity, maize cultivated area, storage period, and quantity of storage losses all of which might have an association with hermetic storage technology takeup (see Appendix Table A.1).
In this study, we employed a two-step sampling method. First, we purposively selected Mathagadhi rural municipality from Palpa district, one of the largest maize-produced mid-hill districts of Lumbini Province, Nepal. Second, smallholding farmers were randomly selected for the experiment, and interviews were conducted using a structured questionnaire. The list of the maize farmers who cultivated maize in 2023 was obtained from the ward offices of the local government.
After collecting the list of farmers, we conducted a power calculation to determine the appropriate sample size for this experiment by following [52]. For this, we selected a standard deviation of 0.56 for storage loss, a power of 80%, a significance level of 5%, and a minimum detectable effect (MDE) of 0.2. For sample sizes of different groups, we followed [53]which suggested that if the experiment design has more than one treatment arm, it would be good to have a larger comparison group than the treatment arms. The proportion for encouragement-100 is p=0.274, and the proportion for encouragement-50 was p=0.366. Thus, the Encouragement-100 group requires a minimum sample size of 85, and the Encouragement-50 group requires a minimum sample size of 97.
Although PICS bags were introduced in the study area, farmers were not so familiar with them, which could lead to higher rates of non-compliance in adopting PICS bags during the experiment. Thus, it was decided to increase the sample size to more than the minimum required to increase the sample in each treatment group, also considering other constraints of budget, time and availability of research assistants. Considering all these, 700 out of 2090 smallholding farmers in the list were selected randomly, 50% for the control group, 30% for the Encouragement-50 group and 20% for the Encouragement-100 group. Random selection was carried out generating random through STATA software. Four farmers were not found during the baseline survey; hence, they were excluded, and 696 samples remained valid in the baseline survey.
We performed the end-line survey from 11th to 31st January 2024, the time when farmers start preparing for the next plantation of the crop and start to use the stored crop for various purposes, to collect outcomes data. In the end-line survey, four farmers attrited due to death and other family members were not available due to the absence when our enumerator visited farmers. Finally, the sample size for data analysis was 692 smallholding farmers, comprising 347 (50.14%) in the control group, 149 farmers in the encouragement-100 (encouraged with 100% subsidy up to 3 bags) group (21.53%), and 196 farmers in the encouragement-50 (encouraged with 50% subsidy up to 3 bags) group (28.32%).
2.3. Summary statistics
Table 1 illustrates the descriptive statistics for our sample (Post-attrition) including demographics, economic, agricultural, and post-harvest management information. From panel A average age of household heads is 47.65 years with 6.08 years of education. Over three-fifths (62.4%) of household heads are male. The average size of the family (household) is 5.85. Moreover, the average age of household heads in the control, encouragement-100 group and encouragement-50 groups are 47.35, 48.74, and 47.37 years, respectively.
Panel B depicts that the average annual income of farmer households is 279.66 thousand (Nepalese Rupee-NPR, 1$ US = 133.78 NPR as of December 2023) with an average cereal income of 18.42 thousand NPR at the farmgate price, the average income from cash crops, forest, livestock, and off-farm are 8.85, 0.77, 26.77 and 217.69 thousand NPR, respectively. The farmgate income of cereals crops is too low in comparison to off-farm income.
Panel C presents that the average agri-experience of household heads is 17.23 years. Their average agri-land size is 9.14 ropani (1 ha = 19.66 ropani). The average area of maize planting is 5.63 ropani and the average production of maize is 520 kg. Also, the average maize production of households in the control, encouragement-100 group, and encouragement-50 groups are 518 kg, 538.2 kg, and 509.6 kg, respectively. Some 133 kg of maize on average, is used for food consumption, 389 kg for animal feeding, and 27 kg for other purposes (brewing and making dry food in the winter season). Hence, the length of storage depends on the quantity produced, ranging from 2 months to 17 months. Besides, only 3.8% of the respondents used to sell maize grain.
Finally, panel D provides the facts on post-harvest management. The average maize storage duration is 8.67 months. In the baseline survey, 89% and 69% of households reported that they have faced insect (maize weevil) and moth problems in post-harvest storage of maize, respectively. 44.32 kg of maize was lost in storage. Similarly, post-harvest storage losses among the control, encouragement-100 group, and encouragement-50 groups are 46.06 kg, 44.83 kg, and 40.84 kg. Only a small proportion (2% in the baseline survey) of farmers are adopting new technology (earlier HST not regarded as effective as PICS bag by the farmers). In contrast, a significant proportion of households are still relying on traditional storage techniques. Thus, policy intervention is needed for the enhancement of post-harvest management to decrease post-harvest storage losses.
2.4. Balance check
We conducted a balance test using the paired t-test to check the similarity between the groups with baseline characteristics. Table 2 shows the results from the balance test. We found that the pretreatment difference between the control group vs encouragement-100 group and the control group vs encouragement-50 group were balanced on average. Also, variables were balanced between the encouragement-50 vs the encouragement-100 group.
2.5. Experimental Design
We conducted the randomized encouragement design, which functions as an instrumental variable (IV). We designed our experiment to assess the effect of PICS bag adoption with different levels of encouragement. It allows the estimate of the effect in each pair of encouragement levels as suggested by [54]. To promote the use of hermetic storage bags, we randomly assigned 100 and 50 percent subsidy offers on the price of up to three PICS bags following the government practice of offering subsidies while promoting the usage of new machineries and technology. A total of 149 smallholding farmers received a 100% subsidy offer, 196 smallholding farmers received a 50% subsidy offer, and 347 farmers in the control group did not receive any subsidy offer. Due to the randomization at the household level, there might be a chance of spillover of subsidy offer information among the groups. To minimize the possible spillover, our enumerator visited each household of the encouragement groups with 100% and 50% between 12-20 September 2023 without prior information and offered a price subsidy. First, we distributed the bags to the encouragement-50 group and later to the encouragement-100 group to avoid the disappointment effect and leakage of information. Figure 2 presents the detailed experimental design of our study. Based on the random assignment of subsidy offers our study has the following three groups.
Control group: This group did not receive any offer of subsidy. They were provided 10-20 minutes of information on the harvesting of maize, hermetic storage bags for seed and grain storage, and the steps for proper use of PICS bags during the baseline survey (see supplementary material description S1).
Encouragement-100 Group: This group received a 100% subsidy offer on the price of up to three bags and the same information as the control group and Encouragement-50 Group.
Encouragement-50 Group: This group received a 50% subsidy offer on the price of up to three PICS bags and the same information as the control group and Encouragement-100 Group.
2.5.1. Treatment variable:
In this study, our treatment variable is the number of PICS bags used by smallholding farmers, each PICS bag can store 50 kg of shelled maize. The cost price of per bag is about 2.5 $US, equivalent to about 6kg of maize in the local market. Every smallholding maize farmer in the study site is free to use PICS bags. Hence treatment has an endogenous nature. Farmers can buy such kinds of PICS bags from local agro-vets (retailers of agricultural inputs) but they need a prior order, which when available often takes several days for delivery. The intervention period, which was from the first week of October 2023 to the first week of January 2024, was three months to estimate the treatment effect. We chose this period for intervention because, in the study area, farmers start to store newly harvested maize in September and start to prepare for plantation of the crop for the following year at the end of January. Starting from February, they start consuming the stored maize grains. Those having more grains stored for longer periods consume as needed thereafter.
2.5.2. Instrumental variables
In Nepal, federal, provincial, and local governments mostly subsidize farmers' adoption of modern agriculture machinery or technology with full or 50% subsidies. So, it would be crucial to investigate which level of subsidy is a better option from policymakers' perspectives to optimize the government budget and reach more farmers. Thus, we used two encouragements 100% and 50% subsidy offers.
Our two random encouragements, 100% and 50% subsidy offer on the price of PICS bags are instrumental variables in adopting PICS bags. To measure the impact of the adoption of PICS bags, the instrumental variable could address the endogeneity issue if the assumptions of IV are satisfied [47]. To evaluate the impact of the number of PICS bags by encouragement on outcomes, which is a causal effect of variable treatment. Both IV's 100% and 50% subsidy offers satisfied all conditions of average causal response theory independence, exclusion, first-stage, and monotonicity, as defined by [49]. We provided details about the validation of our instruments in the result section.
2.5.3. Outcomes:
In this study, we examined the impact of the number of PICS bag treatments on two outcome variables that responded to the end-line survey. The first outcome measures the quantity of maize stored using PICS bags in kg. The second outcome measures the total quantity of maize lost in storage, self-reported by farmers in kg. To measure storage losses, we first compared losses in storage with a PICS bag to losses in traditional storage and calculated the loss difference for each farmer within the group. Then, the difference in storage losses compared among the groups. To ensure the losses enumerators checked the stored grains and confirmed the proportion of insect pest infestation.
2.5.4. Compliance proportion:
In our encouragement design, the compliance rate to the adoption of the PICS bag of farmers in the encouragement-100 group is 0.66 while the compliance rate of farmers in the encouragement-50 group is 0.52 (Appendix Table A.2). The same table shows that 92% of smallholding farmers receive bags when they get free, and 80% buy at least one PICS bag with 50% subsidies. Despite giving them brief information on hermetic storage bags for seed and grain storage, how they work and the steps for their proper use during the baseline survey the compliance rate was lower than expected
2.6. Estimation strategy
Our main objective is to measure the causal effect of the number of PICS bags adoption on outcomes (i.e., storage quantity of maize and post-harvest storage losses). For this, we used the two-stage least square (2SLS) method to estimate the local average treatment effects (LATEs) for encouragement groups relative to the control group. Also, we estimate LATE for the Encouragment-100 group relative to the Encouragment-50 group. [49,55,56] suggested that 2SLS can draw a weighted average per unit causal effect of continuous treatment. Our treatment is continuous, to estimate the weighted average per unit causal effect we generated weight for treatment by following [49,55,56]. To estimate the effects of treatment on the different outcomes of interest through two encouragement levels as IVs, we set up the following first-stage and second-stage equations.
First stage equation:
Ni = α1 + φ1Ei + γ1Xi + ε1i
Where Ni is the number of PICS bags, N= {0,1,2,…. } the number of bags adopted by farmers, Ei is IV dummy 1 if farmers assigned subsidy offer (a 100% / a 50% subsidies offer only one subsidy as an instrument at one time), Xi is a set of control variables (age, education (year), family size, and gender), and ε1i is the error term.
And, second-stage estimates using the following equation after getting the first-stage fitted value, i.
Second-stage equation:
Where Yi is the outcomes (two outcomes storage quantity and Post-harvest storage losses), i is the fitted value of treatment, Xi is a set of the control variables (same as a first-stage equation), λ is the local average treatment effect (LATE), and ε2i is the error term.
3. Results
3.1. First stage the impact of subsidy offers on the PICS bag adoption
Encouraging smallholding farmers to use hermetic storage technology that reduces post-harvest storage losses, increases storage period, and improves the grain quality on farm harvest grain seems noteworthy. This enhances the socio-economic benefits and food security of smallholder farmers [8,40]. Our experiment also basically supports this statement. Resolving socio-economic constraints in the adoption of new agricultural technology is always an independent concern of policymakers and academicians.
The result of the first stage presents that the encouragement with subsidy offers of 100% and 50% is highly predicated on the number of PICS bags used (Table 3). Columns (1) and (2) of the table indicate the coefficient for encouragement with a 100% subsidy offer without and with covariates have the same values of 0.76. Which is significant at the 1% level (p-value< 0.01). Columns (3) and (4) of the same table illustrate the coefficient for encouragement with a 50% subsidy offered without and with covariates having the same value of 0.41, which is significant at the 1 % level (p-value< 0.01). Coefficients are significantly far from zero, which indicates encouragement with 100% and 50% subsidy are proper instrumental variables.
3.2. Impact of the PICS bags adoption on storage quantity
Table 4 presents the local average treatment effects (LATEs) on storage quantity outcome through two encouragements, 100%, and 50% subsidy offers. Columns (1) and (2) of the table show LATEs without and with covariates, respectively, for the farmers, who were encouraged with a 100% subsidy. Likewise, Columns (3) and (4) of the table show LATEs without and with covariates, respectively, for the farmers, who were encouraged with a 50% subsidy. The result indicates that an additional unit of PICS bag adoption increases maize storage by 42.84 and 42.86 kg, without and with covariates, respectively, for those encouraged with 100% subsidy. Similarly, it increases maize storage by 39.20 kg without and with covariates, respectively, for farmers encouraged with a 50% subsidy offer. Results show that the PICS bag adoption has a positive and significant effect (p-value <0.001) for those encouraged with 100% and 50% subsidy, despite controlling variables (Table 4).
That is to say, among the compliers in the 100% subsidy, adopters of 1 bag store 36.59 kg, and those adopting 2 and 3 bag stores 82.5 kg and 122 kg, respectively. Similarly, among the compliers in the 50% subsidy, adopters of 1 bag store 35.44 kg, and those adopting 2 and 3 bags store 81 kg and 130 kg, respectively.
3.3. Impact of the PICS bags adoption on post-harvest storage losses
Table 5 provides LATE estimates on post-harvest storage loss outcomes through two encouragements: 100% and 50% subsidy offers. Columns (1) and (2) of the table illustrate LATE without and with covariates, respectively, for farmers who were encouraged with a 100 % subsidy. Similarly, Columns (3) and (4) of the table illustrate LATE without and with covariates, respectively, for farmers who were encouraged with a 50 % subsidy. The result shows that an additional unit of PICS bag adoption reduces post-harvest storage losses by 10.05kg and 10.03 kg without and with covariates, respectively, for farmers who were encouraged with a 100% subsidy offer (Table 5). These values are consistent and significant at the 5% level (p-value <0.05).
There is no significant effect on post-harvest storage losses for those encouraged with a 50% subsidy.
3.4. Impact on PICS bags adoption and outcomes of interest:100% vs 50% subsidy encouragement
Table 6 illustrates the first stage and IV estimates for encouraged farmers with 100% subsidy relative to those with 50% subsidy. Columns (1) and (2) of the table show the impact of a 100% subsidy on the adoption of the numbers of PICS bags without and with covariates, respectively, with coefficient values of 0.35 and 0.33 significant at the 1% level (p-value< 0.01), indicating that the 100% subsidy offer is proper IV to estimate the impact of the number of PICS bags on outcomes of interest. Similarly, columns (3) and (4) of the table represent the coefficient of the impact of the PICS bag adoption on maize storage quantity using the bags for farmers encouraged with a 100% subsidy relative to those encouraged with a 50% subsidy without, and with covariates, respectively.
Coefficients suggest that an additional one unit of PICS hermetic bag adoption increments the maize storage of 47.15 and 47.68 kg without and with covariates, respectively, which are statistically significant at the 1 % level (p-value< 0.01) and consistent regardless of the including covariates.
Columns (5) and (6) of the table show impacts on post-harvest storage losses with coefficient values of -8.24 and -10.94 without and with covariates, respectively (Table 6). However, the results show that the impact of PICS bag adoption on post-harvest storage losses is insignificant in comparison to farmers who are encouraged with a 100% subsidy to encouraged with a 50% subsidy.
3.5. Instrument Validity
Our random encouragements: a 100% and a 50% subsidy offered to randomly selected farmers are instrumental variables for those farmers. Our instruments satisfied the following conditions and are appropriate for estimating the impact of the number of PICS bags on the storage quantity of maize and post-harvest storage losses.
Condition 1: Relevance
The first condition is the instrumental variable must correlate with the endogenous regressor (treatment variable), Cov (Z, D) 0. Table 3 shows encouragement with 100% and 50% subsidy offers are highly correlated with the use of the hermetic bag and the coefficients of both encouragement levels are significant at a 1 % level. Also, our IVs have higher first-stage F-statistics than the benchmark value exceeding 10 (see Appendix Table A.3) for strong IVs [57]. Hence, our IVs are proper to estimate the impact of PICS bags on outcomes of interest.
Condition 2: Independence
The instrumental variable must not correlate with unobservable factors, Cov(Z, u) 0. In this study, we randomly offered 100% and 50 % subsidies to smallholding farmers so this may distribute unobservable factors to all groups equally. The results from the balance check suggest the randomness of baseline variables between the encouragement-100 group relative to the control group, the encouragement-50 group relative to the control group, and the encouragement-100 group relative to the encouragement-50 group (see Table 2). This supports for validation of our instrumental variables.
Condition 3: Exclusion restriction
Violation of the exclusion restriction condition leads to IV estimate bias and inconsistency [57]. Although we cannot conduct a direct empirical test for exclusion restriction, we can provide precise intuition (Aizer & Doyle, 2015). Our random subsidy offers on the price of PICS bags only encourage smallholding farmers access to the bags and only after using the PICS bags farmers can store the maize which might reduce insect pest infestation while lowering storage losses. Hence, our encouragements (IVs) do not have a direct impact on outcomes without using the PICS bags. Due to our experimental setup, we run a separate regression model for a 100% subsidy offer and a 50% subsidy. An equal number of exogenous instruments and endogenous variables could reduce the bias near zero [59]. Therefore, our IVs satisfy the exclusion restriction condition.
Condition 4: Monotonicity
No farmer ‘defies’, the subsidy offers, would motivate the farmers to adopt hermetic storage bags but would not demotivate them. In our design still, farmers can decide not to adopt PICS bags, if they do not want.
3.6. Robustness Check:
We estimated the LATEs for outcomes using the limited information maximum likelihood (LIML) estimator and generalized method of momentum (GMM) estimators to check the preciseness and consistency of our results (see Appendix Table A.4-A.5).
4. Discussion
In this study, we delved into the causal impact of PICS bags on storage quantity and post-harvest storage losses among smallholding farmers in the rural mid-hills of Nepal encouraging them to use the HST by offering them subsidies on the price of up to three PICS bags to encouraged smallholding farmer after providing HST information to all the farmers.
Findings from our study suggest that the adoption of PICS bags has significant effects on storage quantity, using the PICS bags for smallholding farmers in Nepal in both encouragement-100 and encouragement-50 groups encouraged with subsidy. Hence, our finding on storage quantity contradicts with findings of [8,10,45]. They did not find a statistically significant storage quantity of maize in their studies where they reported the ITT effect conducting RCTs. Our findings on post-harvest storage loss resonate with the findings of [42]. They found that PICS bags with training reduced post-harvest storage loss by 6.1% points (76.8% reduction in storage loss). However, this finding might not be free from endogeneity bias since technology adoption is not random, and there is a chance of self-selection bias [43,44]. Also, our finding for post-harvest storage losses is in line with the findings of a 2.3% point reduction in storage losses in Uganda [8] and hermetic bags causing PHL reduction by 5.1 % points in Tanzania [7]. But contradicts with the finding of [45] found the null effect (ITT) in post-harvest storage losses in Ethiopia.
Our insignificant result for storage losses for the encouragement-50 group relative to the control group and the encouragement-100 group relative to the encouragement-50 group are mainly due to two reasons. First, most of the encouraged farmers adopted only a single unit of PICS bag. Although we provided a subsidy for up to three PICS bags, which can store a maximum of 150 kg of shelled maize, most farmers did not take full advantage of this offer. The main reason for this might be need of extra labor and time to shell the maize into grains before storing it in PICS bags. Traditionally, farmers store maize with husks in various ways as mentioned in the earlier section. The out-migration of people for work has increased throughout Nepal, with 5.9 million labor permits in the year 2023-24 for working abroad [19]. Lumbini Province is one of the provinces with high numbers of out-migration. It suggests a potential shortage of labor in rural regions of the province including the studied rural municipality. This could be another reason for the low adoption of PICS bags, instead of the fact that a very high percentage of farmers took/bought PICS bags.
Second, due to the short period of intervention, farmers reported less insect pest infestation in the early storage period. Hence, they did not use PICS bags, although, they took the bags with subsidy offers. They can use the PICS bags later, even in the next season and the following years. Generally, PICS bags can be used effectively for more than two years.
Our paper indicating the behavioral change of farmers regarding post-harvest management of grains has mainly three contributions to the emerging literature of improved storage technology for grains postharvest storage. First, we measure the causal impact of hermetic storage on storage quantity and post-harvest storage losses with a randomized encouragement design; an IV approach. This can address the endogeneity bias by measuring the impact of endogenous regressor [60]. Also, it provides rigorous and trustworthy causal impact rather than measuring the effect of random assignment of treatment on the outcome [47]. Since the adoption of technology is endogenous [43,44], previous RCTs done on storage technology could not be free from endogeneity biases.
Second, most of the earlier studies measured the combined effect with other factors (e.g. training, demonstration, group storage, and community storage). They lack evidence for the singled-out effect of the PICS bag. We estimated the effect of independent PICS bags disentangling from other factors. Thus, our finding provides a more precise treatment effect of the PICS bag reducing the effects of other factors.
Third, to our knowledge, this is the first study, which provides causal evidence on post-harvest storage management in rural mid-hills in Nepal. A previous descriptive study was “On-farm Grain Storage and Challenges in Bagamati Province in Nepal” [28].
Based on this study's findings, we suggest two policy implications for improved storage and sustainable agri-food systems.
First, encouraging smallholding farmers with 100% subsidies leads to broader adoption of HST. It increases the storage of maize and reduces post-harvest storage losses. Stored maize quantity using PICS bags reduces storage losses. It can enhance the local food availability and accessibility. Similarly, encouraging a 50% subsidy offer also increases the storage quantity using PICS bags. The increase in storage quantity poses a behavioural change regarding HST. It improves the grain's quality and controls insect infestation[36,37]. Thus, encouraging farmers to offer subsidies could be a viable policy option for post-harvest management, with preference to be given to the 100% subsidy considering the readily available PICS bags in such hilly rural municipalities.
Second, our study is the first study of randomized encouragement design in agriculture economics, which used two values of encouragement. It allows us to compare the impact of the PICS bag when smallholding farmers are encouraged with a 100% and 50% subsidy. The result suggests that a 100% subsidy offer is more effective in storage quantity than a 50% subsidy with no significant effect on post-harvest storage losses. This shows that being encouraged with a 100% subsidy offer could be a better policy option to improve the storage system. On the other hand, a 100% subsidy imposes a significant burden on the government budget.
In contrast, a 50% subsidy offer is cost-effective for developing nations and will still provide long-term benefits. Encouraging a 50% subsidy offer could be traded off for a more significant number of farmers for HST adoption and controlling storage problems with a smaller budget. Hence, encouraging smallholding farmers with a 50% subsidy might be a feasible, sustainable, and expandable policy option for policymakers in developing countries. Further studies are awaited in this regard.
5. Conclusions
The adoption of improved storage systems such as PICS bags can play a vital role in storage quantity, storage behaviors change, and post-harvest storage loss reduction through encouragement with subsidy offers on the price of PICS bags among smallholding farmers. This matters for enhancing food security as well as reducing hunger. This study aimed to measure the causal impact of PICS bags on storage quantity using PICS bags and post-harvest storage losses among smallholding maize farmers in Nepal with experimental data.
We conducted a randomized encouragement design, an IV among 692 smallholding maize farmers in Mathagadhi rural municipality in Lumbini province in Nepal. We found a significant impact on storage quantity and post-harvest storage losses among smallholding farmers who were encouraged with 100% subsidy offers. Similarly, we revealed a significant impact on storage quantity, whereas no significant effect on storage losses to smallholding farmers, who were encouraged with a 50% subsidy. In addition, compared to smallholding farmers encouraged with a 50% subsidy, those encouraged with 100% offers were likely to store more maize, although post-harvest storage losses were insignificant.
A limitation of our study may be the intervention period. Which was a bit short considering the storage period of maize for 8.61 months on average in the study area. Although some literature emphasizes that a short-term subsidy on agriculture technology increases its demand and future adoption [35,61] we recommend the study with a long period of intervention to measure the impact of hermetic storage technology more robustly.
Author Contributions
Conceptualization, D.K.N, and K.L.M.; methodology, D.K.N, and K.L.M.; software, D.K.N.; validation, D.K.N, and K.L.M.; formal analysis, D.K.N, and K.L.M.; investigation, D.K.N.; resources, D.K.N, and K.L.M.; data curation, D.K.N.; writing—original draft preparation, D.K.N, and K.L.M.; writing—review and editing, D.K.N, and K.L.M.; visualization, D.K.N.; supervision, K.L.M.; project administration, D.K.N.; funding acquisition, D.K.N, and K.L.M.;. All authors have read and agreed to the published version of the manuscript.
Funding
This study was supported by the Mathagadhi Rural Municipality in Nepal, and the Japanese Grant Aid for Human Resource Development Scholarship (JDS).
Institutional Review Board Statement
The study was conducted in accordance with the Declaration of Helsinki, and approved by the Institutional Review Board research ethics review board of the Graduate School of Humanities and Social Sciences, Hiroshima University, Japan (approved no. HR-HUM-001150, on 16th Aug 2023)The survey questionnaire and experimental design were approved (on 16th Aug 2023, approved no. HR-HUM-001150) by the research ethics review board of the Graduate School of Humanities and Social Sciences, Hiroshima University, Japan.
Data Availability Statement
The corresponding author will make the data and codes available upon reasonable request.
Acknowledgments
The authors wish to acknowledge the collaborative efforts and support of Mathagadhi Rural Municipality in Nepal and smallholding maize farmers who participated in this investigation.
Conflicts of Interest
The authors declare no conflicts of interest.
Appendix A

Table A1.
Description of the selected variables.
| Variables | Descriptions |
| Demographics | |
| Age | Age of respondents |
| Education (year) | Education year of respondents |
| Gender | Gender of respondents 1= male; 0= female |
| Family size | Total number of members in household |
| Economical (Income in thousands in Nepali Rupee-NPR) | |
| Family inocme | Average yearly income of household |
| Cereal income | Average yearly income of household from cereal crops |
| Cash crop income | Average yearly income of household from cash crops |
| Forest income | Average yearly income of household from forest |
| Off-farm income | Average yearly income of household from other sectors excluding agricuture |
| Livestock income | Average yearly income of household from livestock |
| Agricultural | |
| Agri-experience (year) | Experiences year of respondent in agriculture |
| Agri-land size (ropani) | Total area of agriculture land of household in ropani (1 ha= 19.66 ropani) |
| Maize production quantity (kg) | Total quantity of maize produced in the previous year. |
| Maize cultivated area (ropani) | Total area of maize cultivated land in the year 2023 in ropani (1 ha= 19.66 ropani) |
| Post-harvest management | |
| Storage period (month) | Storage period of maize in month |
| Insects (dummy) | Household having problem by insects such as weevil 1= Yes; 0= No |
| Moths (dummy) | Household having problem by insects such as moths 1= Yes; 0= No |
| Storage Loss (kg) | quantity of maize losses during the storage in Kg |
| New technology (dummy) | Famers who have experiences of new technology for storage 1 = Yes; 0= No |
| Outcome variables | |
| Storage quantity using PICS bag | Total quantity of maize stored in hermetic air- tight bags in kg. |
| Post-harvest storage losses | Total storage losses self-reported by households |
Table A2.
Distribution of PICS bag adoption among groups.
| Nos. of PICS bag | Control Group | Encouragement-100 Group | Encouragement-50 Group | |||
| Receive | Adopt | Receive | Adopt | Receive | Adopt | |
| (1) | (2) | (3) | ||||
| 0 | 347 | 347 | 12 | 50 | 39 | 94 |
| 1 | 0 | 0 | 33 | 47 | 26 | 57 |
| 2 | 0 | 0 | 31 | 16 | 31 | 25 |
| 3 | 0 | 0 | 73 | 36 | 100 | 20 |
Note: (1) From this table, we can obtain the compliance using the following formula.
Compliance proportion = (A-B)/C
Where A is the number of farmers who adopted PICS bags if farmers received the subsidy offer, B is the total number of farmers who adopted PICS bags regardless of encouragement, and C is the total number of farmers who randomly received the subsidy offer.
(2) Compliance proportion for Encouragement-100 = (99-0)/149 = 0.66
(3) Compliance proportion for Encouragement-50= (102-0)/196 =0.52
Table A3.
Weakness test of IV.
| 100% Subsidy offer Encouragment-100 Vs Control Group |
50% Subsidy offer Encouragment-50 Vs Control Group |
100% Subsidy offer Encouragment-100 Vs Encouragment-50 |
|
| Weak Instruments test | |||
| F-statistic | 199.85 | 129.47 | 12.25 |
| F-probability | 0.0000 | 0.0000 | 0.0005 |
| Degree of Freedom | 490 | 537 | 339 |
| Partial R- Saqured | 0.2897 | 0.1943 | 0.0349 |
Table A4.
Robustness check for storage quantity outcomes.
| (1) | (2) | (3) | (4) | |
| LIML | GMM | LIML | GMM | |
| Variables | Storage quantity using PICS bags | Storage quantity using PICS bags | Storage quantity using PICS bags | Storage quantity using PICS bags |
| Nos. of PICS bags | 42.86***(2.67) | 42.86*** (2.67) |
39.20*** (1.36) |
39.20*** (1.36) |
| Observations | 496 | 496 | 543 | 543 |
| R-squared | 0.85 | 0.85 | 0.92 | 0.92 |
| Covariates | Yes | Yes | Yes | Yes |
| Encouragement (subsidy offer) | 100% | 100% | 50% | 50% |
Notes: robust standard errors in parentheses *** p<0.01, ** p<0.05, * p<0.1, and covariates: age, education(year), family size, and gender.
Table A5.
Robustness check for post-harvest storage losses outcome.
| (1) | (2) | (3) | (4) | |
| LIML | GMM | LIML | GMM | |
| Variables | Post-harvest storage loss (kg) | Post-harvest storage loss (kg) | Post-harvest storage loss (kg) | Post-harvest storage loss (kg) |
| Nos. of PICS bags | -10.02** (4.00) |
(4.00) | (7.12) | -9.37 (7.12) |
| Observations | 496 | 496 | 543 | 543 |
| R-squared | 0.02 | 0.02 | 0.05 | 0.05 |
| Covariates | Yes | Yes | Yes | Yes |
| Encouragement (subsidy offer) | 100% | 100% | 50% | 50% |
Notes: robust standard errors in parentheses, *** p<0.01, ** p<0.05, * p<0.1, and covariates: age, education(year), family size, and gender.
References
- FAO State of Food and Agriculture 2019: Moving Forward on Food Loss and Waste Reduction; FOOD & AGRICULTURE ORG, 2019; ISBN 9789251317891.
- Delgado, L.; Schuster, M.; Torero, M. Food Losses in Agrifood System: What We Know. Annu Rev Resour Economics 2023, 15(41-62), doi:10.1146/annurev-resource-072722. [CrossRef]
- FAO How to Feed the World in 2050 Available online: https://www.fao.org/fileadmin/templates/wsfs/docs/expert_paper/How_to_Feed_the_World_in_2050.pdf (accessed on 24 April 2024).
- Godfray, H.C.J. The Challenge of Feeding 9-10 Billion People Equitably and Sustainably. In Proceedings of the Journal of Agricultural Science; Cambridge University Press, December 12 2014; Vol. 152, pp. S2–S8.
- Kumar, D.; Kalita, P. Reducing Postharvest Losses during Storage of Grain Crops to Strengthen Food Security in Developing Countries. Foods 2017, 6, 1–22, doi:10.3390/foods6010008. [CrossRef]
- Tesfaye, W.; Tirivayi, N. The Impacts of Postharvest Storage Innovations on Food Security and Welfare in Ethiopia. Food Policy 2018, 75, 52–67, doi:10.1016/j.foodpol.2018.01.004. [CrossRef]
- Brander, M.; Bernauer, T.; Huss, M. Improved On-Farm Storage Reduces Seasonal Food Insecurity of Smallholder Farmer Households – Evidence from a Randomized Control Trial in Tanzania. Food Policy 2021, 98, doi:10.1016/j.foodpol.2020.101891. [CrossRef]
- Omotilewa, O.J.; Ricker-Gilbert, J.; Ainembabazi, J.H.; Shively, G.E. Does Improved Storage Technology Promote Modern Input Use and Food Security? Evidence from a Randomized Trial in Uganda. J Dev Econ 2018, 135, 176–198, doi:10.1016/j.jdeveco.2018.07.006. [CrossRef]
- Chegere, M.J. Post-Harvest Losses Reduction by Small-Scale Maize Farmers: The Role of Handling Practices. Food Policy 2018, 77, doi:10.1016/j.foodpol.2018.05.001. [CrossRef]
- Channa, H.; Ricker-Gilbert, J.; Feleke, S.; Abdoulaye, T. Overcoming Smallholder Farmers’ Post-Harvest Constraints through Harvest Loans and Storage Technology: Insights from a Randomized Controlled Trial in Tanzania. J Dev Econ 2022, 157, doi:10.1016/j.jdeveco.2022.102851. [CrossRef]
- Murdock, L.L.; Margam, V.; Baoua, I.; Balfe, S.; Shade, R.E. Death by Desiccation: Effects of Hermetic Storage on Cowpea Bruchids. J Stored Prod Res 2012, 49, 166–170, doi:10.1016/j.jspr.2012.01.002. [CrossRef]
- Abass, A.B.; Ndunguru, G.; Mamiro, P.; Alenkhe, B.; Mlingi, N.; Bekunda, M. Post-Harvest Food Losses in a Maize-Based Farming System of Semi-Arid Savannah Area of Tanzania. J Stored Prod Res 2014, 57, 49–57, doi:10.1016/j.jspr.2013.12.004. [CrossRef]
- World Bank MISSING FOOD: The Case of Postharvest Grain Losses in Sub-Saharan Africa, Report No. 60371-AFR; Washington, DC 20433, 2011;
- Shiferaw, B.; Prasanna, B.M.; Hellin, J.; Bänziger, M. Crops That Feed the World 6. Past Successes and Future Challenges to the Role Played by Maize in Global Food Security. Food Secur 2011, 3, 307–327.
- Erenstein, O.; Jaleta, M.; Sonder, K.; Mottaleb, K.; Prasanna, B.M. Global Maize Production, Consumption and Trade: Trends and R&D Implications. Food Secur 2022, 14, 1295–1319.
- Bhandari, G.; Achhami, B.B.; Karki, T.B.; Bhandari, B.; Bhandari, G. Survey on Maize Post-Harvest Losses and Its Management Practices in the Western Hills of Nepal. Journal of Maize Research and Development 2015, 1, 98–105, doi:10.5281/zenodo.34288. [CrossRef]
- MoALD Statistical Information on Nepalese Agriculture 2078/79 (202122); Shinhadarbar, Kathamandu, 2023;
- MoALD Selected Indicators of Nepalese Agriculture; Shinhadarbar Kathmandu, 2023;
- MOF Economic Survey Fiscal Year 2023-24; Sinhdurbar, Kathamandu, 2024;
- Timsina, K.P.; Ghimire, Y.N.; Lamichhane, J. Maize Production in Mid Hills of Nepal: From Food to Feed Security. Journal of Maize Research and Development 2016, 2, 20–29, doi:10.3126/jmrd.v2i1.16212. [CrossRef]
- Upadhyay, I.P.; Shrestha, K.B.; Shivakoti, G.P. RS3839_Existing Farmer Practices of Maize Storage in the Eastern and Mid-Western Hills of Nepal.; Khajura, Banke, 2002;
- Upadhayay IP; Shrestha KB; Shivakoti GP RS4182_A Literature Review On Post-Harvest Losses of Maize with Emphasis on Storage Losses..Pdf-1487049461; Khajura, Banke, 2002;
- Paneru, R.B.; Paudel, G.P.; Thapa, R.B. DETERMINANTS OF POST-HARVEST MAIZE LOSSES BY PESTS IN MID HILLS OF NEPAL. International Journal of Agriculture, Environment and Bioresearch 2018, 3, 110–118.
- PMAMP Prime Minister Agriculture Modernization Project: Project Implementation Manual. Prime Minister Agriculture Modernization Project 2020.
- PMAMP Annual Program and Progress Report (Fiscal year 2022/23); 2024;
- MoAD Agriculture Development Strategy (ADS). Government of Nepal, Ministry of Agriculture Development 2015, 1.
- Flock, J.H. Purdue E-Pubs Factors That Influence the Adoption of Hermetic Storage, Evidence From Nepal; 2015;
- Kandel, P.; Kharel, K.; Njoroge, A.; Smith, B.W.; Díaz-Valderrama, J.R.; Timilsina, R.H.; Paudel, G.P.; Baributsa, D. On-Farm Grain Storage and Challenges in Bagmati Province, Nepal. Sustainability (Switzerland) 2021, 13, doi:10.3390/su13147959. [CrossRef]
- Ndaghu, N.N.; Abdoulaye, T.; Mustapha, A.; Choumbou Raoul Fani, D.; Tabetando, R.; Udeme Henrietta, U.; Lucy Kamsang, S. Gender Differentiation on the Determinants and Intensity of Adoption of Purdue Improved Cowpea Storage (PICS) Bags in Northern Nigeria. Heliyon 2023, 9, doi:10.1016/j.heliyon.2023.e23026. [CrossRef]
- Benimana, G.U.; Ritho, C.; Irungu, P. Assessment of Factors Affecting the Decision of Smallholder Farmers to Use Alternative Maize Storage Technologies in Gatsibo District-Rwanda. Heliyon 2021, 7, doi:10.1016/j.heliyon.2021.e08235. [CrossRef]
- Alemu, G.T.; Nigussie, Z.; Haregeweyn, N.; Berhanie, Z.; Wondimagegnehu, B.A.; Ayalew, Z.; Molla, D.; Okoyo, E.N.; Baributsa, D. Cost-Benefit Analysis of on-Farm Grain Storage Hermetic Bags among Small-Scale Maize Growers in Northwestern Ethiopia. Crop Protection 2021, 143, doi:10.1016/j.cropro.2020.105478. [CrossRef]
- Manda, J.; Feleke, S.; Mutungi, C.; Tufa, A.H.; Mateete, B.; Abdoulaye, T.; Alene, A.D. Assessing the Speed of Improved Postharvest Technology Adoption in Tanzania: The Role of Social Learning and Agricultural Extension Services. Technol Forecast Soc Change 2024, 202, doi:10.1016/j.techfore.2024.123306. [CrossRef]
- Zhang, S.; Sun, Z.; Ma, W.; Valentinov, V. The Effect of Cooperative Membership on Agricultural Technology Adoption in Sichuan, China. China Economic Review 2020, 62, doi:10.1016/j.chieco.2019.101334. [CrossRef]
- Baributsa, D.; Njoroge, A.W. The Use and Profitability of Hermetic Technologies for Grain Storage among Smallholder Farmers in Eastern Kenya. J Stored Prod Res 2020, 87, doi:10.1016/j.jspr.2020.101618. [CrossRef]
- Channa, H.; Chen, A.Z.; Pina, P.; Ricker-Gilbert, J.; Stein, D. What Drives Smallholder Farmers’ Willingness to Pay for a New Farm Technology? Evidence from an Experimental Auction in Kenya. Food Policy 2019, 85, 64–71, doi:10.1016/j.foodpol.2019.03.005. [CrossRef]
- Williams, S.B.; Murdock, L.L.; Baributsa, D. Storage of Maize in Purdue Improved Crop Storage (PICS) Bags. PLoS One 2017, 12, doi:10.1371/journal.pone.0168624. [CrossRef]
- Obeng-Akrofi, G.; Maier, D.E.; White, W.S.; Akowuah, J.O.; Bartosik, R.; Cardoso, L. Effectiveness of Hermetic Bag Storage Technology to Preserve Physical Quality Attributes of Shea Nuts. J Stored Prod Res 2023, 101, doi:10.1016/j.jspr.2023.102086. [CrossRef]
- Odjo, S.; Burgueño, J.; Rivers, A.; Verhulst, N. Hermetic Storage Technologies Reduce Maize Pest Damage in Smallholder Farming Systems in Mexico. J Stored Prod Res 2020, 88, doi:10.1016/j.jspr.2020.101664. [CrossRef]
- Ng’ang’a, J.; Mutungi, C.; Imathiu, S.; Affognon, H. Effect of Triple-Layer Hermetic Bagging on Mould Infection and Aflatoxin Contamination of Maize during Multi-Month on-Farm Storage in Kenya. J Stored Prod Res 2016, 69, 119–128, doi:10.1016/j.jspr.2016.07.005. [CrossRef]
- Shukla, P.; Pullabhotla, H.K.; Baylis, K. The Economics of Reducing Food Losses: Experimental Evidence from Improved Storage Technology in India. Food Policy 2023, 117, doi:10.1016/j.foodpol.2023.102442. [CrossRef]
- Aggarwal, S.; Francis, E.; Robinson, J. Grain Today, Gain Tomorrow: Evidence from a Storage Experiment with Savings Clubs in Kenya. J Dev Econ 2018, 134, 1–15, doi:10.1016/j.jdeveco.2018.04.001. [CrossRef]
- Chegere, M.J.; Söderbom, M.; Eggert, H. The Effects of Storage Technology and Training on Post-Harvest Losses, Practices and Sales: Evidence from Small-Scale Farms in Tanzania. Econ Dev Cult Change 2022, 70, 729–761, doi:10.1086/713932. [CrossRef]
- Mendola, M. Agricultural Technology Adoption and Poverty Reduction: A Propensity-Score Matching Analysis for Rural Bangladesh. Food Policy 2007, 32, 372–393, doi:10.1016/j.foodpol.2006.07.003. [CrossRef]
- Wu, F. Adoption and Income Effects of New Agricultural Technology on Family Farms in China. PLoS One 2022, 17, doi:10.1371/journal.pone.0267101. [CrossRef]
- Negede, B.M.; De Groote, H.; Minten, B.; Voors, M. Does Access to Improved Grain Storage Technology Increase Farmers’ Welfare? Experimental Evidence from Maize Farming in Ethiopia. J Agric Econ 2023.
- Nindi, T.; Ricker-Gilbert, J.; Bauchet, J. Incentive Mechanisms to Exploit Intraseasonal Price Arbitrage Opportunities for Smallholder Farmers: Experimental Evidence from Malawi. Am J Agric Econ 2023, doi:10.1111/ajae.12376. [CrossRef]
- Angrist, J.D.; Imbens, G.W.; Rubin, D.B. Identification of Causal Effects Using Instrumental Variables. J Am Stat Assoc 1996, 91, 444–455, doi:10.1080/01621459.1996.10476902. [CrossRef]
- Angrist, J.D.; Pischke, J.-S. Mastering ’Metrics: The Path from Cause to Effect; 1st ed.; Princeton University Press: Princeton, New Jersey, 2014; ISBN 978-0-691-15284-4.
- Angrist, J.D.; Pischke, J.-S. Mostly Harmless Econometrics: An Empiricistís Companion; Princeton University Press: Princeton, New Jersey, 2009;
- Imbens, G.W.; Angrist, J.D. Identification and Estimation of Local Average Treatment Effects. Econometrica 1994, 62, 467–475, doi:10.2307/2951620. [CrossRef]
- National Statistical Office, G. of N. National Population and Housing Census 2021 Available online: https://censusnepal.cbs.gov.np/results/economic?province=5&district=52&municipality=9, (accessed on 7 December 2023).
- Vu, H.T.; Tran, D.; Goto, D.; Kawata, K. Does Experience Sharing Affect Farmers’ pro-Environmental Behavior? A Randomized Controlled Trial in Vietnam. World Dev 2020, 136, doi:10.1016/j.worlddev.2020.105062. [CrossRef]
- Duflo, E.; Glennerster, R.; Kremer, M. Using Randomization in Development Economics Research: A Toolkit *; 2006;
- Mullally, C.; Boucher, S.; Carter, M. Encouraging Development: Randomized Encouragement Designs in Agriculture. Am J Agric Econ 2013, 95, 1352–1358, doi:10.1093/ajae/aat041. [CrossRef]
- Angrist, J.D.; Imbens, G.W. Two-Stage Least Squares Estimation of Average Causal Effects in Models With Variable Treatment Intensity. J Am Stat Assoc 1995, 90, 431–442, doi:10.1080/01621459.1995.10476535. [CrossRef]
- Baiocchi, M.; Cheng, J.; Small, D.S. Instrumental Variable Methods for Causal Inference. Stat Med 2014, 33, 2297–2340, doi:10.1002/sim.6128. [CrossRef]
- Bastardoz, N.; Matthews, M.J.; Sajons, G.B.; Ransom, T.; Kelemen, T.K.; Matthews, S.H. Instrumental Variables Estimation: Assumptions, Pitfalls, and Guidelines. Leadership Quarterly 2023, 34, doi:10.1016/j.leaqua.2022.101673. [CrossRef]
- Aizer, A.; Doyle, J.J. Juvenile Incarceration, Human Capital, and Future Crime: Evidence from Randomly Assigned Judges. Quarterly Journal of Economics 2015, 130, 759–804, doi:10.1093/qje/qjv003. [CrossRef]
- Angrist, J.D.; Krueger, A.B. Instrumental Variables and the Search for Identification: From Supply and Demand to Natural Experiments. Journal of Economic Perspectives 2001, 15, 69–85, doi:DOI: 10.1257/jep.15.4.69. [CrossRef]
- Sajons, G.B. Estimating the Causal Effect of Measured Endogenous Variables: A Tutorial on Experimentally Randomized Instrumental Variables. Leadership Quarterly 2020, 31, doi:10.1016/j.leaqua.2019.101348. [CrossRef]
- Omotilewa, O.J.; Ricker-Gilbert, J.; Ainembabazi, J.H. Subsidies for Agricultural Technology Adoption: Evidence from a Randomized Experiment with Improved Grain Storage Bags in Uganda. Am J Agric Econ 2019, 101, 753–772, doi:10.1093/ajae/aay108. [CrossRef]
Figure 1.
Study Site Map.
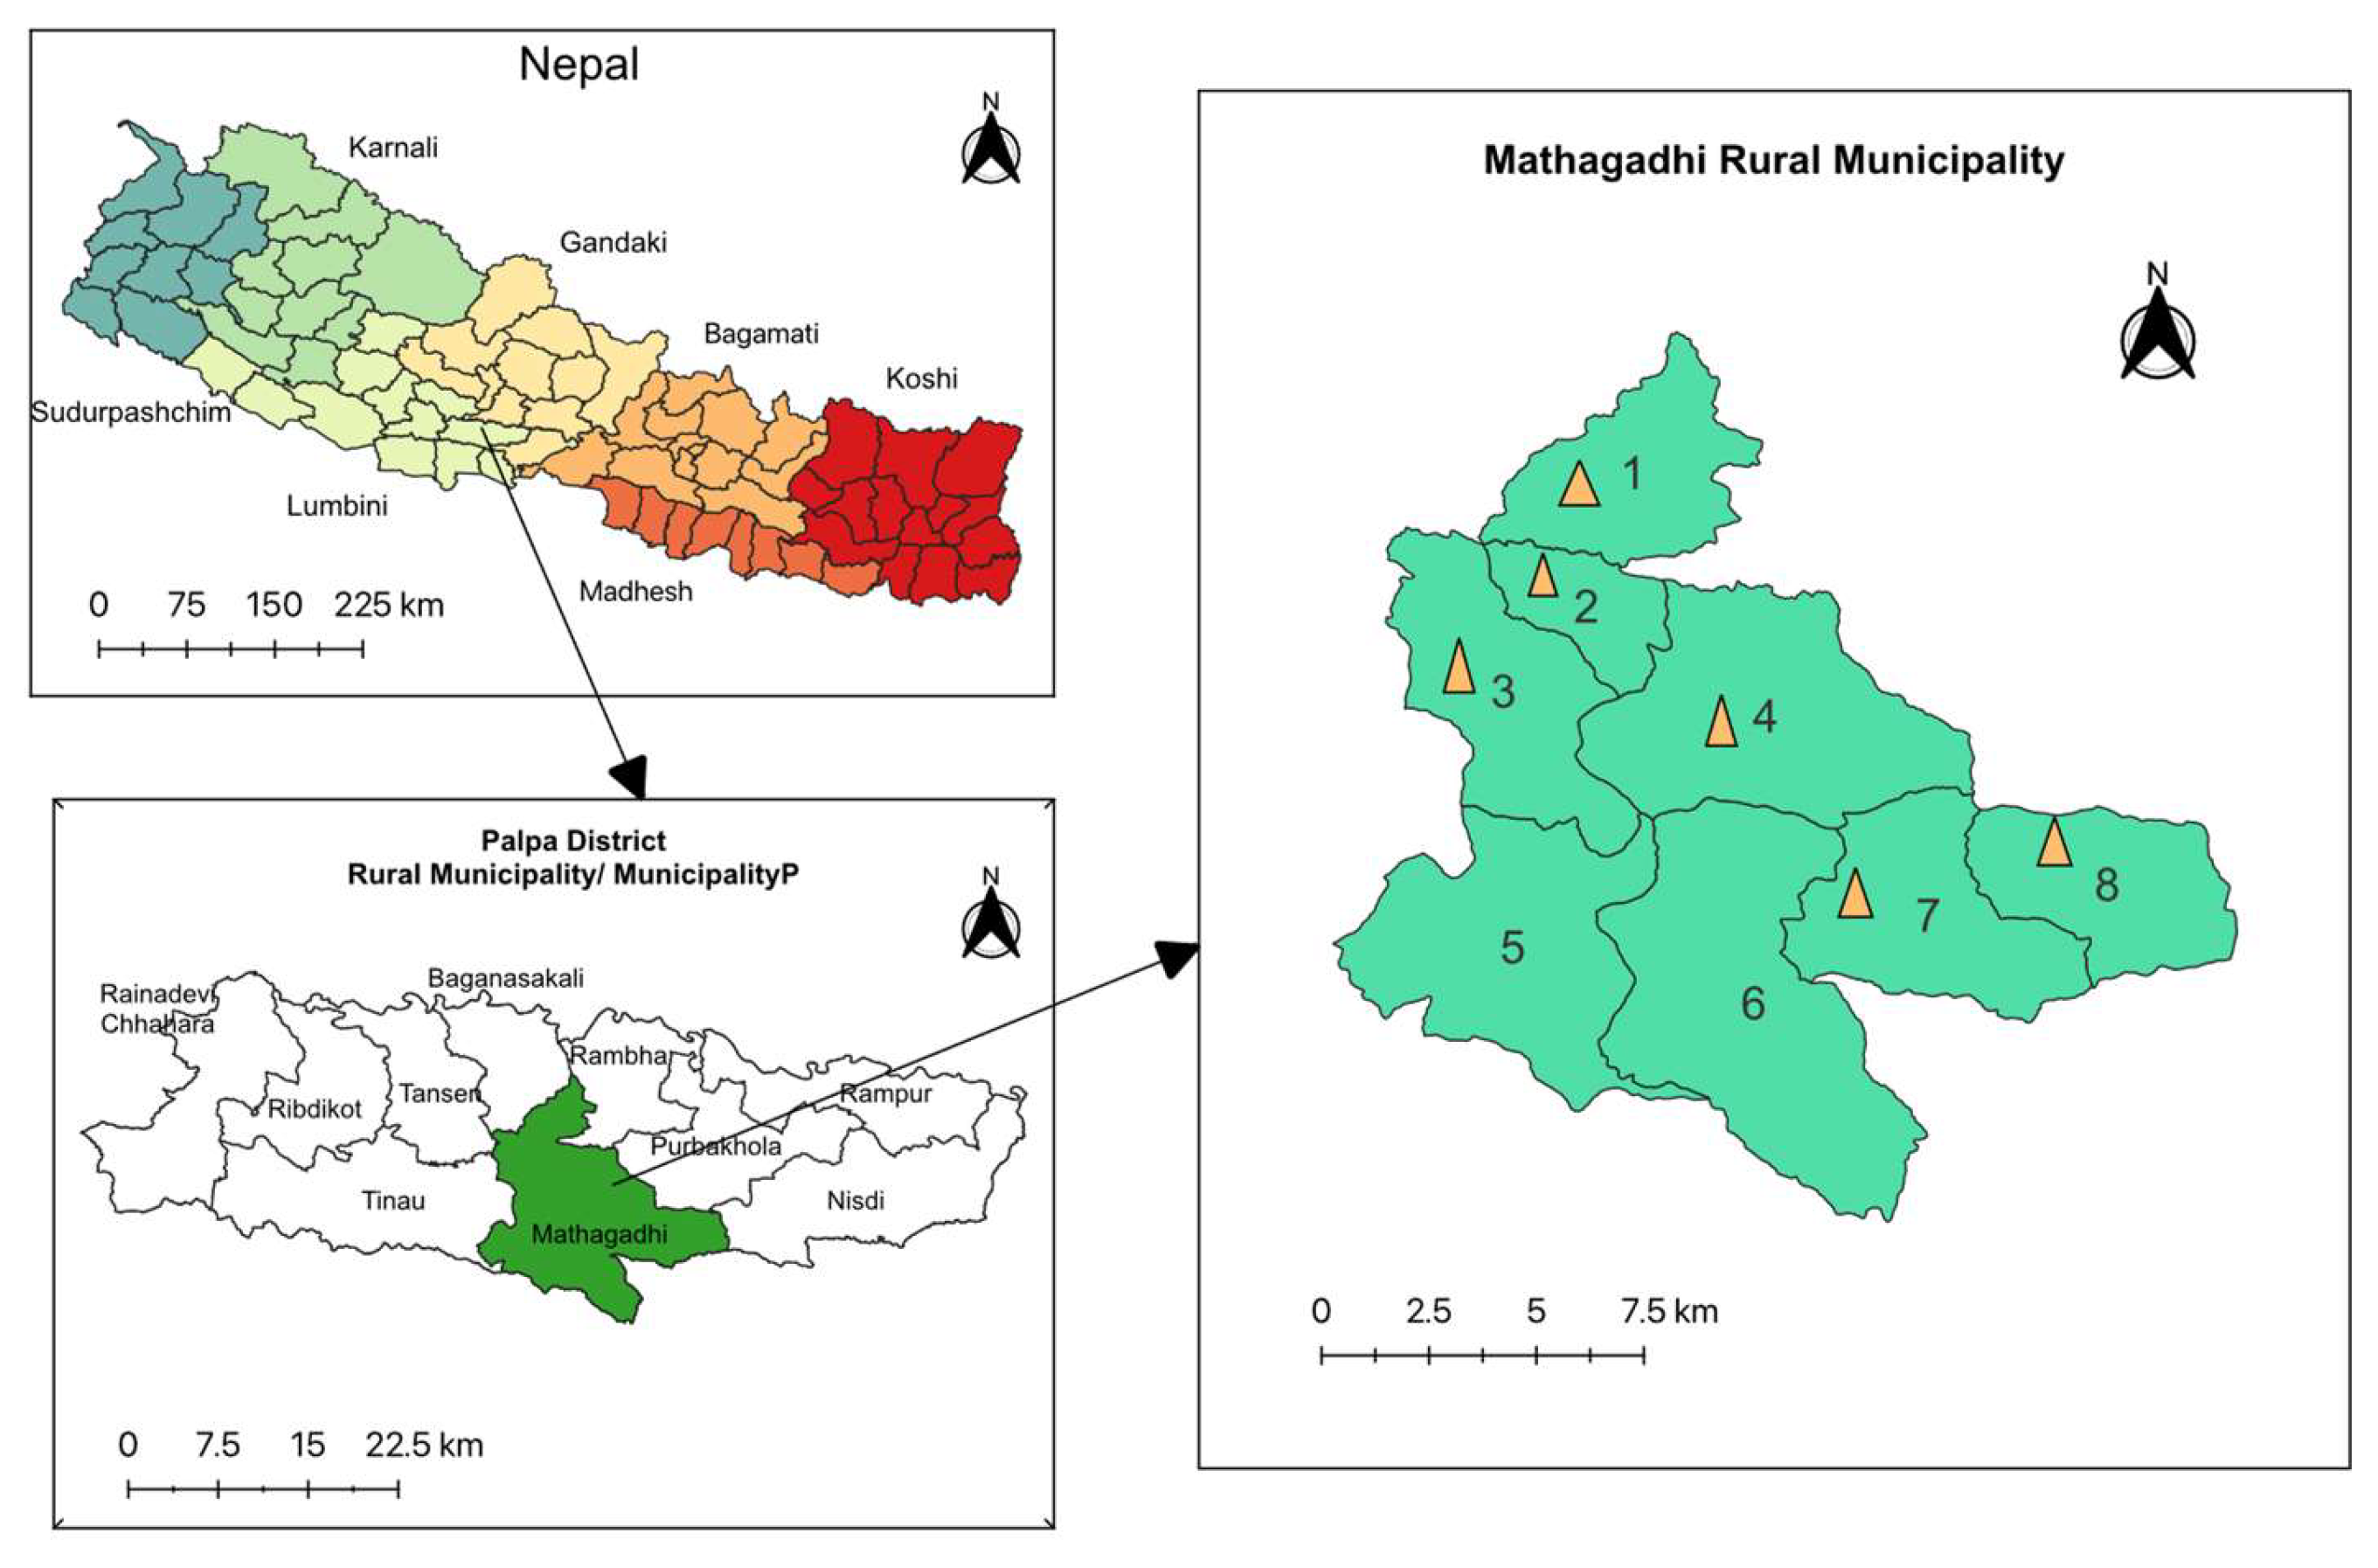
Figure 2.
Experimental Design.
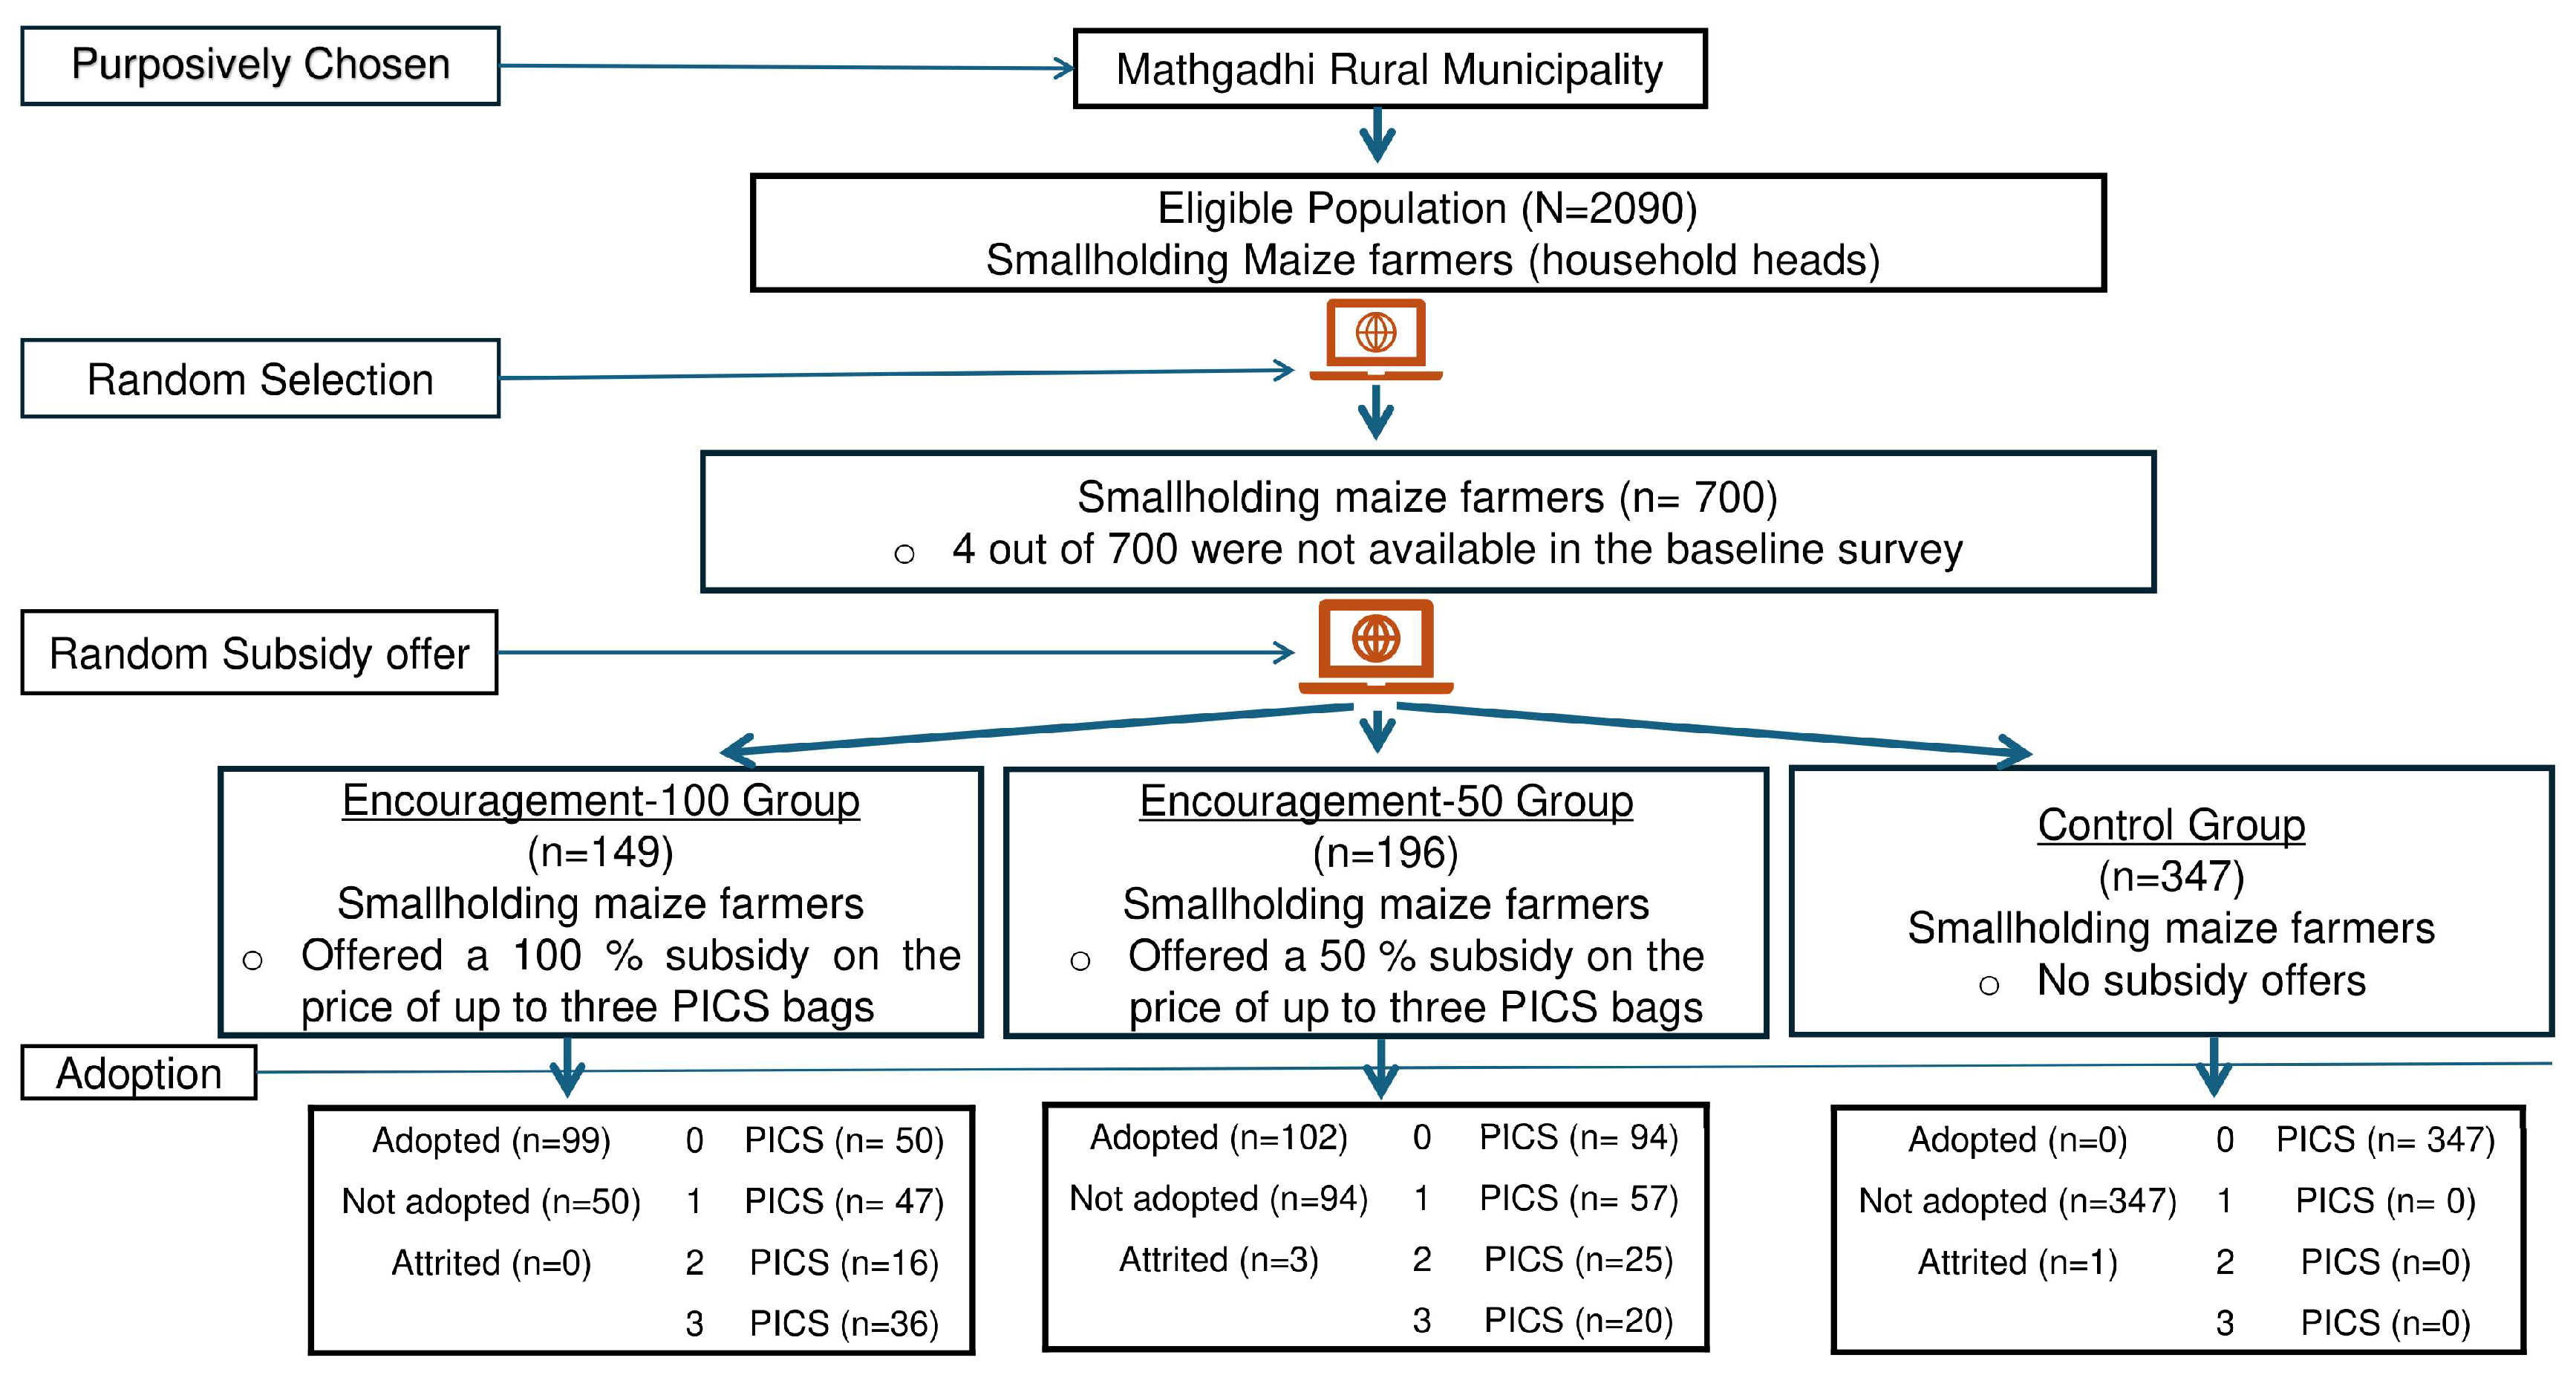
Table 1.
Descriptive statistics for the baseline variable.
| Variables | Full Sample | Control | Encouragement-100 Group | Encouragement-50 Group | |||||||||||
| (n = 692) | (n = 347) | (100% subsidy offer) | (50% subsidy offer) | ||||||||||||
| (n = 149) | (n = 196) | ||||||||||||||
| Mean | SD | Mean | SD | Mean | SD | Mean | SD | ||||||||
| Panel A. Demographics | |||||||||||||||
| Age | 47.65 | 13.92 | 47.35 | 13.86 | 48.74 | 13.96 | 47.37 | 14.05 | |||||||
| Education (Year) | 6.08 | 3.71 | 6.16 | 3.57 | 6.09 | 3.94 | 5.93 | 3.78 | |||||||
| Gender | 0.62 | 0.48 | 0.64 | 0.48 | 0.63 | 0.48 | 0.59 | 0.49 | |||||||
| Family size | 5.85 | 2.48 | 5.88 | 2.43 | 6.04 | 2.72 | 5.66 | 2.39 | |||||||
| Panel B. Economical (Income in thousands of Nepalese rupees -NPR) | |||||||||||||||
| Family income | 279.66 | 231.21 | 270.68 | 220.78 | 293.54 | 276.40 | 293.54 | 276.40 | |||||||
| Cereals income | 18.42 | 25.22 | 19.12 | 27.51 | 16.24 | 22.22 | 16.24 | 22.22 | |||||||
| Cash crop income | 8.85 | 28.60 | 10.86 | 37.57 | 6.82 | 14.54 | 6.82 | 14.54 | |||||||
| Forest income | 0.77 | 4.42 | 0.92 | 5.75 | 0.52 | 1.92 | 0.52 | 1.92 | |||||||
| Off-farm income | 217.69 | 225.68 | 205.08 | 214.82 | 234.65 | 264.38 | 234.65 | 264.38 | |||||||
| Livestock income | 26.77 | 32.01 | 27.66 | 37.13 | 27.73 | 32.19 | 27.73 | 32.19 | |||||||
| Panel C. Agricultural | |||||||||||||||
| Agri-experience (year) | 17.23 | 10.78 | 17.32 | 11.24 | 17.35 | 9.74 | 16.98 | 10.74 | |||||||
| Agri-land size (Ropani) | 9.14 | 6.15 | 9.01 | 6.06 | 9.43 | 6.57 | 9.14 | 6 | |||||||
| Maize Production Quantity (Kg) | 520 | 364 | 518 | 359.69 | 538.2 | 372.6 | 509.6 | 366.2 | |||||||
| Maize Plant Area (Ropani) | 5.63 | 3.86 | 5.59 | 3.84 | 5.81 | 3.91 | 5.57 | 3.89 | |||||||
| Panel D. Post-harvest management | |||||||||||||||
| Storage Period (month) | 8.67 | 2.92 | 8.63 | 2.91 | 8.77 | 2.8 | 8.64 | 3.05 | |||||||
| Insects (Dummy) | 0.89 | 0.31 | 0.89 | 0.32 | 0.91 | 0.29 | 0.89 | 0.32 | |||||||
| Moths (Dummy) | 0.69 | 0.46 | 0.67 | 0.47 | 0.73 | 0.44 | 0.69 | 0.46 | |||||||
| Storage Loss | 44.32 | 52.7 | 46.06 | 57.07 | 44.83 | 48.81 | 40.84 | 47.33 | |||||||
| New technology (Dummy) | 0.02 | 0.14 | 0.02 | 0.15 | 0.03 | 0.16 | 0.01 | 0.07 | |||||||
Source: Field Survey, 2023 August; Note: SD= Standard Deviation, 1$ US = 133.78 NPR as of December 2023, and 1 ha = 19.66 ropani.
Table 2.
Baseline comparison among groups.
| Variables | Encouragement-100 Vs. Control | Encouragement-50 Vs. Control | Encouragement-50 Vs. Encouragement-100 | ||||||
| Diff | S. E. | t-value | Diff | S. E. | t-value | Diff | S. E. | t-value | |
| Panel A. Demographics | |||||||||
| Age | -1.39 | 1.36 | -1.02 | -0.02 | 1.24 | -0.01 | -1.37 | 1.52 | -0.90 |
| Education (Year) | 0.07 | 0.36 | 0.19 | 0.23 | 0.33 | 0.71 | -0.16 | 0.42 | -0.38 |
| Gender | 0.01 | 0.05 | 0.25 | 0.06 | 0.04 | 1.29 | -0.04 | 0.05 | -0.83 |
| Family size | -0.16 | 0.25 | -0.65 | 0.22 | 0.22 | 1 | -0.38 | 0.28 | -1.37 |
| Panel B. Economical (Income in thousands of Nepali rupees (NPR) | |||||||||
| Family income | -22.87 | 23.39 | -0.98 | -14.32 | 19.43 | -0.73 | -8.54 | 26.25 | -0.33 |
| Cereals income | 2.88 | 2.55 | 1.13 | 0.28 | 2.32 | 0.12 | 2.61 | 2.47 | 1.06 |
| Cash crop income | 4.04 | 3.17 | 1.27 | 4.01 | 2.8 | 1.43 | 0.03 | 1.60 | 0.02 |
| Forest income | 0.4 | 0.48 | 0.82 | 0.23 | 0.44 | 0.52 | 0.17 | 0.26 | 0.65 |
| Off-farm income | -29.57 | 22.60 | -1.31 | -22.03 | 19.10 | -1.15 | -7.54 | 25.65 | -0.29 |
| Livestock income | -0.07 | 3.50 | -0.02 | 3.17 | 2.86 | 1.11 | -3.24 | 2.81 | -1.15 |
| Panel C. Agricultural | |||||||||
| Agri-experience (year) | -0.03 | 1.06 | -0.03 | 0.34 | 0.99 | 0.34 | -0.37 | 1.12 | -0.33 |
| Agri-land size (Ropani) | -0.42 | 0.61 | -0.69 | -0.13 | 0.54 | -0.24 | -0.29 | 0.68 | -0.43 |
| Maize Production Quantity (Kg) | -20.18 | 35.61 | -0.57 | 8.38 | 32.35 | 0.26 | -28.56 | 40.11 | -0.71 |
| Maize Plant Area (Ropani) | -0.22 | 0.38 | -0.57 | 0.02 | 0.34 | 0.06 | -0.23 | 0.42 | -0.55 |
| Panel D. Post-harvest management | |||||||||
| Storage Period (month) | -0.14 | 0.28 | -0.49 | -0.004 | 0.26 | -0.02 | -0.13 | 0.32 | -0.42 |
| Insects (Dummy) | -0.02 | 0.03 | -0.7 | -0.003 | 0.03 | -0.11 | -0.02 | 0.03 | -0.55 |
| Moths (Dummy) | -0.06 | 0.05 | -1.33 | -0.02 | 0.04 | -0.54 | -0.04 | 0.05 | -0.76 |
| Storage Loss | 1.23 | 5.36 | 0.23 | 5.22 | 4.8 | 1.09 | -4.00 | 5.21 | -0.77 |
| New technology (earlier HST) (Dummy) | 0 | 0.02 | -0.25 | 0.02 | 0.01 | 1.57 | -0.02 | 0.01 | -1.68 |
Source: Field Survey, 2023 August; Note: Diff = mean difference and SE = Standard Errors.
Table 3.
First stage impact of subsidy offer on the PICS bags adoption.
| (1) | (2) | (3) | (4) | |
| Variables | Nos. of PICS bags | Nos. of PICS bags | Nos. of PICS bags | Nos. of PICS bags |
| 100% Subsidy offer | 0.76*** (0.08) |
0.76*** (0.08) |
||
| 50% Subsidy offer | 0.41*** (0.04) |
0.41*** (0.04) |
||
| Constant | 0.00***(0.00) | -0.21* (0.11) |
0.00 (0.00) |
-0.10* (0.06) |
| Observations | 496 | 496 | 543 | 543 |
| R-squared | 0.29 | 0.30 | 0.19 | 0.20 |
| Covariates | No | Yes | No | Yes |
Notes: robust standard errors in parentheses, *** p<0.01, ** p<0.05, * p<0.1, and covariates: age, education (year), family size, and gender.
Table 4.
Impact of the PICS bag adoption on storage quantity.
| (1) | (2) | (3) | (4) | |
| Variables | Storage quantity using PICS bag (kg) | Storage quantity using PICS bag (kg) | Storage quantity using PICS bag (kg) | Storage quantity using PICS bag (kg) |
| Nos. of PICS bags | 42.84*** (2.64) |
42.86*** (2.67) |
39.20*** (1.38) |
39.20*** (1.36) |
| Constant | -0.00*** (0.00) |
2.61 (5.41) |
0.00*** (0.00) |
0.97 (1.12) |
| Observations | 496 | 496 | 543 | 543 |
| R-squared | 0.85 | 0.85 | 0.92 | 0.92 |
| Covariates | No | Yes | No | Yes |
Notes: robust standard errors in parentheses, *** p<0.01, ** p<0.05, * p<0.1, and covariates: age, education (year), family size, and gender.
Table 5.
Impact of the PICS bags adoption on post-harvest storage losses.
| (1) | (2) | (3) | (4) | |
| Variables | Post-harvest storage loss (Kg) | Post-harvest storage loss (Kg) | Post-harvest storage loss (Kg) | Post-harvest storage loss (Kg) |
| Nos. of PICS Hermetic bag | -10.05** (4.08) |
-10.02** (4.56) |
-11.93 (7.34) |
-9.37 (7.12) |
| Constant | 30.53*** (1.73) |
9.89 (7.50) |
30.67*** (1.75) |
5.61 (6.95) |
| Observations | 496 | 496 | 543 | 543 |
| R-squared | 0.02 | 0.05 | ||
| Covariates | No | Yes | No | Yes |
Notes: robust standard errors in parentheses, *** p<0.01, ** p<0.05, * p<0.1, and covariates: age, education (year), family size, and gender.
Table 6.
Impact on PICS bags adoption and outcomes of interest: 100% vs 50% subsidy encouragement.
| (1) | (2) | (3) | (4) | (5) | (6) | |
| First-stage | Second-stage | |||||
| Variables | No. of PICS bag | No. of PICS bag | Storage quantity using PICS bag (kg) | Storage quantity using PICS bag (kg) | Post-harvest storage losses (kg) | Post-harvest storage losses (kg) |
| 100% subsidy offer | 0.35*** (0.09) |
0.33*** (0.09) |
||||
| Nos. of PICS bag | 47.15*** (6.36) |
47.68*** (5.39) |
-8.24 (10.06) |
-10.94 (10.33) |
||
| Observations | 345 | 345 | 345 | 345 | 345 | 345 |
| R-squared | 0.04 | 0.06 | 0.82 | 0.82 | ||
| Covariates | No | Yes | No | Yes | No | Yes |
Notes: robust standard errors in parentheses, *** p<0.01, ** p<0.05, * p<0.1, #covariates: age, education (year), family size, and gender.
Disclaimer/Publisher’s Note: The statements, opinions and data contained in all publications are solely those of the individual author(s) and contributor(s) and not of MDPI and/or the editor(s). MDPI and/or the editor(s) disclaim responsibility for any injury to people or property resulting from any ideas, methods, instructions or products referred to in the content. |
© 2024 by the authors. Licensee MDPI, Basel, Switzerland. This article is an open access article distributed under the terms and conditions of the Creative Commons Attribution (CC BY) license (http://creativecommons.org/licenses/by/4.0/).
Copyright: This open access article is published under a Creative Commons CC BY 4.0 license, which permit the free download, distribution, and reuse, provided that the author and preprint are cited in any reuse.


