
Submitted:
18 November 2024
Posted:
19 November 2024
You are already at the latest version
Abstract
Ginkgo biloba, a "living fossil" with immense medicinal and conservation value, is a nationally first-class protected wild plant. However, many Ginkgo populations are under threat from habitat destruction, human exploitation, and over-harvesting, which has limited their numbers and range. Using an optimized MaxEnt model in R, this study analyzed Ginkgo distribution points and 22 ecological factors in China to explore the key environmental factors affecting its geographical distribution. The study also predicted the spatial distribution patterns and centroid changes of potential suitable areas under three different carbon emission pathways: current conditions, 2021-2040 (2030s), 2041-2060 (2050s), and 2061-2080 (2070s). The findings are as follows: (1) The optimal model parameter combination (RM = 3.2, FC = LPH) resulted in the lowest complexity and overfitting, while achieving very high prediction accuracy. (2) The key environmental factors influencing Ginkgo growth include precipitation in the driest month (20–175 mm), minimum temperature in the coldest month (-4 to 3°C), precipitation in the hottest quarter (450–2500 mm), and a temperature seasonal variation deviation greater than 580. (3) Under the three future climate scenarios (SSP126, SSP245, and SSP585), the potential suitable habitat area for Ginkgo biloba in China is expected to increase, with the distribution range migrating to higher latitudes. This study is highly significant for the ecological protection of Ginkgo, aiding in the rational planning of potential suitable areas, enhancing the monitoring of key conservation areas, and developing effective protection strategies in a timely manner.
Keywords:
Ginkgo biloba
; maximum entropy model
; potential suitable areas
; climatic change
1. Introduction
Ginkgo (Ginkgo biloba), known as the "living fossil" of the plant kingdom, belongs to the family Ginkgoaceae and the genus Ginkgo. It is considered a relict species from the Mesozoic era [1]. Ginkgo biloba is listed as an endangered (EN) species on the IUCN Red List, a nationally protected wild plant, and holds high medicinal, timber, and nutritional value. Its distribution range is relatively wide, extending from northern to northeastern China, and from the south to Guangzhou, with a more concentrated presence in the middle and lower reaches of the Yangtze River. Research on Ginkgo has mainly focused on its physicochemical properties [2], clinical effects [3], and chemical composition [4]. However, studies on its habitat and potential habitat are scarce. In recent years, due to the rising demand and economic value of Ginkgo, over-exploitation has become evident, severely threatening wild Ginkgo resources [5]. Given the increasing threats to wild Ginkgo populations, exploring the potential geographic distribution of Ginkgo, and predicting its future range under climate change, is crucial for the conservation of wild Ginkgo resources and selecting sites for artificial planting.
Climate change plays a key role in shaping the spatial distribution patterns of plant populations. Recent global temperature increases [6], driven by human energy use and geological changes, along with frequent extreme weather events, have impacted plant growth, geographic distribution, and ecosystem stability [7,8]. Rapid climate change can lead to the contraction of spatial ranges or even the extinction of plants with low adaptability and poor dispersal abilities. Therefore, understanding the effects of climate change on plant distribution and niche areas is vital for biodiversity conservation and maintaining ecosystem stability. Ecological niche models (ENMs [9]) are widely used to study species' suitable habitats, with the Maximum Entropy Algorithm model (MaxEnt) being one of the most popular due to its ease of use, accurate predictions, and reliability [10,11,12]. MaxEnt has been employed to predict potential suitable areas for various high-value species, including relict and endangered plants such as Sophora moorcroftiana, Sophora japonica [13], and Pterocarpus marsupium [14,15]. This model evaluates the effects of climate change on plant habitats by calculating the correlation between species' spatial distribution points and environmental variables, making it a robust tool even when dealing with incomplete data or small sample sizes [16]. In addition to predicting suitable habitats, the MaxEnt model can generate spatial maps [17] of these areas and assess the contribution of environmental variables using the Jackknife test. This model has been applied in various fields, including species distribution modeling, climate change response, biodiversity conservation, and evolutionary studies.
In summary, this study employs the MaxEnt model to analyze the spatial pattern of Ginkgo distribution under present and future climatic conditions using climatic and topographic data. The goal is to identify the key environmental factors influencing Ginkgo's growth and provide theoretical references for the strategic planting and conservation of this valuable species in China. The study seeks to answer three primary questions: (1) What are the main environmental factors affecting Ginkgo distribution? (2) How will the potential habitable zone of Ginkgo shift under climate change? (3) How can Ginkgo be reasonably protected as a rare plant?
2. Materials and Methods
2.1. Species Range Point Data
Ginkgo distribution data were obtained from several sources, including the Global Biodiversity Information Facility (GBIF), the Chinese Digital Herbarium (CVH), and the Chinese National Specimen Resource Platform (NSII). The locations of Ginkgo biloba were extracted from these databases, and latitude and longitude data were collected using the Baidu coordinate system. After eliminating duplicates and invalid data, the buffer method in ArcGIS was used to retain one distribution point within a 5 km radius, resulting in 118 valid distribution data points.
2.2. Selection of Environmental Data
Plant growth and distribution depend heavily on their adaptability to environmental factors such as climate and topography. Therefore, 19 bioclimatic factors and 3 topographic factors were selected for analysis. Climatic variables were obtained from the Global Climate Database (Worldclim), and topographic data were downloaded from the Geospatial Data Cloud. Slope and slope direction were extracted using ArcGIS. Future climate data were based on the BCC-CSM2-MR model, developed by the National Meteorological Center of China, under three climate scenarios (SSPs126, SSPs245, SSPs585 [18]) for the 2030s, 2050s, and 2070s, with a resolution of 2.5 minutes.
2.3. Model Construction and Accuracy Test
2.3.1. Screening of Environmental Factors
To avoid overfitting the model due to correlations between environmental factors, the distribution data and environmental variables were input into the MaxEnt model for pre-modeling. This process identified the contribution rates of each environmental factor and excluded those with a contribution rate of zero. Pearson correlation analysis was then performed on all environmental factors using SPSS 25.0 (Figure 1). Based on the correlation analysis and the table of environmental factor contribution rates, factors with |r| < 0.8 were retained, while factors with |r| > 0.8 were retained only if they had high contribution rates. This final selection yielded 11 environmental factors for modeling (Table 1). A correlation heat map of these environmental factors was plotted using the corrplot package in R.
2.3.2. Model Construction and Optimization
Given that the MaxEnt model can become overfitted due to complex operations, resulting in unreliable or difficult-to-interpret predictions, model complexity was addressed. Complexity is significantly correlated with the feature combination (FC)—LQPTH (L = linear, Q = quadratic, P = product, T = threshold, H = hinge)—and the regularization multiplier (RM). Therefore, the MaxEnt model was tuned using the "kuenm" package (R3.6.3) to ensure optimal combinations of RM and FC parameters. The best parameter combination was selected when the omission rates were less than 5% and the natural logarithm of AICc was minimized, corresponding to a delta AICc value of zero.
The other model parameters were set as follows: 75% of the species distribution data was randomly selected as the training set, and 25% as the test set. The output format was set to Logistic, and results ranged between 0-1, facilitating the delineation of fitness zones in subsequent analyses. The model was run 10 times, with a maximum background value of 10,000, and the remaining parameters were set to default.
The accuracy of the prediction results was evaluated using the area under the receiver operating characteristic curve (ROC) (AUC). Generally, the higher the AUC value, the better the model's predictive accuracy [19]. AUC values between 0.5-0.7 indicate low accuracy, 0.8-0.9 moderate accuracy, and 0.9-1.0 high accuracy. In this study, the average AUC value for Ginkgo biloba in China predicted by the MaxEnt model was 0.928, with all AUC values exceeding 0.9, indicating reliable predictions that can be used to estimate Ginkgo's potential distribution in China.
2.4. Classification of Suitable Areas
The predicted species distribution data were imported into ArcGIS, where the predicted result values (P) ranged from 0 to 1. Higher values indicate a greater likelihood of the species’ presence. Using ArcGIS's reclassification function, Ginkgo's habitat was divided into four categories: non-habitable (P < 0.09), low-habitable (0.09 ≤ P < 0.27), moderate-habitable (0.27 ≤ P < 0.48), and highly-habitable (P ≥ 0.48).
3. Results
3.1. Model Optimization and Accuracy Evaluation Results
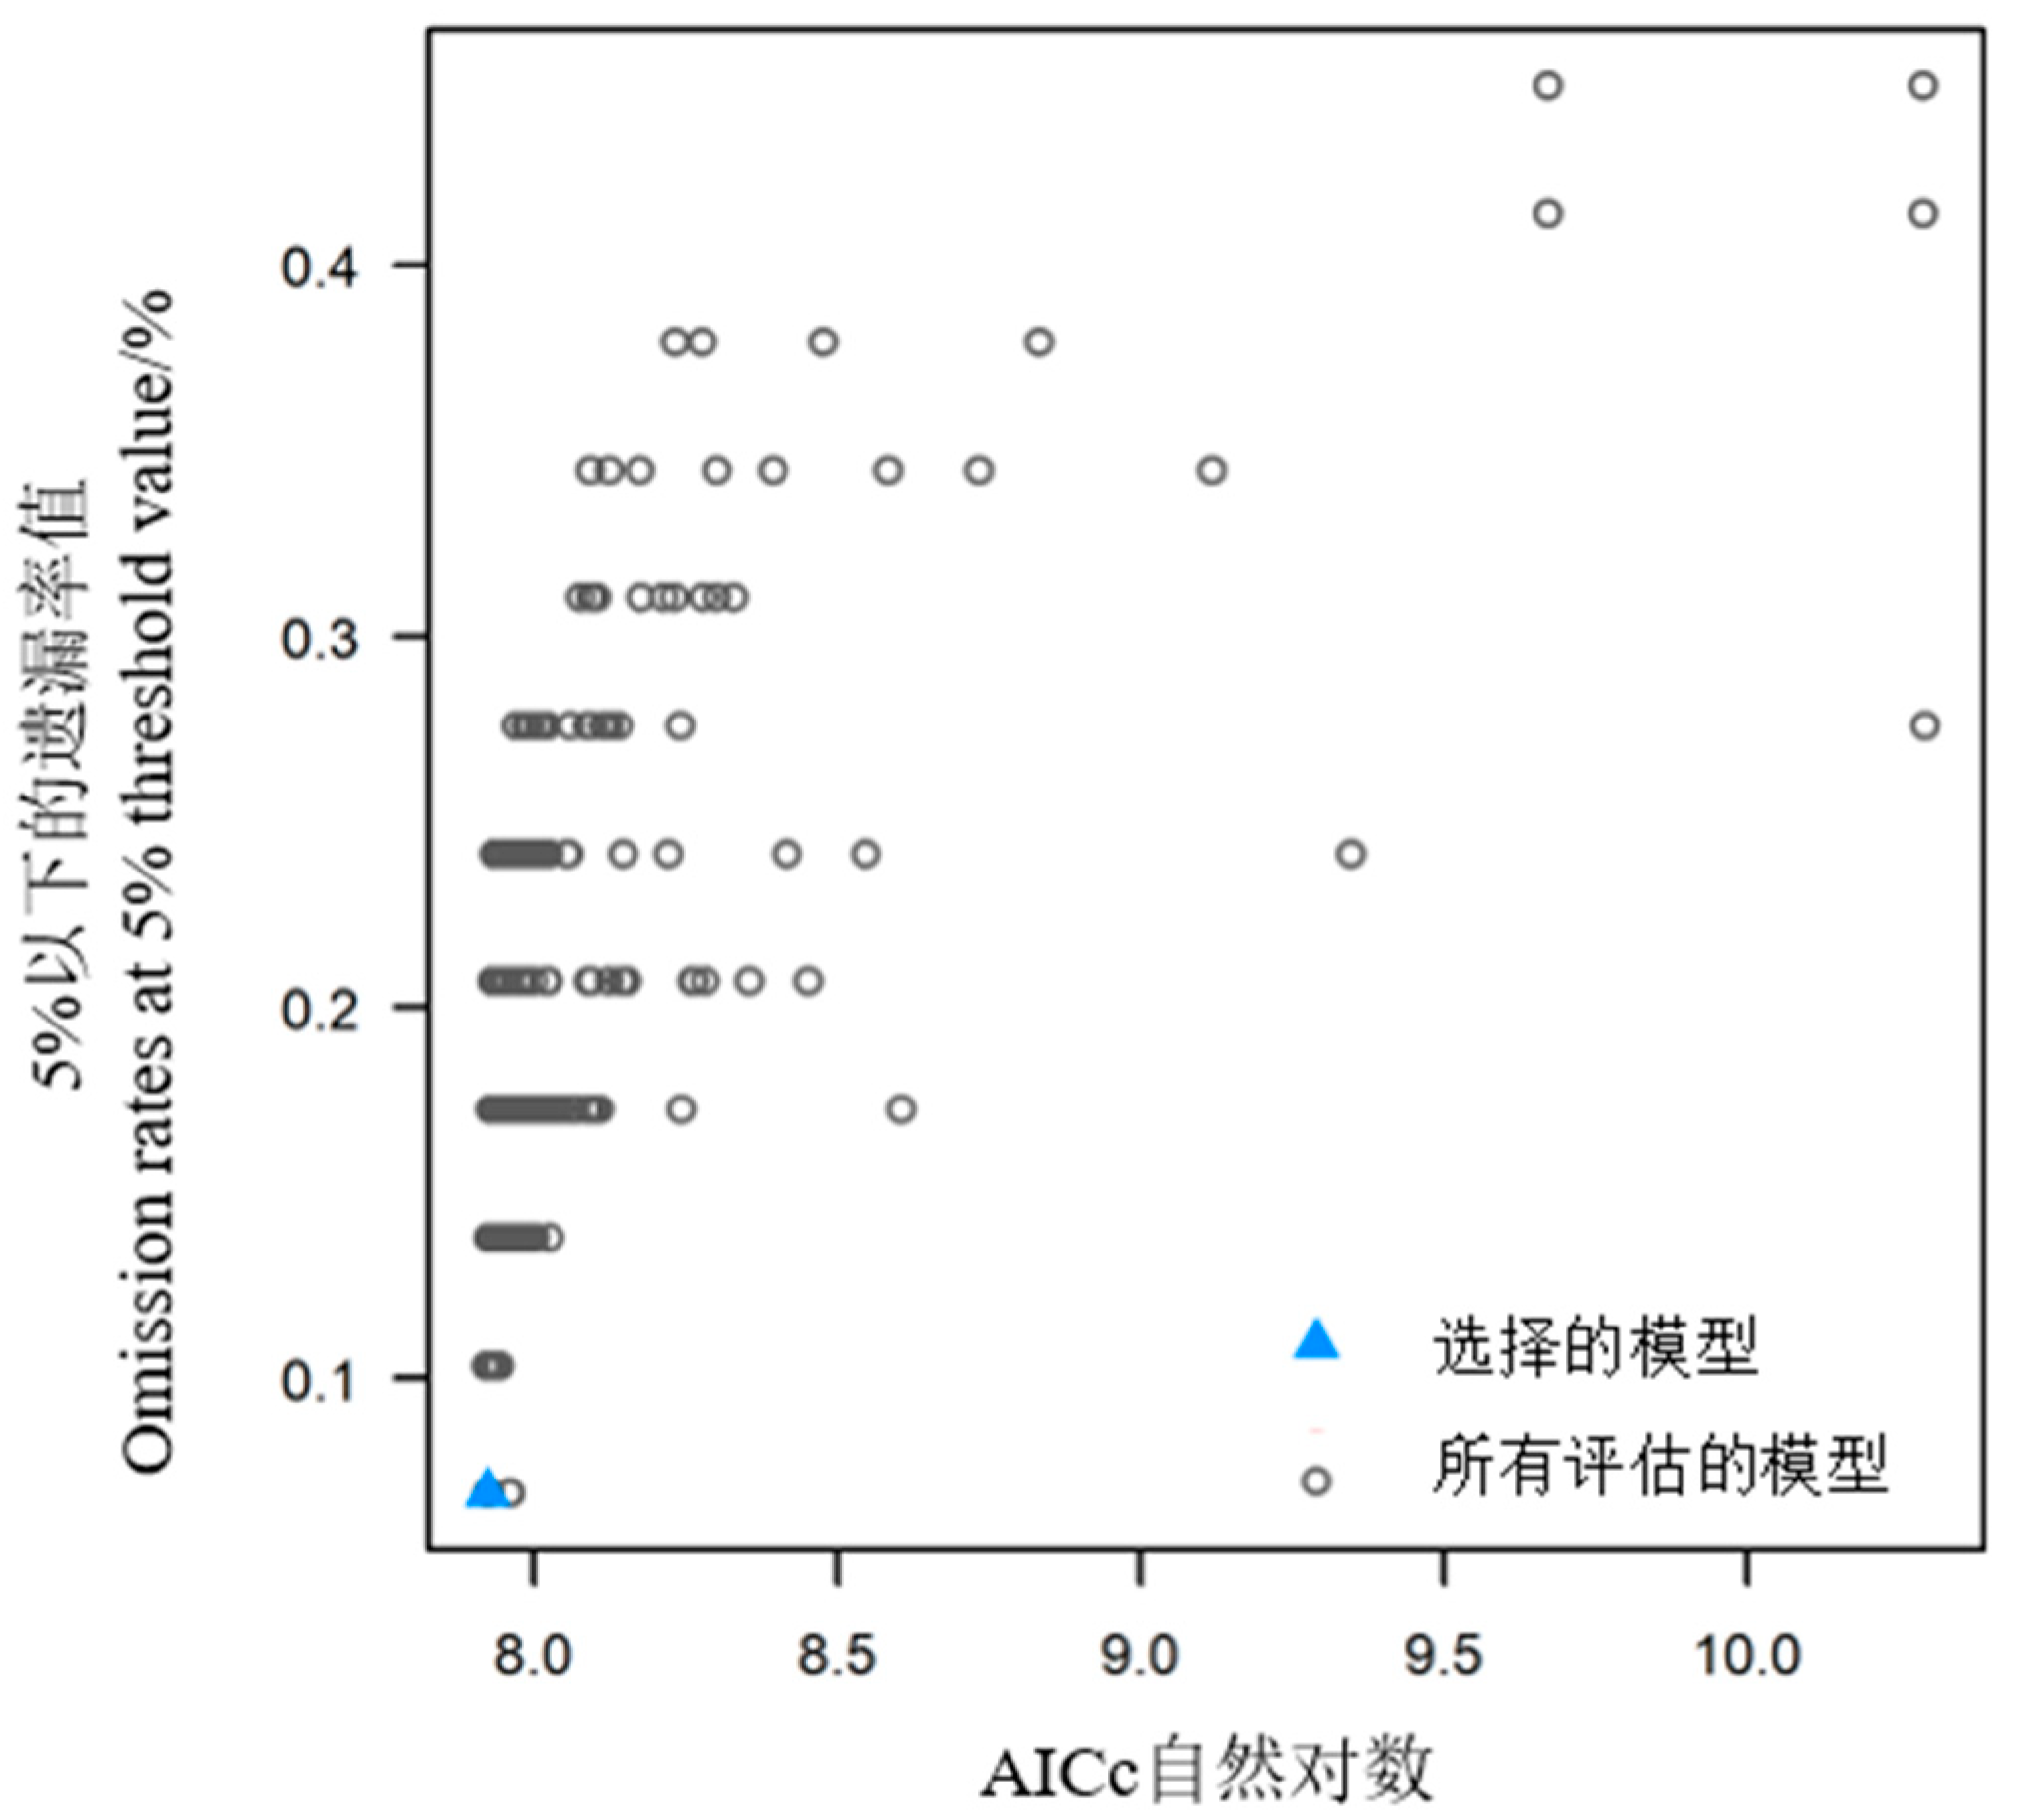
The model optimization results involved cross-validating 1,160 FC and RM parameter combinations, all meeting the 5% omission rate threshold. Among these, 12 parameter combinations had a delta AICc of less than 2. The optimal feature combination was LPH, and the RM value was 3.2, with an omission rate of 0.03448 and a delta AICc of 0. The average AUC value of the optimized model was 0.905, indicating good predictive performance.
Figure 2.
Optimal model parameter combination selection.
3.2. Main Environmental Factors Affecting the Distribution of Ginkgo Biloba
MaxEnt model outputs and regularized training gain contributions, based on the Jackknife test and one-way response curves, revealed the key environmental factors influencing Ginkgo distribution. The most significant factors were precipitation in the driest month (bio14, 35.6%), minimum temperature in the coldest month (bio6, 29.4%), precipitation in the wettest season (bio16, 16.9%), and temperature seasonality (bio4, 8.9%), with a cumulative contribution of 90.8%. Precipitation in the driest month (bio14) was the main factor, while the others were secondary. The remaining environmental factors each contributed less than 5%, which was the general environmental factor. The cumulative contribution of the precipitation factors (bio14, bio16) was higher (52.5%) than that of the temperature factor (40.4%).

Table 2.
The importance of each dominant environment variable in the MaxEnt model.
| coding | variant | Contribution/% | Replacement contribution/% |
| bio14 | Precipitation in the driest month | 35.6 | 0.7 |
| bio6 | Minimum temperature in the coldest month | 29.4 | 54.2 |
| bio16 | Wettest quarterly precipitation | 16.9 | 19.9 |
| bio4 | Deviation from seasonal variation in temperature | 8.9 | 12.7 |
| DEM | altitude (e.g. above street level) | 4 | 4.5 |
| bio2 | Annual average daily difference | 1.3 | 0.6 |
| bio15 | Seasonal coefficient of variation of precipitation | 1.1 | 0.3 |
| bio5 | Hottest Month Maximum Temperature | 0.9 | 1.8 |
| bio3 | isothermal | 0.9 | 0 |
| Slope | elevation | 0.7 | 3.5 |
| bio8 | Average | 0.3 | 1.9 |
In summary, the response curves for the four main ecological factors influencing Ginkgo's suitable areas are shown in Figure 3. Environmental factors corresponding to an existence probability ≥0.5 are considered thresholds for suitable species distribution. Based on the curves, these thresholds were: precipitation in the driest month (20-175 mm), minimum temperature in the coldest month (-4 °C to 3 °C), precipitation in the wettest season (450-2500 mm), and temperature seasonality deviation greater than 580 mm.
3.3. Potential Distribution Areas of Ginkgo Under Current Climatic Conditions
Under current climatic conditions (Figure 5), Ginkgo’s potential habitat is primarily concentrated in the Yangtze River Basin, particularly in the lower reaches. The total suitable area accounts for 24.2% of the total land area. The highly suitable area (P ≥ 0.48) covers 508,800 km2, or 21.9% of the total suitable area, and is concentrated in the junction of Hubei, Jiangxi, Henan, and Anhui provinces, as well as central Sichuan and northern Guangdong. The moderately suitable area (0.48 > P ≥ 0.27) covers 912,000 km2 (39.2% of the suitable area) and is scattered across central Hunan, north-central Anhui, and most of Sichuan. Low-suitability zones (0.27 > P ≥ 0.09) occupy 892,800 km2 (38.4%), primarily surrounding the medium and high-suitability zones, with concentrations in Yunnan, Guizhou, and Guangxi. Non-habitable areas are predominantly located in the northwest.
The variation in precipitation and temperature likely contributes to this distribution pattern. In northern regions, low annual precipitation and harsh winter temperatures (below -20 °C) hinder Ginkgo's long-term survival and root development.
Figure 4.
Potential geographic distribution of Ginkgo under historical climatic conditions. Note: The map is produced based on the standard map with review number GS (2019)1822 downloaded from the standard map service website of the State Administration of Surveying, Mapping and Geoinformation, and there is no modification to the base map.
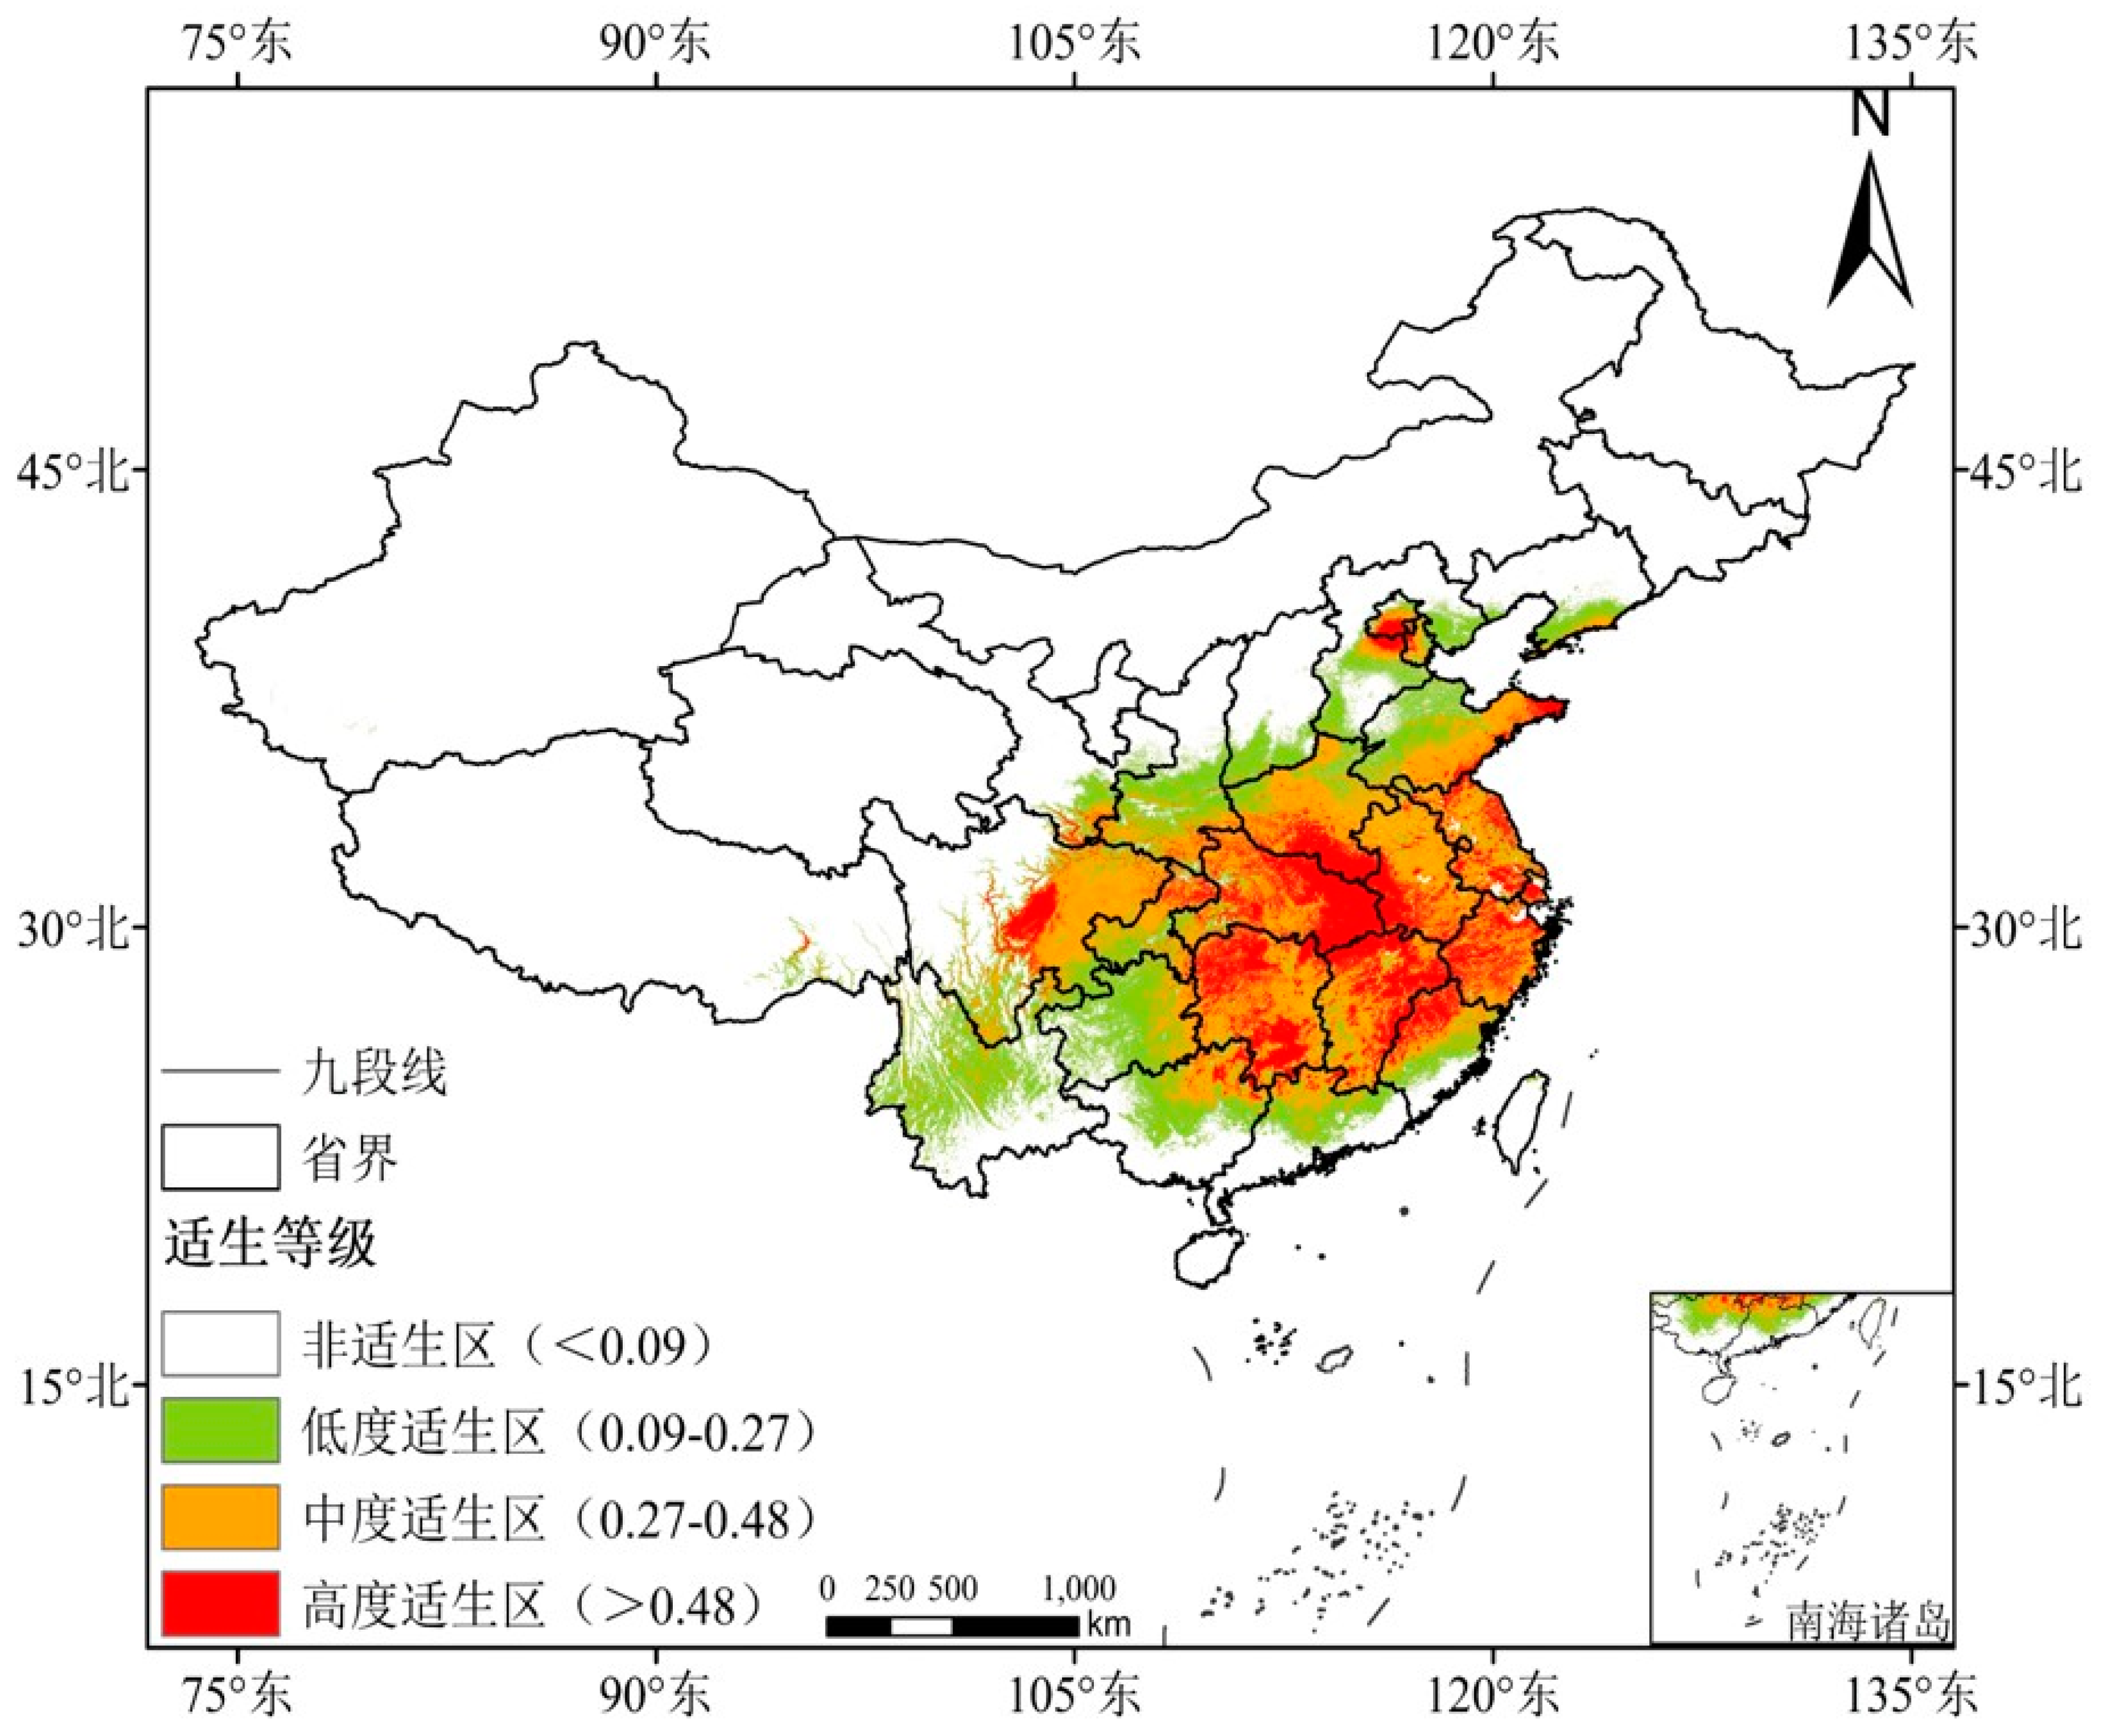
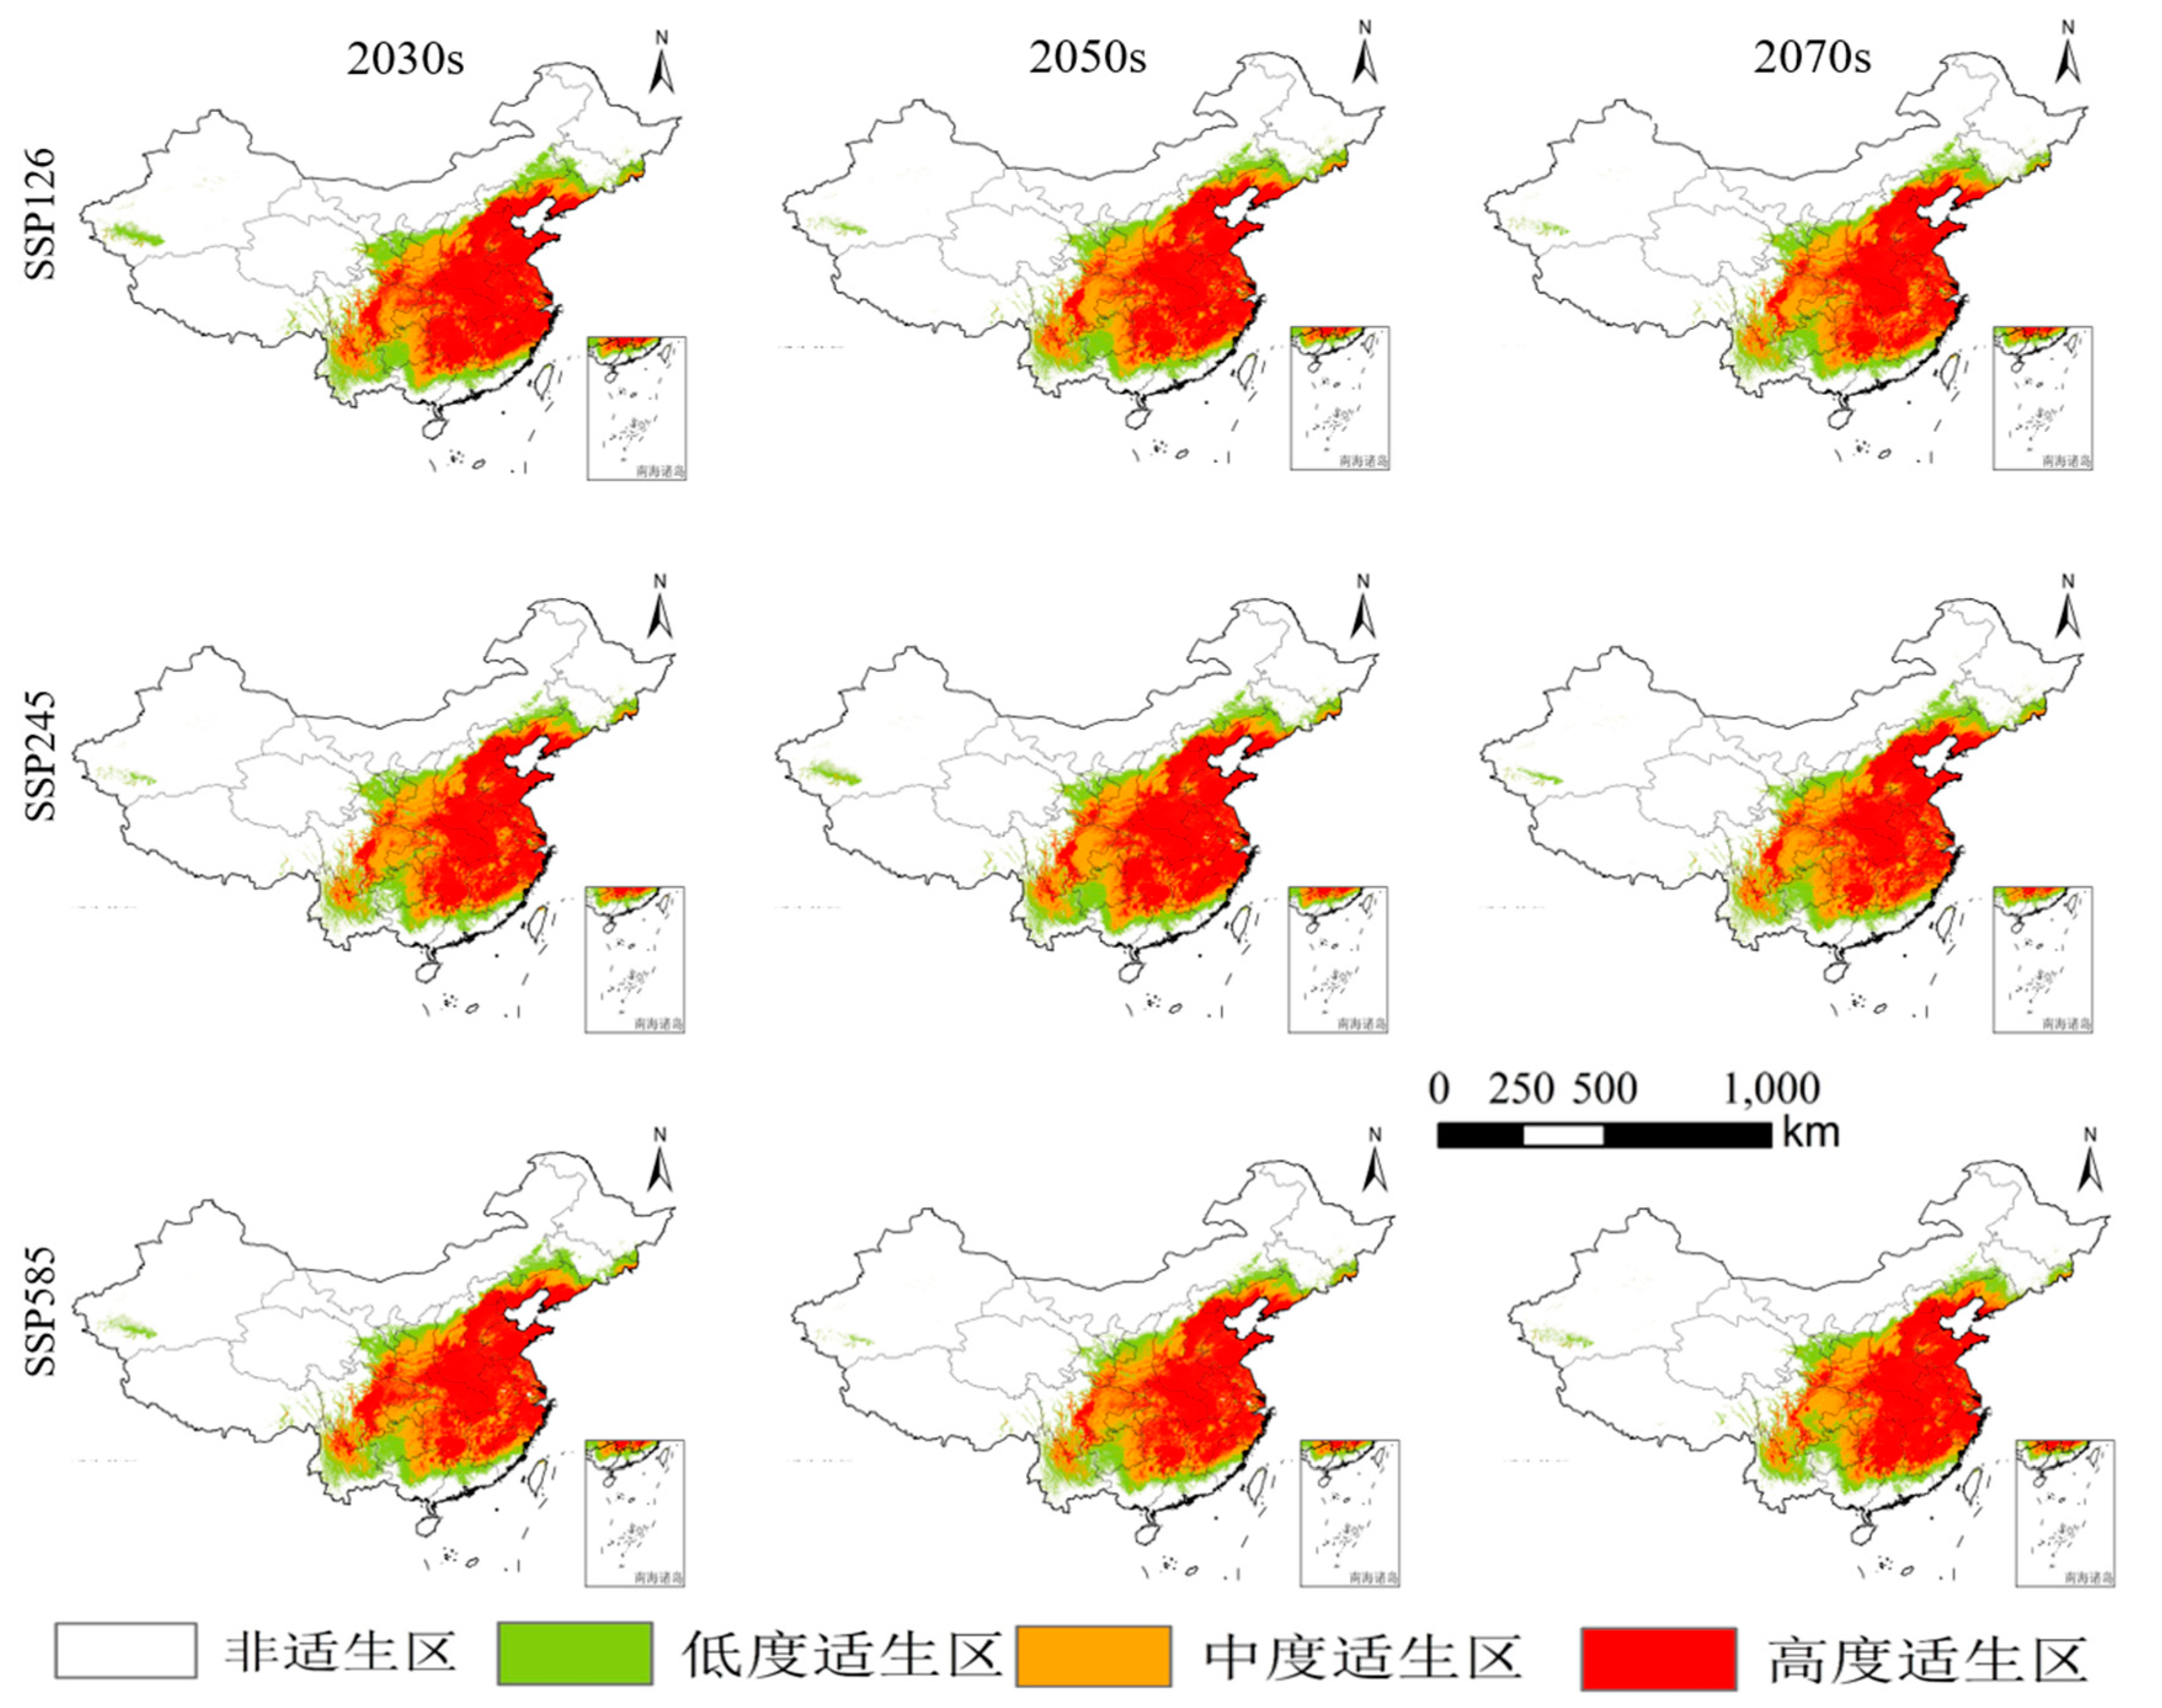
Figure 5.
Distribution range of potential suitable areas for Ginkgo in China under future climate scenarios.
Figure 5.
Distribution range of potential suitable areas for Ginkgo in China under future climate scenarios.
3.4. Modeling of Potential Future Ginkgo Habitat Areas
Simulations of future climate scenarios under three shared socio-economic pathways yielded nine potential distribution models for three time periods. The average AUC values of all models exceeded 0.9, confirming the model’s validity. As shown in Figure 6, the area of suitable zones fluctuates under different scenarios (Table 3), with moderate-suitability zones changing little. However, highly suitable areas are predicted to increase dramatically, becoming 2-3 times larger than they are under current conditions. The distribution of highly suitable areas is expected to concentrate and spread northward toward the lower Yellow River. From 2021 to 2040, under scenarios SSP126, SSP245, and SSP585, highly suitable areas are predicted to decrease by 105,600 km2. The largest total suitable area (3.312 million km2) is predicted for SSP126 from 2021 to 2041, while the smallest increase (2.9664 million km2) is expected for SSP585 from 2041 to 2060. Over the next 60 years, the total suitable area is projected to follow the trend SSP126 > SSP245 > SSP585.
3.5. Center-of-Mass Migration in Potential Habitat Areas
The centers of the aptitude zones for different periods are represented by their centers of mass. By comparing the positions of these centers in future climatic conditions with their positions in the current climate, the overall trend of the aptitude zones can be demonstrated more intuitively. While the migration distances of the Ginkgo habitat vary, the overall trend remains the same (Figure 5), showing a clear northward migration. The center of mass of the current Ginkgo habitat is located in Yichang City, Hubei Province (111°92′E, 30°57′N). In the SSP126 and SSP245 scenarios for the 2070s, the center of mass moves to Xiangfan City, Hubei Province (111°96′E, 32°22′N and 111°42′E, 31°84′N, respectively). Under the SSP585 scenario for the 2070s, it shifts to Shiyan City, Hubei Province (110°89′E, 32°54′N), which will become the most suitable area for Ginkgo in future climatic conditions. This northward migration of the center of mass indicates that Ginkgo biloba strongly responds to temperature changes. Although the migration paths in different scenarios vary, the general trend during 2021-2040 shows a significant northward shift, and by 2041-2060, the SSP245 scenario shows the farthest northward migration.
Table 4.
Longitude and latitude of the center of mass of Ginkgo biloba distribution at different stages.
Table 4.
Longitude and latitude of the center of mass of Ginkgo biloba distribution at different stages.
| Period | current | 2030s | 2050s | 2070s | ||||||
| SSP126 | SSP245 | SSP585 | SSP126 | SSP245 | SSP585 | SSP126 | SSP245 | SSP585 | ||
| Longitud | 111.92 | 109.14 | 109.85 | 110.96 | 109.56 | 111.12 | 111.23 | 111.89 | 11.42 | 110.89 |
| Latitude | 30.57 | 31.81 | 31.94 | 31.98 | 31.66 | 32.71 | 31.37 | 32.22 | 31.84 | 32.54 |
4. Discussion
4.1. Key Environmental Variables Affecting Ginkgo Distribution
The geographic distribution of plants on a regional scale is influenced by various environmental factors, with hydrothermal conditions being the primary determinants of plant growth [20]. Precipitation and temperature effects vary greatly between species [21]. Through the analysis of each ecological factor’s contribution rate and the results of the Jackknife test, it was found that precipitation plays a greater role than temperature in determining Ginkgo’s distribution, with precipitation-related environmental variables contributing 52.5%. The precipitation in the driest season is the most critical factor [22]. For subtropical species like Ginkgo, low temperatures typically limit northern distribution [23]. Therefore, temperature conditions must be fully considered in the conservation and planting of Ginkgo biloba. Xiaoxia et al. [24], using the MaxEnt model, also found that precipitation had a greater influence than temperature in the potential distribution of yellow jackets in China. Topography also affects Ginkgo’s distribution, with topography-related environmental variables contributing 8.6%. Lower altitudes are more favorable for Ginkgo growth [25], likely due to higher oxygen levels and other resources available at lower elevations. Generally, slopes less than 15° offer fertile, well-drained soil conducive to plant growth. Northern regions, which experience lower annual precipitation and winter temperatures often below -20 °C, are less suitable for Ginkgo’s long-term survival and root growth.
4.2. Changes in Potential Suitable Areas for Ginkgo in China Under Climate Change
Regional climate models project that temperature bands will shift northward in the future, with the most significant movements occurring along the northern boundaries of subtropical, warm, and highland temperate zones [26]. Under climate change, many species are expected to migrate to higher latitudes or altitudes [27]. For instance, species like Chinese cherry (Prunus pseudocerasus [28]) and Gymnadenia conopsea [29] are predicted to experience range contractions and northward migrations. However, a few species, such as Podocarpus neriifolius [30] and Quercus alpina, may adapt to these changes and expand their habitats. In this study, MaxEnt predicted that Ginkgo biloba’s suitable habitat will expand under future climate scenarios, with habitats shifting to higher latitudes and altitudes [31]. This expansion, particularly under the SSP585 scenario, may be driven by increased precipitation. Chen et al. [32] also demonstrated that Ginkgo’s suitable areas will move to higher latitudes under future climate conditions, aligning with this study's predictions.
4.3. Accuracy of Simulation Results
The MaxEnt model typically retains a random subset of data for modeling and uses the AUC value to evaluate predictive performance. While this method can effectively test prediction accuracy, model results may be affected by sampling bias and parameter settings [33], which can cause overfitting. First, AUC values can overestimate model performance if training and test data are influenced by sampling bias. Second, the complexity of the MaxEnt model, as a machine learning model, can result in overfitting during species distribution modeling, affecting the accuracy of results. Although many studies have successfully used the MaxEnt model for species distribution [34] predictions, some have not adequately addressed overfitting issues, limiting their models’ generalization abilities [35]. Model complexity can be managed by adjusting the RM and selecting appropriate feature combinations using AICc. In this study, the spatial sparsity tool, Pearson correlation coefficient, and kuenm package were used to select the best MaxEnt model, minimizing overfitting. The results showed that RM=3.2 and FC=LHP had the lowest overfitting and improved model confidence. After reconstructing the model using these optimized parameters [36], predictions of Ginkgo habitat for different periods were obtained, yielding better prediction accuracy than using default parameters [37].
5. Conclusion
This study modeled the spatial distribution of suitable areas for Ginkgo biloba in China under current climate conditions and three future emission scenarios (SSP126, SSP245, and SSP585), with the following conclusions:
(1) Precipitation and temperature are key environmental factors influencing Ginkgo distribution. Precipitation in the driest month, minimum temperature in the coldest month, precipitation in the hottest quarter, and seasonal temperature variation are the dominant factors. The thresholds for suitable growth conditions are: 20-175 mm precipitation, -4 °C to 3 °C minimum temperature, 450-2500 mm precipitation in the wettest quarter, and >580 mm temperature variation. Ginkgo's suitable areas are primarily located in southern China, particularly along the middle and lower reaches of the Yangtze River.
(2) Under future climate scenarios, Ginkgo’s suitable distribution areas will expand. By the 2070s, the suitable area under the green development model (SSP126) will be larger than under the medium-emission scenario (SSP245) and high-emission scenario (SSP585). As temperatures rise, Ginkgo’s suitable distribution will shift to higher latitudes.
(3) Limitations of this study: First, the selection of environmental factors—Ginkgo's distribution and suitability are influenced by many complex factors, such as land use, human interference, and species interactions, which were not fully accounted for in this study. Only 22 environmental factors were considered. Second, the precision and stability of the MaxEnt model are affected by sample size. While increasing sample size can stabilize AUC values and reduce standard deviations, it may also cause overfitting. Selecting an appropriate sample size can improve model accuracy.
Author Contributions
Conceptualization, Xiaohuang LIU and Peng SHI; methodology, Jiufen LIU; software, Shenglin LI; writing—original draft preparation, Shenglin LI; writing—review and editing, Shenglin LI; visualization, Ping ZHU and Run LIU; supervision, Liyuan XING. All authors have read and agreed to the published version of the manuscript.
Funding
Special Funds Projects for Basic Scientific Research Business Expenses of Chinese Academy of Geological Sciences (Grant No. JKYQN202362); Key Laboratory of Eco-geochemistry, Ministry of Natural Resources (No.ZSDHJJ202303); This work was supported by Open Foundation of the Key Laboratory of Natural Resource Coupling Process and Effects (Grant ZH-2023-003).
Data Availability Statement
The authors will supply the relevant data in response to reasonable requests. If anyone wants to get data from this study, they can contact the first author, Shenglin Li (Lsl010909@163.com).
Conflicts of Interest
The authors declare no conflicts of interest.
References
- Huiming, Y. Technical points of ginkgo seedling cultivation and control of common pests and diseases. South. Agric. 2022, 16, 63–65. [Google Scholar]
- Yan, H.; Jing, Z. Observation on the efficacy and safety of Ginkgo biloba extract tablets combined with butylphthalide soft capsule in Alzheimer’s disease. Chin. Med. Pharmacol. Clin. 2017, 33, 196–199. [Google Scholar]
- YAO, Hai-boat; LUO, Coltan; ZHANG, Li-huan. Clinical observation on the treatment of carotid atherosclerosis with Ginkgo biloba combined with simvastatin. Chin. J. Trad. Chin. Med. 2021, 39, 252–254. [Google Scholar]
- Yidan, Y.U.L.; Yangchun, X.; Ningbin, J.; Qin, H.E.; Yao, T.; Yang, L.; Rongling, Y. Insecticidal activity of Ginkgo biloba exocarp and Ginkgo biloba leaf extracts and their composites against the cabbage moth. Nat. Prod. Res. Dev. 2020, 32, 1747–1753. [Google Scholar]
- Congcong, G.; Jun, L.; Shuai, L.; Xiaoman, L.; Xiaohui, L. Management techniques of high quality ginkgo cultivation. Fruit Farmer’s Friend 2024, 08, 63–65. [Google Scholar]
- Skendžić, S.; Zovko, M.; Živković, I.P.; Lešić, V.; Lemić, D. The impact of climate change on agricultural insect pests. Insects 2021, 12. [Google Scholar] [CrossRef]
- Chen, I.C.; Hill, J.K.; Ohlemüller, R.; Roy, D.B.; Thomas, C.D. Rapid range shifts of species associated with high levels of climate warming. Science 2011, 333, 1024–1026. [Google Scholar] [CrossRef]
- Gibson, L.; Lee, T.M.; Koh, L.P.; Brook, B.W.; Gardner, T.A.; Barlow, J.; Peres, C.A.; Bradshaw, C.J.A.; Laurance, W.F.; Lovejoy, T.E.; Sodhi, N.S. Primary forests are irreplaceable for sustaining tropical biodiversity. Nature 2011, 478, 378–381. [Google Scholar] [CrossRef] [PubMed]
- Aijun, W.; Dongye, L.U.; Guosheng, Z.; Haiguang, H.; Ying, W. HUsleng, Ao Min. MaxEnt-based simulation of potential distribution of forked cypress under climate change in Eurasia. Forest Sci. 2021, 57, 43–55. [Google Scholar]
- Guowei, W.; Qiuliang, H.; Zengwei, L.U.; Wenfeng, L.; Chenyang, S.; Xiaoru, Z.; Tianyu, J.; Dongfeng, Z. Potential geographic distribution and ecological suitability of wood sorrel under climate change scenarios. J. Ecol. 2023, 43, 6617–6626. [Google Scholar]
- Xiaofan, W.; Yuxuan, D.; Lulu, J.; Chongyun, W.; Mingchun, P.; Yun, L.I.; Xuhong, W.; Yunfei, M.A. Optimization-based MaxEnt model to predict the historical, current and future distributional changes of alpine oak group plants in China. J. Ecol. 2023, 16, 1–15. [Google Scholar]
- Gelviz-Gelvez, S.M.; Pavón, N.P.; Illoldi-Rangel, P.; Ballesteros-Barrera, C. Ecological niche modeling under climate change to select shrubs for ecological restoration in Central Mexico. Ecol. Eng. 2015, 74, 302–309. [Google Scholar] [CrossRef]
- Yang, L.; Li, H.; Li, Q.; Guo, Q.; Li, J. Genetic diversity analysis and potential distribution prediction of Sophora moorcroftiana endemic to Qinghai-Tibet Plateau, China. Forests 2021, 12. [Google Scholar] [CrossRef]
- Ghosh, B.G.; Garai, S.; Rahaman, S.M.; Khatun, M.; Mohammad, N.; Mishra, Y.; Ranjan, A.; Tiwari, S. Assessing potential habitat distribution range of the endangered tree species Pterocarpus marsupium Roxb. under the climate change scenario in India. Trees Forests People 2021, 6, 100124. [Google Scholar] [CrossRef]
- Jianhua, X.; Xin, D.; Chaonan, C.A.I.; Canyu, Z.; Xiaoyan, Z.; Lang, L.I.; Jie, L.I. Geographic distribution of Minnan (Phoebe bournei, Lauraceae) and simulation of distribution pattern with climate change. J. Ecol. 2021, 41, 5703–5712. [Google Scholar]
- Lingxiao, Y.; Ye, L.I.U.; Shaotian, C.; Zehao, S. Simulation of the potential distribution pattern of Qingxiangmu in Southwest China under climate change scenarios based on the maximum entropy model. Biodiversity 2016, 24, 453–461. [Google Scholar]
- Meng, X.; Xuexing, Z.; Yan, L.; Yongpeng, M.; Wei, L.; Linxiang, Y.; Wen, L.; Peixian, Z.; Zhenghong, L.; Hong, M. Selection of suitable tree species for dry and hot river valleys in Yunnan based on MaxEnt model. J. Ecol. 2024, 44, 3689–3707. [Google Scholar]
- Weng, Y.W.; Tsai, W.J.; Wang, C.C. Application and outlook of shared socioeconomic pathways (SSPs). Adv. Clim. Change Res. 2020, 16, 215–222. [Google Scholar]
- Lihui, M.; Yao, L.I.; Chang, L.I.U.; Yanming, F. Predicting the potential distribution area of fine-leaved pinniped moss in China based on MaxEnt model. J. Ecol. 2017, 36, 54–60. [Google Scholar]
- Hong, Y.; Jingjing, D.; Tong, W.U.; Huajin, Z.; Jie, C.; Meng, L.I.; Xianrong, W.; Xiangui, Y.I. Prediction of potential habitat of spring cherry based on MaxEnt model. J. Nanjing Univ. (Nat. Sci. Ed.) 2023, 47, 131–138. [Google Scholar]
- Zeyi, O.; Zhihui, L.; Long, O.S.; Yong, C.; Zhichun, Z.; Jiyou, W. Maxent and ArcGIS-based prediction of the potential habitat areas of the red-barked cycads in China. J. Central S. Univ. For. Sci. Technol. 2023, 43, 19–26. [Google Scholar]
- Feilong, G.; Gangbiao, X.U.; Mengzhu, L.U.; Yihong, M.; Chengzhi, Y.; Kaiqi, G. Analysis of potential suitable distribution areas of poplar based on MaxEnt model. For. Sci. 2020, 56, 184–192. [Google Scholar]
- Yiqin, X.U.; Weijian, W.; Xiequan, L.; Yuxin, G.; Yuru, P.A.N.; Xiaoxing, Z. MaxEnt modeling to predict the potential geographic distribution of Toona sinensis in China under climate change. J. Northeast For. Univ. 2024, 52, 47–51. [Google Scholar]
- Xiaoxia, N.; Huaying, Y.; Yingying, X.; Panyu, Y.; Qiwei, Z. Analysis of potential suitable habitat changes of Chinese yellow fir based on Maxent model. J. Guangxi Norm. Univ. (Natural Science Edition) 1–12.
- Liang, L.I.; Li, W.; Xin, W.; Zhiyuan, M. Analyzing the effect of altitude gradient on plant growth and development. Protective Forest Sci. Technol. 2016, 05, 67–68. [Google Scholar]
- Lei, W.; Zhang Baichao, Q.I.N.G.; Zhenyu, H.; Bo, L.U. Interpretation of the main findings of the IPCC. Prog. Clim. Change Res. 2022, 18, 389–394. [Google Scholar]
- Fuxiang, C.; Qingjun, X.; Shoujin, C.; Jiangxue, L.; Chengjing, Q. Progress on the impact of global warming on species distribution. J. Central S. Univ. For. Sci. Technol. 2008, 28, 86–89. [Google Scholar]
- Chen-Long, F.; Meng, L.; Chang-Fen, T.; Yan-Feng, S.; Xian-Gui, Y.; Xian-Rong, W. Prediction of potential habitat of Chinese cherry under four climate change scenarios. J. Nanjing For. Univ. (Nat. Sci. Ed.) 2024, 48, 235–242. [Google Scholar]
- Chasuna, Q.; Hongxia, H.; Alatan Cumbur, Y.; Ouoliji, B.J.; Ujisguleng, C. Prediction of potential habitat of the endangered medicinal plant panax ginseng in China under climate change. J. Appl. Ecol. 2024, 1–12. [Google Scholar]
- Futaki, L.; Rui, L.; Changle, M.; Jianxin, Y.; Lijuan, W.; Yong, C.; Yongyu, S. Prediction of the potential habitat of Hundred Days’ Green in China under climate change scenarios. West. For. Sci. 2024, 53, 38–44. [Google Scholar]
- Xiaofan, W.; Yuxuan, D.; Lulu, J.; Chongyun, W.; Mingchun, P.; Yun, L.I.; Xuhong, W.; Yunfei, M.A. Optimization-based maximum entropy model for predicting historical, current and future distributional changes of the alpine oak group of plants in China. J. Ecol. 2023, 43, 6590–6604. [Google Scholar]
- Meilin, C.; Hairong, H. Response of four common tree species in the loess plateau region to climate change. J. Beijing For. Univ. 2023, 45, 21–33. [Google Scholar]
- Xingwang, Z.; Yao, L.I.; Yanping, X.; Xianming, B.; Yanming, F. Impact of climate change on the potential geographic distribution of Huangshan rowan. J. Plant Resour. Environ. 2018, 27, 31–41. [Google Scholar]
- Cangbai, L.I.; Keyan, X.; Nan, L.I.; Xianglong, S.; Shuai, Z.; Kai, W.; Wenkai, C.; Rui, C.A.O. A comparative study of support vector machine, random forest and artificial neural network machine learning algorithms in geochemical anomaly information extraction. Earth J. 2020, 41, 309–319. [Google Scholar]
- Merow, C.; Smith, M.J.; Silander, J.A., Jr. A practical guide to MaxEnt for modeling species’ distributions: what it does, and why inputs and settings matter. Ecography 2013, 36, 1058–1069. [Google Scholar] [CrossRef]
- Li, Y.; Li, M.; Li, C.; Liu, Z. Optimized Maxent model predictions of climate change impacts on the suitable distribution of Cunninghamia lanceolata in China. Forests 2020, 11. [Google Scholar] [CrossRef]
- Fuyin, G.; Xiaohuang, L.; Xiaofeng, Z.; Baimaiti, Z.; Yugang, W.; Tao, L.I.N.; Chuanyan, Z.; Liyuan, X.; Ran, W.; Honghui, Z.; Chao, W.; Zhiluo, Z.; Yibo, X.U. Impacts of climate change and human activities on saline vegetation-an example of tamarisk. Geol. China 1–16.
Figure 1.
Spatial autocorrelation of environmental variables.

Figure 3.
Response curves of major ecological factors (a) Precipitation in the driest month (b) Minimum temperature in the coldest month (c) Precipitation in the wettest season (d) Deviation from seasonal variation in temperature.
Figure 3.
Response curves of major ecological factors (a) Precipitation in the driest month (b) Minimum temperature in the coldest month (c) Precipitation in the wettest season (d) Deviation from seasonal variation in temperature.
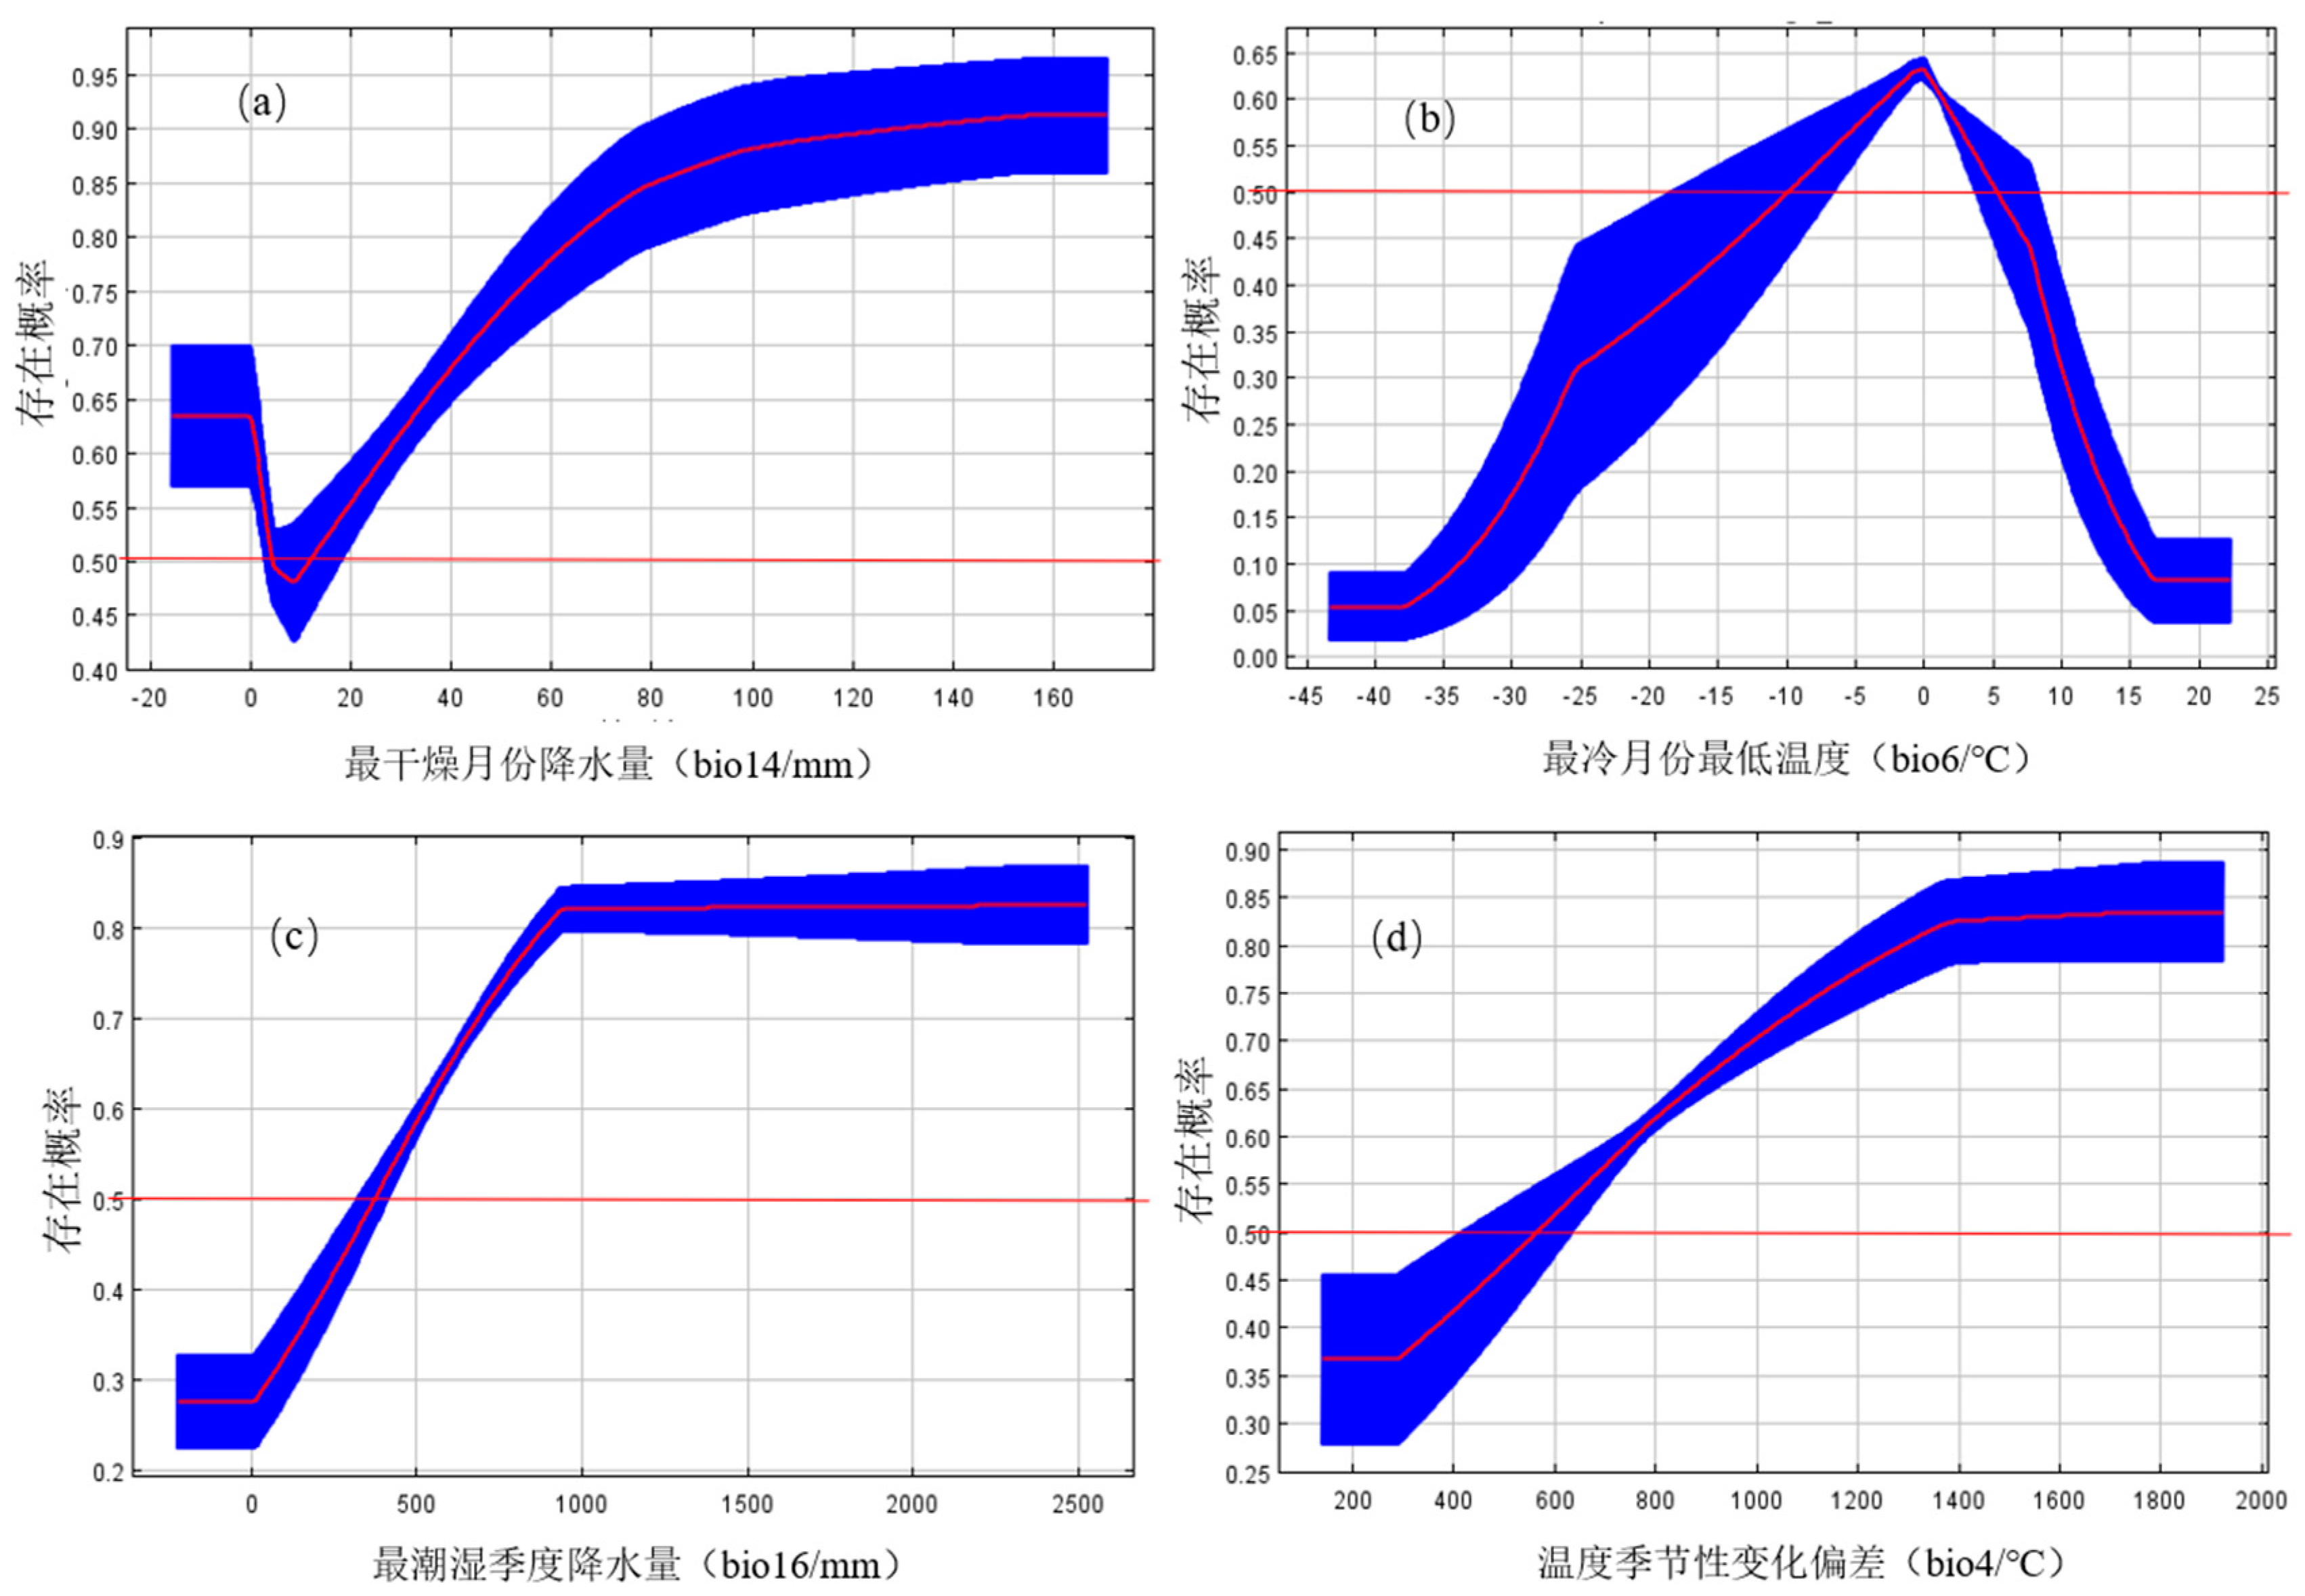
Figure 6.
Centroid migration route of suitable areas of Ginkgo biloba under different climatic conditions.
Figure 6.
Centroid migration route of suitable areas of Ginkgo biloba under different climatic conditions.
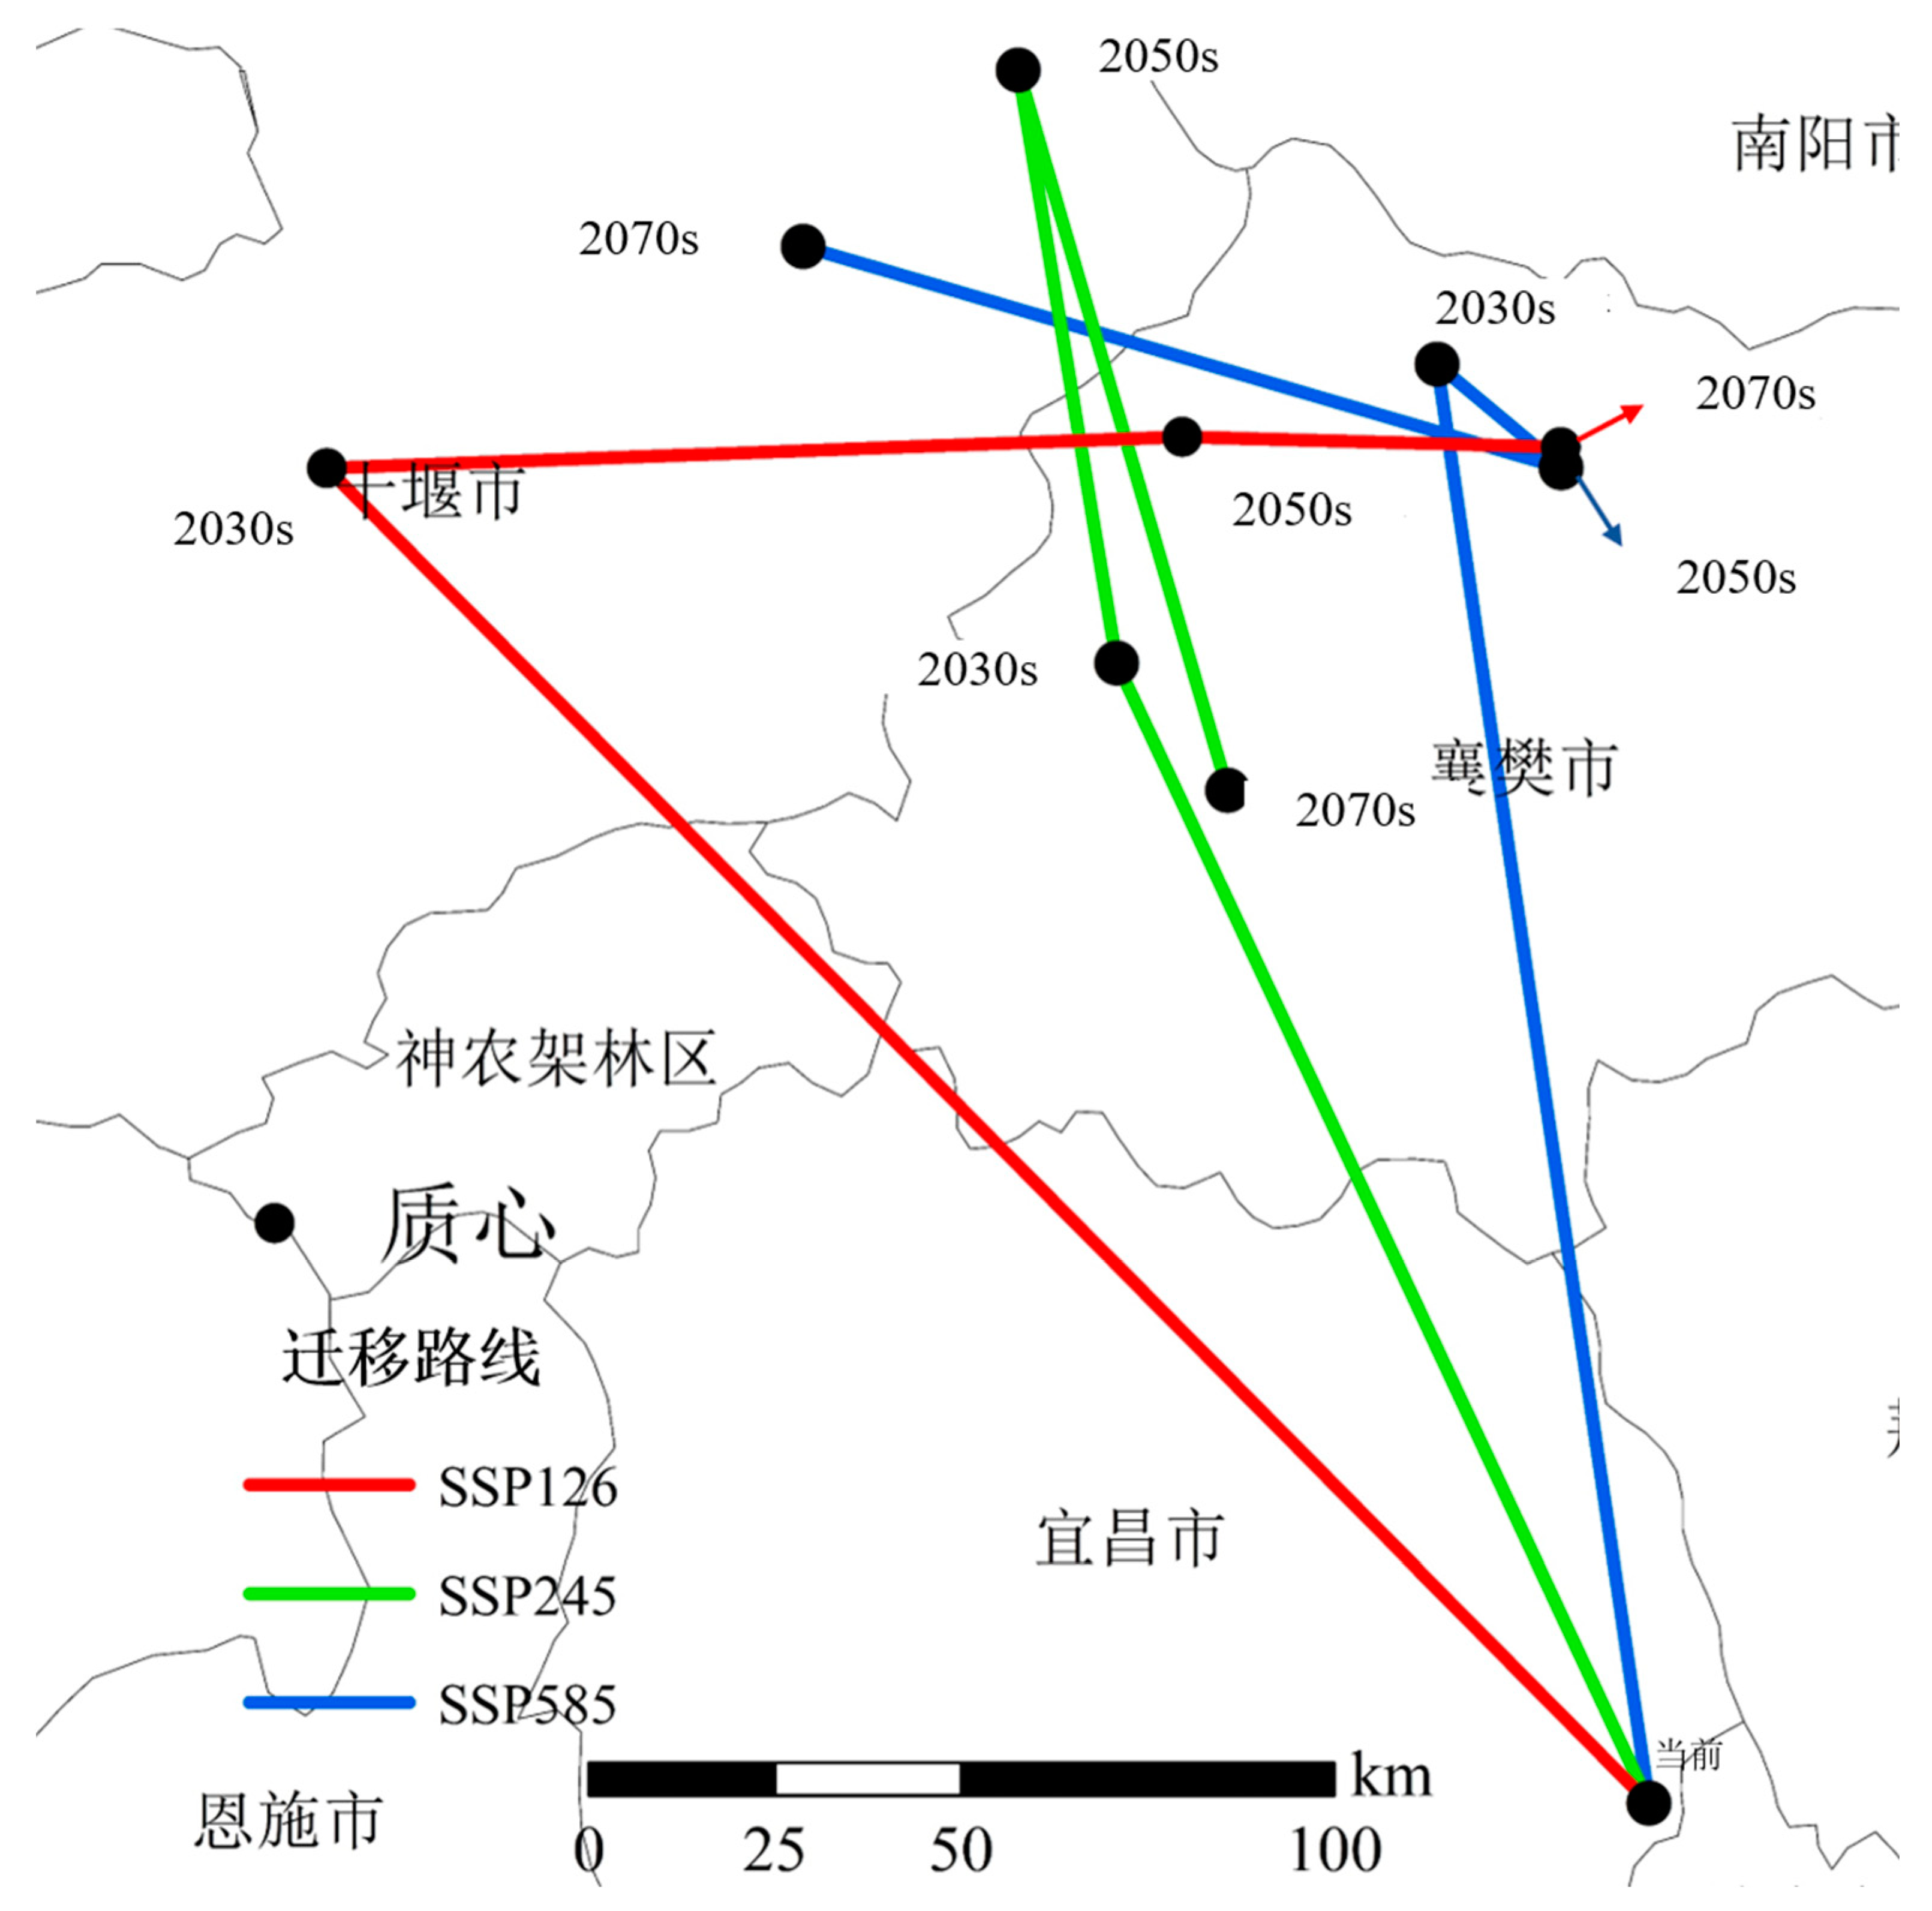
Table 1.
Screening of climatic variables influencing the distribution of Ginkgo biloba.
| coding | variant | unit (of measure) | Is it used for modeling |
| bio_1 | average annual temperature | °C | clogged |
| bio_2 | Annual average daily difference | °C | be |
| bio_3 | isothermal | °C | be |
| bio_4 | Deviation from seasonal variation in temperature | / | be |
| bio_5 | Hottest Month Maximum Temperature | °C | be |
| bio_6 | Minimum temperature in the coldest month | °C | be |
| bio_7 | Annual difference in temperature | °C | clogged |
| bio_8 | Average temperature during the wettest season | °C | be |
| bio_9 | Average temperature during the driest season | °C | clogged |
| bio_10 | Average temperature of the hottest quarter | °C | clogged |
| bio_11 | Average temperature of the coldest quarter | °C | clogged |
| bio_12 | Annual precipitation | mm | clogged |
| bio_13 | Precipitation in the wettest month | mm | clogged |
| bio_14 | Precipitation in the driest month | mm | be |
| bio_15 | Seasonal coefficient of variation of precipitation | / | be |
| bio_16 | Wettest quarterly precipitation | mm | be |
| bio_17 | Precipitation in the driest quarter | mm | clogged |
| bio_18 | Precipitation in the hottest quarter | mm | clogged |
| bio_19 | Coldest quarterly precipitation | mm | clogged |
| DEM | height above sea level | m | be |
| Slope | elevation | % | be |
| Aspect | slope direction | / | clogged |
Table 3.
Proportion of potential suitable area of Ginkgo biloba in China under future climate scenarios/%.
Table 3.
Proportion of potential suitable area of Ginkgo biloba in China under future climate scenarios/%.
| Climatic context | age | high habitability zone | mesophilic zone | area of low habitat | non-migratory zone |
| modernity | modernity | 5.3 | 9.5 | 9.3 | 75.8 |
| ssp126 | 2021-2040 | 16.7 | 8.9 | 8.9 | 65.5 |
| 2041-2060 | 15.2 | 9.3 | 8.3 | 67.2 | |
| 2061-2080 | 14.1 | 9.4 | 8.6 | 67.9 | |
| ssp245 | 2021-2040 | 14.1 | 9.1 | 8.1 | 68.7 |
| 2041-2060 | 15.8 | 9.1 | 8.2 | 66.9 | |
| 2061-2080 | 13.9 | 9.7 | 8.4 | 68 | |
| ssp585 | 2021-2040 | 15 | 9.1 | 8.7 | 67.2 |
| 2041-2060 | 13.9 | 9.1 | 7.9 | 69.1 | |
| 2061-2080 | 14.4 | 8.7 | 8 | 68.9 |
Disclaimer/Publisher’s Note: The statements, opinions and data contained in all publications are solely those of the individual author(s) and contributor(s) and not of MDPI and/or the editor(s). MDPI and/or the editor(s) disclaim responsibility for any injury to people or property resulting from any ideas, methods, instructions or products referred to in the content. |
© 2024 by the authors. Licensee MDPI, Basel, Switzerland. This article is an open access article distributed under the terms and conditions of the Creative Commons Attribution (CC BY) license (http://creativecommons.org/licenses/by/4.0/).
Copyright: This open access article is published under a Creative Commons CC BY 4.0 license, which permit the free download, distribution, and reuse, provided that the author and preprint are cited in any reuse.


