
Submitted:
18 November 2024
Posted:
19 November 2024
You are already at the latest version
Abstract
This article analyzes the settlement of Haitians and Jamaicans at the state, county, and census tract levels in the two main population centers for these two groups: New York and Miami metropolitan areas. The authors pose the question of whether Haitians and Jamaicans fundamentally differ from African Americans in terms of settlement and socio-economic status. It is established that these two population groups are highly concentrated on a nationwide scale (in the states of Florida and New York) and in some counties (comprising metropolitan areas of New York and Miami). The authors carried out a spatial correlation analysis to identify areas of concentration of Haitians and Jamaicans in the two above-mentioned metropolitan areas. Three distinct Haitian areas, three mixed Haitian/Jamaican, and one distinct Jamaican area are found in New York. In the Miami metropolitan area, three Haitian/Jamaican areas are identified, as well as one Haitian area. The calculation of the Darden–Kamel Composite Socio-Economic Index was used to assess the socio-economic status of these areas and draw a comparison with the concentration of African Americans in these areas. The analysis revealed that the areas of concentration of Haitians and Jamaicans are relatively disadvantaged in their socio-economic status, but to a lesser extent than those of African Americans. The study also established the following pattern: in the New York metropolitan area, the higher socio-economic status is in the mixed Haitian/Jamaican areas of concentration in the central city, while in Miami, it is observed in the Jamaican areas in the suburbs.
Keywords:
Haitians
; Jamaicans
; USA
; spatial concentration
; socio-economic status
; settlement
1. Introduction
When studying individual ethnic groups in the U.S. population, one should take into account ethnoracial context. Therefore, before proceeding to the statement of the problem, which a geographical study may solve, we should clarify the ethnic and racial categories surrounding Haitians and Jamaicans in the United States. The division of the country’s society into racial groups implies the existence of the African Americans. The fact of belonging to this group, as well as to any other racial group, is determined during census by means of a survey. A respondent answers voluntarily, therefore attributing themselves to a certain racial group, which is considered racial self-identification. Studies of ethnic and racial composition of the U.S. population include one more form of self-identification—the language form—into the number of racial groups. This is allowed exclusively for the Spanish-speaking population, which is united into the racial group of Hispanics or Latin Americans [1].
This puts some groups of migrants in a marginal position, as they represent the Latin American region, but are not Spanish-speaking groups. Haitians and Jamaicans are among the largest groups in this category. The situation is further complicated by the fact that despite voluntarily choosing one’s racial group, attributing oneself to African Americans may or may not coincide with a societal perception of one’s race [2]. Perception of race (and some specific types of it, most notably colorism) can make a large contribution to the development of discriminatory practices [3,4,5,6,7].
Representatives of Haitian and Jamaican communities in the U.S. may attribute themselves to either African Americans or Latin Americans (even more so given that the latter ones split into White Hispanics and Black Hispanics in the detailed version of the census data). Therefore, it is important to understand which context to place these two groups in: African Americans or Hispanics. While the countries of Haiti and Jamaica undoubtedly belong to Latin America, migrants from these countries have an unclear status in the context of U.S. studies. On the one hand, they are most frequently included in the African American racial group. On the other hand, many studies emphasize the socio-economic and cultural differences between Black Caribbeans/African Caribbeans or West Indians and African migrants and U.S.-rooted African Americans. African Caribbeans are part of African American society as many people who identify themselves as African Americans have Caribbean roots [8]. New migrants, for example those arriving from Jamaica, are frequently included in the process of assimilation and transformation of their identity into African American one [9]. Historically, Afro-Caribbeans faced the same manifestations of racial discrimination including spatial segregation as African Americans of non-Caribbean descent [10].
At the same time, African Americans perceive Jamaicans and especially Haitians as migrants, that is, a group drastically different from them [11,12]. Jamaicans, Haitians as well as other migrant groups in the U.S., try to settle in a more compact way, primarily in the conducive environment of unprivileged districts of the country’s major cities [13]. The settlement of Haitians and Jamaicans proper is viewed by the researchers in the context of migration and diaspora studies [14,15,16,17], or together with that of migrants from the West Indies [11]. The authors concluded that Haitians and Jamaicans are heavily concentrated in the central cities of several major U.S. metropolitan areas, and their level of socio-economic well-being is substantially lower than the average. The settlement and socio-economic status of African Americans are in turn considered in tight connection with segregation issues. This situation was established at the dawn of quantitative sociology (the first example is the pioneering study by Du Bois [18] and was continued by the proponents of radical geography [19,20,21].
The main contribution into the development of methodologies for studying the settlement and socio-economic status of African Americans was made by Massey, Denton [22], Wilson [23] and Johnston et al. [24]. In most cases, they resorted to using different indices—dissimilation, concentration, centralization, and many other [25]. Even though African Americans are much more studied than Haitians and Jamaicans, it may be stated that many basic singularities of their settlement and socio-economic status are similar to one another. All the three groups—African Americans, Haitians, and Jamaicans—are highly urbanized, concentrated in space and relatively poor. Racial discrimination was historically a major factor that made an impact on the formation of these traits. As part of racist political practices (such as redlining) the ethnic identity of individual groups was not accounted for in any way, so migrants from Haiti and Jamaica found themselves in the same conditions as African Americans who were born in the U.S. This is another factor allowing us to study them in one and the same context.
Thus, the main research question of this study is what the settlement and socio-economic statuses of Haitians and Jamaicans have in common with African Americans and what differences they have. As these two ethnic groups were not directly analyzed using the means of quantitative socio-economic geography and quantitative sociology, the relevance of this study is also connected with filling the gap in this area of American studies. Thus, the main goal of this paper is to analyze the settlement patterns of Haitians and Jamaicans in the U.S. cities in the context of inequality and segregation studies as well as quantitative African American studies. By comparing these two ethnic groups to a much larger group of African Americans (which is, of course, wider than an ethnic group, being both a racial and a socio-economic group because of the tragic history of racial discrimination and artificial inequality), we can find out whether Haitians and Jamaicans can be analyzed as integral part of African American group, or they are more of an exception.
2. Materials and Methods
The data were mostly collected from American Community Survey for the years 2014 through 2018 conducted by the U.S. Census Bureau [26]. It contains tables with data on the respondents’ ancestry including the options “Haitian” and “Jamaican.” Notably, the perception of ancestry does not set a framework for migrant generations. A Jamaican person may perceive themselves as either having been born in Jamaica and not having U.S. citizenship or as a third-generation descendant of migrants. Therefore, the categories of “Haitian” and “Jamaican” in this context may be contrasted with the “African American” category as an ethnic rather than a racial self-identification option.
The socio-economic data are also contained in the American Community Survey. Below, as part of the methodology description, we will name the parameters collected from that source. It should be pointed out that the collection of data was conducted not directly on the Census Bureau website, but from the project website of the Minnesota Population Center at the University of Minnesota, NHGIS [27], as the latter accumulates the official Census Bureau’s data in a more convenient format.
Apart from the analysis of the size of Haitian and Jamaican population in the states and counties, an analysis was carried out on the level of census tracts (CT) in metropolitan areas with large Haitian and Jamaican communities. It was made in two stages:
- Identifying areas of concentration of Haitian and Jamaican population (as well as African Americans—for the purposes of comparison).
- Assessing their socio-economic status (also as compared to African Americans).
At the first stage, we applied the spatial correlation analysis algorithm. It was proposed by Luc Anselin based on the analysis of Local Spatial Autocorrelation [28]. Spatial autocorrelation is a quantitative relationship between the objects in question and the congruence of the values of certain parameters in them [29]. It may be positive (when neighboring objects have similar values) and negative (when neighboring objects have different values).
To assess the spatial autocorrelation, we need to calculate Moran’s I, which may be global or local. Global Moran’s I assesses spatial autocorrelation for the totality of the objects, while Local Moran’s I assesses each object individually. The Global I index was proposed by Patrick A. P. Moran in 1950 for biometric studies [30], while the Local I index was devised by Anselin in 1995 specifically for the analysis of ethnic group concentration [28].
If the analysis had used two parameters instead of one, such procedure may be called the spatial correlation analysis (in Anselin’s terms it is Bivariate Local Moran’s I). To conduct the spatial correlation analysis, we used Nearest Neighbor Analysis algorithm. It assumes the following formula:
where n is the number of census tracts, wij is the weighting matrix element, W is the sum of all wij, xi is the minority population in i, yj is the share of minority population in j, and is the mean share of minority population in all census tracts.
The spatial correlation analysis has an advantage over the spatial autocorrelation analysis in cases where the statistical data on a census tract were used. The use of two variables allows avoiding distortions connected with the engineering nature of the statistical-territorial division. For example, we often encounter a situation where on the border between the central city of the metro area and the suburbs a smaller-sized CT with a high population size borders a larger CT representing a smaller population. That said, the latter one may have an abnormally high proportion of the studied group. The bivariate analysis allows avoiding such outlying cases when identifying areas of concentration.
The analysis of spatial correlation was conducted using GeoDa, the specialized software developed by the team led by Anselin [31]. This program also allows doing an instant quantitative interpretation of the results obtained.
A shape file with spatial and statistical information on the census tract is imported into GeoDa, then a matrix of spatial weights is made. In the current study, the geographical proximity between census tracts was determined based on the queen contiguity rule, which means that census tracts with a shared border or an angular point were considered neighboring CTs. The queen contiguity rule is well-suited for a census tract grid with many right angles.
After the calculation of Local Moran’s I in this software, the LISA (Local Indicator Spatial Analysis) and the analysis of local indicators of spatial association were conducted. Every census tract that had at least one neighbor and whose Local Moran’s I value exceeds |0,05|, was attributed to one of the four clusters:
- HH (High-High) CT with a relatively high value of the independent variable neighboring a CT with a relatively high value of the dependent variable. Spatial autocorrelation is positive. These were designated as areas of concentration.
- HL (High-Low) CT with a relatively high value of the independent variable neighboring a CT with a relatively low value of the dependent variable. Spatial autocorrelation is negative.
- LL (Low-Low) CT with a relatively low value of the independent variable neighboring a CT with relatively low values of the dependent variable. Spatial autocorrelation is positive.
- LH (Low-High) CT with a relatively low value of the independent variable neighboring a CT with relatively high values of the dependent variable. Spatial autocorrelation is negative.
To assess the socio-economic status of the concentration areas we used the socio-economic status concept. This term has two basic definitions suggested by Villalba [32]:
- A construct reflecting the social and economic background of an individual or a group.
- A concept of a relative position in a certain social structure based on the assumption of a universally uneven status.
This study uses the second option. If we interpret it in terms of qualitative assessment, then this approach requires the comparison of community parameters with the mean values related to the overall structure. As of this study, the structure is the urban agglomeration, or to be more precise, its substitute—a metropolitan area, which is a totality of counties interconnected through economic and migration processes.
It is important to note here that it is not possible to single out “cognizant” communities, that is, social groups that are perceived (including spatially) by its representatives. In other words, we cannot single out vernacular districts and matching communities, while it is these categories (in a more mundane sense) that city dwellers operate. Therefore, the socio-economic status will be assessed for people who “randomly” found themselves to be on the premises of one territory—a census tract.
The socio-economic status may be assessed using different sets of indicators. Those include socialization parameters, the quality of housing and environment (including access to services), accumulation of capital (poverty) and income level, the level of education, employment, and job qualification. If we narrow this diversity down to specific categories, three of them are the ones that are accessed most frequently: income, education, and employment [33,34,35].
- Median household income, US dollars.
- Unemployment rate among the working population, %.
- Share of the population with incomes below the poverty level, %.
- The share of people with completed higher education (with a bachelor’s degree) among citizens over 25 years old, %.
- The share of those occupying managerial positions or employed in areas of intellectual work among the employed, %.
- Median house price, US dollars.
- Median cost of renting a house (including operating costs and utility bills), US dollars.
- Share of occupied (not abandoned) houses, %.
- Share of households with a car, %.
For each territorial entity the index is calculated as a sum of standardized values (z-score) of the above-mentioned indicators. Its explicit formula is missing in Darden’s and his co-authors’ publications, but it may easily be reconstructed:
where xi is the x value in census tract i, X is the mean x value, S is the standard mean deviation. The resulting values may be both positive and negative which reflects, respectively, the higher and the lower socio-economic status (SES).
Most of the studies devoted to the analysis of the socio-economic status of U.S. city districts use either one indicator (in most cases—the income level) or 2–3 indicators (poverty level and real estate value). This index allows assessing both the socio-economic characteristics (components 1, 2, 3, 6, 7, 8, 9) and institutional parameters (4, 5). Apart from that, some indicators pertain to society (1, 2, 3, 4, 5, 9), while others refer to the characteristics of the district itself (6, 7, 8). The accounting of such diverse indicators was not found in other relevant studies. Finally, unlike classical indices, it assumes any values, both positive and negative, rather than the values 0–1. This is considered optimal when calculating deviations from the norm, as the index of 0–1 values may even out vast disproportions that exist among the districts of American cities.
3. Results
In terms of the aggregate population size, the two groups under study are very similar. As of 2018, the U.S. had 1.02 million Haitians and 1.12 million Jamaicans. They live across all the country’s states, but in some of them their number does not exceed one thousand people, while other states concentrate considerable shares of these groups (see Figure 1 and Figure 2).
Almost half of all Haitians live in Florida, which is unsurprising. This state’s coast is located closer to Haiti than other U.S. territories, and political instability in the country has repeatedly led to large-scale waves of Haitian refugee migration [14]. Later, the diaspora grew in the logic of chain migration. It should be noted that other states with the most Haitian populations also have access to the Atlantic Ocean.
Immigration of Jamaicans went more smoothly than that of Haitians, without abrupt surges similar to those in the 1980s. In this case, New York and Florida are the leaders, but the Jamaican population is distributed among them almost evenly. The aggregate number of Jamaicans in these two states also exceeds half of the population of the entire group in the U.S.A. The differences in the composition of other leading states from the Haitian case are minimal: on the list we see Maryland instead of Massachusetts. Once again, all the states have access to the Atlantic.

Table 1.
Counties with the largest Haitian and Jamaican population. Compiled by the authors based on [26].
Table 1.
Counties with the largest Haitian and Jamaican population. Compiled by the authors based on [26].
| County | Haitian pop., thousand |
County | Jamaican pop., thousand |
| Broward, FL | 126.8 | Broward, FL | 114.4 |
| Miami-Dade, FL | 126.3 | Kings, NY | 84.1 |
| Palm Beach, FL | 85.2 | Queens, NY | 65.8 |
| Kings, NY | 75.6 | Bronx, NY | 65.2 |
| Orange, FL | 49.4 | Miami-Dade, FL | 37.0 |
| Queens, NY | 33.1 | Palm Beach, FL | 35.7 |
| Essex, NJ | 24.2 | Hartford, CT | 27.0 |
| Suffolk, MA | 24.1 | Westchester, NY | 26.9 |
| Nassau, NY | 23.3 | Nassau, NY | 22.2 |
| Middlesex, MA | 21.3 | Orange, FL | 21.3 |
All the countries from the two lists are united by a high degree of urbanization – they are located within the boundaries of large metropolitan areas. In both cases the leader is Broward County in South Florida, which is explained by the geographical proximity to the Caribbean Sea and an abundance of large cities. Almost on a par with it is Miami-Dade County where the principal international migration center of Florida and the entire American South—the city of Miami—is located. This county is Broward’s south neighbor. Overall, as was the case with the states, the groups of leading counties are hardly differentiated—the difference is only in the ranking position. Both lists include Florida’s counties of Palm Beach (together with Broward and Miami-Dade it makes up the Miami metro area) and Orange, the New York boroughs of Kings (Brooklyn) and Queens (both part of New York city) and Nassau County (part of New York metro area). Haitians are widely represented in Essex County (the State of New Jersey, New York metro area), while Jamaicans—in Westchester County (also New York metro area).
This means that a considerable part of Haitians and Jamaicans is concentrated in two agglomerations—New York and Miami. Indeed, the New York agglomeration has 235.7k Haitians (23% of all U.S. Haitians) and 348.2k Jamaicans (31.2% of all U.S. Jamaicans), while the Miami agglomeration has 338.2k (33%) and 187.1k (16.7%) respectively. In connection to such a substantial concentration of Haitians and Jamaicans in two agglomerations as well as in view of a large number of African Americans in them, the focus of further analysis of the socio-economic status of these two groups will be within the boundaries of the New York and Miami agglomerations.
Three forms of concentration can be singled out: only Haitians, only Jamaicans, and two groups simultaneously. Apart from that, to draw a comparison with African American districts we identified areas of concentration of African Americans that do not overlap with the concentration of Haitians and Jamaicans. As the analysis of the spatial concentration implies identifying local extremums not based on threshold values of population share, the shares of titular groups in all four areas of concentration should be considered (see Table 2).
As the analysis was performed using two variables, the areas of concentration included large CTs where the number of representatives of the groups under study is high, while the share is very low. In New York, the population of census tracts with 1% Haitians reaches 100 people, while in Miami, the population of census tracts with 1.4% Haitians is 102 people. That is, the aggregate population in such census tracts is almost 10k people (with the mean population density of census tracts being 4.4k people). It is noteworthy though that such cases are few (around 1% of the entire selection of census tracts that were among the areas of concentration). Also noteworthy is that both metropolitan areas had census tracts that were attributed to the areas of concentration of Haitians and Jamaicans, but were not attributed to African Americans. Figure 3 shows the areas of concentration of Haitians and Jamaicans in the New York metro area that have been identified through the analysis of spatial correlation.
Two large mixed Haitian/Jamaican areas are located within the city boundaries of New York—in the Kings (widely known as Brooklyn) and Queens counties. In the latter case, the mixed part of the area gravitates toward Elmont. Both areas are predominantly Jamaican. The Nassau Country also has such a Jamaican-dominated area. The homogenous areas, in turn, are located in other parts of the metropolitan area: fully Jamaican area on the border of Bronx and the city of Mount Vernon and fully (or almost fully) Haitian areas — in New York’s Rockland County and the New Jersey’s Essex County and Union. In all, we can single out seven areas of concentration of the two groups under study. Figure 4 demonstrates the concentration of Haitians and Jamaicans in the Miami metro area.
As is the case with New York, the areas have distinct enough borders and are distanced from one another. There are four of them: one is fully Haitian (in the cities of Delray Beach and Ocean Beach) and three are mixed ones. Let us point out that while the basis of mixed areas in New York is Jamaican communities, in Miami this function is performed by Haitian ones. This is caused by the sequence of migration waves: the Jamaican community of New York is “older” that the Haitian one, while the situation in Miami is different. When saying “in Miami” we need to make a caveat that we specifically mean the metro area, as the city of Miami is, geographically speaking, a periphery of its own agglomeration, its southern boundary. This also pertains to the agglomeration overall (the city is not even dominant in terms of population: of 6 million people, only 451 thousand reside in Miami) and to the areas of concentration. The latter ones cover the “central” city only slightly.
The detached nature of the established areas in Miami should be considered an interesting phenomenon. While New York has a distinct suburbia that starts on the outskirts of the central city, the Florida coast is a continued strap of highly urbanized territories with no distinct barriers between one another [36,37,38]. Despite this fact, as well as the relative nature of city boundaries, every area is located at a considerable distance from its neighbor. Only two northern areas will possibly merge in the coming decades.
We can talk about the detachedness of areas from each other, but in both cases, we see an active process of Haitian and Jamaican areas overlapping. This means that the Jamaican and Haitian communities do not always occupy isolated migrant quarters, yet this option is present too, more often so in the New York metro area [39]. Overall, the main bulk of both Haitian and Jamaican as well as mixed areas overlap with the territories with low racial diversity, populated predominantly by African Americans (the two groups in question being a part of them in terms of census data).
To identify how different the areas of concentration of Haitians and Jamaicans are from those of African Americans in the socio-economic respect, the results of the Composite Socio-Economic Index for four types of territories should be considered:
- Areas of concentration of Haitians.
- Areas of concentration of Jamaicans.
- Areas of concentration of Haitians and Jamaicans.
- Areas of concentration of African Americans.
The results of the calculation may be found in Table 3.
In all the four area types in both metropolitan areas, the Composite Socio-Economic Index assumes negative values, which means that, in general, Haitians, Jamaicans, and African Americans populate underprivileged districts. However, the indicators are substantially differentiated. In both metro areas, “younger” migrant communities—the Haitians of New York and the Jamaicans of Miami—live in more privileged areas than “older” communities and African Americans.
Mixed areas are of special interest. While Miami’s socio-economic status seems logical (as something in between Haitian and Jamaican areas), New York has an unexpectedly high Composite Socio-Economic Index. That said, the share of African Americans is incredibly high — 75.7% (which is 8–39 percentage points higher than in other identified types of areas in the two metropolitan areas). That means that in this case a high share of African Americans is not connected with socio-economic ill-being. Moreover, these areas are more prosperous than suburban ones, which is untypical in the U.S. This may testify to the fact that the suburbanization of Haitians and Jamaicans follows a scenario that is different from the suburbanization of white population as the socio-economic status of these two groups does not grow when they move to the suburbs. In Miami the situation gets reversed again. The most well-to-do areas are Jamaican concentration areas adjacent to mixed areas outside the central city of the metro area.
4. Discussion and Conclusions
The settlement of Haitians and Jamaicans has both notable similarities and differences from that of African Americans. In a sense, the settlement of Haitians and Jamaicans is a model of how African Americans could have settled if the U.S. history had not had a long period of slavery and, consequentially, extreme territorial concentration [40]. Having “skipped” that stage of settlement, Haitians and Jamaicans, just like African Americans, concentrated heavily in central cities of major metropolitan areas (that said, they are virtually not present in the Black Belt). The New York and Miami metro areas are by far the most populated ones in terms of the size of these two groups [39].
Akin to African Americans, Haitians and Jamaicans in the New York metro areas are inclined to suburbanization [41]. That said, this suburbanization may be considered not exactly “real” or even “fake,” as moving to the suburbs does not lead to a drastic change in the socio-economic status, which is the case under the “classical” scenario of white population suburbanization. In the Miami metro area, the situation is compounded by the fact that there is no suburbia there in the traditional American sense [42] —the local system of settlement is made of a narrow strap of cities and towns with no dominant ones (paradoxically, Miami is a periphery of its metro area), so instead of the suburbanization of Haitians and Jamaicans we can rather speak of the formation of several detached areas.
In the realm of socio-economic status lies the critical difference between Haitians, Jamaicans, and African Americans. The difference is that when they come to the U.S., they find themselves in an international setting of interracial relations instead of carrying the weight of discrimination that existed (and still exists in a certain, structural way) throughout the development of the American state. “Younger” groups—The Haitians of New York and the Jamaicans of Miami—reside in much more privileged neighborhoods as compared to the Jamaicans of New York and the Haitians of Miami who settled en masse in the second half of the 20th century when discrimination on the real estate market was a much more acute problem than it is today [43,44]. Similarly, less privileged are African American neighborhoods, most of which emerged on the sites of the old ghettos of the segregation age.
The study results in a conclusion that Haitians and Jamaicans are the “new type” of African Americans. Unburdened by settlement structure and the centuries-long legacy of socio-economic problems they find themselves nonetheless among underprivileged social strata (which sets them apart from many other migrant groups). However, as compared to the “native” African Americans, they have fewer problems in terms of integration into the U.S. economy and improvement of socio-economic standing, as they are not loaded with the negative social capital accumulated by African Americans in the age of slavery and segregation.
The results of our analysis contributed to a rich body of work on settlement patterns of ethnic and racial minorities in the U.S. and on inequality between non-white Americans and the average level of socio-economic status. The novelty of our approach is to consider two large Caribbean groups not as a part of African American community per sé, but as reference groups that are being analyzed in comparison with African Americans and the average level of socio-economic status in the selected cities.
However, our methodology has some evident limitations. First, we assume that African Americans are somewhat uniform groups in terms of their experience with inequality and systematic racism. This is not exactly true because of internal differentiation of African Americans as well as the variety of their socio-economic and geographic history (e.g., some African Americans were victims of discriminative practices in the U.S. for several generations, while other could have lived in Africa or Antilles before getting to the U.S. and had to deal with other discriminative and violent practices of the colonial rule). Second, we did not have enough space to make a deeper analysis of discriminatory rules that shaped settlement patterns of Haitians and Jamaicans. This is very important for possible future research of the subject because Caribbeans have experienced overlapping patterns of discrimination (being both a non-white minority and migrants), but in most cases without getting formally segregated (because there were very small Caribbean communities in the Jim Crow South).
Author Contributions
For research articles with several authors, a short paragraph specifying their individual contributions must be provided. The following statements should be used “Conceptualization, Ivan N. Alov; methodology, Ivan N. Alov; software, Ivan N. Alov; validation, Ivan N. Alov; formal analysis, Ivan N. Alov; investigation, Ivan N. Alov; resources, Ivan N. Alov; data curation, Ivan N. Alov; writing—original draft preparation, Ivan N. Alov; writing—review and editing, Marko D. Petrović; visualization, Ivan N. Alov; supervision, Marko D. Petrović; project administration, Marko D. Petrović; funding acquisition, Ivan N. Alov, Marko D. Petrović. All authors have read and agreed to the published version of the manuscript.”
Funding
This publication has been supported by project No. 060509-0-000 (RUDN University Scientific Projects Grant System) and by the Ministry of Science, Technological Development and Innovation of the Republic of Serbia (Contract no. 451-03-66/2024-03/200172).
Conflicts of Interest
The authors declare no conflicts of interest.
References
- Frey W. H. Diversity Explosion: How New Racial Demographics Are Remaking America. Brookings Institution Press, 2014. 224 p.
- Braveman P., Parker Dominguez T. Abandon “Race.” Focus on Racism. Front. Public Health. 2021. Vol 9. P. 1–8. [CrossRef]
- Chavez-Dueñas N. Y., Adames H. Y., Organista, K. C. Skin-Color Prejudice and Within-Group Racial Discrimination: Historical and Current Impact on Latino/a Populations. Hispanic Journal of Behavioral Sciences. 2014. Vol. 36(1). P. 3–26. [CrossRef]
- Graves J. L. Why the Nonexistence of Biological Races Does Not Mean the Nonexistence of Racism. American Behavioral Scientist. 2015. Vol. 59 (11). P. 1474–1495. [CrossRef]
- Dhillon-Jamerson K. K. Euro-Americans Favoring People of Color: Covert Racism and Economies of White Colorism. American Behavioral Scientist. 2018. Vol. 62 (14). P. 2087–2100. [CrossRef]
- Charles J. Colorism and the Afro-Latinx Experience: A Review of the Literature. Hispanic Journal of Behavioral Sciences. 2021. Vol. 43 (1-2). P. 8–31. [CrossRef]
- Antunes R. de A., Gonçalves E. dos S., Bernardino L. G., Casalecchi J. G. S., Grebot I. B. da F., de Moraes R. Influence of Economic Scarcity on Race Perception. Psychological Reports. 2023. P. 1–25. [CrossRef]
- Thornton M. C., Taylor R. J., Chatters L. M, Ivy Forsythe-Brown African American and Black Caribbean feelings of closeness to Africans. Identities: Global Studies in Culture and Power. 2017. Vol. 24 (4). P. 493–512. [CrossRef]
- Ferguson G. M., Bornstein M. H. Remote acculturation: The “Americanization” of Jamaican Islanders. International Journal of Behavioral Development. 2012. Vol. 36 (3). P. 167–177. [CrossRef]
- Jones T.-A. Jamaican Immigrants in the United States and Canada: Race, Transnationalism, and Social Capital. El Paso, TX: LFB Scholarly Publishing, 2008. 190 p.
- Foner N. (ed.). Islands in the City: West Indian Migration to New York. Berkeley: University of California Press, 2001. 312 p.
- Manuel R. C., Taylor R. J., Jackson J. S. Race and ethnic group differences in socio-economic status: Black Caribbeans, African Americans and non-Hispanic Whites in the United States. The Western Journal of Black Studies. 2012. Vol. 36 (3). P. 228–239. [CrossRef]
- Vickerman M. Jamaicans: Balancing Race and Ethnicity. One Out of Three: Immigrant New York in the Twenty-First Century / Foner M. (ed.). New York: Columbia University Press. P. 176–199.
- Stepick A., Portes A. Flight into Despair: A Profile of Recent Haitian Refugees in South Florida. International Migration Review. 1986. Vol. 20 (2). P. 329–350. [CrossRef]
- Portes A., Grosfoguel R. Caribbean Diasporas: Migration and Ethnic Communities. The Annals of the American Academy of Political and Social Science. 1994. Vol. 533 (1). P. 48–69. [CrossRef]
- Catanese A. V. Haitians: Migration and Diaspora. New York: Routledge, 1999. 156 p.
- Jackson R. O. Geographies of the Haitian Diaspora. New York: Routledge, 2011. 348 p.
- Du Bois W. E. B. On Sociology and the Black Community / Heritage of Sociology Series / Green D. S., Driver E. D. (eds.). Chicago: University of Chicago Press, 2013. 328 p.
- Bunge W. W. Fitzgerald: Geography of a revolution. Cambridge, MA: Schenkman, 1971. 272 p.
- Harvey D. W. Revolutionary and counter revolutionary theory in geography and the problem of ghetto formation. Antipode. 1972. Vol. 4 (2). P. 1–13. [CrossRef]
- Harvey D. W. Social Justice and the City. Athens, GA: University of Georgia Press, 1973. 368 p.
- Massey D. S., Denton N. A. American Apartheid: Segregation and the Making of the Underclass. Cambridge: Harvard University Press, 1993. 374 p.
- Wilson W. J. The Truly Disadvantaged: The Inner City, The Underclass and Public Policy. University of Chicago Press, 1987. 261 p.
- Johnston R. J., Manley D., Jones K. Spatial scale and measuring segregation: illustrated by the formation of Chicago’s ghetto. GeoJournal. 2018. Vol. 83. P. 73–85. [CrossRef]
- Massey D. S., Denton N. A. The Dimensions of Residential Segregation. Social Forces. 1988. Vol. 62 (2). P. 281–315.
- American Community Survey (ACS) - U.S. Census Bureau. Available online: https://www.census.gov/programs-surveys/acs (accessed: October 20, 2024).
- IPUMS NHGIS. Available online: https://www.nhgis.org/ (accessed: October 20, 2024).
- Anselin L. Local Indicators of Spatial Association—LISA. Geographical Analysis. 1995. Vol. 27. P. 93–115. [CrossRef]
- Lee S.-I. Correlation and Spatial Autocorrelation / Encyclopedia of GIS / ed. by Shekhar S., Xiong H., Zhou X. Springer, 2017. P. 360–368.
- Moran P. A. P. Notes on Continuous Stochastic Phenomena. Biometrika. 1950. Vol. 37. P. 17–23. [CrossRef]
- Anselin L., Syabri I., Kho Y. GeoDa: An Introduction to Spatial Data Analysis. Geographical Analysis. 2006. Vol. 38, Issue 1. P. 5–22. [CrossRef]
- Villalba C. M. H. Socioeconomic Status (SES) / Encyclopedia of Quality of Life and Well-Being Research / Michalos A. C. (ed.). Berlin: Springer, 2014. P. 267.
- Kraus M. W., Stephens N. M. A road map for an emerging psychology of social class. Social and Personality Psychology Compass. Vol. 6. P. 642–656. [CrossRef]
- Baker E. H. Socioeconomic status, definition / The Wiley Blackwell Encyclopedia of Health, Illness, Behavior, And Society / Cockerham W. C., Dingwall R., Quah S. R. (eds.). Hoboken, NJ: Wiley-Blackwell, 2014. P. 2210–2214.
- Manstead A. S. The psychology of social class: how socioeconomic status impacts thought, feelings, and behaviour. British Journal of Social Psychology. 2018. Vol. 57. P. 267–291. [CrossRef]
- Finkl, C. W., Charlier, R. H. Sustainability of subtropical coastal zones in southeastern Florida: challenges for urbanized coastal environments threatened by development, pollution, water supply, and storm hazards. Journal of Coastal Research. 2003. Vol. 19(4). P. 934–943. http://www.jstor.org/stable/4299236.
- Divya, Y., Gopinathan, P., Jayachandran, K., Al-Quraishi, A. M. F. Color slices analysis of land use changes due to urbanization in a city environment of Miami Area, South Florida, USA. Modeling Earth Systems and Environment. 2021. Vol. 7(1). P. 537-546. [CrossRef]
- Chernyshev, K. A., Alov, I. N., Li, Y., Gajić, T. How real is migration’s contribution to the population change in major urban agglomerations? Journal of the Geographical Institute “Jovan Cvijić” SASA. 2023. Vol. 73(3), P. 371–378. [CrossRef]
- Audebert, C. Residential Patterns and Political Empowerment among Jamaicans and Haitians in the US Metropolis. Human Architecture: Journal of the Sociology of Self-Knowledge. 2009. Vol. 7(4). P. 53-68.
- Ortiz, P. An African American and Latinx History of the United States (Vol. 4). Beacon Press, 2018.
- Baines, K. Embodying the Everyday: Health and Heritage Practice Relationships in Latin American and Caribbean Immigrant Communities in New York City. Human Organization. 2023. Vol. 82(4), P 331-341. [CrossRef]
- Nijman, J., Clery, T. Rethinking suburbia: A case study of metropolitan Miami. Environment and Planning A. 2015. Vol. 47(1). P. 69-88. [CrossRef]
- Kalmijn, M. The socioeconomic assimilation of Caribbean American blacks. Social Forces. 1996. Vol. 74(3). P. 911-930. [CrossRef]
- Huyser, K. R., Sakamoto, A., Takei, I. The persistence of racial disadvantage: The socioeconomic attainments of single-race and multi-race Native Americans. Population Research and Policy Review. 2010. Vol. 29. P. 541-568. [CrossRef]
Figure 1.
Share of the states in overall Haitian population of the U.S. Compiled by the authors based on [26].
Figure 1.
Share of the states in overall Haitian population of the U.S. Compiled by the authors based on [26].
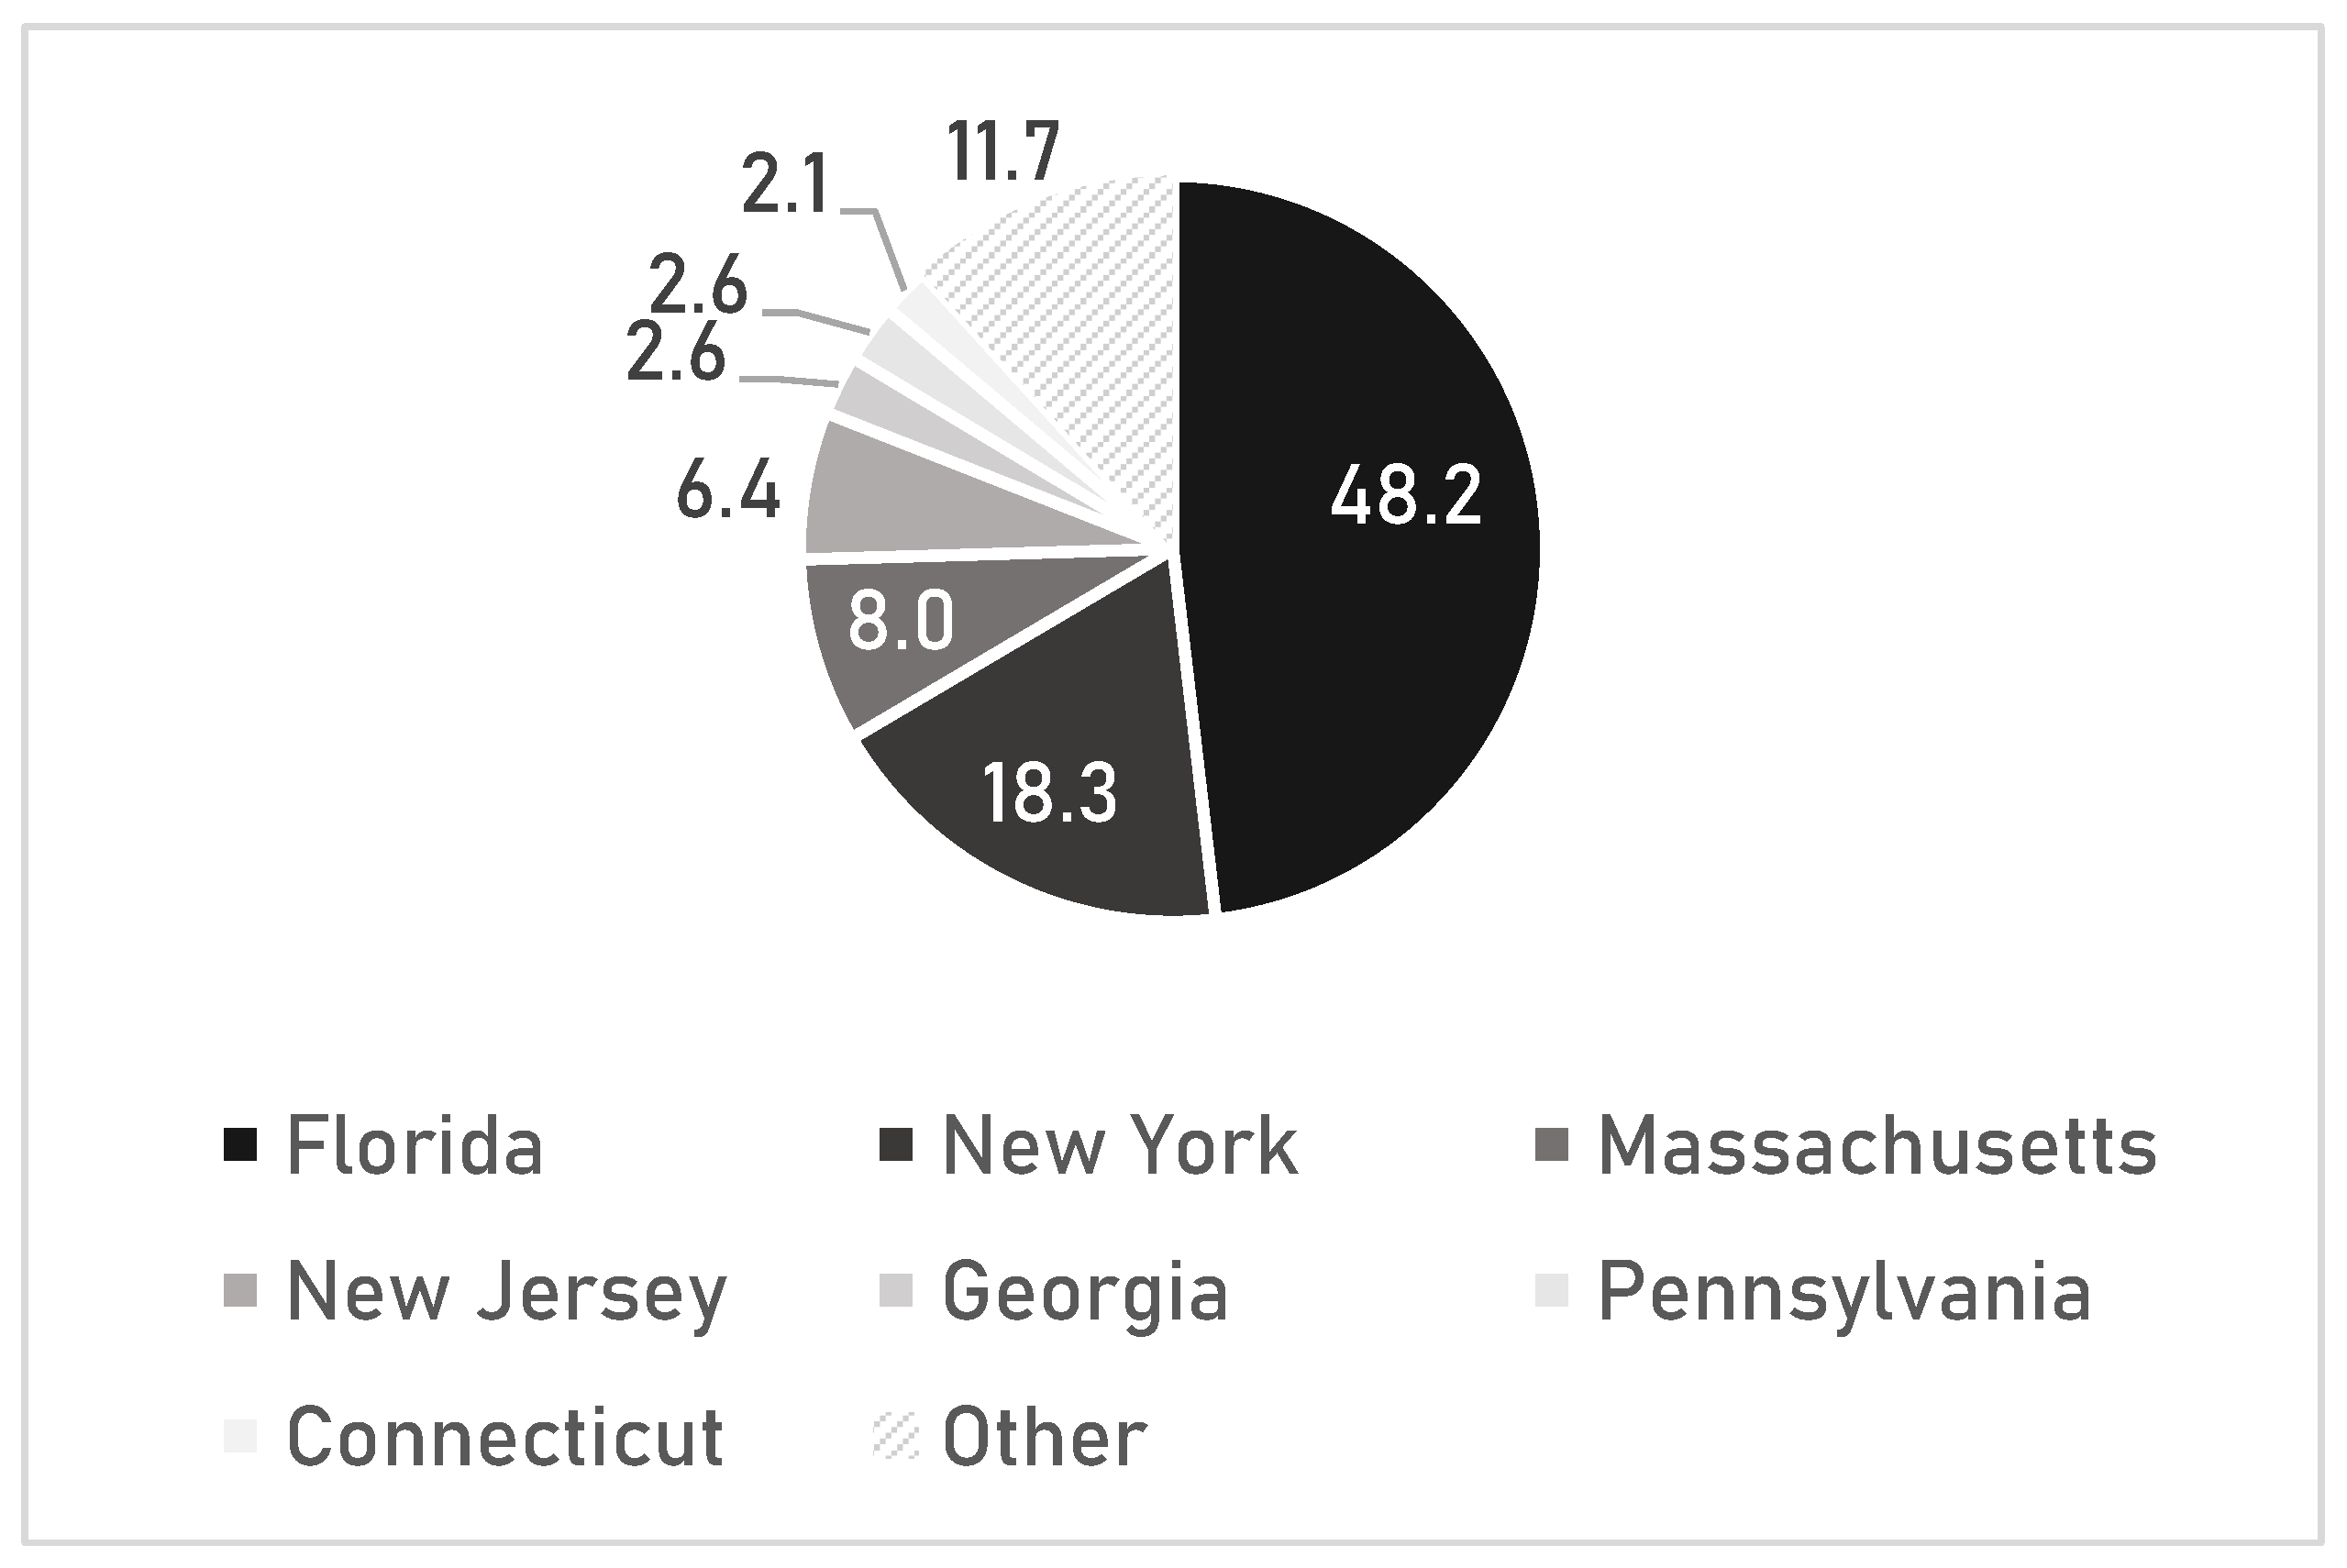
Figure 2.
Share of the states in overall Jamaican population of the U.S. Compiled by the authors based on [26].
Figure 2.
Share of the states in overall Jamaican population of the U.S. Compiled by the authors based on [26].
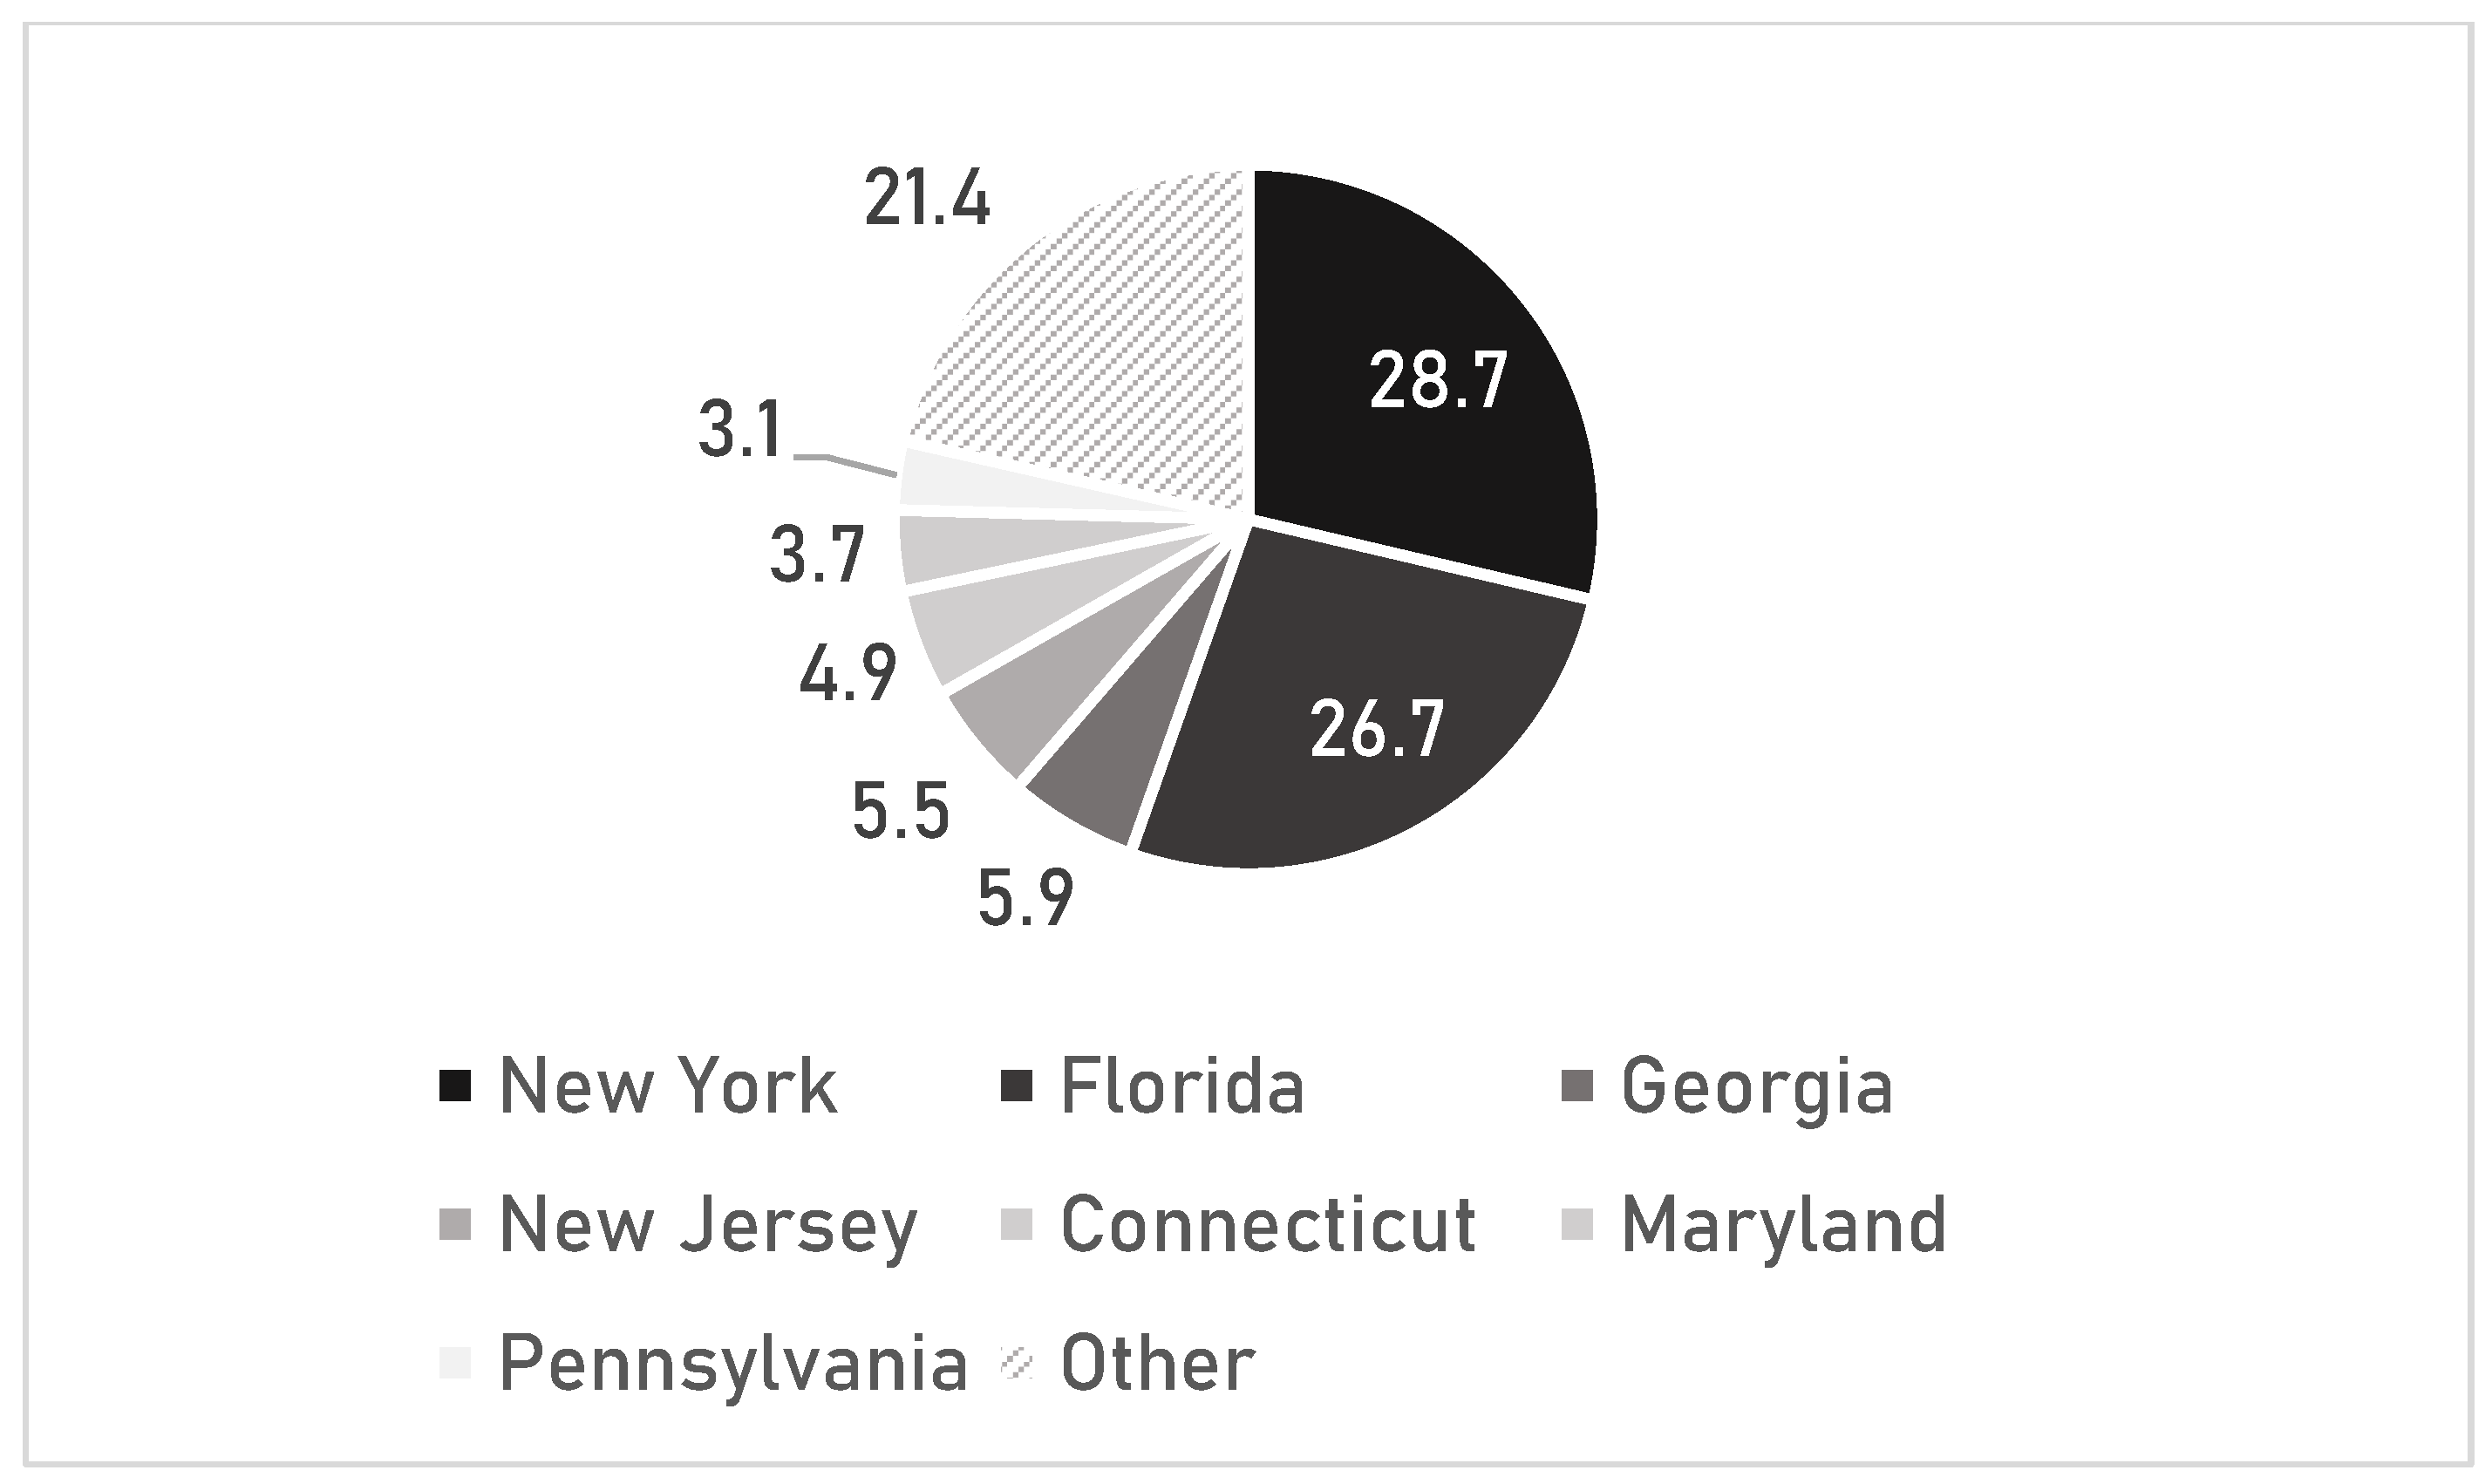
Figure 3.
Areas of concentration of Haitians and Jamaicans in New York metropolitan area. Created by the authors.
Figure 3.
Areas of concentration of Haitians and Jamaicans in New York metropolitan area. Created by the authors.
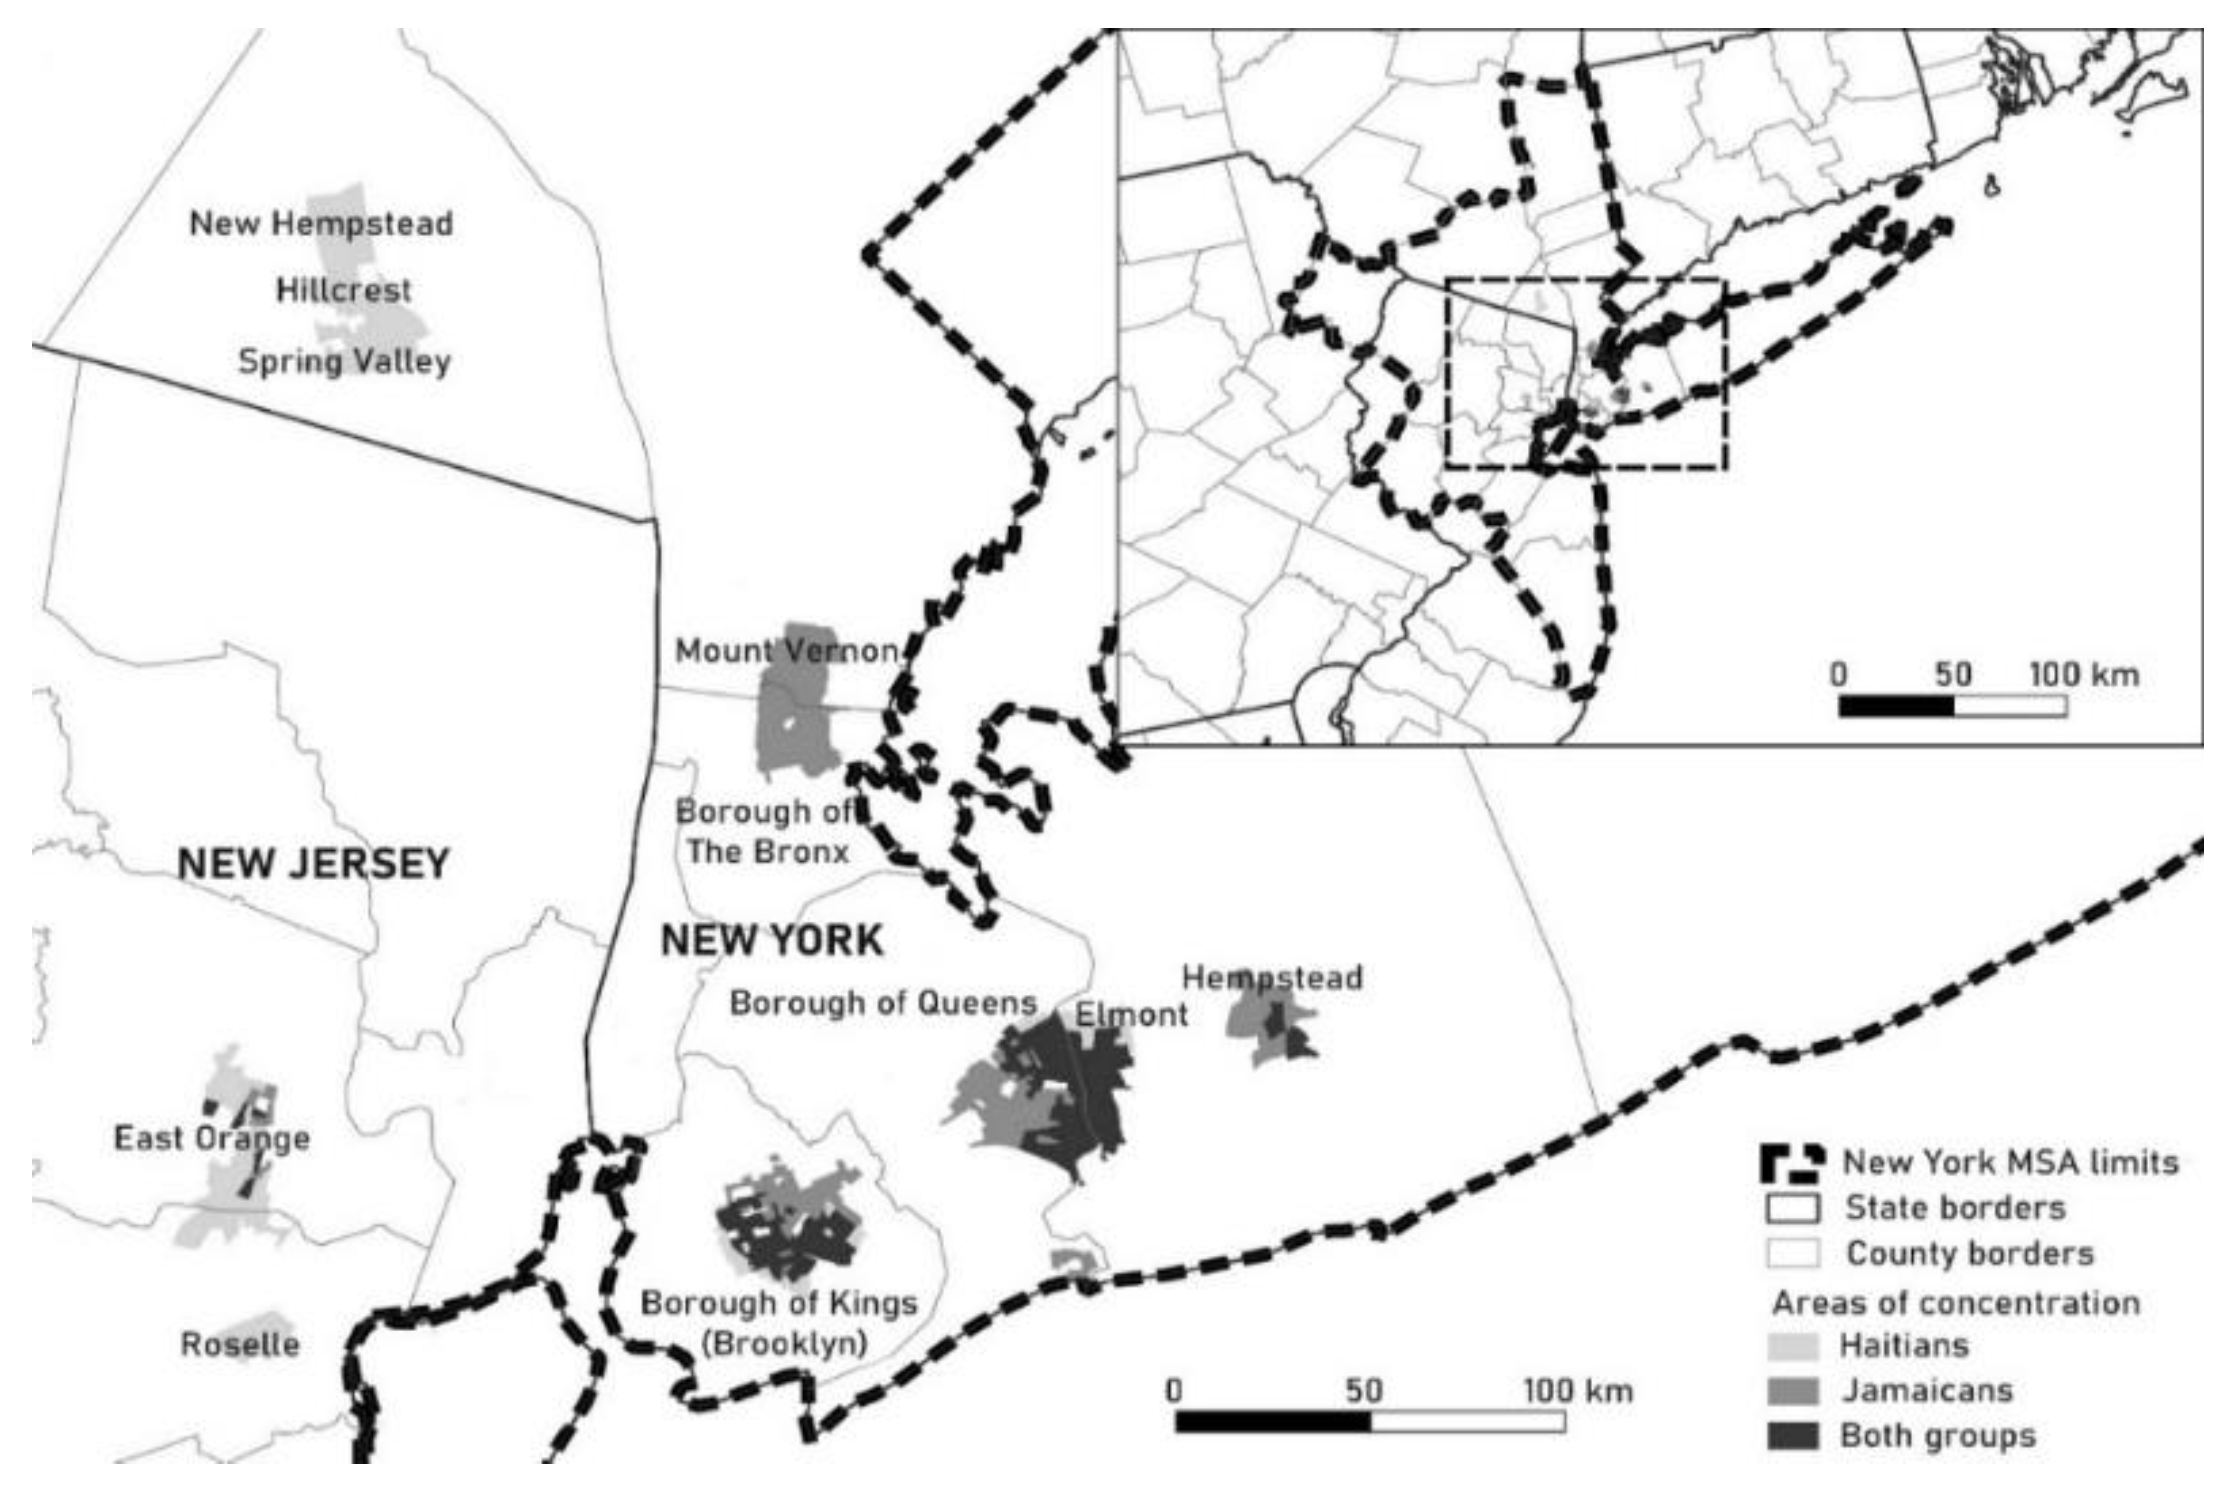
Figure 4.
Areas of concentration of Haitians and Jamaicans in Miami metropolitan area. Created by the authors.
Figure 4.
Areas of concentration of Haitians and Jamaicans in Miami metropolitan area. Created by the authors.
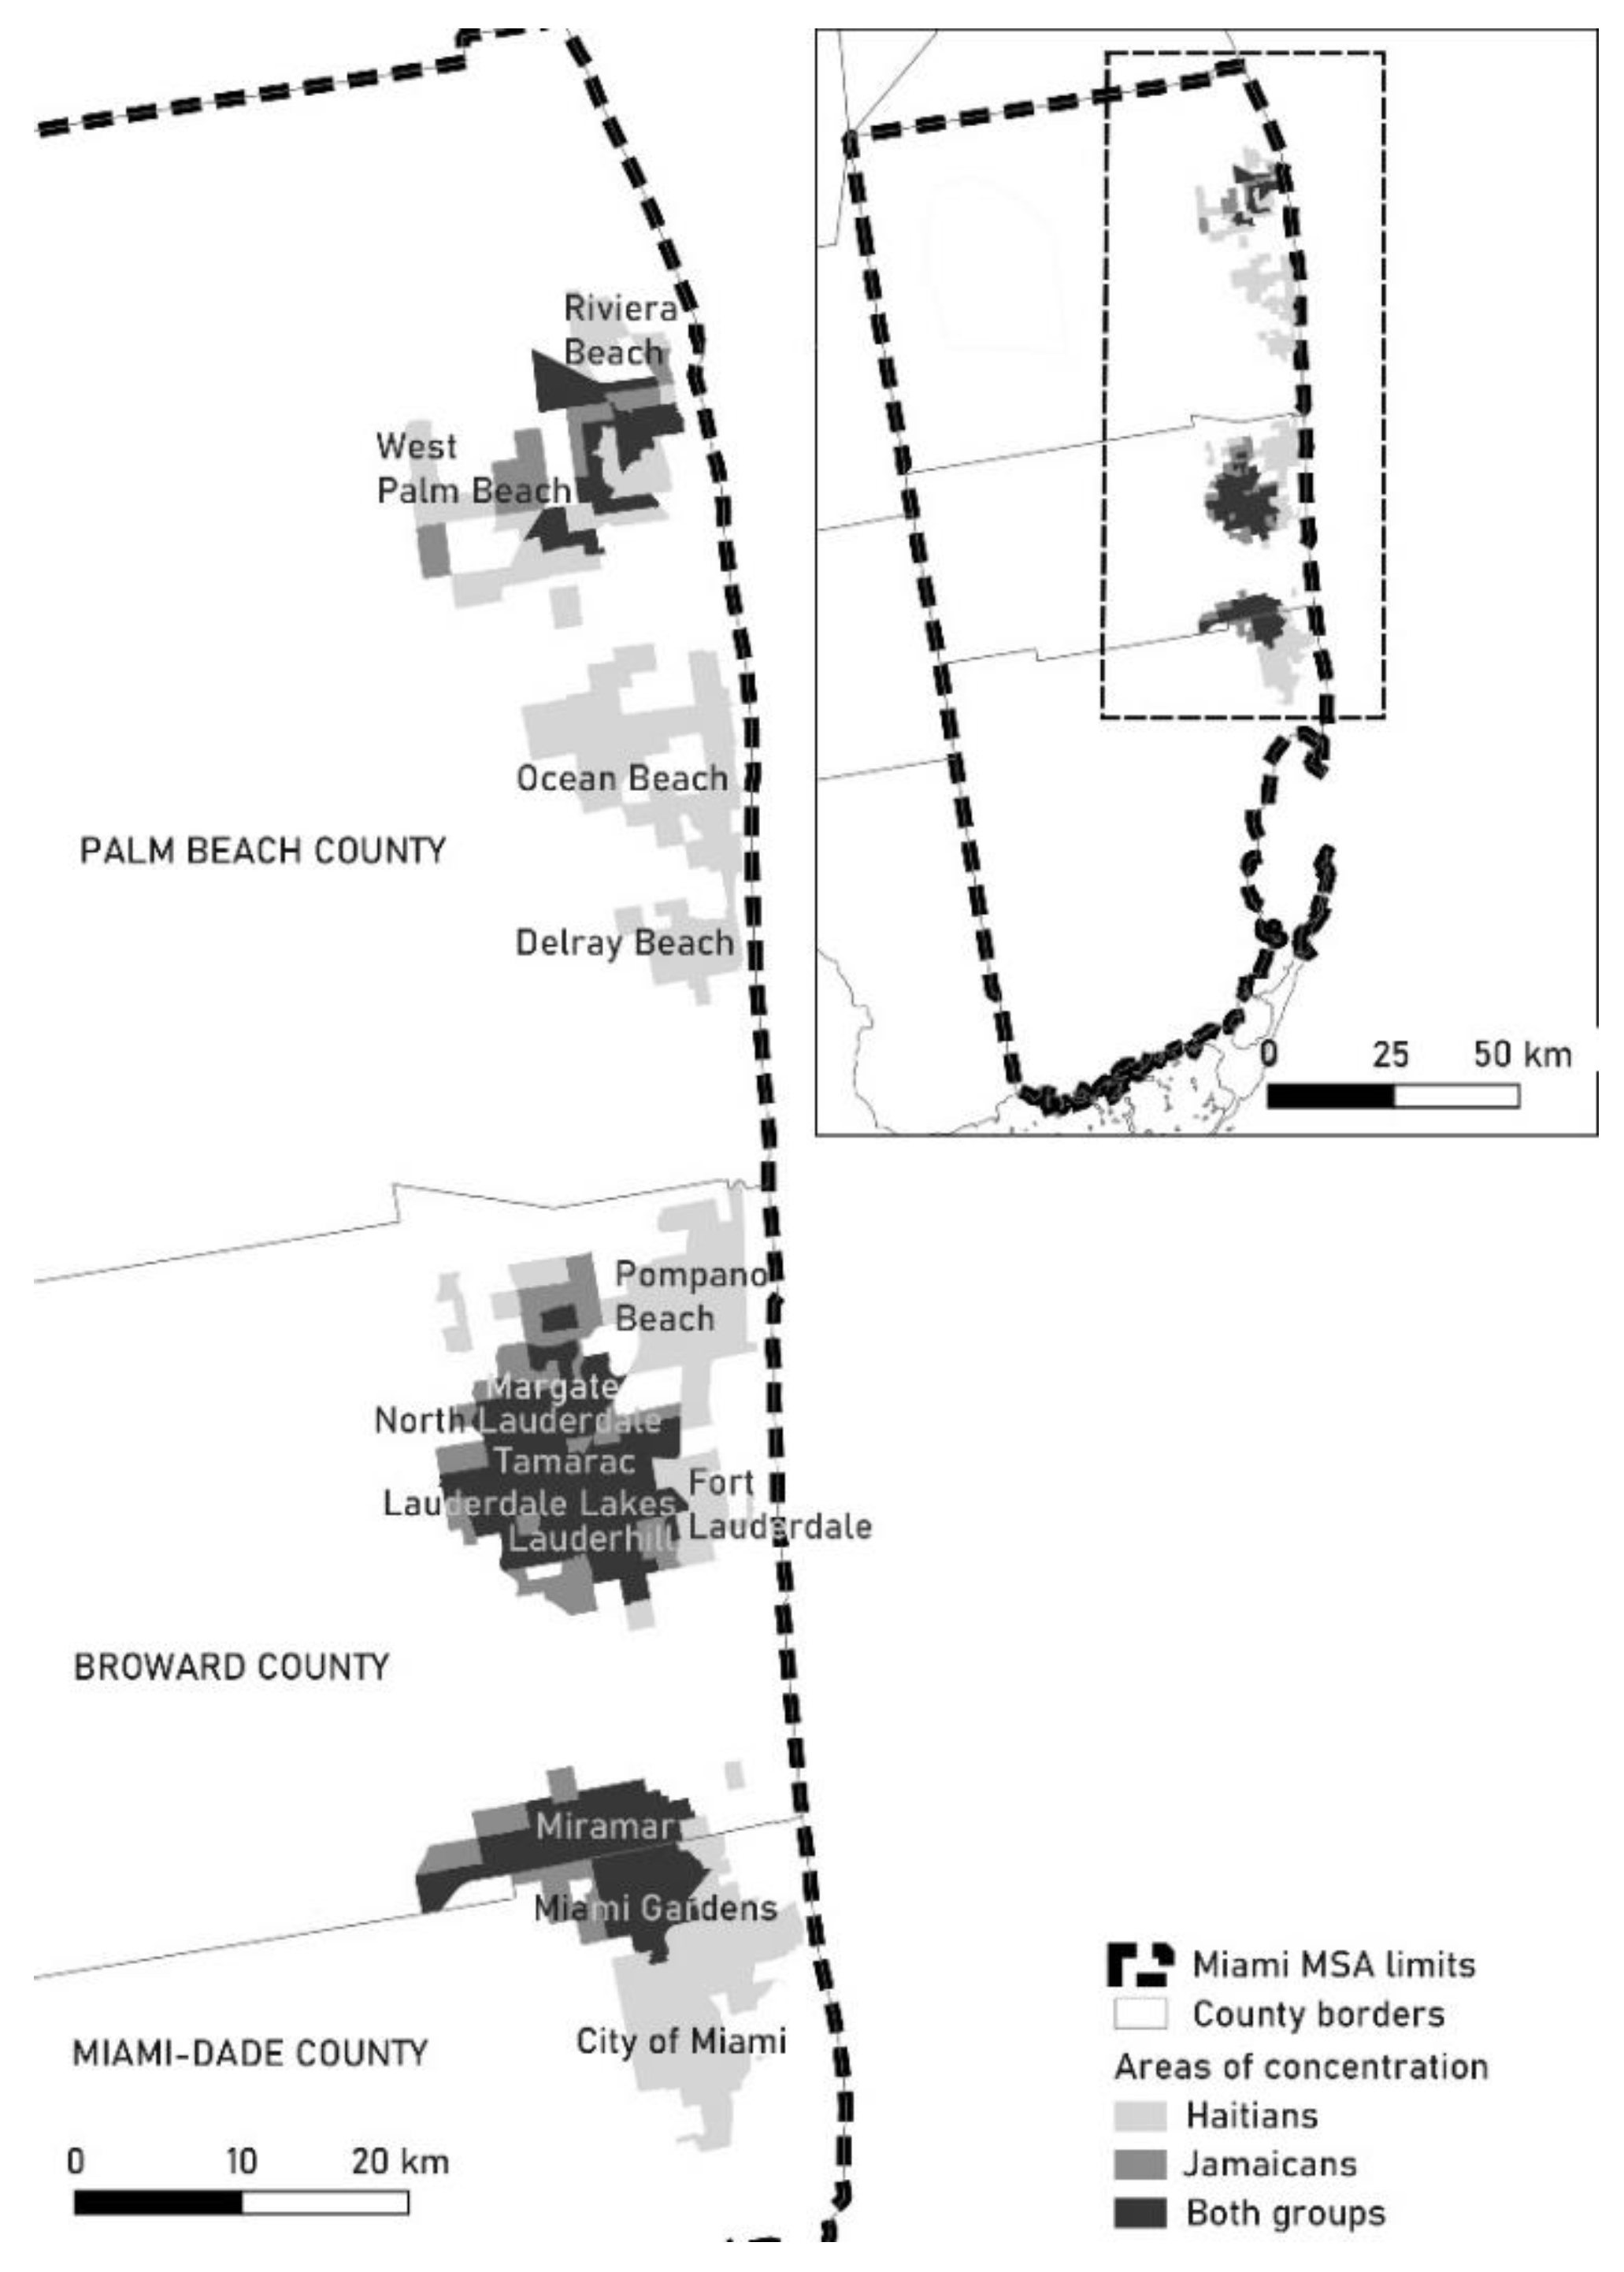
Table 2.
Shares of titular ethnic groups in the identified areas of concentration, %. Compiled by the authors based on [26].
Table 2.
Shares of titular ethnic groups in the identified areas of concentration, %. Compiled by the authors based on [26].
| Metropolitan Area | Haitians | Jamaicans | Haitian and Jamaicans |
African Americans (without Haitians and Jamaicans) |
|---|---|---|---|---|
| New York (mean) Miami (mean) |
11.6 | 16.3 | 27.2 | 62.6 |
| 18.5 | 6.6 | 27.4 | 63.5 | |
| New York (max) Miami (max) |
29.4 | 45.8 | 55.2 | 100 |
| 62.1 | 16.2 | 63.2 | 96.4 | |
| New York (min) Miami (min) |
1 | 1.9 | 5.9 | 21.2 |
| 1.4 | 1.8 | 7.1 | 19.8 |
Table 3.
Darden–Kamel Composite Socio-Economic Index values in areas of concentration of Haitians, Jamaicans, and African Americans. Compiled by the authors based on [26].
Table 3.
Darden–Kamel Composite Socio-Economic Index values in areas of concentration of Haitians, Jamaicans, and African Americans. Compiled by the authors based on [26].
| Metropolitan Area | Haitians | Jamaicans | Haitian and Jamaicans |
African Americans (without Haitians and Jamaicans) |
|---|---|---|---|---|
| New York (mean) Miami (mean) |
-3.72 | -4.72 | -1.55 | -4.7 |
| -4.29 | -1.27 | -3.47 | -5.35 | |
| New York (max) Miami (max) |
4.72 | 7.46 | 7.07 | 7.3 |
| 11.06 | 9.01 | 8.0 | 0.53 | |
| New York (min) Miami (min) |
-12.76 | -14.56 | -14.24 | -21.7 |
| -23.51 | -14.12 | -15.98 | -16.08 |
Disclaimer/Publisher’s Note: The statements, opinions and data contained in all publications are solely those of the individual author(s) and contributor(s) and not of MDPI and/or the editor(s). MDPI and/or the editor(s) disclaim responsibility for any injury to people or property resulting from any ideas, methods, instructions or products referred to in the content. |
© 2024 by the authors. Licensee MDPI, Basel, Switzerland. This article is an open access article distributed under the terms and conditions of the Creative Commons Attribution (CC BY) license (http://creativecommons.org/licenses/by/4.0/).
Copyright: This open access article is published under a Creative Commons CC BY 4.0 license, which permit the free download, distribution, and reuse, provided that the author and preprint are cited in any reuse.


