
Submitted:
16 November 2024
Posted:
19 November 2024
You are already at the latest version
Abstract
Background: Disease-related malnutrition and sarcopenia are prevalent conditions in gastrointestinal cancer patients, whose early diagnosis is essential to establish a nutritional intervention that contributes to preventing adverse outcomes and improving the disease prognosis. Phase angle (PhA), rectus femoris cross-sectional area (RFCSA) and rectus femoris thickness (RF-Y-axis) are considered effort-independent markers of muscle mass, strength and functionality. These markers are influenced by the metabolic changes in cancer patients but have not been fully validated in this population. Objective: This study aimed to evaluate the potential utility of PhA, RFCSA and RF-Y-axis in predicting malnutrition and sarcopenia in patients with esophagogastric cancer (EGC). Methods: This was a cross-sectional study of patients diagnosed with EGC. PhA was obtained using bioelectrical impedance vector analysis (BIVA), along with ASMMI. RFCSA and RF-Y-axis were measured via nutritional ultrasound (NU®). Muscle capacity was assessed using handgrip strength (HGS), and functionality by applying the Short-Physical-Performance-Battery (SPPB). Malnutrition and sarcopenia were determined according to GLIM and EWGSOP2 criteria, respectively. Results: Out of the 35 patients evaluated, 82.8% had malnutrition and 51.4% sarcopenia. RFCSA(r=0.582) and RF-Y-axis(r=0.602) showed significant, moderate correlations with ASMMI, unlike PhA(r=0.439), which displayed a weak correlation with this parameter. However, PhA (OR=0.167,CI 95%:0.047-0.591,p=0.006), RFCSA (OR=0.212, CI 95%:0.074-0.605,p=0.004), and RF-Y-axis (OR=0.002,CI 95%:0.000-0.143,p=0.004) all showed good predicting ability for sarcopenia in the crude models, but only RF-Y-axis was able to explain malnutrition in the regression model (OR=0.002, CI 95%:0.000-0.418,p=0.023). Conclusion: RF-Y-axis emerged as the only independent predictor of both malnutrition and sarcopenia in this study, likely due to its stronger correlation with ASMMI compared to PhA and RFCSA.
Keywords:
esophagogastric cancer
; malnutrition
; sarcopenia
; nutritional ultrasound
; phase angle
; morphofunctional assessment
1. Introduction
According to the latest data from the Global Cancer Observatory (GLOBOCAN) of 2022, gastrointestinal (GI) cancers are a major public health concern as they pose the highest lifetime risk of death, due to the invasive nature of the disease [1]. In Europe, esophageal and gastric cancers, two of the most lethal malignant GI tumors [2,3], accounted for 189.031 new cases and 142.508 deaths in 2020 [4], resulting in a sixth and third place in terms of mortality, respectively [1]
These patients commonly experience a high rate of nutritional impairment due to symptoms arising from systemic inflammation and local tumor effects, such as dysphagia, nausea, malabsorption, vomiting, diarrhea or fatigue [5,6,7]. This leads to inadequate nutritional intake [8,9,10], which causes involuntary weight loss and reduced muscle mass [11,12,13,14]. Therefore, disease-related malnutrition (DRM) and sarcopenia are the most common cancer-related conditions, affecting between 15% and 40% of patients at the time of diagnosis. Moreover, in advanced stages of esophagogastric cancer (EGC), DRM and sarcopenia may affect up to 75% of patients [15,16,17,18].
Currently, in cancer patients, DRM and sarcopenia have been associated with adverse outcomes, including higher likelihood of postoperative complications and reduced response and tolerance to treatment [19]. This results in increased length of hospital stay, disease burden and healthcare costs, further worsening patient prognosis and overall survival [20,21,22]. Hypercatabolic state and, consequently, muscle wasting are often exacerbated by most chemotherapeutic agents and surgery itself, underscoring the importance of evaluating muscle mass as a key component in morphofunctional assessment to identify malnutrition and sarcopenia [23], which can also occur in individuals with normal weight, overweight, or obesity.
The Global Leadership Initiative on Malnutrition (GLIM) has highlighted the role of reduced muscle mass as a phenotypic criterion for diagnosing malnutrition in clinical settings [24]. Similarly, in 2019, the European Working Group on Sarcopenia in Older People 2 (EWGSOP2) updated the definition of this condition, establishing that sarcopenia is probable when low muscle strength is detected; its diagnosis is confirmed by the presence of low muscle quantity or quality, and is considered severe when low physical performance is identified [25]. There are several techniques available to assess changes in body composition, such as bioelectrical impedance analysis (BIA) and ultrasound (US), which have the advantages of low cost, high portability and bedside use [26,27,28], unlike MRI and CT, currently considered as gold standards for assessing the nutritional status of patients [29,30].
On one hand, BIA is a non-invasive method based on the human’s body ability to transmit an electrical current, providing the bioelectrical impedance vector analysis (BIVA) and phase angle (PhA), both of which elucidate insights into cell membrane integrity and vitality, and body hydration [31,32,33,34,35]. The BIVA approach and PhA are derived from raw measurements, specifically resistance (R) and reactance (Xc), rendering them independent of body weight and free from calculation-inherent errors, which makes them suitable for use in cancer patients [36,37].
On the other hand, US has proven to be a valuable tool, independent of hydration status. It has shown good validity for estimating muscle mass [38,39,40,41] through measurements of different body compartments [42]. Although various muscular structures can be evaluated, the rectus femoris (RF) is one of the most referenced since anterior thigh muscles are affected early in catabolic processes [43]. Like PhA, ultrasound-derived rectus femoris cross-sectional area (RFCSA) and muscle thickness or rectus femoris Y-axis (RF-Y-axis) have been proposed as attractive, effort-independent surrogate markers of malnutrition and sarcopenia. Recent studies have demonstrated that lower values of these parameters are linked to reduced muscle mass, strength and/or functionality [44,45,46,47,48].
However, contradictory findings have also been reported [49,50,51,52]. In addition, most studies yielding positive results have focused on contexts outside of oncology, including cardiovascular diseases, chronic obstructive pulmonary disease, Sars-CoV2 disease or even healthy patients [46,47,53]. Furthermore, research evaluating the effectiveness of PhA has predominantly examined its association with postoperative complications rates, length of hospital stay, quality of life and survival, rather than with malnutrition and sarcopenia [54,55,56,57].The same has occurred when considering ultrasound measurements, as studies have concentrated on establishing correlations between RFCSA, RF-Y-axis, and mortality [45].
Consequently, to date, there is a gap in the literature regarding the ability of certain bioelectrical and ultrasound parameters to reflect nutritional status, including muscle quantity and quality in EGC patients. Therefore, our aim was to evaluate the potential utility of PhA, RF-CSA and RF-MT in identifying malnutrition and sarcopenia according to the GLIM and EWGSOP2 criteria, respectively, in adult patients with EGC.
2. Materials and Methods
2.1. Study Design
Prospective cross-sectional study, single-center, developed in 35 patients diagnosed with esophagogastric cancer. The patients were recruited in the Endocrinology and Nutrition Service of the Hospital Universitario y Politécnico La Fe in Valencia between January 2024 and September 2024, after being referred from esophagogastric surgery or medical oncology department.
The inclusion criteria were patients between 18 and 80 years old with histologically confirmed diagnoses, regardless of tumor stage and route of feeding. The exclusion criteria were patients with concomitant non-esophagogastric malignant tumors and those undergoing palliative treatment and patients with ECOG (Eastern Cooperative Oncology Group) >2. Patients diagnosed with severe liver cirrhosis, chronic kidney disease stage 4 or 5 (glomerular filtration rate less than 30 ml/min/1.73 m², measured by the equation proposed by the Chronic Kidney Disease Epidemiology Collaboration (CKD-EPI)), heart failure, mental illness, or stroke were excluded. Additionally, patients without all clinical data such as weight or height and contraindications to BIA were also excluded. This ensured that, in total, 4 patients were excluded from the present study.
The study was approved by the Clinical Research Ethics Committee of the La Fe Health Research Institute (number 2023-1188-1, approval date December 20th 2023) and informed consent was obtained from each patient to use their data anonymously.
1.2. Clinical and Sociodemographic Data
We collected data related to sex, age, comorbidities such as diabetes, hypertension, dyslipemia; tumor location, TNM (Tumor Nodes Metastasis) cancer staging system, oncology treatment and ECOG. Information was recruited by interview or medical record. The level of physical activity was assessed using the International Physical Activity Questionnaire (IPAQ) [58]. Based on the results, participants were classified into inactive or low physical activity, moderate activity, and high activity.
1.3. Anthropometric Measurements
A stadiometer was used to measure height, and weight was calculated using a calibrated weighing scale set (certified test weights ± 0.1 kg) (SECA ®, Hamburg, Germany). As part of anthropometry, patients were measured with the patient standing, dressed in light clothing, barefoot, and with the head oriented in the Frankfurt horizontal plane, using a mechanical column scale. The patient’s body mass index (BMI) was determined and classified according to the World Health Organization (WHO). For older patients, the BMI was classified according to the recommendations of the Spanish Society of Geontology and Geriatry (SEGG) and the Spanish Society of Clinical Nutrition and Metabolism (SENPE) [59].
Calf (CC) and mid-arm circumferences (MAC) were measured according to recommendations and using a flexible, non-elastic measuring tape (SECA® 201) calibrated in centimeters with millimeter precision. The CC cut-off was <34 cm for men and <33 cm for women (BMI = 18.5–24.9 kg/m2, for other BMIs, adjustment factors) [60].
1.4. Nutritional Screening and Diagnosis of Malnutrition
Nutritional risk was evaluated by the subjective global assessment (SGA) [61]. The SGA is the most studied, validated, and widely recognized method for accurately assessing the nutritional status of oncology patients [62,63]. It produces the following global ratings: well nourished (A), moderately malnourished(B), or severely malnourished (C).
The GLIM criteria were used to diagnose malnutrition [24], which stipulate that a minimum of one etiologic and one phenotypic criterion must be present at the same time. The phenotypic criteria included: (a) unintentional weight loss > 5% over the past six months or >10% beyond six months, (b) a body mass index (BMI) of <18.5 kg/m² for individuals under 70 years of age or <20 kg/m² for those aged 70 and older, and (c) reduction of muscle mass based on appendicular skeletal muscle mass index (ASMMI) (<7 kg/m2 in males and <5.5 kg/m2 in females) or fat free mass index (FFMI) ( <17 kg/m2 in males and <15 kg/m2 in females).
We determined that all patients fulfilled the GLIM etiological criteria for chronic disease-related due to cancer. Dietary intake was estimated using a 24-hour dietary recall of 3 days conducted by a trained registered dietitian.
1.5. Morphofunctional Assessment
1.5.1. Bioelectrical Impedance Vector Analysis (BIVA)
The impedance measurements were conducted using a single-frequency and phase-sensitive impedance analyzer (NUTRILAB®, AKERN®, Pontassieve, Italy), which applies an alternating sinusoidal electric current of 400 µA at 50 kHz. We performed the measurements following the standard and validated technique [64], which are based on the placement of the electrodes (BIATRODES™) on the back of the right hand (center of the third proximal phalanx) and one electrode on the corresponding foot (proximal to the second and third metatarsophalangeal joints). The position of the patients was supine with the legs opened at a 45° angle relative to the body’s midline, while the upper limbs were positioned 30° away from the trunk. To avoid disturbances, all patients waited five minutes in a supine position to balance the fluid distribution, and they were instructed to abstain from food and drink the 2 hours before the test [65]. Bioelectrical parameters were analyzed to estimate body composition, including PhA, total body water (TBW), extracellular body water (ECW), intracellular body water (ICW), fat-free mass (FFM), fat mass (FM), body cell mass (BMC) and appendicular skeletal muscle mass (ASMM). To assess the hydration status, ECW/TBW ratio and TBW/FFM % was used.
1.5.2. Nutritional Ultrasound (NU)®
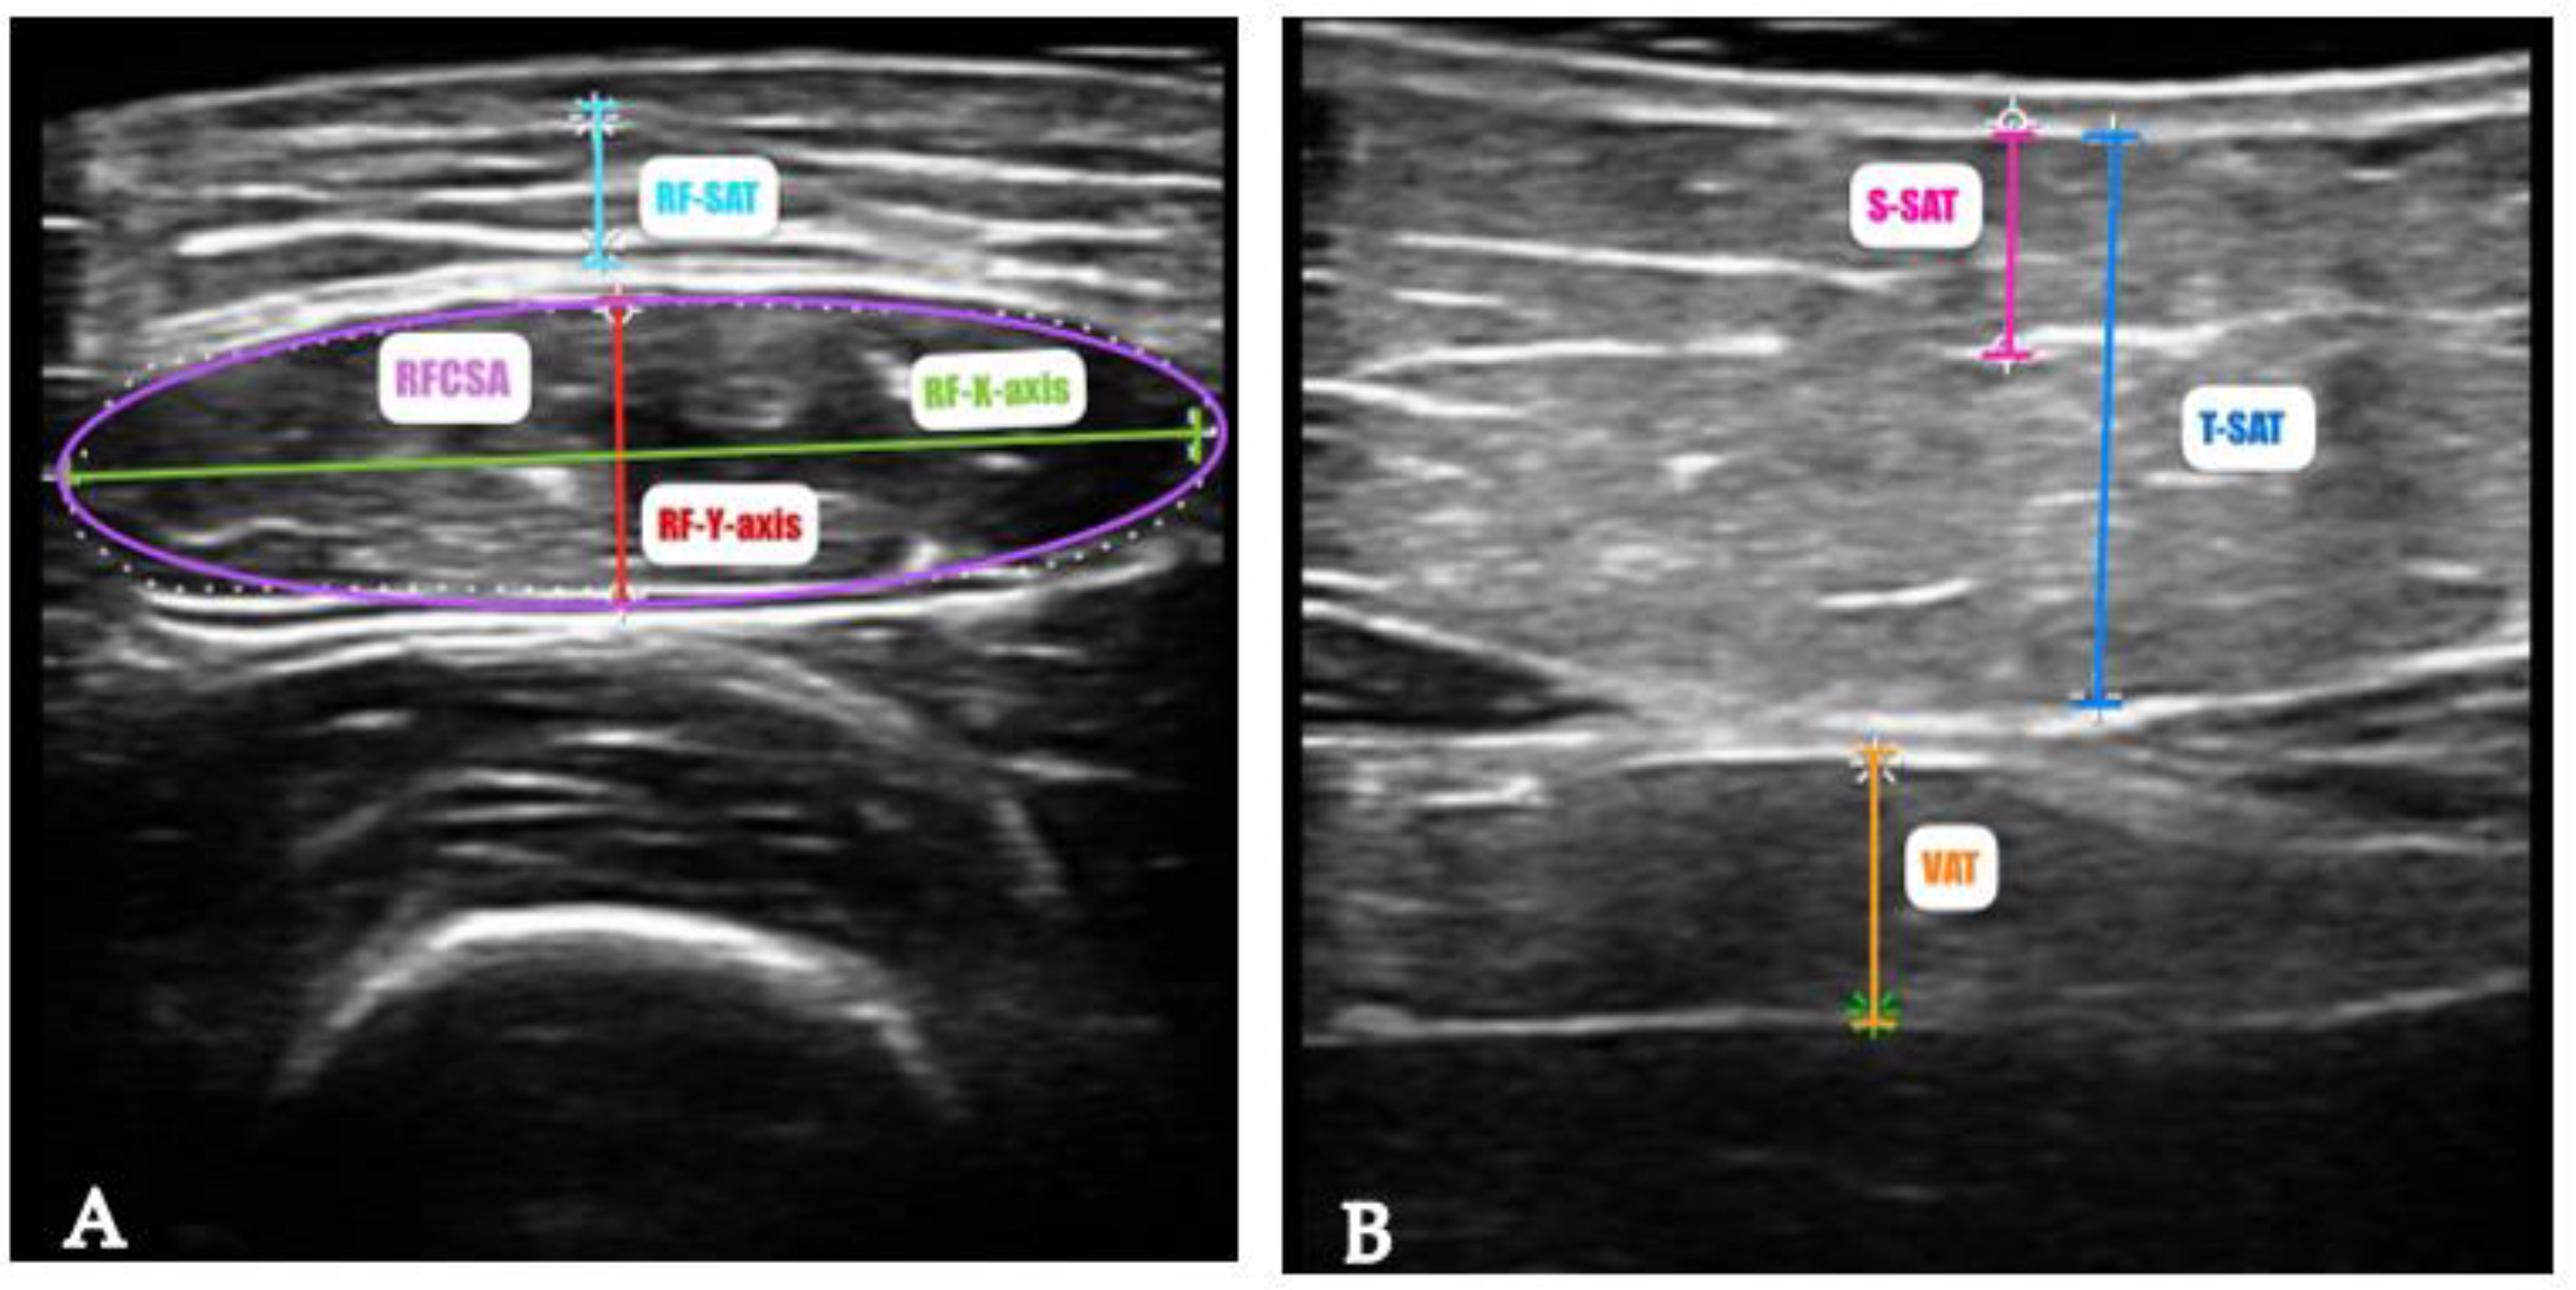
The U PROBE-L6C® (manufacturer Léleman®, Valencia, Spain) (linear 7.5–10 KHz) ultrasound scanner was used, which allowed a depth of up to 100 mm. The patient was in a relaxed supine position with the knee fully extended. Ultrasound scans of the rectus femoris muscle were performed at a point two-thirds of the way between the superior pole of the patella and the anterior superior iliac spine, according to standardized technique [66]. The probe was covered with a suitable water-soluble transmission gel to ensure proper acoustic contact without compressing the dermal surface. It was aligned perpendicularly to both the longitudinal and transverse axes of the rectus femoris muscle to acquire the transverse image (Figure 1A). We measured in the transversal axis the cross-sectional area (RFCSA) in cm2, muscle thickness (or RF-Y-axis), the RF-X-axis and leg subcutaneous fat (RF-AT) in cm.
The other component of NU® is the fat assessment at the level of abdominal wall. The measurement point was established at the midpoint between the xiphoid appendix and the umbilicus in the midline. In the cross-sectional view, the anatomical structures observed were arranged from the most superficial layer, which corresponds to the epidermis, followed by the superficial and deep adipose tissue layers. The two anterior rectus abdominis muscles, which converge at the central part of the linea alba, were identified. Lastly, the preperitoneal fat layer located between the lower border of the linea alba and the parietal peritoneum was visualized (Figure 1B). The images were taken during unforced expiration, in a transverse axis, and aligned perpendicularly to the skin. In this case, we measured the total subcutaneous abdominal adipose tissue (T-SAT), superficial subcutaneous abdominal fat (S-SAT), and total visceral adipose tissue (VAT), all in cm. The procedure was performed by one experienced professional, to avoid interobserver variability.
Figure 1.
Measurement of rectus femoris (A) and abdominal adipose tissue (B) by ultrasound of a patient of our sample. Abbreviations - RFCSA: rectus femoris cross sectional area; RF-Y-axis: rectus femoris Y axis or muscle thickness; RF-X-axis: rectus femoris X axis; RF-SAT: rectus femoris superficial adipose tissue; VAT: visceral adipose tissue; T-SAT: total subcutaneous adipose tissue and S-SAT: superficial subcutaneous adipose tissue.
1.5.3. Functional and Muscle Strength Assessment
The measurement of hand grip strength (HGS) in the dominant hand was assessed using a Jamar dynamometer (Asimow Engineering Co., Los Angeles, CA, USA). The patients were instructed to sit in a chair with a backrest, with both feet on the floor, with the shoulders close to the body in a neutral position and the forearm flexed at 90º without rotation [67,68]. The correct grip was then explained to them and initiated when they were in a comfortable position. They were asked to squeeze as hard as they could after receiving a verbal command, they were encouraged with words of effort to achieve a better result. Three measurements were recorded with the dominant hand, with 1 minute of rest between each measurement, and then averaged.
To assess the physical performance, the Short Physical Performance Battery (SPPB) test was used, which consists of three tests: balance (feet together, semi tandem, and tandem), walking speed (over 4 m), and the chair rising test. With it, patients were divided into dependent/disabled (0-3 points), frail (4–6 points), pre-fragile (7–9 points), or autonomous/ robust (10-12 points) [69].
1.6. Assessment and Diagnosis of Sarcopenia
Sarcopenia risk was performed using the validated Spanish version of the SARC- F) [70], a five-item self-report questionnaire based on patient’s perceptions of their own limitations in Strength, Assistance in walking, Rise from a chair, Climb stairs and experiences with Falls. The final score was used to classify patients into low probability of sarcopenia (<4 points) or high probability of sarcopenia (≥ 4 points) [71].
To diagnose sarcopenia, EWGSOP2 (European Working Group on Sarcopenia in Older People) criteria was used [25]. The patients were classified according to the EWGSOP2 algorithm: (1) probable sarcopenia if they presented low muscle strength in dynamometry (<27 kg in men and <16 kg in women); (2) confirmed sarcopenia, if there is coexistence of low muscle strength with the previously described criteria and low muscle quantity or quality defined as ASMMI (<7 kg/m2 in males and <5.5 kg/m2 in females); and (3) severe sarcopenia if, in addition to low strength and low muscle quantity/quality, there is low physical performance (SPPB test ≤ 8 points).
1.7. Statistical Analysis
Continuous variables are described as mean and standard deviation (SD) or median and interquartile range (IQR). Categorical variables are described as proportions (%). Previously, the Shapiro-Wilk test was performed to check the normality of the data. Comparisons between groups were made with different tests, depending on the nature of the variables, including the Mann-Whitney U test, Fisher’s exact test, one-way ANOVA and the Kruskal-Wallis test, followed by the Bonferroni post-hoc, as appropriate. Inferential statistics were performed with bivariate correlations with the Pearson and Spearman correlation test, according to normal distribution. To confirm whether different variables are factors that can predict malnutrition and sarcopenia, we conducted binary logistic regression analysis using a crude model in the presence or absence of malnutrition and sarcopenia as dependent variables. Statistical significance was set at p < 0.05. All statistical analyses were performed with SPSS 30.0 (SPSS Inc., Chicago, IL, USA) software package.
3. Results
Participants Characteristics
The study included 35 patients, 26 of whom were male (74.3%) with a mean age of 62.8 ± 8.8 years. A total of 25 (71.4%) patients had esophagus cancer and 14 (40%) were in stage III. The combination of surgery and chemotherapy (CTx) was the most used therapy (54.3%). Most patients were inactive or considered with low physical activity (74.3%). An overview of the characteristics of the population study, including demographic and clinical variables, screening methods and anthropometric measurements are summarized in Table 1.
Classical and advanced parameters of nutritional status assessment in the study sample, stratified by sex, are shown in Table 2.
According to SGA, 3 (8.6%) patients were classified as well nourished, 14 (40.0%) as mild to moderately malnourished and 18 (51.4%) as severely malnourished. Considering an average weight loss of 14.3 ± 7.9 within the past six months, malnutrition was prevalent in 82.8% of patients according to GLIM criteria, with 31.4% categorized as stage 1 (moderate) and 51.4% as stage 2 (severe). The diagnosis of malnutrition was more prevalent in men than women (84.6% and 77.6% respectively), but severe malnutrition was higher in women (55.6%).
Following the EWGSOP2 criteria, the prevalence of sarcopenia was 18 patients (51.4%), with 8 (22.8%) classified as having confirmed sarcopenia and 10 (28.6%) as having severe sarcopenia, despite only 8 (22.8%) participants being identified as at risk for this condition based on SARC-F findings.
As shown in Table 3, weight loss was the only variable that showed a statistically significant difference between non-malnutrition and stages 1 (p = 0.010) and 2 (p < 0.001) of this condition. When analyzing BIVA-derived parameters by group pairs, the PhA values associated with severe malnutrition (4.3 ± 0.7) were significantly lower than those corresponding to non-malnourished individuals (5.3 ± 0.7; p = 0.001). The data for BMI (p < 0.001), ASMMI (p = 0.003) and BCM (p = 0.017) exhibited the same trend.
Regarding US measurements, both RF-CSA (p < 0.001) and RF-Y-axis (p < 0.001) showed significant differences between the non-malnutrition and severe malnutrition groups. Although the %FM measured by BIVA did not reveal noteworthy variations among any of the groups, significant differences were observed between the RF-adipose tissue values of the two groups (p = 0.020).
Differences between malnutrition groups and sociodemographic and clinical variables such as physical activity, primary site tumor, comorbidities, tumor stage and treatment were not founded.
In relation to sarcopenia diagnosis, significant differences were observed in sex (p = 0.003) and age (p= 0.021) across the four groups, as well as in the SARC-F score. All patients without sarcopenia were men. Table 4 shows that the PhA values for individuals with confirmed (4.5 ± 0.8; p = 0.009) and severe sarcopenia (4.1 ± 0.5, p < 0.001) were significantly lower than those for patients without this condition (5.6 ± 0.7). This finding was also evident in the values obtained for BCM (p = 0.011, p < 0.001) and ASMMI (p < 0.001, p < 0.001). Like BCM and ASMMI, both RF-CSA and RF-y-axis showed significant differences between the non-sarcopenia group and the confirmed (p < 0.001) and severe sarcopenia groups (p = 0.027, p = 0.039).
Significant differences were also observed between the non-sarcopenia and sarcopenia probable groups when comparing the data for PhA (p = 0.044). The same pattern was noted for the other two diagnostic components of sarcopenia, showing significantly higher HGS values in patients without sarcopenia compared to those with probable (p = 0.037), confirmed (p = 0.002), and severe sarcopenia (p < 0.001). SPPB values in patients with severe sarcopenia were also significantly lower than those in the other groups (p < 0.001).
As presented with malnutrition, we did not find differences between sarcopenia groups and other sociodemographic and clinical variables.
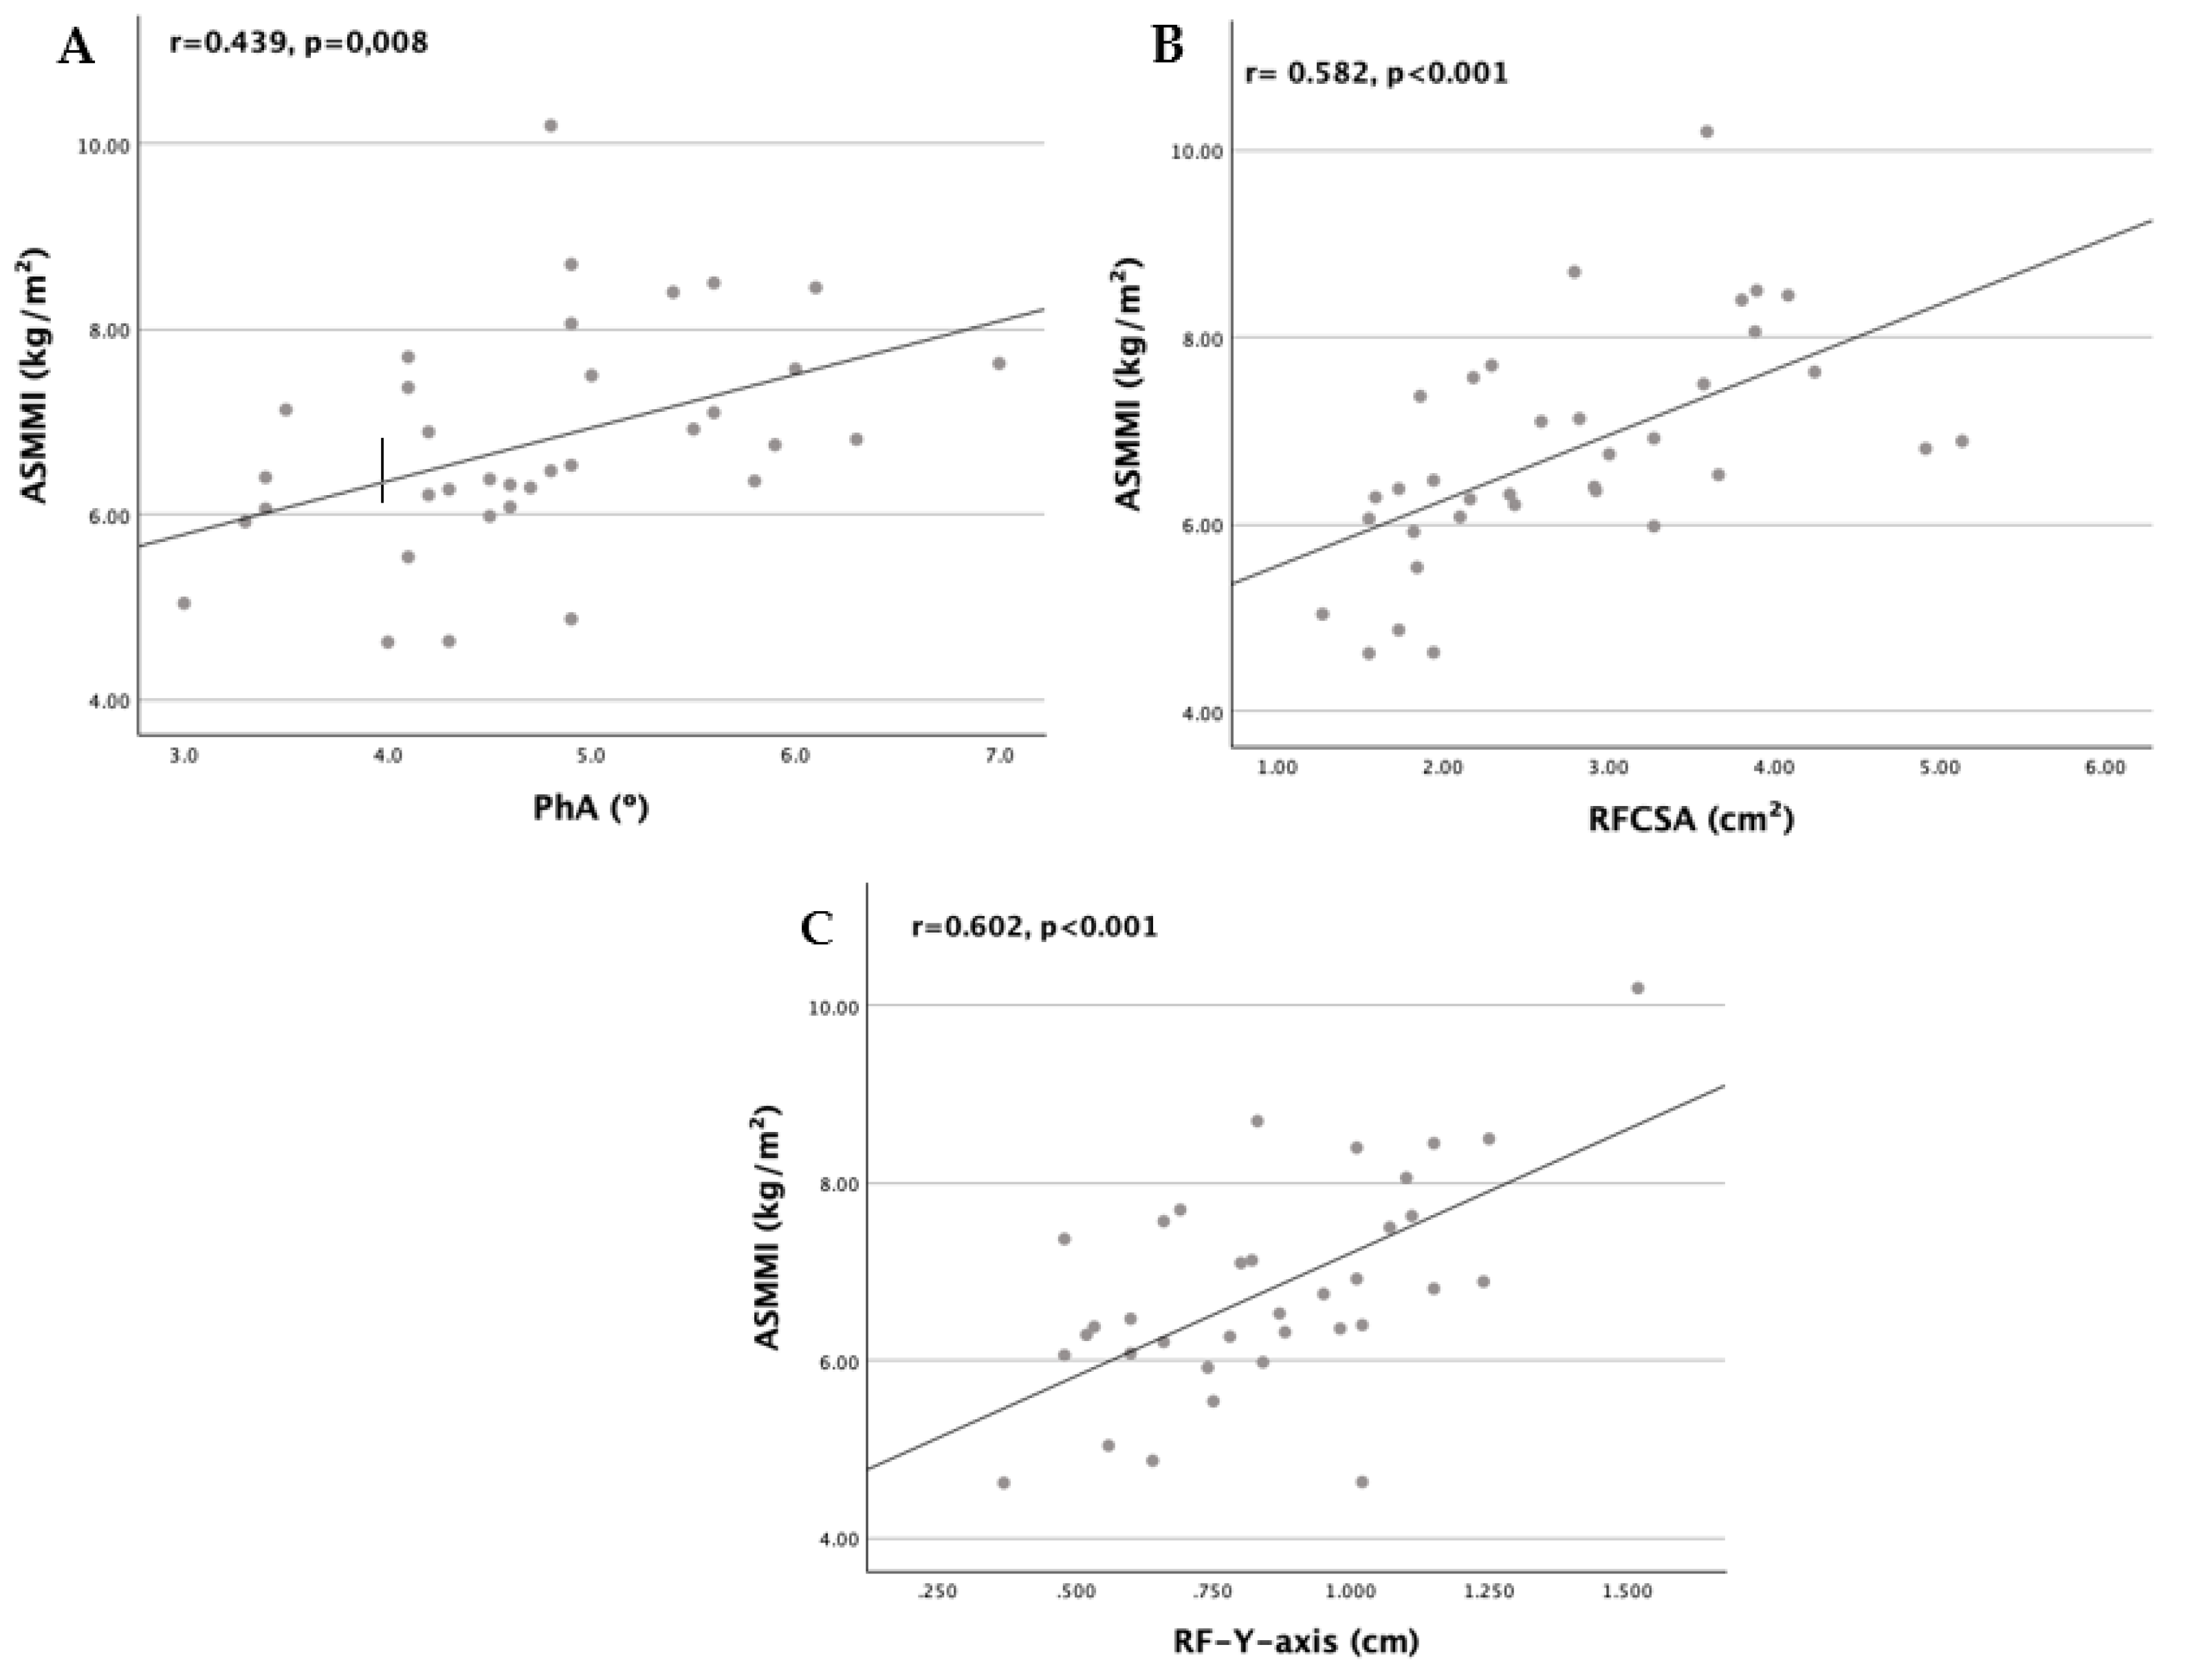
PhA showed a weak but significant direct correlation with ASMMI (r = 0.439, p = 0.008), whereas RFCSA (r = 0.582, p < 0.001) and RF-Y-axis (r = 0.602, p < 0.001) were significantly and moderately correlated with ASMMI. As shown in Table 5, although BCM (r = 0.397, p = 0.018) displayed a statistically significant correlation with BMI, PhA did not; therefore, it was also not correlated with weight loss, similar to RFCSA. RF-Y-axis was the only muscle mass-related measure significantly correlated with all three diagnostic components of malnutrition, namely weight loss (r = -0.386, p = 0.022), BMI (r = 0.599, p < 0.001), and ASMMI.
In contrast, adipose tissue markers such as RF-AT, T-SAT and S-SAT were also ultrasound measurements associated with weight loss and BMI. All three—RF-AT (r = 0.742, p < 0.001), total subcutaneous (r = 0.826, p < 0.001), and superficial subcutaneous abdominal fat (r = 0.799, p < 0.001)—showed high correlations with BMI, as well as FM (r = 0.543, p < 0.001), but insignificant correlations with weight loss. These findings suggest that RF-Y-axis may perform better than the other parameters as a predictor of malnutrition.
Figure 2.
Scatter plot graphs of correlation between ASMMI and (A) PhA, (B) RFCSA, (C) RF-Y-axis.
As detailed in Table 6, regarding the diagnostic components of sarcopenia, PhA exhibited statistically significant direct correlations with HGS (r = 0.556, p < 0.001), ASMMI (r = 0.439, p = 0.008), and SPPB (r = 0.475, p = 0.004), similar to BCM; however, the correlations with PhA were weaker, as previously mentioned. Although both RFCSA and RF-Y-axis showed significant and moderate correlations with ASMMI, RF-Y-axis (r = 0.602, p < 0.001) demonstrated the strongest association. Only RFCSA was statistically significantly correlated with HGS (r = 0.447, p = 0.007). Neither ultrasound measure was correlated with SPPB.
These results suggest that PhA may provide a better prediction of sarcopenia than either RFCSA or RF-Y-axis.
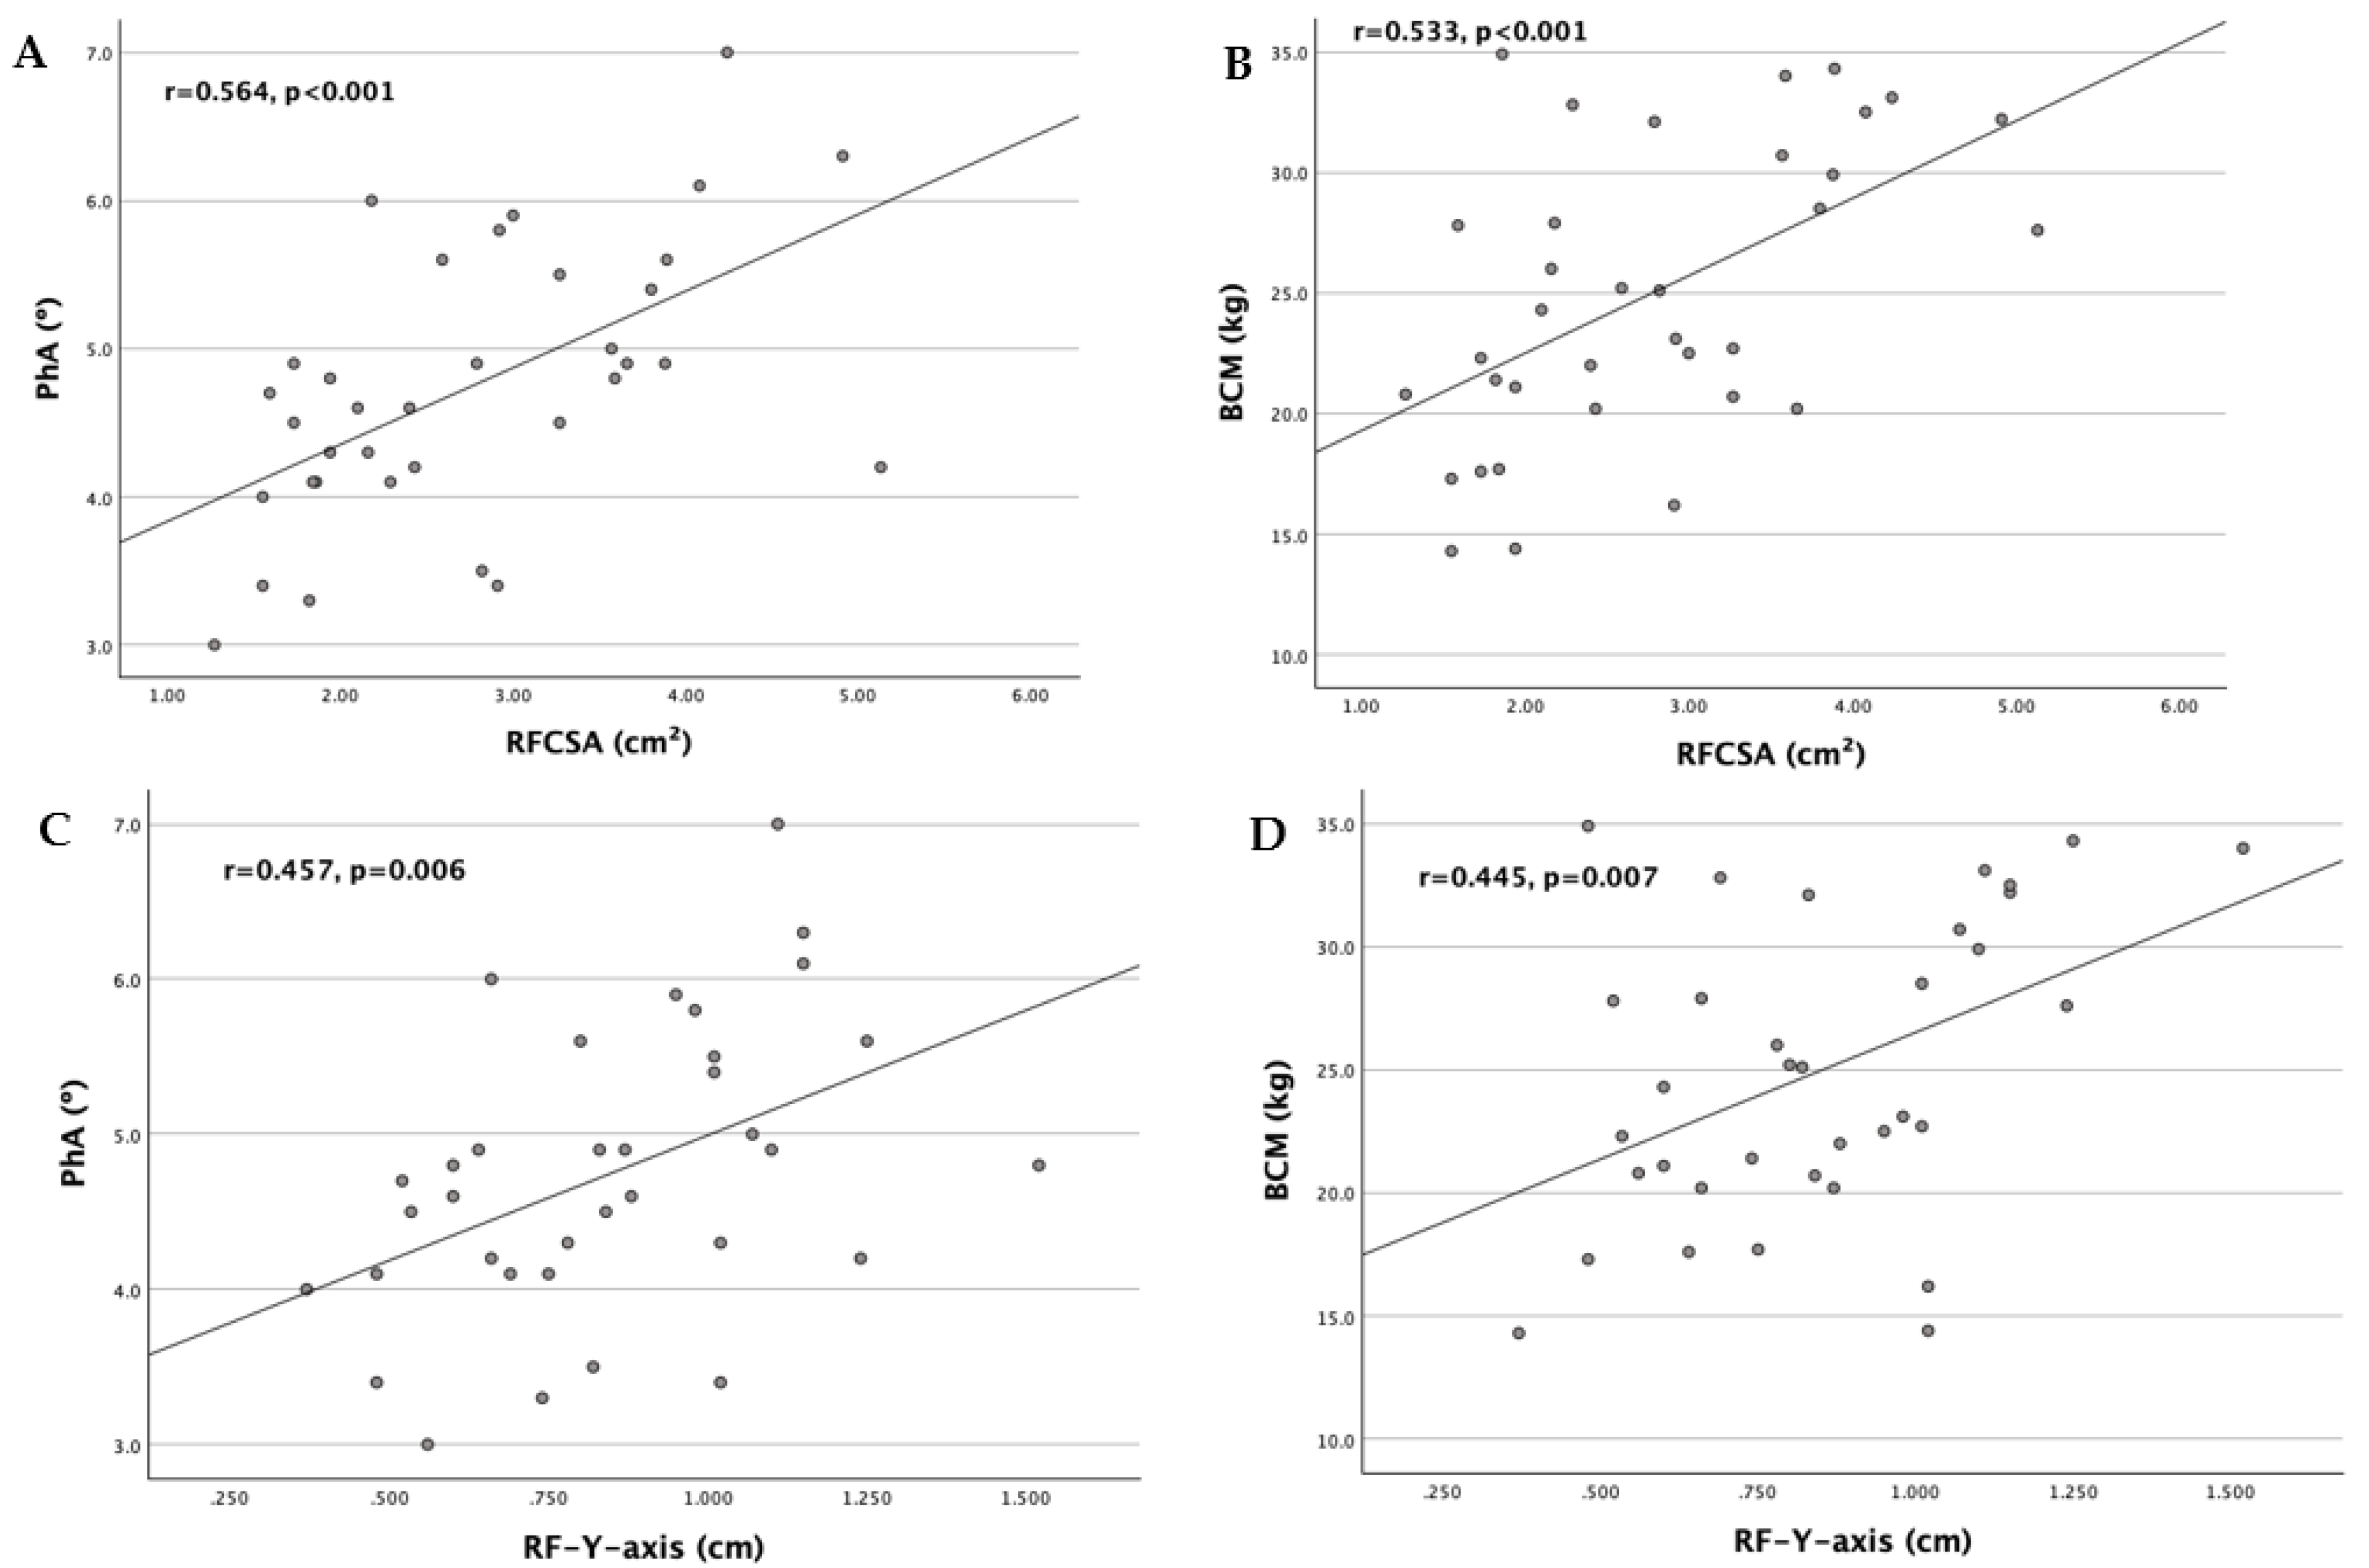
As shown in Figure 3, a positive correlation was found between RF ultrasound measurements and BIVA-derived parameters as shown in figure 2. RFCSA showed a moderate positive correlation with PhA (r=0.564, p<0.001) and BCM (r=0.533, p<0.001). RF-Y-axis revealed a weak positive correlation with PhA (r=0.457, p=0.006) and BCM (r=0.445, p=0.007).
Figure 3.
Scatter plot graphs of correlation between RF ultrasound measurements and BIVA-derived parameters: (A) RFCSA with PhA, (B) RFCSA with BCM, (C) RF-Y-axis with PhA and (D) RF-Y-axis with BCM.
Figure 3.
Scatter plot graphs of correlation between RF ultrasound measurements and BIVA-derived parameters: (A) RFCSA with PhA, (B) RFCSA with BCM, (C) RF-Y-axis with PhA and (D) RF-Y-axis with BCM.
The unadjusted binary logistic regression models aimed at predicting the presence of malnutrition demonstrated that higher values of the RF-Y-axis (OR = 0.002, IC 95%: 0.000-0.418, p = 0.023), total subcutaneous abdominal fat (OR = 0.192, IC 95%: 0.043-0.851, p = 0.030), and superficial subcutaneous abdominal fat (OR = 0.019, IC 95%: 0.001-0.448, p = 0.014) are protective factors against this condition. As shown in Table 7, it was revealed that for each one-cm increase in RF-Y-axis, total subcutaneous abdominal fat, and superficial subcutaneous abdominal fat, the likelihood of not having malnutrition is 500, 5.2, and 52.6 times higher, respectively.
Then, the crude analyses for predicting sarcopenia indicated that higher values of PhA (OR = 0.167, IC 95%: 0.047-0.591, p = 0.006) and ultrasound measurements of the rectus femoris, namely RFCSA (OR = 0.212, IC 95%: 0.074-0.605, p = 0.004) and RF-Y-axis (OR = 0.002, IC 95%: 0.000-0.143, p = 0.004) are protective against this condition. Specifically, the likelihood of being free from sarcopenia increases by 5.99 times with each one-degree increase in PhA. Similarly, for every one-cm increase in RFCSA and RF-Y-axis, the probability of not having sarcopenia rises by 4.72 and 500 times, respectively.
It is worth noting that BCM, like the RF-Y-axis, showed good predictive ability in both crude models for malnutrition and sarcopenia. However, the estimation of this parameter relies on predictive BIA equations, which require data such as weight and height that are not always available. For this reason, attention has been focused on the results corresponding to PhA, RFCSA, and the RF-Y-axis. Multivariable logistic regression models were not conducted due to the limited sample size.
4. Discussion
To the best of our knowledge, this is the first study to investigate the potential usefulness of phase angle and nutritional ultrasound in identifying the presence of malnutrition and sarcopenia in European patients with EGC, using the most recent diagnostic criteria (GLIM and EWGSOP2). Only two studies have assessed the predictive value of the PhA in patients with gastrointestinal cancer, one focusing solely on malnutrition [72] and the other including sarcopenia [73]. In fact, when considering ultrasound, only one study has utilized RF-CSA and RF-Y-axis to predict these two deleterious conditions in head and neck cancer patients [74], while another one to anticipate 12-month mortality in a similar sample [45].
Our investigation identified that malnutrition was highly prevalent in esophagus and gastric cancer patients (82.8%), with 31.4% of patients in moderate malnutrition and 51.4% in severe malnutrition. These values are higher than those found in most studies with the same population and similar methodology [73,75,76,77]. Moreover, these investigations have emphasized that those patients who are candidates for oncologic surgery, such as most of those included in our study, are twice as likely to present malnutrition. A study recorded 72.2% of malnutrition in patients after esophagogastric cancer surgery [78].
Moreover, this research shows that sarcopenia was highly prevalent in the patients with EGC analyzed, representing 51.5% of them. As with undernutrition, these results are significantly higher compared to other studies [79,80].The discrepancies observed can primarily be attributed to differences in methodology, as most studies have used different diagnostic criteria or another technique to assess body composition, like CT scans. Only one study included the EWGSOP2 diagnostic algorithm for sarcopenia, which found a 43.3% of sarcopenic patients [81].However, in studies that included patients who underwent esophagectomy or gastrectomy [82,83], the prevalence of sarcopenia increased considerably (57.4% and 57.7% respectively), more closely resembling our results. In fact, most of our patients classified in confirmed sarcopenia or severe sarcopenia were submitted to surgical management.
Clinical characteristics, such as tumor site, tumor stage, and type of treatment, did not show significant differences between the malnutrition and sarcopenia groups, likely due to sample heterogeneity, which resulted in very small frequencies in each subgroup. However, statistically significant differences were observed in some BIVA-derived parameters, such as PhA, ASMMI, and BCM. This trend has also been recorded by multiple studies carried out in oncology patients [34,84,85]. PhA was positively correlated with all the components of sarcopenia diagnosis (ASMMI, HGS and SPPB). Zuo et al. previously reported a similar correlation in gastric cancer patients [73]. Unlike the results observed in our study, they also found a positive correlation between PhA and all the nutritional indices used to diagnose malnutrition according to GLIM criteria.
Interestingly, BCM was the parameter most strongly correlated with the diagnostic components of malnutrition and sarcopenia. Also, the crude analyses for predicting these two conditions demonstrated that a higher value of BCM is a protective factor against malnutrition and sarcopenia. These results are consistent with those reported by Herrera-Martínez et al. in a large cohort of patients with head and neck cancer [86]. Their results demonstrated that BCM was more strongly associated with malnutrition (OR = 0.88, 95% CI = 0.84–0.93, P < 0.001) and sarcopenia (OR = 0.81, 95% CI = 0.76–0.87, P < 0.001) compared to PhA (OR = 0.54, 95% CI = 0.40–0.71, P < 0.001) (OR = 0.47, 95% CI = 0.33–0.66, P < 0.001).
However, the aim of the present study focused on parameters such as PhA due to its clinical significance, but in our study, phase angle was not able to predict malnutrition, although it could predict sarcopenia. Conversely, the study by Yang et al. using logistic regression models, confirmed PhA as a valuable indicator of malnutrition in patients with gastrointestinal cancer (OR = 0.548, 95% CI = 0.385–0.780, P < 0.001) [72]. A potential explanation for the discrepancies could be the altered hydration status and the small size of our study sample. The mean ECW/TBW index found that we found exceeded the reference value established by Ge et al. [87] for the oncologic population with sarcopenia, evidencing a state of overhydration (ECW/TBW ≥ 0.385), which may interfere with correlations involving PhA.
The use of NU® derived parameters based on muscle area and thickness (RFCSA and RF-Y-axis respectively) may contribute to the assessment of malnutrition and sarcopenia. We found a moderate positive correlation between RFCSA and R-Y-axis with ASMMI, as previously described by Hida et al. [88]. We also detected a weak correlation between RFCSA and HGS as Lopez-Gómez et al. [89], which indicates that RF ultrasound measurements could be related not only with the muscle quantity, but also with the muscle strength. This is supported by previous research of the role of ultrasound in the prediction of sarcopenia in elderly patients. It was revealed that RFCSA and RF-Y-axis were the best indicators for detecting loss of muscle mass and strength [90].
RF-Y-axis was the only marker capable of predicting both sarcopenia and malnutrition. Furthermore, it exhibited the strongest correlation with ASMMI when considering PhA and RFCSA. Ozturk et al. also disclosed that RF-Y-axis had a slightly greater positive correlation with the skeletal muscle mass for the diagnosis of malnutrition using GLIM criteria, in hospitalized internal medicine patients [91].
Due to the limited literature using these ultrasound measurements as markers of malnutrition and sarcopenia, making direct comparisons was challenging. In cancer patients we only have the data reported by two Spanish studies [74,89]. In one hand, Fernández-Jiménez et al. described that high levels of the RF-CSA (OR = 0.81 (0.68–0.98), p < 0.05) and RF-Y-axis (OR = 0.31 (0.15–0.61), p < 0.001) were associated with a decreased risk of malnutrition, as defined with GLIM criteria. Sarcopenia showed the same trend (OR = 0.64 (0.49–0.82), p < 0.001) for RFCSA and (OR = 0.27 (0.11–0.68), p < 0.01) for RF-Y-axis. In the other hand, Lopez-Gómez did only find statically differences of the RFCSA with sarcopenia diagnosis (sarcopenia: 2.47 cm2 (±0.54 cm2); no sarcopenia: 3.65 cm2 (±1.34 cm2); p = 0.02), but no differences with malnutrition.
Concerning adipose tissue, assessed by NU®, we found that all abdominal measurements (T-SAT, S-SAT and VAT) and RF-adipose tissue were significantly different between malnutrition groups. Additionally, T-SAT and S-SAT were correlated with all the components of malnutrition diagnosis, and they could predict the malnutrition in the crude logistic regression analysis. As expected and described by other studies [74], the US adipose tissue measurements did not show any relation with sarcopenia parameters, since they are highly associated with methods of assessing fat deposition and distribution.
Furthermore, we found a significant correlation between RFCSA and R-Y-axis with PhA, BCM and ASMMI which is consistent with a previous study in a longitudinal cohort of patients with cancer [45] and with the DRECO (Disease-Related caloric-protein malnutrition EChOgraphy) study [92]. These findings could inform the combined use of BIVA and NU®, which are readily available in routine clinical practice, to monitor the nutritional status of cancer patients.
There were several limitations to the current study. The first is the heterogeneity of the population under analysis regarding tumor stage, type of treatment and BMI, which weaken the results. The second is the small sample size of patients evaluated, which limited the ability to create multivariate logistic regression models. In addition, given the predominance of men in GI cancer studies, as is the case in the present cohort, drawing conclusions by gender in body composition is difficult. Therefore, multicenter trials with larger sample sizes are essential for further validation. Third, the cross-sectional nature of the study precluded the evaluation of cause-effect relationships derived from nutritional intervention, as well as the analysis of complications and survival outcomes.
5. Conclusions
In conclusion, RF-Y-axis is the only parameter that appears to be a promising and useful independent predictor of both malnutrition and sarcopenia in this sample of EGC patients. These results reinforce the implementation of RF-Y-axis in routine clinical practice and its use as a potential low muscle quantity or quality criterion into the EWGSOP2 criteria and as a potential phenotypic criterion for muscle mass loss into the GLIM criteria. Nevertheless, PhA and RFCSA had good performance in predicting sarcopenia, but not malnutrition in the same population. This suggests the need for a larger sample to demonstrate stronger correlations between these two markers and ASMMI, in order to effectively determine their usefulness as predictors not only of the presence but also of the severity of malnutrition and sarcopenia.
This study represents the initial exploration of an ongoing prospective nutritional follow-up project aimed at improving the process of identifying patients who require multimodal interventions, as well as assessing the outcomes of these interventions in terms of body composition and function. In this way, the research conducted would allow the results obtained to be translated into a more practical, effective, and objective morphofunctional assessment, thereby supporting the work of health professionals.
Author Contributions
Conceptualization, E.V.M.; M.J.P.S; B.T.M and M.A.P; methodology, E.V.M.; formal analysis, E.V.M. and M.J.P.S.; investigation, E.V.M; M.J.P.S.; M.A.P; A.R.P; E.G.S; S.M.S; A.D.M; A.M.G; A.C.V and A.D; resources, J.F.M.T.; data curation, E.V.M. and M.J.P.S; writing—original draft preparation, E.V.M. and M.J.P.S; writing—review and editing, E.V.M.; M.J.P.S; B.T.M and M.A.P.; visualization, E.V.M.; supervision, M.A.P, B.T.M and J.F.M.T.; project administration, E.V.M; M.A.P and J.F.M.T.; funding acquisition, J.F.M.T. All authors have read and agreed to the published version of the manuscript.
Funding
E.V.M is supported by a predoctoral fellowship (“Formación del Profesorado Universitario” Ref: FPU23/03502) and this research was funded by SENPE Foundation (“Grant for the best research project presented in Clinical Nutrition on morphofunctional assessment in patients with gastrointestinal tract disease”).
Institutional Review Board Statement
The study was conducted in accordance with the Declaration of Helsinki, and approved by Clinical Research Ethics Committee of the La Fe Health Research Institute (number 2023-1188-1, approval date December 20th 2023).
Informed Consent Statement
Informed consent was obtained from all subjects involved in the study.
Data Availability Statement
Data are contained within the article.
Conflicts of Interest
The authors declare no conflicts of interest.
References
- Bray, F.; Laversanne, M.; Sung, H.; Ferlay, J.; Siegel, R.L.; Soerjomataram, I.; Jemal, A. Global Cancer Statistics 2022: GLOBOCAN Estimates of Incidence and Mortality Worldwide for 36 Cancers in 185 Countries. CA Cancer J Clin 2024, 74, 229–263. [Google Scholar] [CrossRef]
- Xie, Y.; Shi, L.; He, X.; Luo, Y. Gastrointestinal Cancers in China, the USA, and Europe. Gastroenterol Rep (Oxf) 2021, 9, 91–104. [Google Scholar] [CrossRef] [PubMed]
- Jardim, S.R.; de Souza, L.M.P.; de Souza, H.S.P. The Rise of Gastrointestinal Cancers as a Global Phenomenon: Unhealthy Behavior or Progress? Int J Environ Res Public Health 2023, 20, 3640. [Google Scholar] [CrossRef] [PubMed]
- Giusti, F.; Martos, C.; Bettio, M.; Negrão Carvalho, R.; Zorzi, M.; Guzzinati, S.; Rugge, M. Geographical and Temporal Differences in Gastric and Oesophageal Cancer Registration by Subsite and Morphology in Europe. Front Oncol 2024, 14, 1250107. [Google Scholar] [CrossRef]
- Movahed, S.; Norouzy, A.; Motlagh, A.G.; Eslami, S.; Khadem-Rezaiyan, M.; Emadzadeh, M.; Nematy, M.; Ghayour-Mobarhan, M.; Tabrizi, F.V.; Bozzetti, F.; Toussi, M.S. Nutritional Status in Patients with Esophageal Cancer Receiving Chemoradiation and Assessing the Efficacy of Usual Care for Nutritional Managements. Asian Pac J Cancer Prev 2020, 21, 2315. [Google Scholar] [CrossRef] [PubMed]
- Ajani, J.A.; D’Amico, T.A.; Bentrem, D.J.; Cooke, D.; Corvera, C.; Das, P.; Enzinger, P.C.; Enzler, T.; Farjah, F.; Gerdes, H.; Gibson, M.; Grierson, P.; Hofstetter, W.L.; Ilson, D.H.; Jalal, S.; Keswani, R.N.; Kim, S.; Kleinberg, L.R.; Klempner, S.; Lacy, J.; Licciardi, F.; Ly, Q.P.; Matkowskyj, K.A.; McNamara, M.; Miller, A.; Mukherjee, S.; Mulcahy, M.F.; Outlaw, D.; Perry, K.A.; Pimiento, J.; Poultsides, G.A.; Reznik, S.; Roses, R.E.; Strong, V.E.; Su, S.; Wang, H.L.; Wiesner, G.; Willett, C.G.; Yakoub, D.; Yoon, H.; McMillian, N.R.; Pluchino, L.A. Esophageal and Esophagogastric Junction Cancers, Version 2.2023, NCCN Clinical Practice Guidelines in Oncology. J Natl Compr Canc Netw 2023, 21, 393–422. [Google Scholar] [CrossRef] [PubMed]
- Wöll, E.; Amann, A.; Eisterer, W.; Gerger, A.; Grünberger, B.; Rumpold, H.; Weiss, L.; Winder, T.; Greil, R.; Prager, G.W. Treatment Algorithm for Patients With Gastric Adenocarcinoma: Austrian Consensus on Systemic Therapy-An Update. Anticancer Res 2023, 43, 2889–2897. [Google Scholar] [CrossRef]
- Ravasco, P.; Monteiro-Grillo, I.; Marques Vidal, P.; Camilo, M.E. Cancer: Disease and Nutrition Are Key Determinants of Patients’ Quality of Life. Support Care Cancer 2004, 12, 246–252. [Google Scholar] [CrossRef]
- Jordan, T.; Mastnak, D.M.; Palamar, N.; Kozjek, N.R. Nutritional Therapy for Patients with Esophageal Cancer. Nutr Cancer 2018, 70, 23–29. [Google Scholar] [CrossRef] [PubMed]
- Peterson, S.J.; Mozer, M. Differentiating Sarcopenia and Cachexia Among Patients With Cancer. Nutr Clin Pract 2017, 32, 30–39. [Google Scholar] [CrossRef]
- Ferrara, M.; Samaden, M.; Ruggieri, E.; Vénéreau, E. Cancer Cachexia as a Multiorgan Failure: Reconstruction of the Crime Scene. Front Cell Dev Biol 2022, 10, 960341. [Google Scholar] [CrossRef]
- Ma, L.; Poulin, P.; Feldstain, A.; Chasen, M.R. The Association between Malnutrition and Psychological Distress in Patients with Advanced Head-and-Neck Cancer. Curr Oncol 2013, 20, e554-60. [Google Scholar] [CrossRef]
- Arends, J.; Bachmann, P.; Baracos, V.; Barthelemy, N.; Bertz, H.; Bozzetti, F.; Fearon, K.; Hütterer, E.; Isenring, E.; Kaasa, S.; Krznaric, Z.; Laird, B.; Larsson, M.; Laviano, A.; Mühlebach, S.; Muscaritoli, M.; Oldervoll, L.; Ravasco, P.; Solheim, T.; Strasser, F.; de van der Schueren, M.; Preiser, J.C. ESPEN Guidelines on Nutrition in Cancer Patients. Clin Nutr 2017, 36, 11–48. [Google Scholar] [CrossRef] [PubMed]
- Muscaritoli, M.; Lucia, S.; Farcomeni, A.; Lorusso, V.; Saracino, V.; Barone, C.; Plastino, F.; Gori, S.; Magarotto, R.; Carteni, G.; Chiurazzi, B.; Pavese, I.; Marchetti, L.; Zagonel, V.; Bergo, E.; Tonini, G.; Imperatori, M.; Iacono, C.; Maiorana, L.; Pinto, C.; Rubino, D.; Cavanna, L.; Di Cicilia, R.; Gamucci, T.; Quadrini, S.; Palazzo, S.; Minardi, S.; Merlano, M.; Colucci, G.; Marchetti, P.; Fioretto, L.; Cipriani, G.; Barni, S.; Lonati, V.; Frassoldati, A.; Surace, G.C.; Porzio, G.; Martella, F.; Altavilla, G.; Santarpia, M.C.; Pronzato, P.; Levaggi, A.; Contu, A.; Contu, M.; Adamo, V.; Berenato, R.; Marchetti, F.; Pellegrino, A.; Violante, S.; Guida, M. Prevalence of Malnutrition in Patients at First Medical Oncology Visit: The PreMiO Study. Oncotarget 2017, 8, 79884–79896. [Google Scholar] [CrossRef]
- Brown, L.R.; Laird, B.J.A.; Wigmore, S.J.; Skipworth, R.J.E. Understanding Cancer Cachexia and Its Implications in Upper Gastrointestinal Cancers. Curr Treat Options Oncol 2022, 23, 1732–1747. [Google Scholar] [CrossRef]
- Curtis, A.R.; Livingstone, K.M.; Daly, R.M.; Marchese, L.E.; Kiss, N. Associations between Dietary Patterns and Malnutrition, Low Muscle Mass and Sarcopenia in Adults with Cancer: A Scoping Review. Int J Environ Res Public Health 2022, 19, 1769. [Google Scholar] [CrossRef]
- Bossi, P.; Delrio, P.; Mascheroni, A.; Zanetti, M. The Spectrum of Malnutrition/Cachexia/Sarcopenia in Oncology According to Different Cancer Types and Settings: A Narrative Review. Nutrients 2021, 13, 1980. [Google Scholar] [CrossRef] [PubMed]
- Arends, J. Malnutrition in Cancer Patients: Causes, Consequences and Treatment Options. European Journal of Surgical Oncology 2024, 50, 107074. [Google Scholar] [CrossRef] [PubMed]
- Van Soom, T.; El Bakkali, S.; Gebruers, N.; Verbelen, H.; Tjalma, W.; van Breda, E. The Effects of Chemotherapy on Energy Metabolic Aspects in Cancer Patients: A Systematic Review. Clinical Nutrition 2020, 39, 1863–1877. [Google Scholar] [CrossRef]
- Lee, D.U.; Fan, G.H.; Hastie, D.J.; Addonizio, E.A.; Han, J.; Prakasam, V.N.; Karagozian, R. The Clinical Impact of Malnutrition on the Postoperative Outcomes of Patients Undergoing Gastrectomy for Gastric Cancer: Propensity Score Matched Analysis of 2011-2017 Hospital Database. Clin Nutr ESPEN 2021, 46, 484–490. [Google Scholar] [CrossRef] [PubMed]
- Browning, A.F.; Chong, L.; Read, M.; Hii, M.W. Economic Burden of Complications and Readmission Following Oesophageal Cancer Surgery. ANZ J Surg 2022, 92, 2901–2906. [Google Scholar] [CrossRef] [PubMed]
- Del Giorno, R.; Quarenghi, M.; Stefanelli, K.; Rigamonti, A.; Stanglini, C.; De Vecchi, V.; Gabutti, L. Phase Angle Is Associated with Length of Hospital Stay, Readmissions, Mortality, and Falls in Patients Hospitalized in Internal-Medicine Wards: A Retrospective Cohort Study. Nutrition 2021, 85, 111068. [Google Scholar] [CrossRef]
- Ballesteros-Pomar, M.D.; Gajete-Martín, L.M.; Pintor-De-la-maza, B.; González-Arnáiz, E.; González-Roza, L.; García-Pérez, M.P.; González-Alonso, V.; García-González, M.A.; de Prado-Espinosa, R.; Cuevas, M.J.; Fernández-Perez, E.; Mostaza-Fernández, J.L.; Cano-Rodríguez, I. Disease-Related Malnutrition and Sarcopenia Predict Worse Outcome in Medical Inpatients: A Cohort Study. Nutrients 2021, 13, 2937. [Google Scholar] [CrossRef] [PubMed]
- Cederholm, T.; Jensen, G.L.; Correia, M.I.T.D.; Gonzalez, M.C.; Fukushima, R.; Higashiguchi, T.; Baptista, G.; Barazzoni, R.; Blaauw, R.; Coats, A.; Crivelli, A.; Evans, D.C.; Gramlich, L.; Fuchs-Tarlovsky, V.; Keller, H.; Llido, L.; Malone, A.; Mogensen, K.M.; Morley, J.E.; Muscaritoli, M.; Nyulasi, I.; Pirlich, M.; Pisprasert, V.; de van der Schueren, M.A.E.; Siltharm, S.; Singer, P.; Tappenden, K.; Velasco, N.; Waitzberg, D.; Yamwong, P.; Yu, J.; Van Gossum, A.; Compher, C.; Jensen, G.L.; Charlene, C.; Cederholm, T.; Van Gossum, A.; Correia, M.I.T.D.; Fukushima, R.; Higashiguchi, T.; Fuchs, V. GLIM Criteria for the Diagnosis of Malnutrition - A Consensus Report from the Global Clinical Nutrition Community. Clin Nutr 2019, 38, 1–9. [Google Scholar] [CrossRef] [PubMed]
- Cruz-Jentoft, A.J.; Bahat, G.; Bauer, J.; Boirie, Y.; Bruyère, O.; Cederholm, T.; Cooper, C.; Landi, F.; Rolland, Y.; Sayer, A.A.; Schneider, S.M.; Sieber, C.C.; Topinkova, E.; Vandewoude, M.; Visser, M.; Zamboni, M.; Bautmans, I.; Baeyens, J.P.; Cesari, M.; Cherubini, A.; Kanis, J.; Maggio, M.; Martin, F.; Michel, J.P.; Pitkala, K.; Reginster, J.Y.; Rizzoli, R.; Sánchez-Rodríguez, D.; Schols, J. Sarcopenia: Revised European Consensus on Definition and Diagnosis. Age Ageing 2019, 48, 16–31. [Google Scholar] [CrossRef] [PubMed]
- Kokura, Y.; Nishioka, S.; Maeda, K.; Wakabayashi, H. Ultrasound Utilized by Registered Dietitians for Body Composition Measurement, Nutritional Assessment, and Nutritional Management. Clin Nutr ESPEN 2023, 57, 173–180. [Google Scholar] [CrossRef] [PubMed]
- Sabatino, A.; D’Alessandro, C.; Regolisti, G.; di Mario, F.; Guglielmi, G.; Bazzocchi, A.; Fiaccadori, E. Muscle Mass Assessment in Renal Disease: The Role of Imaging Techniques. Quant Imaging Med Surg 2020, 10, 1672–1686. [Google Scholar] [CrossRef] [PubMed]
- Lima, J.; Foletto, E.; Cardoso, R.C.B.; Garbelotto, C.; Frenzel, A.P.; Carneiro, J.U.; Carpes, L.S.; Barbosa-Silva, T.G.; Gonzalez, M.C.; Silva, F.M. Ultrasound for Measurement of Skeletal Muscle Mass Quantity and Muscle Composition/Architecture in Critically Ill Patients: A Scoping Review on Studies’ Aims, Methods, and Findings. Clinical Nutrition 2024, 43, 95–110. [Google Scholar] [CrossRef]
- Manfrinato Miola, T.; Santos Da Conceição, E.L.; De Oliveira Souza, J.; Vieira Barbosa, P.N.; José, F.; Coimbra, F.; Galvão, A.; Bitencourt, V. CT Assessment of Nutritional Status and Lean Body Mass in Gastric and Esophageal Cancer. Applied Cancer Research 2018 38:1 2018, 38, 1–5. [Google Scholar] [CrossRef]
- Miola, T.; Souza, J.D.O.; Santos, M.C.; Gross, J.L.; Couto, N.L.; Bitencourt, A.G.V. Comparison between Nutritional Assessment and Computed Tomography Analysis of Muscle Mass in Patients with Lung Cancer. Braspen J 2021, 36, 341–347. [Google Scholar] [CrossRef]
- da Silva, B.R.; Orsso, C.E.; Gonzalez, M.C.; Sicchieri, J.M.F.; Mialich, M.S.; Jordao, A.A.; Prado, C.M. Phase Angle and Cellular Health: Inflammation and Oxidative Damage. Rev Endocr Metab Disord 2022, 24, 543. [Google Scholar] [CrossRef] [PubMed]
- Lukaski, H.C.; Kyle, U.G.; Kondrup, J. Assessment of Adult Malnutrition and Prognosis with Bioelectrical Impedance Analysis: Phase Angle and Impedance Ratio. Curr Opin Clin Nutr Metab Care 2017, 20, 330–339. [Google Scholar] [CrossRef]
- Norman, K.; Stobäus, N.; Pirlich, M.; Bosy-Westphal, A. Bioelectrical Phase Angle and Impedance Vector Analysis--Clinical Relevance and Applicability of Impedance Parameters. Clin Nutr 2012, 31, 854–861. [Google Scholar] [CrossRef]
- Branco, M.G.; Mateus, C.; Capelas, M.L.; Pimenta, N.; Santos, T.; Mäkitie, A.; Ganhão-Arranhado, S.; Trabulo, C.; Ravasco, P. Bioelectrical Impedance Analysis (BIA) for the Assessment of Body Composition in Oncology: A Scoping Review. Nutrients 2023, 15, 4792. [Google Scholar] [CrossRef]
- Bellido, D.; García-García, C.; Talluri, A.; Lukaski, H.C.; García-Almeida, J.M. Future Lines of Research on Phase Angle: Strengths and Limitations. Rev Endocr Metab Disord 2023, 24, 563. [Google Scholar] [CrossRef] [PubMed]
- Norman, K.; Herpich, C.; Müller-Werdan, U. Role of Phase Angle in Older Adults with Focus on the Geriatric Syndromes Sarcopenia and Frailty. Rev Endocr Metab Disord 2023, 24, 429–437. [Google Scholar] [CrossRef]
- Norman, K.; Stobäus, N.; Pirlich, M.; Bosy-Westphal, A. Bioelectrical Phase Angle and Impedance Vector Analysis – Clinical Relevance and Applicability of Impedance Parameters. Clinical Nutrition 2012, 31, 854–861. [Google Scholar] [CrossRef]
- Nijholt, W.; Jager-Wittenaar, H.; Raj, I.S.; van der Schans, C.P.; Hobbelen, H. Reliability and Validity of Ultrasound to Estimate Muscles: A Comparison between Different Transducers and Parameters. Clin Nutr ESPEN 2020, 35, 146–152. [Google Scholar] [CrossRef]
- Berger, J.; Bunout, D.; Barrera, G.; de la Maza, M.P.; Henriquez, S.; Leiva, L.; Hirsch, S. Rectus Femoris (RF) Ultrasound for the Assessment of Muscle Mass in Older People. Arch Gerontol Geriatr 2015, 61, 33–38. [Google Scholar] [CrossRef]
- Chen, Y.L.; Liu, P.T.; Chiang, H.K.; Lee, S.H.; Lo, Y.L.; Yang, Y.C.; Chiou, H.J. Ultrasound Measurement of Rectus Femoris Muscle Parameters for Discriminating Sarcopenia in Community-Dwelling Adults. J Ultrasound Med 2022, 41, 2269–2277. [Google Scholar] [CrossRef]
- De Souza, V.A.; Oliveira, D.; Cupolilo, E.N.; Miranda, C.S.; Colugnati, F.A.B.; Mansur, H.N.; Fernandes, N.M. da S.; Bastos, M.G. Rectus Femoris Muscle Mass Evaluation by Ultrasound: Facilitating Sarcopenia Diagnosis in Pre-Dialysis Chronic Kidney Disease Stages. Clinics. [CrossRef]
- Van den Broeck, J.; Héréus, S.; Cattrysse, E.; Raeymaekers, H.; De Maeseneer, M.; Scafoglieri, A. Reliability of Muscle Quantity and Quality Measured With Extended-Field-of-View Ultrasound at Nine Body Sites. Ultrasound Med Biol 2023, 49, 1544–1549. [Google Scholar] [CrossRef] [PubMed]
- Nies, I.; Ackermans, L.L.G.C.; Poeze, M.; Blokhuis, T.J.; Ten Bosch, J.A. The Diagnostic Value of Ultrasound of the Rectus Femoris for the Diagnosis of Sarcopenia in Adults: A Systematic Review. Injury 2022, 53, S23–S29. [Google Scholar] [CrossRef] [PubMed]
- Nijholt, W.; Scafoglieri, A.; Jager-Wittenaar, H.; Hobbelen, J.S.M.; van der Schans, C.P. The Reliability and Validity of Ultrasound to Quantify Muscles in Older Adults: A Systematic Review. J Cachexia Sarcopenia Muscle 2017, 8, 702. [Google Scholar] [CrossRef] [PubMed]
- García-García, C.; Vegas-Aguilar, I.M.; Rioja-Vázquez, R.; Cornejo-Pareja, I.; Tinahones, F.J.; García-Almeida, J.M. Rectus Femoris Muscle and Phase Angle as Prognostic Factor for 12-Month Mortality in a Longitudinal Cohort of Patients with Cancer (AnyVida Trial). Nutrients 2023, 15, 522. [Google Scholar] [CrossRef] [PubMed]
- Simón-Frapolli, V.J.; Vegas-Aguilar, I.M.; Fernández-Jiménez, R.; Cornejo-Pareja, I.M.; Sánchez-García, A.M.; Martínez-López, P.; Nuevo-Ortega, P.; Reina-Artacho, C.; Estecha-Foncea, M.A.; Gómez-González, A.M.; González-Jiménez, M.B.; Avanesi-Molina, E.; Tinahones-Madueño, F.J.; García-Almeida, J.M. Phase Angle and Rectus Femoris Cross-Sectional Area as Predictors of Severe Malnutrition and Their Relationship with Complications in Outpatients with Post-Critical SARS-CoV2 Disease. Front Nutr 2023, 10, 1218266. [Google Scholar] [CrossRef]
- Deng, M.; Yan, L.; Tong, R.; Zhao, J.; Li, Y.; Yin, Y.; Zhang, Q.; Gao, J.; Wang, Q.; Zhou, X.; Hou, G. Ultrasound Assessment of the Rectus Femoris in Patients with Chronic Obstructive Pulmonary Disease Predicts Sarcopenia. International Journal of Chronic Obstructive Pulmonary Disease 2022, 17, 2801–2810. [Google Scholar] [CrossRef] [PubMed]
- Wan, Y.-L.; Hsieh, B.-Y.; Rong, M.; Tay, J.; Kong, K.H. Ultrasound Measurements of Rectus Femoris and Locomotor Outcomes in Patients with Spinal Cord Injury. Life 2022, 12, 1073. [Google Scholar] [CrossRef] [PubMed]
- Gomes, T.L.N.; Soares, J.D.P.; Borges, T.C.; Pichard, C.; Pimentel, G.D. Phase Angle Is Not Associated with Fatigue in Cancer Patients: The Hydration Impact. Eur J Clin Nutr 2020, 74, 1369–1373. [Google Scholar] [CrossRef] [PubMed]
- Martin, L.; Lagergren, J.; Blomberg, J.; Johar, A.; Bosaeus, I.; Lagergren, P. Phase Angle as a Prognostic Marker after Percutaneous Endoscopic Gastrostomy (PEG) in a Prospective Cohort Study. Scand J Gastroenterol 2016, 51, 1013–1016. [Google Scholar] [CrossRef]
- Matias, C.N.; Cavaco-Silva, J.; Reis, M.; Campa, F.; Toselli, S.; Sardinha, L.; Silva, A.M. Phase Angle as a Marker of Muscular Strength in Breast Cancer Survivors. Int J Environ Res Public Health 2020, 17, 4452. [Google Scholar] [CrossRef]
- Valentino, N.P.; Gomes, T.L.N.; Barreto, C.S.; Borges, T.C.; Soares, J.D.P.; Pichard, C.; Laviano, A.; Pimentel, G.D. Low Phase Angle Is Associated with the Risk for Sarcopenia in Unselected Patients with Cancer: Effects of Hydration. Nutrition 2021, 84, 111122. [Google Scholar] [CrossRef] [PubMed]
- Yokomachi, J.; Fukuda, T.; Mizushima, Y.; Nozawa, N.; Ishizaka, H.; Matsumoto, K.; Kambe, T.; Inoue, S.; Nishikawa, K.; Toyama, Y.; Takahashi, R.; Arakawa, T.; Yagi, H.; Yamaguchi, S.; Ugata, Y.; Nakamura, F.; Sakuma, M.; Abe, S.; Fujita, H.; Mizushima, T.; Toyoda, S.; Nakajima, T. Clinical Usefulness of Phase Angle as an Indicator of Muscle Wasting and Malnutrition in Inpatients with Cardiovascular Diseases. Asia Pac J Clin Nutr 2023, 32, 297–307. [Google Scholar] [CrossRef] [PubMed]
- Yasui-Yamada, S.; Oiwa, Y.; Saito, Y.; Aotani, N.; Matsubara, A.; Matsuura, S.; Tanimura, M.; Tani-Suzuki, Y.; Kashihara, H.; Nishi, M.; Shimada, M.; Hamada, Y. Impact of Phase Angle on Postoperative Prognosis in Patients with Gastrointestinal and Hepatobiliary-Pancreatic Cancer. Nutrition 2020, 79–80, 110891. [Google Scholar] [CrossRef] [PubMed]
- Gulin, J.; Ipavic, E.; Mastnak, D.M.; Brecelj, E.; Edhemovic, I.; Kozjek, N.R. Phase Angle as a Prognostic Indicator of Surgical Outcomes in Patients with Gastrointestinal Cancer. Radiol Oncol 2023, 57, 524. [Google Scholar] [CrossRef] [PubMed]
- Gulin, J.; Ipavic, E.; Mastnak, D.M.; Brecelj, E.; Edhemovic, I.; Kozjek, N.R. Phase Angle as a Prognostic Indicator of Surgical Outcomes in Patients with Gastrointestinal Cancer. Radiol Oncol 2023, 57, 524–529. [Google Scholar] [CrossRef]
- Conde Frio, C.; Härter, J.; Santos, L.P.; Orlandi, S.P.; Gonzalez, M.C. Phase Angle, Physical Quality of Life and Functionality in Cancer Patients Undergoing Chemotherapy. Clin Nutr ESPEN 2023, 57, 331–336. [Google Scholar] [CrossRef] [PubMed]
- Sember, V.; Meh, K.; Sorić, M.; Jurak, G.; Starc, G.; Rocha, P. Validity and Reliability of International Physical Activity Questionnaires for Adults across EU Countries: Systematic Review and Meta Analysis. Int J Environ Res Public Health 2020, 17, 7161. [Google Scholar] [CrossRef]
- Wanden-Berghe, C. Valoración antropométrica. In Valoración nutricional en el anciano. Recomendaciones prácticas de los expertos en geriatría y nutrición (SENPE y SEGG); Galénitas-Nigra Trea: Madrid, Spain, 2007; pp. 77–96. [Google Scholar]
- Gonzalez, M.C.; Mehrnezhad, A.; Razaviarab, N.; Barbosa-Silva, T.G.; Heymsfield, S.B. Calf Circumference: Cutoff Values from the NHANES 1999-2006. Am J Clin Nutr 2021, 113, 1679–1687. [Google Scholar] [CrossRef] [PubMed]
- Detsky, A.S.; Mclaughlin, J.; Baker, J.P.; Johnston, N.; Whittaker, S.; Mendelson, R.A.; Jeejeebhoy, K.N. What Is Subjective Global Assessment of Nutritional Status? JPEN J Parenter Enteral Nutr 1987, 11, 8–13. [Google Scholar] [CrossRef]
- De Groot, L.M.; Lee, G.; Ackerie, A.; van der Meij, B.S. Malnutrition Screening and Assessment in the Cancer Care Ambulatory Setting: Mortality Predictability and Validity of the Patient-Generated Subjective Global Assessment Short Form (PG-SGA SF) and the GLIM Criteria. Nutrients 2020, Vol. 12, Page 2287 2020, 12, 2287. [Google Scholar] [CrossRef]
- Du, H.; Liu, B.; Xie, Y.; Liu, J.; Wei, Y.; Hu, H.; Luo, B.; Li, Z. Comparison of Different Methods for Nutrition Assessment in Patients with Tumors. Oncol Lett 2017, 14, 165. [Google Scholar] [CrossRef]
- Lukaski, H.C.; Bolonchuk, W.W.; Hall, C.B.; Siders, W.A. Validation of Tetrapolar Bioelectrical Impedance Method to Assess Human Body Composition. J Appl Physiol (1985) 1986, 60, 1327–1332. [Google Scholar] [CrossRef] [PubMed]
- Artero, A.; Sáez Ramírez, T.; Muresan, B.T.; Ruiz-Berjaga, Y.; Jiménez-Portilla, A.; Sánchez-Juan, C.J. The Effect of Fasting on Body Composition Assessment in Hospitalized Cancer Patients. Nutr Cancer 2023, 75, 1610–1618. [Google Scholar] [CrossRef] [PubMed]
- García-Almeida, J.M.; García-García, C.; Vegas-Aguilar, I.M.; Ballesteros Pomar, M.D.; Cornejo-Pareja, I.M.; Fernández Medina, B.; de Luis Román, D.A.; Bellido Guerrero, D.; Bretón Lesmes, I.; Tinahones Madueño, F.J. Nutritional Ultrasound®: Conceptualisation, Technical Considerations and Standardisation. Endocrinol Diabetes Nutr 2023, 70, 74–84. [Google Scholar] [CrossRef]
- Trampisch, U.S.; Franke, J.; Jedamzik, N.; Hinrichs, T.; Platen, P. Optimal Jamar Dynamometer Handle Position to Assess Maximal Isometric Hand Grip Strength in Epidemiological Studies. J Hand Surg Am 2012, 37, 2368–2373. [Google Scholar] [CrossRef]
- Sánchez Torralvo, F.J.; Porras, N.; Abuín Fernández, J.; García Torres, F.; Tapia, M.J.; Lima, F.; Soriguer, F.; Gonzalo, M.; Rojo Martínez, G.; Olveira, G. Normative Reference Values for Hand Grip Dynamometry in Spain. Association with Lean Mass. Nutr Hosp 2018, 35, 98–103. [Google Scholar] [CrossRef] [PubMed]
- Santamaría-Peláez, M.; González-Bernal, J.J.; Da Silva-González, Á.; Medina-Pascual, E.; Gentil-Gutiérrez, A.; Fernández-Solana, J.; Mielgo-Ayuso, J.; González-Santos, J. Validity and Reliability of the Short Physical Performance Battery Tool in Institutionalized Spanish Older Adults. Nursing reports (Pavia, Italy) 2023, 13, 1354–1367. [Google Scholar] [CrossRef] [PubMed]
- Parra-Rodríguez, L.; Szlejf, C.; García-González, A.I.; Malmstrom, T.K.; Cruz-Arenas, E.; Rosas-Carrasco, O. Cross-Cultural Adaptation and Validation of the Spanish-Language Version of the SARC-F to Assess Sarcopenia in Mexican Community-Dwelling Older Adults. J Am Med Dir Assoc 2016, 17, 1142–1146. [Google Scholar] [CrossRef]
- Malmstrom, T.K.; Morley, J.E. SARC-F: A Simple Questionnaire to Rapidly Diagnose Sarcopenia. J Am Med Dir Assoc 2013, 14, 531–532. [Google Scholar] [CrossRef] [PubMed]
- Yang, J.; Xie, H.; Wei, L.; Ruan, G.; Zhang, H.; Shi, J.; Shi, H. Phase Angle: A Robust Predictor of Malnutrition and Poor Prognosis in Gastrointestinal Cancer. Nutrition 2024, 125. [Google Scholar] [CrossRef] [PubMed]
- Zuo, J.; Zhou, D.; Zhang, L.; Zhou, X.; Gao, X.; Zhang, J.X.; Ding, X.; Hou, W.; Wang, C.; Jiang, P.; Wang, X. Phase Angle - A Screening Tool for Malnutrition, Sarcopenia, and Complications in Gastric Cancer. Clin Nutr ESPEN 2024, 59, 334–342. [Google Scholar] [CrossRef]
- Fernández-Jiménez, R.; García-Rey, S.; Roque-Cuéllar, M.C.; Fernández-Soto, M.L.; García-Olivares, M.; Novo-Rodríguez, M.; González-Pacheco, M.; Prior-Sánchez, I.; Carmona-Llanos, A.; Muñoz-Jiménez, C.; Zarco-Rodríguez, F.P.; Miguel-Luengo, L.; Boughanem, H.; García-Luna, P.P.; García-Almeida, J.M. Ultrasound Muscle Evaluation for Predicting the Prognosis of Patients with Head and Neck Cancer: A Large-Scale and Multicenter Prospective Study. Nutrients 2024, 16, 387. [Google Scholar] [CrossRef]
- Liu, C.; Lu, Z.; Li, Z.; Xu, J.; Cui, H.; Zhu, M. Influence of Malnutrition According to the GLIM Criteria on the Clinical Outcomes of Hospitalized Patients With Cancer. Front Nutr 2021, 8, 774636. [Google Scholar] [CrossRef] [PubMed]
- Santos, M.L.D. Dos; Leite, L.D.O.; Lages, I.C.F. Prevalence of malnutrition, according to the Glim criteria, in patients who are the candidates for gastrointestinal tract surgery. Arq Bras Cir Dig 2022, 35, e1663. [Google Scholar] [CrossRef] [PubMed]
- Xu, L. Bin; Shi, M.M.; Huang, Z.X.; Zhang, W.T.; Zhang, H.H.; Shen, X.; Chen, X.D. Impact of Malnutrition Diagnosed Using Global Leadership Initiative on Malnutrition Criteria on Clinical Outcomes of Patients with Gastric Cancer. JPEN J Parenter Enteral Nutr 2022, 46, 385–394. [Google Scholar] [CrossRef] [PubMed]
- Murnane, L.C.; Forsyth, A.K.; Koukounaras, J.; Shaw, K.; King, S.; Brown, W.A.; Mourtzakis, M.; Tierney, A.C.; Burton, P.R. Malnutrition Defined by GLIM Criteria Identifies a Higher Incidence of Malnutrition and Is Associated with Pulmonary Complications after Oesophagogastric Cancer Surgery, Compared to ICD-10-Defined Malnutrition. J Surg Oncol 2023, 128, 769–780. [Google Scholar] [CrossRef] [PubMed]
- Anconina, R.; Ortega, C.; Metser, U.; Liu, Z.A.; Suzuki, C.; McInnis, M.; Darling, G.E.; Wong, R.; Taylor, K.; Yeung, J.; Chen, E.X.; Swallow, C.J.; Bajwa, J.; Jang, R.W.; Elimova, E.; Veit-Haibach, P. Influence of Sarcopenia, Clinical Data, and 2-[18F] FDG PET/CT in Outcome Prediction of Patients with Early-Stage Adenocarcinoma Esophageal Cancer. Eur J Nucl Med Mol Imaging 2022, 49, 1012–1020. [Google Scholar] [CrossRef] [PubMed]
- Sales-Balaguer, N.; Sorribes-Carreras, P.; Morillo Macias, V. Diagnosis of Sarcopenia and Myosteatosis by Computed Tomography in Patients with Esophagogastric and Pancreatic Cancer. Cancers (Basel) 2024, 16, 2738. [Google Scholar] [CrossRef] [PubMed]
- Kim, M.; Lee, C. min; Kang, B.K.; Ha, T.K.; Choi, Y.Y.; Lee, S.J. Sarcopenia Assessed with DXA and CT Increases the Risk of Perioperative Complications in Patients with Gastrectomy. Eur Radiol 2023, 33, 5150–5158. [Google Scholar] [CrossRef]
- Şahin, M.E.H.; Akbaş, F.; Yardimci, A.H.; Şahin, E. The Effect of Sarcopenia and Sarcopenic Obesity on Survival in Gastric Cancer. BMC Cancer 2023, 23, 911. [Google Scholar] [CrossRef] [PubMed]
- Tegels, J.J.W.; Van Vugt, J.L.A.; Reisinger, K.W.; Hulsewé, K.W.E.; Hoofwijk, A.G.M.; Derikx, J.P.M.; Stoot, J.H.M.B. Sarcopenia Is Highly Prevalent in Patients Undergoing Surgery for Gastric Cancer but Not Associated with Worse Outcomes. J Surg Oncol 2015, 112, 403–407. [Google Scholar] [CrossRef] [PubMed]
- Vegas-Aguilar, I.M.; Guirado-Peláez, P.; Fernández-Jiménez, R.; Boughanem, H.; Tinahones, F.J.; Garcia-Almeida, J.M. Exploratory Assessment of Nutritional Evaluation Tools as Predictors of Complications and Sarcopenia in Patients with Colorectal Cancer. Cancers (Basel) 2023, 15, 847. [Google Scholar] [CrossRef] [PubMed]
- Ji, W.; Liu, X.L.; Liu, P.; He, Y.W.; Zhao, Y.X.; Zheng, K.; Cui, J.W.; Li, W. The Efficacy of Fat-Free Mass Index and Appendicular Skeletal Muscle Mass Index in Cancer Malnutrition: A Propensity Score Match Analysis. Front Nutr 2023, 10, 1172610. [Google Scholar] [CrossRef] [PubMed]
- Herrera-Martínez, A.D.; Prior-Sánchez, I.; Fernández-Soto, M.L.; García-Olivares, M.; Novo-Rodríguez, C.; González-Pacheco, M.; Martínez-Ramirez, M.J.; Carmona-Llanos, A.; Jiménez-Sánchez, A.; Muñoz-Jiménez, C.; Torres-Flores, F.; Fernández-Jiménez, R.; Boughanem, H.; del Galindo-Gallardo, M.C.; Luengo-Pérez, L.M.; Molina-Puerta, M.J.; García-Almeida, J.M. Improving the Nutritional Evaluation in Head Neck Cancer Patients Using Bioelectrical Impedance Analysis: Not Only the Phase Angle Matters. J Cachexia Sarcopenia Muscle 2024. [Google Scholar] [CrossRef] [PubMed]
- Ge, Y.Z.; Ruan, G.T.; Zhang, Q.; Dong, W.J.; Zhang, X.; Song, M.M.; Zhang, X.W.; Li, X.R.; Zhang, K.P.; Tang, M.; Li, W.; Shen, X.; Shi, H.P. Extracellular Water to Total Body Water Ratio Predicts Survival in Cancer Patients with Sarcopenia: A Multi-Center Cohort Study. Nutr Metab (Lond) 2022, 19, 34. [Google Scholar] [CrossRef] [PubMed]
- Hida, T.; Ando, K.; Kobayashi, K.; Ito, K.; Tsushima, M.; Kobayakawa, T.; Morozumi, M.; Tanaka, S.; Machino, M.; Ota, K.; Kanbara, S.; Ito, S.; Ishiguro, N.; Hasegawa, Y.; Imagama, S. Ultrasound Measurement of Thigh Muscle Thickness for Assessment of Sarcopenia. Nagoya J Med Sci 2018, 80, 519. [Google Scholar] [CrossRef]
- López-Gómez, J.J.; Plaar, K.B.S.; Izaola-Jauregui, O.; Primo-Martín, D.; Gómez-Hoyos, E.; Torres-Torres, B.; De Luis-Román, D.A. Muscular Ultrasonography in Morphofunctional Assessment of Patients with Oncological Pathology at Risk of Malnutrition. Nutrients 2022, 14, 1573. [Google Scholar] [CrossRef]
- Ozturk, Y.; Koca, M.; Burkuk, S.; Unsal, P.; Dikmeer, A.; Oytun, M.G.; Bas, A.O.; Kahyaoglu, Z.; Deniz, O.; Coteli, S.; Ileri, I.; Dogu, B.B.; Cankurtaran, M.; Halil, M. The Role of Muscle Ultrasound to Predict Sarcopenia. Nutrition 2022, 101, 111692. [Google Scholar] [CrossRef]
- Ozturk, Y.; Deniz, O.; Coteli, S.; Unsal, P.; Dikmeer, A.; Burkuk, S.; Koca, M.; Cavusoglu, C.; Dogu, B.B.; Cankurtaran, M.; Halil, M. Global Leadership Initiative on Malnutrition Criteria with Different Muscle Assessments Including Muscle Ultrasound with Hospitalized Internal Medicine Patients. JPEN J Parenter Enteral Nutr 2022, 46, 936–945. [Google Scholar] [CrossRef]
- de Luis Roman, D.; García Almeida, J.M.; Bellido Guerrero, D.; Guzmán Rolo, G.; Martín, A.; Primo Martín, D.; García-Delgado, Y.; Guirado-Peláez, P.; Palmas, F.; Tejera Pérez, C.; García Olivares, M.; Maíz Jiménez, M.; Bretón Lesmes, I.; Alzás Teomiro, C.M.; Guardia Baena, J.M.; Calles Romero, L.A.; Prior-Sánchez, I.; García-Luna, P.P.; González Pacheco, M.; Martínez-Olmos, M.Á.; Alabadí, B.; Alcántara-Aragón, V.; Palma Milla, S.; Martín Folgueras, T.; Micó García, A.; Molina-Baena, B.; Rendón Barragán, H.; Rodríguez de Vera Gómez, P.; Riestra Fernández, M.; Jiménez Portilla, A.; López-Gómez, J.J.; Pérez Martín, N.; Montero Madrid, N.; Zabalegui Eguinoa, A.; Porca Fernández, C.; Tapia Guerrero, M.J.; Ruiz Aguado, M.; Velasco Gimeno, C.; Herrera Martínez, A.D.; Novo Rodríguez, M.; Iglesias Hernández, N.C.; de Damas Medina, M.; González Navarro, I.; Vílchez López, F.J.; Fernández-Pombo, A.; Olveira, G. Ultrasound Cut-Off Values for Rectus Femoris for Detecting Sarcopenia in Patients with Nutritional Risk. Nutrients 2024, 16, 1552. [Google Scholar] [CrossRef]

Table 1.
Baseline demographic and disease characteristics of the participants.
| Variables | All Patients (n=35) | Male (n=26) | Female (n=9) |
|---|---|---|---|
| Age (years) | 62.8 ± 8.8 | 62.2 ± 9.5 | 64.8 ± 6.4 |
| Primary site tumor | |||
| Esophagus | 25 (71.4%) | 21 (80.8%) | 4 (44.4%) |
| Gastric | 10 (28.6%) | 5 (19.2%) | 5 (55.6%) |
| Tumor stage | |||
| I | 3 (8.6%) | 0 (0%) | 3 (33.3%) |
| II | 10 (28.6) | 8 (30.8%) | 2 (22.2%) |
| III | 14 (40%) | 11 (42.3%) | 3 (33.3%) |
| IV | 8 (22.9%) | 7 (26.9%) | 1 (11.1%) |
| Comorbidities | |||
| 0 | 7 (20%) | 6 (23.1%) | 1 (11.1%) |
| 1 | 8 (22.9%) | 6 (23.1%) | 2 (22.2%) |
| ≥2 | 20 (57.1%) | 14 (53.8%) | 6 (66.7%) |
| Physical Activity | |||
| Low or inactive | 26 (74.3%) | 19 (73.1%) | 7 (77.8%) |
| Medium | 5 (14.3%) | 3 (11.5%) | 2 (22.2%) |
| High | 4 (11.4%) | 4 (15.4%) | 0 (0%) |
| Treatment | |||
| Only CTx | 8 (22.9%) | 8 (30.8%) | 0 (0%) |
| CTx and RTx | 4 (11.4%) | 2 (7.7%) | 2 (22.2%) |
| Surgery and CTx | 10 (54.3%) | 13 (50%) | 6 (66.7%) |
| Surgery, CTx and RTx | 4 (11.4%) | 3 (11.5%) | 1 (11.1%) |
Data are expressed as mean ± standard deviations or percentage. Groups were divided by sex variable. Abbreviations – CTx: chemotherapy; RTx: radiotherapy.
Table 2.
Morphofunctional assessment parameters stratified by sex.
| Variables | All Patients (n=35) | Male (n=26) | Female (n=9) |
|---|---|---|---|
| BMI (kg/m2) | 23.3 ± 5.7 | 23.5 ± 5.3 | 22.6 ± 6.9 |
| Underweight | 13 (37.1%) | 9 (34.6%) | 4 (44.4%) |
| Normal | 12 (34.3%) | 10 (38.5%) | 2 (22.2%) |
| Overweight | 4 (11.4%) | 3 (11.5%) | 1 (11.1%) |
| Obesity | 6 (17.1%) | 4 (15.4%) | 2 (22.2%) |
| Weight loss within past 6 months (%) | 14.3 ± 7.9 | 14.9 ± 8.3 | 12.3 ± 6.5 |
| <5% | 4 (11.4%) | 3 (11.5%) | 1 (11.1%) |
| 5-10% | 5 (14.3%) | 2 (7.7%) | 3 (33.3%) |
| >10% | 26 (74.3%) | 21 (80.8%) | 5 (55.6%) |
| MAC (cm) | 26.1 ± 5.3 | 23.5 ± 5.3 | 25.2 ± 6.9 |
| CC (cm) | 32.9 ± 4.4 | 33.3 ± 4.5 | 31.9 ± 4.1 |
| Normal | 8 (22.9%) | 6 (23.1%) | 2 (22.2%) |
| Low | 27 (77.1%) | 20 (66.9%) | 7 (77.8%) |
| BIVA-derived parameters | |||
| PhA (º) | 4.7 ± 0.9 | 4.9 ± 0.9 | 4.3 ± 0.8 |
| ECW/TBW ratio | 0.5 ± 0.07 | 0.48 ± 0.06 | 0.51 ± 0.08 |
| TBW/FFM (%) | 69.7 ± 17.6 | 71.1 ± 14.7 | 66.0 ± 24.6 |
| FM (%) | 19.6 ± 12 | 18.7 ± 10.2 | 22.2 ± 16.6 |
| ASMMI (kg/m2) | 6.8 ± 1.2 | 7.2 ± 1.06 | 5.6 ± 0.86 |
| BCM (kg) | 24.9 ± 6.1 | 27.1 ± 5.2 | 18.8 ± 3.9 |
| Nutritional ultrasound ®: rectus femoris muscle | |||
| RFCSA (cm2) | 2.8 ± 1.0 | 2.9 ± 1.02 | 2.2 ± 0.8 |
| RF-Y-axis (cm) | 0.8 ± 0.3 | 0.87 ± 0.27 | 0.77 ± 0.22 |
| RF-X-axis | 3.65 ± 0.50 | 3.76 ± 0.44 | 3.31 ± 0.55 |
| RF-AT (cm) | 0.41 (0.23 – 0.74) | 0.35 (0.24-0.55) | 0.78 (0.22-1.42) |
| Nutritional ultrasound ®: abdominal adipose tissue | |||
| T-SAT (cm | 1.4 (0.5-1.9) | 1.35 (0.47-1.85) | 1.41 (0.82-2.43) |
| S-SAT (cm) | 0.52 (0.28-0.87) | 0.47 (0.26-0.79) | 0.68 (0.35-1.06) |
| VAT (cm) | 0.55 (0.31-0.73) | 0.52 (0.30-0.65) | 0.58 (0.33-0.95) |
| Hand Grip Strength | |||
| HGS (kg) | 27.5 ± 8.4 | 31.1 ± 6.5 | 17.3 ± 2.5 |
| Functional test | |||
| SPPB | 10 (7-11) | 10 (7.7-11.2) | 10 (6.5-10.5) |
Data are expressed as mean ± standard deviation or median (interquartile range). Abbreviations – BMI: Body mass index; MAC: mid-arm circumference; CC: calf circumference; SGA: subjective global assessment; BIVA: bioelectrical impedance vector analysis; PhA: phase angle; ECW: extracellular water; TBW: total body water; FFM: fat free mass; FM: fat mass; ASMMI: appendicular skeletal muscle mass index; BCM: body cellular mass; RFCSA: rectus femoris cross sectional area; RF-Y-axis: rectus femoris Y axis; RF-X-axis: rectus femoris X axis; RF-AT: rectus femoris adipose tissue; T-SAT: total subcutaneous adipose tissue; S-SAT: superficial subcutaneous adipose tissue; VAT: visceral adipose tissue; HGS: hand grip strength; SPPB: Short Physical Performance Battery.
Table 3.
Differences in demographic, clinical, BIVA-derived, and ultrasound data according to the GLIM criteria.
Table 3.
Differences in demographic, clinical, BIVA-derived, and ultrasound data according to the GLIM criteria.
| Variables | No malnutrition (n=6) | Moderate malnutrition (n=11) | Severe malnutrition (n=18) | p-value |
|---|---|---|---|---|
| Sex | 0.773 | |||
| Male | 4 (66.7%) | 9 (81.8%) | 13 (72.2%) | |
| Female | 2 (33.3%) | 2 (18.2%) | 5 (27.8%) | |
| Age (years) | 60.5 ± 4.8 | 63.3 ± 10.9 | 63.3 ± 8.7 | 0.786 |
| BMI (kg/m2) | 29.3 ± 5.6 | 25.9 ± 4.8 | 19.6 ± 3.0 | <0.001*** |
| Weight loss within past 6 months (%) | 4.2 ± 4.3 | 14.9 ± 5.5 | 17.3 ± 7.4 | <0.001*** |
| MAC (cm) | 31.0 ± 4.6 | 29.4 ± 4.3 | 22.4 ± 3.0 | <0.001*** |
| CC (cm) | 36.8 ± 5.3 | 34.9 ± 3.5 | 30.3 ± 2.8 | <0.001*** |
| SGA | ||||
| Well nourished (A) | 3 (50%) | 0 (0%) | 0 (0%) | <0.001*** |
| Mild to moderately malnourished (B) | 2 (33.3% | 8 (72.7%) | 4 (22.2%) | |
| Severely malnourished (C) | 1 (16.7%) | 3 (27.3%) | 14 (77.8%) | |
| BIVA-derived parameters | ||||
| PhA (º) | 5.3 ± 0.7 | 5.1 ± 1.02 | 4.3 ± 0.7 | 0.016* |
| ECW/TBW ratio | 0.46 ± 0.04 | 0.47 ± 0.07 | 0.50 ± 0.07 | 0.405 |
| TBW/FFM (%) | 62.3 ± 30.3 | 74.3 ± 2.1 | 69.7 ± 17.2 | 0.430 |
| FM (%) | 25.7 ± 13.9 | 21.0 ± 13.6 | 16.7 ± 9.8 | 0.255 |
| ASMMI (kg/m2) | 7.7 ± 1.5 | 7.6 ± 0.8 | 6.0 ± 0.8 | <0.001*** |
| BCM (kg) | 29.9 ± 4.7 | 27.6 ± 5.6 | 21.7 ± 4.9 | <0.001*** |
| Nutritional ultrasound ®: rectus femoris muscle | ||||
| RFCSA (cm2) | 3.5 ± 0.9 | 3.5 ± 0.9 | 2.1 ± 0.6 | <0.001*** |
| RF-Y-axis (cm) | 1.1 ± 0.3 | 0.97 ± 0.19 | 0.68 ± 0.18 | <0.001*** |
| RF-X-axis (cm) | 3.64 ± 0.22 | 3.96 ± 0.12 | 3.46 ± 0.11 | 0.030* |
| RF-Adipose tissue (cm) | 0.82 (0.4-1.16) | 0.44 (0.34-1.01) | 0.30 (0.18-0.50) | 0.037* |
| Nutritional ultrasound ®: abdominal adipose tissue | ||||
| T-SAT (cm | 2.08 (1.72-2.59) | 1.30 (0.55-2.62) | 1.0 (0.36-1.56) | 0.012* |
| S-SAT (cm) | 1.07 (0.73-1.26) | 0.62 (0.34-0.95) | 0.44 (0.19-0.65) | 0.011* |
| VAT (cm) | 0.63 (0.56-0.97) | 0.62 (0.55-0.93) | 0.34 (0.24-0.48) | 0.004** |
Data are expressed as mean ± standard deviation or median (interquartile range) or percentage. Asterisk indicates significant difference between groups, according to the Mann–Whitney test or Fisher’s exact test (*** p < 0.001, ** p < 0.01, * p < 0.05) Abbreviations – BMI: Body mass index; MAC: mid-arm circumference; CC: calf circumference; SGA: subjective global assessment; BIVA: bioelectrical impedance vector analysis; PhA: phase angle; ECW: extracellular water; TBW: total body water; FFM: fat free mass; FM: fat mass; ASMMI: appendicular skeletal muscle mass index; BCM: body cellular mass; RFCSA: rectus femoris cross sectional area; RF-Y-axis: rectus femoris Y axis; RF-X-axis: rectus femoris X axis; RF-AT: rectus femoris adipose tissue; T-SAT: total subcutaneous adipose tissue; S-SAT: superficial subcutaneous adipose tissue; VAT: visceral adipose tissue; HGS: hand grip strength; SPPB: Short Physical Performance Battery.
Table 4.
Differences in demographic, clinical, BIVA-derived, and ultrasound data according to the EWGSOP2 criteria.
Table 4.
Differences in demographic, clinical, BIVA-derived, and ultrasound data according to the EWGSOP2 criteria.
| Variables | No sarcopenia (n=12) | Probable sarcopenia (n=5) | Confirmed sarcopenia (n=8) | Severe sarcopenia (n=10) | p value |
|---|---|---|---|---|---|
| Sex | 0.003** | ||||
| Male | 12 (100%) | 1 (20%) | 5 (62.5%) | 8 (80%) | |
| Female | 0 (0%) | 4 (80%) | 3 (37.5%) | 2 (20%) | |
| Age (years) | 57.7 ± 9.4 | 68.8 ± 6.5 | 61.2 ± 6.9 | 67.2 ± 7.1 | 0.021* |
| BMI (kg/m2) | 27.3 ± 5.2 | 26.9 ± 5.5 | 18.5 ± 3.2 | 20.3 ± 2.6 | <0.001*** |
| MAC (cm) | 30.4 ± 3.8 | 29.2 ± 5.5 | 20.4 ± 2.3 | 23.9 ± 2.4 | <0.001*** |
| CC (cm) | 36.7 ± 4.2 | 33.3 ± 3.4 | 30.3 ± 3.1 | 30.3 ± 2.5 | <0.001*** |
| SARC-F | <0.001*** | ||||
| No risk | 12 (100%) | 2 (40%) | 8 (100%) | 5 (50%) | |
| Sarcopenia risk | 0 (0%) | 3 (60%) | 0 (0%) | 5 (50%) | |
| BIA-derived parameters | |||||
| PhA (º) | 5.6 ± 0.7 | 4.5 ± 0.9 | 4.5 ± 0.8 | 4.1 ± 0.5 | <0.001*** |
| ECW/TBW ratio | 0.47 ± 0.04 | 0.48 ± 0.09 | 0.48 ± 0.07 | 0.51 ± 0.07 | 0.550 |
| TBW/FFM (%) | 74.15 ± 1.97 | 60.13 ± 33.3 | 73.4 ± 0.29 | 66.0 ± 24.5 | 0.407 |
| FM (%) | 19.4 ± 12.7 | 25.2 ± 19.1 | 14.2 ± 8.9 | 21.4 ± 8.4 | 0.408 |
| ASMMI (kg/m2) | 7.98 ± 0.95 | 6.73 ± 0.57 | 5.92 ± 0.96 | 6.08 ± 0.69 | <0.001*** |
| BCM (kg) | 30.2 ± 3.6 | 23.5 ± 6.3 | 22.7 ± 6.3 | 21.1 ± 3.9 | <0.001*** |
| Nutritional ultrasound ®: rectus femoris muscle | |||||
| RFCSA (cm2) | 3.56 ± 0.76 | 2.80 ± 0.60 | 1.82 ± 0.49 | 2.53 ± 1.05 | <0.001*** |
| RF-Y-axis (cm) | 1.05 ± 0.22 | 0.86 ± 0.13 | 0.58 ± 0.18 | 0.80 ± 0.21 | <0.001*** |
| RF-AT (cm) | 0.48 (0.36-0.85) | 1.10 (0.28-1.84) | 0.26 (0.15-0.48) | 0.30 (0.18-0.49) | 0.072 |
| RF-X-axis (cm) | 3.79 ± 0.11 | 3.75 ± 0.20 | 3.49 ± 0.99 | 3.55 ± 0.23 | 0.520 |
| Hand Grip Strength | |||||
| HGS (kg) | 35.9 ± 4.9 | 19.5 ± 7.1 | 25.4 ± 5.2 | 23.3 ± 6.2 | <0.001*** |
| Functional test | |||||
| SPPB | 11.5 (10-12) | 10 (7.5-10.5) | 10 (9-10.75) | 6 (5-7.25) | <0.001*** |
Data are expressed as mean ± standard deviation or median (interquartile range) or percentage. Asterisk indicates significant difference between groups, according to the Mann–Whitney test or Fisher’s exact test (*** p < 0.001, ** p < 0.01, * p < 0.05) Abbreviations – BMI: Body mass index; MAC: mid-arm circumference; CC: calf circumference; BIVA: bioelectrical impedance vector analysis; PhA: phase angle; ECW: extracellular water; TBW: total body water; FFM: fat free mass; FM: fat mass; ASMMI: appendicular skeletal muscle mass index; BCM: body cellular mass; RFCSA: rectus femoris cross sectional area; RF-Y-axis: rectus femoris Y axis; RF-X-axis: rectus femoris X axis; RF-AT: rectus femoris adipose tissue; T-SAT: total subcutaneous adipose tissue; S-SAT: superficial subcutaneous adipose tissue; VAT: visceral adipose tissue; HGS: hand grip strength; SPPB: Short Physical Performance Battery.
Table 5.
Correlations between BIVA-derived parameters, ultrasound measurements, and components of malnutrition diagnosis according to GLIM criteria (%weight loss, BMI and ASMMI).
Table 5.
Correlations between BIVA-derived parameters, ultrasound measurements, and components of malnutrition diagnosis according to GLIM criteria (%weight loss, BMI and ASMMI).
| Variables | % weight loss | BMI (kg/m2) | ASMMI (kg/m2) | |||
|---|---|---|---|---|---|---|
| r | p value | r | p value | r | p value | |
| BIA-derived parameters | ||||||
| PhA (º) | -0.093 | 0.596 | 0.288 | 0.094 | 0.439 | 0.008** |
| ECW/TBW ratio | 0.244 | 0.157 | 0.244 | 0.158 | -0.246 | 0.154 |
| TBW/FFM (%) | 0.156 | 0.378 | 0.261 | 0.136 | 0.169 | 0.338 |
| FM (%) | -0.232 | 0.181 | 0.543 | <0.001* | 0.204 | 0.240 |
| BCM (kg) | -0.313 | 0.067 | 0.397 | 0.018* | 0.837 | <0.001*** |
| Nutritional ultrasound ®: rectus femoris muscle | ||||||
| RFCSA (cm2) | -0.311 | 0.069 | 0.531 | 0.001* | 0.582 | <0.001*** |
| RF-Y-axis (cm) | -0.386 | 0.022* | 0.599 | <0.001* | 0.602 | <0.001*** |
| RF-AT (cm) | -0.420 | 0.012* | 0.742 | <0.001* | 0.245 | 0.156 |
| Nutritional ultrasound ®: abdominal adipose tissue | ||||||
| T-SAT (cm | -0.491 | 0.005* | 0.826 | <0.001* | 0.399 | 0.026* |
| S-SAT (cm) | -0.459 | 0.009* | 0.799 | <0.001* | 0.416 | 0.020* |
| VAT (cm) | -0.092 | 0.112 | 0.607 | <0.001* | 0.278 | 0.130 |
Asterisk indicates significant correlation (*** p < 0.001, ** p < 0.01, * p < 0.05). Abbreviations - BMI: Body mass index; ASMMI: appendicular skeletal muscle mass index; PhA: phase angle; ECW: extracellular water; TBW: total body water; FFM: fat free mass; FM: fat mass; BCM: body cellular mass; RFCSA: rectus femoris cross sectional area; RF-Y-axis: rectus femoris Y axis; RF-AT: rectus femoris adipose tissue; T-SAT: total subcutaneous adipose tissue; S-SAT: superficial subcutaneous adipose tissue; VAT: visceral adipose tissue.
Table 6.
Correlations between BIVA-derived parameters, ultrasound measurements, and components of sarcopenia diagnosis according the EWGSOP2 (HGS, ASMMI, SPPB).
Table 6.
Correlations between BIVA-derived parameters, ultrasound measurements, and components of sarcopenia diagnosis according the EWGSOP2 (HGS, ASMMI, SPPB).
| Variables | HGS (kg) | ASMMI (kg/m2) | SPPB | |||
|---|---|---|---|---|---|---|
| r | p value | R | p value | R | p value | |
| BIA-derived parameters | ||||||
| PhA (º) | 0.556 | <0.001* | 0.439 | 0.008* | 0.475 | 0.004** |
| ECW/TBW ratio | -0.257 | 0.135 | -0.246 | 0.154 | -0.376 | 0.026 |
| TBW/FFM (%) | 0.223 | 0.204 | 0.169 | 0.338 | 0.124 | 0.483 |
| BCM (kg) | 0.751 | <0.001* | 0.837 | <0.001* | 0.461 | 0.005** |
| Nutritional ultrasound ®: rectus femoris muscle | ||||||
| RFCSA (cm2) | 0.447 | 0.007* | 0.582 | <0.001* | 0.233 | 0.178 |
| RF-Y-axis (cm) | 0.315 | 0.065 | 0.602 | <0.001* | 0.151 | 0.388 |
Asterisk indicates significant correlation (*** p < 0.001, ** p < 0.01, * p < 0.05). Abbreviations - HGS: hand grip strength; ASMMI: appendicular skeletal muscle mass index; SPPB: Short Physical Performance Battery; PhA: phase angle; ECW: extracellular water; TBW: total body water; FFM: fat free mass; FM: fat mass; BCM: body cellular mass; RFCSA: rectus femoris cross sectional area; RF-Y-axis: rectus femoris Y axis.
Table 7.
Crude logistic regression analysis evaluating PhA, RFCSA, RFT, T-SAT and S-SAT with GLIM malnutrition and EWGSOP2 sarcopenia.
Table 7.
Crude logistic regression analysis evaluating PhA, RFCSA, RFT, T-SAT and S-SAT with GLIM malnutrition and EWGSOP2 sarcopenia.
| Malnutrition | Sarcopenia | |||
|---|---|---|---|---|
| Variables | OR | p value | OR | p value |
| PhA (º) | 0.430 (0.152-1.217) | 0.112 | 0.167 (0.047-0.591) | 0.006** |
| BCM (kg) | 0.817 (0.673-0.993) | 0.042* | 0.797 (0.682-0.932) | 0.005** |
| Nutritional ultrasound ®: rectus femoris muscle | ||||
| RFCSA (cm2) | 0.401 (0.155-1.037) | 0.060 | 0.212 (0.074-0.605) | 0.004** |
| RF-Y-axis (cm) | 0.002 (0.000-0.418) | 0.023* | 0.002 (0.000-0.143) | 0.004** |
| RF-AT (cm) | 0.220 (0.035-1.369) | 0.105 | ||
| Nutritional ultrasound ®: abdominal adipose tissue | ||||
| T-SAT (cm | 0.192 (0.043-0.851) | 0.030* | ||
| S-SAT (cm) | 0.019 (0.001-0.448) | 0.014* | ||
Asterisk indicates statical significance (*** p < 0.001, ** p < 0.01, * p < 0.05). Abbreviations - PhA: phase angle; BCM: body cellular mass; RFCSA: rectus femoris cross sectional area; RF-Y-axis: rectus femoris Y axis; RF-AT: rectus femoris adipose tissue; T-SAT: total subcutaneous adipose tissue; S-SAT: superficial subcutaneous adipose tissue.
Disclaimer/Publisher’s Note: The statements, opinions and data contained in all publications are solely those of the individual author(s) and contributor(s) and not of MDPI and/or the editor(s). MDPI and/or the editor(s) disclaim responsibility for any injury to people or property resulting from any ideas, methods, instructions or products referred to in the content. |
© 2024 by the authors. Licensee MDPI, Basel, Switzerland. This article is an open access article distributed under the terms and conditions of the Creative Commons Attribution (CC BY) license (https://creativecommons.org/licenses/by/4.0/).
Copyright: This open access article is published under a Creative Commons CC BY 4.0 license, which permit the free download, distribution, and reuse, provided that the author and preprint are cited in any reuse.


