
Submitted:
18 November 2024
Posted:
19 November 2024
You are already at the latest version
Abstract
There has been a growing interest in the use of inertial sensors to explore the temporal aspects of the Timed-Up-and-Go (TUG) test. The current study aimed to analyze the spatiotemporal parameters and the phases of the TUG test in patients with knee osteoarthritis (KOA) using inertial sensors and to compare the results with those of non-arthritic individuals. The study included 20 patients with KOA and 60 non-arthritic individuals aged 65 to 84 years. All volunteers performed the TUG test and 17 spatiotemporal parameters and phase data were collected wirelessly using the BTS G-Walk inertial sensor. Significant differences were observed between KOA patients and non-arthritic controls, with all but 3 parameters not reaching statistical significance. The results of our study align with findings from similar studies involving diverse patient populations. Our study offers valuable insights into specific characteristics of mobility and functional abilities influenced by KOA, enabling healthcare professionals to develop targeted interventions.
Keywords:
knee osteoarthritis
; timed up and go test
; inertial sensors
; phase durations
; spatiotemporal parameters
1. Introduction
Annually, approximately one out of every three adults aged 65 and above, and nearly half of individuals over 80, encounter at least one fall [1]. Falls resulting in unintentional injuries are significant contributors to mortality and have witnessed an increase in occurrence [2]. The associated non-fatal falls in 2020 have been estimated by Medicare to account for $80.0 billion in healthcare costs [3].
On the other hand, OA poses a significant challenge to public health due to its considerable burden on individuals regarding physical and psychosocial impairment [4,5]. Additionally, OA is recognized as one of the most prevalent joint diseases globally [6,7]. In 1990, over 7 million Americans experienced a disability that hindered their ability to engage in essential daily activities [8]. Since that time, the prevalence of the disease, particularly KOA, has experienced a twofold increase [9]. Approximately 18% of women aged 60 years and older are estimated to be affected by the condition, whereas the prevalence among men of the same age group is approximately 10% [6]. The connection between KOA and falls is a topic of debate; however, evidence suggests that gait and balance disorders caused by OA could potentially elevate the risk of falls [10,11].
Thus, specialized screening tools for assessing fall risk are widely recognized as the preferred approach. Among these tools, the TUG test is renowned and considered the gold standard for fall risk assessment, offering numerous advantages [12,13]. The patient gets up from an armchair, goes three meters, turns around, walks back, and sits down again while being watched and timed [14]. It is a simple and easily performed test, making it widely adopted [13,15]. Additionally, it has received recommendations from esteemed organizations such as the American Geriatric Society and the British Geriatric Society [16].
Recently, the TUG test has been conducted using accelerometers worn by patients. This enables a focused analysis of the sit-to-stand and stand-to-sit subtasks, providing valuable information to identify fall risk in home-based fallers compared to healthy individuals [17]. The study findings indicate that the TUG test successfully identifies 63% of fallers, and when combined with accelerometer data, this percentage increases to 87% in patients equipped with accelerometers [17]. Similarly, a study by Buisseret et al. (2020) demonstrated that using three-dimensional acceleration data from wearable sensors during typical walking can help create a predictive model for the TUG test in older adults. The model showed a narrow margin of error when estimating the TUG scores of the participants. By analyzing the TUG score during regular walking, the model can let clinicians evaluate older persons' fall risks remotely [13].
In addition, instrumented TUG tests can yield valuable information regarding the kinematics of functional tasks, such as accelerations and angular velocities [18,19]. However, there remain several unresolved issues in the scientific literature. The timing and transitions between different test phases hold crucial clinical information for diagnosis and prognosis [20]. Accurately analyzing these times is, therefore, of fundamental importance.
Consequently, it is not surprising that interest in using inertial sensors to investigate temporal information of the TUG test has considerably grown [21,22,23,24,25]. Thus, this study aimed to analyze the spatiotemporal parameters and phases of the TUG test using inertial sensors in patients with pre-operative KOA and compare the results with those of healthy individuals.
2. Materials and Methods
2.1. Participants
In the current study, 20 patients with primary KOA (5 males and 15 females) with a mean age of 74.84 (6.694) years (65 to 88 years), and 60 non-arthritic controls (15 males and 45 females with a mean age of 72.25 (5.220) years (65 to 88 years) were included. Cases and controls were individually matched on age, sex and bone mass index (BMI). Each case with KOA was matched with 3 controls. Patients diagnosed with end-stage unilateral primary KOA scheduled for total knee arthroplasty (TKA) were recruited. Inclusion criteria required patients to have the ability to walk independently without the need for ambulatory aids. Exclusion criteria encompassed patients with neurological, cardiorespiratory or other severe orthopedic conditions, leading to ambulatory impairment and lack of individual, independent mobility. Controls were healthy individuals had no history of orthopedic or neurological disorders, including recent injuries, surgeries or pharmaceutical therapy that may have affected gait and balance.
Prior to the participation, all individuals provided written consent after receiving a detailed explanation of the study's objectives. The study protocol received approval from the IRB Committee of the School of Physical Education and Sport Science, National and Kapodistrian University of Athens, Greece (Approval Number: 1306/22-09-2021).
2.2. Instrumentation
A wireless inertial sensor (G-Walk, BTS Bioengineering S.p.A., Milan, Italy) was used to collected TUG test data. The device is equipped with 4 IMUs (Inertial Measurement Units). Each IMU is equipped with a three-axis accelerometer, magnetometer, gyroscope, and positioning system receiver. Specifically, it features a triaxial accelerometer (16-bit/axis) with multiple sensitivity options, offering a dynamic range of ±2, ±4, ±8, ±16 g and bandwidth ranging from 4 to 1000 Hz. Additionally, it includes triaxial magnetometers (13-bit) with a dynamic range of ±1200μT and bandwidth up to 100Hz and a triaxial gyroscope (16-bit/axis) with multiple sensitivity options, providing a dynamic range of ±250, ±500, ±1000, ±2000 °/sec and bandwidth ranging from 4 to 8000Hz. The device is equipped with a GPS receiver with a position accuracy of 2.5 m up to 5 Hz or 3 m up to 10 Hz and bandwidth up to 10 Hz.
The module's dimensions are 70 mm L x 40 mm W x 18 mm H (2.75 in L x 1.57 in W x 0.7 in H), and it supports an acquisition frequency of up to 1000 Hz. The module connects to a laptop for data acquisition via Bluetooth 3.0 (class 1.5), providing a range of up to 60 meters in line of sight.
2.3. Acquisition Protocol
The sensor is positioned inside a semi-elastic black belt, which is placed above the iliac wings at the level of the L4 vertebra in all individuals undergoing the TUG test, as illustrated in Figure 1.
All participants were instructed how to perform the TUG test to enhance the reliability of the test results. The participants were seated with their backs against the backrest and their arms resting on the chair's armrests. Upon receiving the signal from the operator to start, participants were required to stand, walk three meters in a straight line ahead, turn without changing positions, and then return to the chair and sit down again.
Using bluetooth technology, gait data were captured and transmitted to a computer where the dedicated G-Studio software processed the collected data and calculated various spatiotemporal parameters. The reported exam window is depicted in Figure 2.
2.4. Data Analysis
The G-studio software extracted various spatiotemporal parameters, including:
Analysis Duration, s: This parameter represented the overall duration of the entire trial.
For the Sit-to-Stand and Stand-to-Sit test phases, the following parameters were calculated:
- Phase Duration, s: Indicated the average time interval for each movement in the respective phase.
- Antero-posterior Acceleration m/s²: Represented the average range of anteroposterior acceleration achieved during each assessed phase.
- Lateral Acceleration m/s²: Denoted the average range of medial-lateral acceleration observed during each assessed phase.
- Vertical Acceleration, m/s²: Captured the range of vertical acceleration experienced during each assessed phase.
Parameters were generated for the Mid Turning and End Turning sections:
- Phase Duration, sec: Represented the average temporal duration of each turn in the test.
- Maximum Rotation Speed, °/s: Indicated the maximum speed reached during each turn.
- Average Rotation Speed, °/s: Represented the average speed maintained throughout each turn.
Lastly, the report section included information on the Test phases, documenting the duration of each phase (e.g., Sit to Stand (rising), Forward Gait (forward walking), Return Gait (back walking), Mid Turning (intermediate rotation), End Turning (final rotation), and Stand to Sit (sitting)) recorded during the trial (Refer to the example in Figure 3 for further clarity).
2.5. Statistical Analysis
All analyses were conducted using the statistical package IBM SPSS, version 28.00 (IBM Corporation, Somers, NY, USA). Data were expressed as mean±standard deviation or median (IQR), in case of violation of normality. Additionally, the Kolmogorov-Smirnov and Shapiro–Wilks tests examined the normal distribution of the parameters. The independent samples t-test and Fisher’s exact test also examined homogeneity between compared groups. Moreover, the independent samples t-test test or Mann-Whitney test was performed comparing the parameters between groups in case of violation of normality. Finally, all tests are two-sided, and statistical significance was set at p < 0.05.
3. Results
During the data analysis, 17 TUG test spatiotemporal parameters and phases data were obtained from 20 OA and 60 healthy individuals. Table 1 displays the demographic statistics and highlights the homogeneity between compared groups for all demographic variables (p>0.05).
Additionally, Table 2 presents significant differences between OA patients and healthy individuals' TUG test results. Particularly, the group of OA patients had statistically higher values of Analysis duration ( p<0.001), Sit to Stand Phase Duration (p<0.001), Stand to Sit Phase Duration (p=0.017), Forward Gait Phase Duration (p<0.001), Return Gait Phase Duration (p<0.001), Mid Turning Phase Duration ( p<0.001 ), End Turning Phase Duration (p<0.001) and lower values of Sit to Stand Antero-Posterior Acceleration (p=0.002), Sit to Stand Lateral Acceleration (p=0.002), Sit to Stand Vertical Acceleration(p<0.001), Mid Turning Maximum Rotation Speed (p=0,002), End Turning Maximum Rotation Speed (p<0.001), Mid Turning Average Rotation Speed (p<0.001), End Turning Average Rotation Speed (p<0.001) compared to healthy individuals. Nonetheless, three parameters, Stand to Sit Antero-Posterior Acceleration (p=0.060), Stand to Sit Lateral Acceleration (p=0.086), and Stand to Sit Vertical Acceleration (p=0.156), had no significant differences.
4. Discussion
The primary aim of this study was to use inertial sensors on patients with pre-operative KOA to analyze the spatiotemporal parameters and phases of the TUG test. Consequently, the results represent a comprehensive attempt to quantify 17 different spatiotemporal parameters and phases of the TUG test. Inertial sensors played a crucial role in providing objective measurements for various TUG test parameters, thereby reducing assessment subjectivity and potential bias. This comprehensive approach enables a holistic evaluation of a patient's mobility and functional performance affected by KOA during the TUG test, covering aspects such as gait acceleration, turning, and sit-to-stand transitions.
Moreover, this study compared the results of the TUG test between individuals aged 65 and older with KOA and their healthy counterparts, revealing significant differences. The findings in this study align with previous research [26,27,28], confirming that KOA patients show longer TUG completion times compared to healthy individuals. These prolonged times were consistent across various studies, underscoring the TUG test’s sensitivity in detecting mobility impairments. Khalaj et al.'s (2014) study examined individuals' balance and fall risk with bilateral KOA, categorizing them into mild and moderate OA groups. The TUG times among these groups significantly varied, particularly between those with mild and moderate KOA [28]. Jones et al. (2013) conducted a study to assess the test-retest reliability, criterion-related validity, and construct validity of the 30-second chair stand to measure lower body strength in individuals over 60. This research introduced the chair-stand test as a means to gauge lower body strength, a crucial component of the TUG test, underscoring its importance in evaluating functional mobility. The study revealed a significant decline (p < .01) in the 30-second chair stand scores for participants in their 60s, 70s, and 80s [29]. Additionally, Zasadzka et al. (2015) aimed to assess the risk of falling in individuals over 60 with OA using the TUG test. This study highlighted the TUG test's sensitivity to mobility variations, especially pertinent for OA patients. The research demonstrated that adults over 60 with KOA face an increased risk of falling, as indicated by prolonged TUG test times. This risk was notably linked to low muscle strength in the lower extremities, measured through the 30-second chair stand test [26].
The identification of statistically significant differences in 14 out of 17 spatiotemporal parameters provides clinicians with refined tools for evaluating the severity of KOA and customizing intervention strategies. For example, quadriceps weakness, a hallmark of KOA, directly impairs a patient’s ability to stand from a seated position or turn efficiently, two key phases of the TUG test. This results in prolonged completion times, reinforcing the need for strength-focused rehabilitation strategies to improve functional mobility [30].
Furthermore, the weaker muscles and structural changes in the knee joint of OA patients often lead to pain and joint stiffness [31]. These factors significantly impact a patient's ability to move smoothly and effectively during the TUG test. Metcalfe et al. (2013) noted that KOA patients frequently experience discomfort, potentially altering their natural movement patterns [32]. Pain can trigger compensatory or guarded movements to alleviate discomfort, potentially altering spatiotemporal parameters [33]. Altered gait patterns result in shorter steps, slower gait speeds, and longer stance phases while walking [34]. These gait impairments affect various measures of walking, turning, and sit-to-stand transitions in the TUG test [35].
Interestingly, the current results are similar to those observed in other patient populations. For instance, the study by Na et al. (2016) specifically examined the center of mass acceleration during sit-to-stand and stand-to-sit motions in stroke patients. In that study, Antero-Posterior and Vertical acceleration during stand-to-sit were not significantly different (p > 0.05) [36]. Similarly, Manckoundia et al. (2006) compared motor strategies used during sit-to-stand and back-to-sit motions in elderly subjects with and without Alzheimer's disease. The results showed nearly identical acceleration statistics (p = 0.85) between the Alzheimer's and healthy groups. The similarities observed between individuals with KOA, Parkinson’s, and Alzheimer’s disease in terms of TUG test performance suggest common mobility challenges across different patient populations. This highlights the TUG test’s potential utility as a universal tool for assessing fall risk in diverse clinical contexts [37].
Notably, individuals with Parkinson's disease, Alzheimer's disease, and OA all share a higher risk of falling [26,38,39]. It appears that these different groups of fallers exhibit similar TUG characteristics.
Each KOA patient may demonstrate unique deterioration patterns. These patterns underscore the impact of KOA on mobility and functional performance, as highlighted by Khalaj et al. (2014) [28]. By identifying these deterioration patterns, healthcare professionals can tailor therapies to address specific deficiencies such as gait irregularities, balance problems, or challenges during particular TUG phases [40]. The use of inertial sensors, by providing real-time and objective data, can transform how clinicians monitor and adjust rehabilitation efforts. Sibley et al. (2011) highlighted that the quantitative data derived from the TUG test can assist clinicians in creating customized rehabilitation plans by pinpointing specific areas of impairment that require focused attention [41].
Monitoring changes in spatiotemporal parameters over time can also help gauge the effectiveness of therapies. As noted by Shumway-Cook et al. (2000), tracking these changes can aid in the early detection of subtle declines in mobility, which is vital for timely interventions in older adults or individuals with mobility impairments [34]. This approach is crucial for enhancing the quality of life in individuals suffering from KOA. According to Wu et al. (2022), clinicians can track improvements or declines over time, adjusting treatment strategies as necessary based on the detailed spatiotemporal data collected during the TUG test [42].
5. Limitations
It's important to acknowledge several limitations of this study. Firstly, a significant limitation is the observed imbalance in the distribution of sexes within the sample. A noticeable disparity existed in the gender composition between the group of OA patients and the age-matched healthy individuals. This gender difference might introduce potential biases and confounding factors, impacting the generalizability and interpretation of our findings. This gender distribution imbalance partially resulted from differences in the prevalence of OA among males and females [43].
Another limitation of this study is the use of a small convenience sample. This choice was necessitated by time and resource constraints, limiting our ability to employ a more representative or randomized sampling method. The use of convenience sampling could introduce selection bias as participants were self-selected or readily accessible. Nonetheless, post hoc power analysis revealed a statistical power of 100% for the between-group comparison.
Lastly, a significant limitation is the absence of reliable studies in the literature that thoroughly investigate the validity and reliability of the BTS G-Walk in capturing acceleration and angular velocity data during the TUG test. While some studies demonstrate the reliability and validity of gait spatiotemporal parameters with the BTS G-Walk wearable sensor [44,45]. only one study assessing the TUG test was identified [22], which did not meet the criteria.
6. Conclusions
This study provides a comprehensive analysis of 17 distinct spatiotemporal parameters and phases of the TUG test, using inertial sensors to measure functional performance objectively. It compares the outcomes of the TUG test between individuals aged 65 and older afflicted with KOA and those without the condition, revealing significant differences. These findings align with those observed in comparable studies involving diverse patient groups. The research offers valuable insights into the specific aspects of mobility and functional performance affected by KOA, enabling clinicians to design targeted therapies to address specific deficits.
7. Disclaimers and Acknowledgments
This research received no specific grants from funding organizations in the public, private, commercial, or not-for-profit sectors. According to the authors, there is no conflict of interest.
References
- Kowal, P. An Aging World: 2015. 2016. [CrossRef]
- James, S.L.; Lucchesi, L.R.; Bisignano, C.; Castle, C.D.; Dingels, Z. V.; Fox, J.T.; Hamilton, E.B.; Henry, N.J.; Krohn, K.J.; Liu, Z.; et al. The Global Burden of Falls: Global, Regional and National Estimates of Morbidity and Mortality from the Global Burden of Disease Study 2017. Injury Prevention 2020, 26. [Google Scholar] [CrossRef]
- Haddad, Y.K.; Miller, G.F.; Kakara, R.; Florence, C.; Bergen, G.; Burns, E.R.; Atherly, A. Healthcare Spending for Non-Fatal Falls among Older Adults, USA. Inj Prev 2024, 30, 272–276. [Google Scholar] [CrossRef] [PubMed]
- Whittaker, J.L.; Truong, L.K.; Dhiman, K.; Beck, C. Osteoarthritis Year in Review 2020: Rehabilitation and Outcomes. Osteoarthritis Cartilage 2021, 29. [Google Scholar] [CrossRef] [PubMed]
- Guccione, A.A.; Felson, D.T.; Anderson, J.J.; Anthony, J.M.; Zhang, Y.; Wilson, P.W.F.; Kelly-Hayes, M.; Wolf, P.A.; Kreger, B.E.; Kannel, W.B. The Effects of Specific Medical Conditions on the Functional Limitations of Elders in the Framingham Study. Am J Public Health 1994, 84. [Google Scholar] [CrossRef] [PubMed]
- Glyn-Jones, S.; Palmer, A.J.R.; Agricola, R.; Price, A.J.; Vincent, T.L.; Weinans, H.; Carr, A.J. Osteoarthritis. The Lancet 2015, 386, 376–387. [Google Scholar] [CrossRef]
- Cao, F.; Xu, Z.; Li, X.X.; Fu, Z.Y.; Han, R.Y.; Zhang, J.L.; Wang, P.; Hou, S.; Pan, H.F. Trends and Cross-Country Inequalities in the Global Burden of Osteoarthritis, 1990–2019: A Population-Based Study. Ageing Res Rev 2024, 99. [Google Scholar] [CrossRef] [PubMed]
- Arthritis Prevalence and Activity Limitations— United States, 1990. JAMA: The Journal of the American Medical Association 1994, 272. [CrossRef]
- Wallace, I.J.; Worthington, S.; Felson, D.T.; Jurmain, R.D.; Wren, K.T.; Maijanen, H.; Woods, R.J.; Lieberman, D.E. Knee Osteoarthritis Has Doubled in Prevalence since the Mid-20th Century. Proc Natl Acad Sci U S A 2017, 114. [Google Scholar] [CrossRef]
- Ng, C.T.; Tan, M.P. Osteoarthritis and Falls in the Older Person. Age Ageing 2013, 42. [Google Scholar] [CrossRef]
- Ackerman, I.N.; Barker, A.; Soh, S.E. Falls Prevention and Osteoarthritis: Time for Awareness and Action. Disabil Rehabil 2023, 45. [Google Scholar] [CrossRef]
- Ni Scanaill, C.; Garattini, C.; Greene, B.R.; McGrath, M.J. Technology Innovation Enabling Falls Risk Assessment in a Community Setting. Ageing Int 2011, 36. [Google Scholar] [CrossRef] [PubMed]
- Buisseret, F.; Catinus, L.; Grenard, R.; Jojczyk, L.; Fievez, D.; Barvaux, V.; Dierick, F. Timed up and Go and Six-Minute Walking Tests with Wearable Inertial Sensor: One Step Further for the Prediction of the Risk of Fall in Elderly Nursing Home People. Sensors (Switzerland) 2020, 20. [Google Scholar] [CrossRef] [PubMed]
- Richardson, S. The Timed “Up & Go”: A Test of Basic Functional Mobility for Frail Elderly Persons. J Am Geriatr Soc 1991, 39. [Google Scholar] [CrossRef]
- Herman, T.; Giladi, N.; Hausdorff, J.M. Properties of the “Timed Up and Go” Test: More than Meets the Eye. Gerontology 2011, 57. [Google Scholar] [CrossRef]
- Drootin, M. Summary of the Updated American Geriatrics Society/British Geriatrics Society Clinical Practice Guideline for Prevention of Falls in Older Persons. J Am Geriatr Soc 2011, 59. [Google Scholar] [CrossRef]
- Weiss, A.; Herman, T.; Plotnik, M.; Brozgol, M.; Giladi, N.; Hausdorff, J.M. An Instrumented Timed up and Go: The Added Value of an Accelerometer for Identifying Fall Risk in Idiopathic Fallers. Physiol Meas 2011, 32. [Google Scholar] [CrossRef]
- Galán-Mercant, A.; Cuesta-Vargas, A.I. Clinical Frailty Syndrome Assessment Using Inertial Sensors Embedded in Smartphones. Physiol Meas 2015, 36. [Google Scholar] [CrossRef]
- Galán-Mercant, A.; Cuesta-Vargas, A.I. Differences in Trunk Accelerometry between Frail and Non-Frail Elderly Persons in Functional Tasks. BMC Res Notes 2014, 7. [Google Scholar] [CrossRef]
- Weiss, A.; Mirelman, A.; Giladi, N.; Barnes, L.L.; Bennett, D.A.; Buchman, A.S.; Hausdorff, J.M. Transition Between the Timed up and Go Turn to Sit Subtasks: Is Timing Everything? J Am Med Dir Assoc 2016, 17. [Google Scholar] [CrossRef]
- Diao, Y.; Lou, N.; Liang, S.; Zhang, Y.; Ning, Y.; Li, G.; Zhao, G. A Novel Environment-Adaptive Timed up and Go Test System for Fall Risk Assessment with Wearable Inertial Sensors. IEEE Sens J 2021, 21, 18287–18297. [Google Scholar] [CrossRef]
- Negrini, S.; Serpelloni, M.; Amici, C.; Gobbo, M.; Silvestro, C.; Buraschi, R.; Borboni, A.; Crovato, D.; Lopomo, N.F. Use of Wearable Inertial Sensor in the Assessment of Timed-Up-and-Go Test: Influence of Device Placement on Temporal Variable Estimation. In Proceedings of the Lecture Notes of the Institute for Computer Sciences, Social-Informatics and Telecommunications Engineering, LNICST; 2017; Volume 192. [Google Scholar]
- Wüest, S.; Massé, F.; Aminian, K.; Gonzenbach, R.; de Bruin, E.D. Reliability and Validity of the Inertial Sensor-Based Timed “Up and Go” Test in Individuals Affected by Stroke. J Rehabil Res Dev 2016, 53. [Google Scholar] [CrossRef] [PubMed]
- Zampieri, C.; Salarian, A.; Carlson-Kuhta, P.; Nutt, J.G.; Horak, F.B. Assessing Mobility at Home in People with Early Parkinson’s Disease Using an Instrumented Timed Up and Go Test. Parkinsonism Relat Disord 2011, 17. [Google Scholar] [CrossRef] [PubMed]
- Mangano, G.R.A.; Valle, M.S.; Casabona, A.; Vagnini, A.; Cioni, M. Age-Related Changes in Mobility Evaluated by the Timed up and Go Test Instrumented through a Single Sensor. Sensors (Switzerland) 2020, 20. [Google Scholar] [CrossRef] [PubMed]
- Zasadzka, E.; Borowicz, A.M.; Roszak, M.; Pawlaczyk, M. Assessment of the Risk of Falling with the Use of Timed up and Go Test in the Elderly with Lower Extremity Osteoarthritis. Clin Interv Aging 2015, 10. [Google Scholar] [CrossRef] [PubMed]
- Jones, C.J.; Rikli, R.E.; Beam, W.C. Research Quarterly for Exercise and Sport A 30-s Chair-Stand Test as a Measure of Lower Body Strength in Community-Residing Older Adults. shapeamerica.tandfonline.com 2013, 70. [Google Scholar] [CrossRef]
- Khalaj, N.; Osman, N.A.A.; Mokhtar, A.H.; Mehdikhani, M.; Abas, W.A.B.W. Balance and Risk of Fall in Individuals with Bilateral Mild and Moderate Knee Osteoarthritis. PLoS One 2014, 9. [Google Scholar] [CrossRef]
- Jones, C.J.; Rikli, R.E.; Beam, W.C. A 30-s Chair-Stand Test as a Measure of Lower Body Strength in Community-Residing Older Adults. Res Q Exerc Sport 1999, 70. [Google Scholar] [CrossRef]
- Luc-Harkey, B.A.; Safran-Norton, C.E.; Mandl, L.A.; Katz, J.N.; Losina, E. Associations among Knee Muscle Strength, Structural Damage, and Pain and Mobility in Individuals with Osteoarthritis and Symptomatic Meniscal Tear. BMC Musculoskelet Disord 2018, 19. [Google Scholar] [CrossRef]
- Batushansky, A.; Zhu, S.; Komaravolu, R.K.; South, S.; Mehta-D’souza, P.; Griffin, T.M. Fundamentals of OA. An Initiative of Osteoarthritis and Cartilage. Obesity and Metabolic Factors in OA. Osteoarthritis Cartilage 2022, 30. [Google Scholar] [CrossRef]
- Metcalfe, A.; Stewart, C.; Postans, N.; Barlow, D.; Dodds, A.; Holt, C.; Whatling, G.; Roberts, A. Abnormal Loading of the Major Joints in Knee Osteoarthritis and the Response to Knee Replacement. Gait Posture 2013, 37. [Google Scholar] [CrossRef]
- De Baets, L.; Matheve, T.; Timmermans, A. The Association between Fear of Movement, Pain Catastrophizing, Pain Anxiety, and Protective Motor Behavior in Persons with Peripheral Joint Conditions of a Musculoskeletal Origin: A Systematic Review. Am J Phys Med Rehabil 2020, 99. [Google Scholar] [CrossRef] [PubMed]
- Shumway-Cook, A.; Brauer, S.; Woollacott, M. Predicting the Probability for Falls in Community-Dwelling Older Adults Using the Timed up and Go Test. Phys Ther 2000, 80. [Google Scholar] [CrossRef]
- Ansai, J.H.; Farche, A.C.S.; Rossi, P.G.; De Andrade, L.P.; Nakagawa, T.H.; Takahashi, A.C.D.M. Performance of Different Timed Up and Go Subtasks in Frailty Syndrome. Journal of Geriatric Physical Therapy 2019, 42. [Google Scholar] [CrossRef] [PubMed]
- Na, E.; Hwang, H.; Woo, Y. Study of Acceleration of Center of Mass during Sit-to-Stand and Stand-to-Sit in Patients with Stroke. J Phys Ther Sci 2016, 28. [Google Scholar] [CrossRef] [PubMed]
- Manckoundia, P.; Mourey, F.; Pfitzenmeyer, P.; Papaxanthis, C. Comparison of Motor Strategies in Sit-to-Stand and Back-to-Sit Motions between Healthy and Alzheimer’s Disease Elderly Subjects. Neuroscience 2006, 137. [Google Scholar] [CrossRef] [PubMed]
- Borges, S.D.M.; Radanovic, M.; Forlenza, O.V. Fear of Falling and Falls in Older Adults with Mild Cognitive Impairment and Alzheimers Disease. Aging, Neuropsychology, and Cognition 2015, 22. [Google Scholar] [CrossRef]
- Fasano, A.; Canning, C.G.; Hausdorff, J.M.; Lord, S.; Rochester, L. Falls in Parkinson’s Disease: A Complex and Evolving Picture. Movement Disorders 2017, 32. [Google Scholar] [CrossRef]
- Carter, N.D.; Khan, K.M.; McKay, H.A.; Petit, M.A.; Waterman, C.; Heinonen, A.; Janssen, P.A.; Donaldson, M.G.; Mallinson, A.; Riddell, L.; et al. Community-Based Exercise Program Reduces Risk Factors for Falls in 65- to 75-Year-Old Women with Osteoporosis: Randomized Controlled Trial. CMAJ. Canadian Medical Association Journal 2002, 167. [Google Scholar]
- Sibley, K.M.; Straus, S.E.; Inness, E.L.; Salbach, N.M.; Jaglal, S.B. Balance Assessment Practices and Use of Standardized Balance Measures among Ontario Physical Therapists. Phys Ther 2011, 91. [Google Scholar] [CrossRef] [PubMed]
- Wu, C.C.; Xiong, H.Y.; Zheng, J.J.; Wang, X.Q. Dance Movement Therapy for Neurodegenerative Diseases: A Systematic Review. Front Aging Neurosci 2022, 14. [Google Scholar] [CrossRef]
- Silverwood, V.; Blagojevic-Bucknall, M.; Jinks, C.; Jordan, J.L.; Protheroe, J.; Jordan, K.P. Current Evidence on Risk Factors for Knee Osteoarthritis in Older Adults: A Systematic Review and Meta-Analysis. Osteoarthritis Cartilage 2015, 23. [Google Scholar] [CrossRef]
- Viteckova, S.; Horakova, H.; Polakova, K.; Krupicka, R.; Ruzicka, E.; Brozova, H. Agreement between the GAITRite R System and the Wearable Sensor BTS G-Walk R for Measurement of Gait Parameters in Healthy Adults and Parkinson’s Disease Patients. PeerJ 2020, 2020. [Google Scholar] [CrossRef]
- Volkan-Yazici, M.; Çobanoğlu, G.; Yazici, G. Test-Retest Reliability and Minimal Detectable Change for Measures of Wearable Gait Analysis System (G-Walk) in Children with Cerebral Palsy. Turk J Med Sci 2022, 52, 658–666. [Google Scholar] [CrossRef] [PubMed]
Figure 1.
The G-walk inertial sensor device is placed in a pocket of a semi-elastic belt positioned above the iliac wings, at the level of the L4 lumbar vertebra.
Figure 1.
The G-walk inertial sensor device is placed in a pocket of a semi-elastic belt positioned above the iliac wings, at the level of the L4 lumbar vertebra.
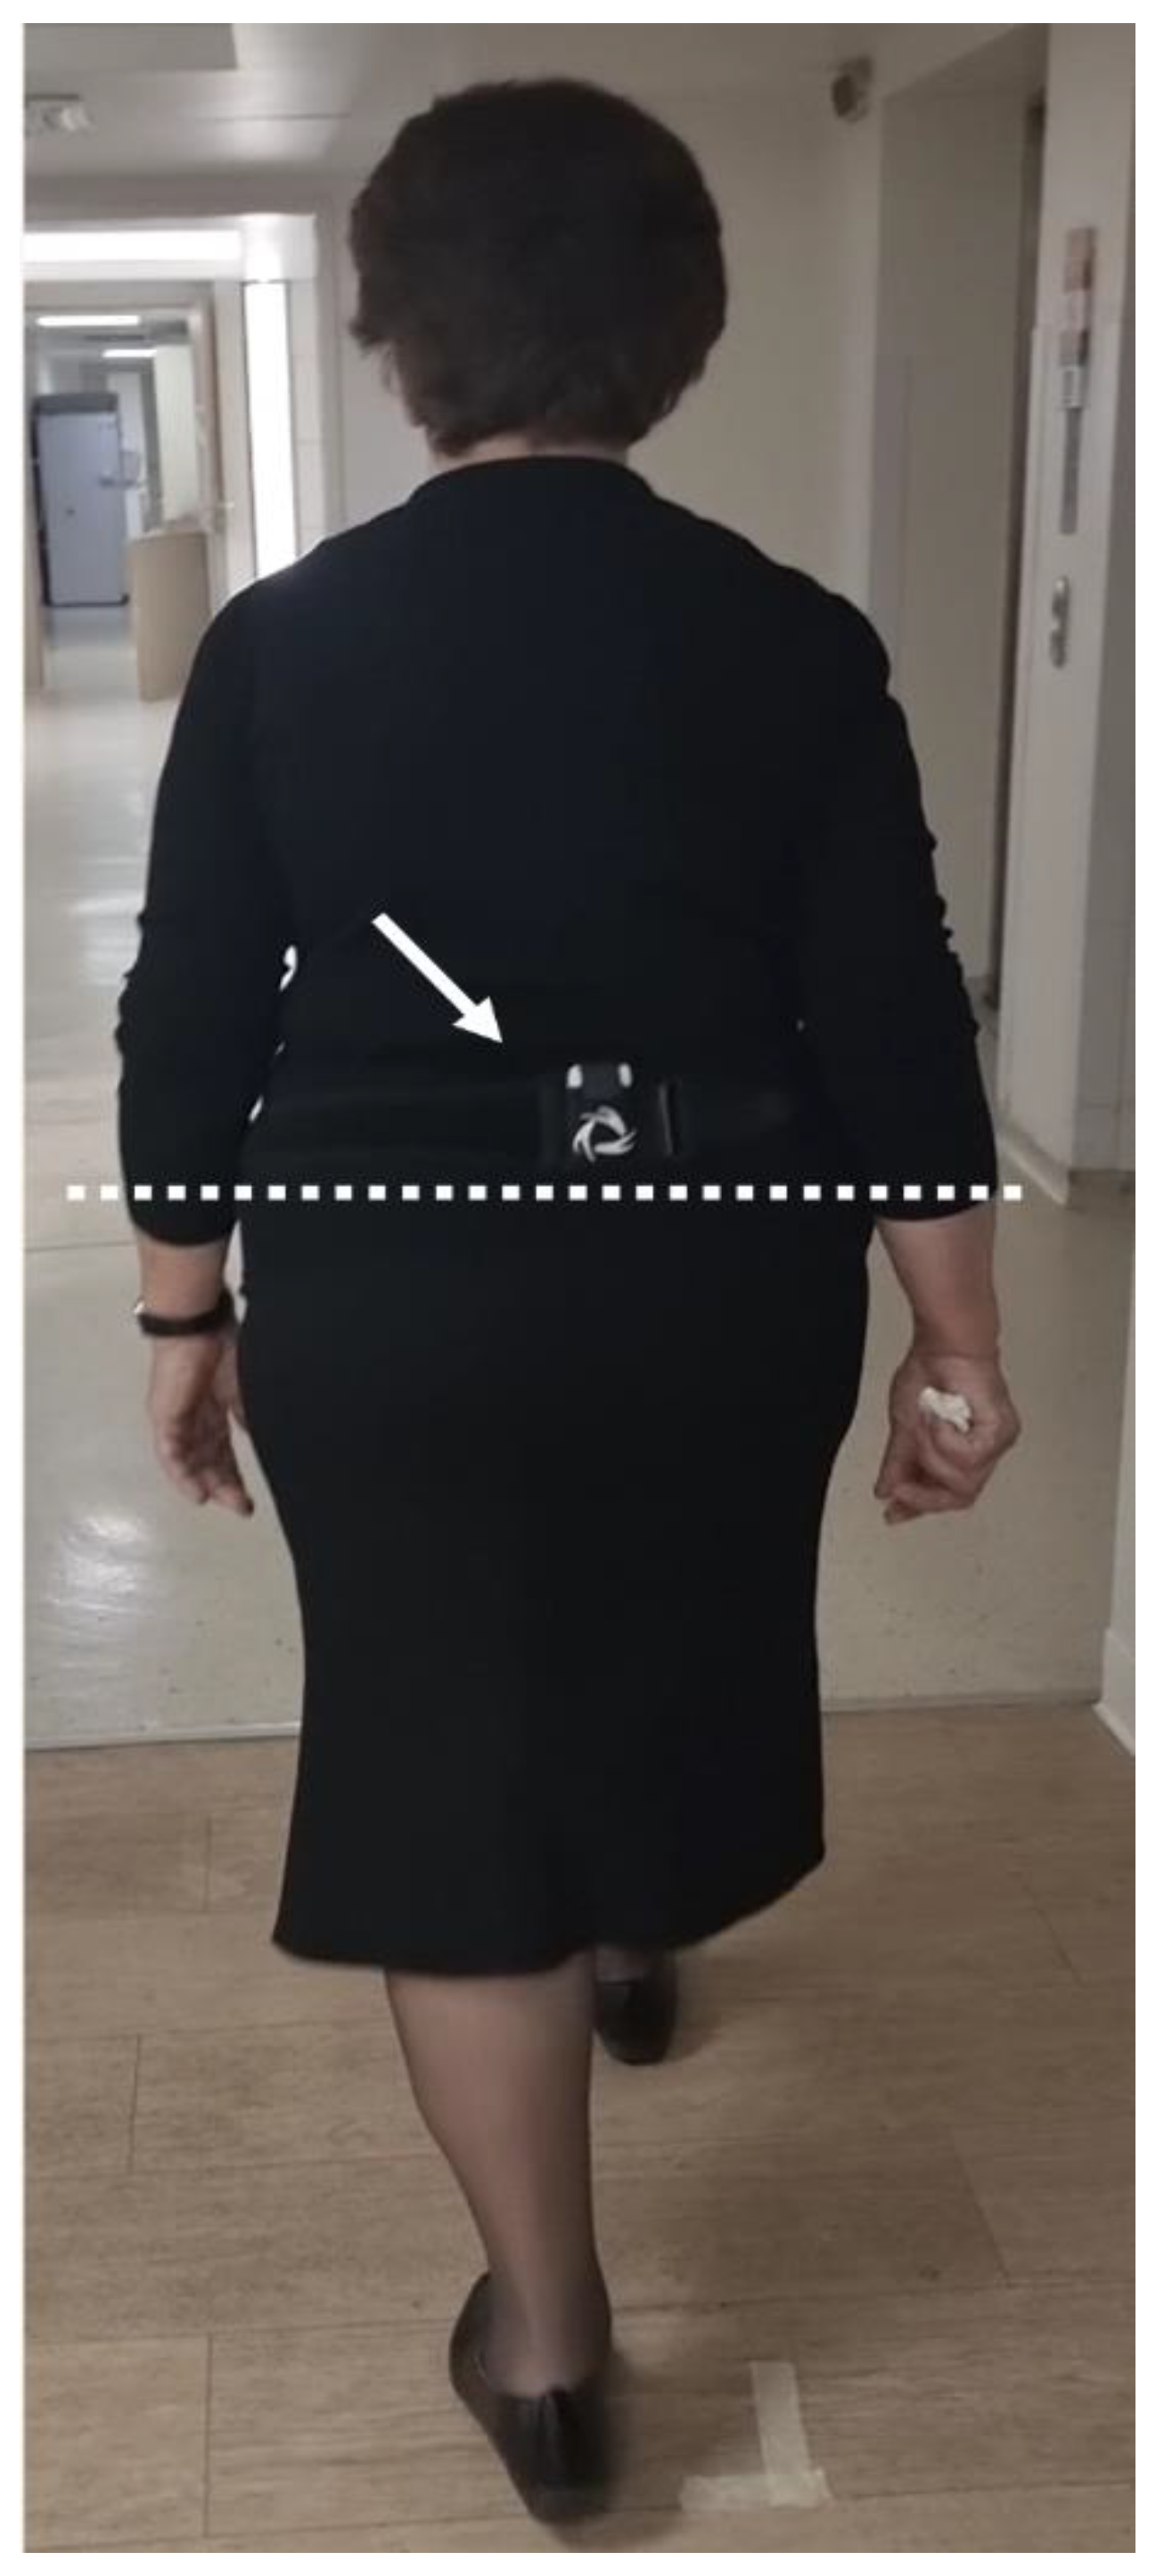
Figure 2.
The report of the TUG test, as is provided by the dedicated G-Studio software.
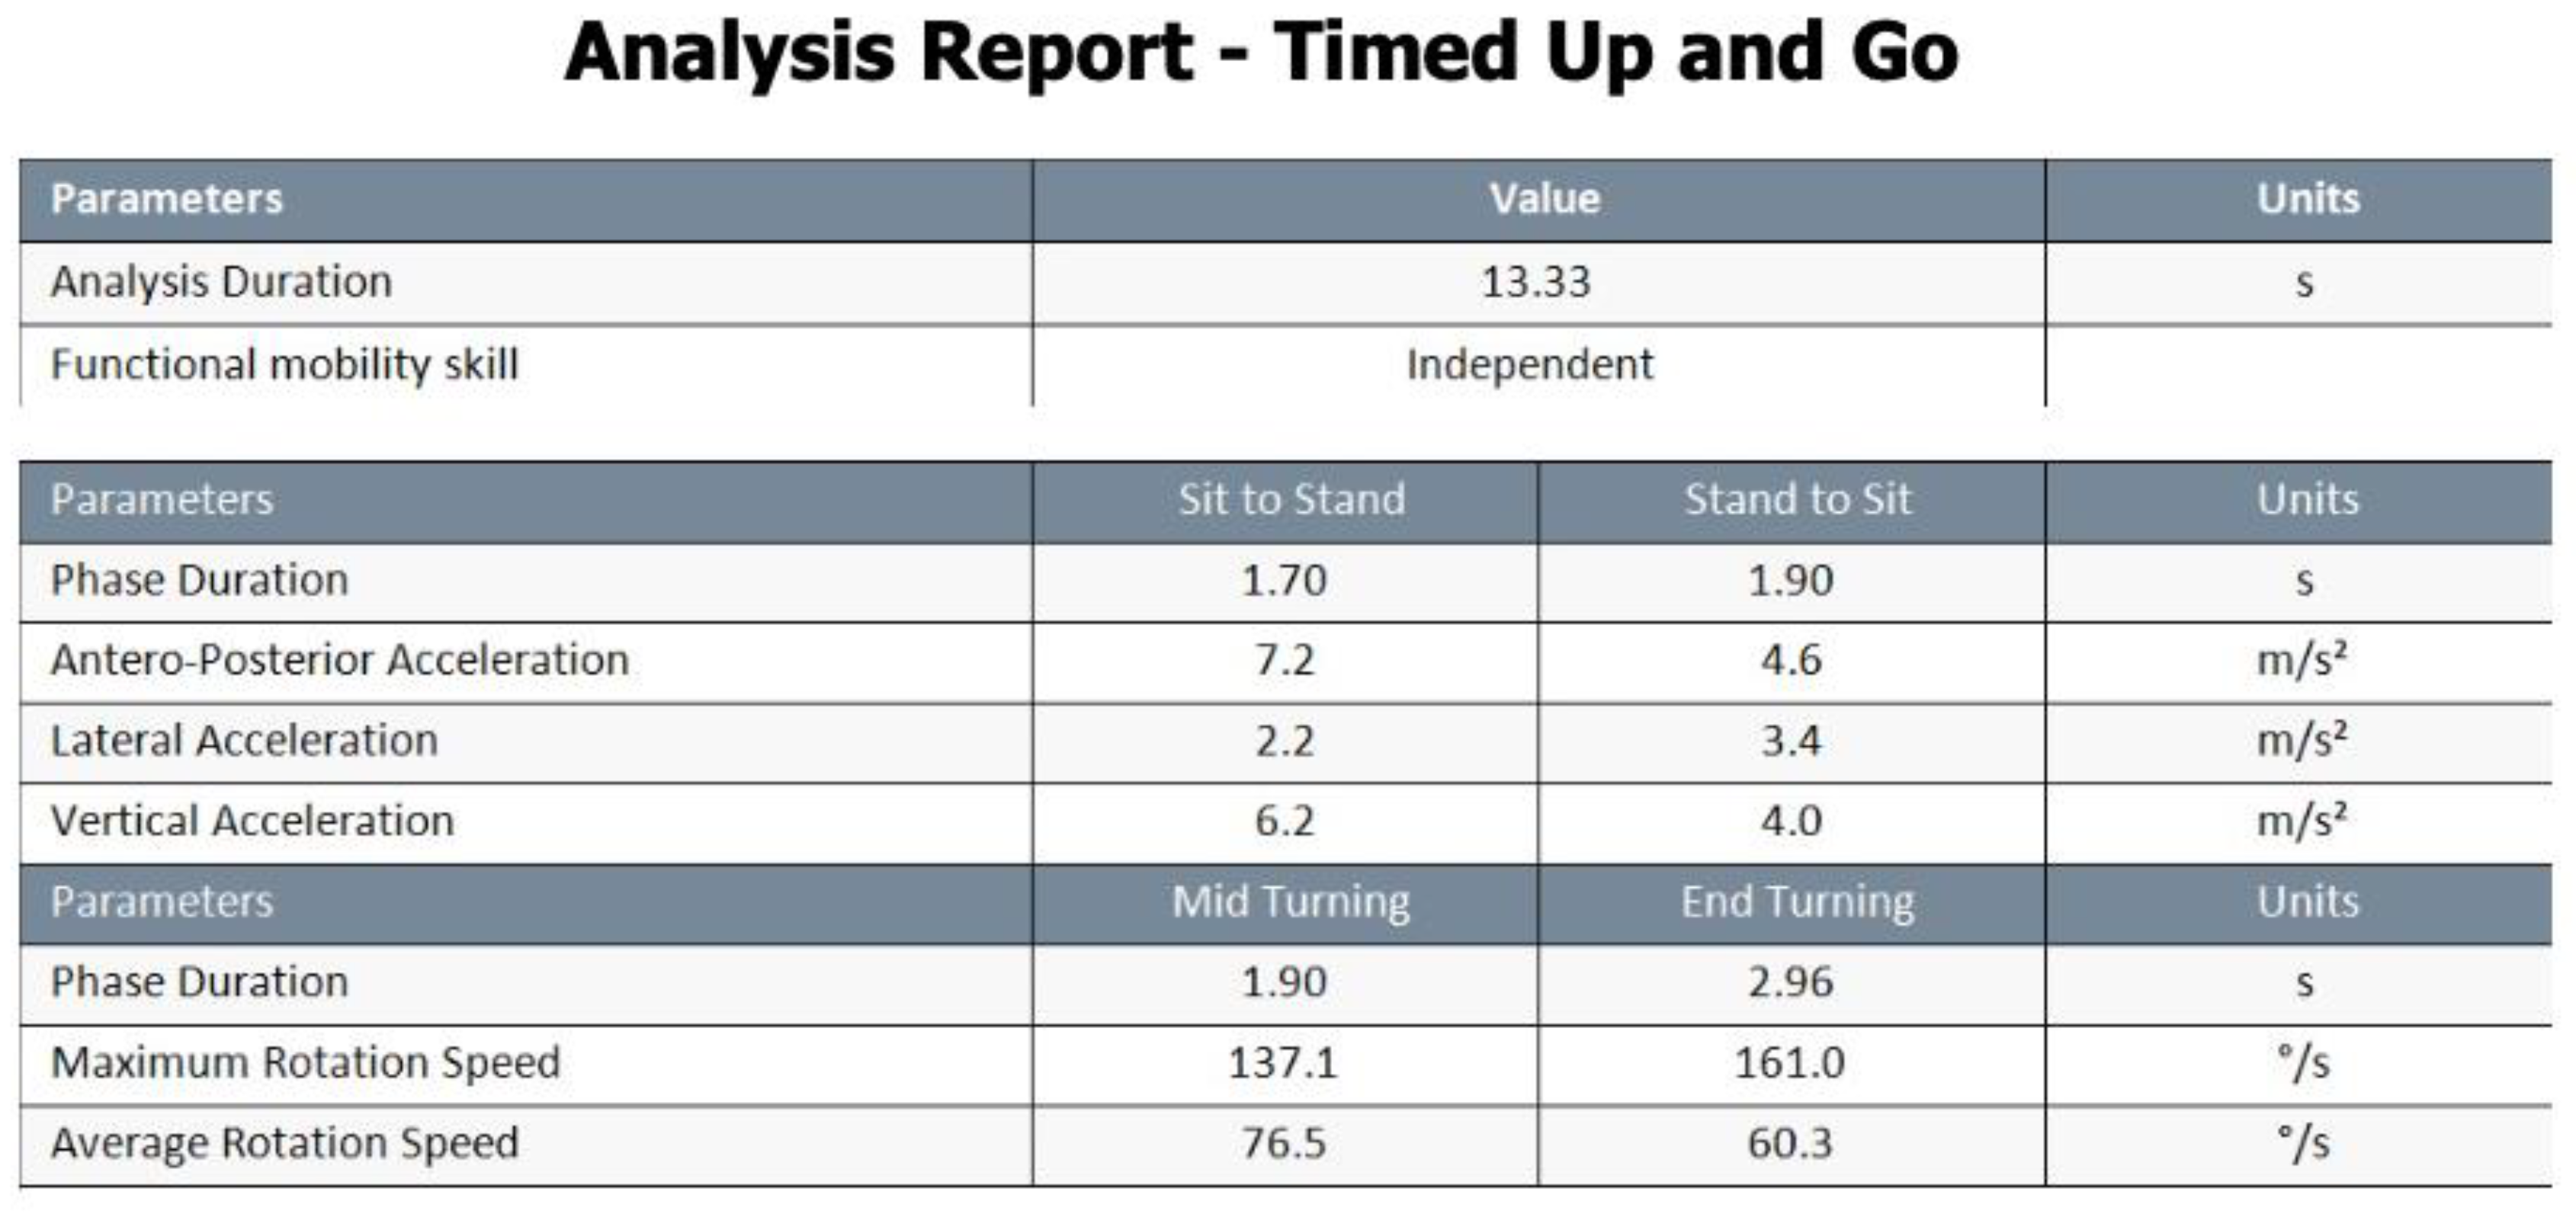
Figure 3.
The G-Studio software provides a graphic representation of the various phases of the TUG test.
Figure 3.
The G-Studio software provides a graphic representation of the various phases of the TUG test.
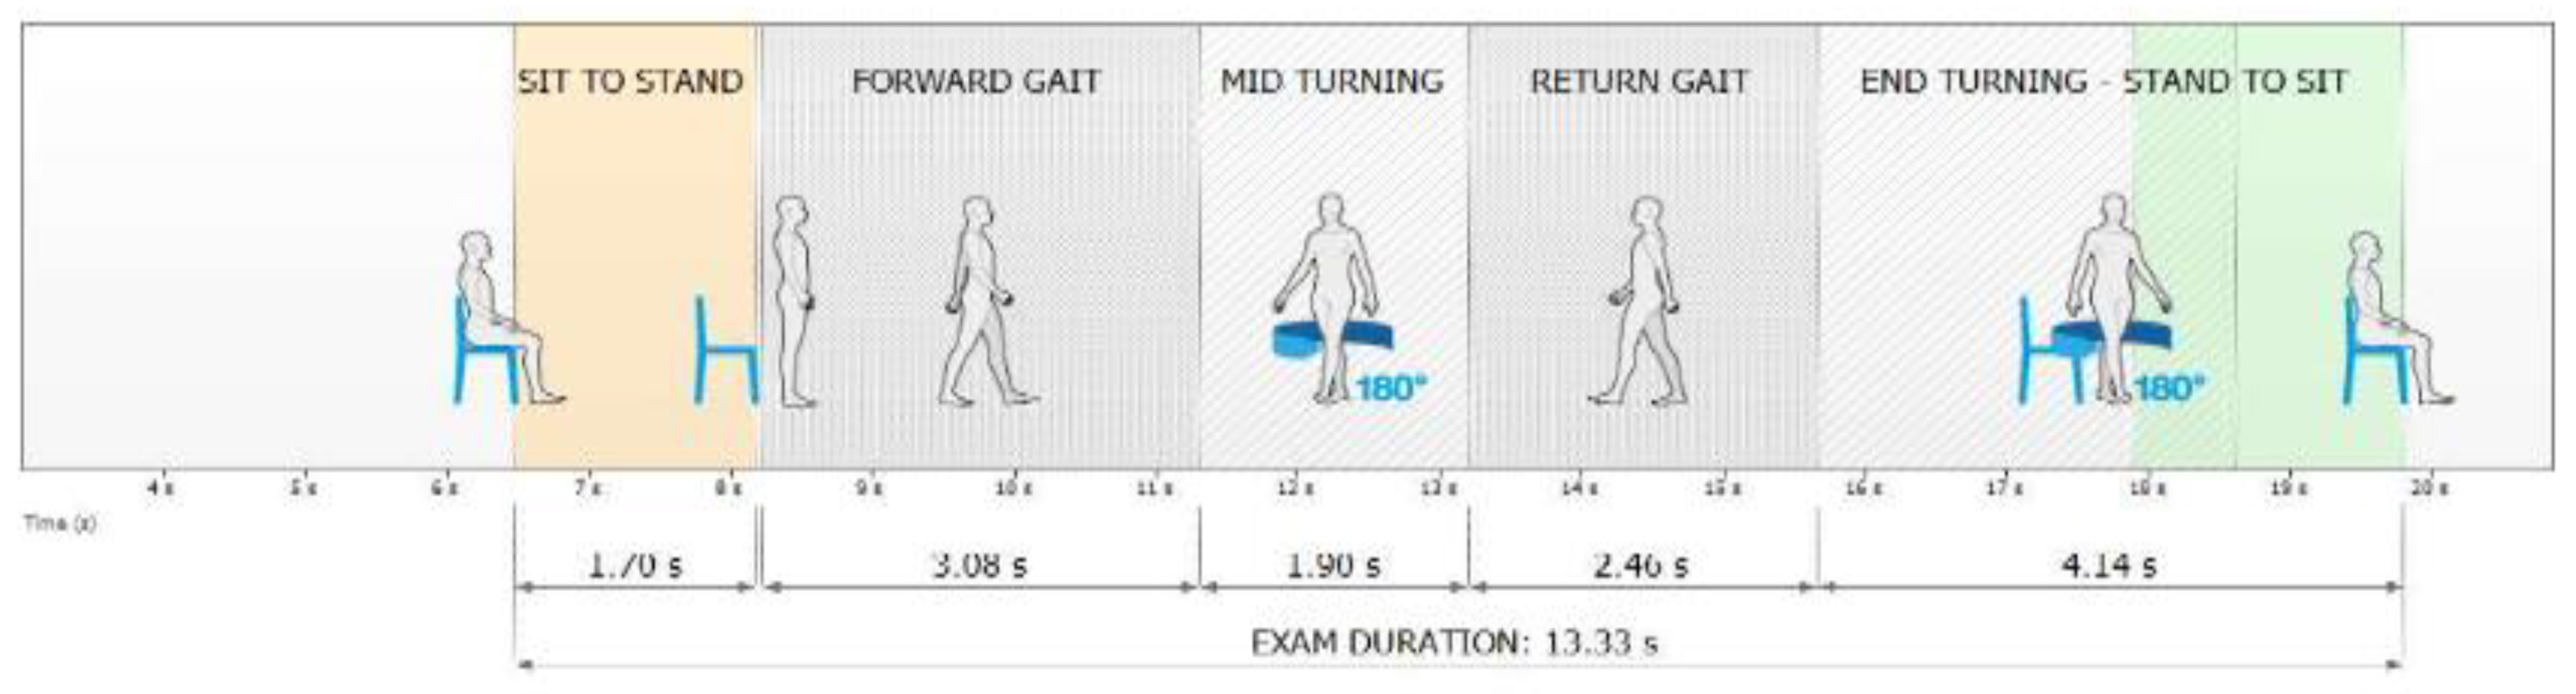

Table 1.
Demographic data of the patients included in the study presented as mean and standard deviation (SD).
Table 1.
Demographic data of the patients included in the study presented as mean and standard deviation (SD).
| All participants (n=39) | |||
|
Knee Osteoarthritis Patients (n=20) |
Healthy Controls (n=60) |
p-value | |
| Age (year) | 74.84 (6.694) | 72.25 (5.220) | 0.184 |
| Weight (kg) | 83.79 (16.788) | 78.60 (9.816) | 0.243 |
| Height (cm) | 165.74 (7.117) | 165.00 (8.784) | 0.776 |
| BMI | 30.46 (5.61) | 29.00 (3.83) | 0.335 |
| Shoe size (EU) | 39.68 (2.358) | 39.55 (2.502) | 0.864 |
| Gender, Male/Female, N(%) | 5(15.8) / 15(84.2) | 15(25.0)/45(75.0) | 0.695 |
Table 2.
Parameters analysis presented as mean and standard deviation (SD).
| Knee Osteoarthritis Patients | Healthy Controls | p-value | |
| Analysis duration, s | 22.32±5.49 | 12.94±1.88 | <0.001 |
| Sit to Stand Phase Duration, s | 2.35±0.64 | 1.62±0.33 | <0.001 |
| Forward Gait Phase Duration, s | 5.65±2.45 | 2.96±0.83 | <0.001 |
| Return Gait Phase Duration, s | 5.58±2.46 | 3.03±0.72 | <0.001 |
| Stand to Sit Antero-Posterior Acceleration, m/s² | 3.07±1.64 | 4.06±1.53 | 0.060 |
| Sit to Stand Vertical Acceleration, m/s² | 2.83±1.01 | 4.02±1.07 | <0.001 |
| Stand to Sit Vertical Acceleration, m/s² | 4.95±2.70 | 6.17±2.57 | 0.156 |
| End Turning Phase Duration, sec | 3.35±0.92 | 1.84±0.56 | <0.001 |
| Mid Turning Maximum Rotation Speed, °/s | 116.70±33.78 | 149.60±27.83 | 0.002 |
| End Turning Maximum Rotation Speed, °/s | 106.14±29.27 | 168.02±35.48 | <0.001 |
| Mid Turning Average Rotation Speed, °/s | 56.94±20.12 | 88.29±20.48 | <0.001 |
| End Turning Average Rotation Speed, °/s | 50.59±14.95 | 91.29±22.76 | <0.001 |
| Median(IQR) | Median(IQR) | ||
| Stand to Sit Phase Duration, s | 2.30±0.90 | 1.90±0.75 | 0.017 |
| Sit to Stand Antero-Posterior Acceleration, m/s² | 2.00±1.20 | 3.10±0.92 | 0.002 |
| Sit to Stand Lateral Acceleration, m/s² | 1.40±0.60 | 1.70±0.38 | 0.002 |
| Stand to Sit Lateral Acceleration, m/s² | 3.10±1.50 | 3.65±0.92 | 0.086 |
| Mid Turning Phase Duration, s | 3.03±1.20 | 1.88±0.80 | <0.001 |
Disclaimer/Publisher’s Note: The statements, opinions and data contained in all publications are solely those of the individual author(s) and contributor(s) and not of MDPI and/or the editor(s). MDPI and/or the editor(s) disclaim responsibility for any injury to people or property resulting from any ideas, methods, instructions or products referred to in the content. |
© 2024 by the authors. Licensee MDPI, Basel, Switzerland. This article is an open access article distributed under the terms and conditions of the Creative Commons Attribution (CC BY) license (http://creativecommons.org/licenses/by/4.0/).
Copyright: This open access article is published under a Creative Commons CC BY 4.0 license, which permit the free download, distribution, and reuse, provided that the author and preprint are cited in any reuse.


