
Submitted:
18 November 2024
Posted:
19 November 2024
You are already at the latest version
Abstract
Ethylene glycol (EG) is one of the contaminants in wastewater of airports because it is commonly used in the composition of aircraft deicing fluids during the cold season in northern regions. Ethylene glycol by itself has comparably low toxicity on mammals and aquatic life, but it can lead to substantial increase in chemical and biological oxygen demands. Contamination of water with EG facilitates the rapid growth of microbial biofilms that decreases the concentration of dissolved oxygen in water and negatively affects overall biodiversity. The development of simple method to decompose EG with a high efficiency and low operating costs is an important task. This study shows that ethylene glycol can be completely oxidized using UV-C activated hydrogen peroxide (H2O2/UV-C) with a high rate (up to 56 mg L–1 h–1) at optimum EG:H2O2 molar ratio of 1:10–1:15. Air purging the reaction solution at 1000 cm3 min–1 increases EG mineralization rate up to 2 times because simultaneous action of UV-activated H2O2 and O2 (H2O2 + O2/UV-C) leads to a synergistic effect, especially at low EG:H2O2 ratios. The kinetics and mechanism of EG degradation are discussed based on the kinetic plots of ethylene glycol and intermediate products.
Keywords:
environmental protection
; wastewater treatment
; ethylene glycol (EG)
; advanced oxidation processes (AOPs)
; photodegradation
; H2O2/UV-C
1. Introduction
Air transport plays an important role in the modern world providing fast and easy transportation of people, mail, and goods over long distances [1]. Major airports are crucial transport hubs that consume a lot of energy and resources, but generate many emissions, including greenhouse gases, volatile organic compounds (VOCs), organics, and lubricants [2]. Furthermore, aircraft deicing fluids (ADFs) are actively used during the cold season in northern regions to remove ice and snow deposits from aircraft surfaces and prevent their further accumulation. ADFs consist of freezing point depressants (50–75%), water (50–25%), and additives (e.g., colorants, thickeners, corrosion inhibitors, surfactants, and pH modifiers) [3]. ADFs are categorized into four types according to their composition, properties, and application fields [4,5]. Deicing fluids of type I have low viscosity and are predominantly used to remove ice and snow from aircraft surfaces. Type II, III, and IV ADFs have higher viscosity due to the presence of thickening agents, which allow the formation of a thin-film coating on external surface of aircraft elements to prevent the deposition and accumulation of ice. The main difference between these types of ADFs attributes to the stability of the formed anti-ice coating at high aircraft speeds. Currently, compositions corresponding to types I and IV are the most commonly used ADFs in airports [6]. Glycols, namely ethylene glycol (EG) and propylene glycol (PG), serve as depressants in many types of fluids because they have relatively low freezing points. Propylene glycol is mostly employed in the USA and Western Europe, while EG-based ADFs are more common in Canada and Russia [7]. The concentration of glycols in wastewater of large transport hubs during the cold season can significantly exceed threshold limit values, thus leading to the environmental pollution [8].
Many studies show that ethylene glycol by itself exhibits relatively low acute and chronic toxicity to aquatic organisms [9,10,11,12,13]. For instance, Pillard [12] showed that the lethal concentration of EG, when 50% of the population dies within 48 h (i.e., 48-h LC50), is 82 g L–1 for fathead minnow Pimephales promelas and 34 g L–1 for water flea Ceriodaphnia dubia, respectively. Chronic toxicity can be expressed as the inhibitory concentration, when growth is inhibited by 25% of the population (i.e., IC25). In the case of C.dubia, IC25 of EG is found to be 12 g L–1. Acute toxicity of some ADFs can be substantially higher than that of EG per se due to the presence of benzotriazoles, which are used in the composition as corrosion inhibitors [14]. More details on the toxicity of EG and EG-based ADFs are summarized in Table 1.
At the same time, indirect factors can substantially affect the aquatic biota in contaminated water. Microorganisms are able to utilize ethylene glycol as a simple carbon source, which promotes their rapid growth [16,17,18]. The biological oxidation of ethylene glycol during this process consumes large amount of oxygen and leads to deficiency of dissolved oxygen in water. [18]. This fact can harm fish and macroinvertebrate populations and negatively affect the overall biodiversity. [6]. Metabolites of ethylene glycol also have toxic effects. For instance, oxalic acid can form crystals in fish kidneys, thus leading to tissue necrosis and other forms of damage [10].
Special procedures are employed in airports to prevent the adverse effects of ADFs on the environment. Major airports have special pads for performing anti-icing operations. These pads are connected to a collection system that prevents ADF from discharging into runoff water [19]. Distillation of the collected solution can provide recycling and reuse of glycols. However, this process requires a lot of energy and is not economically justified when the glycol concentration is lower than 5% [20,21]. Due to this reason, other purification methods are more preferrable for the treatment of low-concentrated solutions to decompose ethylene glycol. Controlled biodegradation in wetlands and soil can be used for efficient treatment of wastewater [22]. On the other hand, these systems require large land areas and are strongly affected by ambient temperature and concentration of dissolved oxygen and other contaminants [23]. Open-air systems can also attract undesirable wildlife. Anaerobic oxidation systems do not have these drawbacks and are more stable, but they are not be able to treat wastewater seasonally containing ethylene glycol in relatively high concentration [24].
One of the promising ways to solve the problem of water contamination with ethylene glycol is application of advanced oxidation processes (AOPs). These processes include electrochemical oxidation [25,26], Fenton and photo-Fenton reactions [27,28,29], photocatalysis [30,31], ozonation [32,33], treatment with UV-activated hydrogen peroxide or hydrogen persulfate [34,35,36]. Hydrogen peroxide is an environmentally friendly reagent, which can be used as a strong oxidant in the processes of water treatment. H2O2 can generate hydroxyl radicals OH• having the redox potential of E° = 2.73 V (vs. RHE), which is high enough to oxidize almost all organic compounds [37]. However, an important aspect of H2O2 application is the requirement for its activation to generate a high number of hydroxyl radicals. H2O2 can be activated sonochemically [38], photochemically [39], or by using Fenton and Fenton-like systems [40]. Activation of H2O2 with UV-C light is easy to operate and does not require additional electrolytes or catalysts. Based on these reasons, H2O2/UV-C oxidation systems are promising for efficient treatment of water contaminated with ethylene glycol and further practical applications [41,42]. This work is aimed to analyze the kinetic aspects of EG degradation during its treatment in the H2O2/UV-C system. Quantitative characteristics of EG degradation were obtained by analyzing total organic carbon (TOC) and chemical oxygen demand (COD) during irradiation. The effects of EG:H2O2 ratio and air purging on EG degradation rate were studied. Finally, the mechanism of EG degradation is discussed based on the data of formed intermediates, which are analyzed using HPLC.
2. Results and Discussion
2.1. Effect of EG:H2O2 Molar Ratio
Kinetic experiments on EG degradation were performed in a batch photoreactor with addition of H2O2 as a strong oxidant. TOC and COD were monitored during the experiments to analyze the kinetics of EG degradation. A change in COD value allows us to analyze partial oxidation of the initial substrate and intermediates, while TOC change reveals complete oxidation of organic matter to CO2. The reactor was equipped with an inner-placed UV-C lamp to activate the generation of hydroxyl radicals from H2O2 and boost the reaction rate (see the Materials and Methods section and Figure S1).
Initially, a series of preliminary experiments was performed to confirm the synergistic effect of all components, when they are employed simultaneously. First, the separate effect of H2O2 on EG oxidation was checked in a model solution containing EG (500 mg L–1 or 8.05 mM) and H2O2, initial concentration of which was 10 times higher than that of EG. According to the stoichiometry of complete oxidation:
molar ratio of reagents in this case (EG:H2O2 = 1:10) corresponded to the two-fold molar excess of H2O2 toward the stoichiometric value.
C2H6O2 + 5H2O2 = 2CO2 + 8H2O,
Figure 1a shows no evident TOC reduction in the experiment without UV-C irradiation, whereas COD value slightly decreases during time. A change in COD value allows the conclusion on partial oxidation of EG with H2O2, but corresponding COD rate has extremely low value (11 mg L–1 h–1). This confirms that H2O2 by itself poorly oxidizes organics, even low-molecular compounds such as ethylene glycol, and the activation of H2O2 is essential for efficient EG degradation.
It is well known that UV-C light causes photolysis of organic compounds and provides degradation of organic contaminants in water [43]. For this reason, the separate effect of UV-C light was also studied. Figure 1b shows no evident TOC reduction during irradiation of EG solution (500 mg L–1) with UV-C light that confirms no complete oxidation of ethylene glycol. At the same time, COD monotonically reduces with a rate of 36 mg L–1 h–1 that indicates a partial oxidation of EG due to the impact of UV-C light and ozone photogenerated from dissolved oxygen in water. COD rate under UV-C light is three times higher compared to the case of treatment with H2O2 only, but it also has a low absolute value, which is not high enough for practice. As will be shown later, the combined action of H2O2 and UV-C light allows sharp rise in the rate of EG degradation.
Irradiation of H2O2 with UV-C light leads to the formation of OH• radicals, which are reactive oxygen species [44]. This process is commonly referred to as activation of hydrogen peroxide [45]. Figure 2 shows TOC and COD kinetic plots during the experiment on EG degradation with H2O2/UV-C system, when initial molar ratio of EG:H2O2 is adjusted to 1:25.
Both TOC and COD values monotonically decrease during irradiation. An induction period presents in TOC plot, whereas COD starts to decrease immediately after turning UV-C light on. This means that EG oxidation occurs though the formation of intermediates, but under irradiation these intermediates are completely oxidized with the formation of CO2 as the final product, which is released to the gas phase. TOC plot in the whole period of irradiation until complete removal of organic matter poorly corresponds to the kinetics of a first-order reaction due to multistage nature of oxidation process. To compare the efficiency of EG degradation in different experiments, TOC values after induction period were linearly approximated and the estimated rate of TOC removal was used as an efficient reaction rate. In the case of EG:H2O2 ratio equaled to 1:25, the rate of TOC removal is found to be 47 mg L–1 h–1 (Figure 2a). It is worth noting that COD data can also be used for this purpose because relative reduction in COD is the same as for TOC (i.e., 24% h–1 as shown in Figure 2), despite of different absolute values.
An important aspect of reaction engineering is the optimization of operating parameters to maximize the efficiency of oxidant utilization [46]. The effect of EG:H2O2 molar ratio on the kinetics of EG mineralization was investigated based on the values of TOC removal rate. As mentioned above, the stoichiometric ratio for complete oxidation of EG with H2O2 corresponds to 1:5 (see Equation 1). The results of experiments reveal that H2O2 amount at the stoichiometric value or lower is not high enough for efficient degradation of EG, and an excess of H2O2 is required. Figure 3 shows that the rate of EG mineralization has the maximum of 56 mg L–1 h–1 at EG:H2O2 ratio of 1:10–1:15. It corresponds to the two- and three-fold molar excess of H2O2 toward the stoichiometric value, respectively.
However, further increase in the concentration of hydrogen peroxide above the mentioned values does not enhance the rate of EG mineralization, but contrary reduces it. At high H2O2 concentrations, OH• radicals interact with molecules of hydrogen peroxide with the formation of hydroperoxyl radicals (HO2•) according to the following reaction [47]:
H2O2 + OH• = H2O + HO2•
The formed HO2• radicals are less active than OH• radicals that leads to a decrease in the overall reaction rate.
Thus, fast EG mineralization in the H2O2/UV-C system can be achieved, when H2O2 concentration is 2-3 times higher than the stoichiometric value.
2.2. Intensification of Oxydation Process
Several approaches were tested to intensify EG degradation in the H2O2/UV-C system and reduce operational costs via shorter time of irradiation and lower amount of added H2O2. It was found that purging the reaction solution with oxygen at its volume flow rate of 200 cm3 min–1 resulted in a substantial increase in the rate of EG mineralization. Figure 4 shows that TOC removal rate in the H2O2 + O2/UV-C system is up to 2 times higher compared to the experiments without oxygen purging (i.e., H2O2/UV-C). In the case of stoichiometric mixture (EG:H2O2 = 1:5, Figure 4a), 90% of TOC removal under oxygen purging reaches for 3.75 h, whereas 5 h is required for the same depth of mineralization in the H2O2/UV-C system. It occurs due to oxygen purging increases initial rate of EG mineralization in 1.4 times from 46 to 64 mg L–1 h–1. Furthermore, oxygen purging allows efficient EG degradation at EG:H2O2 molar ratio lower than the stoichiometric value. Figure 4b shows that TOC removal rate in the H2O2 + O2/UV-C system with EG:H2O2 ratio of 1:3 achieves 56 mg L–1 h–1 that is the same TOC rate as the maximum in the H2O2/UV-C system observed at EG:H2O2 ratio of 1:10–1:15 (see Figure 3). This means that oxygen can serve as an efficient oxidant under the conditions of this experiment, thus resulting in intensification of the oxidation process.
Other experiments with air purging at flow rates of 200 and 1000 cm3 min–1 were carried out to estimate the main reason of the observed effect on the enhancement of EG oxidation rate. Figure 5 shows that the rates of EG mineralization in the experiments with air flow rate of 1000 cm3 min–1 and oxygen flow rate at 200 cm3 min–1 are similar probably due to the same content of oxygen in both gas flows. Otherwise, purging the reaction solution with air at its flow rate of 200 cm3 min–1 leads to a lower increase in TOC removal rate compared to other cases probably due to lower content of oxygen in this gas flow. It allows the conclusion that oxygen plays a crucial role in the enhancement of EG mineralization, and oxygen or air purging leads to an increase in the reaction rate via increase in the concentration of dissolved oxygen in the reaction solution.
The results discussed above reveal the synergistic effect between UV-activated H2O2 and O2, simultaneous action of which substantially enhances EG mineralization, especially at low EG:H2O2 molar ratio. Air purging of reaction solution with a sufficient flow rate may reduce required amount of H2O2 in 2-3 times while maintaining a high rate of EG degradation and depth of its mineralization.
2.3. Mechanism of EG Degradation
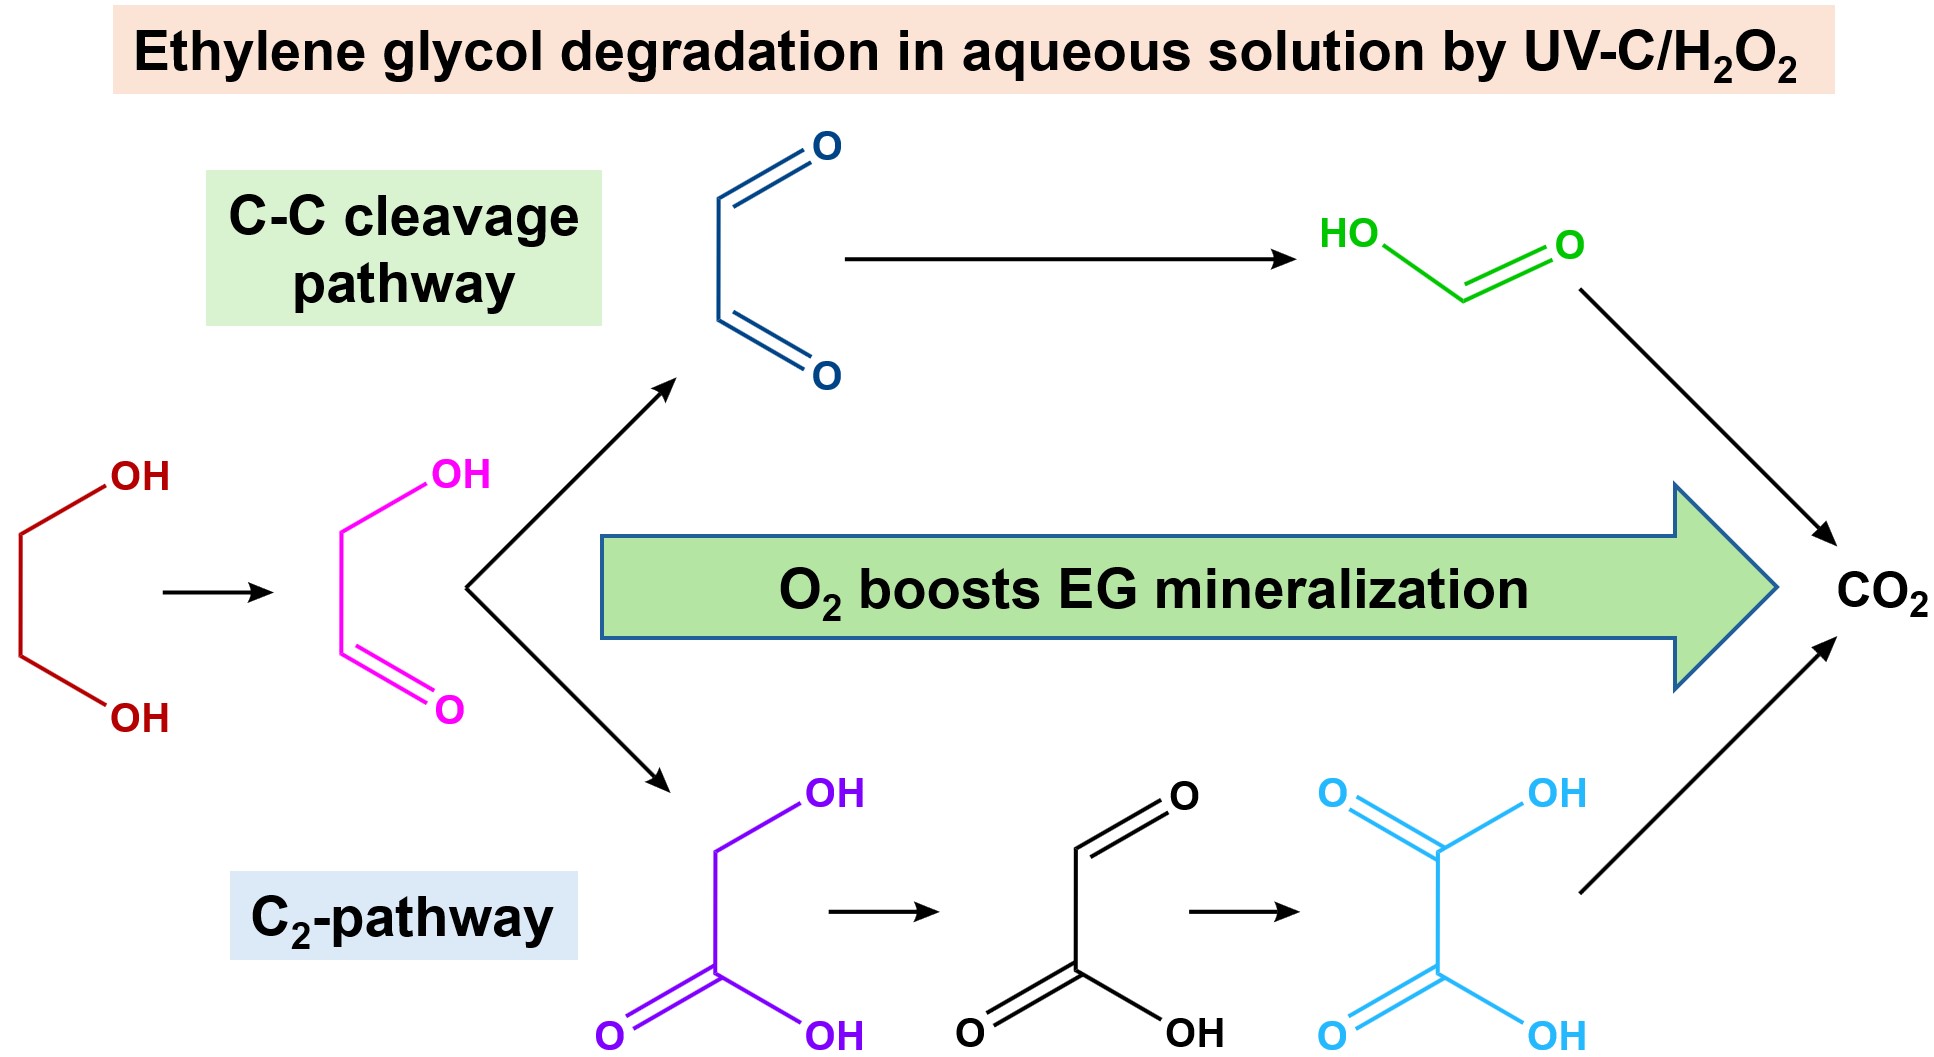
Oxidation of ethylene glycol predominantly occurs in a stepwise manner with the formation of many organic intermediates, including glycol aldehyde, formaldehyde, glyoxal, glycolic acid, glyoxylic acid, oxalic acid, and formic acid [29,32,48,49,50]. To investigate the reasons of strong difference in mineralization rate under the treatment of EG in H2O2/UV-C and H2O2 + air/UV-C systems, concentrations of mentioned reaction components were monitored during the experiments using HPLC analysis (Figure S2 and Table S1). It is important to note that other complex products may also form in radical processes due to occurring the reactions of dehydration, esterification, or polymerization [29,34].
Figure 6 shows the kinetic plots of EG and main intermediates detected in the H2O2/UV-C system. Concentration of ethylene glycol starts to decrease rapidly after turning UV-C light on and reaches a zero value (Figure 6a). Its kinetic plot well corresponds to the kinetics of a first-order reaction with an efficient rate constant (k) of 3.5 ± 0.1 h–1 (see Figure S3). Simultaneously, formic acid forms as the main oxidation product at initial period. Its concentration increases up to 1.76 mM for first 0.5 h and further decreases gradually (Figure 6a). Thus, the C-C bond cleavage can be considered as a crucial step of oxidation process at high concentration of H2O2.
Among aldehydes, glycol aldehyde shows the highest concentration (1.3 mM) after 0.5 h of irradiation (Figure 6b). The maximum concentration of formaldehyde is 3 times lower than that of glycol aldehyde. Formation of formaldehyde may occur via oxidation of glyoxal, and it is consequently oxidized to formic acid. Concentration of glycolic acid reaches the maximum after 1.5 h of irradiation and then decreases with a simultaneous increase in the concentration of glyoxylic and oxalic acids because of partial oxidation (Figure 6c). It worth noting that the concentration of glyoxylic reaches the maximum value after 4 h of irradiation and does not further decrease due to consumption of major H2O2 portion at this moment (Figure 7d).
The results of HPLC analysis allow us to propose two main pathways of EG degradation (Figure 6d). The first one includes C-C bond cleavage in ethylene glycol through glycolaldehyde and glyoxal, resulting in the formation of formic acid. As discussed in [51], such product of EG oxidation as glyoxal can be easily oxidized by hydrogen peroxide even without UV-C irradiation to formic acid, thus resulting in high concentration of HCOOH for initial period of irradiation. Apparently, this route plays a main role during the first minutes of the process. The second pathway (C2-pathway) is the sequential oxidation of ethylene glycol to oxalic acid. Both oxalic and formic acids can be easily oxidized to CO2 under reaction conditions.
As discussed above, air purging leads to substantially higher rate of TOC removal. Figure 7 shows the kinetic plots of EG and main intermediates in the case of H2O2 + air/UV-C system. General trends are similar to the H2O2/UV-C system: fast decrease in EG concentration and high concentration of formic acid in first minutes of irradiation (Figure 7a), comparably high concentration of glycol aldehyde (Figure 7b), and partial oxidation of glycolic acid to glyoxylic and oxalic acids (Figure 7c).
On the other hand, concentration of formic acid in the H2O2 + air/UV-C system (4.13 mM) is about two times higher compared to the case of H2O2/UV-C system, while concentration of glycol aldehyde is lower and has substantially higher removal rate (Figure 7b). Concentrations of glyoxylic acid and oxalic acid continue to decline after reaching their maximum. At the same time, concentrations of glyoxylic and oxalic acids at their highest value are 0.84 and 0.90 mM, respectively. This is significantly higher than in the case of H2O2/UV-C system (0.56 mM for glyoxylic acid and 0.19 mM for oxalic acid) that indicates a higher rate of EG oxidation via C2-pathway under air purging.
To determine the difference in efficiency of H2O2 utilization, concentration of hydrogen peroxide was monitored during the reaction. It was found that kinetic plots of H2O2 substantially differ in the experiments with and without air purging (Figure 7d). In the H2O2/UV-C system, H2O2 kinetic plot corresponds to the kinetics of a first-order reaction, whereas H2O2 concentration decreases slower in the presence of air purging, and its kinetic plot has another form. This fact indicates that O2 plays the role of an oxidant, reducing the amount of hydrogen peroxide required for the complete mineralization of EG. According to Vel Leitner and Dorè [50], process of glycolic acid oxidation to oxalic acid in the H2O2/UV-C system can be boosted by addition of oxygen, which reacts with organic radicals. This leads to faster oxidation of glycol aldehyde to oxalic acid via C2-pathway in the H2O2 + air/UV-C system. Similarly, it can be proposed that the process of ethylene glycol oxidation to glyoxal is also affected by oxygen (see Figure S4), thus resulting in higher concentration of formic acid at initial period of irradiation via C-C bond cleavage pathway. On the other hand, rate of formic acid oxidation in the H2O2/UV-C system can be suppressed by oxygen, as shown by Aristova et al. [52]. Oxidation of formic acid is the last step in EG degradation via C-C cleavage pathway, thus TOC removal in the H2O2 + air/UV-C system can be limited by oxidation of formic acid, despite of enhanced oxidation of other organic intermediates. After substantial decrease in the concentration of formic acid, oxidation of C2-acids becomes the second limiting factor in the process of EG mineralization.
Furthermore, different photochemical reactions, such as polymerization, condensation, and esterification, can lead to the formation of difficult-to-oxidize compounds (C3 and C4 organic molecules, for instance, malonic and succinic acids) [51,53,54]. These compounds can prevent fast removal of TOC and reduce efficiency of H2O2 utilization. An acceleration of oxidation process due to increased concentration of oxygen dissolved in the reaction solution may help to reduce the contribution of photochemical reactions mentioned above, because oxygen reacts with intermediate organic radicals.
3. Materials and Methods
Ethylene glycol (EG) of analytical grade from Reachim (Moscow, Russia) was mixed with deionized water (18.2 MΩ cm) to prepare model reaction solutions with EG concentration of 500 mg L–1. The experiments on EG degradation were performed using these solutions in addition of hydrogen peroxide as an oxidizing agent. Molar ratio between EG and H2O2 was varied in a wide range from 1:0 to 1:100. Commercially available 30% H2O2 solution of laboratory grade (Lega, Moscow, Russia) was titrated with the standardized solution of KMnO4 to determine the exact concentration of H2O2, then a certain aliquot of H2O2 was added to the reaction mixture to achieve the required molar ratio toward EG.
Kinetic experiments of EG degradation using H2O2 under activation with UV-C light were carried out in a 1.5 L glass vessel with inner quartz tube (Figure 8a). A GPH212T5VH/4 germicidal lamp (Heraeus Group, Hanau, Germany) with an electrical power of 10 W was used as a source of UV-C light. Figure 8b shows the emission spectrum of used lamp, which was measured outside the quartz tube using an ILT950 spectroradiometer (International Light Technology, USA). In is important to note that the 185 nm line is not represented in the spectrum shown in Figure 8b due to technical limitations of used spectroradiometer, but according to the manufacturer data its intensity is 5–6 times lower than that of the 254 nm line. In routine experiments, 1 L of EG solution with added H2O2 was put in the reaction vessel and magnetically stirred for 5 min before turning UV-C source on. The moment of UV-C light on was considered as the start of reaction. Blank experiments without H2O2 or UV-C light were also performed to illustrate the synergistic effect of both factors. In several experiments focused on the effect of oxidizing agents, the reaction mixture was continuously purged with oxygen or air at a controlled flow rate of 200–1000 cm3 min–1.
EG degradation was studied by monitoring a combination of parameters, namely total organic carbon (TOC) and chemical oxygen demand (COD), in probes sampled from the reaction mixture periodically during the experiment. The total content of organic carbon was measured using a TOC N/C multi 3100 total organic carbon analyzer (Analytik Jena GmbH, Jena, Germany). In routine measurement, 10 mL of sampled reaction mixture was pre-acidified with 100 μL of 2 M HCl (Reachim, Moscow, Russia), placed in autosampler of TOC N/C multi 3100 analyzer and purged with oxygen under stirring to remove dissolved CO2. After that, three aliquots of 500 μL were taken automatically to measure an averaged value of TOC (mg L–1). COD (mg L–1) was measured according to the ISO 6060:1989 standard [55] but special pretreatment was performed to eliminate the adverse effect of H2O2. 10 mL of sampled reaction mixture was mixed with 100 mg of MnO2 (Reachim, Moscow, Russia) and magnetically stirred overnight. Then, the mixture was filtrated using 0.22 μm PTFE membrane. Complete removal of H2O2 was confirmed by measurement of H2O2 concentration using colorimetric enzymatic method, also known as the Trinder method. 1 mL of commercial GOD-PAP glucose oxidase enzymatic reagent (Vector Best, Novosibirsk, Russia) and 2 mL of phosphate buffer with pH of 7.0 were added to 1 mL of sampled reaction mixture followed by storing at 37 °C for 10 min. In the presence of H2O2, horseradish peroxidase-assisted cooxidation of phenol and 4-aminoantipiryne by H2O2 leads to the formation of quinoneimine dye, which can be identified optically with a maximum absorbance at 510 nm. No H2O2 was detected in the solutions after the proposed pretreatment that allowed correct measurement of COD. In routine procedure of COD measurement, 2 mL of pretreated reaction medium was mixed with 0.5 mL of 0.5 M K2Cr2O7 solution in deionized water and 2.5 mL of 0.04 M Ag2SO4 in sulfuric acid (Reachim, Moscow, Russia). The mixture was heated under reflux in a sand bath at 150 °C for 2 h. After heating, solution was cooled down naturally and transferred to a quartz cuvette with optical path length of 1 cm. Absorption spectra were recorded on a Cary 300 spectrophotometer (Agilent, Santa Clara, CA, USA) using similar solution with deionized water as a reference. The absorbance at 600 nm attributed to light absorption by Cr3+ ions was used for determination of COD value based on calibration plot performed using potassium hydrogen phthalate (Sigma-Aldrich, St. Louis, MA, USA). It is worth noting that COD values measured for the samples pretreated with MnO2 to remove residue of H2O2 well corresponded to the theoretical value regardless of the amount of added H2O2 in whole studied range (Figure 9).
Concentrations of EG and main oxidation intermediates were analyzed using high-performance liquid chromatography (HPLC) on an Acquity H-Class system (Waters Corporation, Milford, MA, USA) equipped with reflective index detector (RID) and photodiode array detector (PDA). HPLC system was also equipped with an ion-exclusion Repromer H column of 250×4.6 mm filled with polymeric sorbent granules of 9 μm (Dr. Maisch HPLC GmbH, Ammerbuch, Germany). 5 mM solution of sulfuric acid in deionized water was used as eluent, which pumped at flow rate of 0.5 cm3 min–1. RID and PDA detectors were connected sequentially, and PDA wavelength was set at 210 nm. Temperature of RID cell and column thermostat were set at 50 °C, whereas autosampler temperature was maintained at 25 °C. Sample volume was 10 μL. RID and PDA signals were analyzed using Empower 3 software (Waters Corporation). Retention times of degradation products and examples of experimental chromatograms can be found in the Supporting Information (Figure S2, Table S1).
4. Conclusions
In this study, the kinetic aspects of ethylene glycol degradation in aqueous solution upon addition of hydrogen peroxide are investigated under irradiation with UV-C light. The highest TOC removal rate (56 mg L–1 h–1) in the H2O2/UV-C system is observed at EG:H2O2 molar ratios of 1:10 and 1:15 that corresponds to the two- and three-fold molar excess of H2O2 toward the stoichiometric value, respectively. Further boost of TOC removal rate is achieved by purging the reaction solution with oxygen or air. Simultaneous action of UV-activated H2O2 and O2 leads to a synergistic effect in enhancement of EG mineralization, especially at low EG:H2O2 molar ratio. TOC removal rate in the H2O2 + O2/UV-C system is up to 2 times higher compared to the experiments without oxygen (i.e., H2O2/UV-C).
Two main pathways of EG mineralization are proposed based on the results of HPLC analysis. The first one leads to the formation of formic acid via C-C bond cleavage as main oxidation product and plays a crucial role in EG oxidation in initial period of irradiation. The second is a pathway of sequential oxidation of EG to oxalic acid. This pathway dominates at low concentrations of H2O2. An increase in the concentration of dissolved oxygen leads to an increase in the oxidation rate via both proposed pathways. Oxygen acts as an oxidant, thus reducing the amount of hydrogen peroxide required for the complete mineralization of EG. Kinetic aspects disclosed in this study reveal the importance of combination of many components in AOPs to reduce required amounts of valuable oxidants, accelerate the mineralization process, and reduce operating costs by achieving synergistic effects.
Supplementary Materials
The following supporting information can be downloaded at: www.mdpi.com/xxx/s1, Figure S1: change in the temperature of reaction solution under different conditions; Figure S2: experimental HPLC chromatograms of the reaction solution recorded using (a) photodiode array (PDA) and (b) refractive index detector (RID); Figure S3: kinetic plot of EG removal and its linearization using corresponding coordinates; Figure S4: proposed mechanism of oxidation though C-C cleavage pathway boosted by oxygen; Table S1: retention times of organic compounds detected in the reaction solution using HPCL.
Author Contributions
Conceptualization, D.K. and D.S.; methodology, M.L., D.K. and D.S.; validation, M.L., D.K. and D.S.; investigation, T.F. and M.L.; resources, D.K.; data curation, T.F. and M.L.; writing—original draft preparation, T.F. and M.L.; writing—review and editing, D.S.; visualization, T.F. and M.L.; project administration, D.K. All authors have read and agreed to the published version of the manuscript.
Funding
This research was funded by the grant of the Ministry of Science and Higher Education of the Russian Federation for large scientific projects in priority areas of scientific and technological development (No. 075-15-2024-646).
Institutional Review Board Statement
Not applicable.
Informed Consent Statement
Not applicable.
Data Availability Statement
Data is contained within the article or Supplementary Materials.
Acknowledgments
The authors acknowledge Dr. Nikolay Gromov and Alina Okhina for helping in analysis of degradation products using HPLC.
Conflicts of Interest
The authors declare no conflicts of interest.
References
- World Air Passenger Traffic Evolution, 1980-2020 – Charts – Data & Statistics Available online:. Available online: https://www.iea.org/data-and-statistics/charts/world-air-passenger-traffic-evolution-1980-2020 (accessed on 27 September 2024).
- Sulej, A.M.; Polkowska, Ż.; Namieśnik, J. Analysis of Airport Runoff Waters. Critical Reviews in Analytical Chemistry 2011, 41, 190–213. [Google Scholar] [CrossRef]
- Shi, X.; Quilty, S.M.; Long, T.; Jayakaran, A.; Fay, L.; Xu, G. Managing Airport Stormwater Containing Deicers: Challenges and Opportunities. Front. Struct. Civ. Eng. 2017, 11, 35–46. [Google Scholar] [CrossRef]
- AMS1424S: Fluid, Aircraft Deicing/Anti-Icing, SAE Type I 2023.
- AMS1428L: Fluid, Aircraft Deicing/Anti-Icing, Non-Newtonian (Pseudoplastic), SAE Types II, III, and IV 2023.
- Environmental Impact and Benefit Assessment for the Final Effluent Limitation Guidelines and Standards for the Airport Deicing Category. U.S. Environmental Protection Agency 2012.
- Johnson, E.P. Aircraft De-Icer: Recycling Can Cut Carbon Emissions in Half. Environmental Impact Assessment Review 2012, 32, 156–164. [Google Scholar] [CrossRef]
- Barash, S.; Covington, J.; Tamulonis, C. Preliminary Data Summary Airport Deicing Operations (Revised). United States Environmental Protection Agency, Washington.
- Staples, C.A.; Williams, J.B.; Craig, G.R.; Roberts, K.M. Fate, Effects and Potential Environmental Risks of Ethylene Glycol: A Review. Chemosphere 2001, 43, 377–383. [Google Scholar] [CrossRef]
- Hartwell, S.I.; Jordahl, D.M.; Evans, J.E.; May, E.B. Toxicity of Aircraft De-icer and Anti-icer Solutions to Aquatic Organisms. Environmental Toxicology and Chemistry 1995, 14, 1375–1386. [Google Scholar] [CrossRef]
- Hymel, M.K.; Baltz, D.M.; Chesney, E.J.; Tarr, M.A.; Kolok, A.S. Swimming Performance of Juvenile Florida Pompano Exposed to Ethylene Glycol. Transactions of the American Fisheries Society 2002, 131, 1152–1163. [Google Scholar] [CrossRef]
- Pillard, D.A. Comparative Toxicity of Formulated Glycol Deicers and Pure Ethylene and Propylene Glycol to Ceriodaphnia Dubia and Pimephales Promelas. Environmental Toxicology and Chemistry 1995, 14, 311–315. [Google Scholar] [CrossRef]
- Novak, L.J.; Holtze, K.; Kent, R.A.; Jefferson, C.; Anderson, D. Acute Toxicity of Storm Water Associated with De-icing/Anti-icing Activities at Canadian Airports. 2000, 19, 1846–1855. [CrossRef]
- Corsi, S.R.; Geis, S.W.; Loyo-Rosales, J.E.; Rice, C.P. Aquatic Toxicity of Nine Aircraft Deicer and Anti-Icer Formulations and Relative Toxicity of Additive Package Ingredients Alkylphenol Ethoxylates and 4,5-Methyl-1H-Benzotriazoles. Environ. Sci. Technol. 2006, 40, 7409–7415. [Google Scholar] [CrossRef]
- Pillard, D.A.; DuFresne, D.L. Toxicity of Formulated Glycol Deicers and Ethylene and Propylene Glycol to Lactuca Sativa, Lolium Perenne, Selenastrum Capricornutum, and Lemna Minor. Arch. Environ. Contam. Toxicol. 1999, 37, 29–35. [Google Scholar] [CrossRef]
- Exton, B.; Hassard, F.; Medina-Vaya, A.; Grabowski, R.C. Undesirable River Biofilms: The Composition, Environmental Drivers, and Occurrence of Sewage Fungus. Ecological Indicators 2024, 161, 111949. [Google Scholar] [CrossRef]
- Exton, B.; Hassard, F.; Medina Vaya, A.; Grabowski, R.C. Polybacterial Shift in Benthic River Biofilms Attributed to Organic Pollution – a Prospect of a New Biosentinel? Hydrology Research 2023, 54, 348–359. [Google Scholar] [CrossRef]
- Nott, M.A.; Driscoll, H.E.; Takeda, M.; Vangala, M.; Corsi, S.R.; Tighe, S.W. Advanced biofilm analysis in streams receiving organic deicer runoff. PLOS ONE 2020, 15, e0227567. [Google Scholar] [CrossRef] [PubMed]
- Fan, H.; Tarun, P.K.; Shih, D.T.; Kim, S.B.; Chen, V.C.P.; Rosenberger, J.M.; Bergman, D. Data Mining Modeling on the Environmental Impact of Airport Deicing Activities. Expert Systems with Applications 2011, 38, 14899–14906. [Google Scholar] [CrossRef]
- Kurowski, M. History, Processing, and Usage of Recycled Glycol for Aircraft Deicing and Anti-Icing. 2001.
- Stankevičienė, R.; Survilė, O.; Šaulys, V.; Bagdžiūnaitė-Litvinaitienė, L.; Litvinaitis, A. The Treatment and Handling Systems of de/Anti-Icing Contaminants Which Generated and Discharged into Surface Runoff from Airports Territories /. Journal of water security. 2019, 1–8. [Google Scholar] [CrossRef]
- Castro, S.; Davis, L.C.; Erickson, L.E. Natural, Cost-effective, and Sustainable Alternatives for Treatment of Aircraft Deicing Fluid Waste. Environ. Prog. 2005, 24, 26–33. [Google Scholar] [CrossRef]
- Vymazal, J. Constructed Wetlands for Wastewater Treatment: A Review. Proceedings of Taal 2007 2008, 965–980. [Google Scholar]
- Schoenberg, T.; Veltman, S.; Switzenbaum, M. Kinetics of Anaerobic Degradation of Glycol-Based Type I Aircraft Deicing Fluids. Biodegradation 2001, 12, 59–67. [Google Scholar] [CrossRef]
- Chauhan, N.L.; Dameera, V.; Chowdhury, A.; Juvekar, V.A.; Sarkar, A. Electrochemical Oxidation of Ethylene Glycol in a Channel Flow Reactor. Catalysis Today 2018, 309, 126–132. [Google Scholar] [CrossRef]
- Jardak, K.; Dirany, A.; Drogui, P.; El Khakani, M.A. Electrochemical Degradation of Ethylene Glycol in Antifreeze Liquids Using Boron Doped Diamond Anode. Separation and Purification Technology 2016, 168, 215–222. [Google Scholar] [CrossRef]
- Araña, J.; Ortega Méndez, J.A.; Herrera Melián, J.A.; Doña Rodríguez, J.M.; González Díaz, O.; Pérez Peña, J. Thermal Effect of Carboxylic Acids in the Degradation by Photo-Fenton of High Concentrations of Ethylene Glycol. Applied Catalysis B: Environmental 2012, 113–114, 107–115. [Google Scholar] [CrossRef]
- Turan-Ertas, T.; Gurol, M.D. Oxidation of Diethylene Glycol with Ozone and Modified Fenton Processes. Chemosphere 2002, 47, 293–301. [Google Scholar] [CrossRef] [PubMed]
- Dietrick McGinnis, B.; Dean Adams, V.; Joe Middlebrooks, E. Degradation of Ethylene Glycol Using Fenton’s Reagent and UV. Chemosphere 2001, 45, 101–108. [Google Scholar] [CrossRef]
- Klauson, D.; Preis, S. The Influence of Iron Ions on the Aqueous Photocatalytic Oxidation of Deicing Agents. International Journal of Photoenergy 2007. [Google Scholar] [CrossRef]
- Kim, K.N.; Hoffmann, M.R. Heterogeneous Photocatalytic Degradation of Ethylene Glycol and Propylene Glycol. Korean J. Chem. Eng. 2008, 25, 89–94. [Google Scholar] [CrossRef]
- Zimin, Yu.S.; Trukhanova, N.V.; Strel’tsova, I.V.; Komissarov, V.D. Kinetics of Polyol Oxidation by Ozone in Aqueous Solutions. Kinetics and Catalysis 2000, 41, 749–752. [Google Scholar] [CrossRef]
- Rafieyan, S.G.; Marahel, F.; Ghaedi, M.; Maleki, A. Degradation of Mono Ethylene Glycol Wastewater by Different Treatment Technologies for Reduction of COD Gas Refinery Effluent. International Journal of Environmental Analytical Chemistry 2024, 104, 1–20. [Google Scholar] [CrossRef]
- Priyadarshini, M.; Ahmad, A.; Das, I.; Ghangrekar, M.M.; Dutta, B.K. Efficacious Degradation of Ethylene Glycol by Ultraviolet Activated Persulphate: Reaction Kinetics, Transformation Mechanisms, Energy Demand, and Toxicity Assessment. Environ Sci Pollut Res 2023, 30, 85071–85086. [Google Scholar] [CrossRef]
- Rosario-Ortiz, F.L.; Wert, E.C.; Snyder, S.A. Evaluation of UV/H2O2 Treatment for the Oxidation of Pharmaceuticals in Wastewater. Water Research 2010, 44, 1440–1448. [Google Scholar] [CrossRef]
- Kwon, M.; Kim, S.; Yoon, Y.; Jung, Y.; Hwang, T.-M.; Lee, J.; Kang, J.-W. Comparative Evaluation of Ibuprofen Removal by UV/H2O2 and UV/S2O82− Processes for Wastewater Treatment. Chemical Engineering Journal 2015, 269, 379–390. [Google Scholar] [CrossRef]
- Armstrong, D.A.; Huie, R.E.; Koppenol, W.H.; Lymar, S.V.; Merényi, G.; Neta, P.; Ruscic, B.; Stanbury, D.M.; Steenken, S.; Wardman, P. Standard Electrode Potentials Involving Radicals in Aqueous Solution: Inorganic Radicals (IUPAC Technical Report). Pure and Applied Chemistry 2015, 87, 1139–1150. [Google Scholar] [CrossRef]
- Bendjelloul, R.; Bensmaili, A.; Berkani, M.; Aminabhavi, T.M.; Vasseghian, Y.; Appasamy, D.; Kadmi, Y. Efficient H2O2 -Sonochemical Treatment of Penicillin G in Water: Optimization, DI-HRMS Ultra-Trace by-Products Analysis, and Degradation Pathways. Process Safety and Environmental Protection 2024, 185, 1003–1011. [Google Scholar] [CrossRef]
- Khan, J.A.; He, X.; Shah, N.S.; Khan, H.M.; Hapeshi, E.; Fatta-Kassinos, D.; Dionysiou, D.D. Kinetic and Mechanism Investigation on the Photochemical Degradation of Atrazine with Activated H2O2, S2O82− and HSO5−. Chemical Engineering Journal 2014, 252, 393–403. [Google Scholar] [CrossRef]
- Bokare, A.D.; Choi, W. Review of Iron-Free Fenton-like Systems for Activating H2O2 in Advanced Oxidation Processes. Journal of Hazardous Materials 2014, 275, 121–135. [Google Scholar] [CrossRef]
- Mukherjee, J.; Lodh, B.K.; Sharma, R.; Mahata, N.; Shah, M.P.; Mandal, S.; Ghanta, S.; Bhunia, B. Advanced Oxidation Process for the Treatment of Industrial Wastewater: A Review on Strategies, Mechanisms, Bottlenecks and Prospects. Chemosphere 2023, 345, 140473. [Google Scholar] [CrossRef]
- Alberto, E.A.; Santos, G.M.; Marson, E.O.; Mbié, M.J.; Paniagua, C.E.S.; Ricardo, I.A.; Starling, M.C.V.M.; Pérez, J.A.S.; Trovó, A.G. Performance of Different Peroxide Sources and UV-C Radiation for the Degradation of Microcontaminants in Tertiary Effluent from a Municipal Wastewater Treatment Plant. Journal of Environmental Chemical Engineering 2023, 11, 110698. [Google Scholar] [CrossRef]
- Acharekar, M.A.; Kaplan, M.M. Ultraviolet Photo-Oxidation Of Ethylene Glycol Laser Coolant By Laser Flashlamp. OE 1982, 21, 1057–1060. [Google Scholar] [CrossRef]
- Rosenfeldt, E.J.; Linden, K.G.; Canonica, S.; von Gunten, U. Comparison of the Efficiency of OH Radical Formation during Ozonation and the Advanced Oxidation Processes O3/H2O2 and UV/H2O2. Water Research 2006, 40, 3695–3704. [Google Scholar] [CrossRef]
- Varank, G.; Can-Güven, E.; Yazici Guvenc, S.; Garazade, N.; Turk, O.K.; Demir, A.; Cakmakci, M. Oxidative Removal of Oxytetracycline by UV-C/Hydrogen Peroxide and UV-C/Peroxymonosulfate: Process Optimization, Kinetics, Influence of Co-Existing Ions, and Quenching Experiments. Journal of Water Process Engineering 2022, 50, 103327. [Google Scholar] [CrossRef]
- Dual Strategies to Enhance Mineralization Efficiency in Innovative Electrochemical Advanced Oxidation Processes Using Natural Air Diffusion Electrode: Improving Both H2O2 Production and Utilization Efficiency. Chemical Engineering Journal 2021, 413, 127564. [CrossRef]
- Zhang, Q.; Wang, L.; Chen, B.; Chen, Y.; Ma, J. Understanding and Modeling the Formation and Transformation of Hydrogen Peroxide in Water Irradiated by 254 Nm Ultraviolet (UV) and 185 Nm Vacuum UV (VUV): Effects of pH and Oxygen. Chemosphere 2020, 244, 125483. [Google Scholar] [CrossRef] [PubMed]
- Linde, H.J.V.D.; Sonntag, C. v. The U.V. Photolysis (λ = 185nm) of Ethylene Glycol in Aqueous Solution. Photochemistry and Photobiology 1971, 13, 147–155. [Google Scholar] [CrossRef]
- Vel Leitner, N.K.; Dore, M. Hydroxyl Radical Induced Decomposition of Aliphatic Acids in Oxygenated and Deoxygenated Aqueous Solutions. Journal of Photochemistry and Photobiology A: Chemistry 1996, 99, 137–143. [Google Scholar] [CrossRef]
- Vel Leitner, N.K.; Doré, M. Mecanisme d’action Des Radicaux OH Sur Les Acides Glycolique, Glyoxylique, Acetique et Oxalique En Solution Aqueuse: Incidence Sur La Consammation de Peroxyde d’hydrogene Dans Les Systemes H2O2/UV et O3/H2O2. Water Research 1997, 31, 1383–1397. [Google Scholar] [CrossRef]
- Carlton, A.G.; Turpin, B.J.; Altieri, K.E.; Seitzinger, S.; Reff, A.; Lim, H.-J.; Ervens, B. Atmospheric Oxalic Acid and SOA Production from Glyoxal: Results of Aqueous Photooxidation Experiments. Atmospheric Environment 2007, 41, 7588–7602. [Google Scholar] [CrossRef]
- Aristova, N.A.; Karpel Vel Leitner, N.; Piskarev, I.M. Degradation of Formic Acid in Different Oxidative Processes. High Energy Chemistry 2002, 36, 197–202. [Google Scholar] [CrossRef]
- Sui, X.; Zhou, Y.; Zhang, F.; Chen, J.; Zhu, Z.; Yu, X.-Y. Deciphering the Aqueous Chemistry of Glyoxal Oxidation with Hydrogen Peroxide Using Molecular Imaging. Phys. Chem. Chem. Phys. 2017, 19, 20357–20366. [Google Scholar] [CrossRef]
- Perri, M.J.; Seitzinger, S.; Turpin, B.J. Secondary Organic Aerosol Production from Aqueous Photooxidation of Glycolaldehyde: Laboratory Experiments. Atmospheric Environment 2009, 43, 1487–1497. [Google Scholar] [CrossRef]
- ISO 6060:1989 Water Quality - Determination of Chemical Oxygen Demand; 1989.
Figure 1.
TOC and COD kinetic plots in EG solution treated with (a) H2O2 (without irradiation) or (b) UV-C light (without addition of H2O2).
Figure 1.
TOC and COD kinetic plots in EG solution treated with (a) H2O2 (without irradiation) or (b) UV-C light (without addition of H2O2).
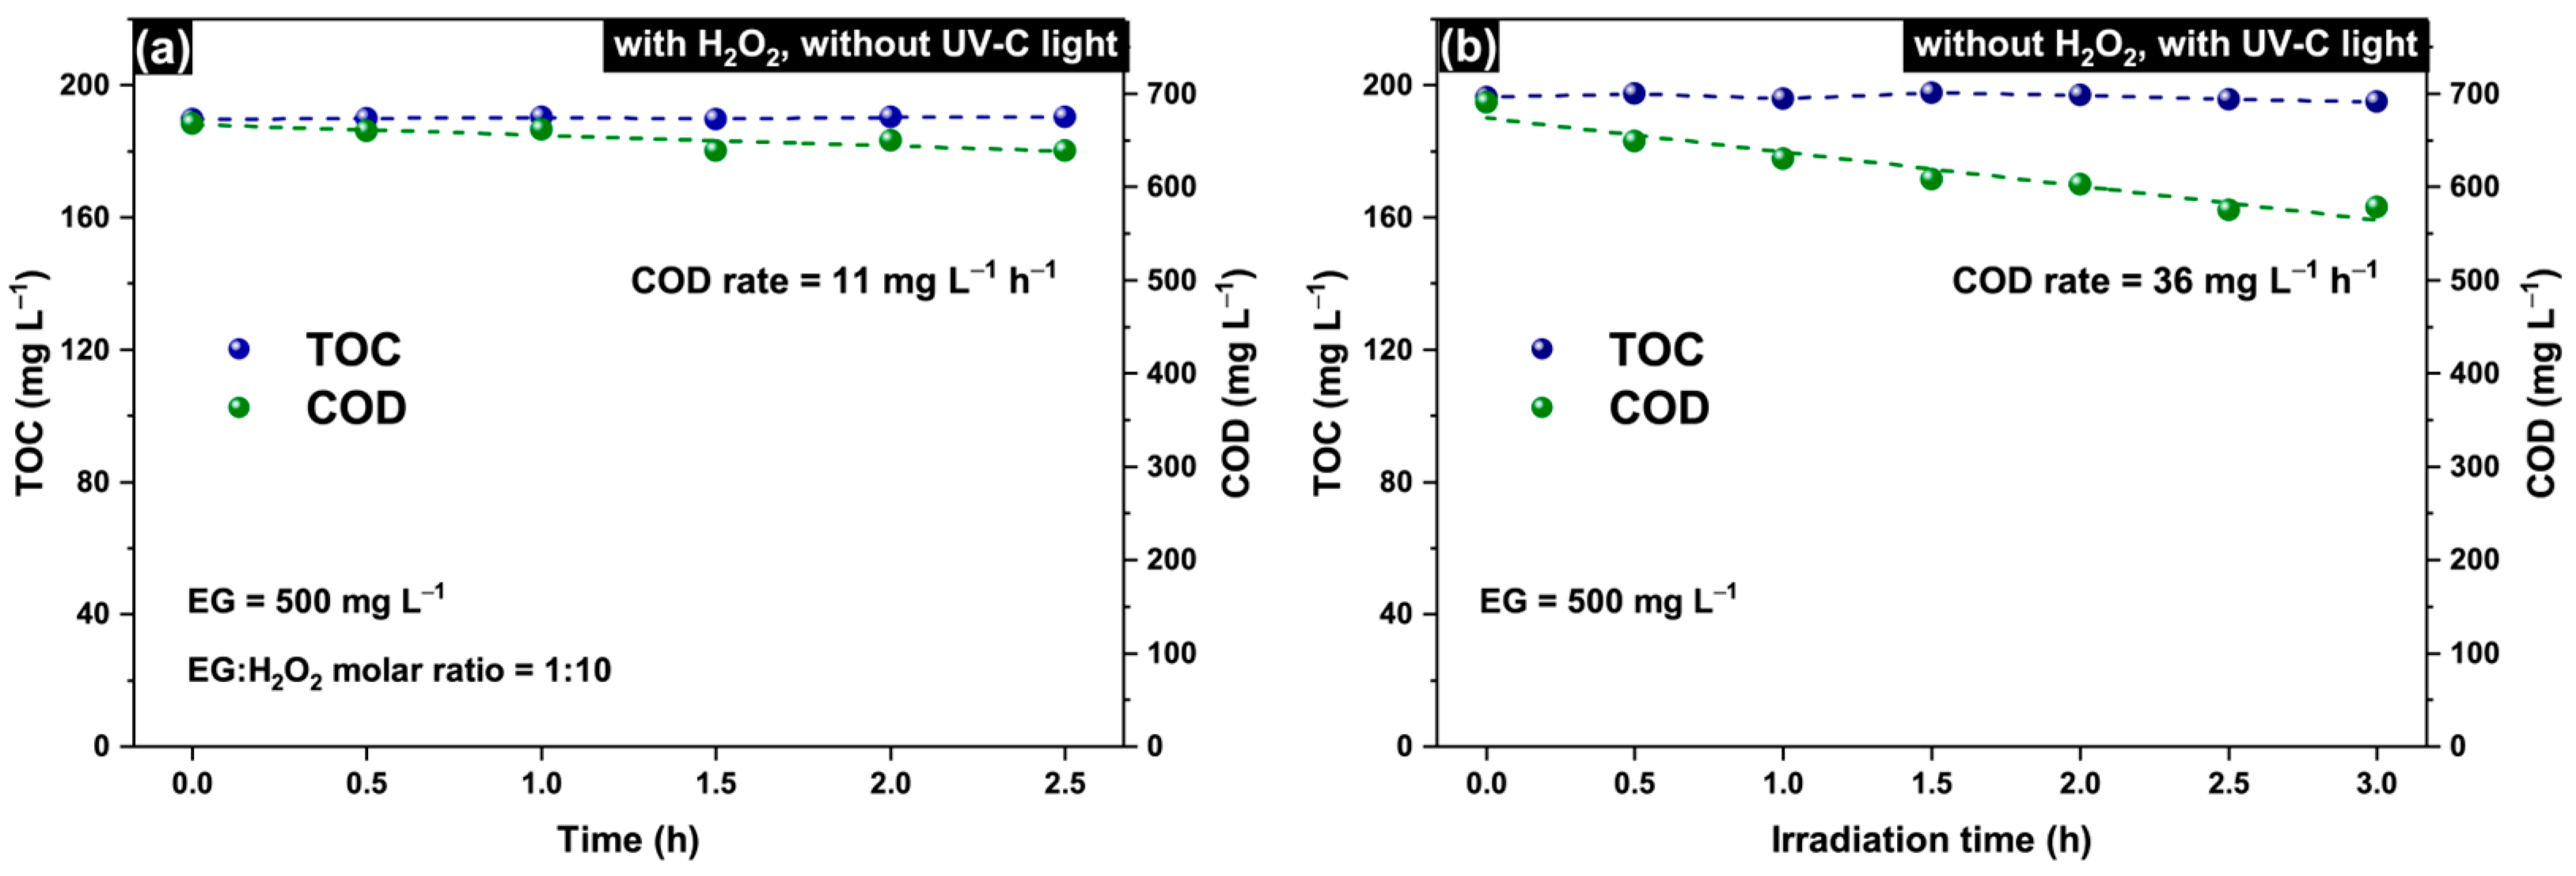
Figure 2.
(a) TOC and (b) COD kinetic plots during irradiation of EG solution (500 mg L–1) containing H2O2 (EG:H2O2 = 1:25) with UV-C light.
Figure 2.
(a) TOC and (b) COD kinetic plots during irradiation of EG solution (500 mg L–1) containing H2O2 (EG:H2O2 = 1:25) with UV-C light.
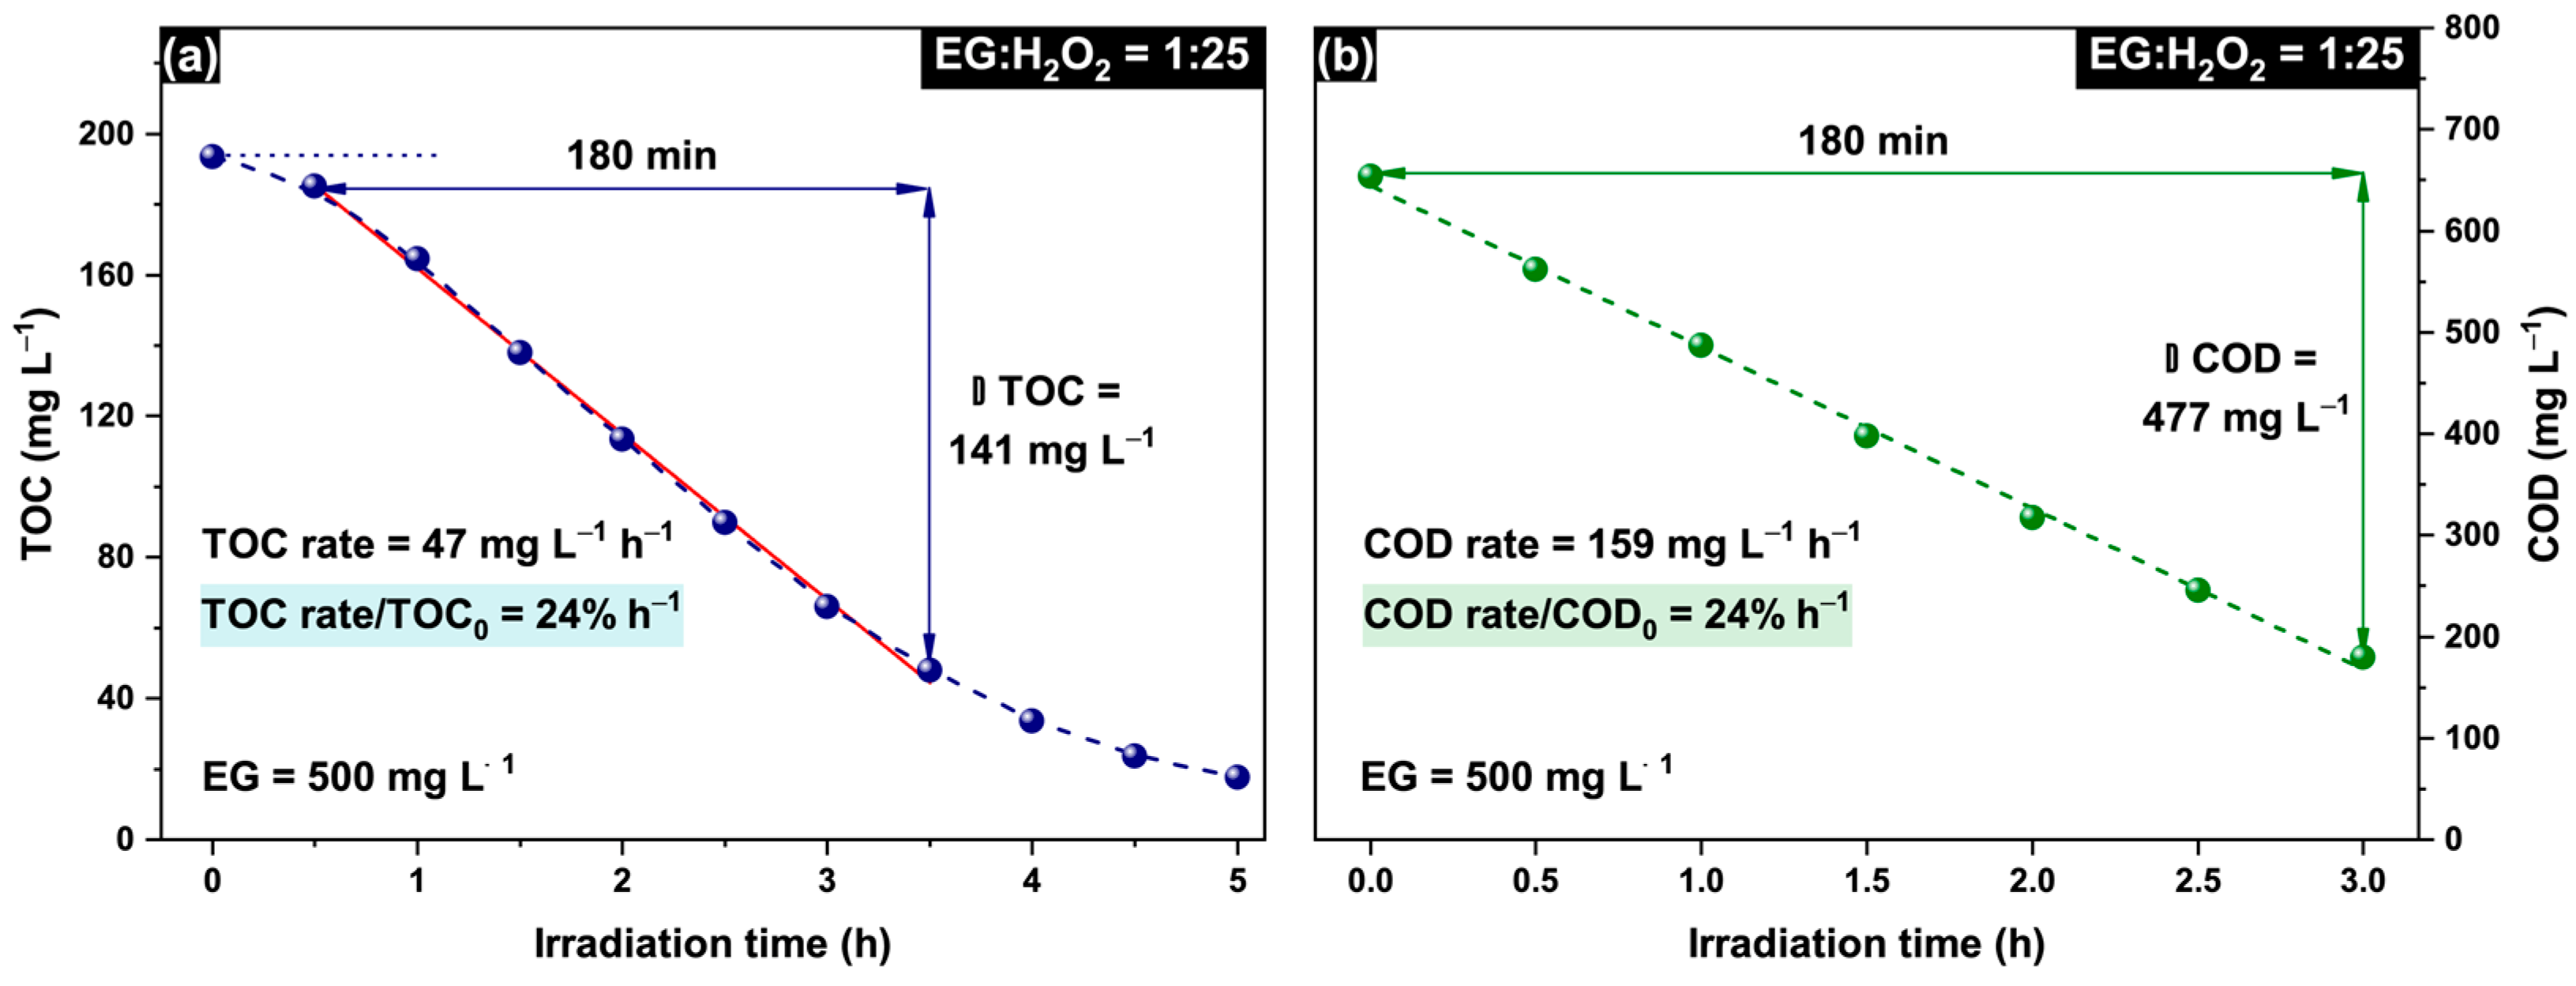
Figure 3.
Effect of EG:H2O2 molar ratio on TOC removal rate during EG degradation.
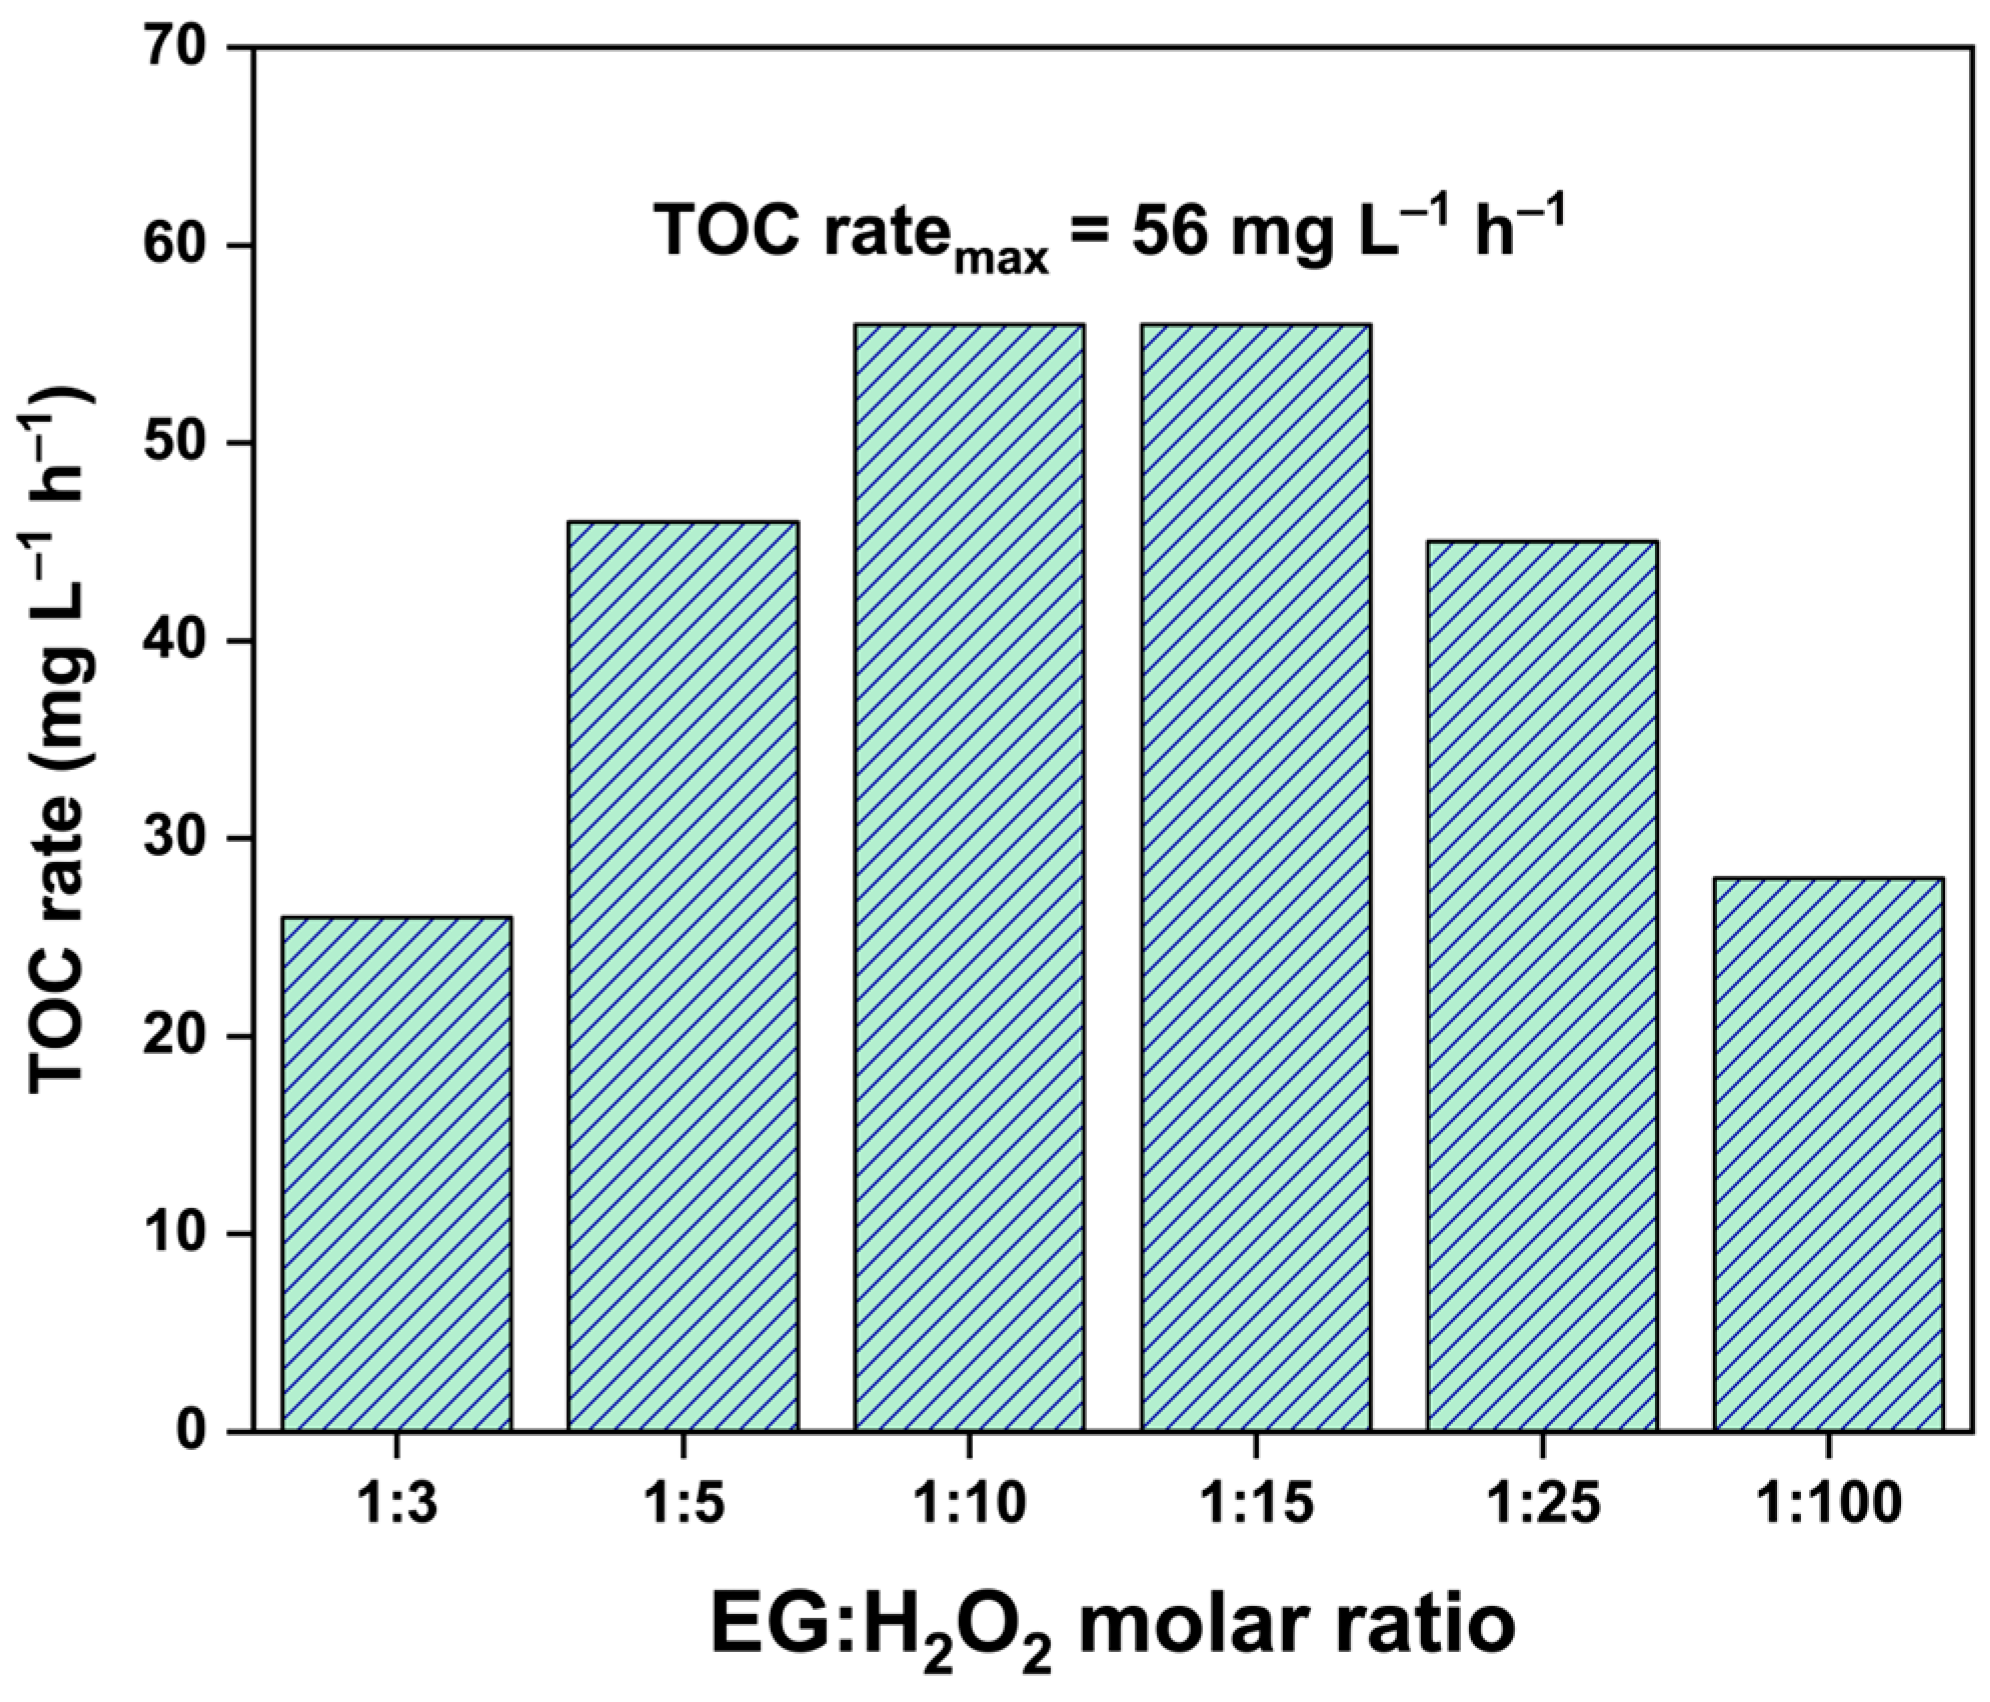
Figure 4.
Comparison of EG mineralization in the H2O2/UV-C and H2O2 + O2/UV-C systems during the experiments with EG:H2O2 molar ratio of (a) 1:5 and (b) 1:3.
Figure 4.
Comparison of EG mineralization in the H2O2/UV-C and H2O2 + O2/UV-C systems during the experiments with EG:H2O2 molar ratio of (a) 1:5 and (b) 1:3.
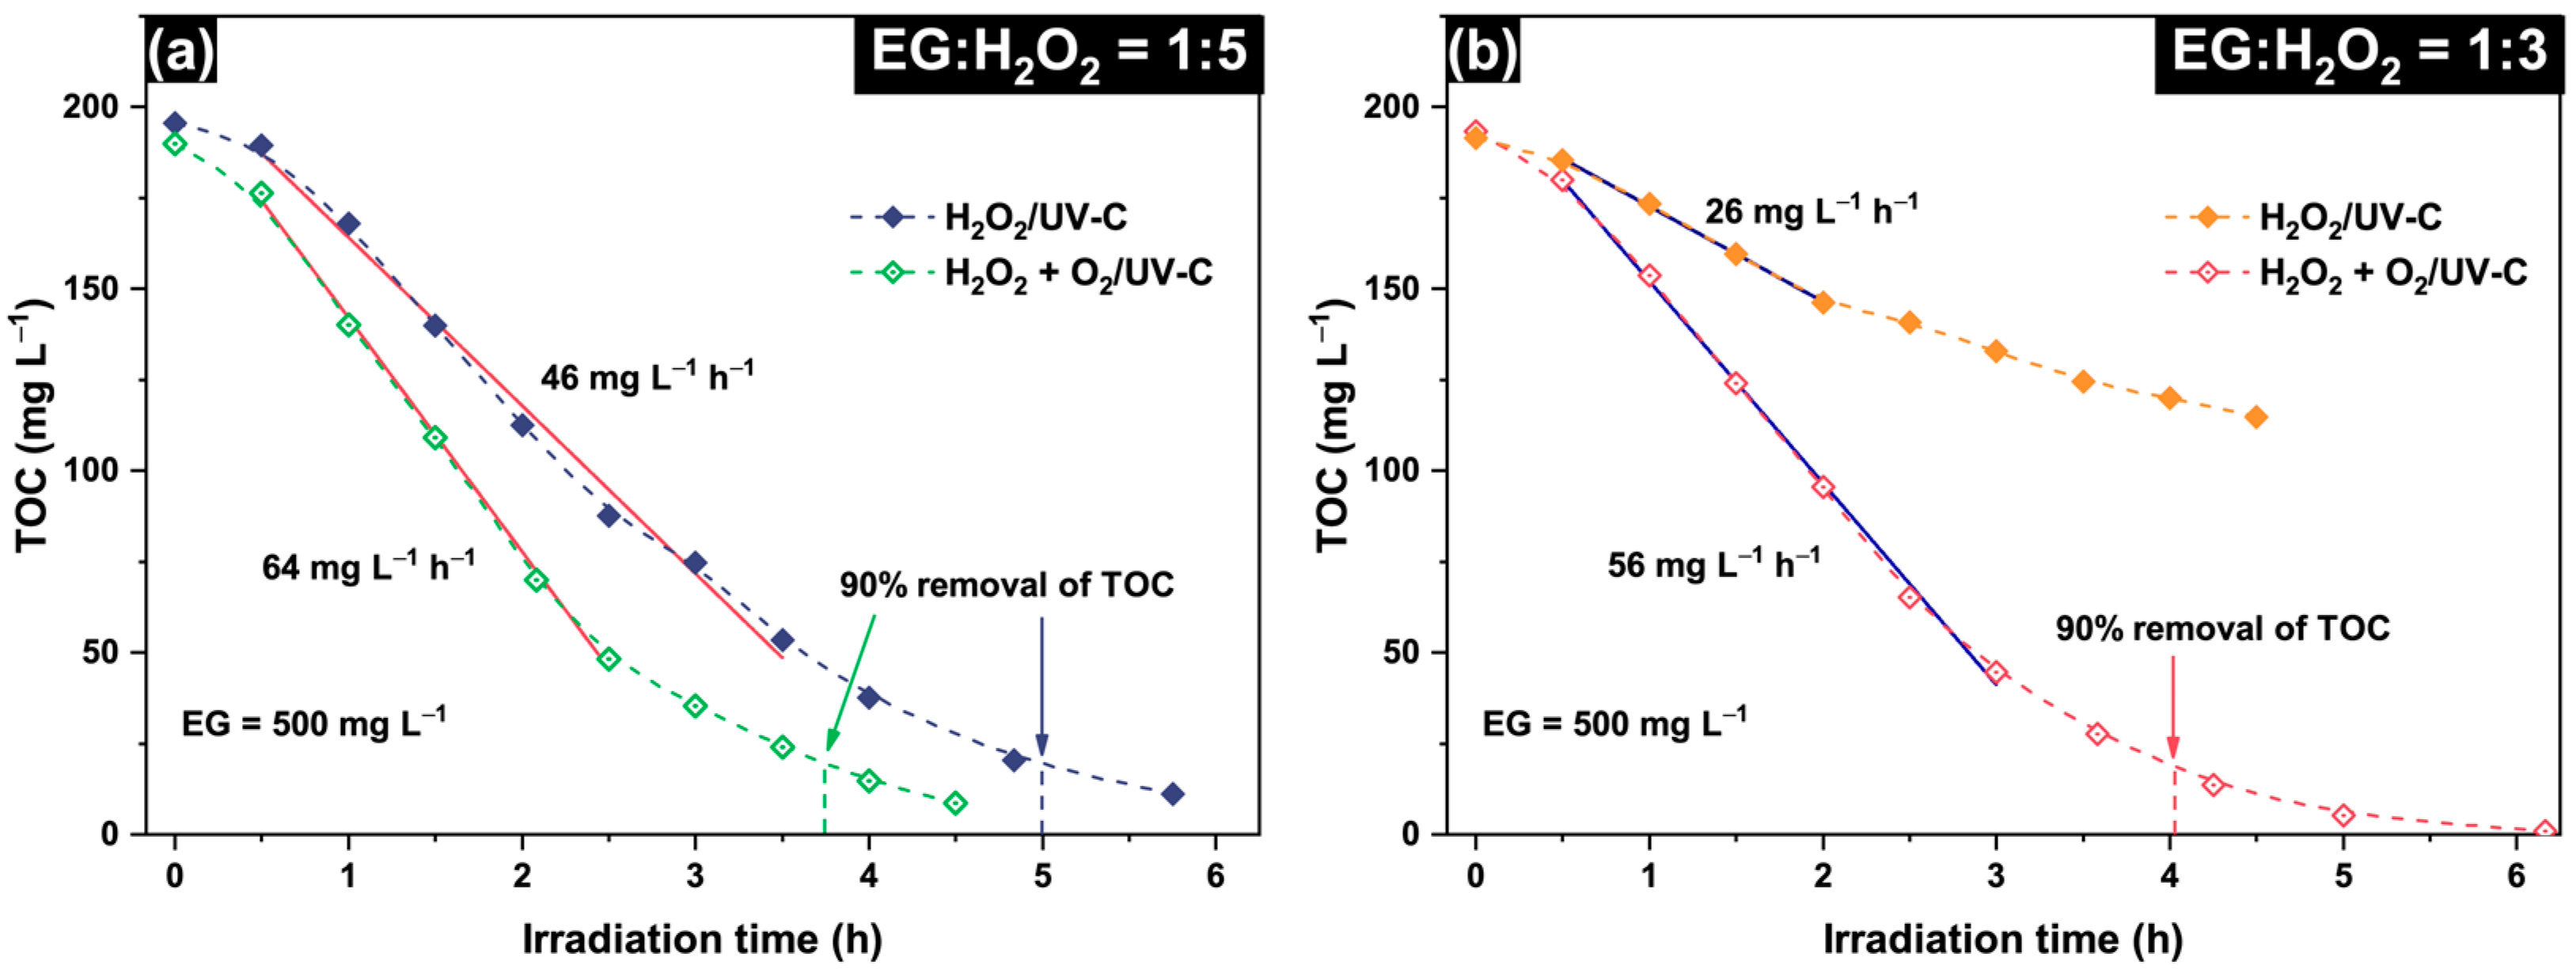
Figure 5.
Comparison of EG mineralization rate under different purging conditions.
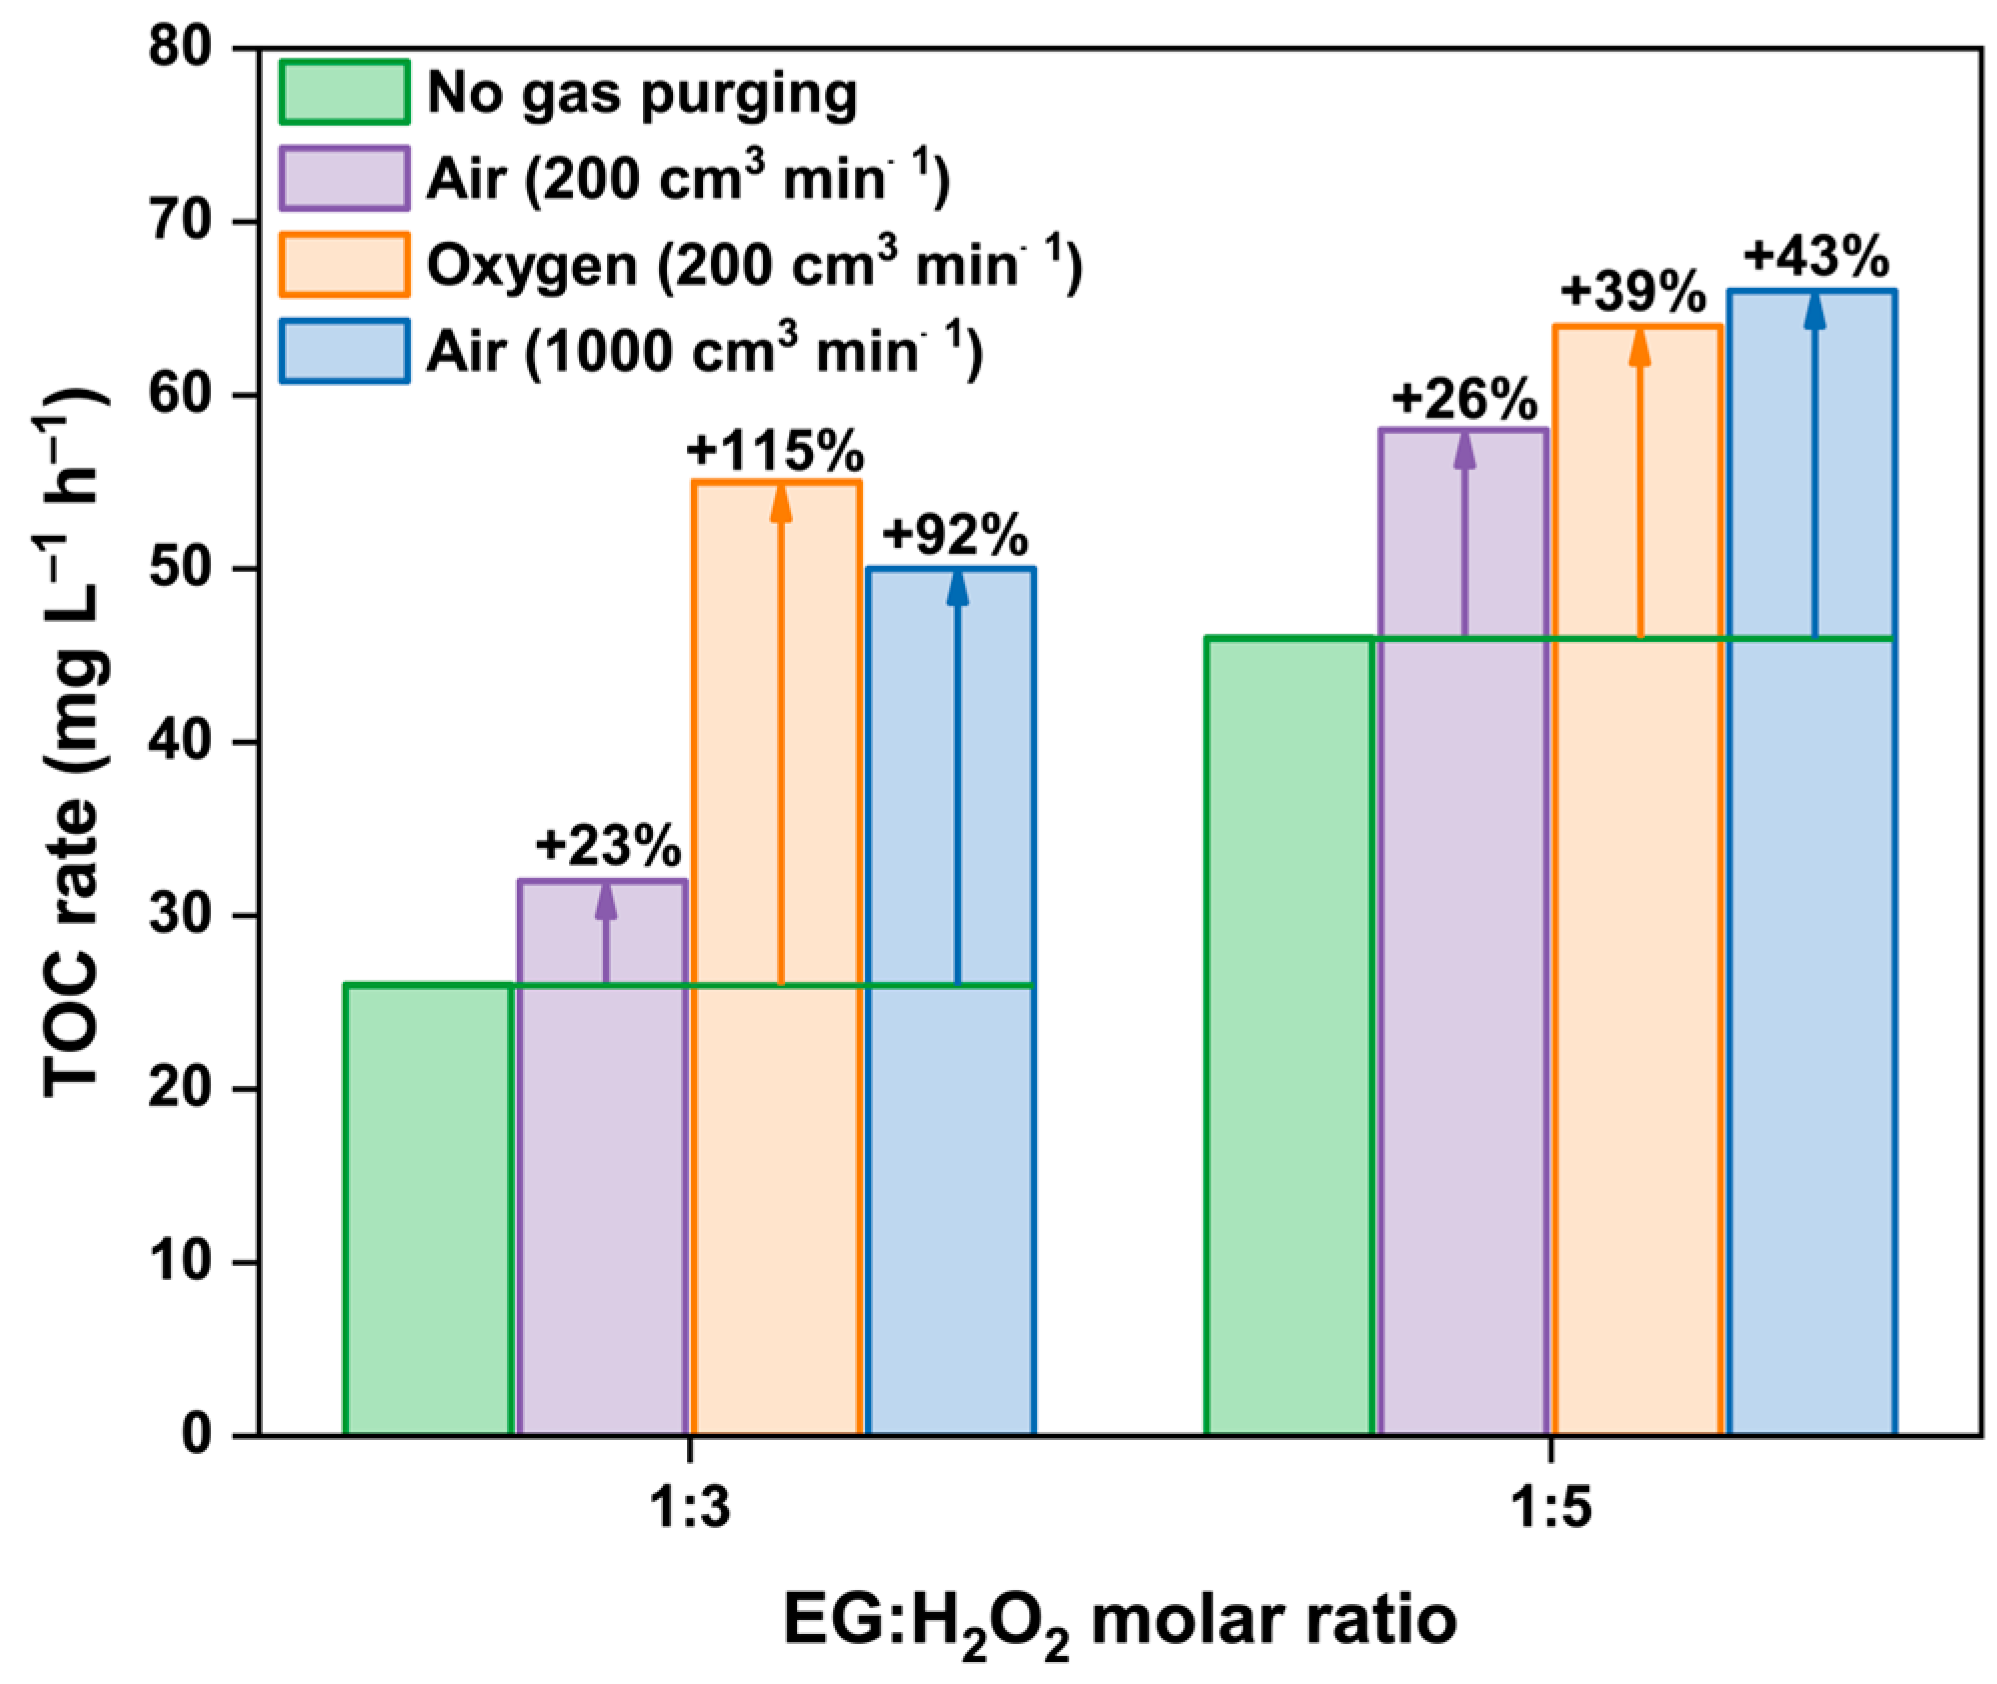
Figure 6.
Kinetic plots of (a) EG and formic acid, (b) aldehydes, and (c) C2-carboxylic acids during EG treatment in the H2O2/UV-C system (EG:H2O2 = 1:3); (d) main pathways of EG degradation.
Figure 6.
Kinetic plots of (a) EG and formic acid, (b) aldehydes, and (c) C2-carboxylic acids during EG treatment in the H2O2/UV-C system (EG:H2O2 = 1:3); (d) main pathways of EG degradation.
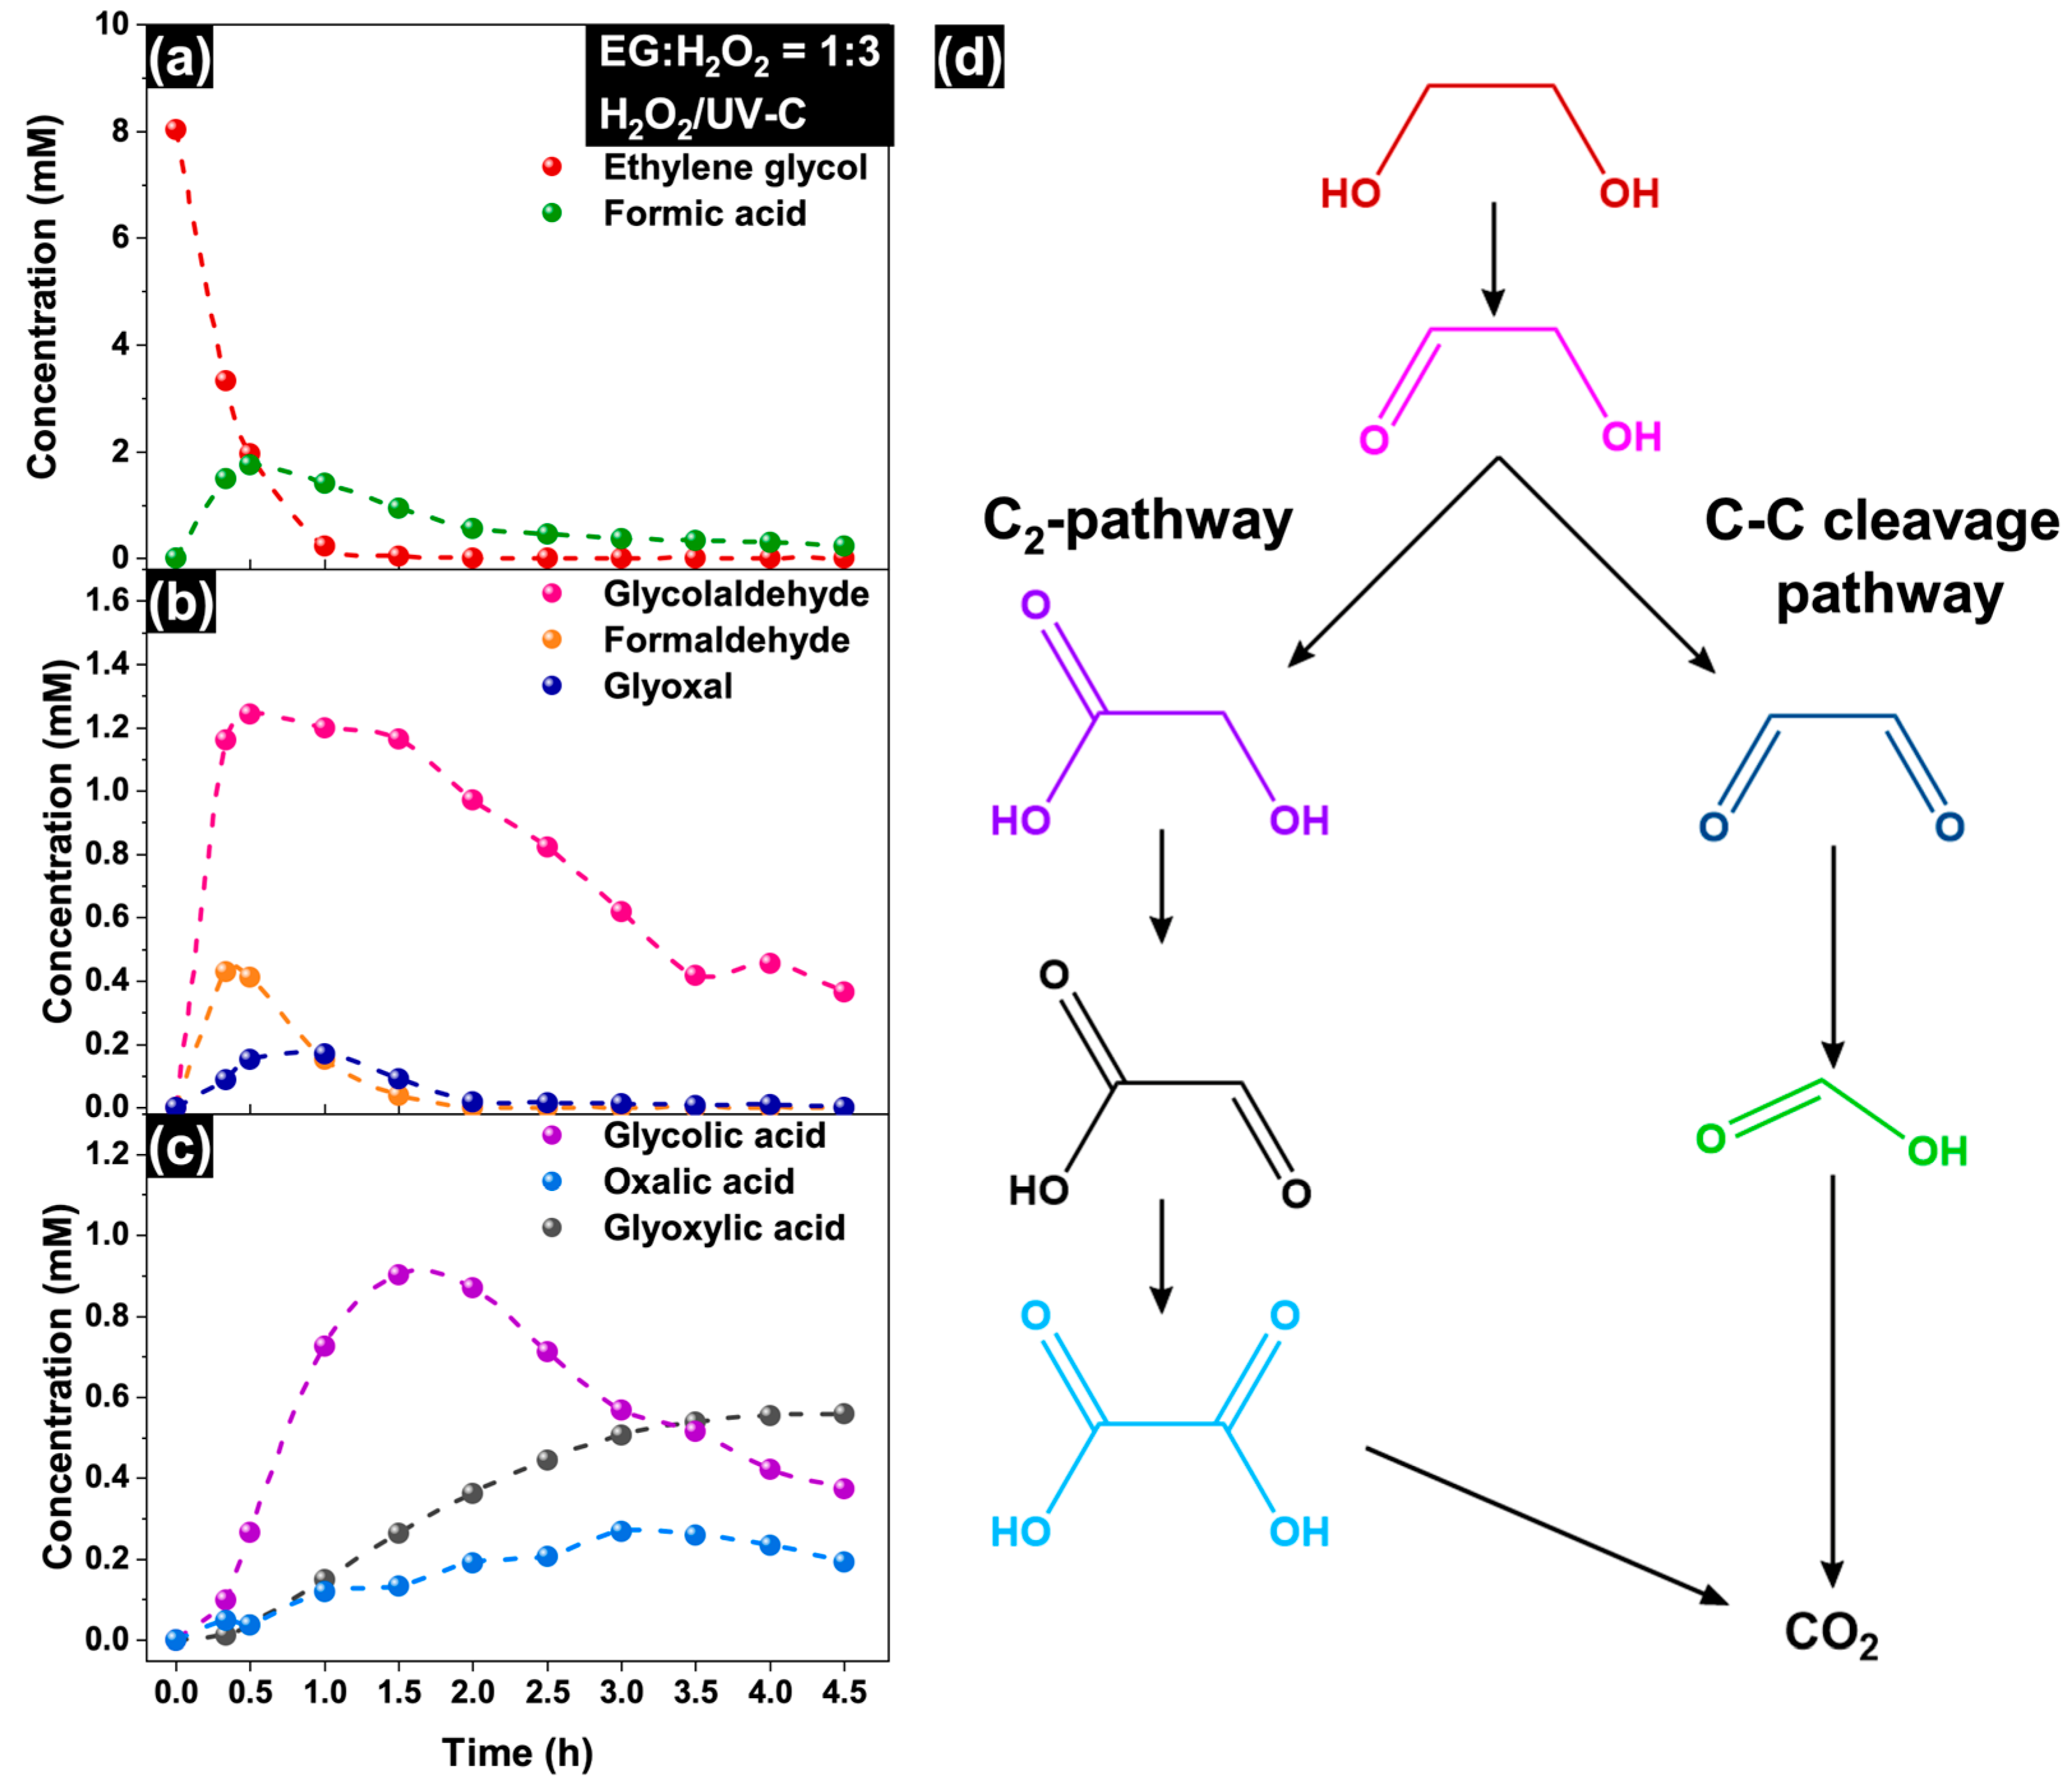
Figure 7.
Kinetic plots of (a) EG and formic acid, (b) aldehydes, and (c) C2-carboxylic acids during EG treatment in the H2O2 + air/UV-C system (EG:H2O2 = 1:3, air flow = 1000 cm3 min–1); (d) comparison of H2O2 kinetic plots in H2O2/UV-C and H2O2 + air/UV-C systems.
Figure 7.
Kinetic plots of (a) EG and formic acid, (b) aldehydes, and (c) C2-carboxylic acids during EG treatment in the H2O2 + air/UV-C system (EG:H2O2 = 1:3, air flow = 1000 cm3 min–1); (d) comparison of H2O2 kinetic plots in H2O2/UV-C and H2O2 + air/UV-C systems.
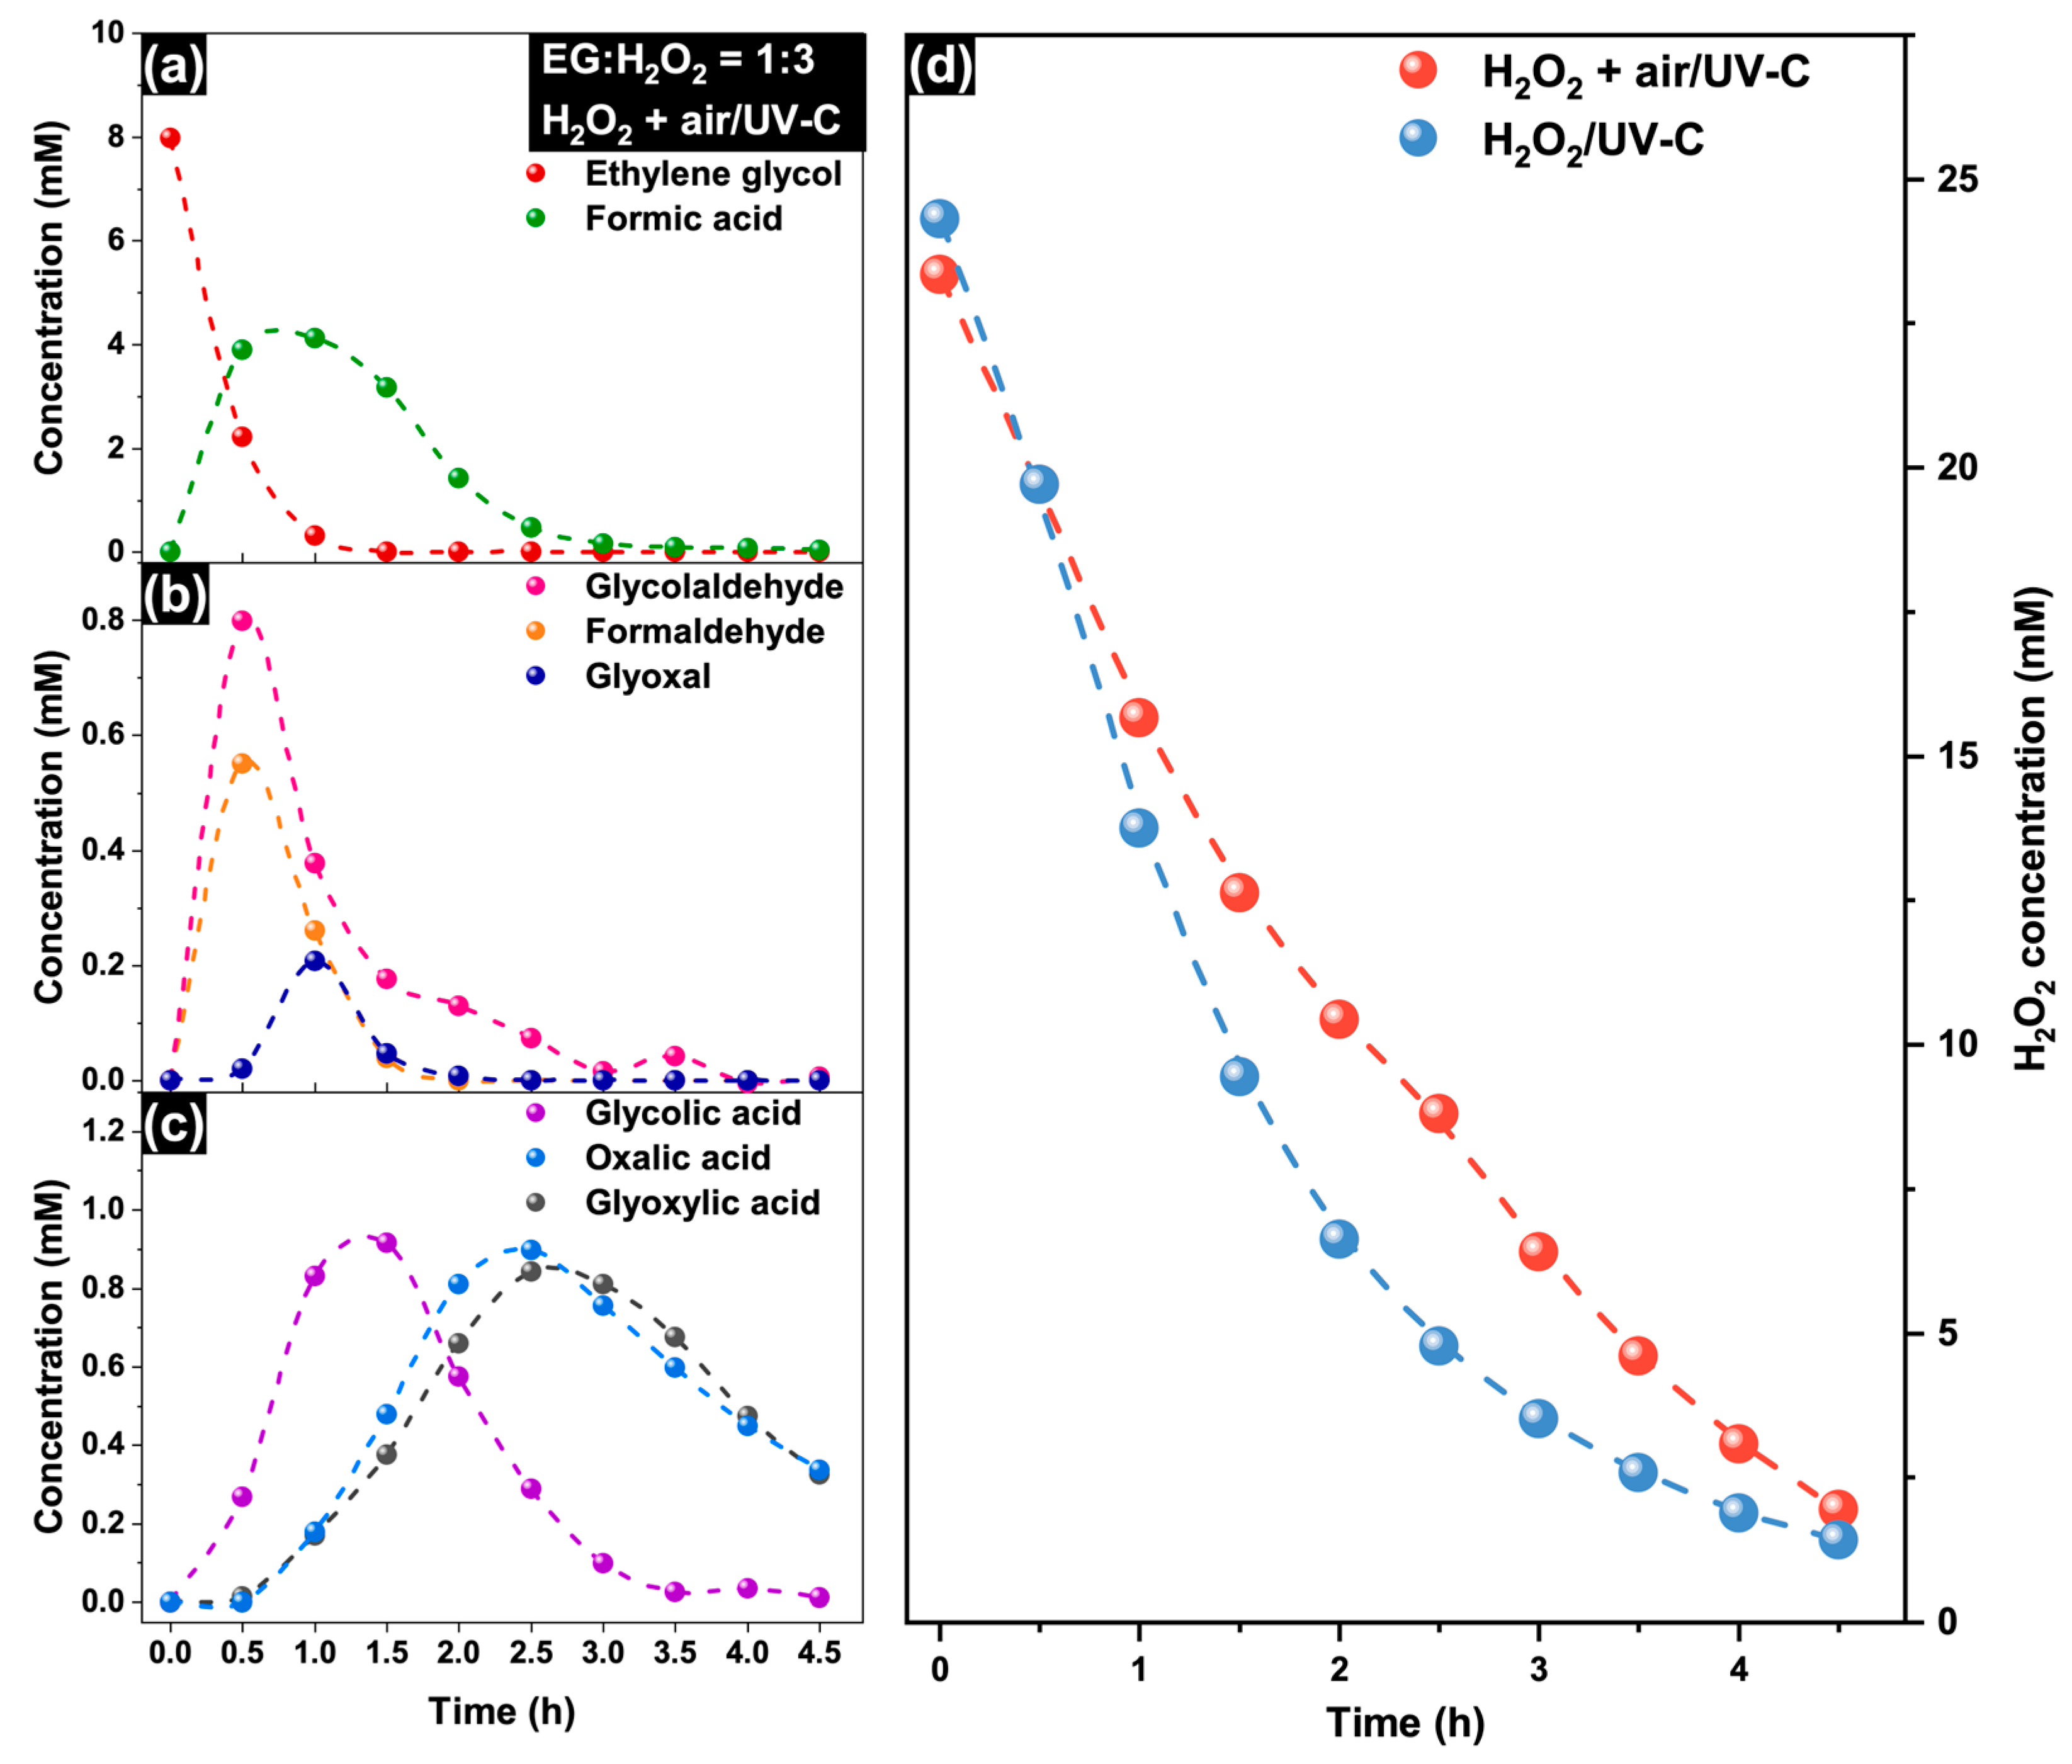
Figure 8.
(a) Scheme of reaction vessel; (b) emission spectrum of used germicidal UV-C lamp in the region of 200–700 nm (the inset shows photograph of lamp into the vessel).
Figure 8.
(a) Scheme of reaction vessel; (b) emission spectrum of used germicidal UV-C lamp in the region of 200–700 nm (the inset shows photograph of lamp into the vessel).
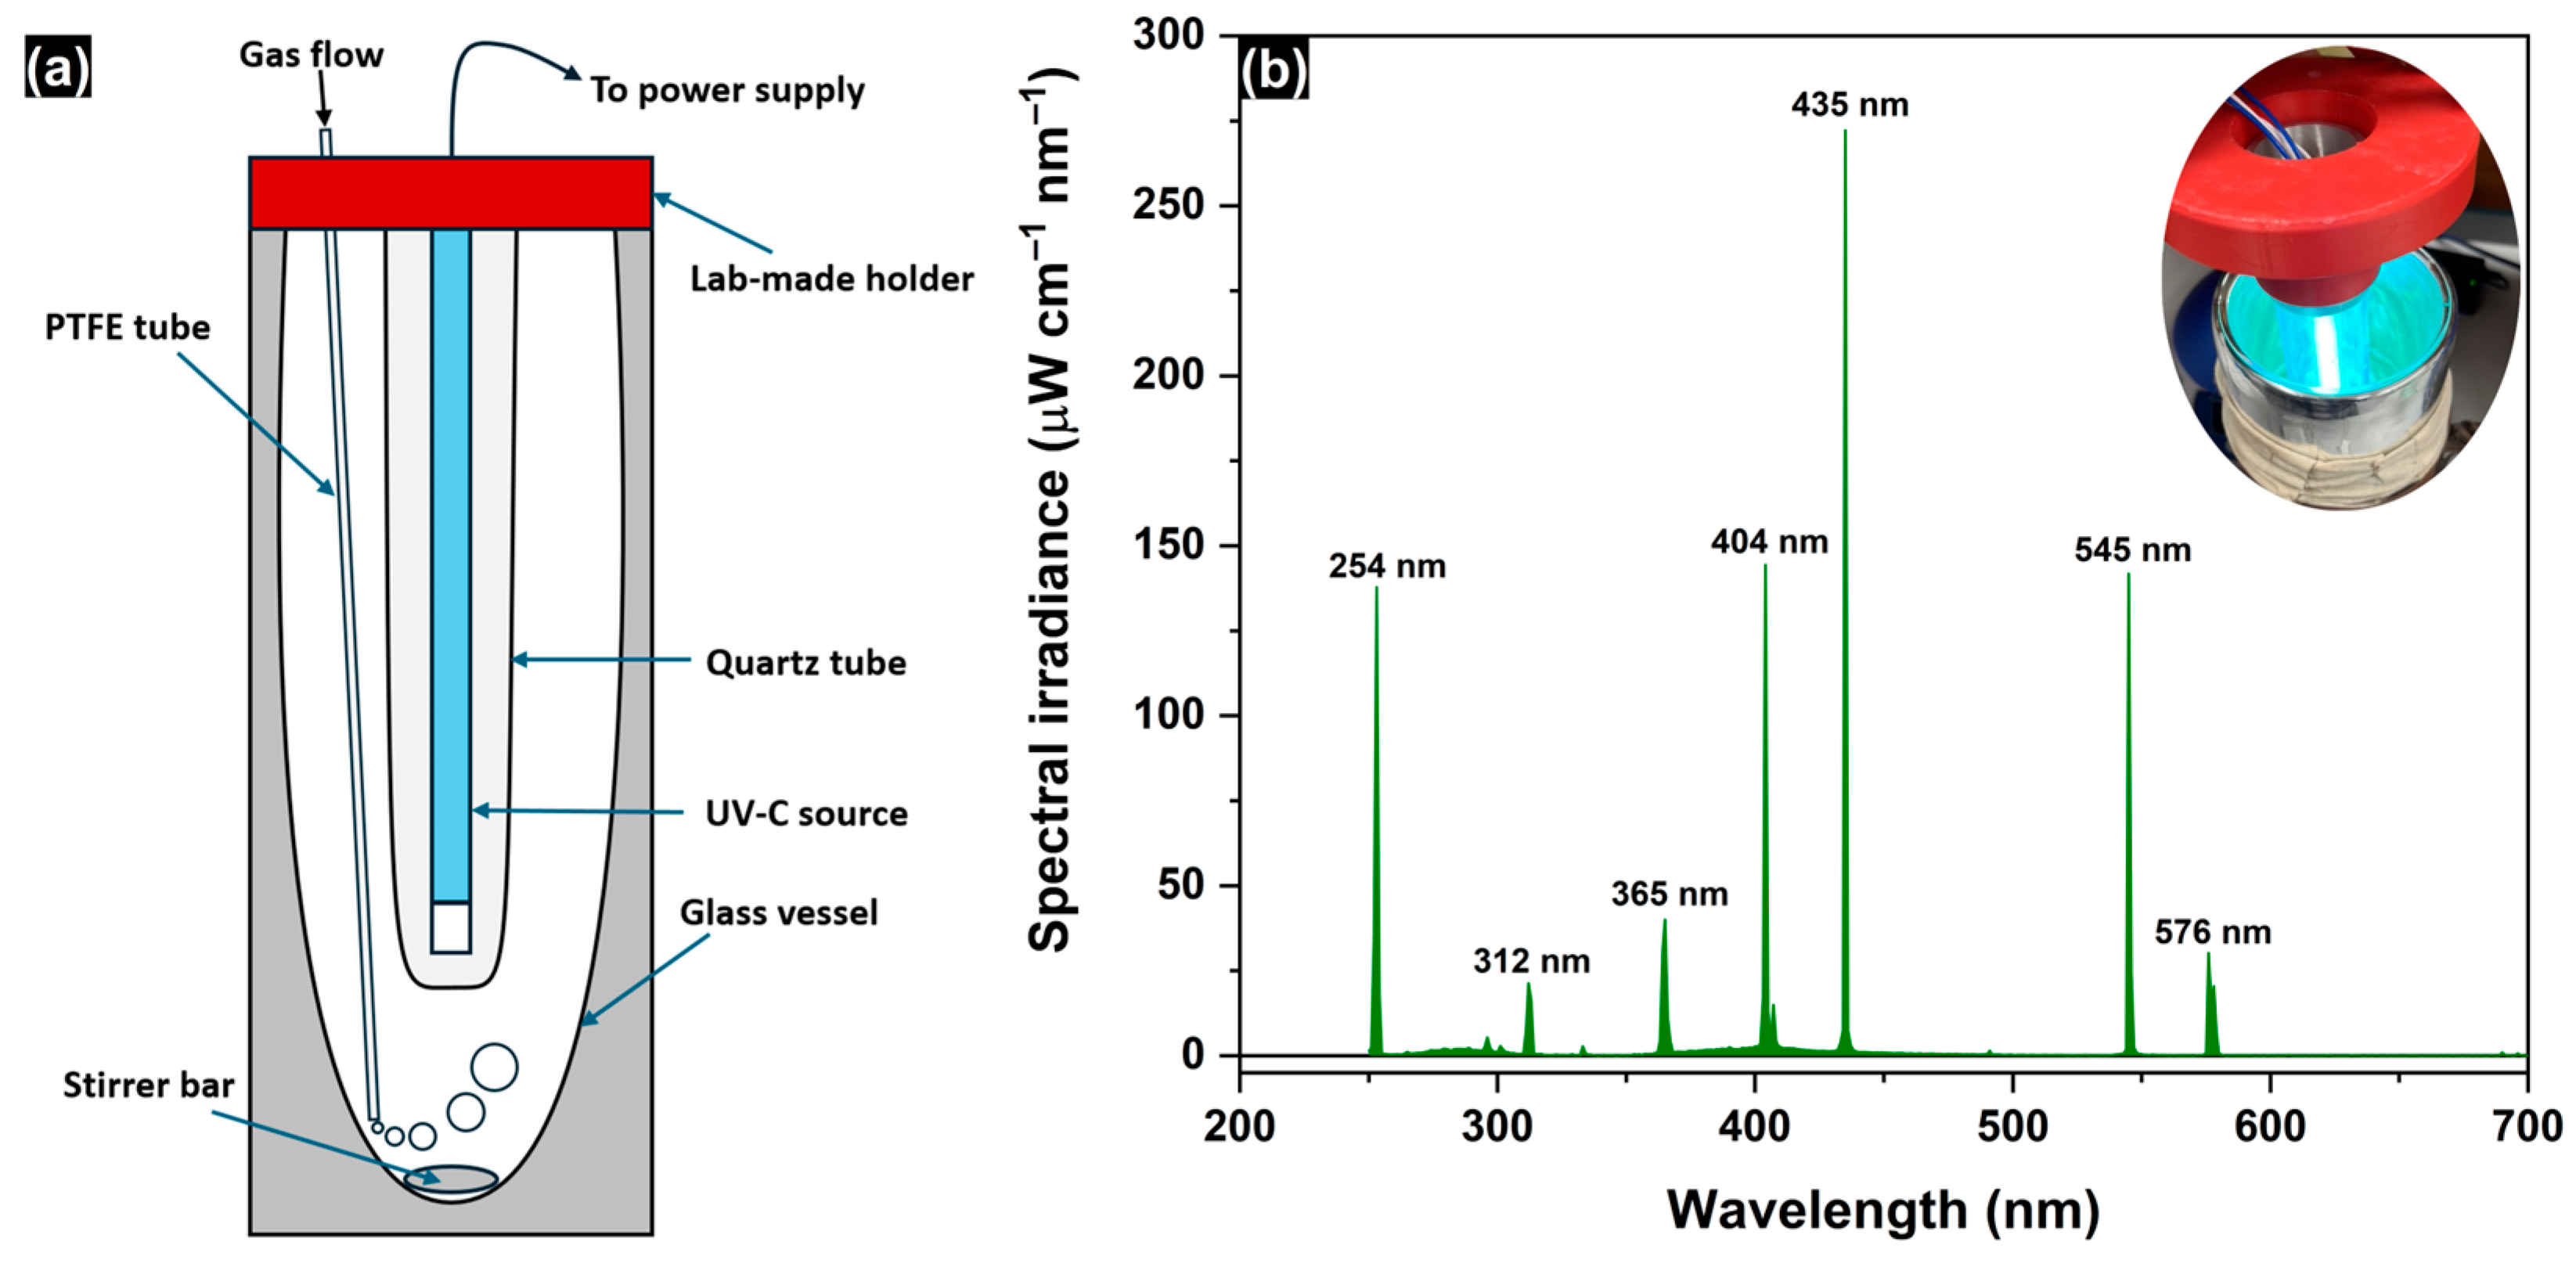
Figure 9.
COD values measured for MnO2-pretreated EG solution (500 mg L–1) containing different amounts of added H2O2.
Figure 9.
COD values measured for MnO2-pretreated EG solution (500 mg L–1) containing different amounts of added H2O2.
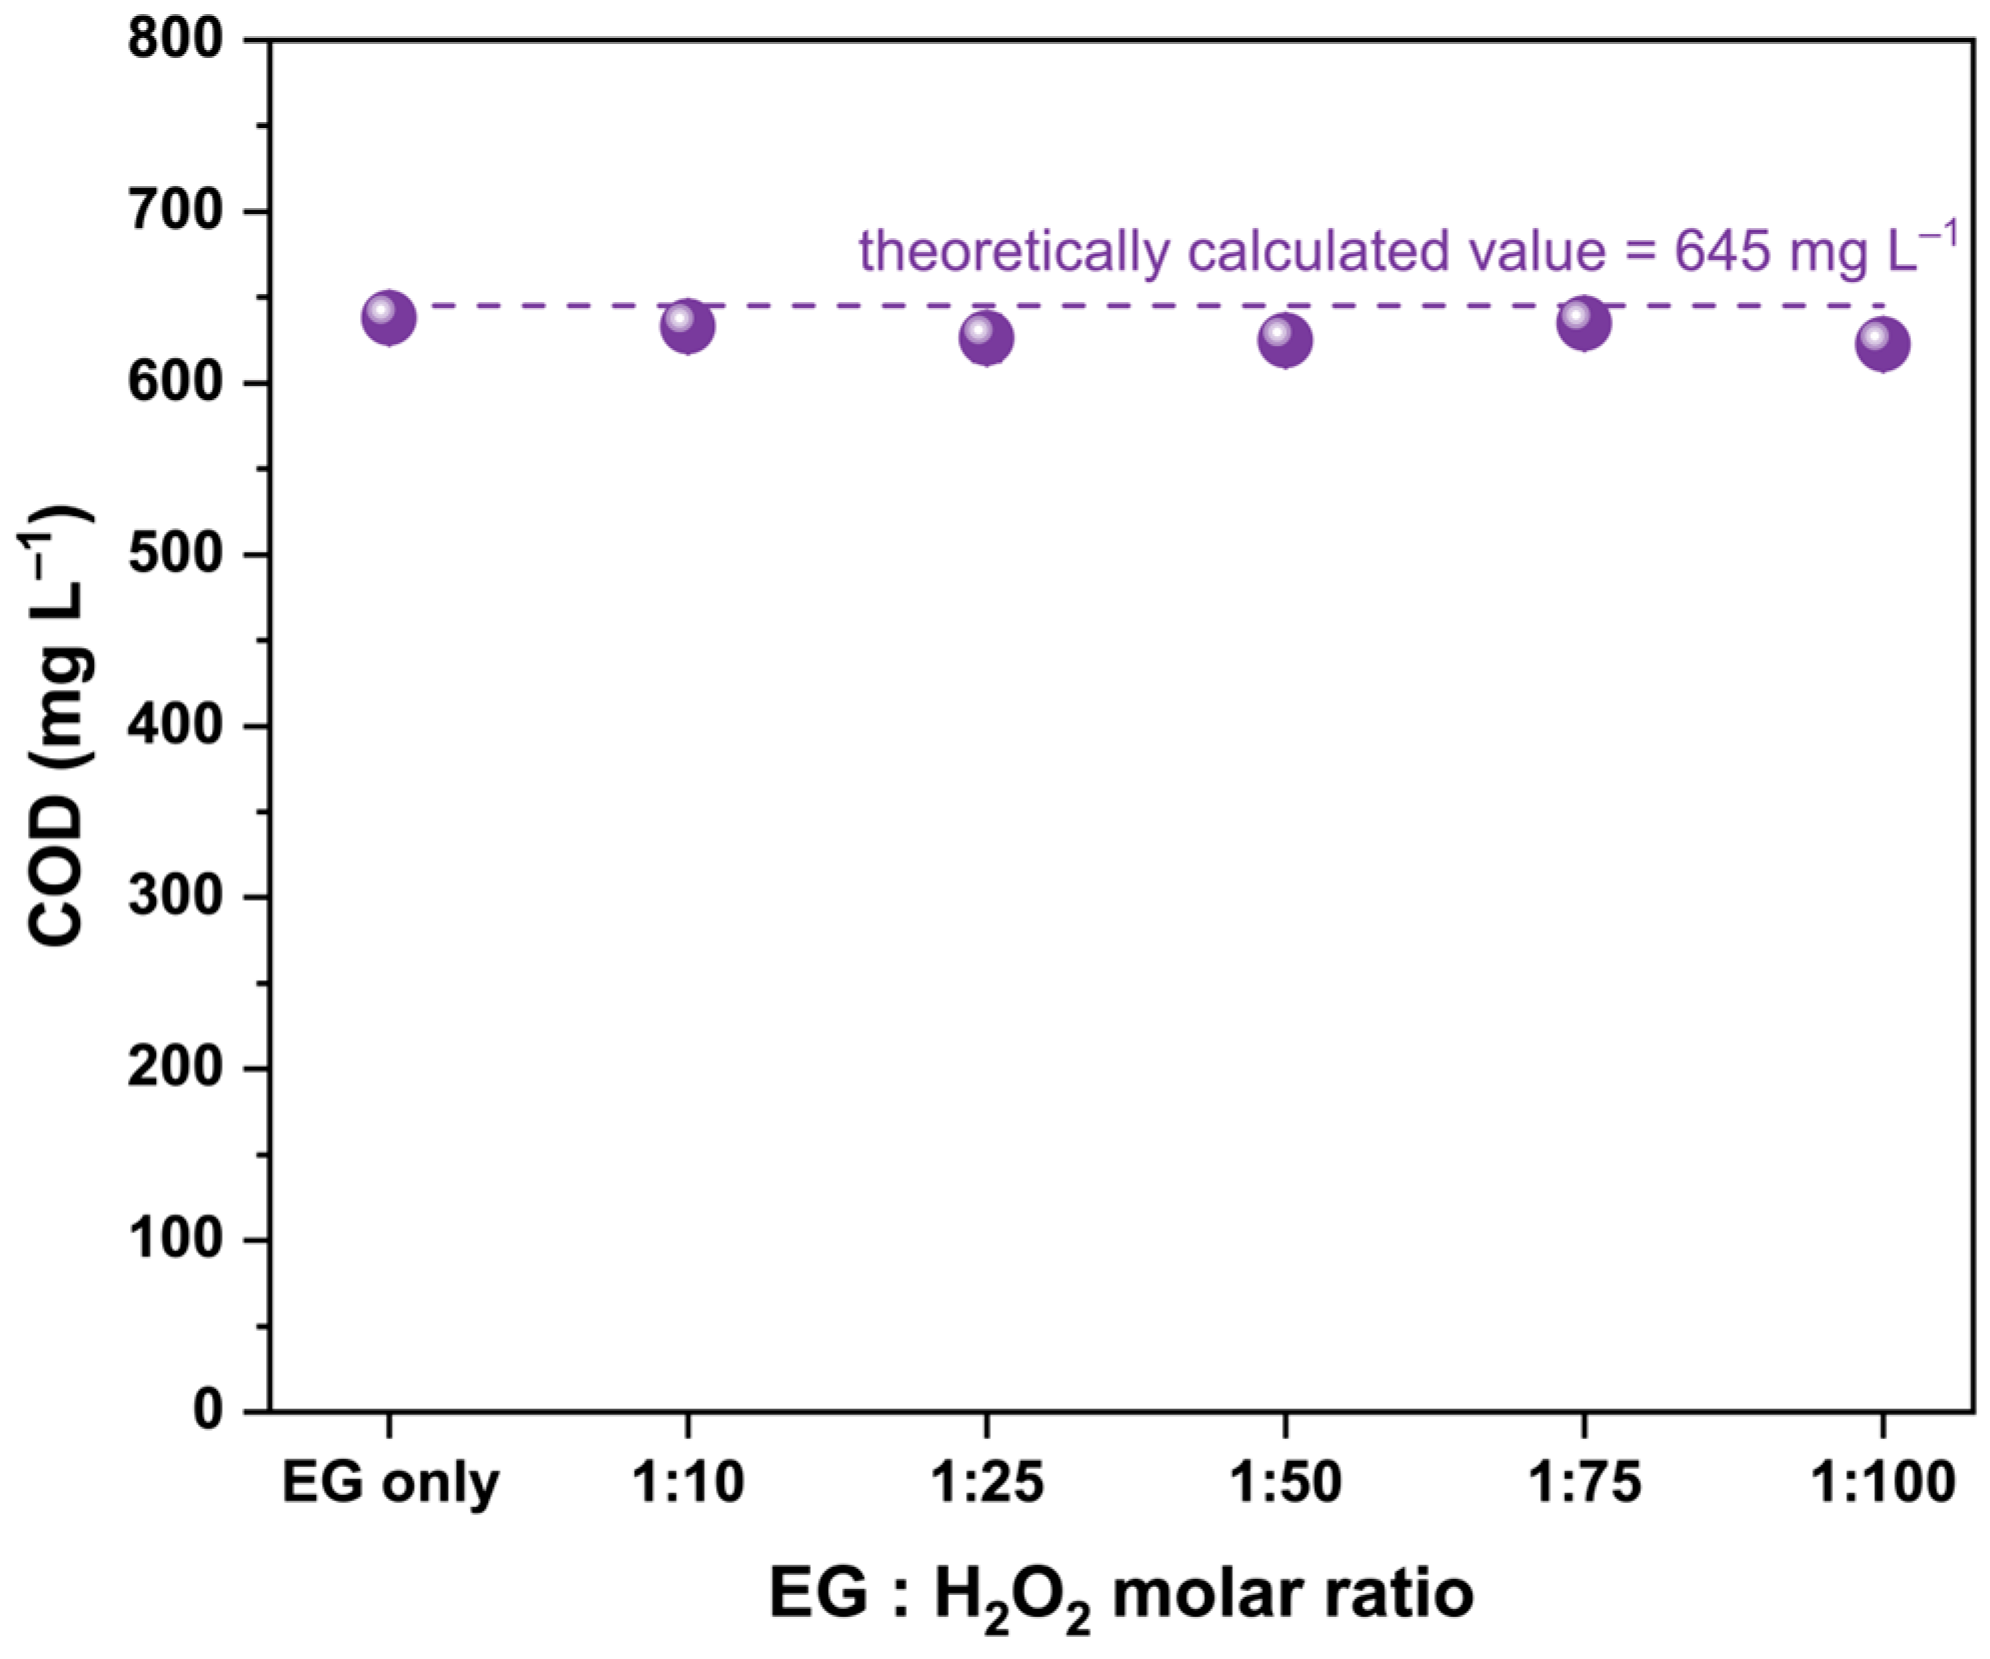

Table 1.
Toxicity of EG and EG-based ADFs.
| Reagent | Model organism | Indicator | Concentration (mg L–1) | Ref. |
|---|---|---|---|---|
| Ethylene glycol | Ceriodaphnia dubia | 48-h LC50 | 34440 | [12] |
| IC25 | 12310 | |||
| Type I ADF | 48-h LC50 | 13140 | ||
| IC25 | 3960 | |||
| Ethylene glycol | Pimephales promelas | 48-h LC50 | 81950 | |
| IC25 | 22520 | |||
| Type I ADF | 48-h LC50 | 8540 | ||
| IC25 | 3660 | |||
| Type I ADF | Ceriodaphnia dubia | 48-h LC50 | 15700 | [14] |
| IC25 | 5470 | |||
| Type IV ADF | 48-h LC50 | 449 | ||
| IC25 | 113 | |||
| Type I ADF | Pimephales promelas | 96-h LC50 | 24700 | |
| IC25 | 4430 | |||
| Type IV ADF | 96-h LC50 | 371 | ||
| IC25 | 179 | |||
| Ethylene glycol | Selenastrum capricornutum | IC25 | 5340 | [15] |
| Type I ADF | 7610 | |||
| Ethylene glycol | Trachinotus carolinus | 24-h LC50 | >60000 | [11] |
Disclaimer/Publisher’s Note: The statements, opinions and data contained in all publications are solely those of the individual author(s) and contributor(s) and not of MDPI and/or the editor(s). MDPI and/or the editor(s) disclaim responsibility for any injury to people or property resulting from any ideas, methods, instructions or products referred to in the content. |
© 2024 by the authors. Licensee MDPI, Basel, Switzerland. This article is an open access article distributed under the terms and conditions of the Creative Commons Attribution (CC BY) license (http://creativecommons.org/licenses/by/4.0/).
Copyright: This open access article is published under a Creative Commons CC BY 4.0 license, which permit the free download, distribution, and reuse, provided that the author and preprint are cited in any reuse.


