
Submitted:
18 November 2024
Posted:
18 November 2024
You are already at the latest version
Abstract
This study evaluates the feasibility and effectiveness of the Life Cycle Assessment (LCA) meth-odology. Two widely used products with the same functionality but different designs were se-lected for comparative analysis. SimaPro 9.6.0 software was used for the calculations and LCA of both assemblies and the analysis covered all phases of the life cycle, taking into account factors such as energy, materials and water consumption. The results allowed a comparison of the environ-mental impacts of the two assemblies, identifying the life cycle phases with the highest impact and the most relevant impact categories. Product design and materials used were found to have a significant impact. Applying the LCA methodology to the two mechanical assemblies identified opportunities for improvement in the design and manufacturing processes, with the aim of re-ducing the environmental impact and increasing the competitiveness of the products. By consid-ering the full life cycle of a product from the early design phases, more sustainable design and manufacturing decisions can be made, and by using this analysis, companies can develop more sustainable products and reduce costs.
Keywords:
life cycle analysis
; environmental impact
; product design life
; cycle phases
1. Introduction
The philosophy of producing as much as possible in as short a time as possible, without regard to the quality of what is produced or the impact on the environment, has evolved into the need to produce only what is needed, in the best possible quality, and with the least possible impact on the environment at all phases of the process [1].
As early as the 1960s and 1970s, concerns about the limited availability of raw materials and energy sources began to drive the development of techniques to assess resource and energy consumption in different sectors and to try to avoid limitations in the future [2]. It was at this time that the first documented studies focusing on the life cycle analysis of a product appeared. These studies sought to compare the energy consumption and emissions associated with the production process of the materials needed to manufacture products [3]. Subsequently, this methodology spread and took the name "Resource and Environmental Profile Analysis" (REPA) in the United States and "Eco-balance" [4] in Europe, the forerunners of today's LCA.
Improving sustainability has been a goal since the 1992 Earth Summit [5] and has been applied to the manufacture of products of all kinds. This paradigm shift has led to an approach that assesses the improvements that can be made throughout a product's lifecycle, from the moment a product idea is conceived to its 'death'. This is known as Life Cycle Assessment (LCA), a concept that first appeared in 1969 with studies carried out at the Midwest Research Institute. In the 1990s, the term "Life Cycle Analysis" (LCA) was introduced by the Society for Environmental Chemical Toxicology (SETAC) [6] and the "Code of Practice for LCA" was created, drawing on the studies carried out with the aim of homogenizing the methodology. In 1997, in order to standardize the application of LCA, SETAC, together with the International Organization for Standardization (ISO), defined the methodology, terminology and procedures for carrying out an LCA, resulting in the ISO 14040 standards [7]. These standards state that "LCA addresses potential environmental aspects and impacts (e.g., resource use and environmental consequences of emissions and discharges) throughout the life cycle of a product, from raw material acquisition, production, use, end-of-life treatment, recycling and disposal (i.e., cradle to grave)" [8].
Life Cycle Assessment (LCA) is currently one of the most widely used techniques for environmental impact assessment, as it allows the analysis, collection and evaluation of the potential environmental impacts generated throughout the life cycle of a product or system, from the extraction of raw materials, through production, use and final disposal, in order to assess the associated environmental impacts [9].
This research has focused on the application of LCA methodology to the analysis of two mechanical assemblies with the same functionality, widely used throughout the world, but made of different construction materials, which have significant differences from a LCA point of view.
The aim is to use LCA to compare the two mechanical assemblies in order to assess how certain design changes have a significant impact on the environmental impacts generated during the life cycle of the products. This comparison will provide ideas on how to rethink the design, manufacturing, production process, etc. so that, without changing the functionality of the assembly, the environmental impact generated is minimized. This situation is transferable to many widely used elements where reducing the environmental impact could have a significant potential impact.
First of all, it will be systematically defined what an LCA consists of and what the phases of an LCA are, explaining both the applicable methodology and the software used to carry out the research. This methodology is based on the international standard ISO 14040 [7]. The LCA is then applied to the first of the two sets, obtaining quantified impacts for a number of impact categories according to the chosen methodology. The LCA is then applied to study the second set, with the same functionality but with a different design.
These LCAs are carried out using the SimaPro software, which allows all the elements of a given set to be analysed, evaluating all the phases necessary to obtain them and taking into account factors such as the consumption of energy, materials, transport and water, among others. The process is quantified by means of so-called eco-indicators, which show the environmental impact of a given process or product. All this allows a comparison to be made between the two products in order to draw conclusions as to which of the two designs has a greater impact in the various categories defined in the methodology used, which uses the Eco-indicator 99 [10]. This eco-indicator makes it possible to measure the impact of materials, production processes, transport processes, energy generation and disposal scenarios [11], which is why it is widely used and suitable for this analysis, using intermediate and final points.
Finally, once this comparison has been made, it is possible to determine which of the two designs has a greater impact, as well as which components of that design or production process contribute to that impact to a greater or lesser extent, and thus to identify variations in the design of the product, or even the production process itself, in order to obtain an "optimized" product that reduces its impact as much as possible without compromising the functionality for which it was designed. The analysis, carried out in a systematic way, will show step by step how to do it and will also reveal the impact of a certain design (materials, manufacturing system, etc.) on the environmental impact by analysing elements of everyday use.
2. Methods
2.1. Life Cycle Analysis
This study uses the Life Cycle Assessment (LCA) tool according to ISO 14040 [7]. LCA is an objective process that allows us to assess the environmental impacts associated with a product, process or activity by identifying and quantifying both material and energy use and emissions to the environment. This makes it possible to determine the impact of resource use and emissions in order to evaluate and implement environmental improvement strategies. The LCA covers the entire life cycle of a product, process or activity, including the extraction and processing of raw materials, production, transport and distribution, use, reuse and maintenance, recycling and final disposal. With regard to a product, this technique allows us to assess the environmental impact from the extraction of raw materials to the end of the product's useful life, when it becomes waste that must be treated appropriately. Based on the ISO 14040 standard [7], LCA studies consist of four phases, as shown in Figure 1:
The steps followed in the analysis according to ISO 14040 are explained below.
2.1.1. Goal and Scope Definition
In the analysis, a Life Cycle Assessment (LCA) was carried out on two products that are widely used worldwide and have the same functionality (shopping trolleys made of different materials), in order to determine the environmental impact of each. On the one hand, a trolley made mainly of steel with a capacity of approximately 180 litres and, on the other hand, a trolley made mainly of polypropylene with a capacity of approximately 164 litres were analysed. The LCA will then be used to see if it is possible to identify which aspects have the greatest influence on the environmental impact, so that changes can be made either in the production process or in the design of the product itself in order to reduce or mitigate it. In both cases, the product system is divided into five sub-processes:
- Material procurement;
- Trolley assembly operations;
- Trolley finishing;
- Trolley assembly process;
- Trolley end-of-life scenario.
In terms of system boundaries, the following aspects shall be considered:
Materials required for the trolley forming process and the method of obtaining them;
Disposal of the trolley at the end of its life cycle.
The transport and distribution of the trolley to the point of use, the equipment used in each of the sub-processes of the system and the energy used in each sub-process shall not be considered.
2.1.2. Life Cycle Inventory Analysis (LCI)
In this LCI phase, data and calculation methods are obtained to quantify the inputs and outputs of the system under consideration, respecting the system boundaries defined in the scoping phase. Figure 2 shows the sub-processes defined in the scope of the study. At this level, the sub-processes are common to both types of trolleys.
These sub-processes will vary for each of the trolley models. Figure 3 breaks down the sub-process of sourcing materials for the metal trolley. Within this phase, the aspects that comprise the process must be considered, from considering the materials required to obtaining them in the required quantity and form.
For each of the sub-components of the trolley (wheels, basket, handlebars and lower base), the entries corresponding to the different materials, with their quantities and weights, must be taken into account. On the basis of the data obtained for the two types of trolley to be analysed, an approximate and consistent weight has been considered for each of their components. This allows an appropriate application of the LCA to the whole set, taking into account the different materials that make up each component and the process used to obtain them. Figure 4 summarises this information for the case of the metal trolley.
Figure 5 breaks down the sub-process of obtaining materials for the polypropylene trolley.
Figure 6 below shows the component, weight and material tree for the polypropylene trolley.
The trolley sub-assembly phase begins when all the necessary materials are available and ends when the trolley is ready. This phase includes the processes that need to be applied to the parts or sub-assemblies that make up the trolley using different machines, taking into account the energy and machinery used for each of the sub-processes. Figure 7 breaks down the subassembly sub-process for the metal trolley, while Figure 8 does the same for the polypropylene trolley.
The finishing sub-process considers the operations to be applied to the trolley after the operations of the second phase have been completed and before the assembly process in the fourth phase. Figure 9 breaks down the finishing sub-process for the metal trolley, while Figure 10 does the same for the polypropylene variant.
In the case of the metal trolley, this step involves cleaning the basket and bottom structure in a soap and acid bath, followed by nickel-chrome plating of the basket and bottom structure. In order to carry out both sub-processes, the following inputs must be considered
- Soap bath;
- Acid bath;
- Nickel bath;
- Chrome bath.
In the case of the polypropylene trolley, this phase includes the removal of excess of plastic in the various injected parts, the removal of any imperfections that may have been created during the injection of the parts and the cleaning of the parts in the soap bath. In order to carry out the three sub-processes, the following entry must be taken into account: Soap bath.
The next phase is the assembly process, which focuses on the final processes to be applied to the trolley after the finishing operations of the third phase. As both types of trolley require a different assembly process, different inputs need to be considered for each. Figure 11 shows the assembly process for the metal trolley.
The mechanical connecting elements required for the assembly of the metal trolley are shown in Table 1.
The assembly process of the polypropylene trolley is shown in Figure 12.
In the case of the polypropylene trolley, for its assembly, only the screws that allow the wheels to be joined to the lower structure should be considered as inputs. These screws are listed in Table 2.
The final sub-process corresponds to the end-of-life scenario of the trolley. This phase considers the final disposal of the trolley in a landfill at the end of its useful life, Figure 13. Landfill is chosen as the end-of-life scenario because recycling and reuse of this type of product is costly. The average lifetime of a metal shopping trolley is 8 years, while for a polypropylene shopping trolley it is assumed to be 10 years.
With all the processes and sub-processes defined for both types of trolley, the inventory analysis is complete. The next step is to carry out the Life Cycle Impact Assessment.
2.1.3. Impact Assessment (LCIA)
During the development of this phase, the significance of potential environmental impacts is assessed based on the results of the Life Cycle Inventory. In order to carry out the Life Cycle Impact Assessment (LCIA), it is necessary to select a number of impact categories, which represent the different areas affected by the product life cycle to and from the environment, such as ozone depletion, nitrification/eutrophication, greenhouse effect, acidification, etc. Category indicators, which determine the emissions or resources used for each impact category, are used to analyse the LCA. To analyse the LCI results, category indicators are used to determine the emissions or resources used for each impact category. The whole process consists of four sub-steps:
- Classification: In this phase, the impact categories to be assessed are selected and the LCI results are assigned to these categories. Depending on the assessment method used, certain impact categories will be assigned, as described below in the section on LCA assessment methods;
- Characterization: At this point the results are transferred to the same unit through the characterization factors by multiplying the ranking results by these factors and grouping the results to obtain an indicator for each impact category. Characterization factors imply the relative contribution of a substance to an impact category. Depending on the assessment method, there are different characterization factors to be applied;
- Normalization: This phase shows the contribution of each impact category to the overall environmental impact. This is done by analysing the results of the characterization. Normalization factors for each impact category are applied to the characterization results. Different scaling factors are applied for each assessment method;
- Scoring or weighting: this consists of converting the results of the normalisation phase using subjective weighting factors. The weighting factors are multiplied by each of the impact categories and then added together to give an overall score for the case under consideration. The weighting factors, which represent the relative importance of each category to the environment, are subjective (unlike the factors in the previous steps) and may vary according to socio-economic criteria. Weighting factors are assigned to each impact assessment method.
2.1.4. Interpretation
This is the final phase of the process, in which the results obtained in the previous phases are analysed and combined in such a way that a series of conclusions and recommendations can be drawn to facilitate decision-making on the system being analysed. These must be consistent with the scope and objective of the study and always within the defined constraints. According to ISO 14044 [1], this phase should include the following aspects:
- Identification of significant issues based on the results of the LCI and LCIA phases of an LCA;
- Evaluation taking into account completeness, sensitivity and consistency analysis checks;
- Conclusions, limitations and recommendations.
2.2. Methodologies for LCA Assessment
There are different methodologies for conducting a LCA assessment, the main differences being the impact categories, the characterisation of the life cycle elements and the standardisation and weighting used. There is also an alternative way of classifying these methodologies, which is to consider that there are two methods of impact assessment. The first is to analyse the effect of the final environmental impact, the so-called endpoint or "damage-oriented method", which results in only three impact categories, making the interpretation of the results easier. The second is to analyse the impact of intermediate effects, the midpoint or "problem-oriented method", which has a relatively low uncertainty but has the disadvantage that the different impact categories of the results are more complicated.
Although there are many methodologies that can be used to carry out the assessment, they are all based on what are known as eco-indicators, which are figures that can be used to determine the total environmental impact of a product and also the impact of a service or process. The Eco-indicator 99 quantifies each of the impact categories and in order to align the methodology with the objective of this study, the Eco-indicator 99 methodology was chosen. This method focuses on the final impacts rather than the intermediate impacts such as human health, ecosystem quality and resource depletion, and also allows for easier interpretation and weighting of the LCA results.
Interpretation is relatively straightforward, as it is sufficient to know that the higher the indicator is, the greater the environmental impact is. The results are grouped into three categories of damage (to human health, ecosystem and resources), which are subdivided into 11 impact categories with corresponding characterization factors (Figure 14).
The damage characterisation factors will simplify the results. Table 3 lists the different damage characterisation factors for the damage category Human health.
Table 4 lists the different damage characterisation factors for the damage category Ecosystem quality.
1 damage is denoted in PDF m2 year (loss of species in a given area over a given period of time).
Finally, Table 5 lists the different damage characterization factors for the damage category: resources.
On the other hand, there are the normalisation factors applied to each impact category, which multiply the results obtained in the characterisation. As mentioned above, each methodology uses different normalisation factors. In the case of the Eco-indicator 99 methodology, these factors are based on European data and reflect the order of magnitude of the environmental problems of the process compared to the total environmental problems in Europe. Table 6 quantifies these factors.
Finally, there are weighting factors, the value of which also depends on the chosen methodology. This weighting is responsible for the prioritisation of the impacts, obtained by multiplying the results of the normalisation of each impact by a factor directly proportional to the level of priority established. The weighting factors, which represent the relative environmental importance of each category, are subjective (unlike the factors in the previous phases) and can vary according to socio-economic criteria. The Eco-indicator 99 methodology includes weighting factors as shown in Table 7.
2.3. Used Software
The analysis was developed using SimaPro 9.6.0 software. This software allows a full LCA with several impact assessment methods, all of which calculate the relative contribution of a substance to a given impact category. Some of the methods also use other procedures such as damage assessment, normalisation or weighting. In this case, the chosen assessment method is Eco-indicator 99. SimaPro offers the possibility to use both user-created and bibliographic databases (Ecoinvent, BUWAL, IDEMAT, ETH, IVAM). In this study, the Ecoinvent database was used.
3. Results
3.1. Characterisation of Both Sets
In order to analyse a product and apply LCA, a series of categories must be defined, including aspects such as materials and their production, transport, energy, etc. For the phases analysed in the software, the final materials have been used, since SimaPro takes into account all the phases necessary to obtain them.
Firstly, a flow chart of the materials that make up the trolley is generated by entering the materials and their associated quantities, as described in Figure 4 and Figure 6 for the metal and polypropylene trolleys, respectively. When entering the materials, it is necessary to apply an amortization factor for the materials corresponding to the average lifetime of each type of trolley, estimated at 8 years for the metal trolley and 10 years for the polypropylene trolley. The quantities indicated are therefore divided by the depreciation factor to obtain the impact of the materials in each of the years of the product's life (Figure 15). In Figure 15 it can be seen that there are different thicknesses in the lines of the graph. This is because the software assigns a certain thickness to the lines according to the impact that each aspect has on the overall product of the analysis, in order to be able to observe what influences the process the most. The greater the thickness, the greater the impact on the process.
It can be seen that the aspect that most influences the impact produced by the metal trolley is the use of chrome-plated steel. The values at the bottom left of each rectangle in the diagram show the impact score, where the magnitude of the chrome-plated steel can be seen compared to other trolley materials. In the case of the polypropylene trolley, it can be seen that the impact score for polypropylene is the highest, which is a reasonable result since most of the trolley is made of polypropylene.
It should be noted that for the purposes of the wheel analysis, polypropylene has been simplified and used instead of rubber, as the impact produced by polypropylene is similar to that of rubber for the same quantity in all impact categories.
In addition, SimaPro allows the addition of an end-of-life scenario, which in this case is landfill as defined in the scope. In the diagram in Figure 16, it can be seen that the aspect that most influences the impact generated by the metal trolley (once the whole process is taken into account by adding the end-of-life scenario) remains the use of chromed stainless steel, while in the case of the polypropylene trolley, polypropylene also remains the most relevant aspect.
Looking at the impact values at the bottom left of each rectangle in the graphs, it can be seen that the total life cycle impact score of the trolley is divided into the impact generated by the trolley itself and the impact generated by the landfill, with impact values of 2.49 and 0.0155 respectively for the metal trolley and 0.579 and 0.111 for the polypropylene trolley.
Figure 17 shows the quantified percentages of the characterisation by impact category for the steel trolley. The percentages are shown for the processing phase of the trolley and the deposition phase of the trolley in the landfill. It can be seen that there are both positive and negative values. Values below 0% represent an environmental benefit over the life cycle of the study object, while values above 0% represent an environmental impact.
For all impact categories it can be seen that the percentage impact of landfill is not significant compared to the impact of shopping trolley processing, as the values for landfill impact are minimal.
If the same approach is repeated for the polypropylene trolley, the percentage impact of the landfill in each of the impact categories is shown in Figure 18. It can be seen that it is significantly lower than the impact generated by the trolley moulding process, except for carcinogens and to a lesser extent for land use.
On the other hand, the percentages of the characterisation by damage categories can also be obtained for the case of both trolleys in Figure 19 and Figure 20 respectively. In both figures, the percentages can be observed in relation to the treatment of each type of trolley and its deposition phase in the landfill.
For the metal trolley, for the three impact categories (human health, ecosystem quality and resource consumption) it can be observed, as in the characterisation by impact category, that the percentage impact of landfill deposition is not significant compared to the impact of trolley processing.
If the same process is carried out for the case of the polypropylene trolley (Figure 20), it can be seen that for the categories of damage to ecosystem quality and resource consumption, the impact generated by the landfill is not significant compared to that generated by the processing of the trolley, unlike in the case of human health, where the final deposition of the trolley in the landfill has a significant impact.
3.2. Normalization and Weighting
The normalisation values by damage category for the case of the metal trolley, corresponding to the processing of the trolley itself and its landfill phase, are shown in Figure 21. Again, for all three damage categories, the percentage impact of landfill deposition compared to the impact of the trolley processing is hardly significant. It can be seen that the largest impact is caused by the consumption of resources, which includes the impact categories of minerals and fossil fuels.
For the polypropylene trolley it can be seen that, as with the characterisation by impact category, the only category in which final disposal in landfill has a significant impact is the one related to human health. In addition, Figure 22 shows that the largest impact is generated by resources consumption, which includes the impact categories of minerals and fossil fuels.
Finally, it is needed to perform the weighting calculation. The weighting is responsible for prioritising the impacts by multiplying each impact by a factor that is directly proportional to the priority level set. The values of the weighting factors for the impact assessment method have been chosen as defined in the scope of the LCA for Eco-indicator 99.
By weighting by impact category (Figure 23), the values for the processing of the metal cart and its landfill phase can be observed.
The highest value is obtained for the human health aspect. Considering that the values of the weighting factors for human health and ecosystem quality are the same, it can be seen that the production process of the metal trolley has a high impact on human health, but a much lower impact on the ecosystem. With regard to the consumption of resources and raw materials, it could be seen that normalization was the most affected aspect, but since the chosen impact assessment method gives it a lower weighting factor than human health, resources consumption is no longer the most significant impact.
Figure 24 shows the weighting for the polypropylene trolley.
The weighting for the polypropylene trolley shows that the highest value is obtained in the aspect related to the consumption of resources and raw materials. Considering that the values of the weighting factors for human health and ecosystem quality are the same (weighting factor 400), it can be seen that both the production process of the polypropylene trolley and its final disposal in landfill have a major impact on human health and a much smaller impact on the ecosystem.
The consumption of resources and raw materials is the aspect most affected by standardisation, and although the chosen impact assessment method gives a lower weighting factor than human health, the consumption of resources is still the most significant impact. However, the final disposal of the polypropylene trolley in landfill has hardly any impact in the resource use category, as all the impact in this category is practically generated by the production process of the trolley.
It is noteworthy that although the weighting factor value of the resource and raw material consumption damage category is half that of the human health factor, the final weighted values are similar, so that the impact generated in the resource category is large and needs to be taken into account.
It can be seen that the impact of landfill at the end of the life of the trolley only has a representative impact in the category of harm to human health.
Finally, a single score can also be obtained (Figure 25), which allows to see which of the impacts are more or less important for each product. This graph has been divided into the impact of manufacturing the metal trolley itself, the impact of landfilling and the relative impact of each of these two processes. In this case, it can be seen that the aspect most affected by the production process of the trolley is human health (as was also seen in the weighting graph). However, the final landfill has virtually no impact on the three aspects.
Figure 26 shows the same indicators, but in this case for the polypropylene trolley. It can be seen that the most affected aspect of the production process of this trolley is the consumption of resources and raw materials. However, the impact on human health is not to be underestimated compared to the impact on the consumption of resources and raw materials. With regard to final disposal in landfills, the most relevant impact is in the human health category. Finally, it was found that the impact caused by landfilling is more important than the impact caused by the production process of the steel trolley.
4. Discussion
Once the LCA results for both products are available, we will evaluate the results. Figure 27 compares the impacts produced by each of the trolley types studied. It shows the characterisation according to impact categories in the processing of the trolley set for each of the materials (polypropylene and steel).
It can be seen that the impact of the metal trolley is higher than that of the polypropylene trolley in virtually all categories, with a notable difference in the carcinogens category. This is an important detail to consider and is consistent with the results obtained by Norgate et al. [12]. Once the analyses have been carried out, special attention should be paid to the materials used in the production process of the metal trolley, and in particular to the steel, which is present in larger quantities, since its use and processing in the case of the metal trolley have an excessive impact, generating carcinogenic substances harmful to human health.
When analysing the landfill deposition (Figure 28), it can be seen that the impacts generated by both types of trolley in the impact categories are significantly lower than those previously obtained (Figure 27). Particularly noteworthy is the impact category value for carcinogens from the landfill deposition of the polypropylene trolley. In the long term, the landfill of a trolley made mainly of polypropylene has a high impact on the production of carcinogenic substances generated during the degradation process of the trolley [13,14,15], so that other possible alternatives for the end-of-life scenario of this trolley should be considered, as has been found in several studies on polymers [16].
Figure 29 below shows the normalisation according to damage categories in the processing of the trolley for each of the two cases. In this case, it can be seen that the impact of the metal trolley is higher than that of the polypropylene in all damage categories (as was the case for the impact categories in the characterisation in Figure 27). The greatest difference in impact is found in the human health damage category, as this includes the carcinogens impact category, which is also much higher for the metal trolley. The impact category with the highest value is the consumption of resources and raw materials. Therefore, efforts should be made to find materials that would allow the trolley moulding process to be carried out in smaller quantities or to analyse the trolley models in such a way that the design could be improved to reduce material consumption [17].
The graph in Figure 30 shows the normalisation according to the damage categories in the landfilling of both types of trolleys. It can be seen that the impacts generated by both trolleys in the damage categories are significantly lower than those observed in Figure 29 for the processing of the trolley, with the exception of the value for the human health damage category for the landfill deposition of the polypropylene trolley. As already mentioned, in the long term, the landfill of a trolley made mainly of polypropylene has a high impact on the production of substances harmful to human health that are produced during the degradation process of the trolley, so that other possible alternatives for the end-of-life scenario of this trolley should be considered that would lead to a lower production of these substances harmful to human health [18].
5. Conclusions
Analysing the results of the comparison in the previous section, it can be seen that in the phase corresponding to the processing of the trolley, the greatest impacts are generated by the metal trolley. As mentioned above, the most significant difference is in the impact category of emissions of carcinogenic substances. It was also observed that the impact category with the highest value was the one corresponding to the consumption of resources and raw materials. With regard to the final phase, the disposal of the shopping trolley in a landfill at the end of its life, the impacts corresponding to this phase are significantly lower than those corresponding to the processing phase of the shopping trolley, with the exception of the value of the impact category emission of carcinogenic substances in the case of the polypropylene shopping trolley. As for the damage categories in the landfill phase, the highest value is found for the impact on human health due to the deposition of the polypropylene trolley in the landfill (this damage category includes the impact category emission of carcinogenic substances, which, as seen above, was the highest value in the characterisation of the polypropylene trolley). Quantitatively comparing the impacts of each phase, it can be seen that the phase with the highest impacts is the one corresponding to the processing of the trolley (with higher impacts in the case of the metal trolley in all aspects). Therefore, the design of both trolleys should be reconsidered in order to minimise the number of materials used and thus reduce the impact caused by the processing of both trolleys. With regard to the final phase, the disposal of the trolley in a landfill at the end of its life, it should be noted that the impacts are lower in the resources and ecosystem quality categories. However, in the case of the polypropylene trolley, alternatives should be sought for the end-of-life scenario as the impact on human health due to the emission of carcinogenic substances is significant. Therefore, analysing the results obtained, it can be concluded that the impacts generated in the case of the metal trolley are greater in the processing phase due to the materials used and their quantity, although the polypropylene trolley has a great environmental impact in its final disposal in landfill, so the end-of-life scenario should be another one that has a lower impact on the emission of substances.
LCA is therefore an environmental management tool that can be important for decision making at different stages of product manufacture, from design to landfill [19]. Although the tool can be complex to understand, LCA is widely accepted by all sectors. Its application allows for a complete analysis of the environmental impacts of products throughout their life cycle, as well as those generated by production processes, and can be used to suggest improvements in design. Indirectly, its use improves both the quality and safety of companies and products, thereby enhancing their public image. LCA studies provide companies with environmental information on their products, making it possible to objectively correct significant environmental impacts by modifying the design of products and production systems, the materials used, etc. [20]. This makes it possible to reduce the environmental impact of the product throughout its life cycle, from the procurement of raw materials and components to the disposal of the product at the end of its useful life. It also reduces the costs associated with the consumption of raw materials and energy. The use of this tool makes it possible to compare products with the same function from the point of view of environmental impact and to make decisions on the design of the product or process on the basis of the information obtained; it also makes it possible to select the most appropriate materials to use on the basis of their observed impact, to make decisions to redesign in order to reduce the quantities of materials used, to choose the end-of-life scenario with the least environmental impact, etc. The use of this tool makes it possible to compare products with the same function from the point of view of environmental impact and to make decisions on the design of the product or process on the basis of the information obtained. Companies need to work with these tools, as using them will allow them to differentiate themselves from the competition and have a higher level of value that will be taken into account by consumers [21]. Similarly, consumers should be encouraged to take an interest in the issue so that they become aware of the consumption, use and purchase of environmentally friendly products [22].
On the other hand, environmental legislation exerts constant pressure on companies, which can sometimes be resolved by applying methodologies such as LCA to their products or production systems to demonstrate that their environmental impact is as low as possible. At present, the possibility of LCA becoming the basis for evaluating products for positioning on the international market cannot be ruled out, as purchasing companies will not be willing to pay for products that have a high environmental impact, as they invest heavily to avoid these impacts and the pollution they cause.
In the case studied, the LCA tool has made it possible to verify which of the two types of products generates the greatest environmental impact in each aspect, and to propose solutions to address these problems. It should be noted that the use of an environmental impact assessment tool (such as the LCA) has made it possible to check how the design of the product, depending on the materials used and their production processes, affects the level of impact generated. Specifically, it was found that the metal trolley has a higher impact than the polypropylene trolley due to the fact that its material extraction process is more costly. Therefore, special attention needs to be paid to the product design stage, as failures at this stage can be extremely costly for companies. This is due to the fact that design is the first stage of product development and mistakes made at this stage can be repeated throughout the production cycle, leading to failures that cannot be solved and therefore the product has to be discarded, creating problems with the use of the product, implying a bad image for the company, reducing its sales and causing large losses for the manufacturing companies.
In conclusion, by analysing the design of a product and comparing it with another with the same functionality, it is possible to assess aspects such as the economic investment to be made, the energy to be consumed or the quantities of raw materials required to obtain the product [23,24]. It is also possible to identify errors at the design stage so that they do not lead to unsolvable problems. In this case, the economic investment can be reduced by redesigning the product, analysing it and reducing the amount of materials used (provided that the product itself does not lose its functionality and does not present structural problems) or by analysing the materials and using others that have a lower environmental impact or require less of them to make up the product. In the same way, redesigning a product can bring certain benefits, such as reduced weight due to a reduction in the amount of material used, better handling and an improvement in the quality of the company's image due to a reduction in the impact.
Author Contributions
Conceptualization, S.V.; methodology, S.V.; formal analysis, S.V. and M.P.L.; investigation, S.V. and M.P.L.; data curation, S.V.; writing—original draft preparation, S.V.; writing—review and editing, S.V. and M.P.L.; project administration, S.V. All authors have read and agreed to the published version of the manuscript.
Funding
This research received no external funding.
Conflicts of Interest
The authors declare no conflicts of interest.
References
- Hao, X.; Wang, X.; Wu, H.; Hao, Y. Path to sustainable development: Does digital economy matter in manufacturing green total factor productivity? Sustainable Development 2023, 31, 360–378. [Google Scholar] [CrossRef]
- Landsberg, H. H. Energy in transition: a view from 1960. Energ. J. 1985, 6, 1–18. [Google Scholar] [CrossRef]
- Ahmad, T.; Zhang, D. A critical review of comparative global historical energy consumption and future demand: The story told so far. Energy Rep. 2020, 6, 1973–1991. [Google Scholar] [CrossRef]
- Baumgartner, T. Evaluating techniques for Eco-balances and life cycle assessment. European Environment 1993, 3, 18–22. [Google Scholar] [CrossRef]
- Molitor, M. R. The United Nations climate change agreements. In The Global Environment; Routledge, 2023; pp. 210–235. [Google Scholar]
- SETAC Books. Life-Cycle Impact Assessment: The State-of-the-Art 2nd Edition. Available online: https://www.setac.org/resource/lcia-2ed.html (accessed on 05-11-2024).
- International Organization for Standardization. Environmental management - Life cycle assessment - Principles and framework (ISO Standard No. 14040:2006). Available online: https://www.iso.org/obp/ui#iso:std:iso:14040:ed-2:v1:es (accessed on 05-11-2024).
- Hauschild, M.Z.; Huijbregts, M.A.J. Introducing Life Cycle Impact Assessment. In Life Cycle Impact Assessment; Hauschild, M., Huijbregts, M, Eds.; Available online; (accessed on 05-11-2024). [CrossRef]
- Boschiero, M.; De Laurentiis, V.; Caldeira, C.; Sala, S. Comparison of organic and conventional cropping systems: A systematic review of life cycle assessment studies. Environ. Impact Asses. 2023, 102, 107187. [Google Scholar] [CrossRef]
- Serrano-Arévalo, T. I.; Padilla-Esquivel, C. A.; Hernández-Pérez, L. G.; Díaz-Alvarado, F. A.; Ramírez-Márquez, C.; Ponce-Ortega, J. M. Green Ammonia Production: The Performance of Global Systems in Eco-Indicator 99 and Circular Economy Metrics. ACS Sustainable Chem. Eng. 2023, 12(33), 12652–12669. [Google Scholar] [CrossRef]
- Li, J.; Hua, Z.; Tian, L.; Chen, P.; Dong, H. Optimal Capacity Allocation for Life Cycle Multiobjective Integrated Energy Systems Considering Capacity Tariffs and Eco-Indicator 99. Sustainability 2024, 16, 8930. [Google Scholar] [CrossRef]
- Norgate, T. E.; Jahanshahi, S.; Rankin, W. J. Assessing the environmental impact of metal production processes. J. Cleaner Prod. 2007, 15, 838–848. [Google Scholar] [CrossRef]
- Lithner, D. Environmental and health hazards of chemicals in plastic polymers and products; University of Gothenburg: Sweden, 2011-05-06. [Google Scholar]
- Nadal, M.; Rovira, J.; Díaz-Ferrero, J.; Schuhmacher, M.; Domingo, J. L. Human exposure to environmental pollutants after a tire landfill fire in Spain: Health risks. Environ. Int. 2016, 97, 37–44. [Google Scholar] [CrossRef] [PubMed]
- O'neill, T. J. Life cycle assessment and environmental impact of polymeric products. Polym. Int. 2004, 53(9), 1395–1396. [Google Scholar]
- Arena, U.; Ardolino, F. Technical and environmental performances of alternative treatments for challenging plastics waste. Resour. Conserv. Recycl. 2022, 183, 106379. [Google Scholar] [CrossRef]
- Bisinella, V.; Christensen, T. H.; Astrup, T. F. Future scenarios and life cycle assessment: systematic review and recommendations. Int. J. Life Cycle Ass. 2021, 26, 2143–2170. [Google Scholar] [CrossRef]
- Hauschild, M. Z.; Dreyer, L. C.; Jørgensen, A. Assessing social impacts in a life cycle perspective—Lessons learned. CIRP annals 2008, 57(1), 21–24. [Google Scholar] [CrossRef]
- De Oliveira, C. T.; Dantas, T. E. T.; Soares, S. R. Nano and micro level circular economy indicators: Assisting decision-makers in circularity assessments. Sustaine Prod. Consum. 2021, 26, 455–468. [Google Scholar] [CrossRef]
- Begum, S.; Ashfaq, M.; Xia, E.; Awan, U. Does green transformational leadership lead to green innovation? The role of green thinking and creative process engagement. Bus. Strateg. Environ. 2022, 31, 580–597. [Google Scholar] [CrossRef]
- Qi, D.; Chen, H.; Hu, L.; Sun, J. Multimethod Analysis of Heavy Metal Pollution and Source Apportionment in a Southeastern Chinese Region. Appl. Sci. 2024, 14, 10559. [Google Scholar] [CrossRef]
- De Canio, F.; Martinelli, E.; Endrighi, E. Enhancing consumers' pro-environmental purchase intentions: the moderating role of environmental concern. Int. J. Retail Distrib. Manag. 2021, 49, 1312–1329. [Google Scholar] [CrossRef]
- Cornely, K.; Ascensão, G.; Ferreira, V.M. A Case Study on Integrating an Eco-Design Tool into the Construction Decision-Making Process. Appl. Sci. 2024, 14, 10583. [Google Scholar] [CrossRef]
- Khan, S. A. R.; Razzaq, A.; Yu, Z.; Miller, S. Retracted: Industry 4.0 and circular economy practices: A new era business strategies for environmental sustainability. Bus. Strateg. Environ. 2021, 30, 4001–4014. [Google Scholar] [CrossRef]
Figure 1.
LCA phases.
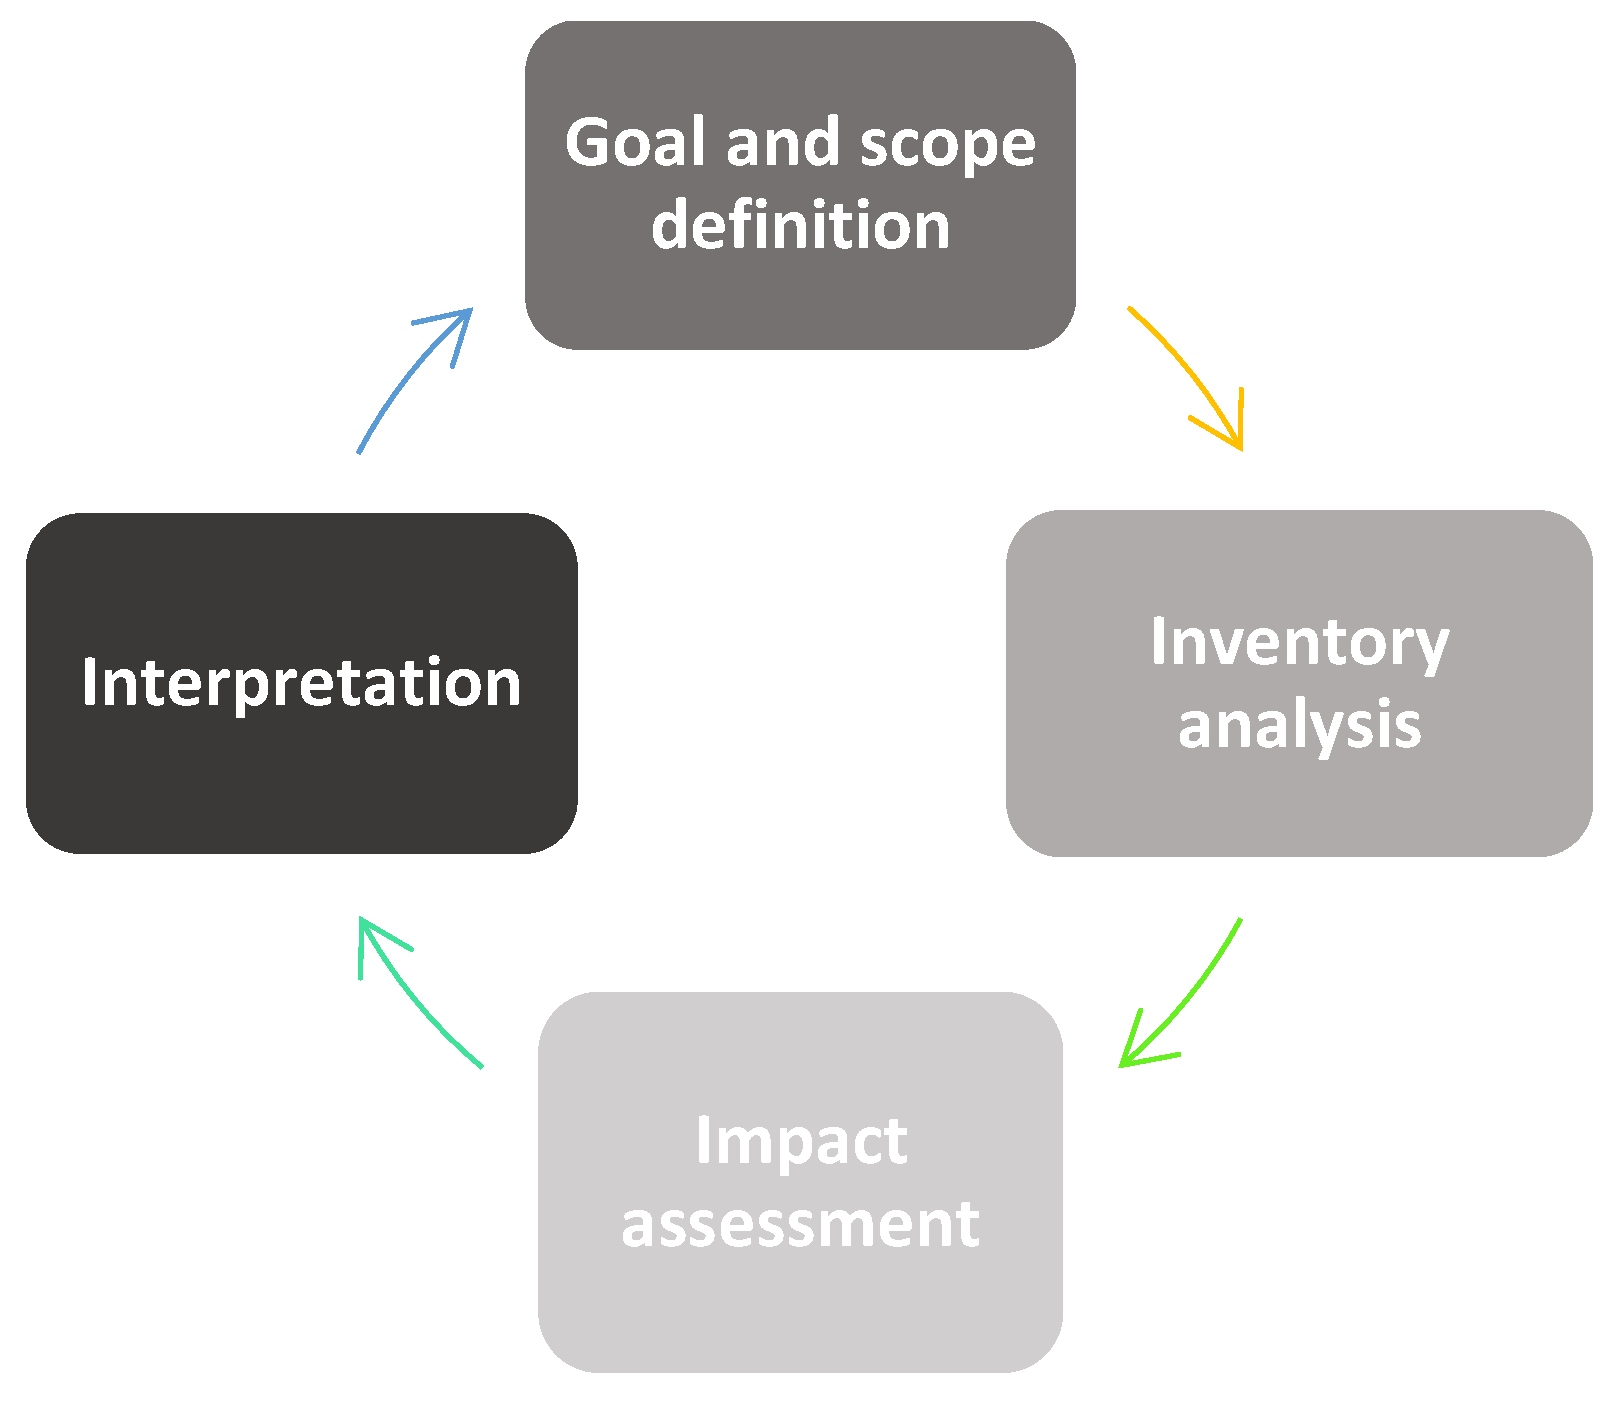
Figure 2.
Product system subprocesses.
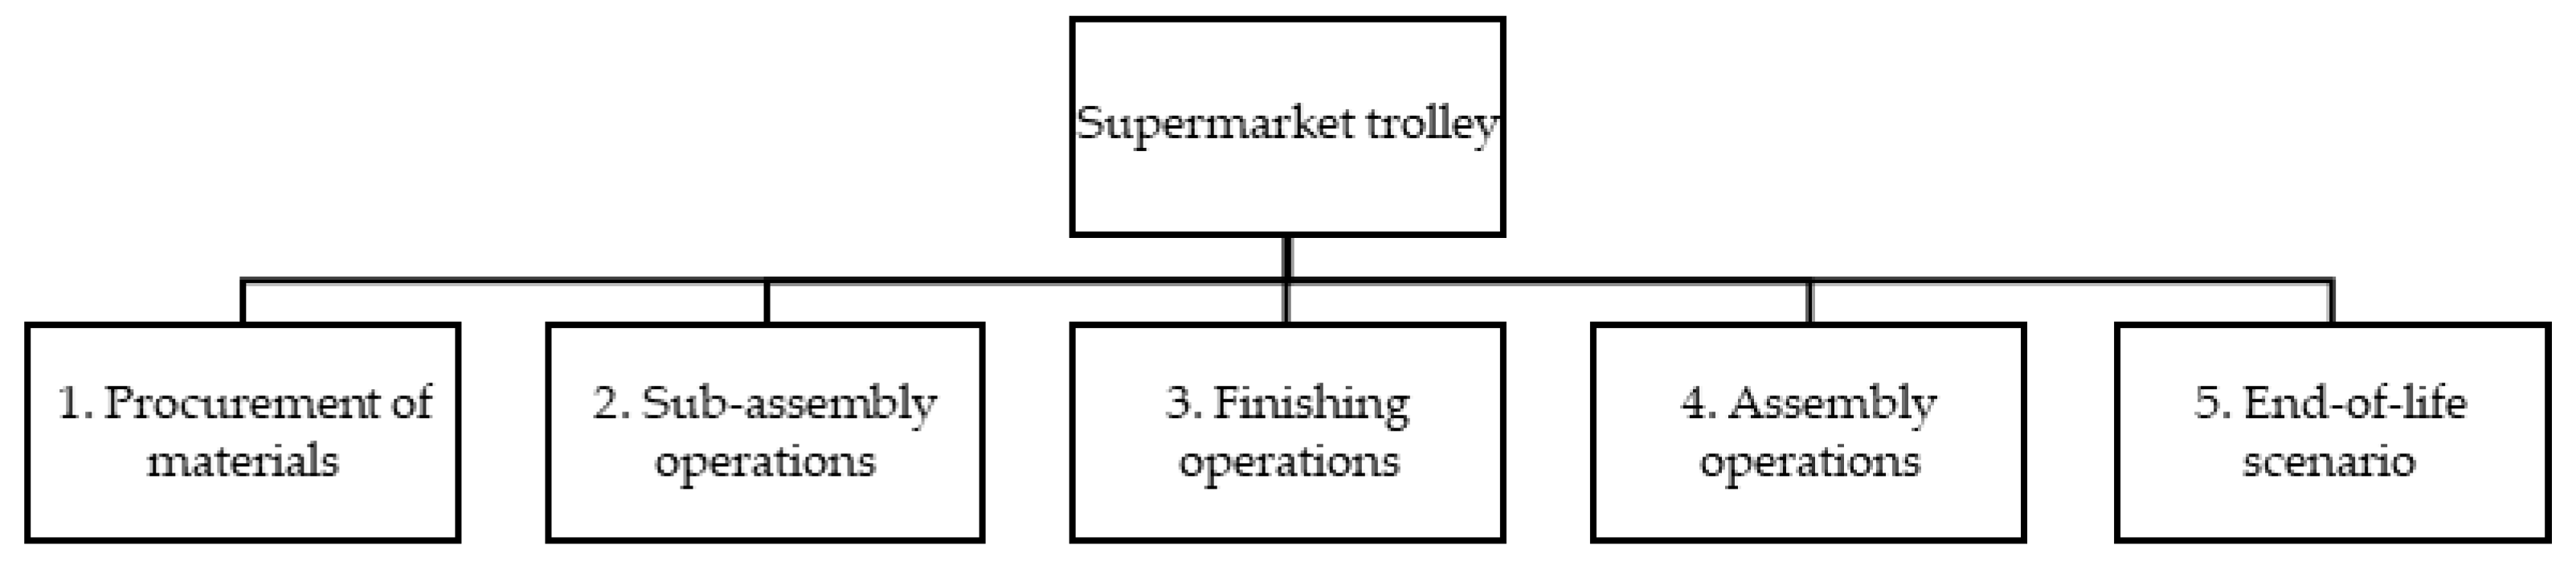
Figure 3.
Sub-process for obtaining materials for the metal trolley.
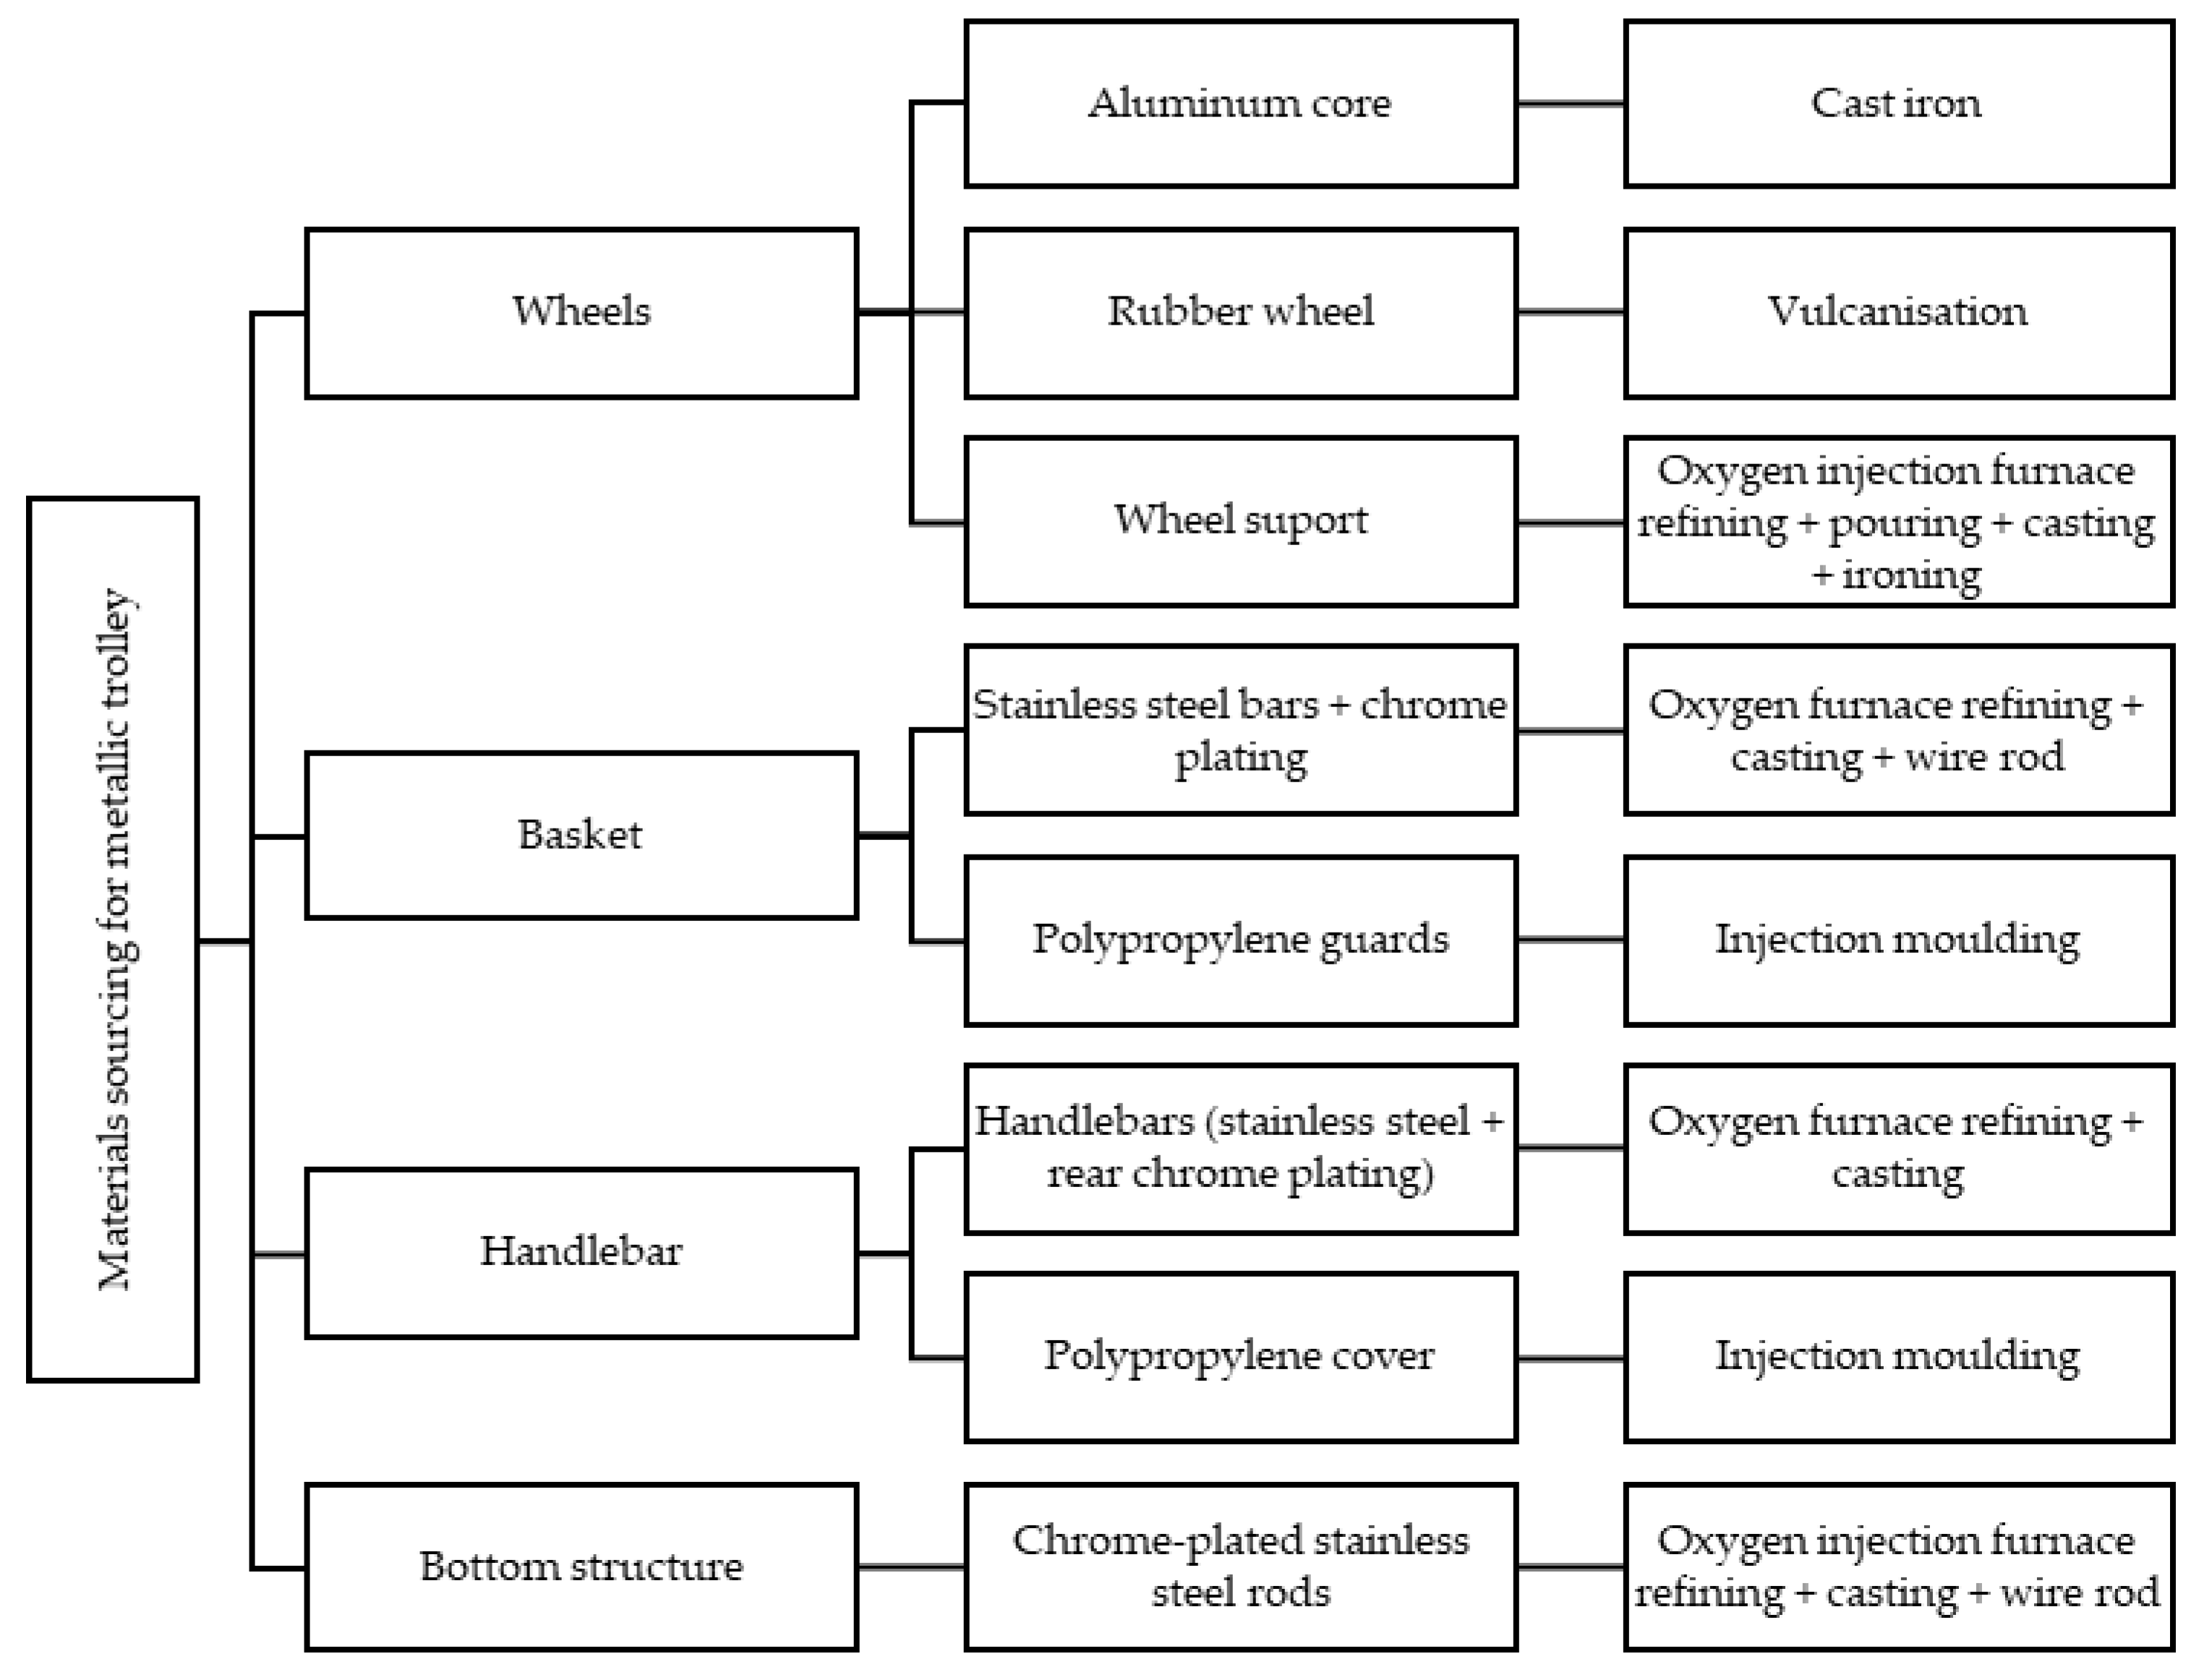
Figure 4.
Component’s tree, weights and materials for the metal trolley.
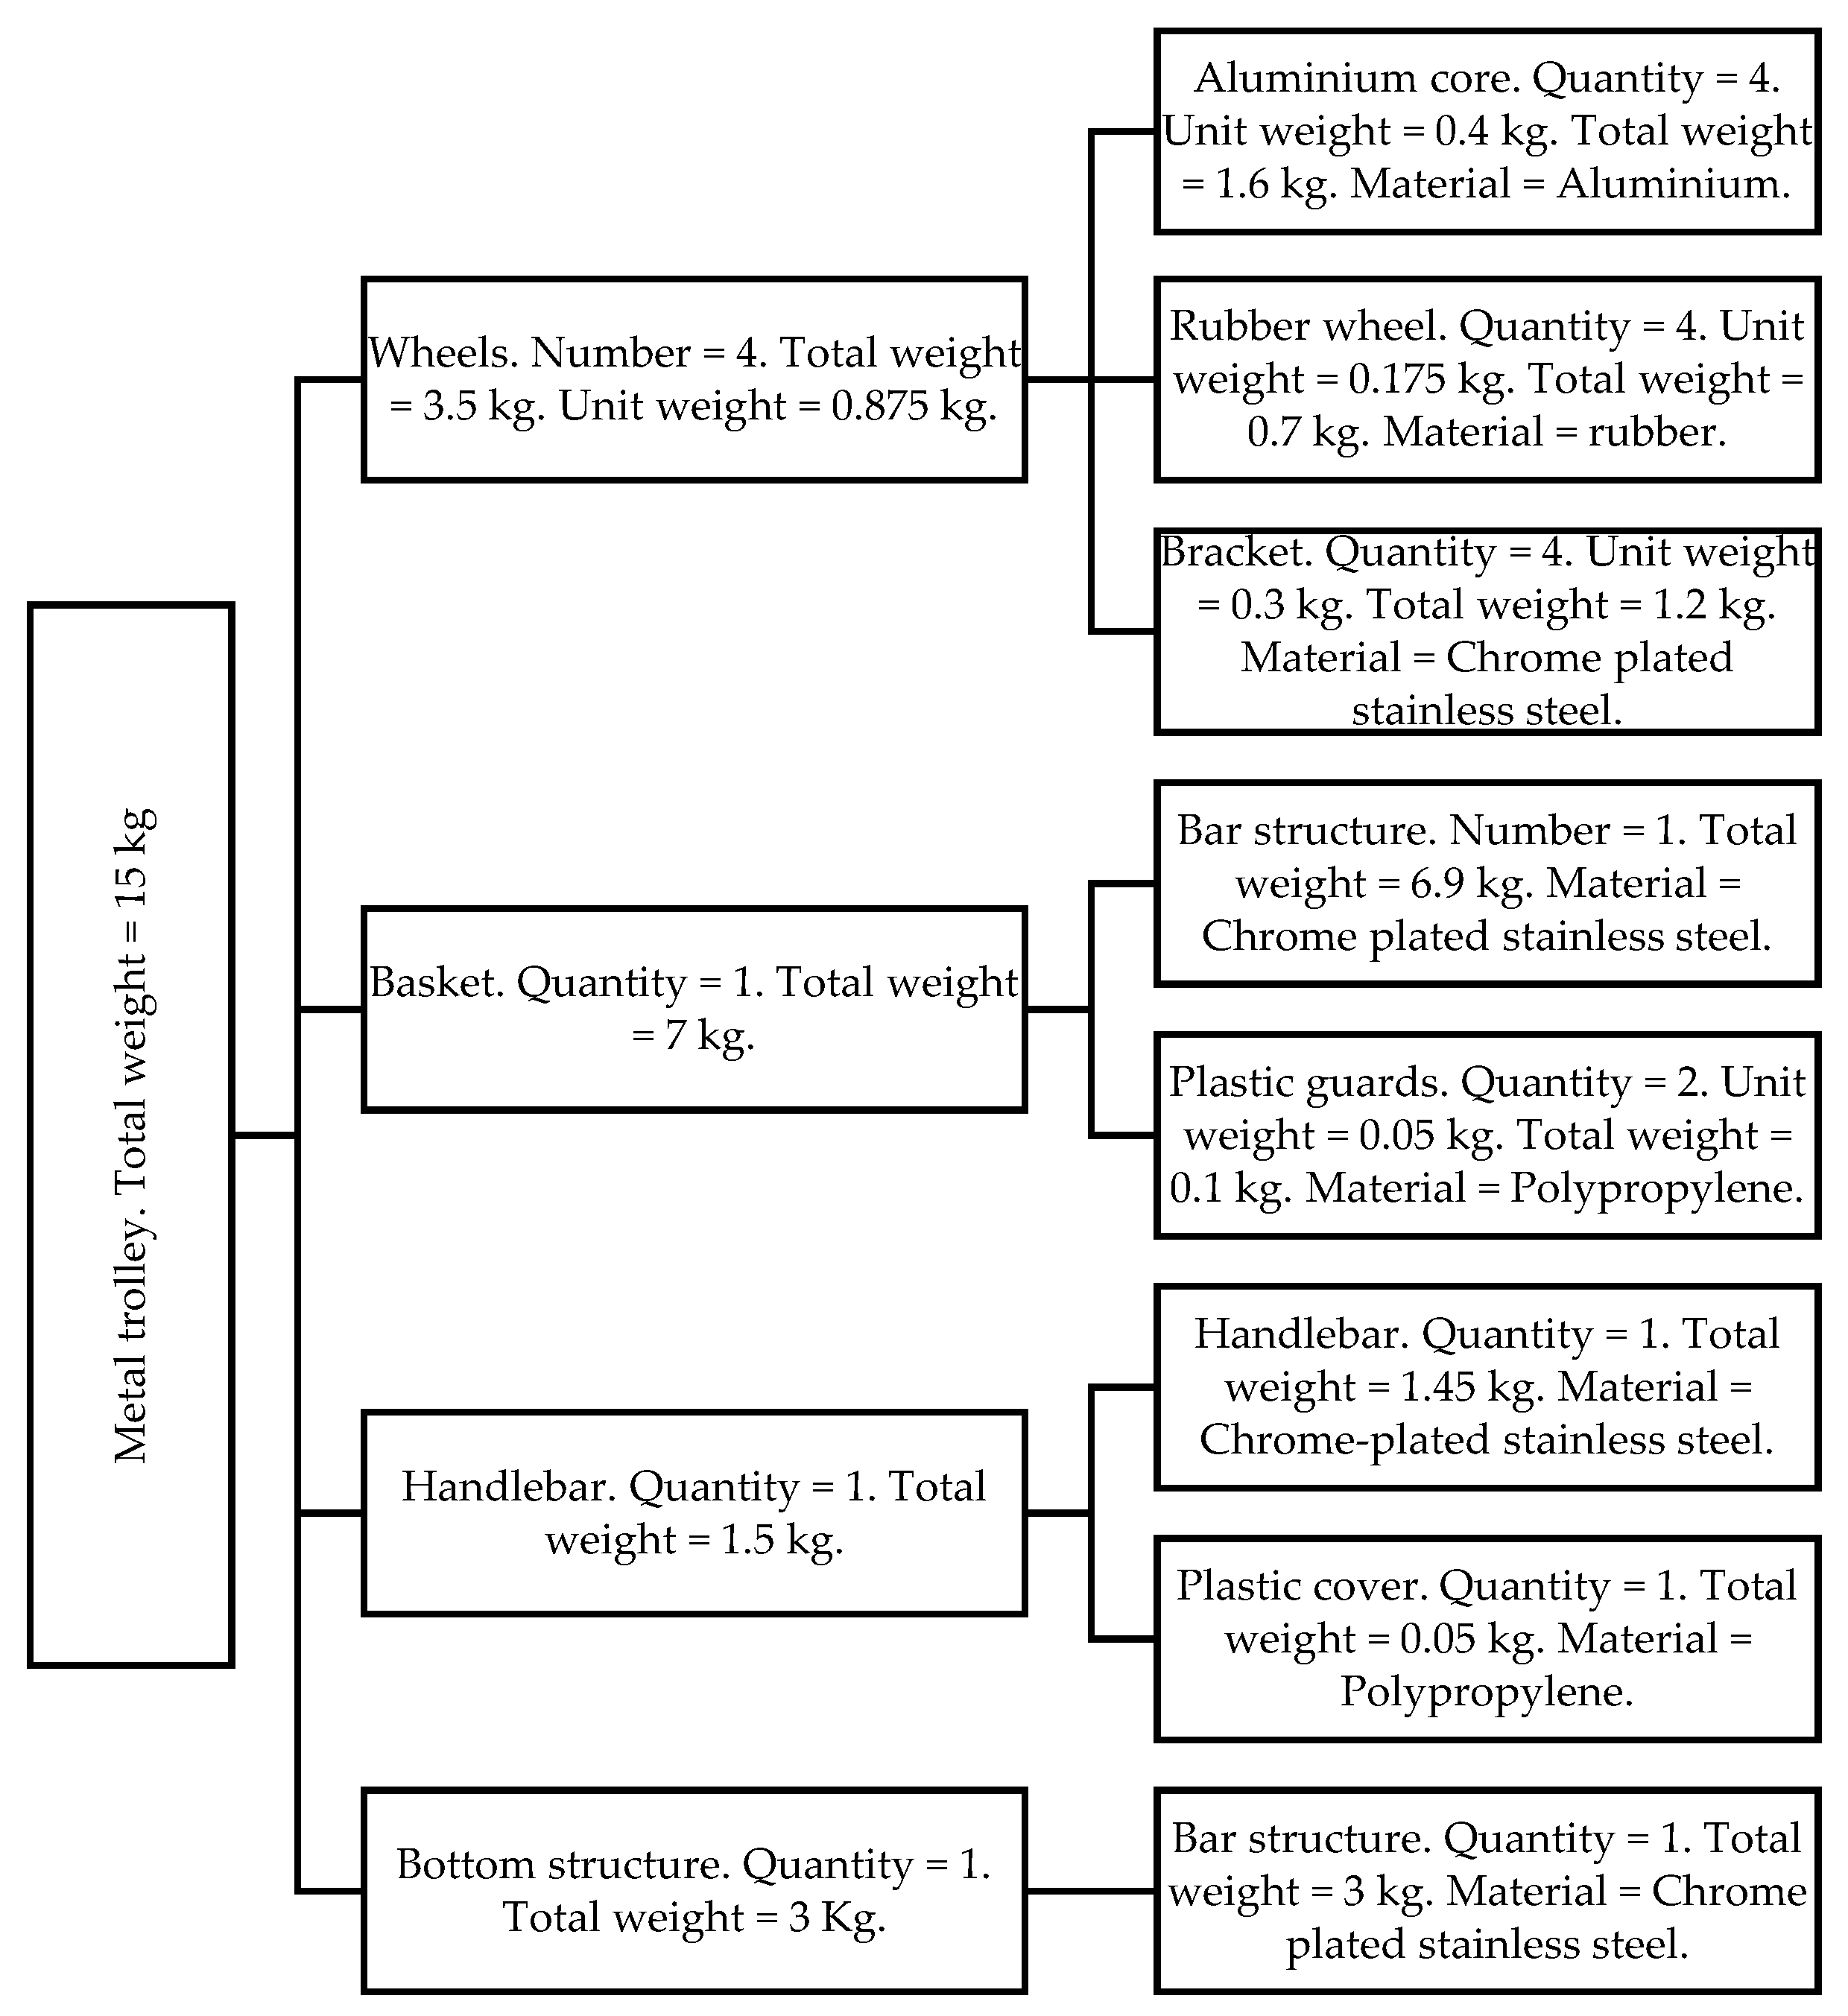
Figure 5.
Sub-process for obtaining materials for the polypropylene trolley.
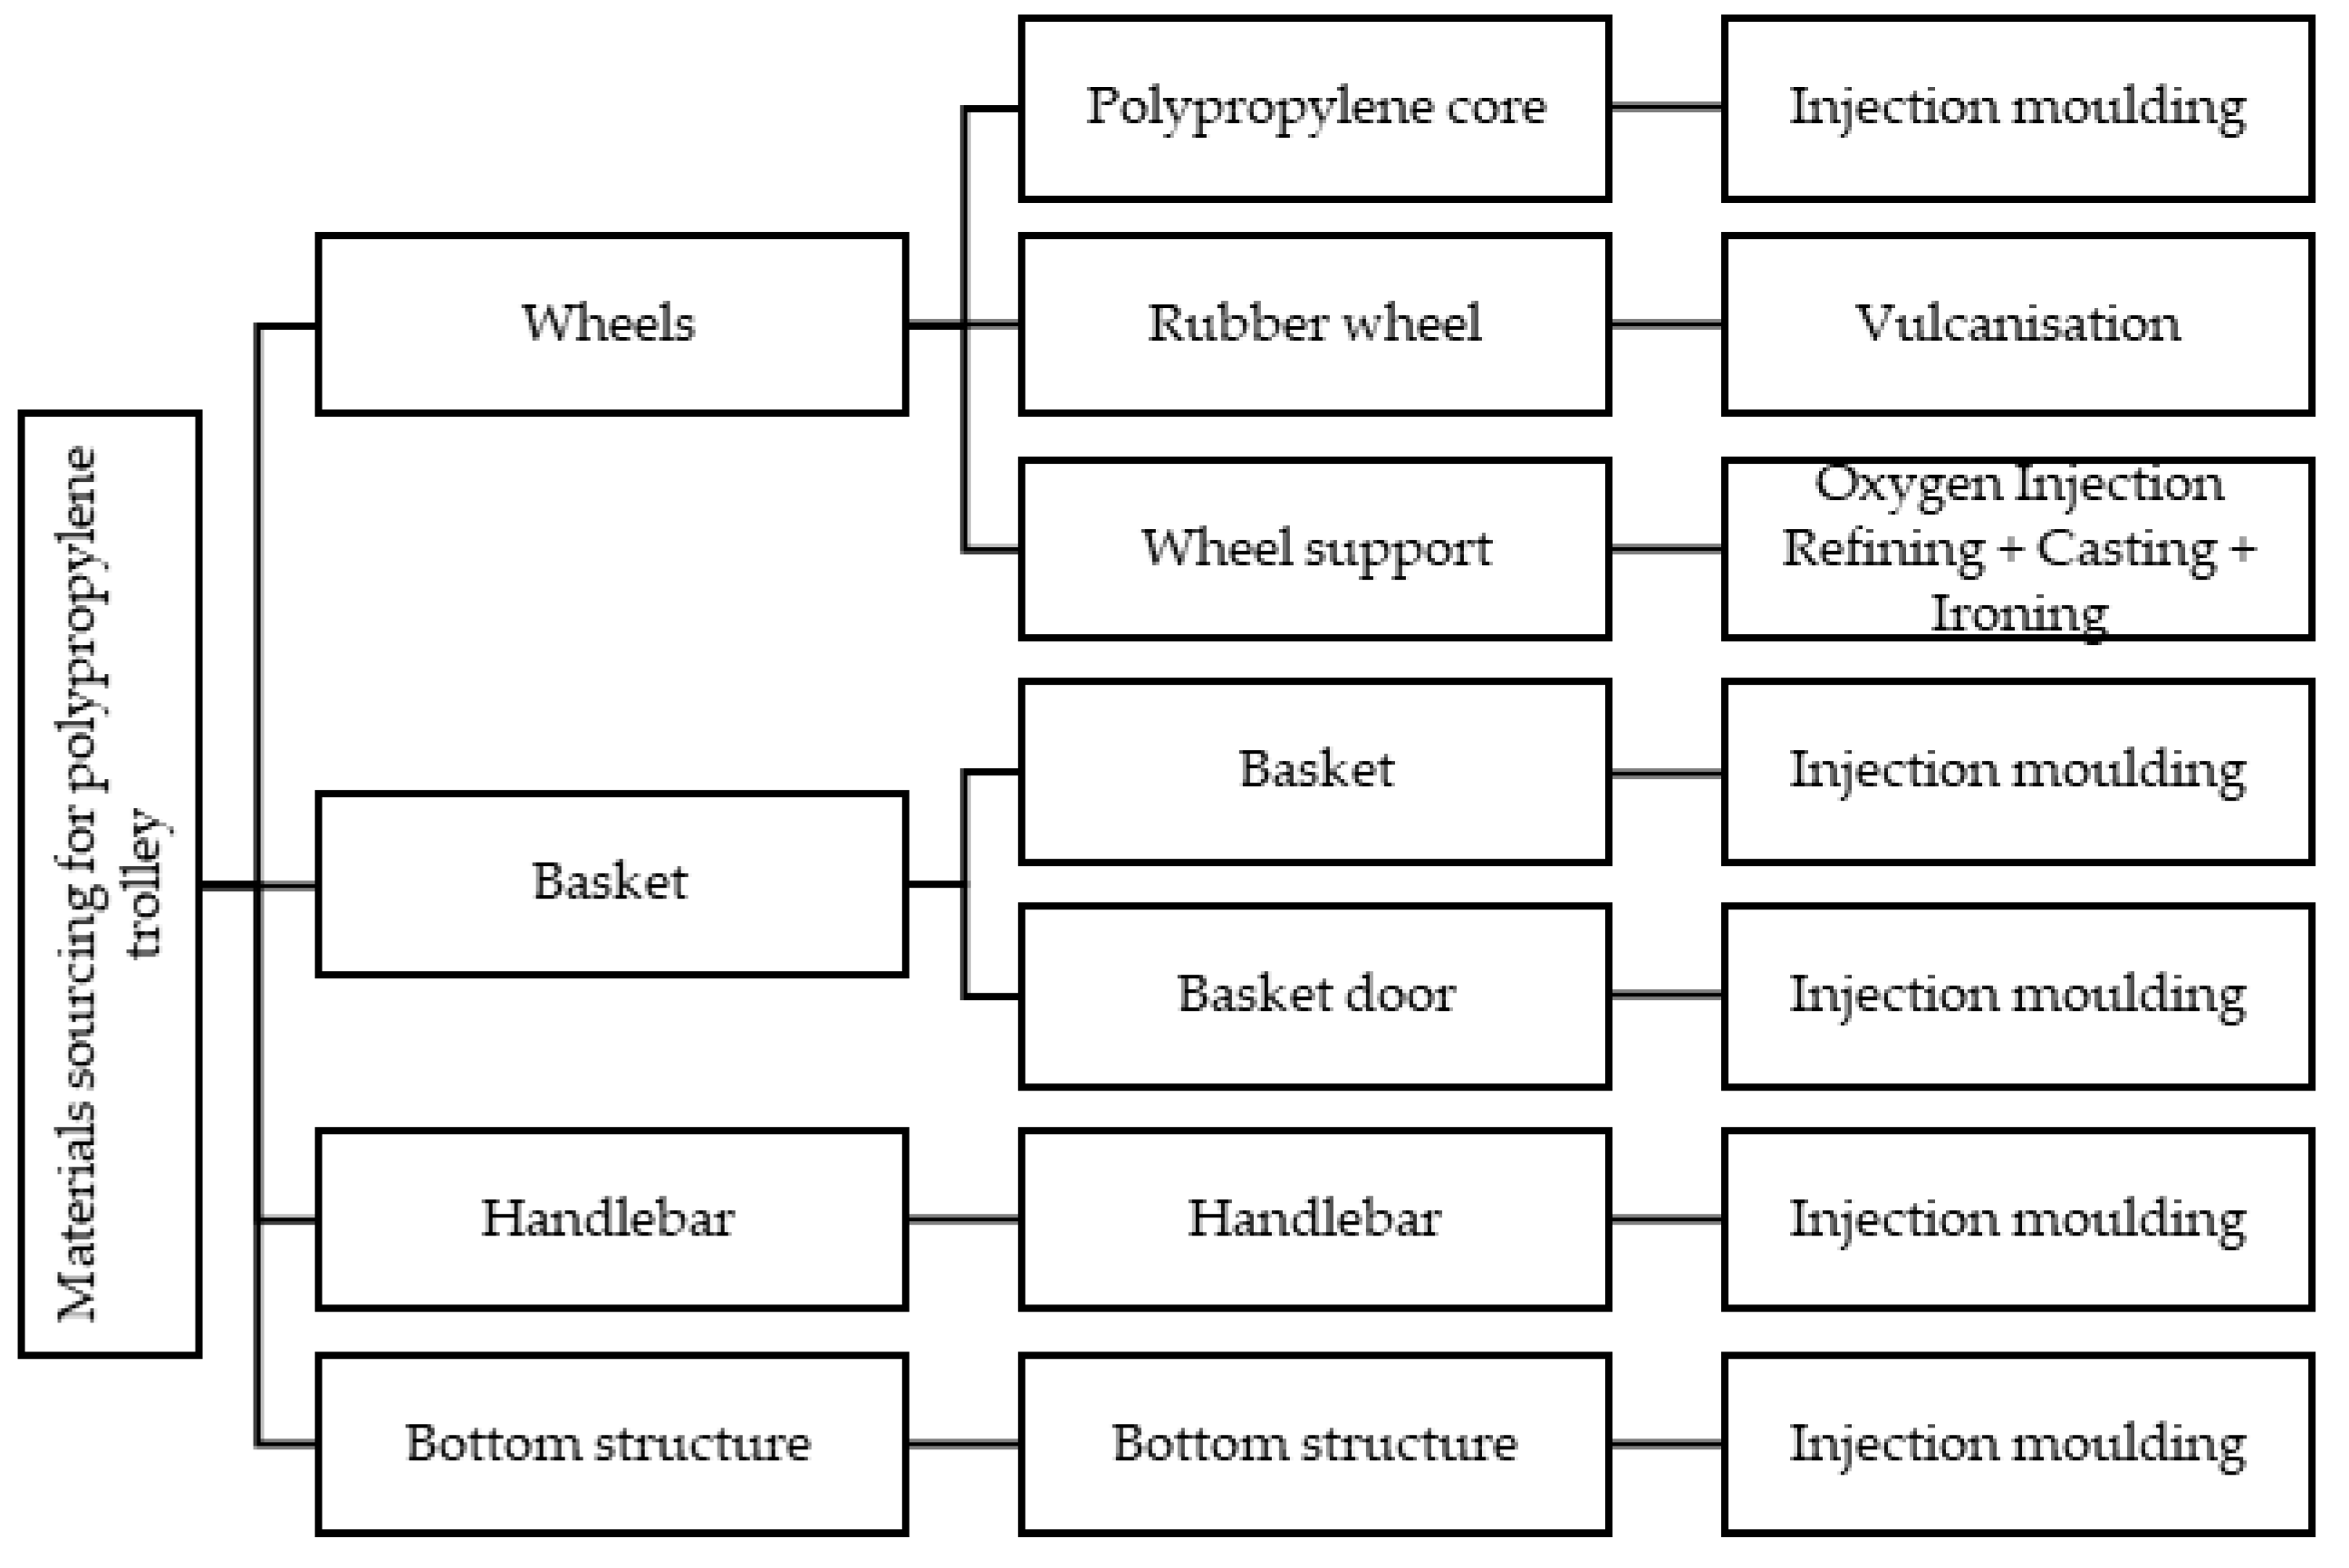
Figure 6.
Tree of components, weights and materials for the polypropylene trolley.
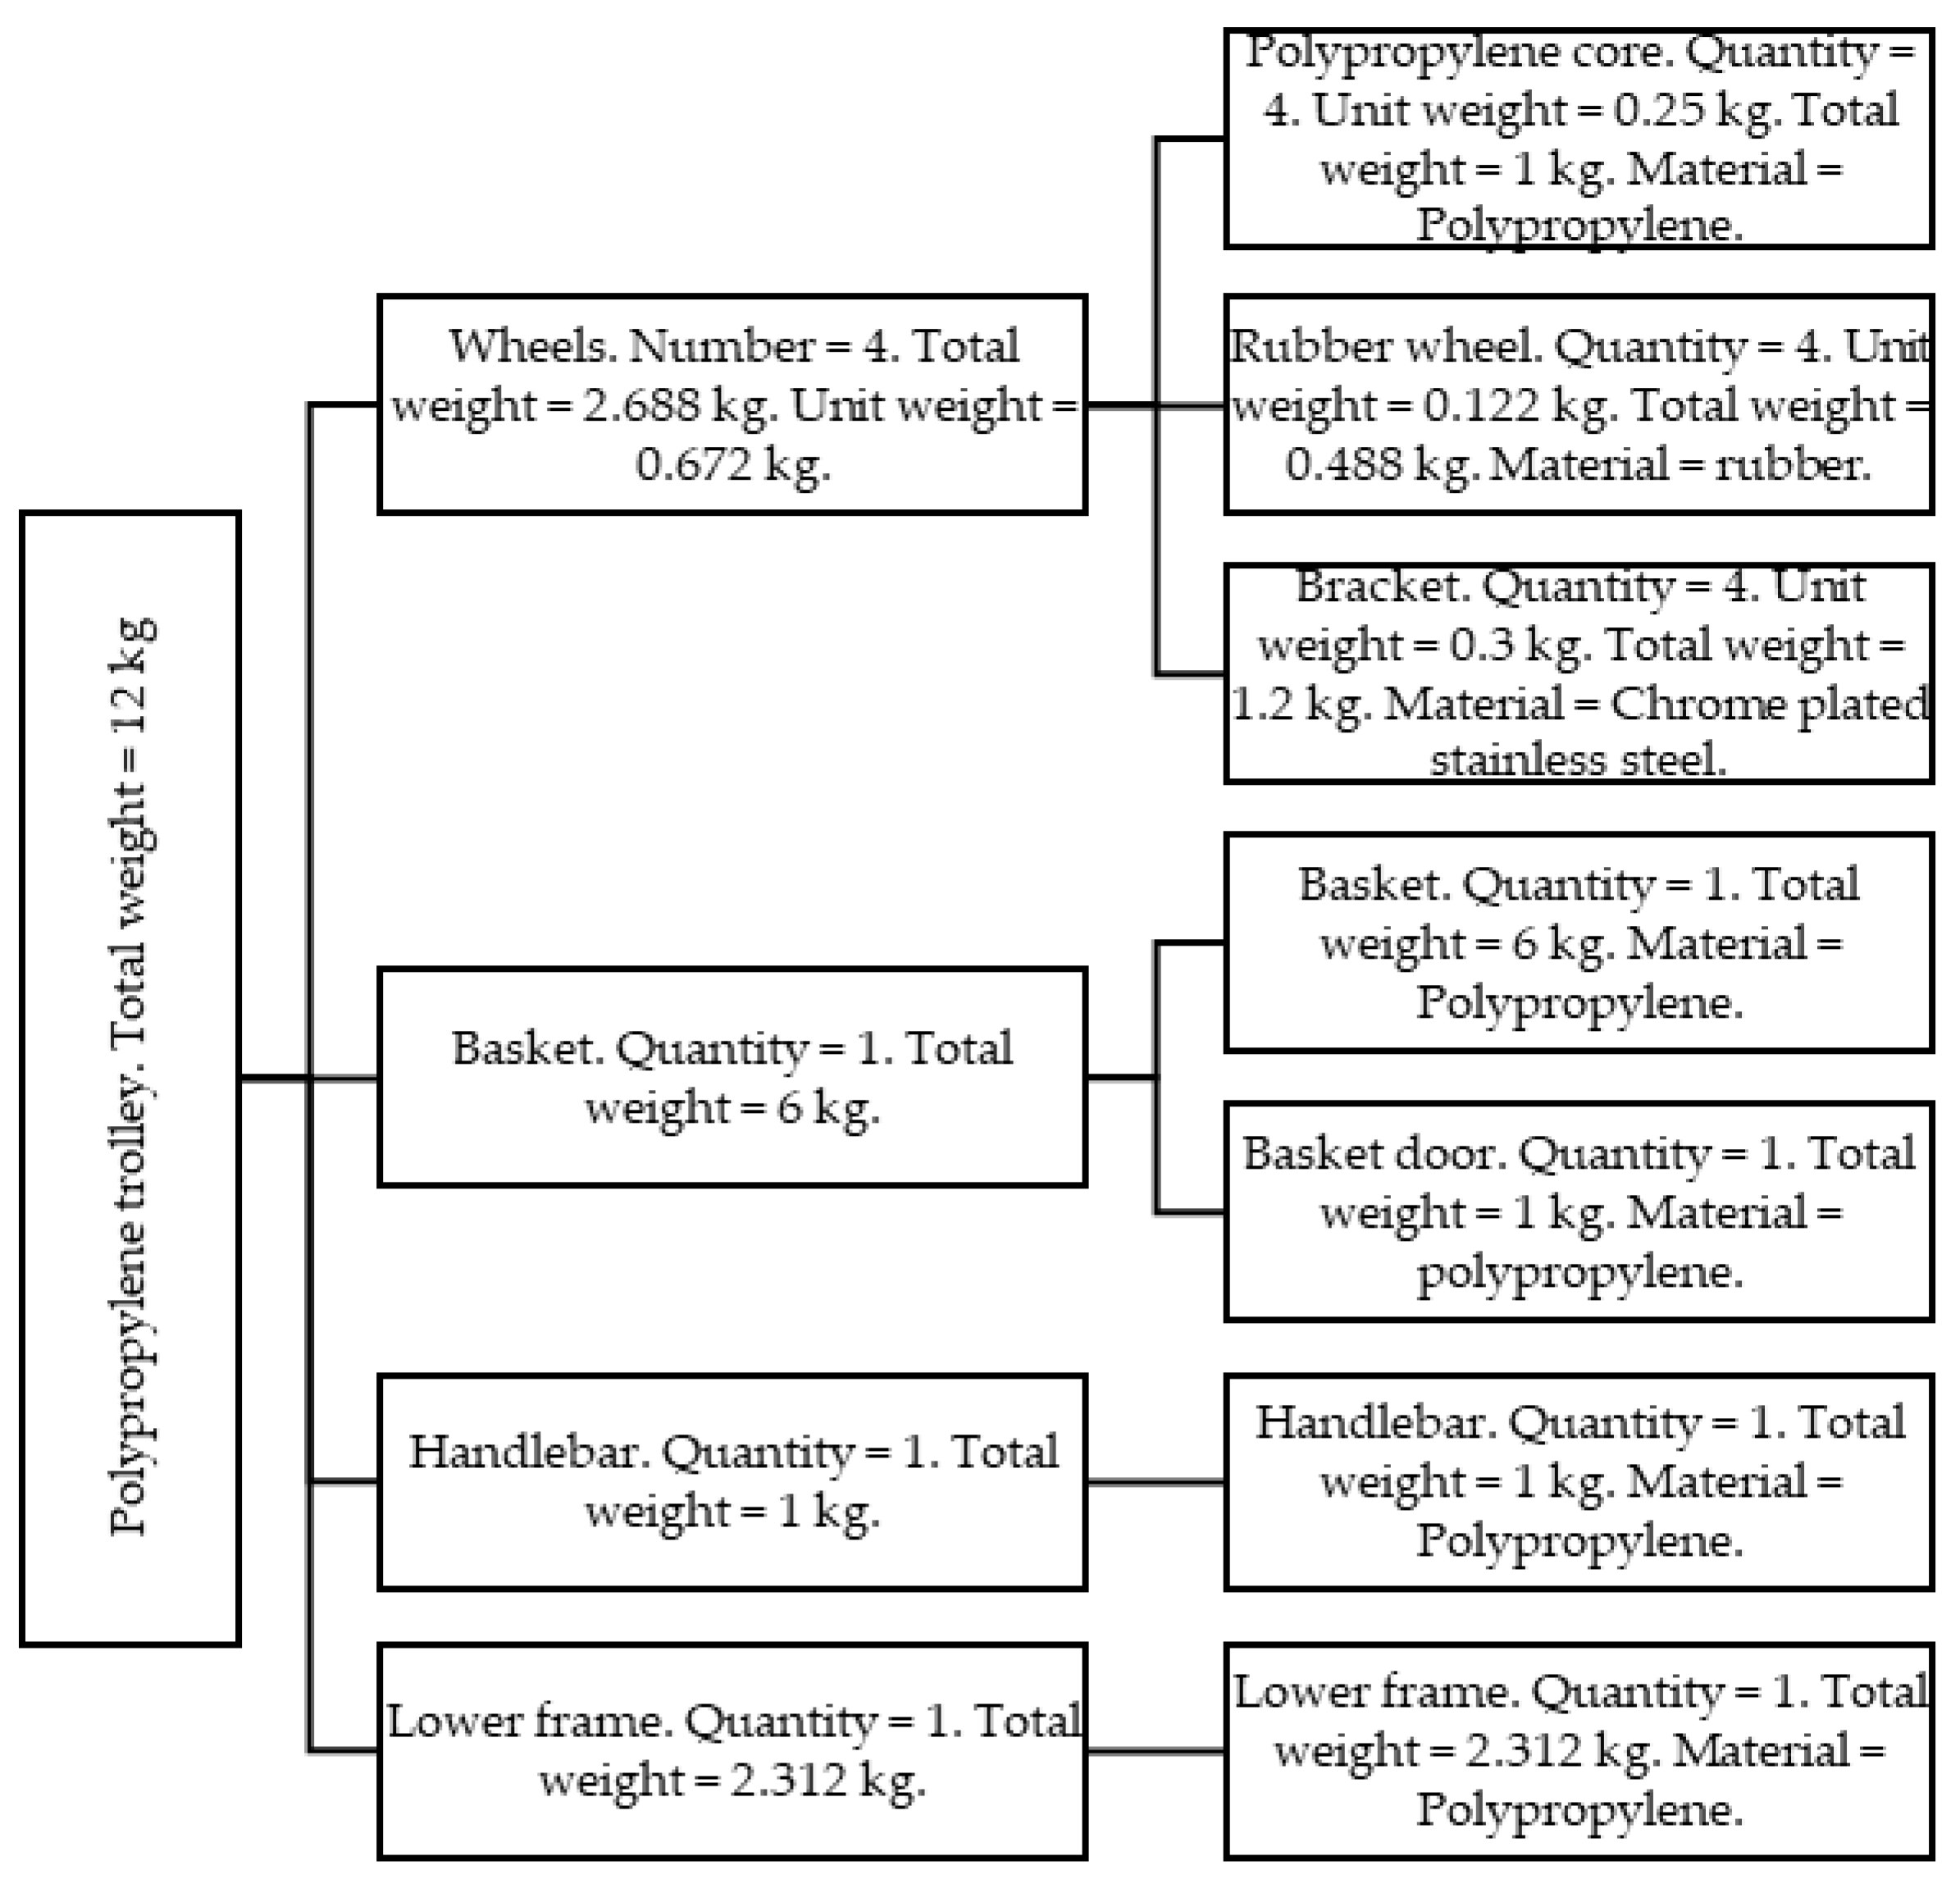
Figure 7.
Sub-processes of the metal trolley assembly operations phase.
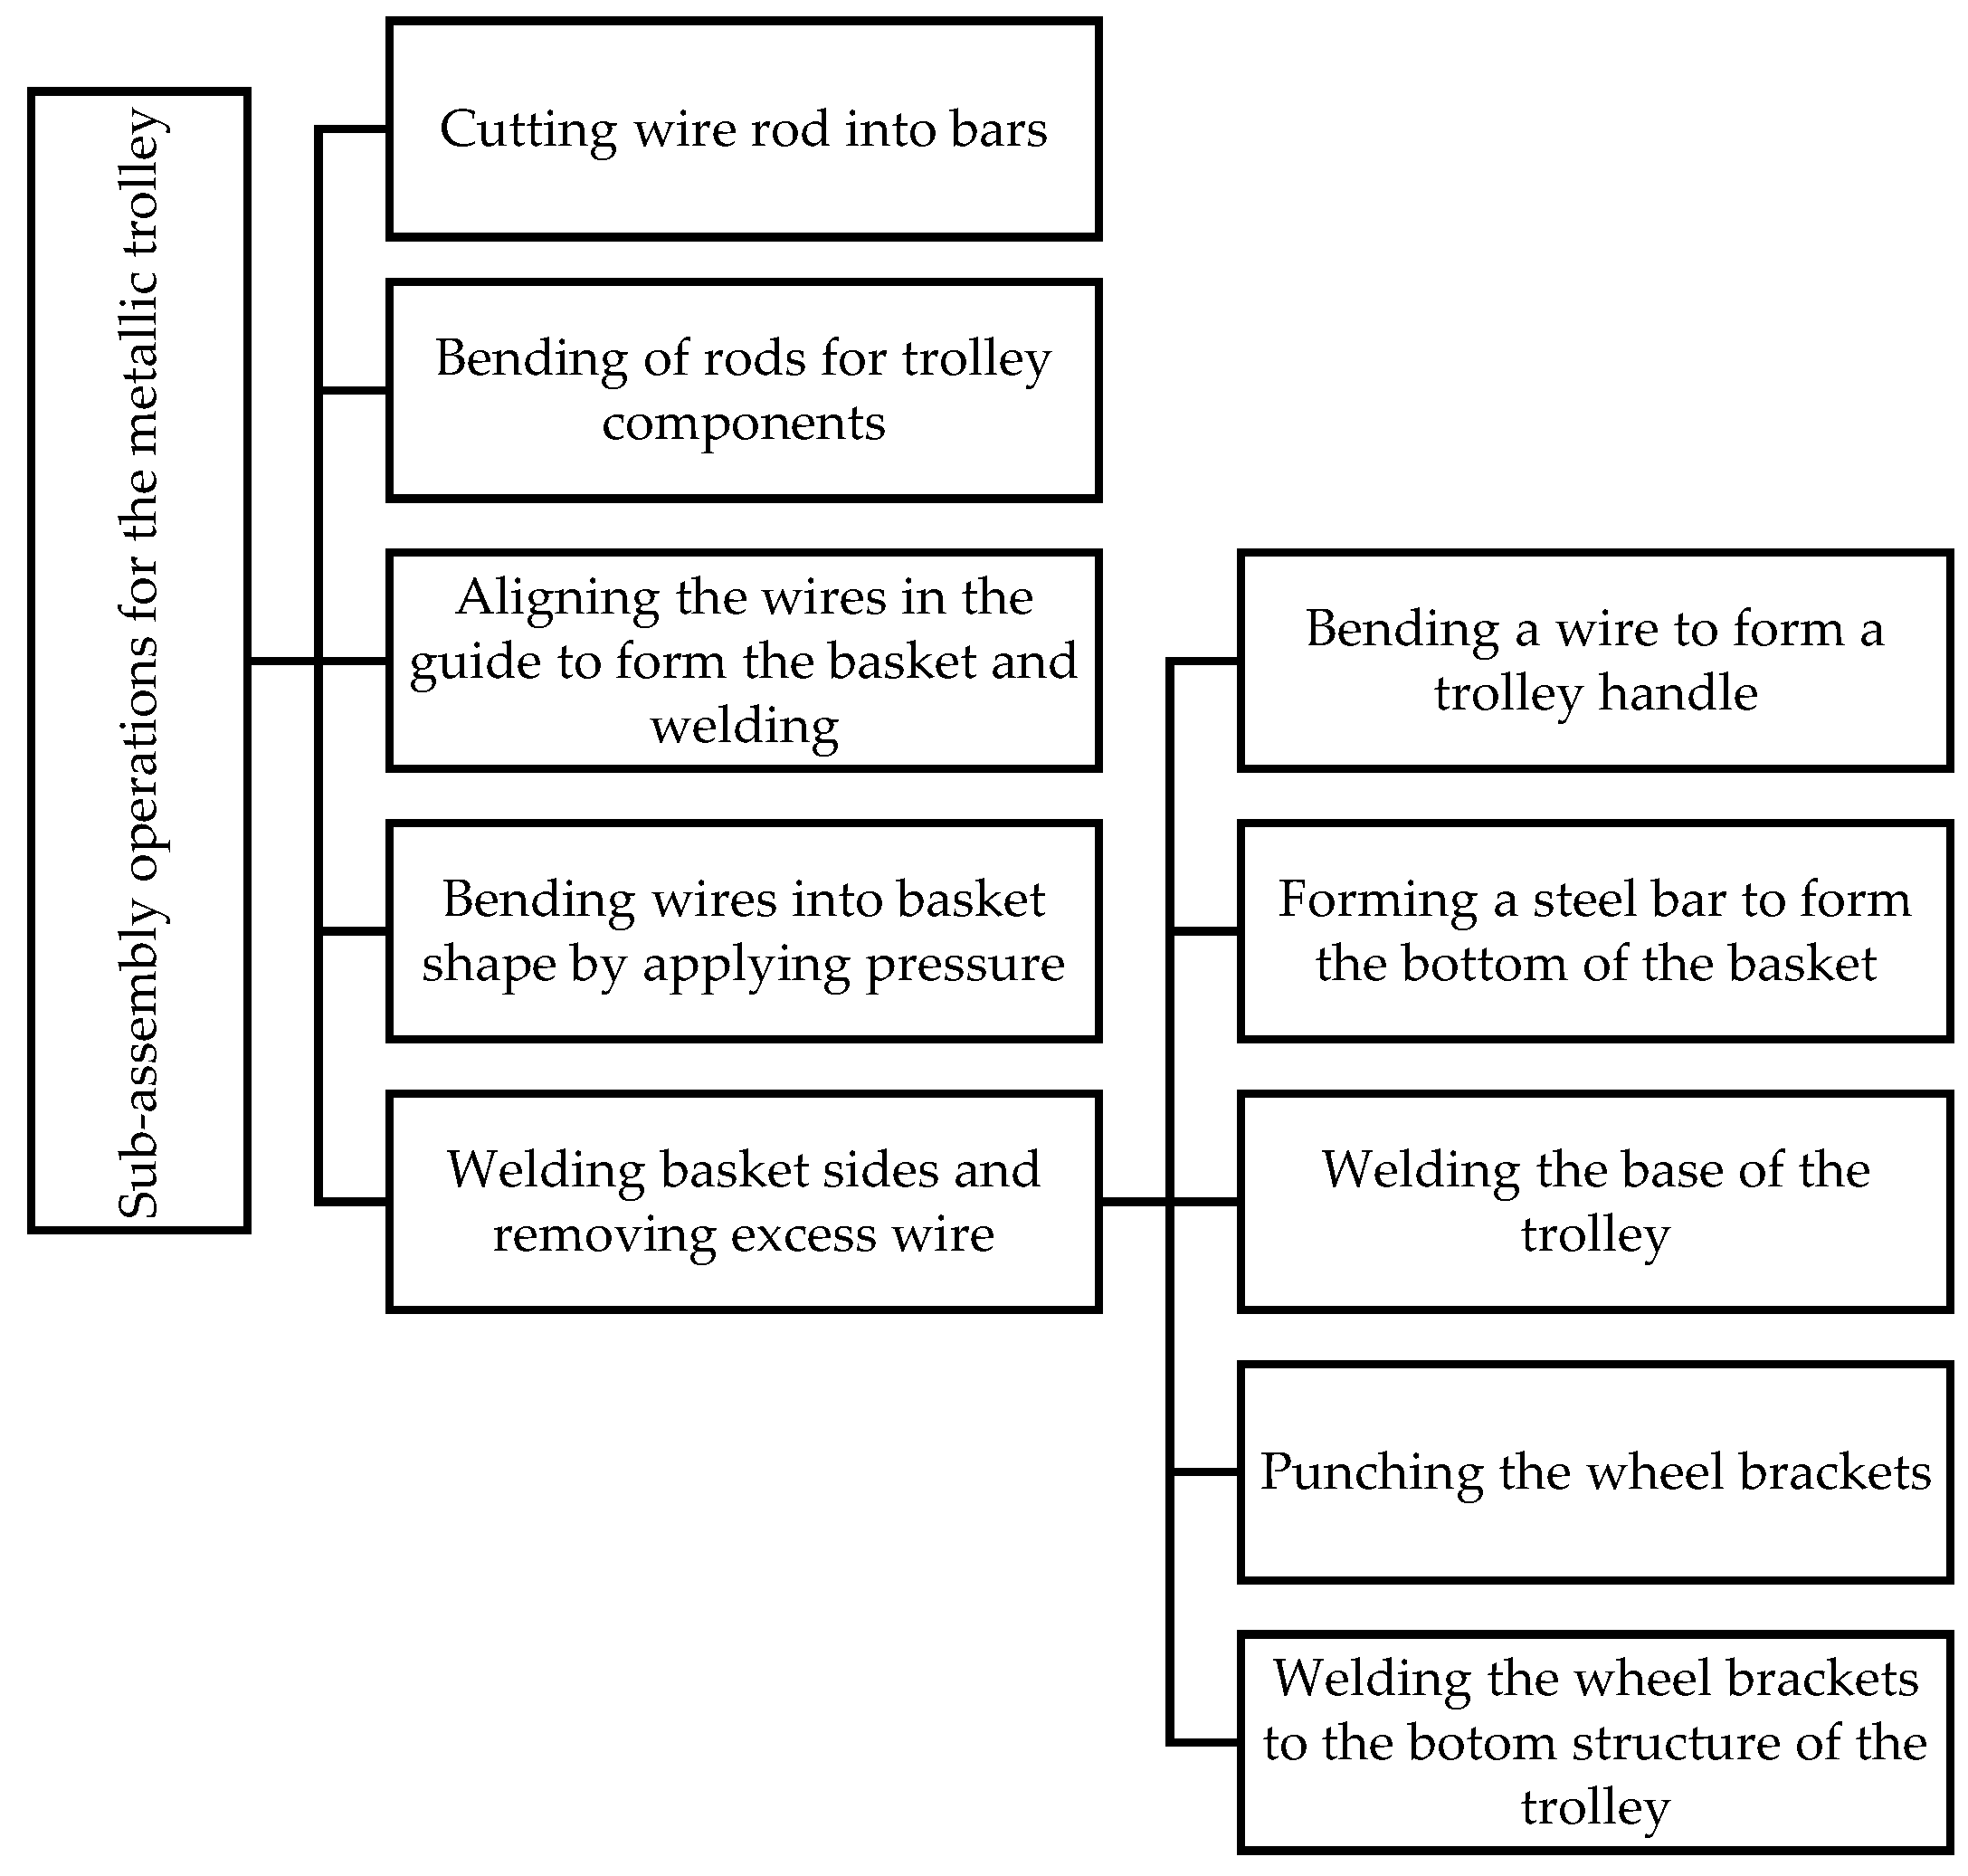
Figure 8.
Sub-processes of the polypropylene trolley assembly operations phase.
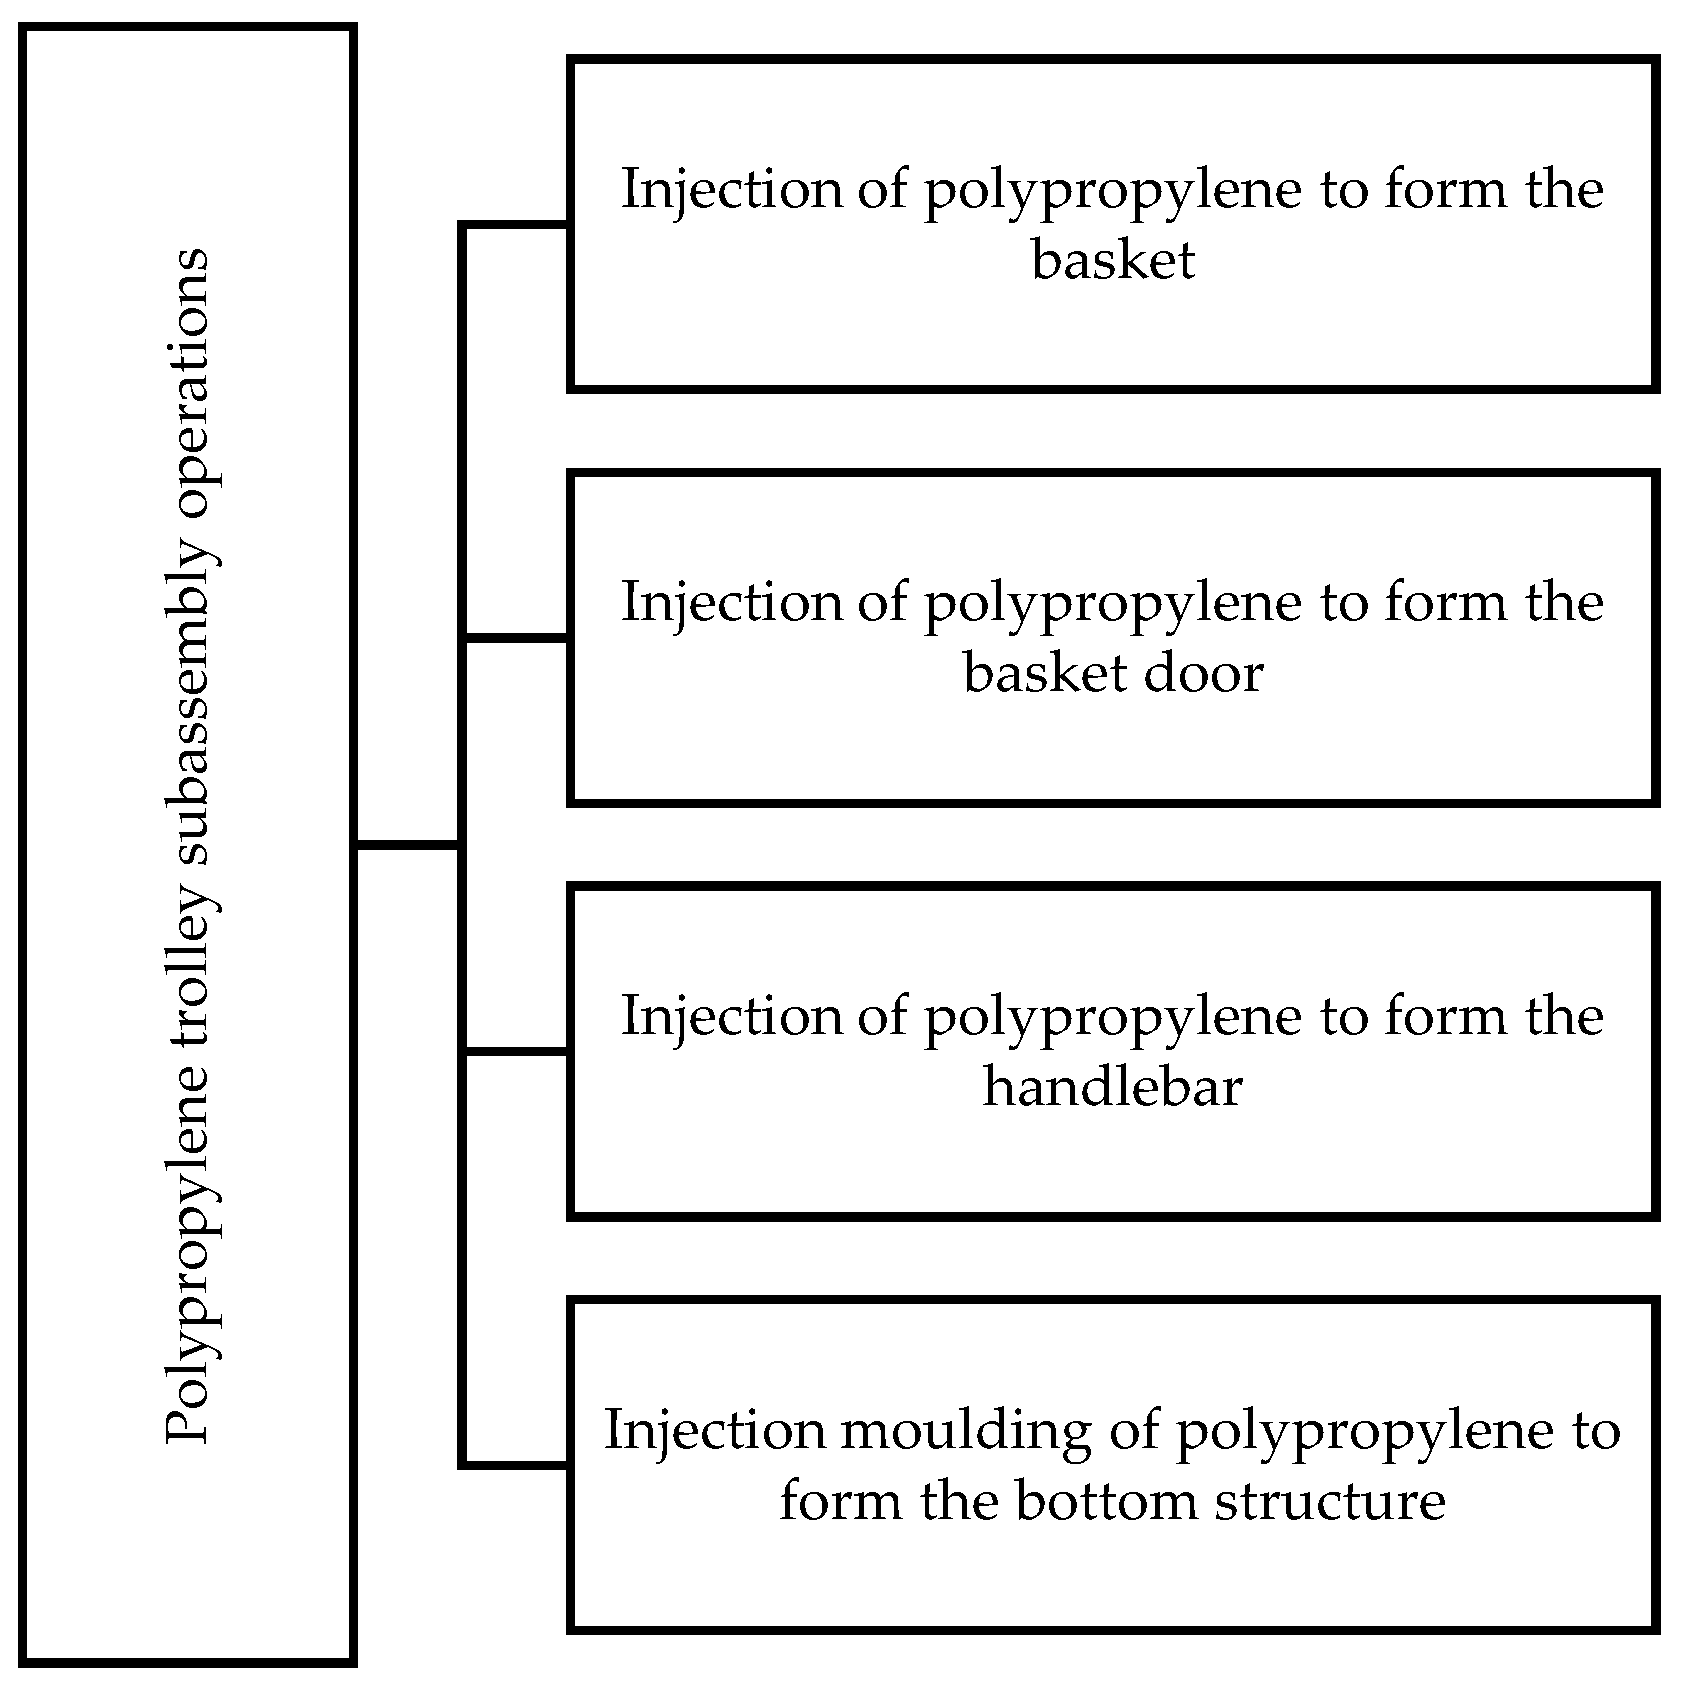
Figure 9.
Sub-processes of the finishing phase for the metal trolley.
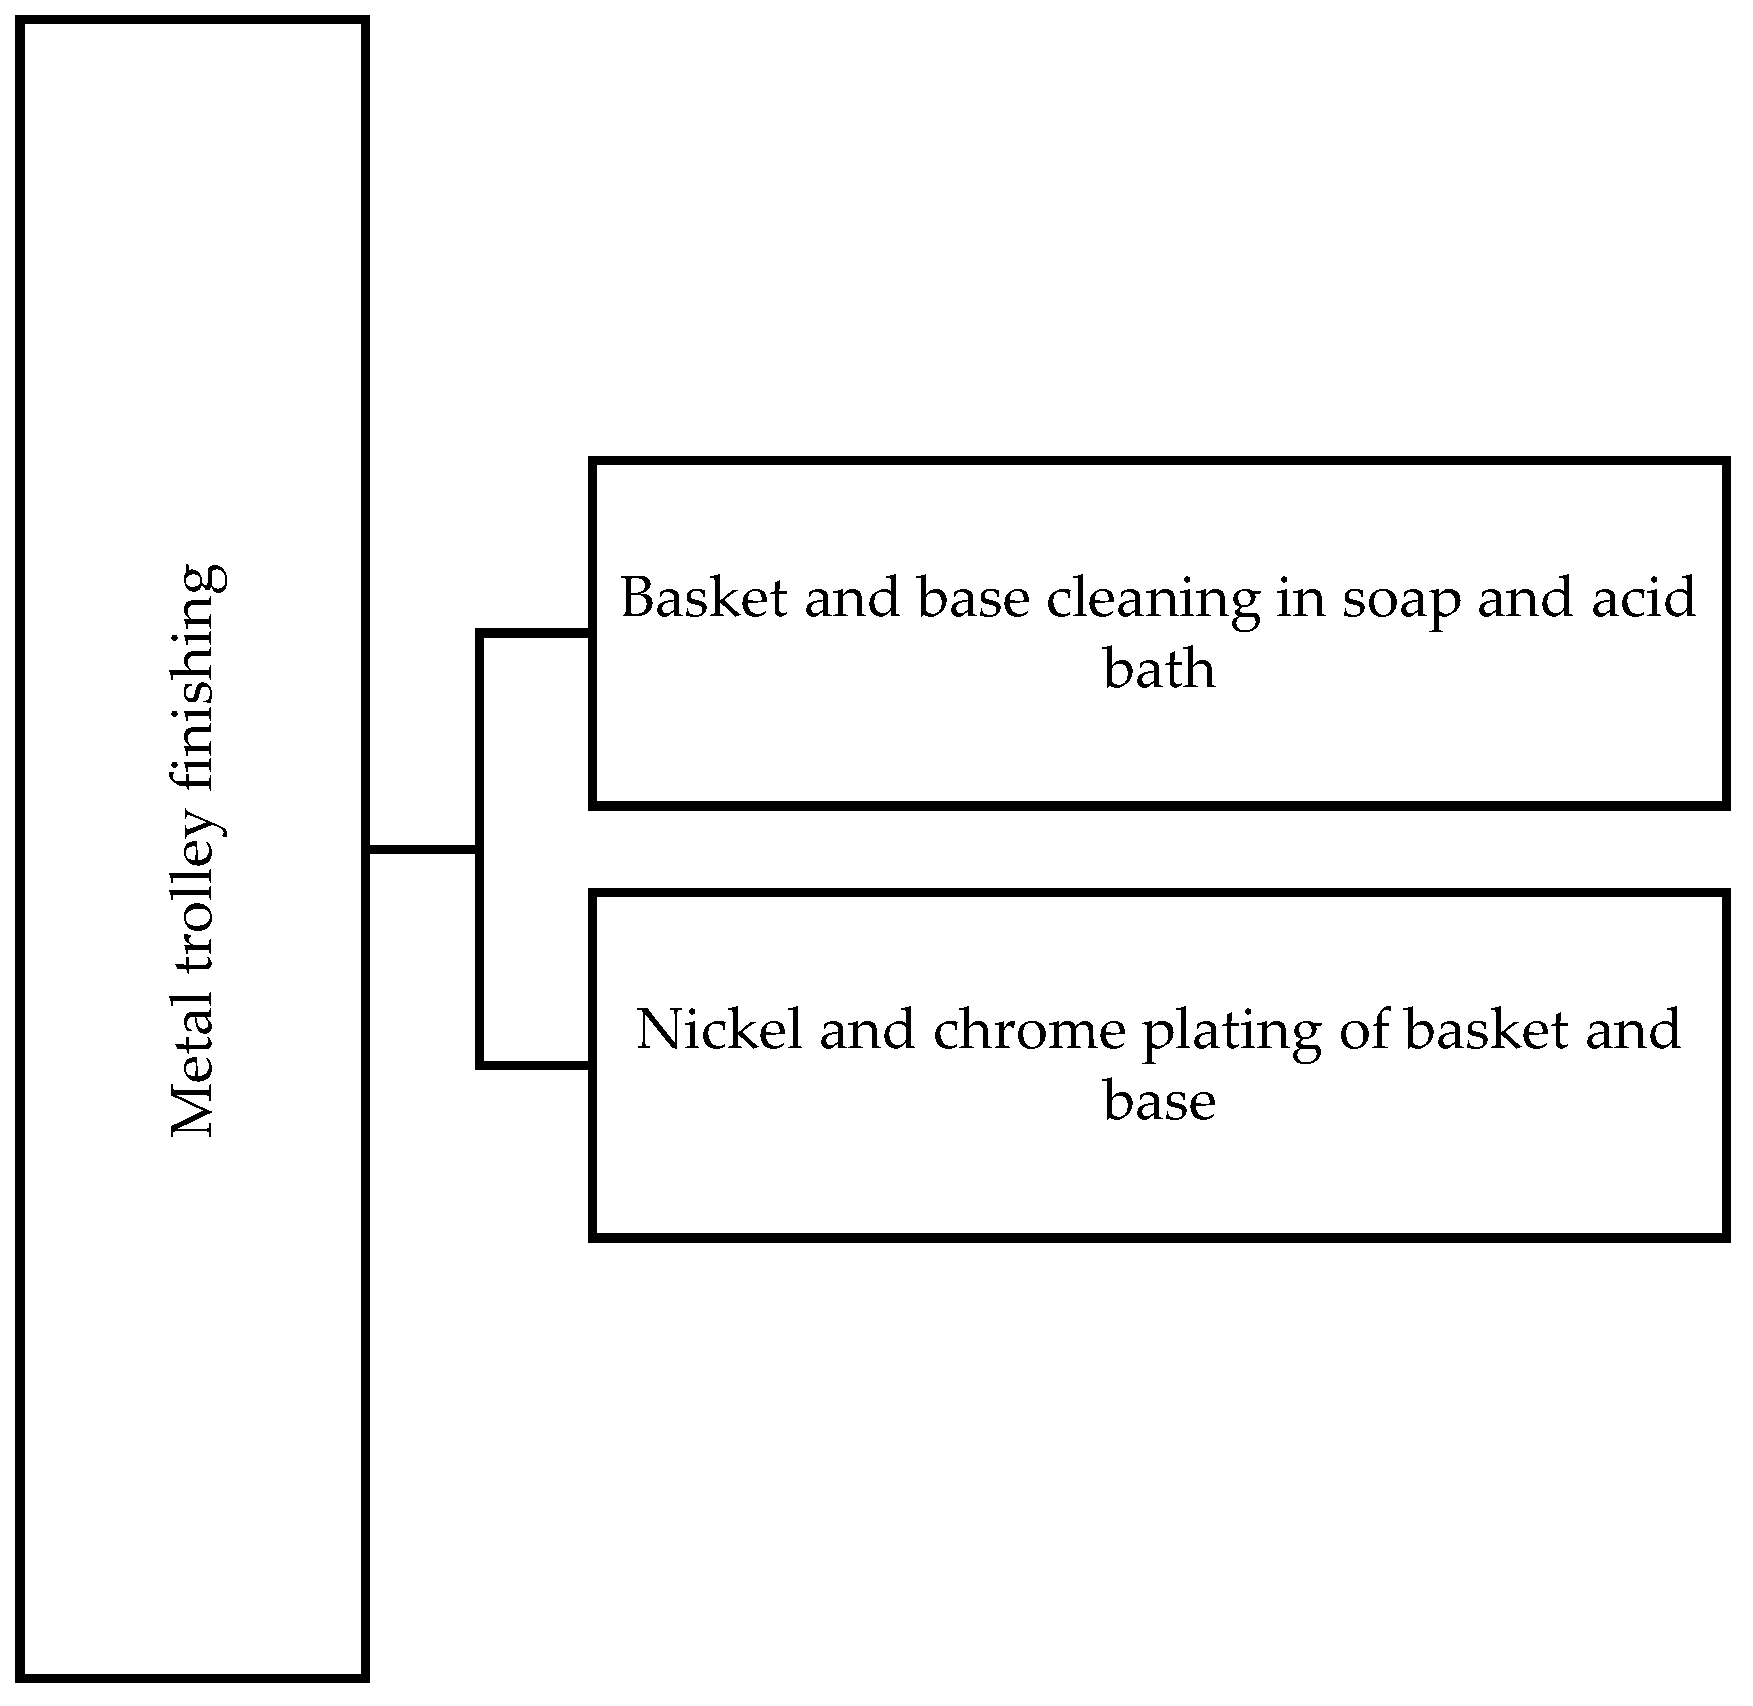
Figure 10.
Sub-processes of the finishing phase for the metal trolley.
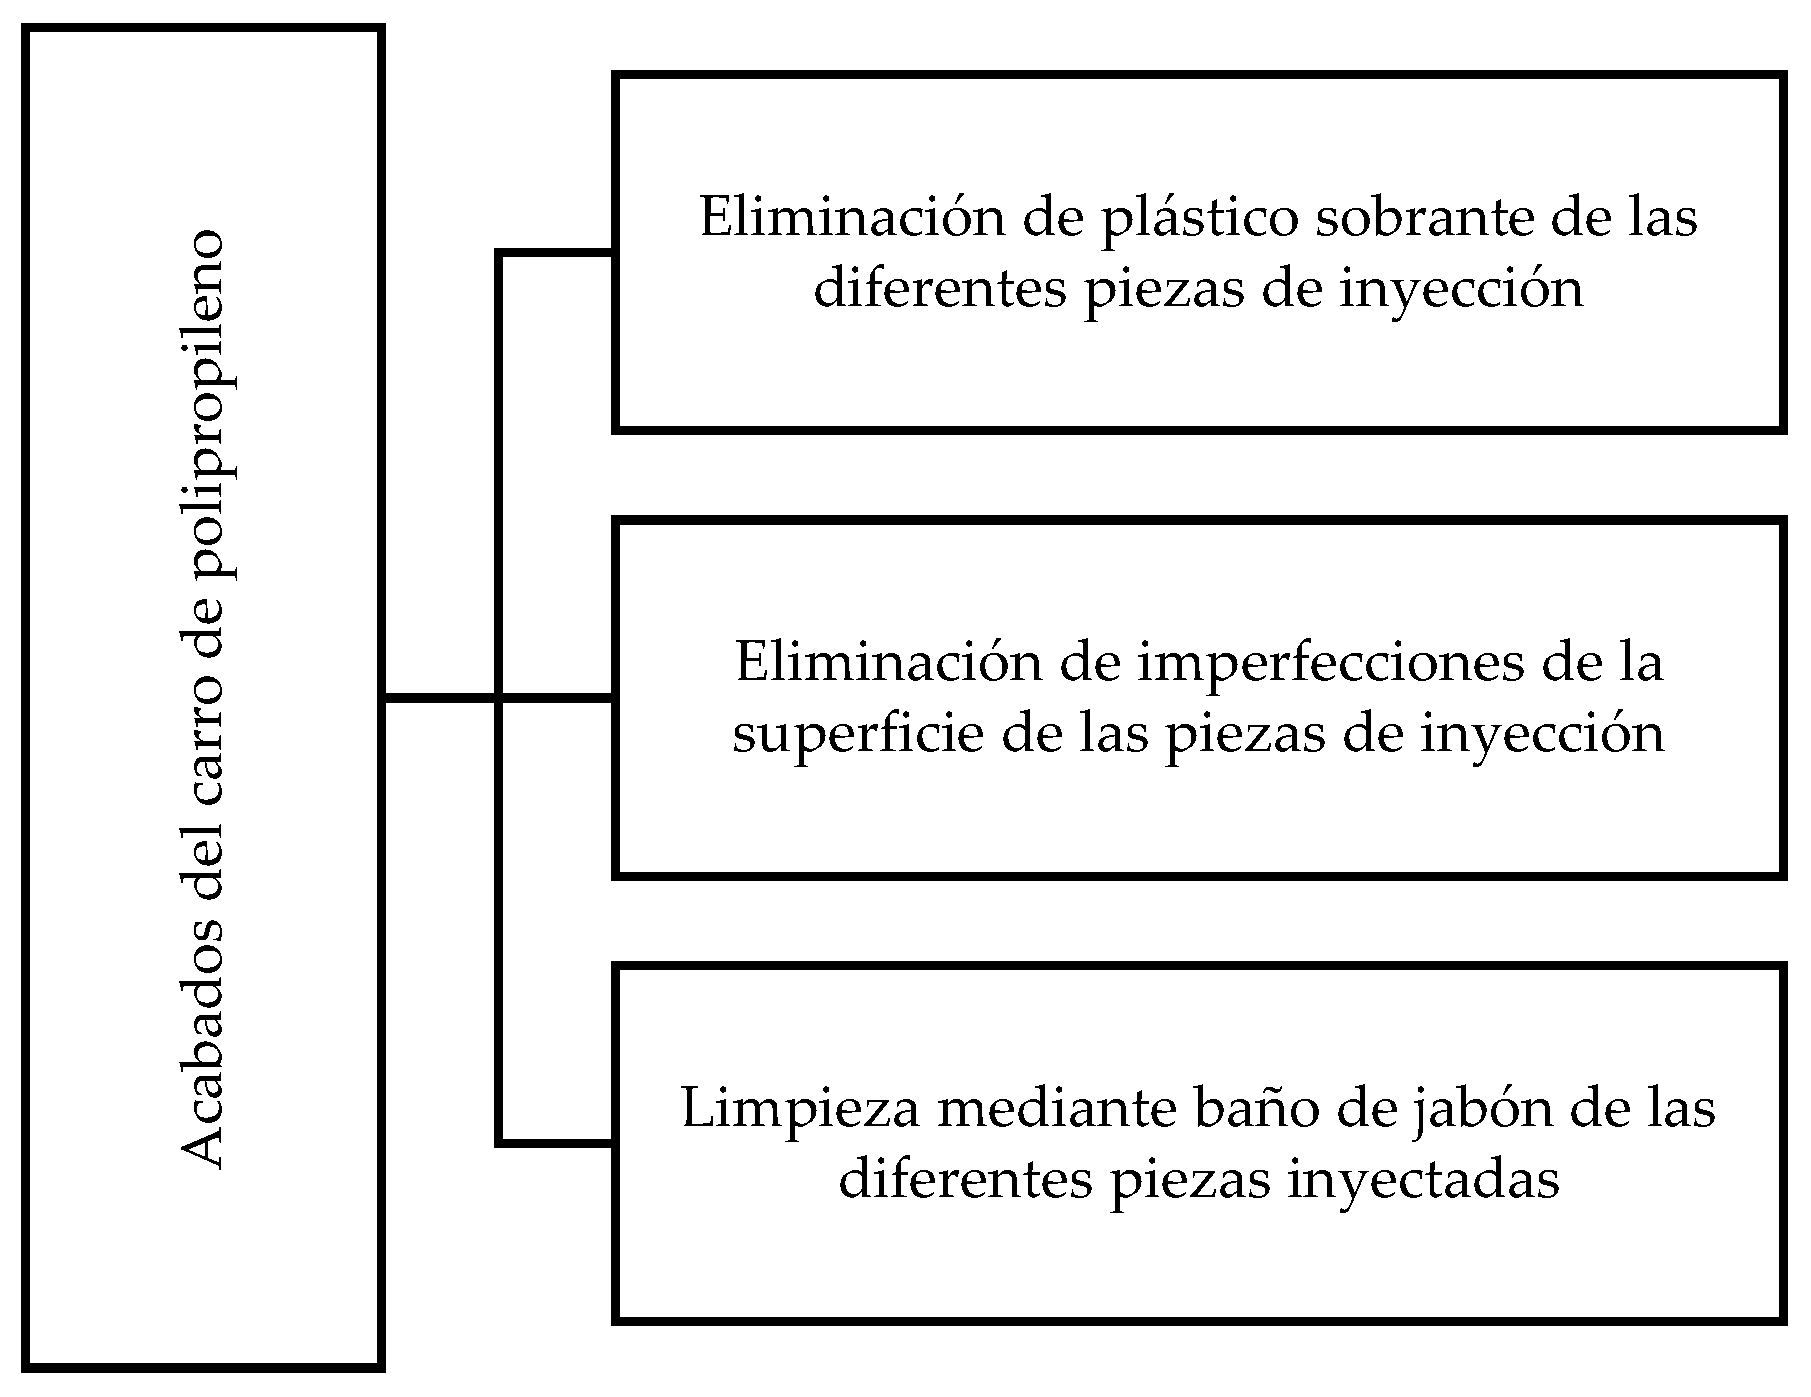
Figure 11.
Sub-processes of the metal trolley assembly phase.
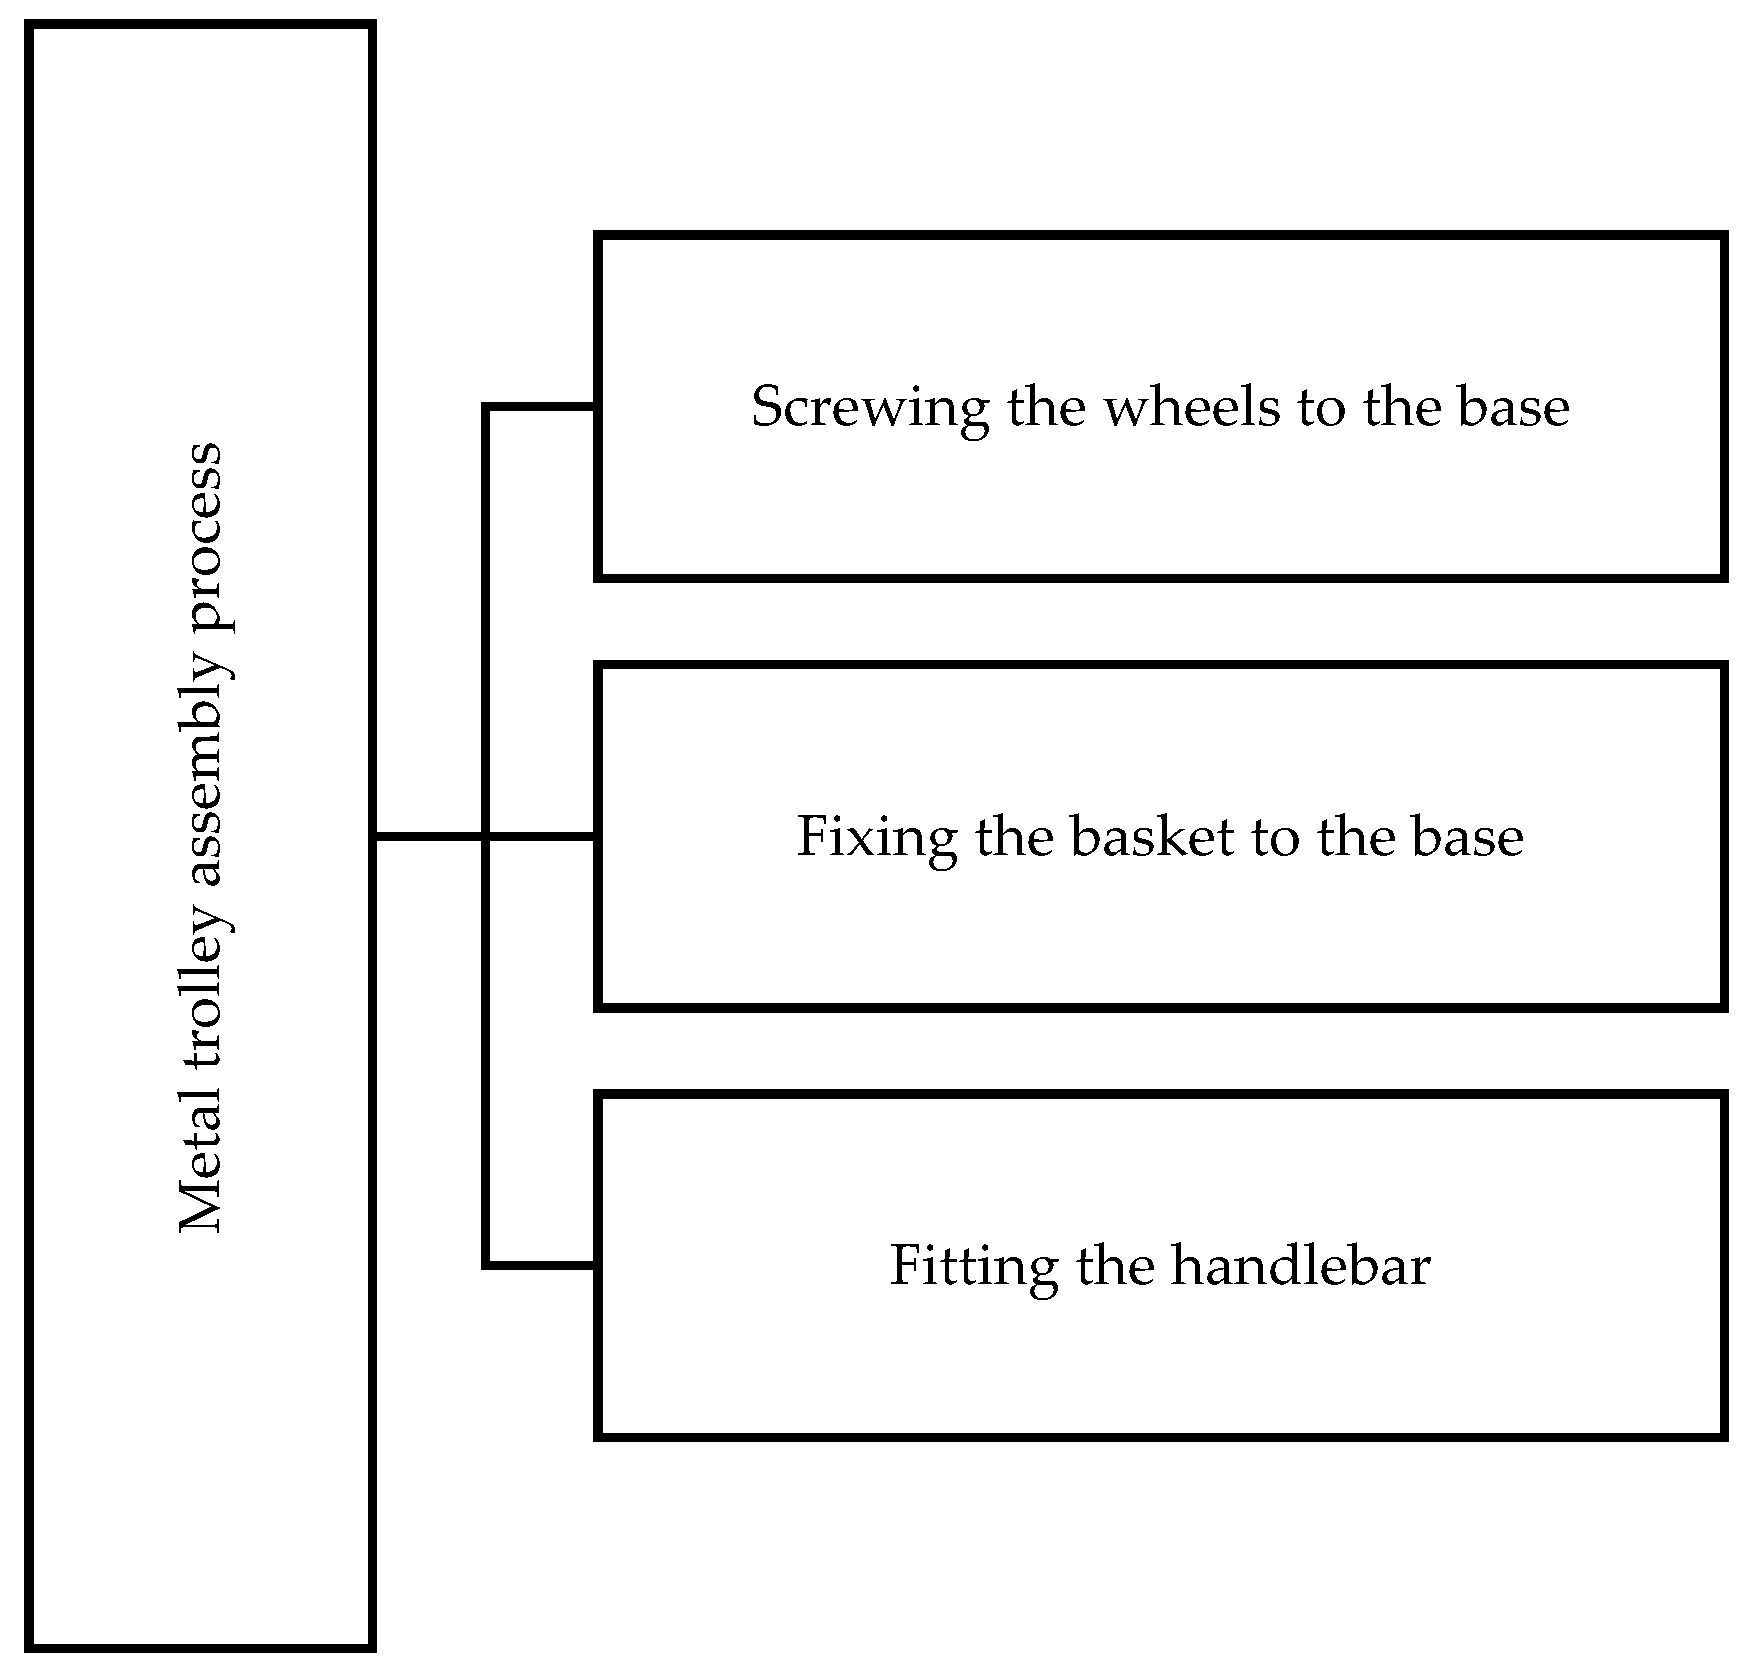
Figure 12.
Sub-processes of the metal trolley assembly phase.
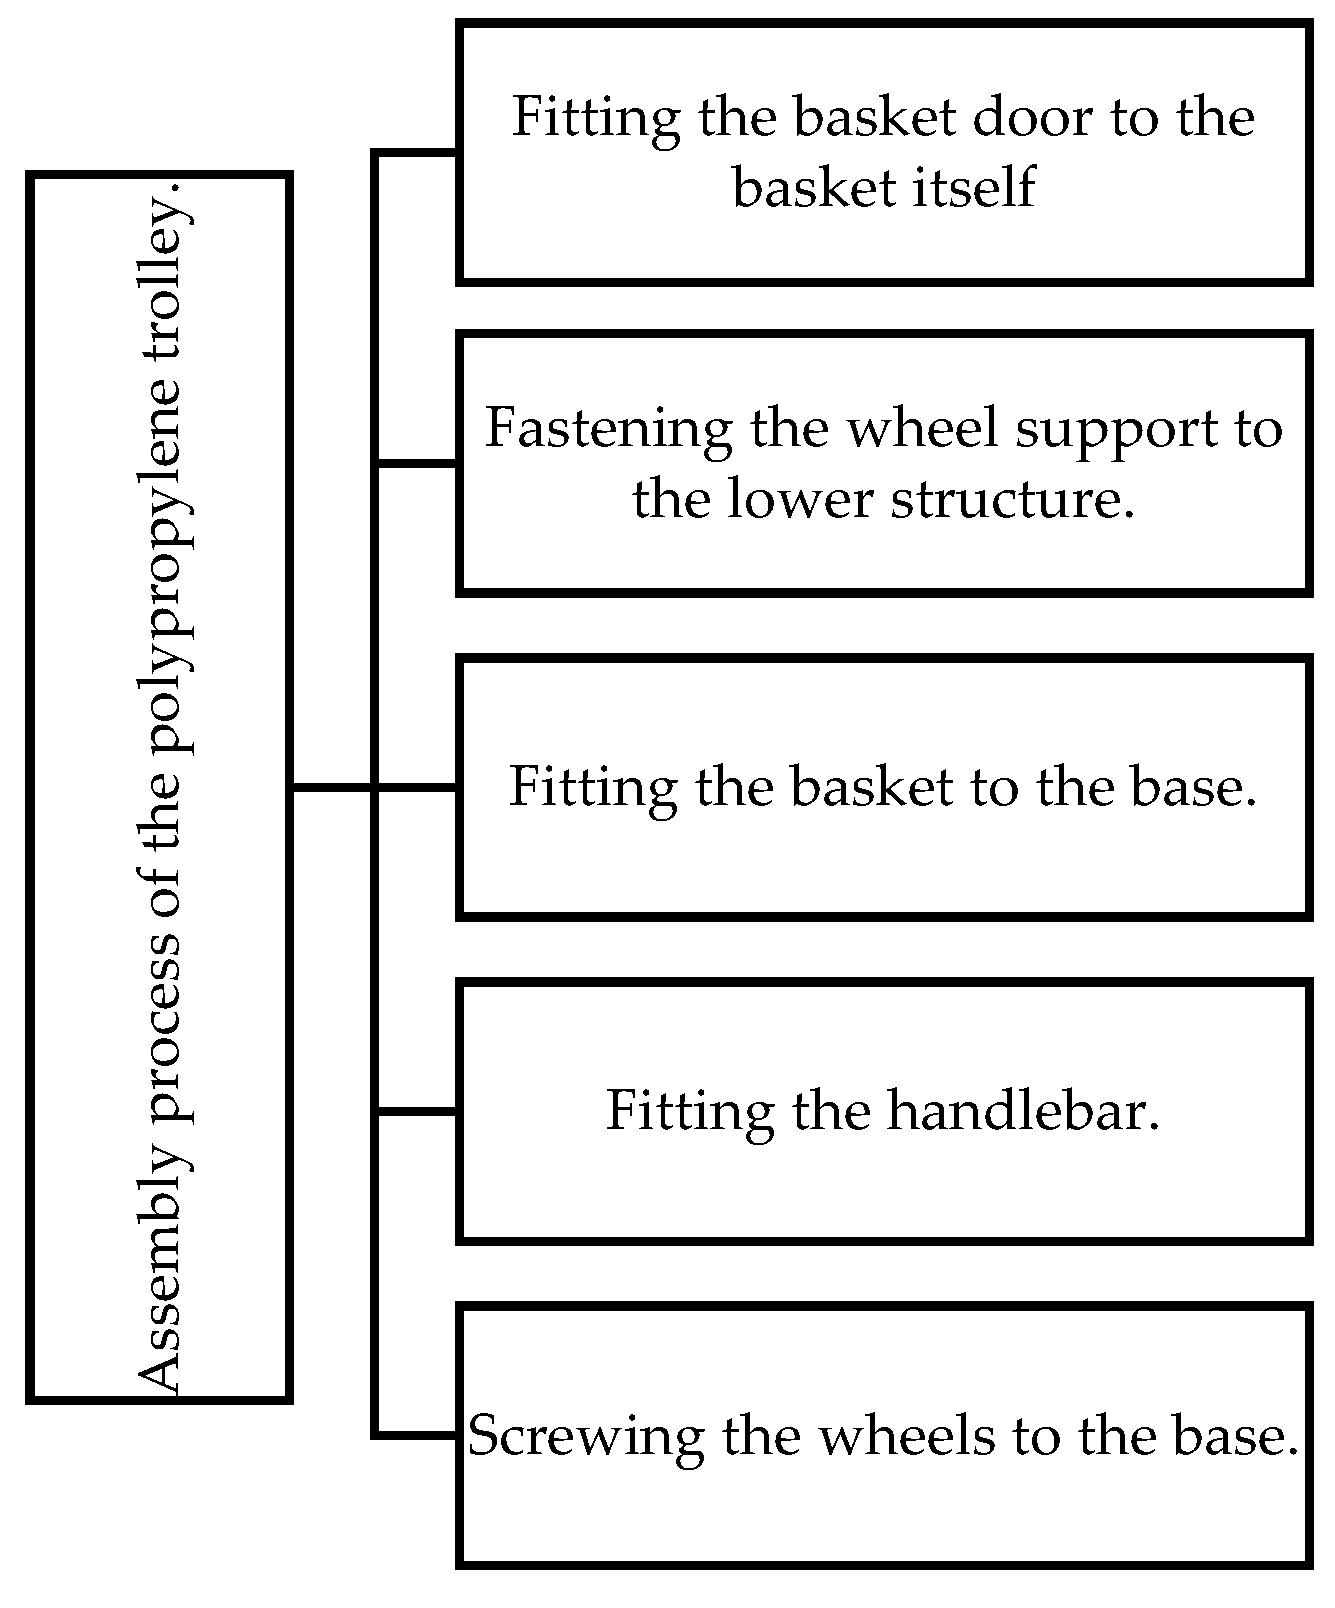
Figure 13.
Sub-processes of the end-of-life scenario phase for both types of trolleys.
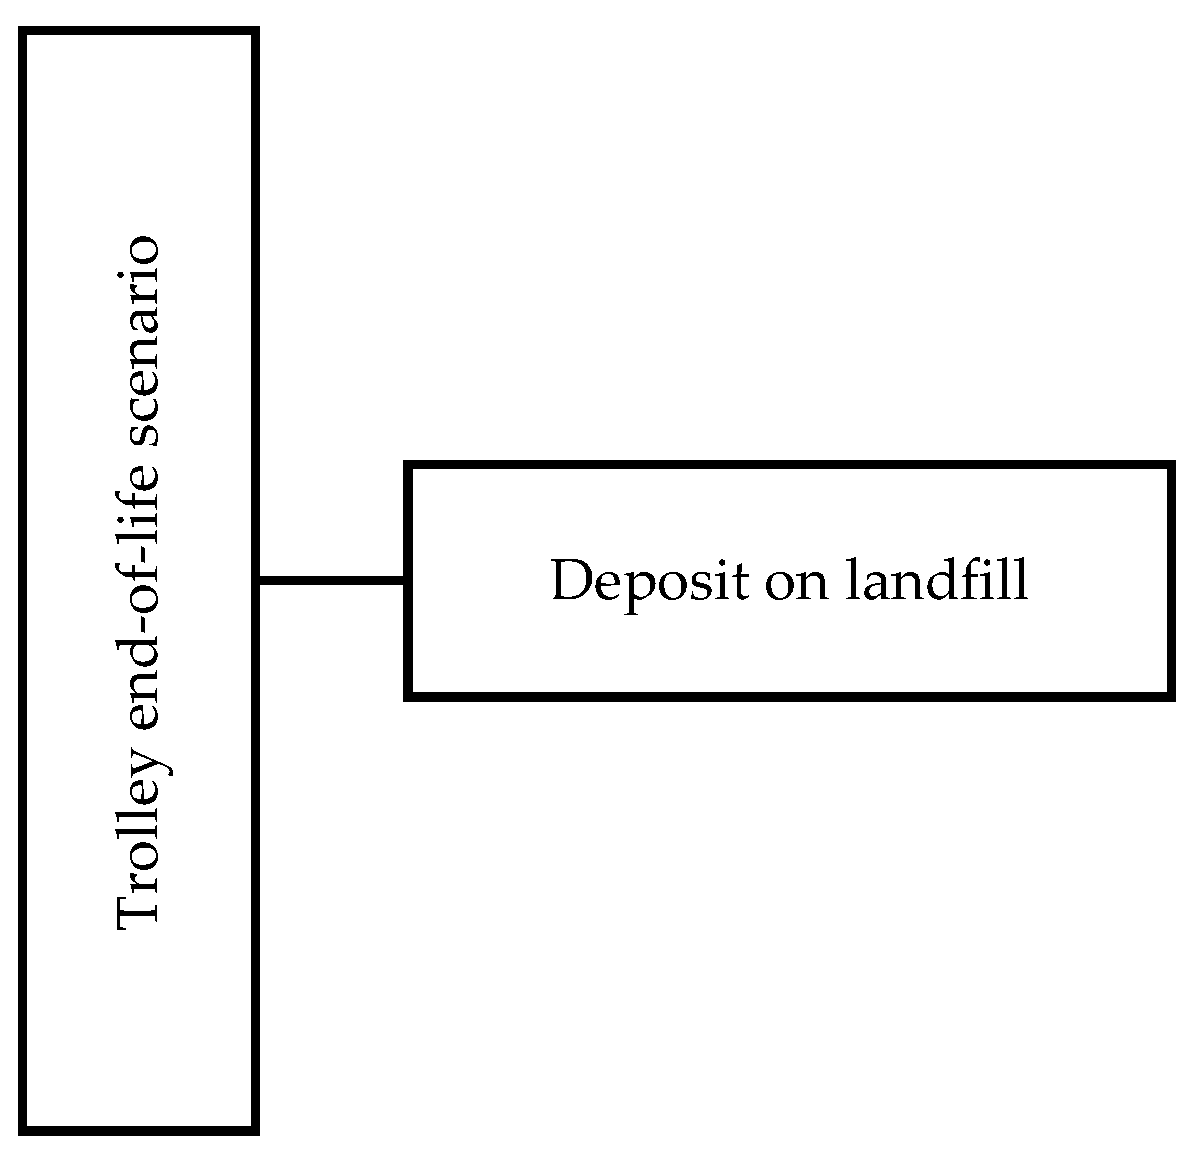
Figure 14.
Impact categories for Eco-indicator 99.
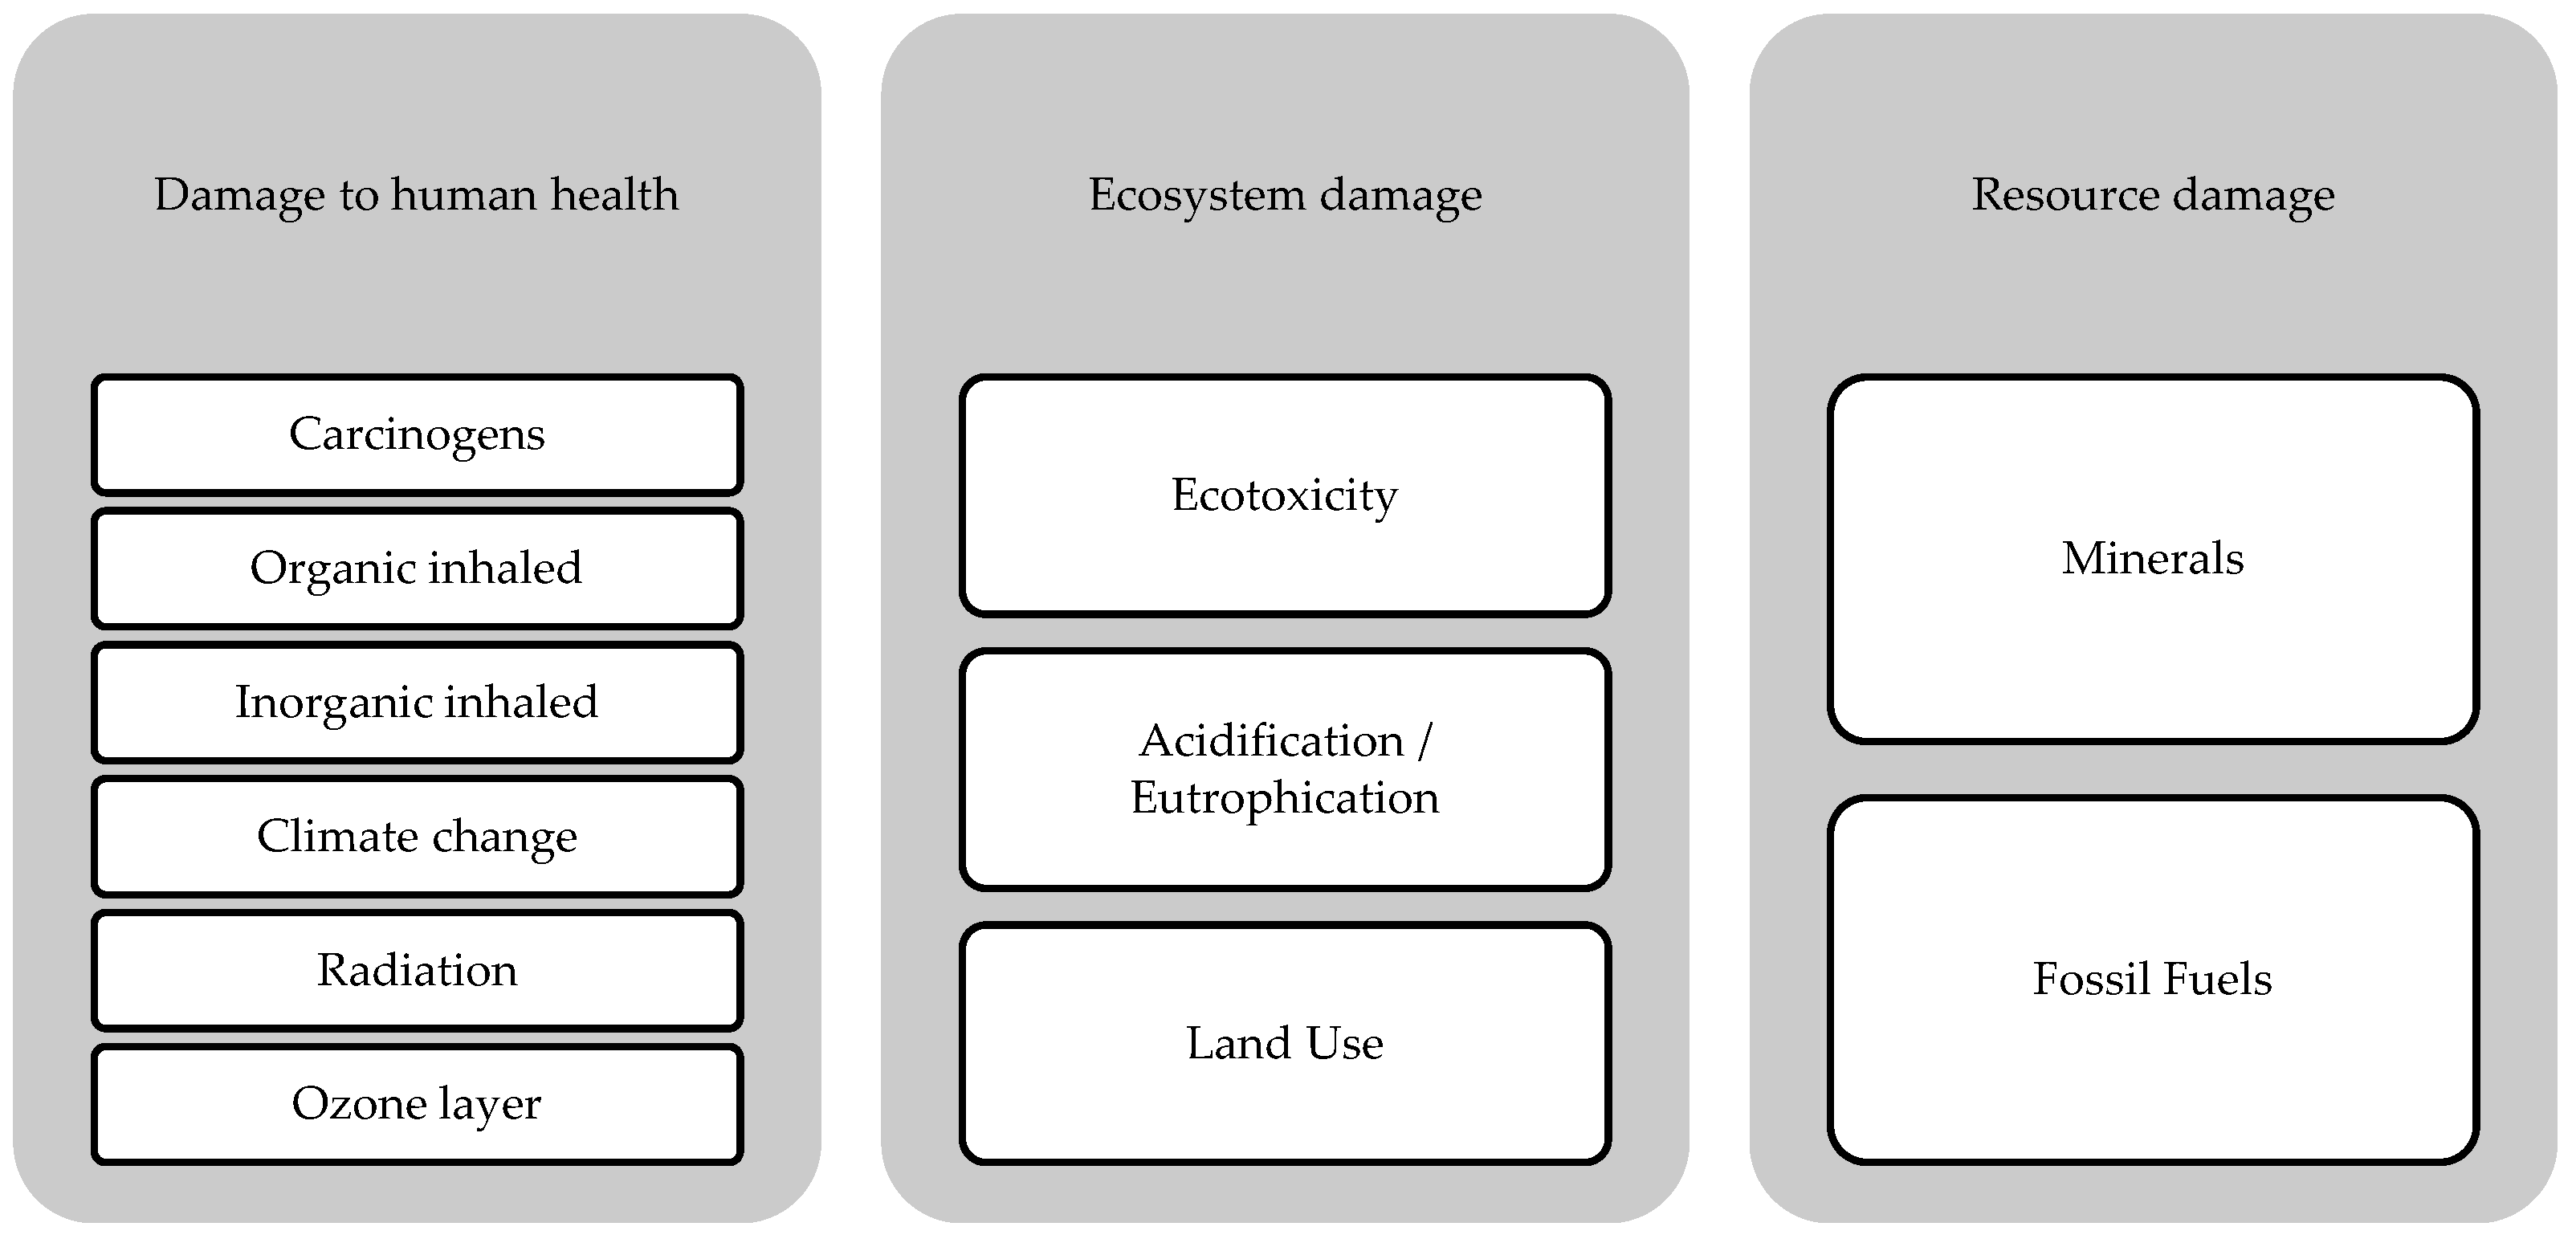
Figure 15.
Material flow diagram for both types of trolleys.
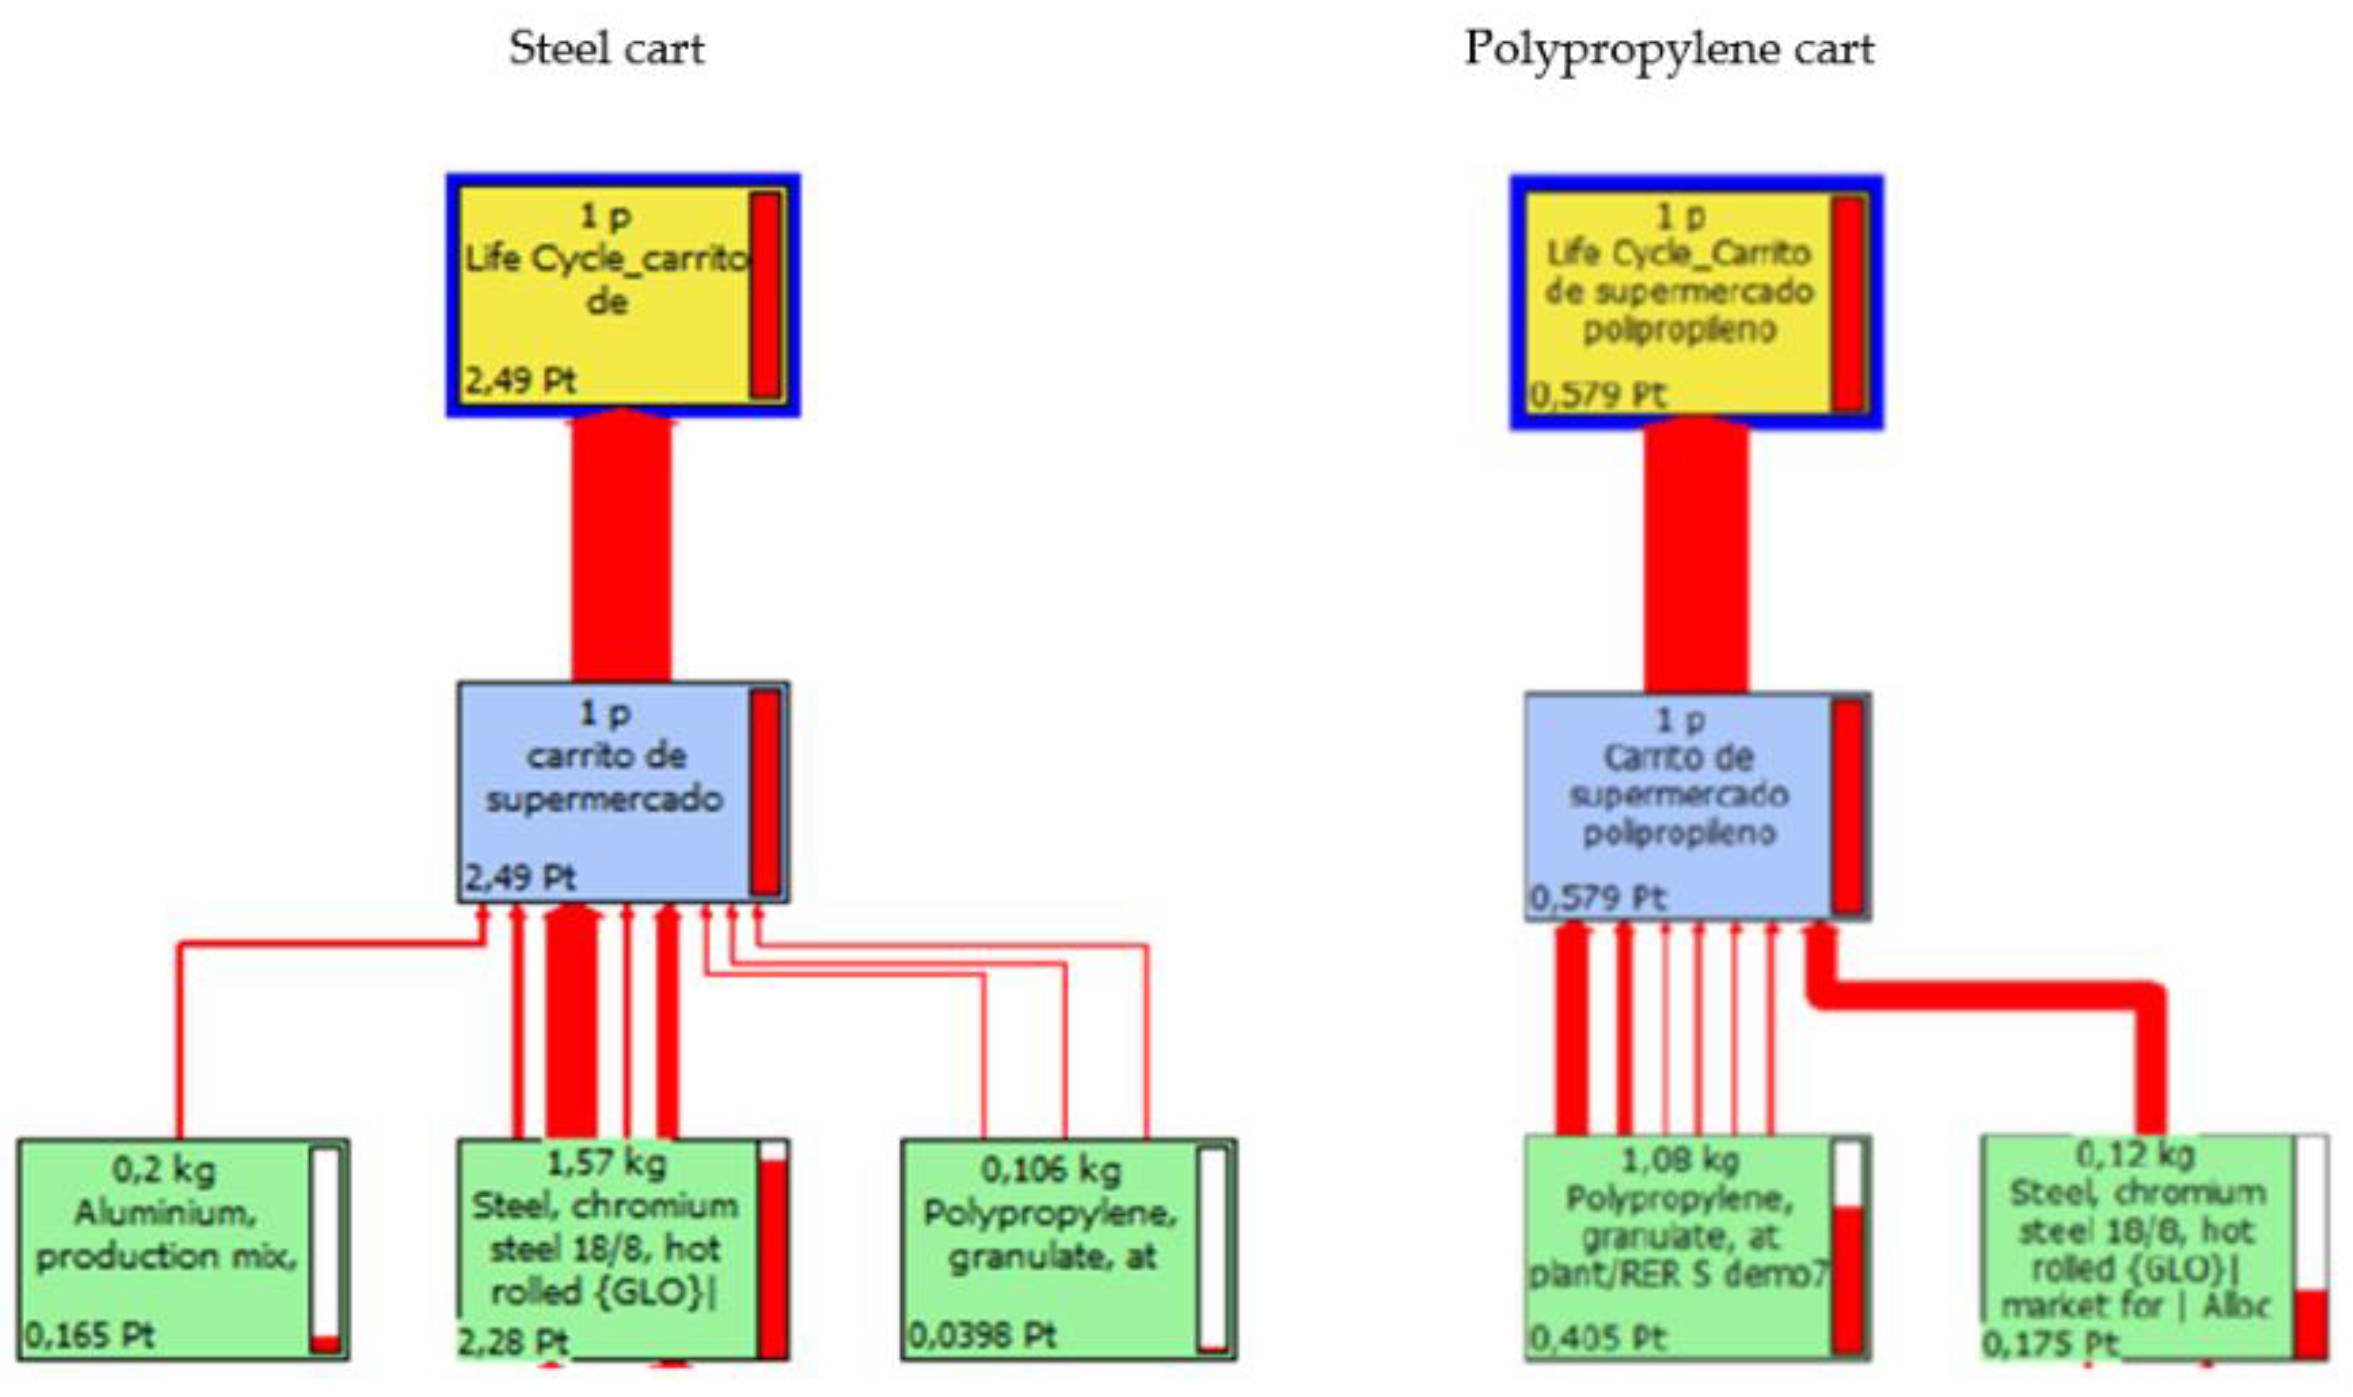
Figure 16.
Characterisation of the impact results to compare the two types of materials in the wheel.
Figure 16.
Characterisation of the impact results to compare the two types of materials in the wheel.
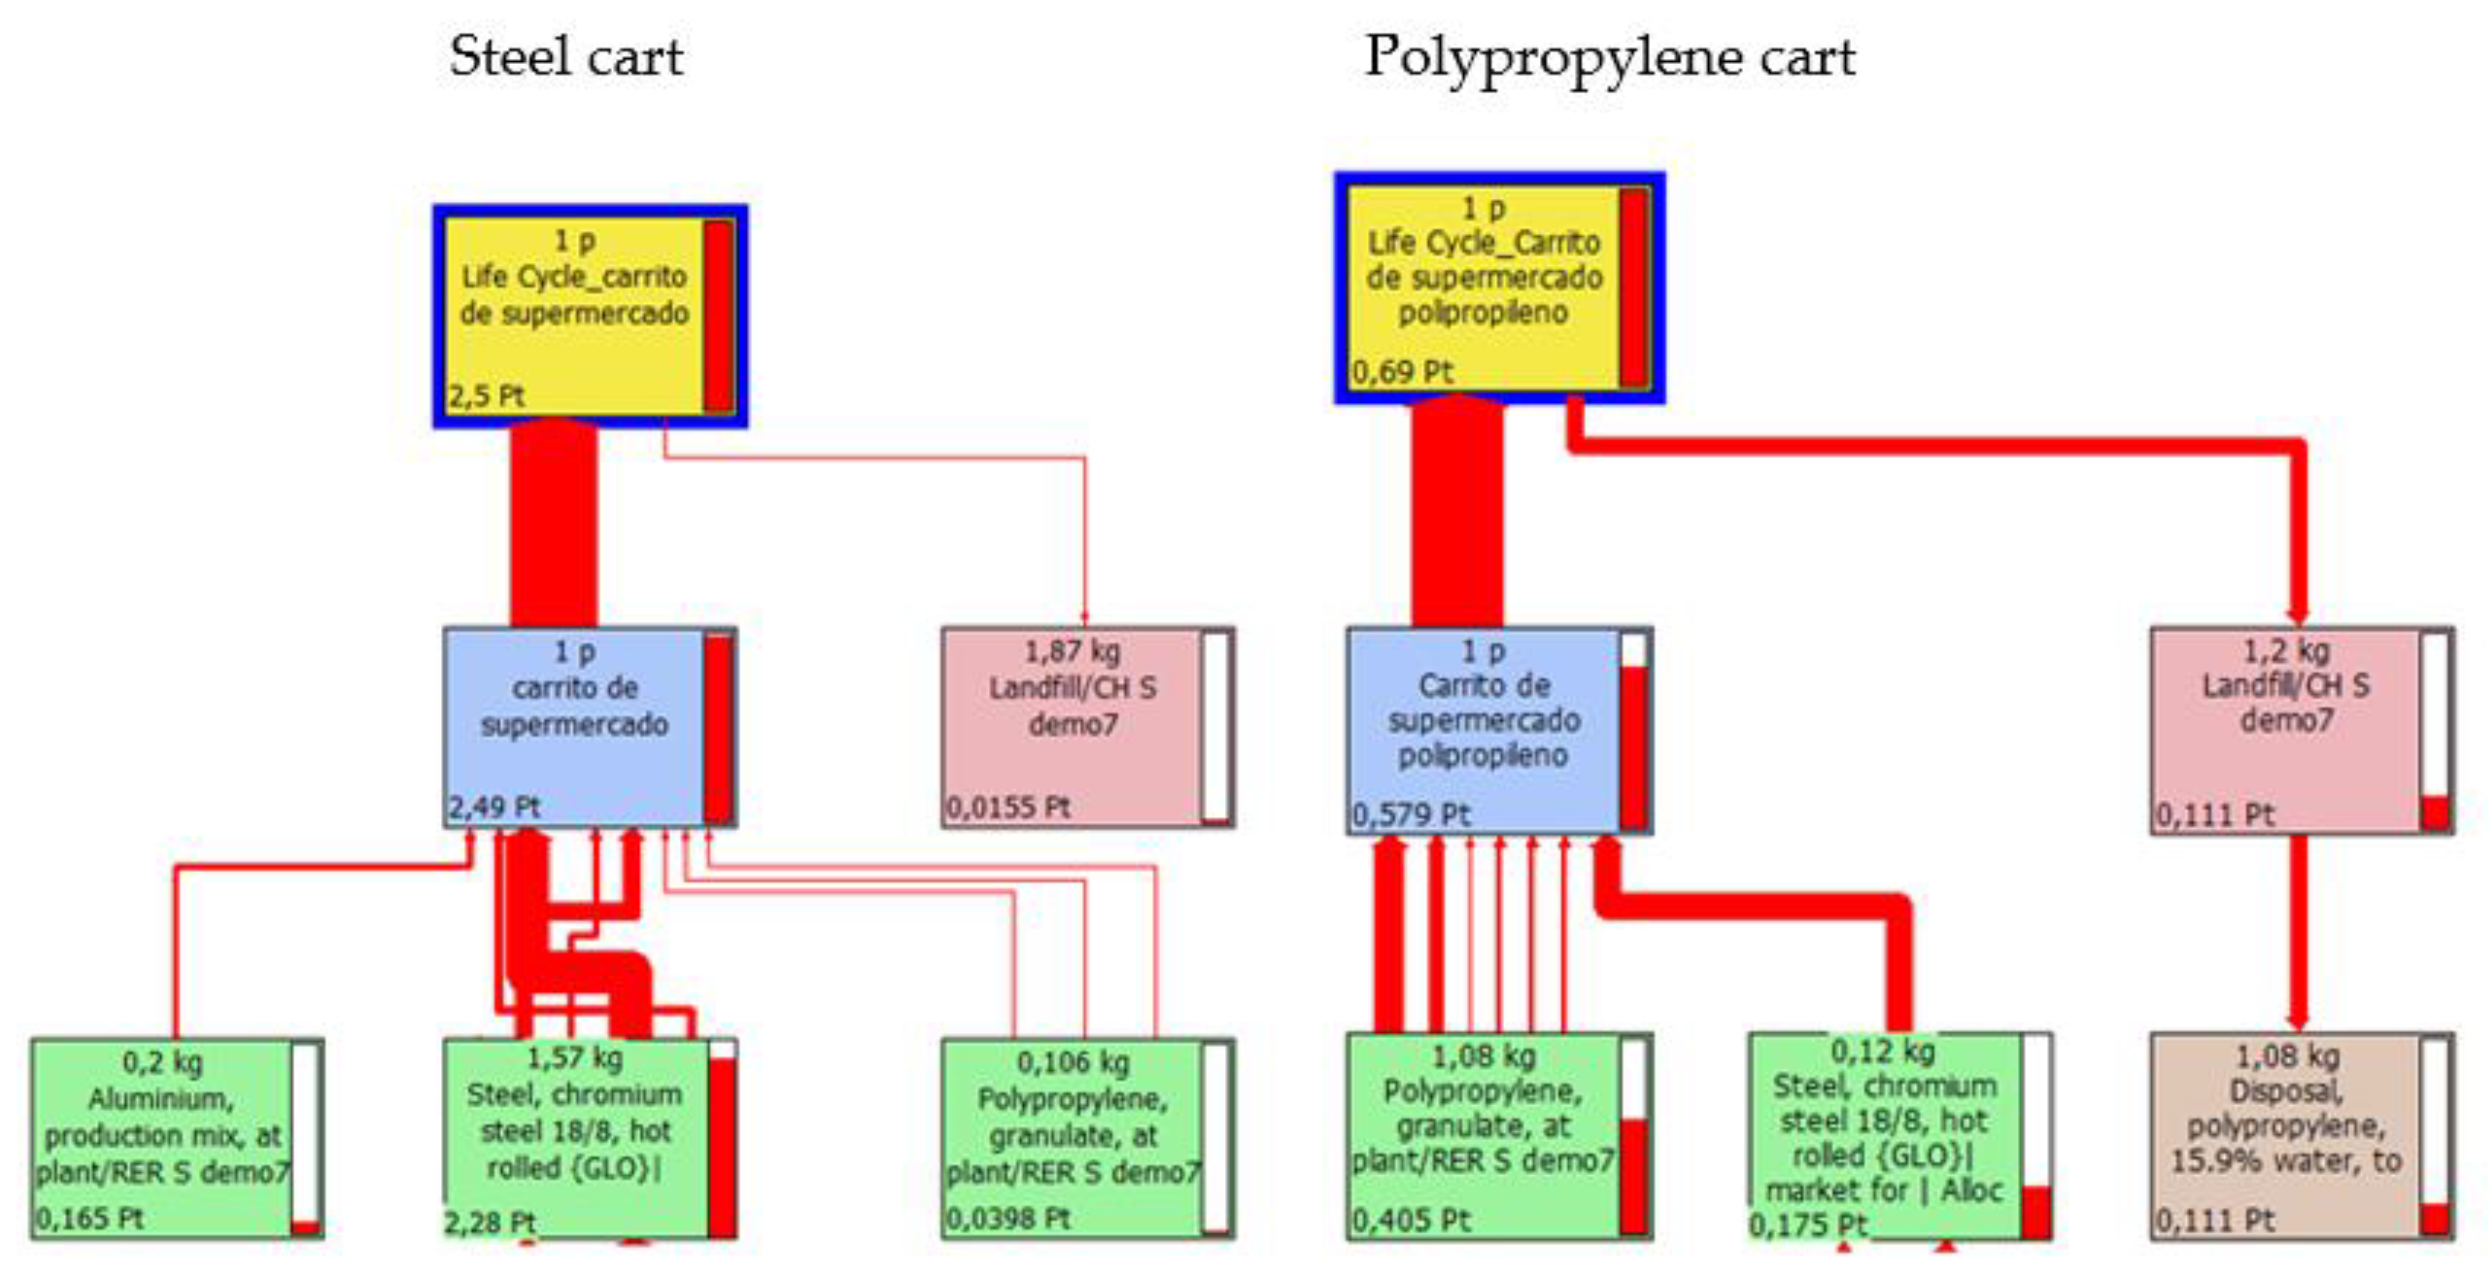
Figure 17.
Characterisation of the impact categories for the metal trolley.
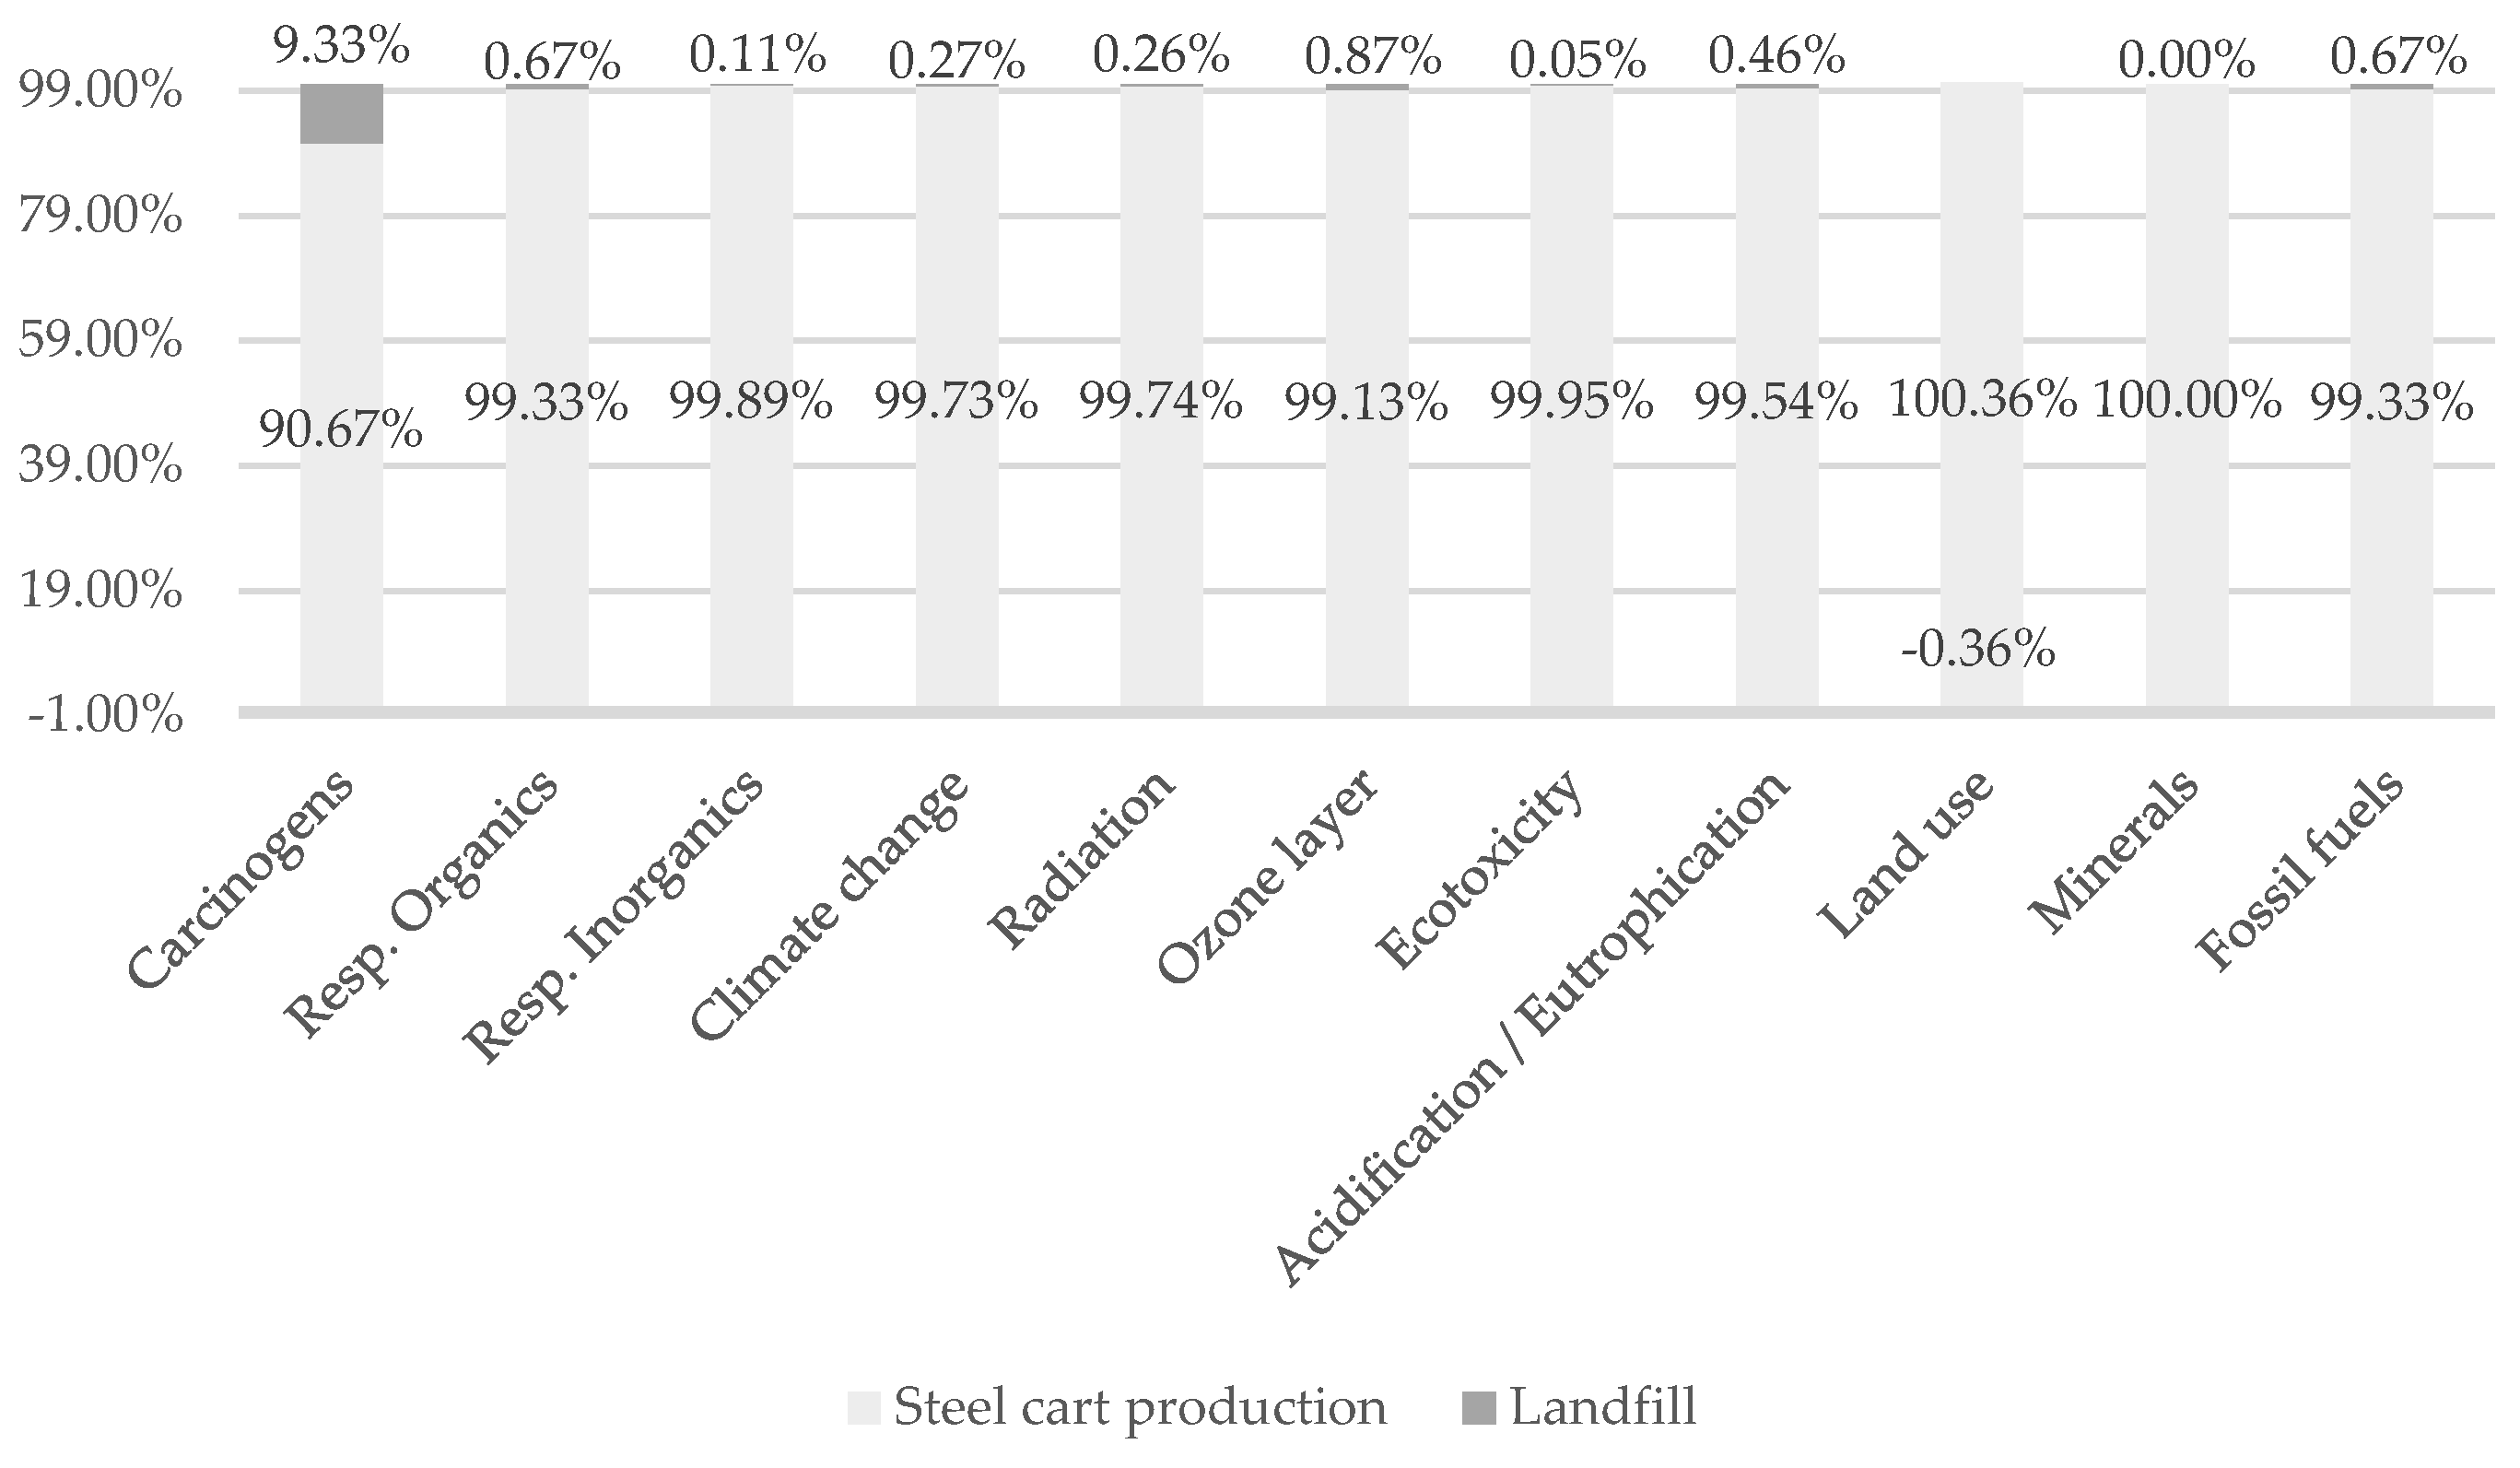
Figure 18.
Characterisation of the impact categories for the polypropylene trolley.
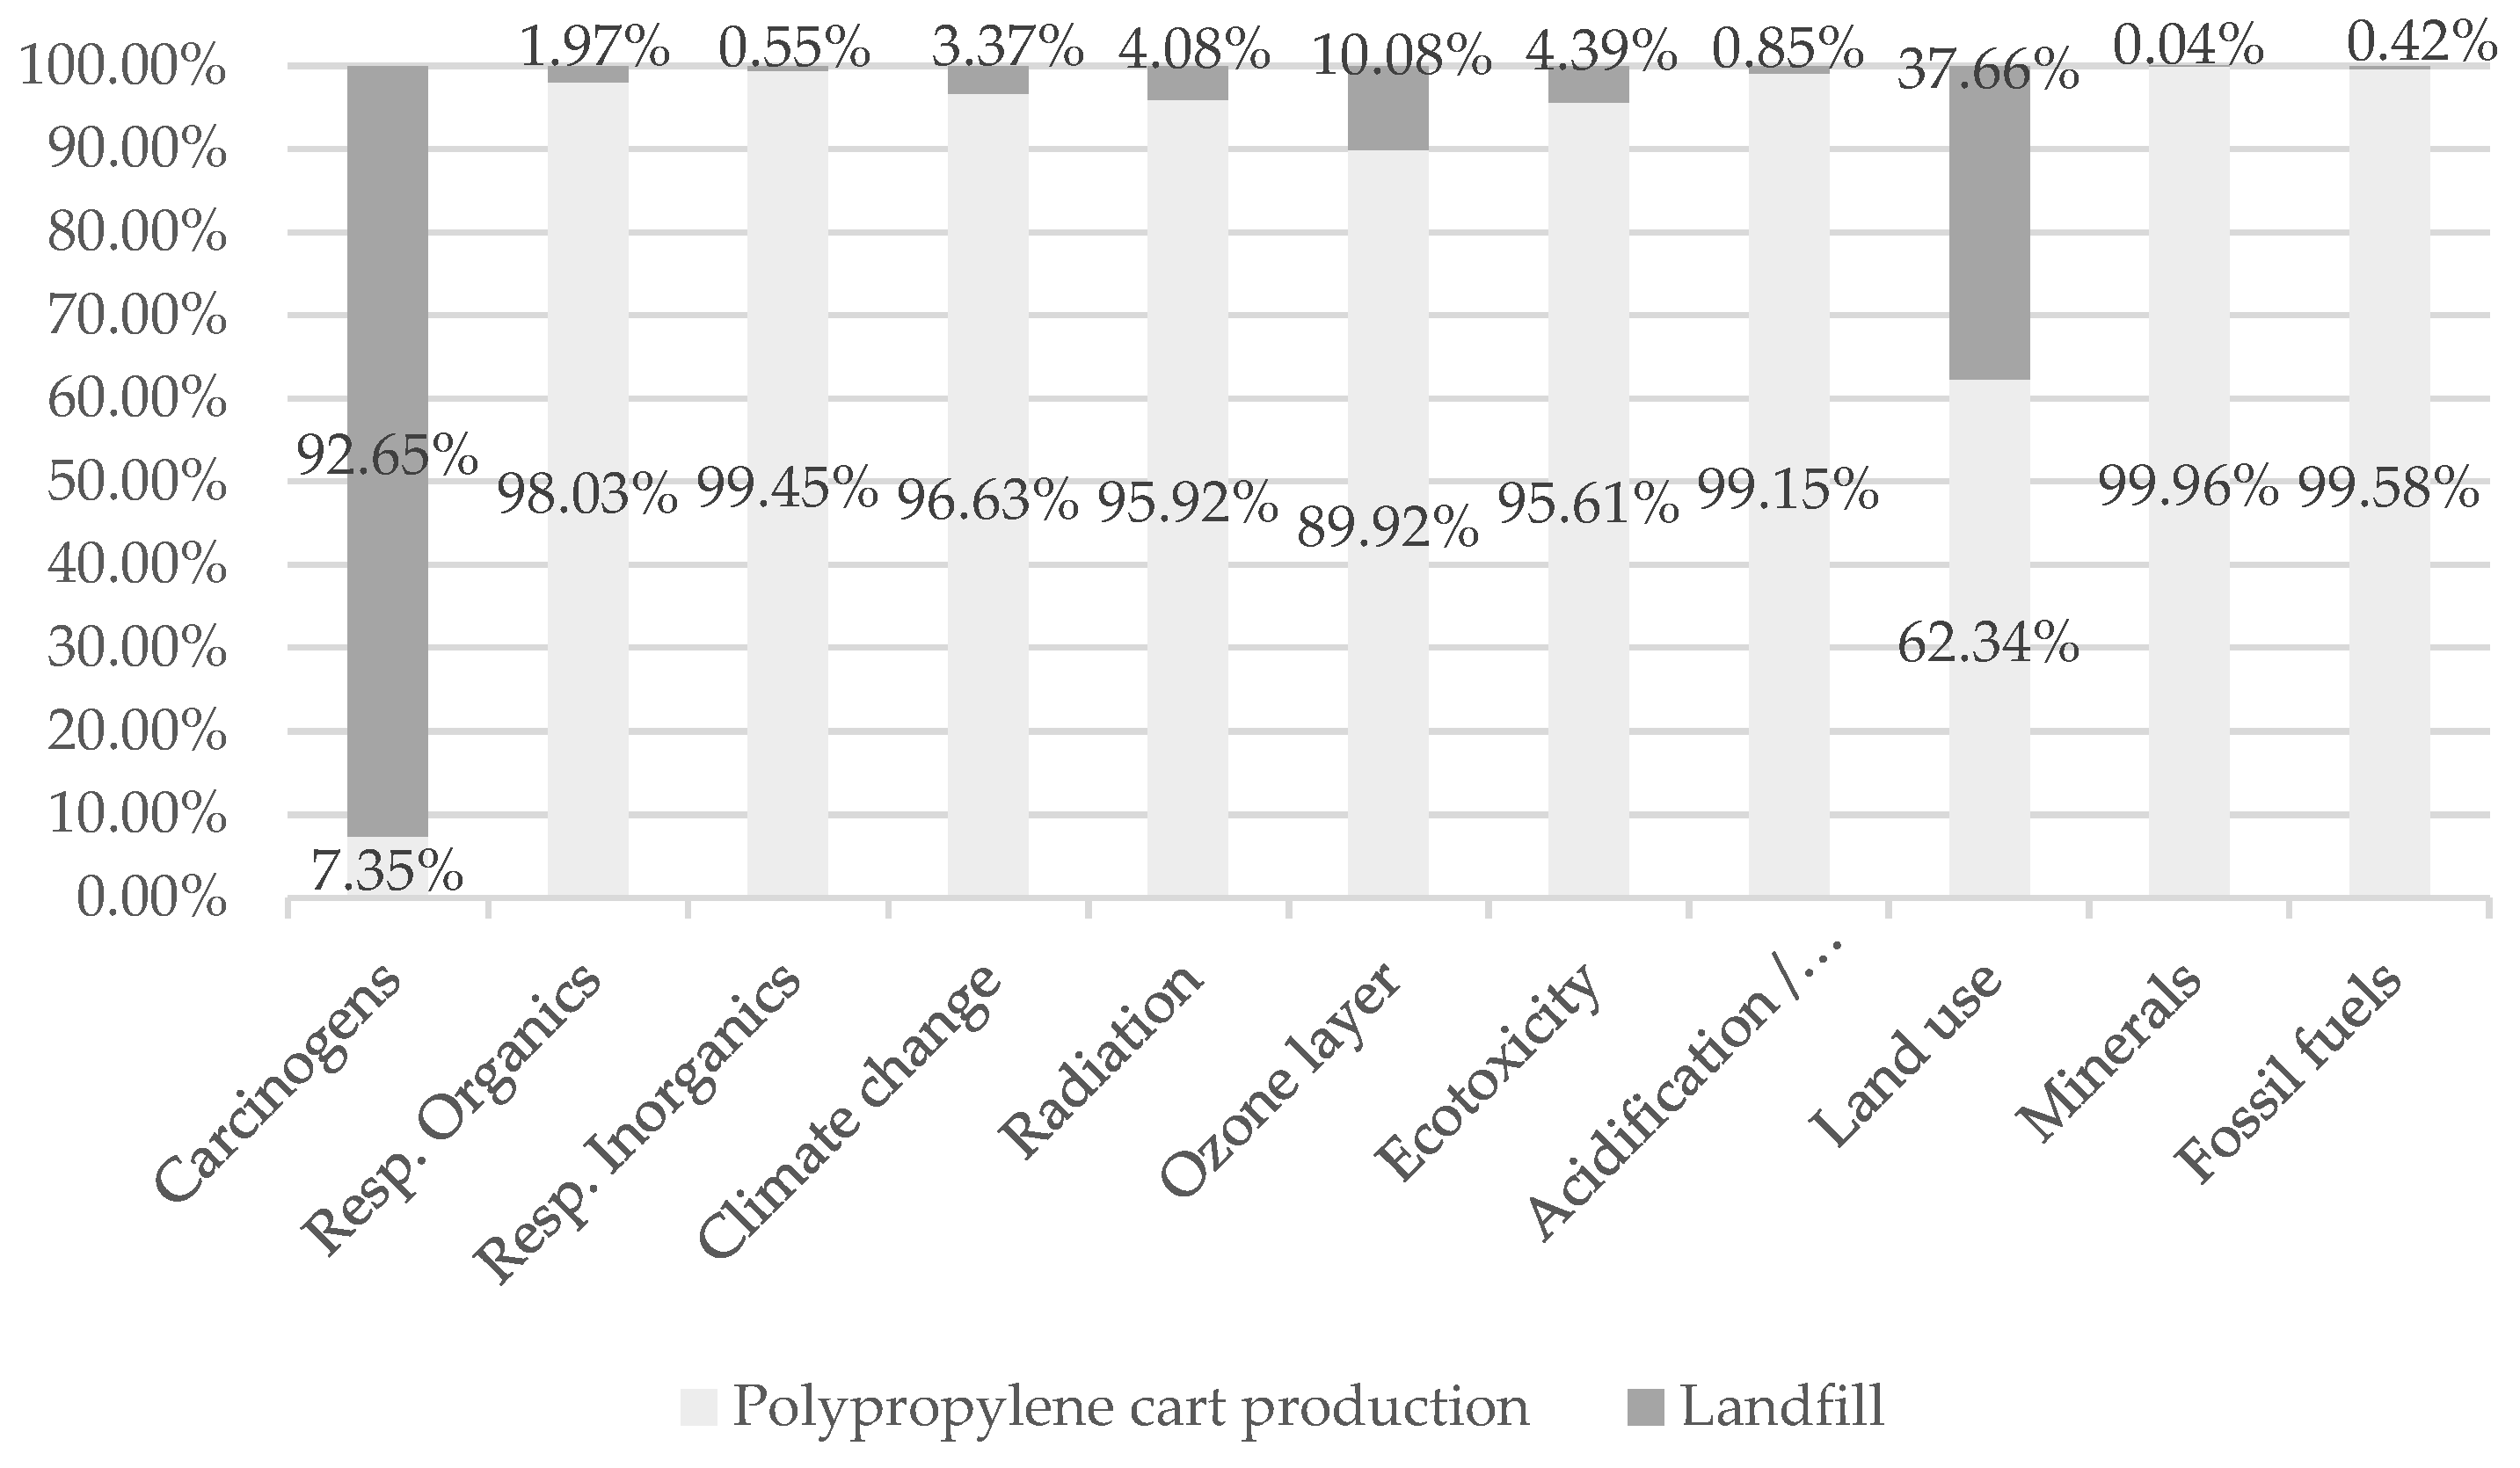
Figure 19.
Characterisation of damage categories for the steel trolley.
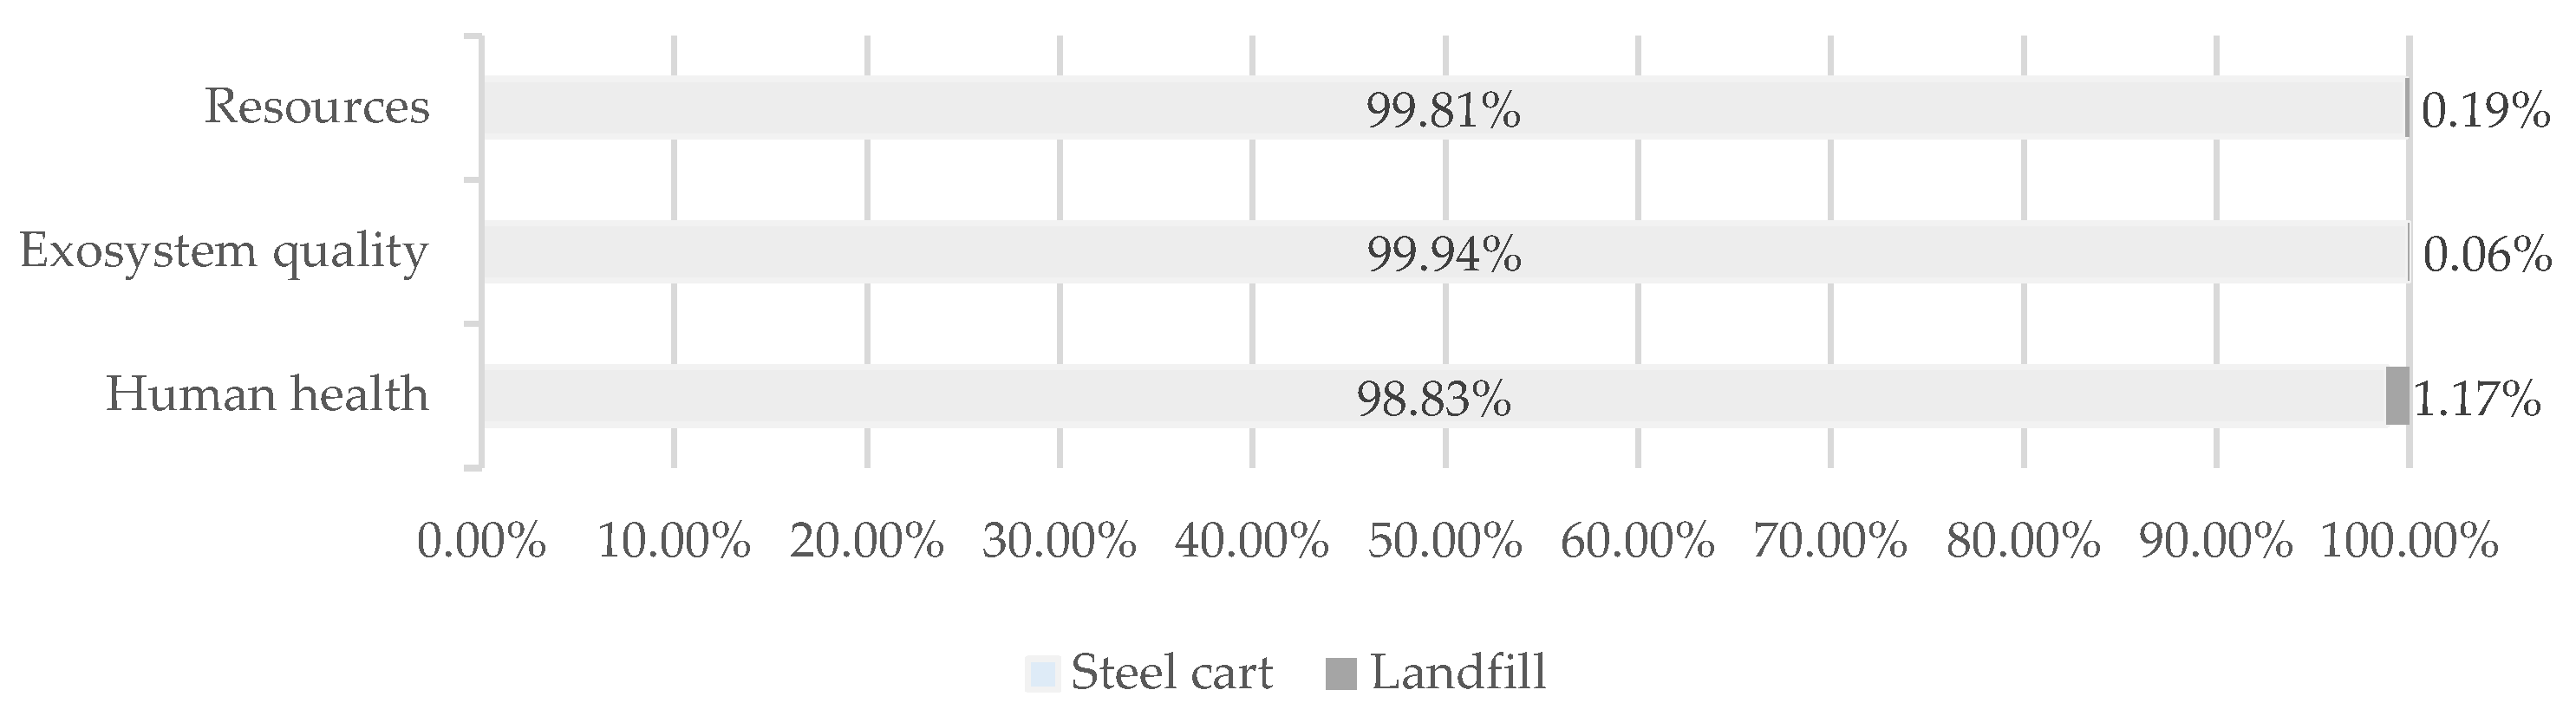
Figure 20.
Characterisation of damage categories for the polypropylene trolley.
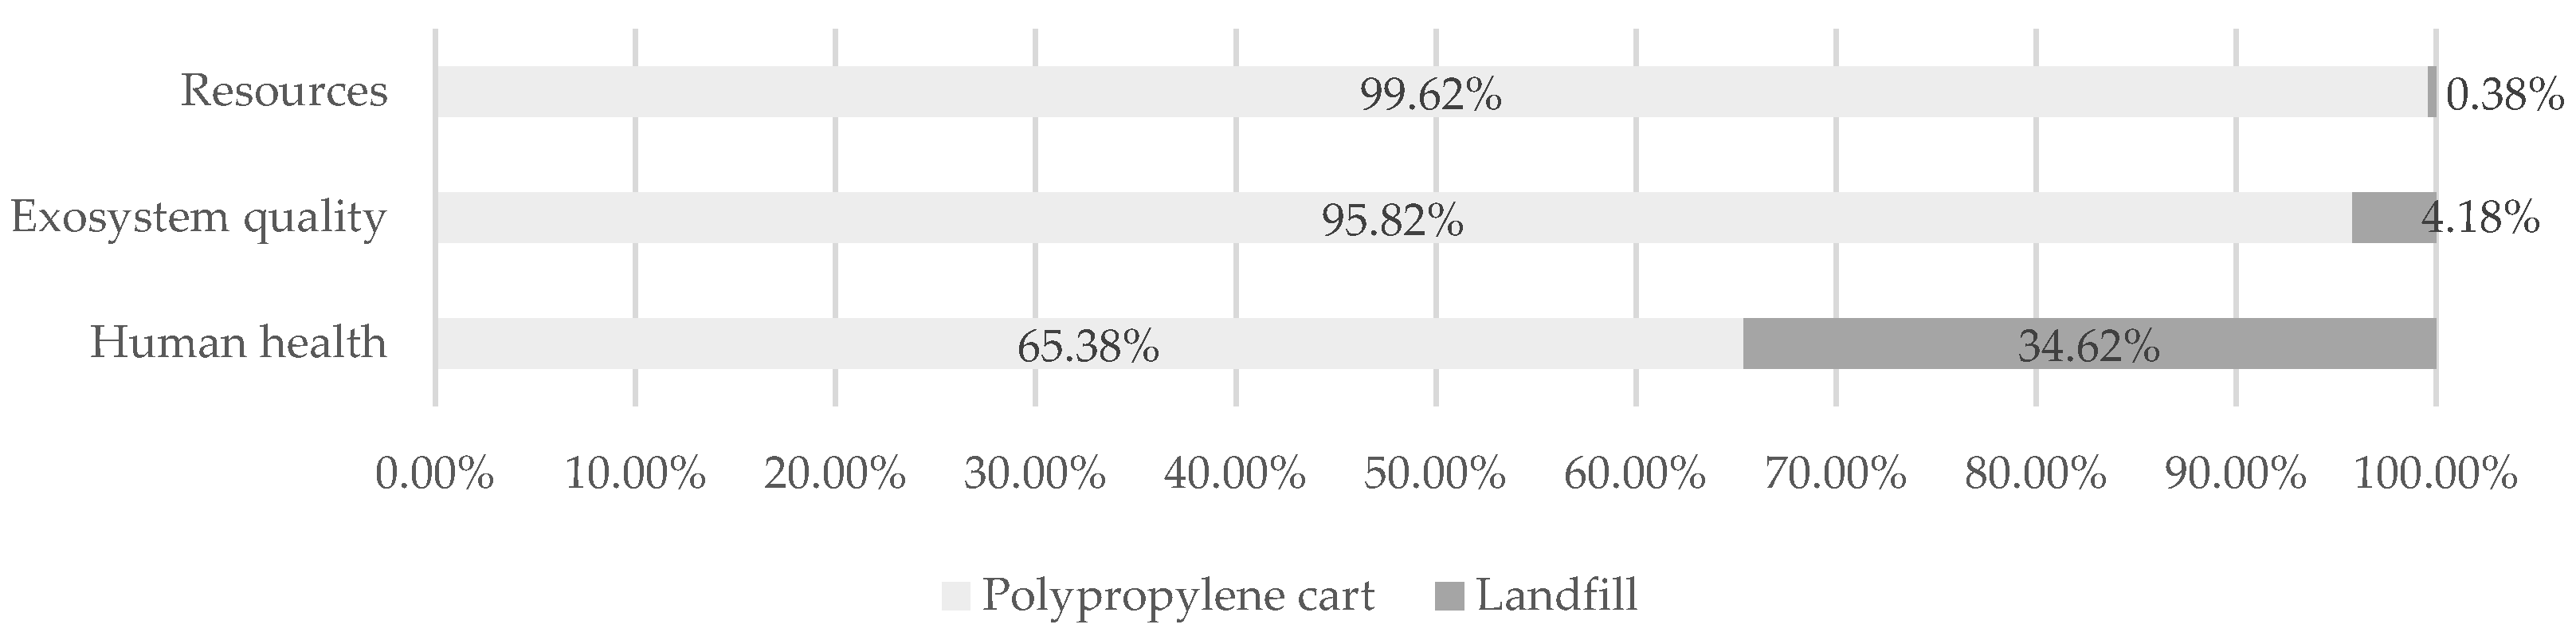
Figure 21.
Normalisation by damage categories for the metal trolley.
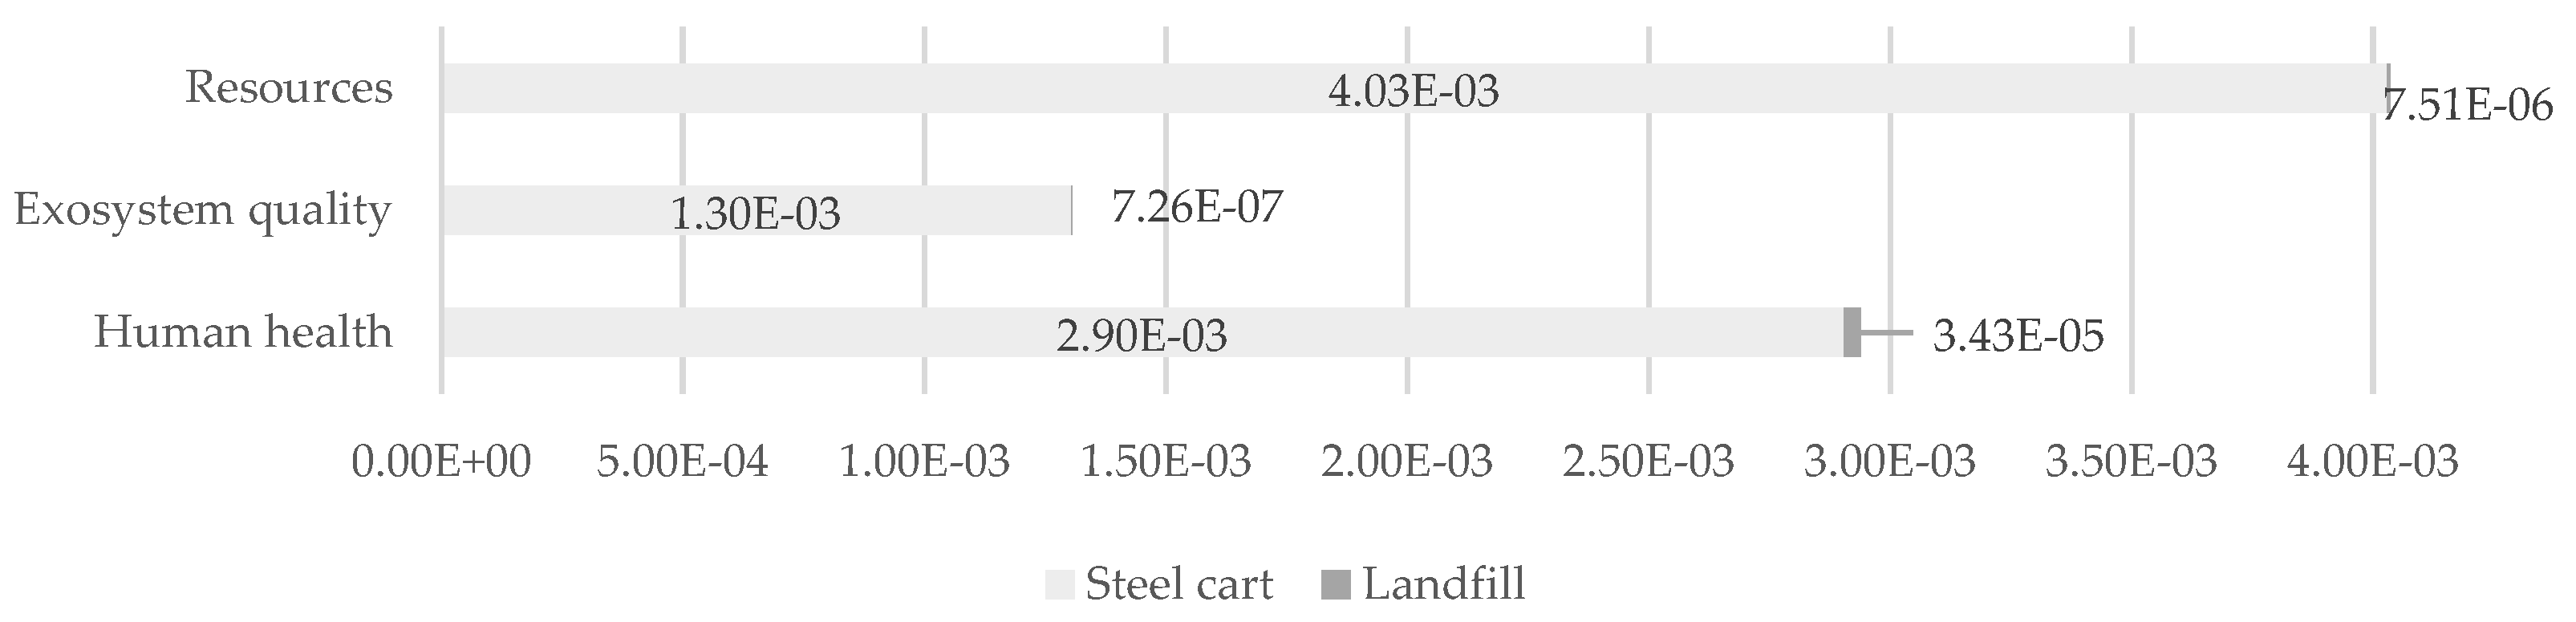
Figure 22.
Normalisation by damage categories for the polypropylene trolley.
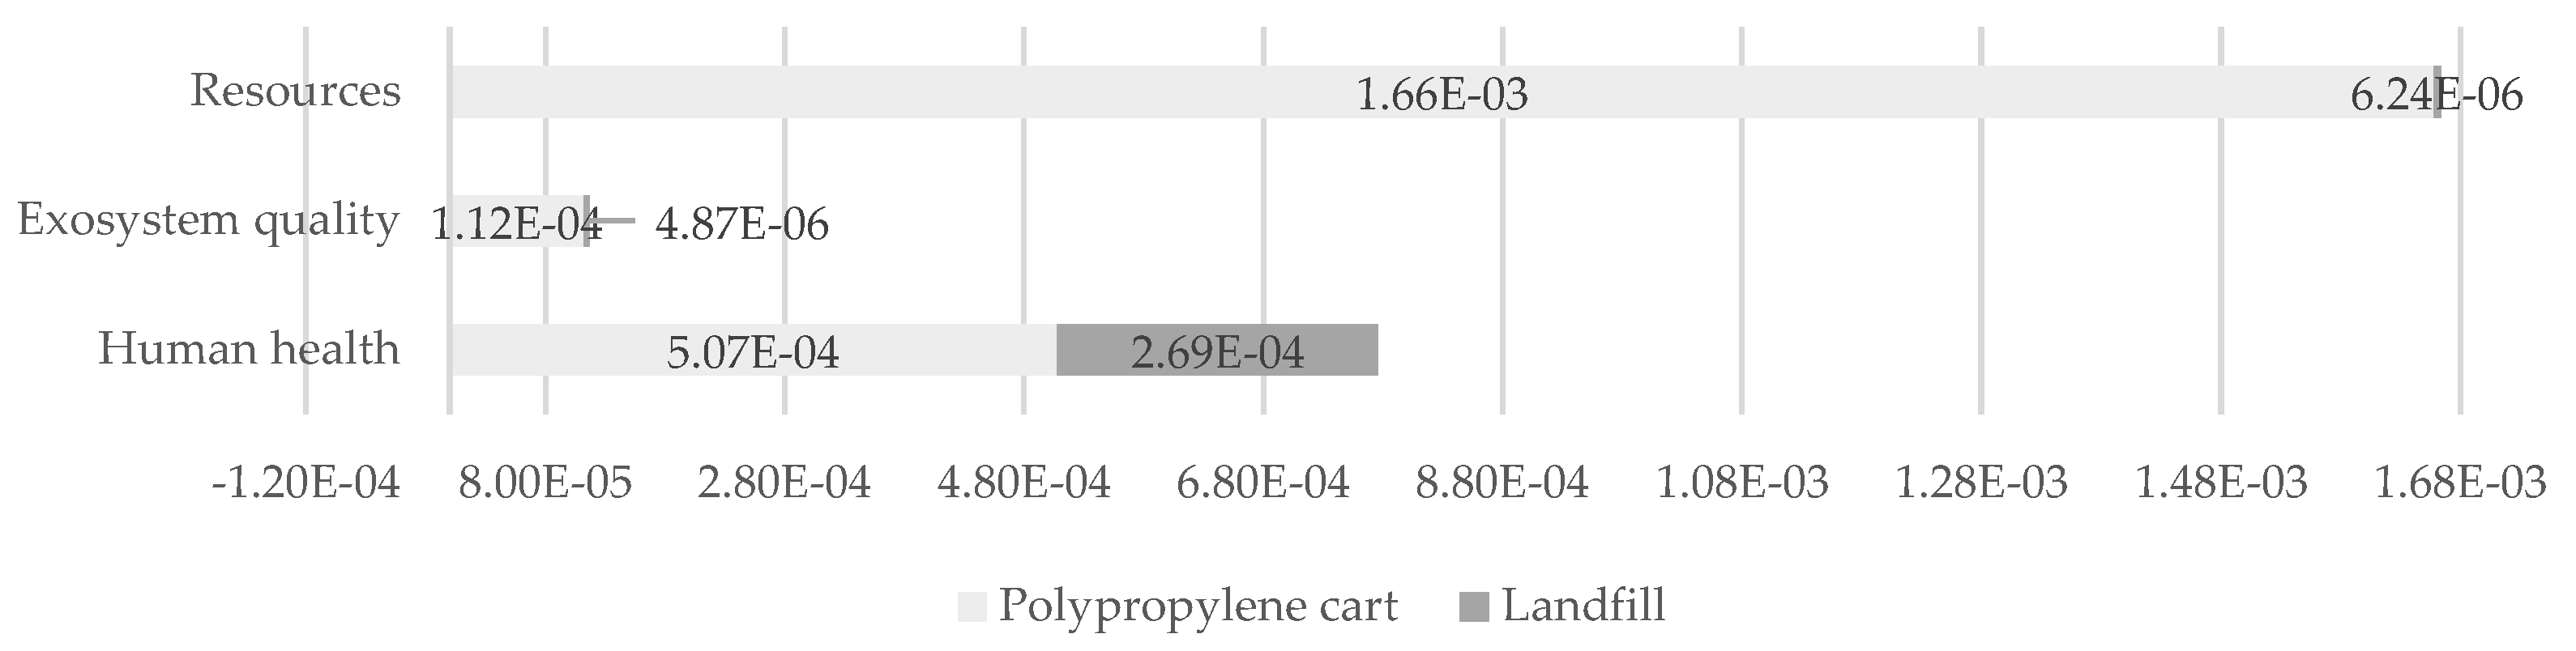
Figure 23.
Weighting by damage categories for the metal trolley (mPt).
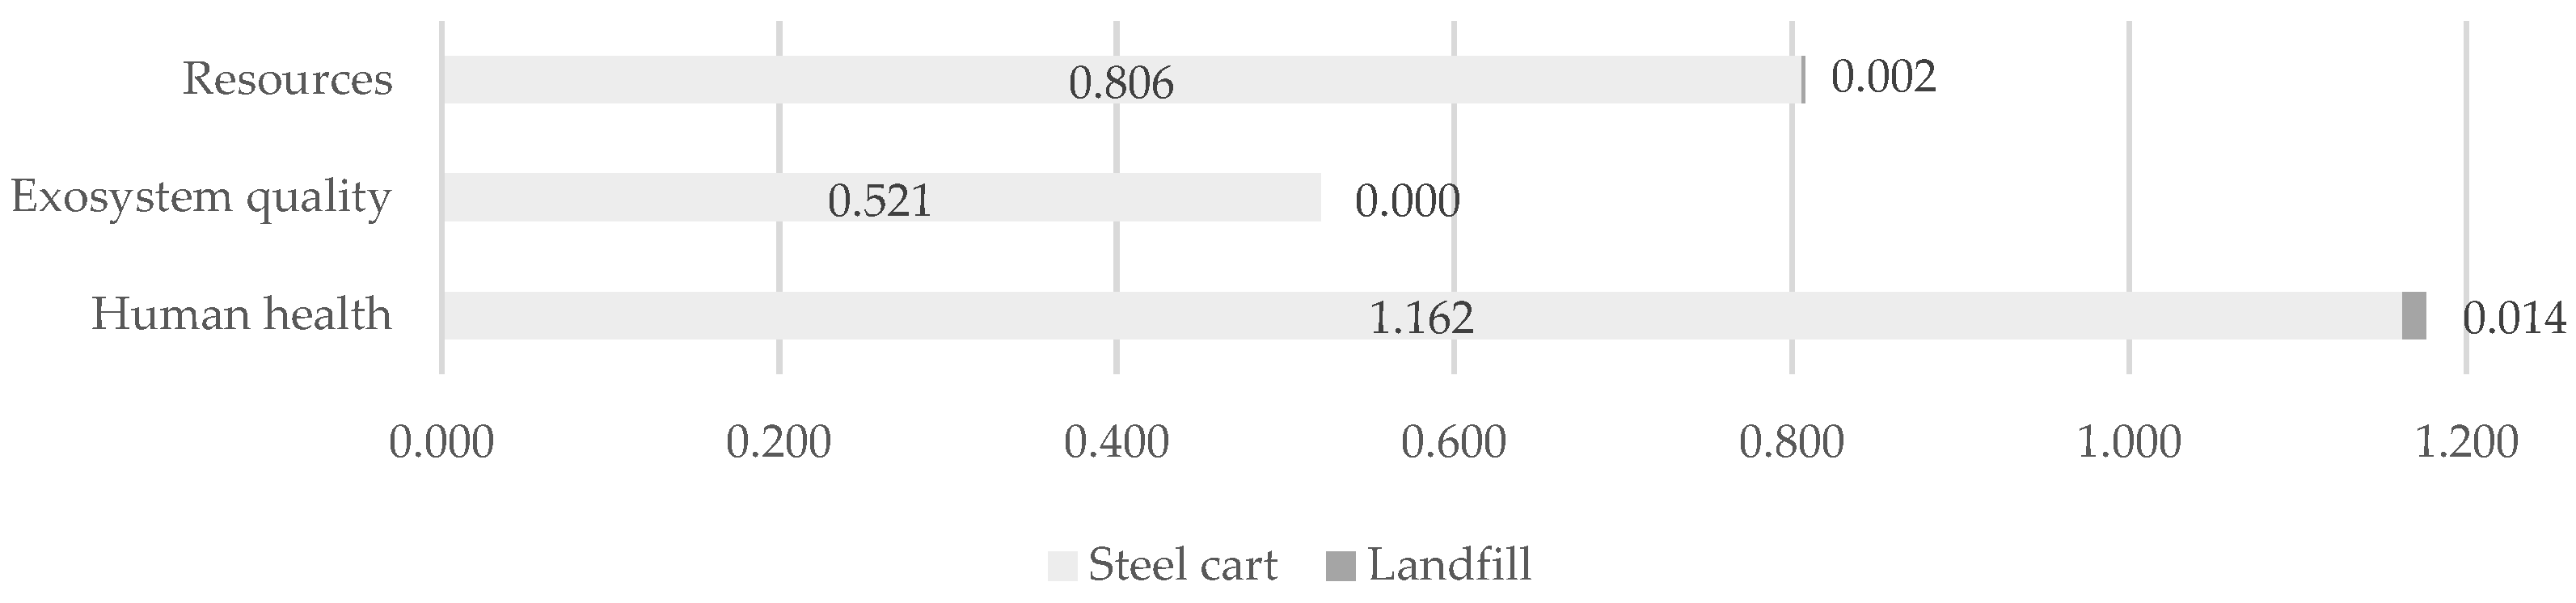
Figure 24.
Weighting by damage categories for the polypropylene trolley (mPt).
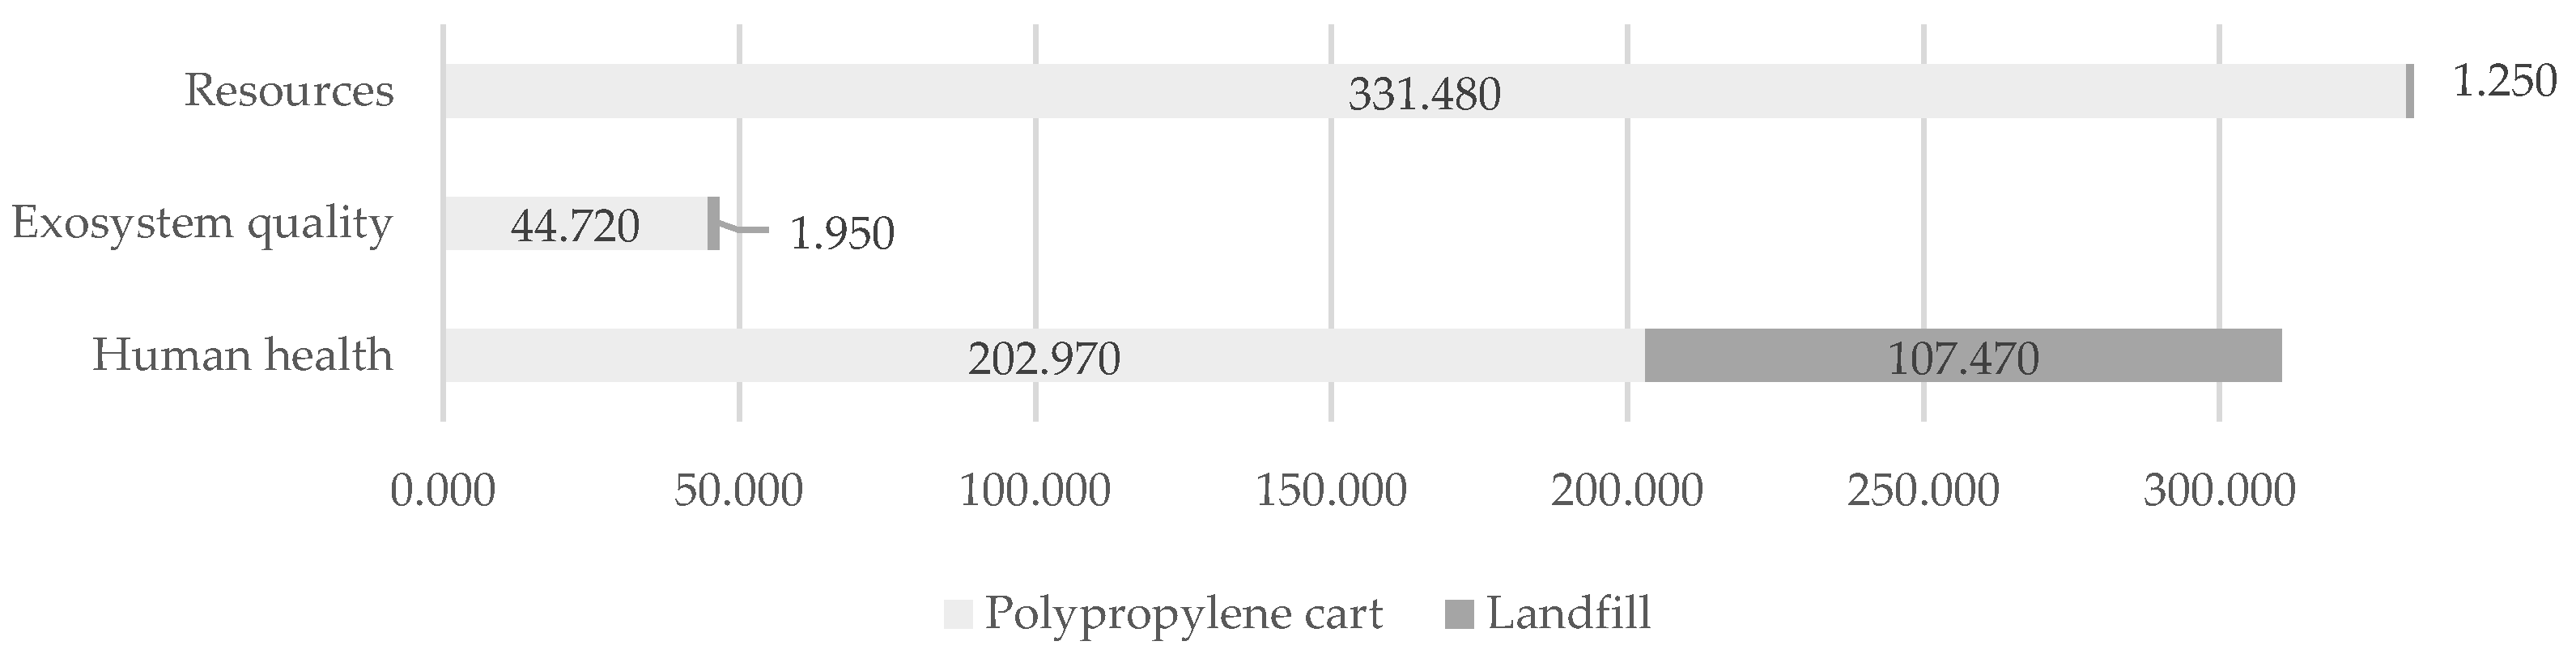
Figure 25.
Single score according to damage categories for the metal trolley.
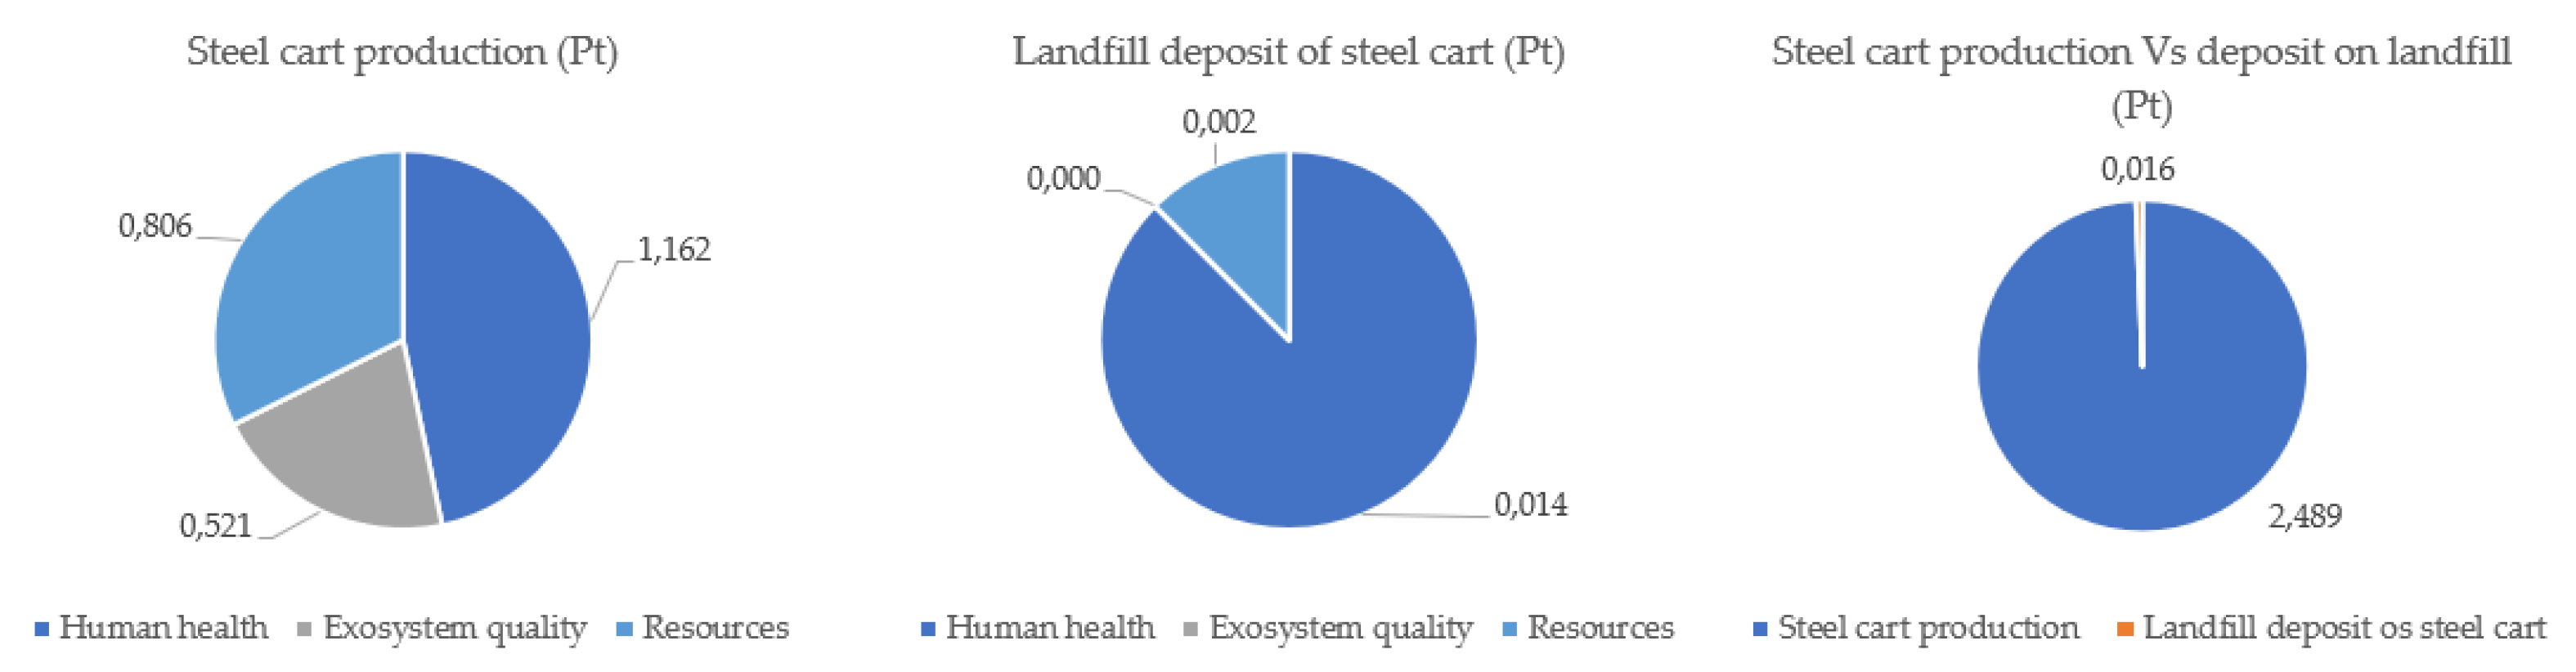
Figure 26.
Single score according to damage categories for the polypropylene trolley.
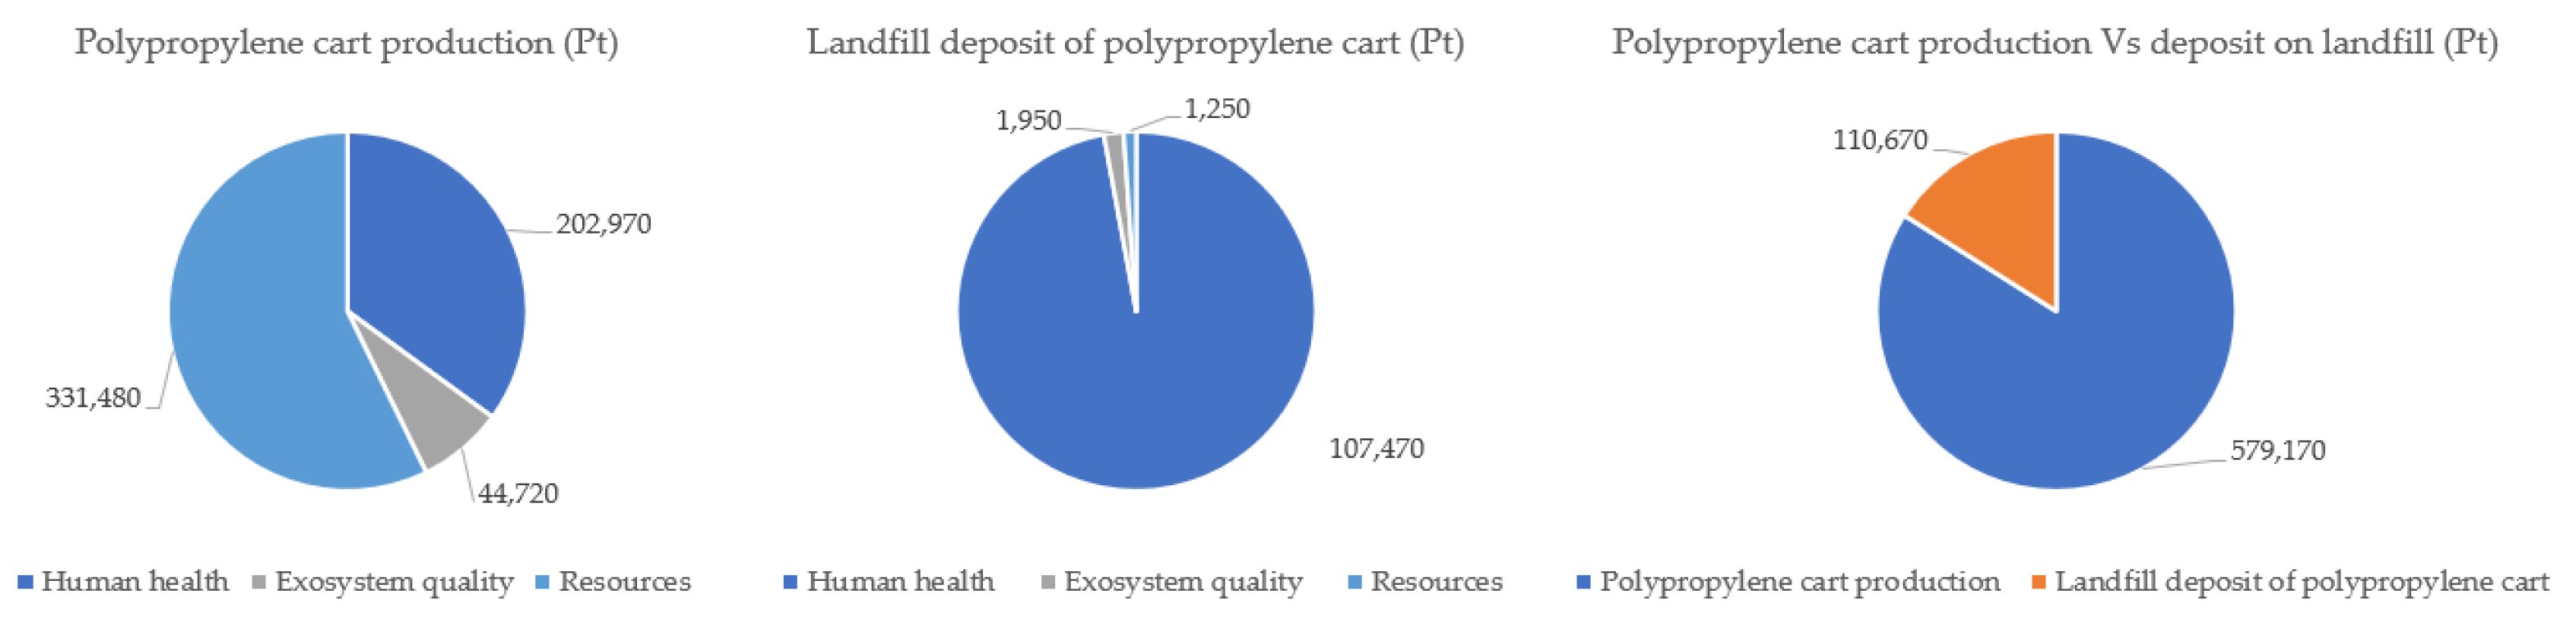
Figure 27.
Characterisation by impact categories for the processing of both trolley types.
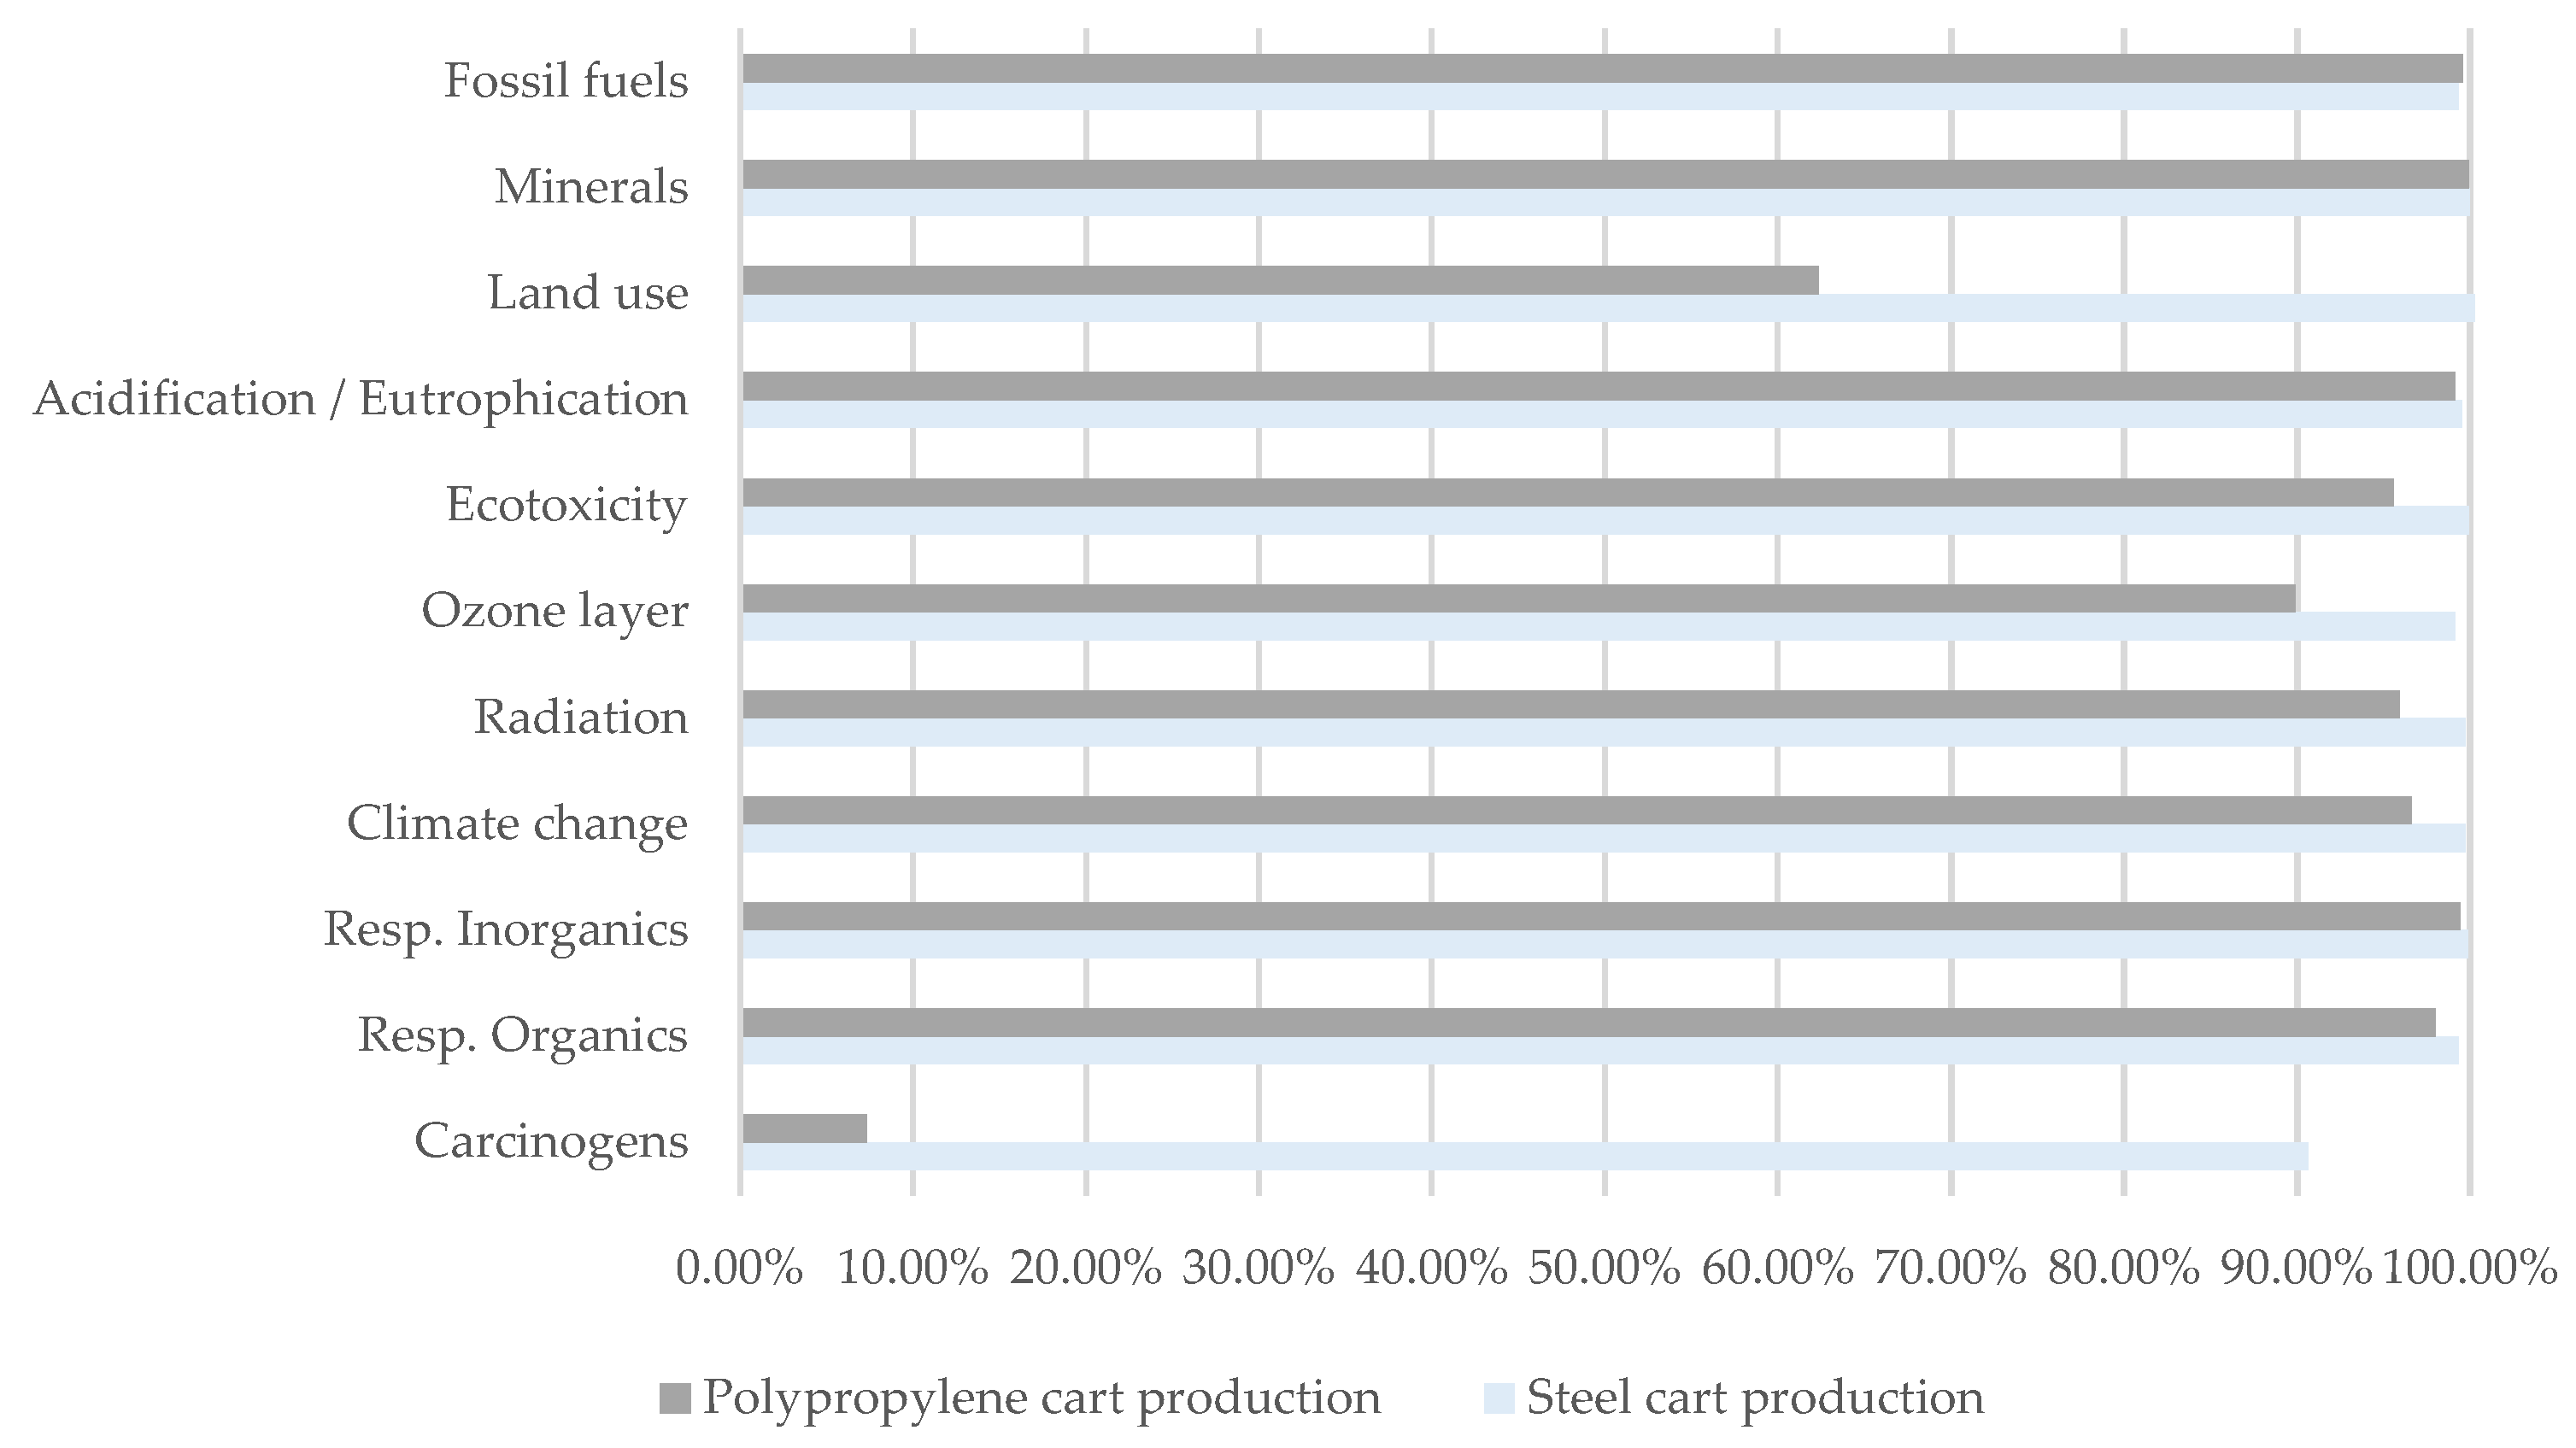
Figure 28.
Characterisation by impact categories for landfilling of both types of trolleys.
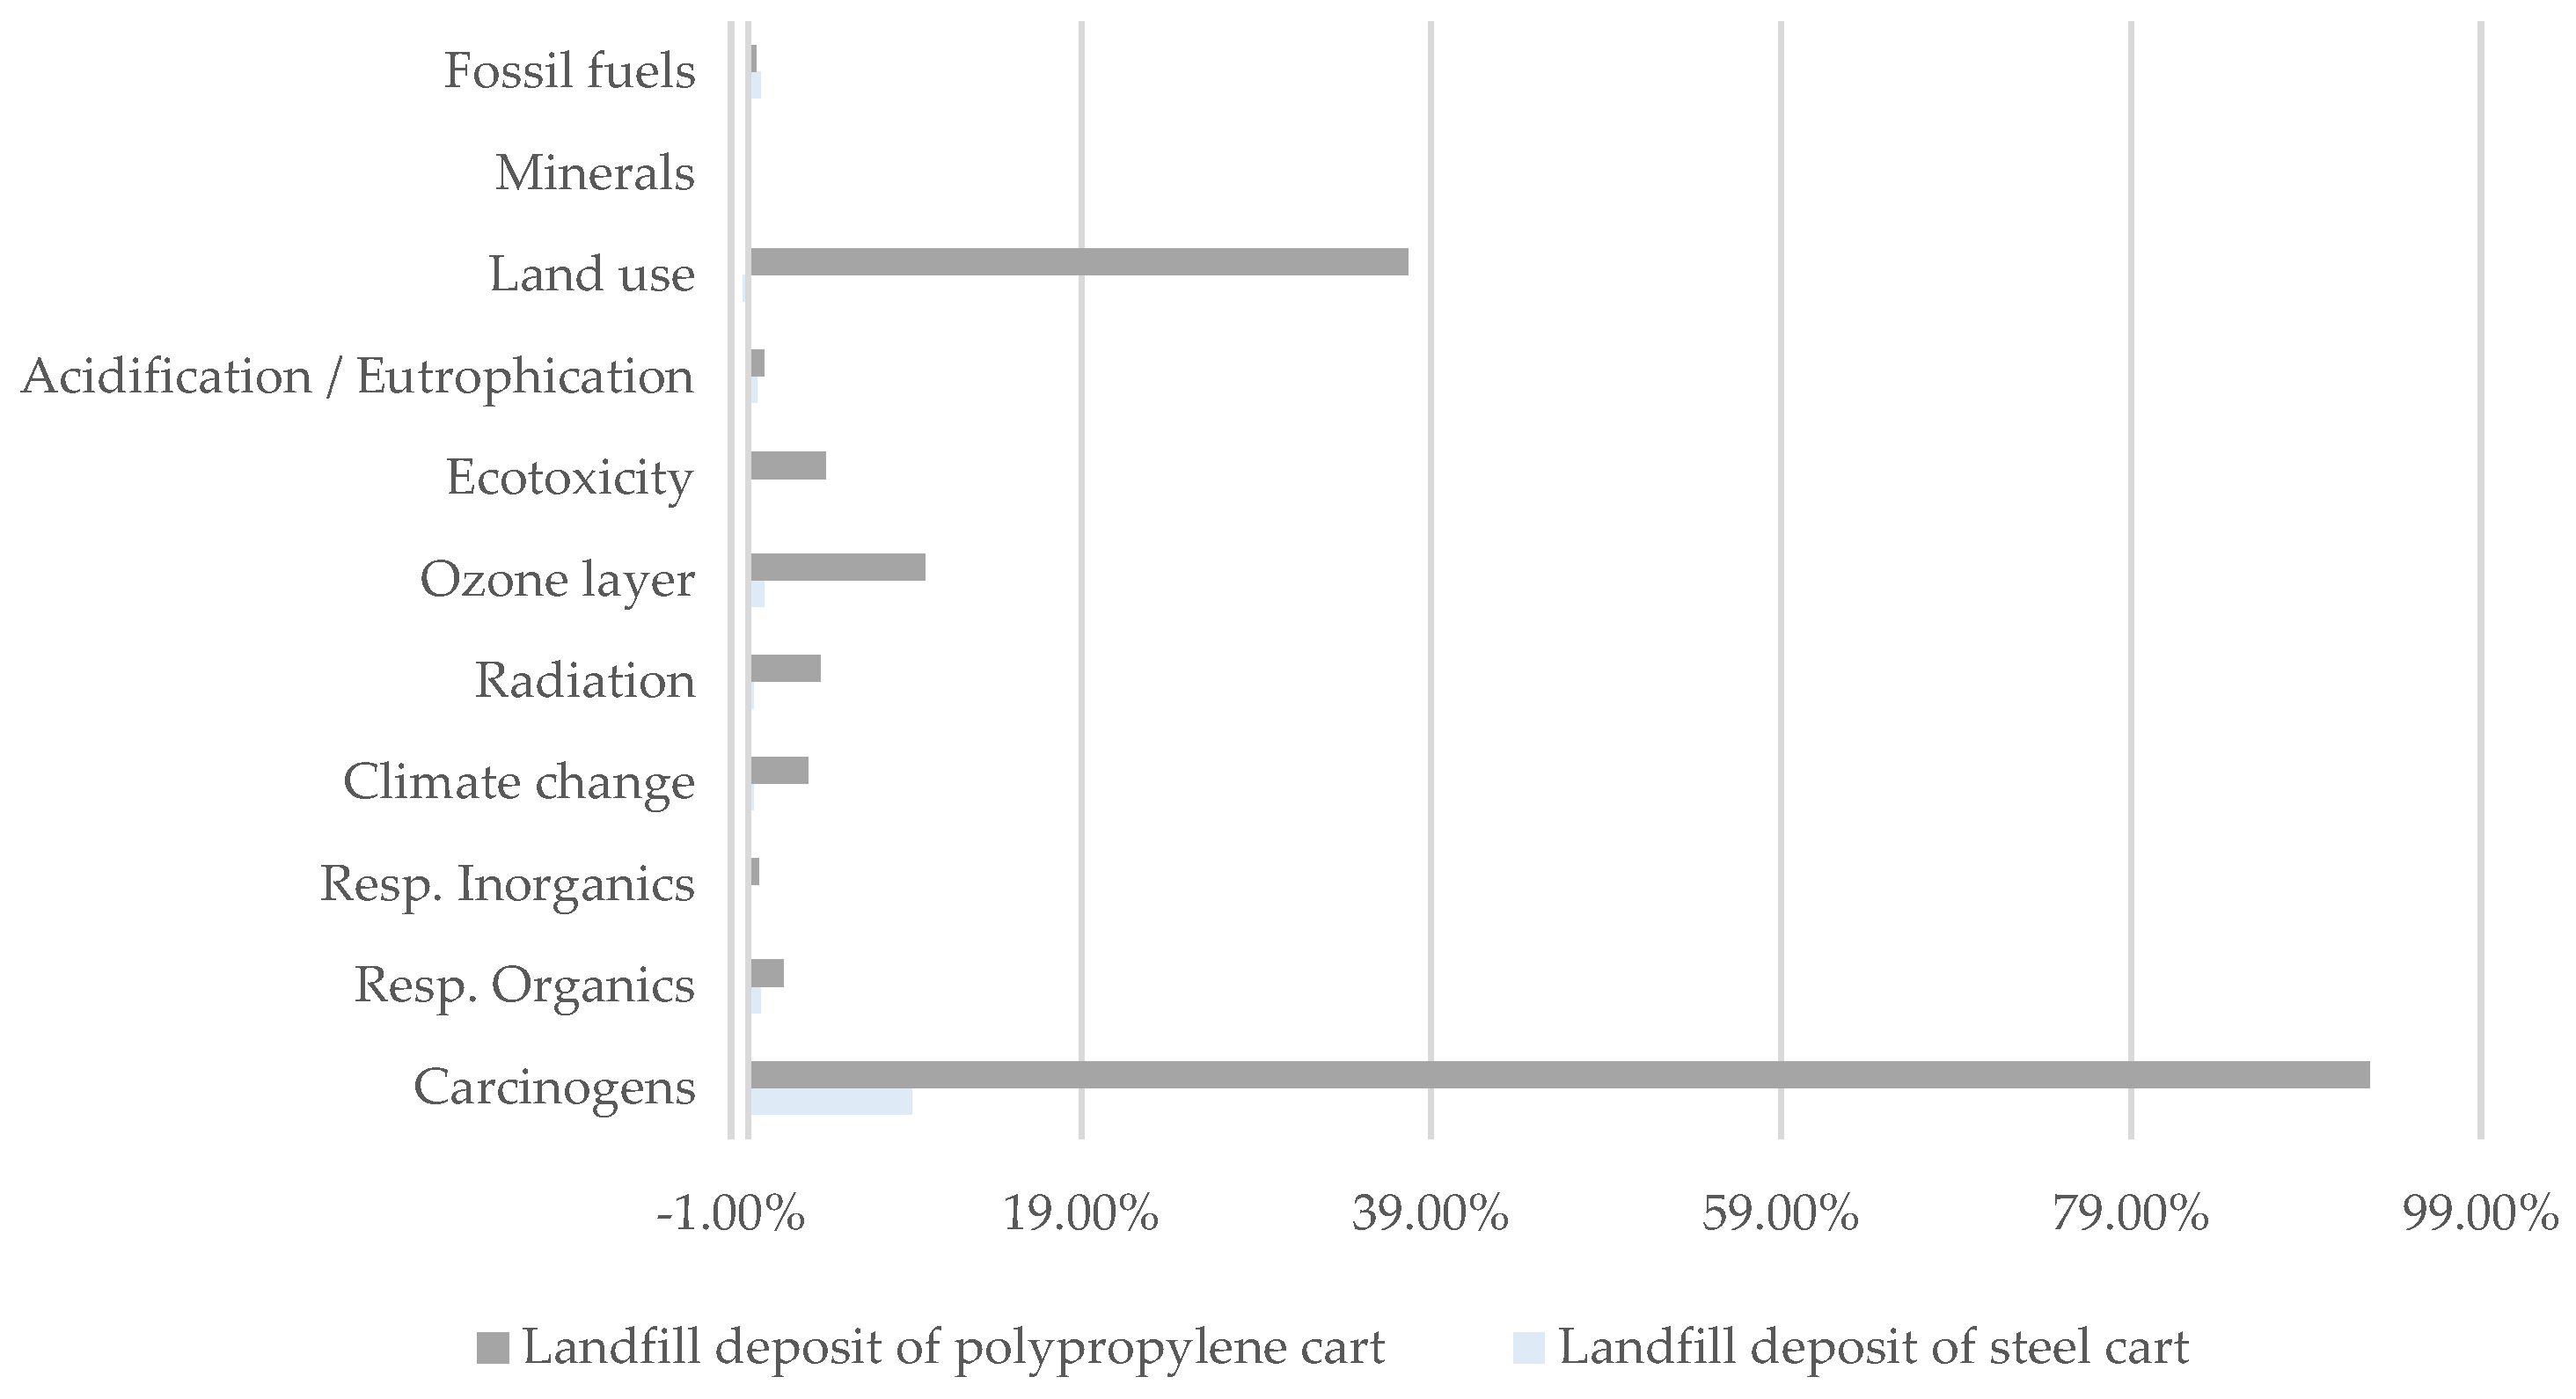
Figure 29.
Normalisation of the damage results in the processing of both types of trolleys.
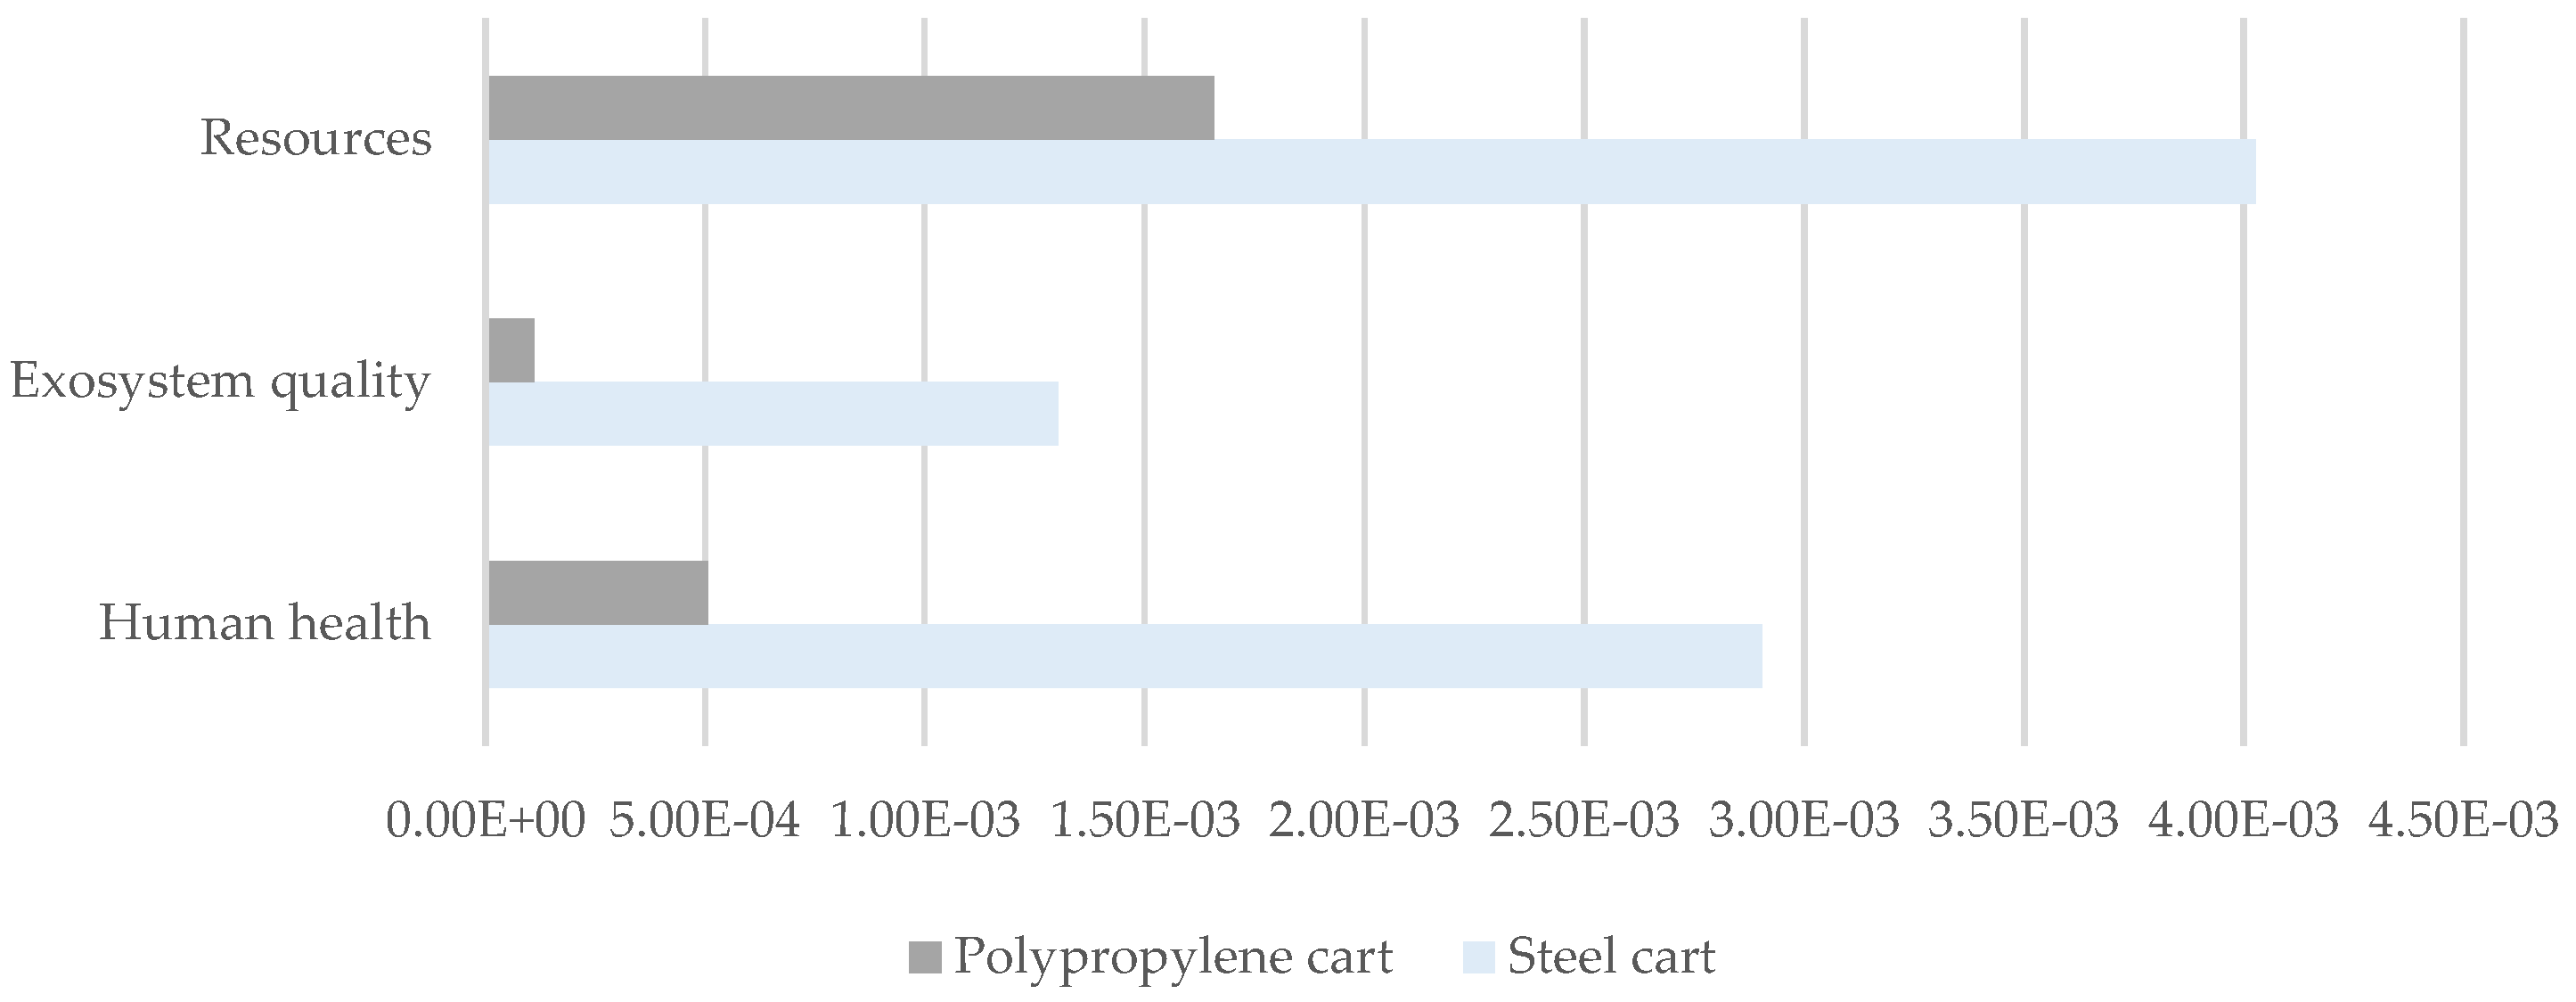
Figure 30.
Normalisation of landfill damage results for both types of trolleys.
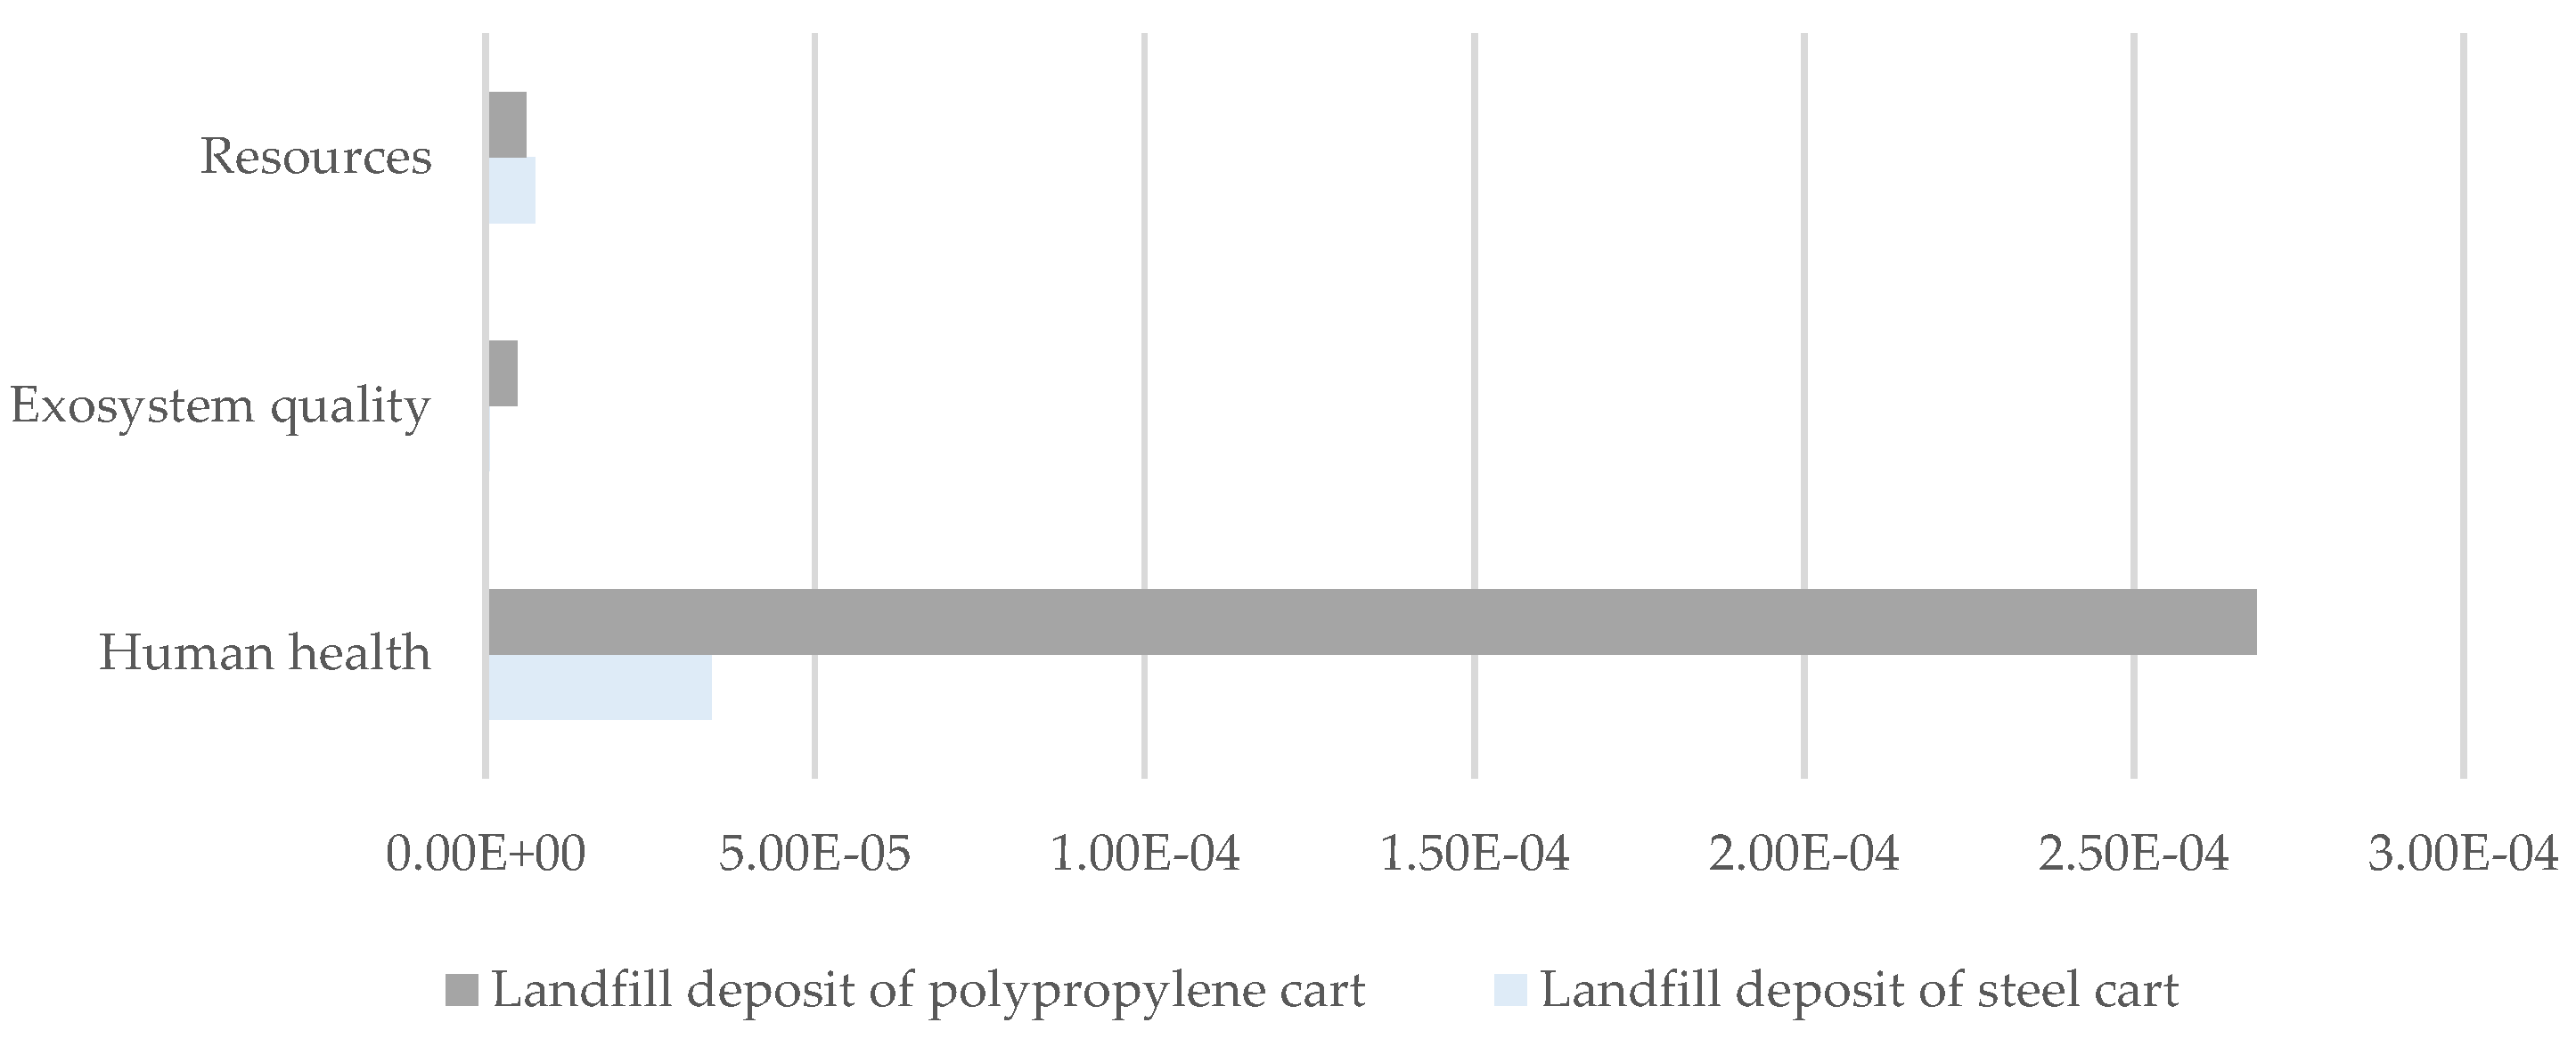

Table 1.
Mechanical connection elements for assembly of the metal trolley.
| Screw type | Quantity | Sub-process |
|---|---|---|
| Hexagon head M12 | 8 | Attachment of the wheels to the lower structure |
| Hexagon head M12 | 4 | Attachment of the basket to the lower structure |
| Hexagon head M24 | 2 | Assembly of handlebar |
Table 2.
Mechanical connecting elements for assembly of the polypropylene trolley.
| Screw type | Quantity | Sub-process |
|---|---|---|
| Hexagon head M12 | 8 | Attachment of the wheels to the lower structure |
Table 3.
Damage characterisation factors for the damage category: human health.
| Harm Category (Human Health) 1 | Damage characterisation factor |
|---|---|
| Carcinogenic substances | 1 |
| Breathed-in organics | 1 |
| Climate change | 1 |
| Radiation | 1 |
| Ozone layer | 1 |
1 damage is denoted in DALY (sum of the number of years of life lost and the number of years lived disabled) /kg emission.
Table 4.
Damage characterisation factors for the damage category: ecosystem quality.
| Damage category (ecosystem quality) 1 | Damage characterisation factor |
|---|---|
| Ecotoxicity (PAF m 2 year) | 0.1 |
| Acidification-Eutrophication (PDF m 2 year) | 1 |
| Land use (PDF m 2 year) | 1 |
Table 5.
Damage characterisation factors for damage category: resources.
| Damage category (resources) 1 | Damage characterisation factor |
|---|---|
| Fossil fuels | 1 |
| Minerals | 1 |
1 damage is denoted in surplus MJ (energy needed to extract minerals and fossil fuels in the future).
Table 6.
Normalization factors for each damage category.
| Damage category | Normalization factor |
|---|---|
| Human health | 65.1 |
| Ecosystem quality | 1.95E-04 |
| Resources | 1.19E-04 |
Table 7.
Weighting factors for each damage category.
| Damage category | Normalization factor |
|---|---|
| Human health (DALY) | 400 |
| Ecosystem quality (PDF m2 year) | 400 |
| Resources (surplus MJ) | 200 |
Disclaimer/Publisher’s Note: The statements, opinions and data contained in all publications are solely those of the individual author(s) and contributor(s) and not of MDPI and/or the editor(s). MDPI and/or the editor(s) disclaim responsibility for any injury to people or property resulting from any ideas, methods, instructions or products referred to in the content. |
© 2024 by the authors. Licensee MDPI, Basel, Switzerland. This article is an open access article distributed under the terms and conditions of the Creative Commons Attribution (CC BY) license (http://creativecommons.org/licenses/by/4.0/).
Copyright: This open access article is published under a Creative Commons CC BY 4.0 license, which permit the free download, distribution, and reuse, provided that the author and preprint are cited in any reuse.


