
Submitted:
15 November 2024
Posted:
18 November 2024
You are already at the latest version
Abstract
Micro and nanoplastics have become increasingly relevant as contaminants to be monitored due to their potential health effects and environmental impact. Nanoplastics, in particular, have been shown to be difficult to detect in drinking water, requiring new capture technologies. In this work, we applied the acoustofluidic seed particle method to capture nanoplastics in an optimized, tilted grid of silica clusters even at the high flow rate of 5 mL/min. Moreover, we achieved, using this technique, the enrichment of nanoparticles ranging from 500 nm to 25 nm as a first in the field. We employ fluorescence to observe the enrichment profiles according to size, using washing buffer flow at 0.5 mL/min, highlighting the size-dependent nature of silica seed particle release of various sizes of nanoparticle. These results highlight the versatility of acoustic trapping for a wide range of nanoplastic particles and allow further study into the complex dynamics of the seed particle method at these size ranges. Moreover, with reproducible size-dependent washing curves, we provide a new window into the rate of nanoplastic escape in high-capacity acoustic traps, relevant for both environmental and biomedical applications.
Keywords:
Microplastics
; Acoustofluidics
; Seed Particle Method
; Silica-Enhanced Seed Particle Method
; Nanoplastics
; Acoustic Trap
; Microfluidic-based Separation
1. Introduction
Plastics have become a staple material in human activity since their inception 70 years ago [1]. While their production and applications have developed tremendously, concerns are being raised regarding adequate disposal and end of life cycle outcomes [2]. The benefits of this material are several - cost-effectiveness, ease of production, versatility and long shelf-life. These are essential for the packaging, medical and textile industries, to name a few [3]. However, it is their resistance to biodegradability which is at the core of an increasing risk to environmental and human health as plastics accumulate in various ecosystems, from aquatic [4] to terrestrial [5]. Ultimately, this leads to the presence of micro and nanoplastics in consumer goods like food [6] and drinking water [7], in the form of micro and nanoplastics. These can be primary, produced by human activity with the explicit aim of being used as micro and nanoparticles, or secondary, which leach from larger polymer bodies when exposed to ultraviolet radiation or abrasion [8]. In terms of size, microplastics are commonly defined as being smaller than 5 mm and larger than 1 µm, whereas nanoplastics are below that threshold. At the micro and nano size ranges, modern sample management and analytical tools struggle to provide a reliable, sample to answer system for micro and nanoplastic monitoring [9]. There is a need to better understand the presence, type and life cycle of micro and nanoplastics, considering that they have already been found in many organs of the human body [10,11,12].
Microfluidics is a field of study that has been used in the past to address accurate manipulation of micro and nanoparticles. It has been essential for the further development of the biomedical field, bringing together disciplines such as chip manufacturing, electrical engineering, technical design, fluid mechanics towards biomedical solutions that aim to improve human health. These solutions are as varied as the multidisciplinarity of the field, having been used, for example, in cancer screening [13], DNA amplification towards sepsis diagnostics [14] and blood component separation [15]. While microparticles have been shown to be manipulated by many techniques [16,18], nanoparticles have been shown to be harder to manage using the same approaches [17]. The potential applications of their accurate enrichment and separation are of enormous interest for the biomedical field. (e.g. for exosome enrichment [19] or virus isolation [20]). The same can be said for the environmental arena, considering the negative implications of nanoplastic contaminants in drinking water.
Acoustofluidics combines sound waves with microfluidics, using piezoelectric transducers to create an acoustic field inside a microchannel, altering the way in which microparticles behave. Acoustic actuation has been used for microparticle focusing [21], separation [22] as well as nanoparticle capture [23]. However, these capabilities have not, at present, been developed to have a flow rate that is compatible with the high-volume applications required for environmental samples. Techniques like electrophoresis, field-flow fractionation or deterministic lateral displacement have been able to manage nanoparticles at flow rates above a few µL/min [17]. In order for new monitoring solutions to be effective for micro and nanoplastics, it is necessary that they are able to sustain adequate performance even at high flow rates while extracting a sufficient amount for endpoint analysis. For this reason, a technique that combines high flow rates with nanoplastic capture is of great interest as a proof of concept for a future environmental monitoring application that can capture not only microplastics but nanoplastics as well.
Previously, we developed the EchoGrid, a high-throughput acoustofluidic device for microplastic enrichment [24], which was a crucial first step into applying acoustofluidics towards drinking water application. In this paper, we report the EchoTilt, an acoustofluidic method designed to maximize nanoplastic capture in an array of acoustic nodes using the silica-enhanced seed particle (S-ESP) method, building off our previous work. For this, we employed a computational approach for optimizing the best angle which predicts maximum nanoparticle-cluster interaction. We demonstrate for the first time that it is possible to capture nanoparticles down to 25 nm and enrich them even at the high flow rate of 5 mL/min. Our comprehensive study quantifies, through fluorescence, the enrichment rates of 500, 200, 100, 50 and 25 nm microplastics in silica clusters, highlighting the impact of size in the behaviour of these particles. Finally, we performed washing experiments to understand the size-dependence of nanoparticle leaching from silica seed particles, paving the way for applications in which nanoparticles are used and their dynamics in seed particles are important, whether it be environmental or biomedical in nature.
2. Materials and Methods
2.1. Acoustofluidic Device
2.1.1. Fabrication and Modelling
The acoustofluidic device is made by integrating a piezoelectric transducer with a polydimethylsiloxane (PDMS) microchannel sealed with a glass reflector layer. The surface displacement transducer was created by milling a 0.1 mm-deep indent into the backside of a 30×20 mm2 piezoelectric transducer (Pz-26, Parker Meggitt, UK), determining the trapping region. The tilted shape of this indentation and its milling files were designed and generated using AutoCAD and Fusion 360 (Autodesk Inc, CA, US). For the milling of both the SDT and the mould, a computerized numerical control (CNC) milling machine (Modela MDX-40A 3D Milling Machine, Roland DGA, CA, US) was used.
The transducer was then integrated with the PDMS microchannel. This was done through standard soft lithography. The polymethyl methacrylate mold was milled from a 0.5-mm PMMA substrate and placed in a petri dish. PDMS was mixed in a 10:1 ratio of monomer to curing agent (SYLGARD 184, Dow Corning, MC, US) and was then poured into the mould, where the SDT had already been placed. This assembly was degassed for 45 minutes and then cured at 60ºC for 90 minutes. After fluidic connection were done with a 20 ga syringe (Instech Laboratories Inc., PA, US), the microchannel was sealed with a glass reflector layer. This was done by using an oxygen plasma treatment to activate the surface of a 75×38×1 mm3 borosilicate microscope slide (Corning Inc, NY, US) and of the PDMS slab, which were then bonded together through direct contact.
2.1.2. Device Modelling
Similarly to previous work, two theoretical models were combined to predict the operation of the device. A 1D model based on an acoustic transmission line was used to determine the main axial resonances generated by the various material layers of the transducer. Then, COMSOL Multiphysics (COMSOL 6.1, COMSOL Multiphysics, Sweden) was used to find the adequate lateral dimensions of the SDT-protrusion to maximize the lateral resonances of the system through an eigenmode simulation. This work allowed a sweep of various eigenmodes and lateral indent dimensions that informed the selection of an ideal acoustic field node distribution. The frequency that generated this acoustic field was then confirmed by an impedance sweep (Z-Check 16777k, Analog Instruments) to determine the SDT’s admittance peaks. Based on this, the frequency of 2.020 MHz was selected to provide a stable and well-defined grid.
2.1.3. Trapping Area Tilt Modelling
A 7x7 grid square was constructed in Python based on the simulations in prior work Martim1, generating an ideal resonance mode for a 10 mm wide square SDT. This grid was then overlaid with equidistant lines to represent laminar flow, where nanoparticles were assumed to follow fluid lines. Subsequently, a scoring system was developed based on the acoustic pressure decay function obtained from further COMSOL Multiphysics simulations. This function was then normalized to a scoring range of 0 to 1. In this scoring system, a score of 1 indicates that the flow line passes through the center of the cluster, while a score of 0 signifies that the flow line falls outside the effective of the cluster's influence. The radius of each cluster was delineated to be 0.49 arbitrary units (a.u.). The developed algorithm then employed an angle sweep between 0 and 90 degrees, allowing the scoring system to evaluate the interaction between fluid flow lines and the acoustic field for every SDT orientation. Each flow line was assigned a score based on its interaction with the clusters. To determine the overall effectiveness of the acoustic field at each tilt angle, a final score was computed by taking the median value of all the individual scores. Based on these scores, the optimal flow line interaction with the acoustic cluster field was observed in the Python script at a tilt angle of 16º.
2.2. Experimental
2.2.1. Setup and Samples
The experimental setup used with the EchoTilt was composed of a signal generator (DS345, Stanford Research Systems, CA, US), a 4× current amplifier (ADA4870ARR-EBZ, Analog Devices, MA, US), a syringe pump (PHD Ultra, Harvard Apparatus, MA, US) and a fluorescence microscope (Axiovert 135M, Carl Zeiss AG, Germany). In terms of fluorescence acquisition, the exposure time used was 200 ms at a magnification of 10×. The fluidic connections were made with plastic tubing (BTPE-60, Instech Laboratories Inc., PA, US), metallic connectors (SC20/15, Prime Bioscience, Singapore) and plastic syringes (Plastipak, BD Bioscience, NJ, US).
The nanoparticle suspensions were created by diluting a stock of polystyrene nanoparticles. The ratio used was 1 ml/1000 mL (Stock/MQ Water, 1000× dilution). This method was followed for every particle size, including 500 nm (Red Fluorescent Fluoro-Max, ThermoFisher, CA, US), 200 nm (Green Fluorescent Fluoro-Max, ThermoFisher, CA, US), 100 nm (Green Fluorescent Fluoro-Max, ThermoFisher, CA, US), 50 nm (Green Fluorescent Fluoro-Max, ThermoFisher, CA, US) and 25 nm (Green Fluorescent Fluoro-Max, ThermoFisher, CA, US), and a vortexer was used to prevent sedimentation from occurring. The silica solution was created by mixing 1 wt% detergent (Tween-20) with 10 µm silica particles (Sigma-Aldrich, Switzerland) in deionized water. To prime the chip, deionized water was used. To clean the chip between experiments, 50% ethanol was used.
2.2.2. Experimental Procedure
This work relied on the silica-enhanced seed particle method. For this, a high concentration silica solution is flowed through the channel and then the acoustic field is activated. This creates the grid of silica clusters, which is then washed with MQ water at 15 mL/min to remove the excess silica from the device. Finally, the nanoplastic sample is loaded into the device at the flow rate relevant for the experiment which results in the capture of the nanoparticles within the silica clusters. An image was taken every time point with the fluorescence microscope. This fluorescence data was processed using ImageJ and a distinct colour was attributed to each particle type. Furthermore, all graphs were created using GraphPad (GraphPad Software Inc, US).
3. Results and Discussion
3.1. Flow Simulation and Tilting
The development of the EchoTilt method is an optimization of the EchoGrid [24] for nanoparticles, an acoustofluidic platform reported previously, towards more effective nanoparticle enrichment. There is a crucial alteration between the two designs, and that is the tilt angle of the milled slot on the back of the SDT. Based on the assumption that nanoparticles follow flow lines in laminar flow, it is possible to model the ideal tilt of a 7x7 grid of acoustic nodes that maximizes the interaction of a flow line with an acoustic node. We hypothesize that this interaction increases the probability that a nanoparticle will be captured by the acoustic forces inside the silica cluster present at each node and thereby increase the efficiency of the acoustofluidic device.
The eigenfrequencies of the SDT were simulated using COMSOL Multiphysics. Of these, the frequency of 2.020 MHz was selected, which corresponded to a 7x7 array of acoustic nodes. By drawing a line measurement through these nodes, it was possible to extract the plot the acoustic pressure decay with distance from the center of the cluster. This function was essential to formulate a Python scoring algorithm that calculated, for each degree of tilt, the level of interaction of the total flowlines with the acoustic cluster. The schematic of the flowline-cluster interaction can be found in Figure 1A. To facilitate flow line scoring according to the distance in which they cross each cluster, the acoustic pressure decay function was normalized to a 0-1 range (Figure 1B). This normalized function was then applied to every flow line during a sweep of each tilt angle, and the total median score was collected for each (Figure 1D).
Three representative tilt angles can be observed in Figure 1C. In the EchoGrid's original position at 0 degrees, one can see 7 peaks representing the each of the 7 centers of the acoustic nodes crossed by a flowline. As the tilt angle changes, the scoring shape also changes, with the peak patterns becoming increasingly uniform. In other words, at 0 degrees, there is a high score for all flow lines going straight through a cluster while there is a minimal score for those crossing in between two clusters – showing that there is considerable variability in nanoparticle capture. This variability means that nanoparticles are subjected to strong forces in the flowlines that go through the center of the clusters but are able to escape through flow lines in between. By reducing this variability, we ensure that most nanoparticles cross at least one cluster before leaving the active trapping area. This is most aptly demonstrated at a tilt of 16º, where a uniform behaviour with minimal fluctuations is achieved for the majority of the grid. Further tilting diminishes this stability and theorized capture efficiency.
Furthermore, we chose the median instead of the mean (Figure 1D) as a measure of central tendency due to its robustness against extreme values. This approach offers a more accurate representation of the expected filtering efficiency of each acoustic node in the EchoGrid, rather than being skewed by potentially high or low scores. Additionally, outer nodes are less representative of the behavior of nodes in the core of the EchoGrid, as it is in the center of the trapping area that more nanoparticles will flow through not only due to hydrodynamic effects but also due to acoustic streaming. Ultimately, this analysis led to the selection of 16º as the tilt angle to be fabricated for the EchoTilt method.
In the back of the microfluidic chip (Figure 2A), we mill the shape of the desired tilted capture area in the microchannel on the other side (Figure 2B). Without the straight empty lines in between the silica clusters visible in Figure 2C, we force the nanoplastics present in solution to necessarily cross at least one cluster in accordance with the produced algorithm, maximizing the efficiency of the trapping area especially if there is a low concentration of contaminants (Figure 2D). Note that there is less silica outside of the trapping area. This is because this picture was taken after the washing step. The clusters can be made more numerous and wider by using a larger initial silica concentration.
3.2. Nanoplastic Enrichment
The enrichment of nanoparticles has been a challenge in microfluidic separation in general, particularly at high flow rates. In acoustofluidics, the main techniques used for manipulating particles at the nanoscale are acoustic streaming [25] and the seed particle method [26]. While the former pertains to vortices in the fluid layer, which in turn carry the nanoparticles, the latter uses larger seed particles to create interstitial anchoring points where the analytes can be trapped. At this time, the minimum trapped nanoparticle size using this method has been reported to be 100 nm, at a flow rate of up to 10 µL/min [25]. The maximum flow rate, pertaining to enriching 270 nm beads, has been reported to be 30 µL/min [23]. Here, we use the S-ESP to investigate what is the minimum particle size that can be captured, as well as what is the maximum flow rate of solution from which enrichment is possible. To evaluate whether the EchoTilt method can achieve better outcomes in terms of minimum particle size and throughput, we flowed five different fluorescent particles (500 nm, 200 nm, 100 nm, 50 nm and 25 nm) through an array of silica seed particle clusters at two distinct flow rates (5 ml/min and 2 ml/min) and evaluated their enrichment measured over an arbitrary cluster.
3.2.1. Enrichment of Larger Nanoplastics (500, 200 and 100 nm)
Capturing nanoparticles using acoustic trapping is known to become more challenging as the target analyte becomes smaller [25]. For this reason, this study first aimed to evaluate whether high throughput enrichment of these larger nanoparticles was possible, even though the primary radiation force (PRF) is weaker, considering how powerfully it decays with a reduction in particle size. This suggests that the secondary radiation force (SRF) has a more relevant role in trapping nanoparticles when compared to microparticles.
In Figure 3, we present the increase of fluorescence across time in a silica cluster hovering above the surface of the transducer. Due to a combination of solution fluorescence and light reflection from the surface of the transducer, it is possible to see in some images coloured background light. The trapping of these nanoparticles can be clearly denoted in the clusters for all three particles (100, 200 and 500 nm), and can be extrapolated to be similar for the remaining 48 clusters of the 7x7 grid. At this high flow rate (5 mL/min), some clusters can slightly drift from their initial position, shifting in an equilibrium state caught between the acoustic field and the stokes drag of the fluid. We observe, particularly in the case of 500 and 200 nm, that, once captured by a silica cluster, there are kernels of nanoparticles formed in the interstitia which help collect further nanoparticles – which is particularly visible for t = 3 min and t = 5 min for 200 nm particles. This also suggests, when compared to the same case for 500 nm, that these nanoparticle kernels form with greater ease in larger silica clusters as these serve as a porous funnel anchoring flowing nanoparticles into larger clusters that are not only particularly susceptible to the SRF but also become actuated by the PRF.
In other words, the use of a high-capacity grid of silica clusters through the S-ESP method has two distinct advantages: a large area of capture, simultaneously increasing throughput and captured sample percentage, and large silica clusters that are conducive to the formation of nanoparticle kernels within them, increasing efficiency and relevancy for endpoint analytical applications.
In the lower flow rate experiment, Figure S1, we also observe a smaller 100 nm kernel, even though it is a rare occurrence compared to the larger particles. However, the slower enrichment provides an interesting observation, particularly visible in the 200 nm experiments, which is that the fluorescence of the cluster progresses from the edges of the silica body to its core as time goes on, suggesting that the more accessible interstitial places are filled first and once these are saturated, the fluorescence moves closer to the center.
The graphs pertaining to the fluorescence progression of these experiments can be found in Figure 6A-B, and will be commented in that section.
3.2.2. Enrichment of Smaller Nanoplastics (50 and 25 nm)
For smaller nanoparticles, we cannot observe any formation of large fluorescent bodies. To our knowledge, 25 nm plastics have not been captured using acoustic waves in literature. In Figure 4, we observe the growing fluorescence of the silica cluster under question for both cases (50 and 25 nm) at 5 mL/min. In both cases, we cannot observe specific particles fluorescing even at high magnifications but instead the fluorescence is indistinguishable from the silica particles themselves. Moreover, unlike what is observed in the case of larger nanoparticles, particularly 200 and 500 nm, there is not an evident increase in fluorescence across time. This suggests that the acoustic silica clusters saturate extremely quickly and cannot hold more nanoplastics – which stands to reason, considering that, with their smaller size, they can better reach every interstice of the clusters if the concentration is high enough.
A decrease in flow rate to 2 mL/min (Figure S2) does not show a significant loss or gain in enrichment performance, further demonstrating that the enrichment saturation speed for smaller particles is higher than in the case of bigger nanoplastics. This has implications at the level of what could be the minimum amount of fluid required, depending on what concentration of contaminant exists, to ensure the fastest capacity saturation of a given silica cluster. This would depend on cluster size among other factors but is an interesting study outside the scope of this work.
3.2.3. Washing of Captured Nanoparticles
To better understand the dynamics that inhere in the interaction between plastic nanoparticles and silica clusters, we added a washing step after enrichment. This washing step allowed us to model nanoplastic release with time under a constant, yet significant, flow rate of 0.5 mL/min, relieving any concerns about fluorescence being solely due to the flowing solution or background reflection.
In Figure 5, we observe the tile set representing all the fluorescence images pertaining to these experiments after the 5 mL/min experiments (for the 2 mL/min experiments, refer to Figure S3) and in Figure 6C are graphed the values of these images, normalized to the first value. We hypothesized that the small nanoparticles, being less susceptible to both the PRF and the SRF, would be less firmly captured in the cluster under the buffer flow, especially those trapped in the midlines between two arbitrary particles. As the cluster is filled, the best spots are quickly taken – which are a combination of very tightly packed silica beads with a stable local acoustic field. This proximity maximizes the SRF while physically constraining the analytes, which is much harder for smaller nanoparticles.
From visual inspection, we observe that this was what we obtained, corroborated as well by the graph in Figure 6C. The fluorescence from the clusters is removed at a higher rate in the beginning of the washing experiment, and this effect is more pronounced for the smaller nanoplastics (25 and 50 nm). For the larger nanoplastics, we observed an intermediate washing speed for 100 nm nanoparticles and a greater resistance to displacement for 200 and 500 nm. While every trial involving smaller (25 and 50 nm) and intermediate (100 nm) nanoplastics was consistent in its decay, we observed a greater variability in the large nanoplastic (200 and 500 nm) case in spite of their resilience to flow. This can be attributed to the PRF having a stronger effect on these particles, especially on the kernels they are likely to create during enrichment.
In our comparison of the enrichment profiles of the clusters at 5 mL/min (Figure 6A) and 2 mL/min (Figure 6B), we observe a trend for each flow rate. While at 2 mL/min (Figure 6B), the fluorescence profile is consistent for all particles after the first time point, with a noted increase for the larger particles (200 and 500 nm), which is expected. However, at 5 mL/min (Figure 6A) the results lose all semblance of stability and, instead, portray an exaggeration of the trend found in Figure 6B. Specifically, we see the small nanoplastics (25 and 50 nm) either decay or barely maintain a level fluorescence, with 100 nm following suit. Conversely, we observe the large nanoplastics (200 and 500 nm) shoot up in fluorescence in the same experimental time. This raises considerable questions which, combined with our previous findings [24], suggest that there is a give and take to be observed when it comes to high throughput micro and nanoplastic capture. While in our previous work we used only microplastics and concluded that a higher flow rate was compatible with better enrichment outcomes without sacrificing too much efficiency, we demonstrate, using the EchoTilt method, that this is not necessarily the case for nanoplastics in general.
For 200 and 500 nm, an increase in flow rate (from 2 mL to 5 mL) is clearly associated with an increase in cluster fluorescence by the end of the experiment, whereas there appears to be a cutoff point at 100 nm from which the enrichment of every smaller particle decreases in effectiveness with higher flow rate. This allows us to conclude that the PRF is essential for enrichment at greater throughputs, with nanoparticles of larger dimensions leveraging their susceptibility to this force to increase the probability with which they are captured in the clusters. The S-ESP method had already demonstrated that it is by creating conditions where the SRF can occur that very powerful trapping forces are obtainable to process large volumes at acceptable efficiently, but here we observe, experimentally, the cut-off point where the combination of the PRF with the SRF is insufficient to continuously increase the number of trapped particles in the clusters at ultra-high flow rates. At best, the cluster can be filled by small and medium nanoplastics (100, 50 and 25 nm) in its most attractive circumstances, but there is an upper limit to this, which is attained in less than a minute (the first point where normalization occurred) for 5 mL/min, the high flow rate case.
We were then interested in observing the washing profiles of all the nanoplastics (Figure 6C), as these would also provide clues as to the comparative forces relevant for each size of particle. Effectively, every particle washes with a reverse exponential curve in which the inflection point is lowest on the normalized fluorescence scale the smaller the particle in question. Furthermore, we note that for the smaller nanoparticles (25 and 50 nm) the variability in results is quite low, with small errors bars, showing that the trapping effect for these particles is extremely consistent and unlikely to stochastically form large particle kernels with high levels of particles and, consequently, fluorescence. However, like all particles, the fluorescence loss regime exemplifies a more stable, linear decay after the 4th minute, which even after 10 minutes retains approximately 25% of the particles. In Table 1, we can observe the loss in percentage of fluorescence as time advances in the washing step.
The values of Table 1 indicate that there is a clear similarity between the fluorescence decay values of 25 and 50 nm, with half of the fluorescence washing away within the first two minutes but then slowing down until the decay is stagnated at around 25% fluorescence remaining. The shape of the curve is similar to the one obtained for 100 nm, with a quicker fluorescence loss in the first two minutes and then a slower effect in the final section. For the larger 200 and 500 nm nanoplastics, we have a general resilience to the washing step. Specifically, we observe that in the first two minutes only 11% of the fluorescence of the 200 nm cluster is lost, which stagnates at 15% by the end of the experiment. In the case of 500 nm, we actually have an increase in fluorescence during the washing step. While initially counterintuitive, this is explained by the nanoparticles being released from adjacent clusters and then becoming trapped in the one in question. Because of the increased size of these nanoparticles, they are more susceptible to the PRF and less sensitive to trapping spots within the silica matrix that are less than ideal. Nevertheless, given enough time, we observe that this increase in fluorescence is transient, effectively equalizing with the initial pre-wash value at the end of ten minutes.
5. Conclusions
In this paper, we present the EchoTilt method for capturing nanoparticles at high flow rates. Building on our previous EchoGrid work, in the EchoTilt, we have developed an algorithm to simulate flow and particle interaction in the acoustic grid and generated a statistical score to select the best tilting angle to maximize capture. We applied the tilted acoustic field to our microfluidic channel, successfully using our S-ESP method to enrich nanoparticles in silica clusters from 500 nm down to 25 nm, even at a high flow rate of 5 mL/min, measuring this enrichment using fluorescence imaging. In addition, we evaluate, through a washing step with buffer solution at 0.5 mL/min, the fluorescence decay of enriched clusters, showing the effect of particle size on release rates. We also showed how large nanoparticles are more susceptible to the PRF compared to the smaller nanoparticles, underlining the impact of the SRF for a system using the seed particle method for nanoparticles at the lower size ranges. In conclusion, the EchoTilt method provides a platform for studying the interaction between silica seed particles and nanoplastics even down to 25 nm, offering a new technique to upconcentrate and enrich these difficult-to-manage contaminants for endpoint analysis and monitoring.
Supplementary Materials
The following supporting information can be downloaded at the website of this paper posted on Preprints.org, Figure S1. Silica-Enhanced Seed Particle Method large nanoparticle enrichment at a flow rate of 2 mL/min using the EchoTilt device. The increase in fluorescence is attributed to the flowing nanoparticle solution interacting with the cluster. The particles used were 100 nm (green), 200 nm (blue) and 500 nm (magenta); Figure S2. Silica-Enhanced Seed Particle Method small nanoparticle enrichment at a flow rate of 2 mL/min using the EchoTilt device. The increase in fluorescence is attributed to the flowing nanoparticle solution interacting with the cluster. The particles used were 25 nm (orange) and 50 nm (red); Figure S3. Nanoparticle washing from a silica cluster at a flow rate of 0.5 mL/min directly after enrichment at 2 mL/min. The decrease in fluorescence is attributed to the nano-particles being washed away from the cluster. The particles used were 25 nm (red), 50 nm (orange), 100 nm (green), 200 nm (blue) and 500 nm (magenta)
Author Contributions
M.C.: conceptualization, methodology, validation, visualization, formal analysis, investigation, writing - original draft, writing – review and editing. L.G.: methodology, validation, visualization, formal analysis, investigation. M.J.: methodology, validation, visualization, formal analysis, investigation. B.H.: conceptualization, resources, supervision. S.T.: formal analysis, writing – review and editing. H.J.: writing – review and editing, supervision, project administration, funding acquisition. M.V.: conceptualization, resources, supervision, writing – review and editing. A.R.: writing – review and editing, supervision, project administration, funding acquisition.
Funding
This project has received funding from the European Union’s Framework Programme for Research and Innovation Horizon 2020 under the Marie Sklodowska-Curie Grant Agreement (MONPLAS, No. 860775).
Acknowledgments
This project has received funding from the European Union’s Framework Programme for Research and Innovation Horizon 2020 under the Marie Sklodowska-Curie Grant Agreement (MONPLAS, No. 860775).
Conflicts of Interest
The authors declare no conflicts of interest.
References
- Plastics – The Fast Facts 2023. PlasticsEurope. Available online: https://plasticseurope.org/knowledge-hub/plastics-the-fast- facts-2023/ (accessed on 19 November 2023).
- Gopalakrishnan, K.K.; Sivakumar, R.; Kashian, D. The Microplastics Cycle: An In-Depth Look at a Complex Topic. Appl. Sci. 2023, 13, 10999. [Google Scholar] [CrossRef]
- Andrady, A.L.; Neal, M.A. Applications and societal benefits of plastics. Philos. Trans. R. Soc. B: Biol. Sci. 2009, 364, 1977–1984. [Google Scholar] [CrossRef]
- Thushari, G.; Senevirathna, J. Plastic pollution in the marine environment. Heliyon 2020, 6, e04709. [Google Scholar] [CrossRef] [PubMed]
- Padha, S.; Kumar, R.; Dhar, A.; Sharma, P. Microplastic pollution in mountain terrains and foothills: A review on source, extraction, and distribution of microplastics in remote areas. Environ. Res. 2022, 207, 112232. [Google Scholar] [CrossRef] [PubMed]
- Kwon, J.-H.; Kim, J.-W.; Pham, T.D.; Tarafdar, A.; Hong, S.; Chun, S.-H.; Lee, S.-H.; Kang, D.-Y.; Kim, J.-Y.; Kim, S.-B.; et al. Microplastics in Food: A Review on Analytical Methods and Challenges. Int. J. Environ. Res. Public Heal. 2020, 17, 6710. [Google Scholar] [CrossRef]
- Koelmans, A.A.; Nor, N.H.M.; Hermsen, E.; Kooi, M.; Mintenig, S.M.; De France, J. Microplastics in freshwaters and drinking water: Critical review and assessment of data quality. Water Res 2019, 155, 410–422. [Google Scholar] [CrossRef] [PubMed]
- Song, Y.K.; Hong, S.H.; Jang, M.; Han, G.M.; Jung, S.W.; Shim, W.J. Combined Effects of UV Exposure Duration and Mechanical Abrasion on Microplastic Fragmentation by Polymer Type. Environ. Sci. Technol. 2017, 51, 4368–4376. [Google Scholar] [CrossRef] [PubMed]
- Asamoah, B.O.; Uurasjärvi, E.; Räty, J.; Koistinen, A.; Roussey, M.; Peiponen, K.-E. Towards the Development of Portable and In Situ Optical Devices for Detection of Micro-and Nanoplastics in Water: A Review on the Current Status. Polymers 2021, 13, 730. [Google Scholar] [CrossRef] [PubMed]
- Ragusa, A.; Svelato, A.; Santacroce, C.; Catalano, P.; Notarstefano, V.; Carnevali, O.; Papa, F.; Rongioletti, M.C.A.; Baiocco, F.; Draghi, S.; et al. Plasticenta: First evidence of microplastics in human placenta. 2021, 146, 106274. [Google Scholar] [CrossRef]
- Yang, Y.; Xie, E.; Du, Z.; Peng, Z.; Han, Z.; Li, L.; Zhao, R.; Qin, Y.; Xue, M.; Li, F.; et al. Detection of Various Microplastics in Patients Undergoing Cardiac Surgery. Environ. Sci. Technol. 2023, 57, 10911–10918. [Google Scholar] [CrossRef] [PubMed]
- Leslie, H.A.; van Velzen, M.J.; Brandsma, S.H.; Vethaak, A.D.; Garcia-Vallejo, J.J.; Lamoree, M.H. Discovery and quantification of plastic particle pollution in human blood. Environ. Int. 2022, 163, 107199. [Google Scholar] [CrossRef] [PubMed]
- Bargahi, N.; Ghasemali, S.; Jahandar-Lashaki, S.; Nazari, A. Recent advances for cancer detection and treatment by microfluidic technology, review and update. Biol. Proced. Online 2022, 24, 1–20. [Google Scholar] [CrossRef] [PubMed]
- Ohlsson, P.D.; Evander, M.; Petersson, K.; Mellhammar, L.; Lehmusvuori, A.; Karhunen, U.; Soikkeli, M.; Seppä, T.; Tuunainen, E.; Spangar, A.; et al. Integrated Acoustic Separation, Enrichment, and Microchip Polymerase Chain Reaction Detection of Bacteria from Blood for Rapid Sepsis Diagnostics. Anal. Chem. 2016, 88, 9403–9411. [Google Scholar] [CrossRef] [PubMed]
- Kuan, D.-H.; Wu, C.-C.; Su, W.-Y.; Huang, N.-T. A Microfluidic Device for Simultaneous Extraction of Plasma, Red Blood Cells, and On-Chip White Blood Cell Trapping. Sci. Rep. 2018, 8, 15345. [Google Scholar] [CrossRef] [PubMed]
- Salafi, T.; Zhang, Y.; Zhang, Y. A Review on Deterministic Lateral Displacement for Particle Separation and Detection. Nano-Micro Lett. 2019, 11, 77. [Google Scholar] [CrossRef] [PubMed]
- Xie, Y.; Rufo, J.; Zhong, R.; Rich, J.; Li, P.; Leong, K.W.; Huang, T.J. Microfluidic Isolation and Enrichment of Nanoparticles. ACS Nano 2020, 14, 16220–16240. [Google Scholar] [CrossRef]
- Tanriverdi, S.; Cruz, J.; Habibi, S.; Amini, K.; Costa, M.; Lundell, F.; Mårtensson, G.; Brandt, L.; Tammisola, O.; Russom, A. Elasto-inertial focusing and particle migration in high aspect ratio microchannels for high-throughput separation. Microsystems Nanoeng. 2024, 10, 87. [Google Scholar] [CrossRef]
- Wu, M.; Ouyang, Y.; Wang, Z.; Zhang, R.; Huang, P.-H.; Chen, C.; Li, H.; Li, P.; Quinn, D.; Dao, M.; et al. Isolation of exosomes from whole blood by integrating acoustics and microfluidics. Proc. Natl. Acad. Sci. USA 2017, 114, 10584–10589. [Google Scholar] [CrossRef] [PubMed]
- Su, W.; Qiu, J.; Mei, Y.; Zhang, X.-E.; He, Y.; Li, F. A microfluidic cell chip for virus isolation via rapid screening for permissive cells. Virol. Sin. 2022, 37, 547–557. [Google Scholar] [CrossRef]
- Wu, Z.; Jiang, H.; Zhang, L.; Yi, K.; Cui, H.; Wang, F.; Liu, W.; Zhao, X.; Zhou, F.; Guo, S. The acoustofluidic focusing and separation of rare tumor cells using transparent lithium niobate transducers. Lab a Chip 2019, 19, 3922–3930. [Google Scholar] [CrossRef] [PubMed]
- Wu, M.; Ozcelik, A.; Rufo, J.; Wang, Z.; Fang, R.; Huang, T.J. Acoustofluidic separation of cells and particles. Microsystems Nanoeng. 2019, 5, 32. [Google Scholar] [CrossRef] [PubMed]
- Havers, M.; Baasch, T.; Lenshof, A.; Evander, M.; Laurell, T. Silica seed particles improve the efficiency and throughput of nanoparticle acoustic trapping. Phys. Rev. Appl. 2024, 21, 034016. [Google Scholar] [CrossRef]
- Costa, M.; Hammarström, B.; van der Geer, L.; Tanriverdi, S.; Joensson, H.N.; Wiklund, M.; Russom, A. EchoGrid: High-Throughput Acoustic Trapping for Enrichment of Environmental Microplastics. Anal. Chem. 2024, 96, 9493–9502. [Google Scholar] [CrossRef] [PubMed]
- Wiklund, M.; Green, R.; Ohlin, M. Acoustofluidics 14: Applications of acoustic streaming in microfluidic devices. Lab a Chip 2012, 12, 2438–2451. [Google Scholar] [CrossRef] [PubMed]
- Hammarström, B.; Laurell, T.; Nilsson, J. Seed particle-enabled acoustic trapping of bacteria and nanoparticles in continuous flow systems. Lab a Chip 2012, 12, 4296–4304. [Google Scholar] [CrossRef] [PubMed]
Figure 1.
(A) 16 degree-tilted Acoustic Field overlaid with a visual representation of the intersecting flow lines (B) Acoustic pressure decay function extracted from COMSOL Multiphysics normalized for a 0-1 score. (C) Depiction of flowline score variation across the active capture area for different tilt angles in blue, orange and green (0, 5 and 16 degrees, respectively). The x-axis represents the normalized height, where 0.0 corresponds to the beginning and 1.0 to the end of the cluster array. The y-axis represents the score value associated with a flow line at each particular height. (D) Graph of the median grid score obtained by the algorithm, with maximum median score at the 16º tilt angle highlighted.
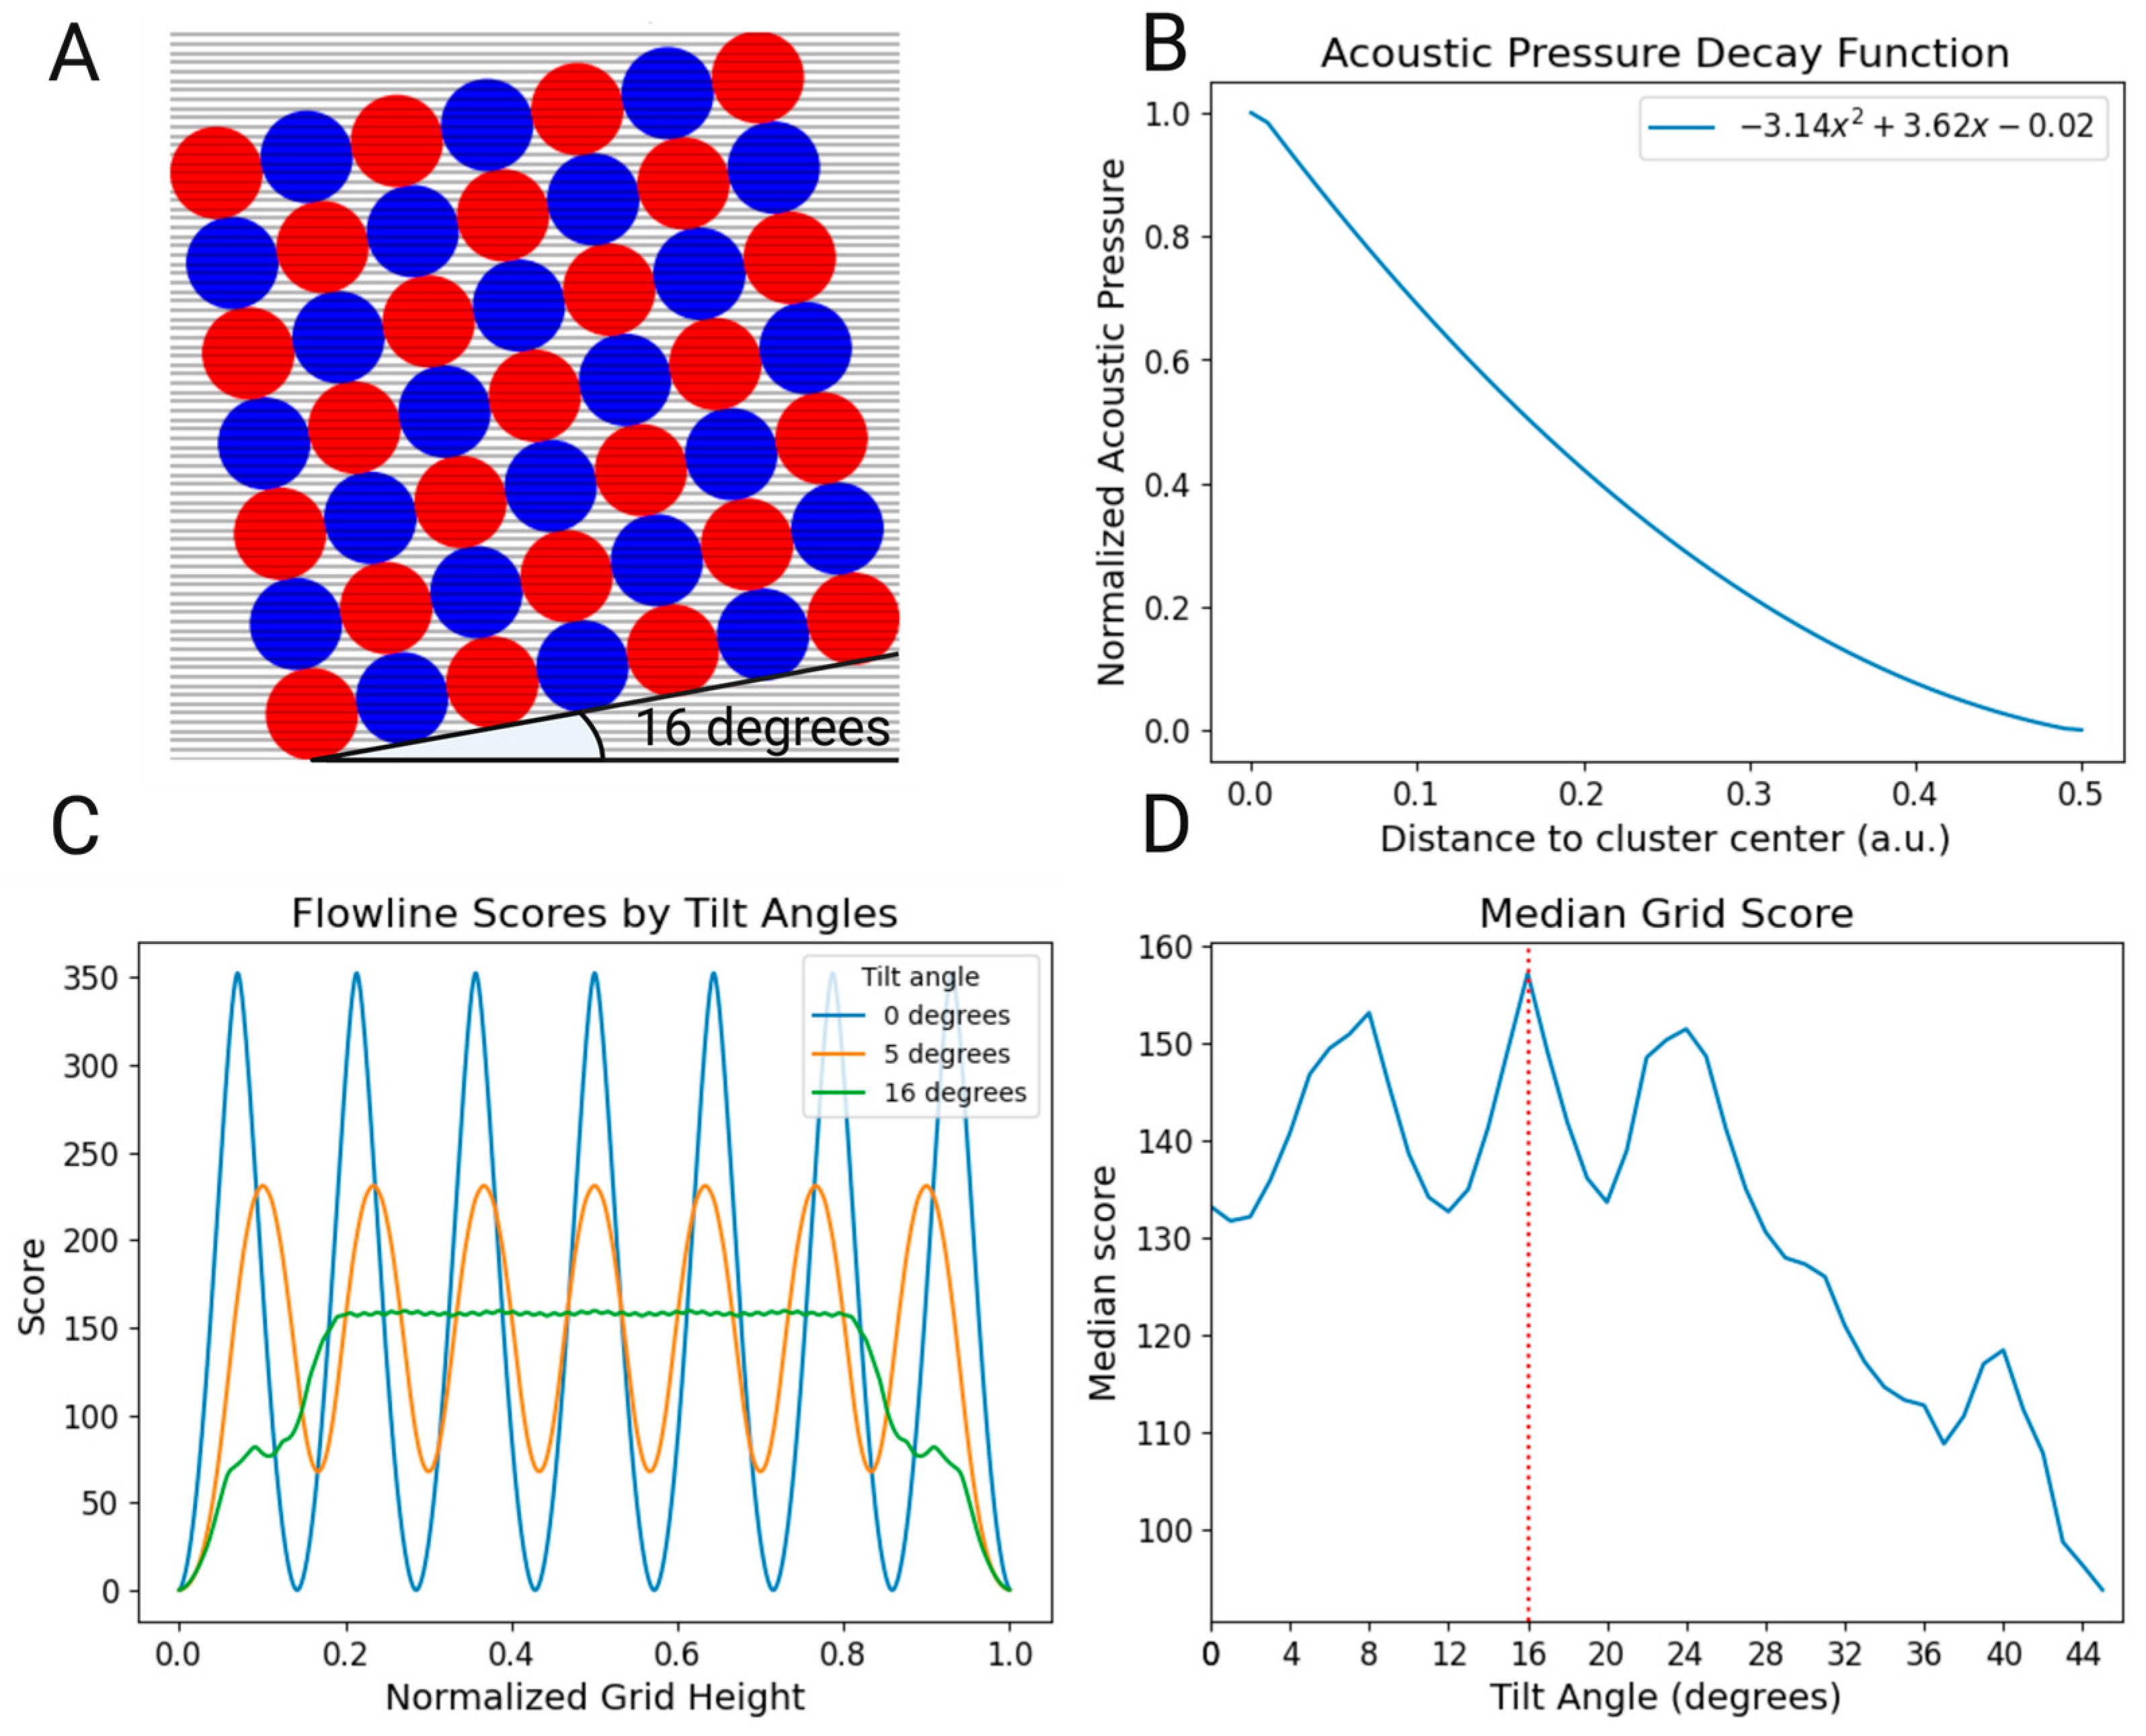
Figure 2.
(A) Picture of the EchoTilt device from the top, showing the milled slot in the back of the SDT. (B) Picture of the bottom (through the glass) of the EchoTilt device with the highlighted 1-cm wide silica cluster grid, visible with the naked eye. (C) Original EchoGrid active trapping area with well-defined clusters. The surrounding silica outside of the square is also patterned with weaker forces and is washed off before the experiment. (D) EchoTilt optimization, showing the 16º tilted trapping area and the organized clusters within it.
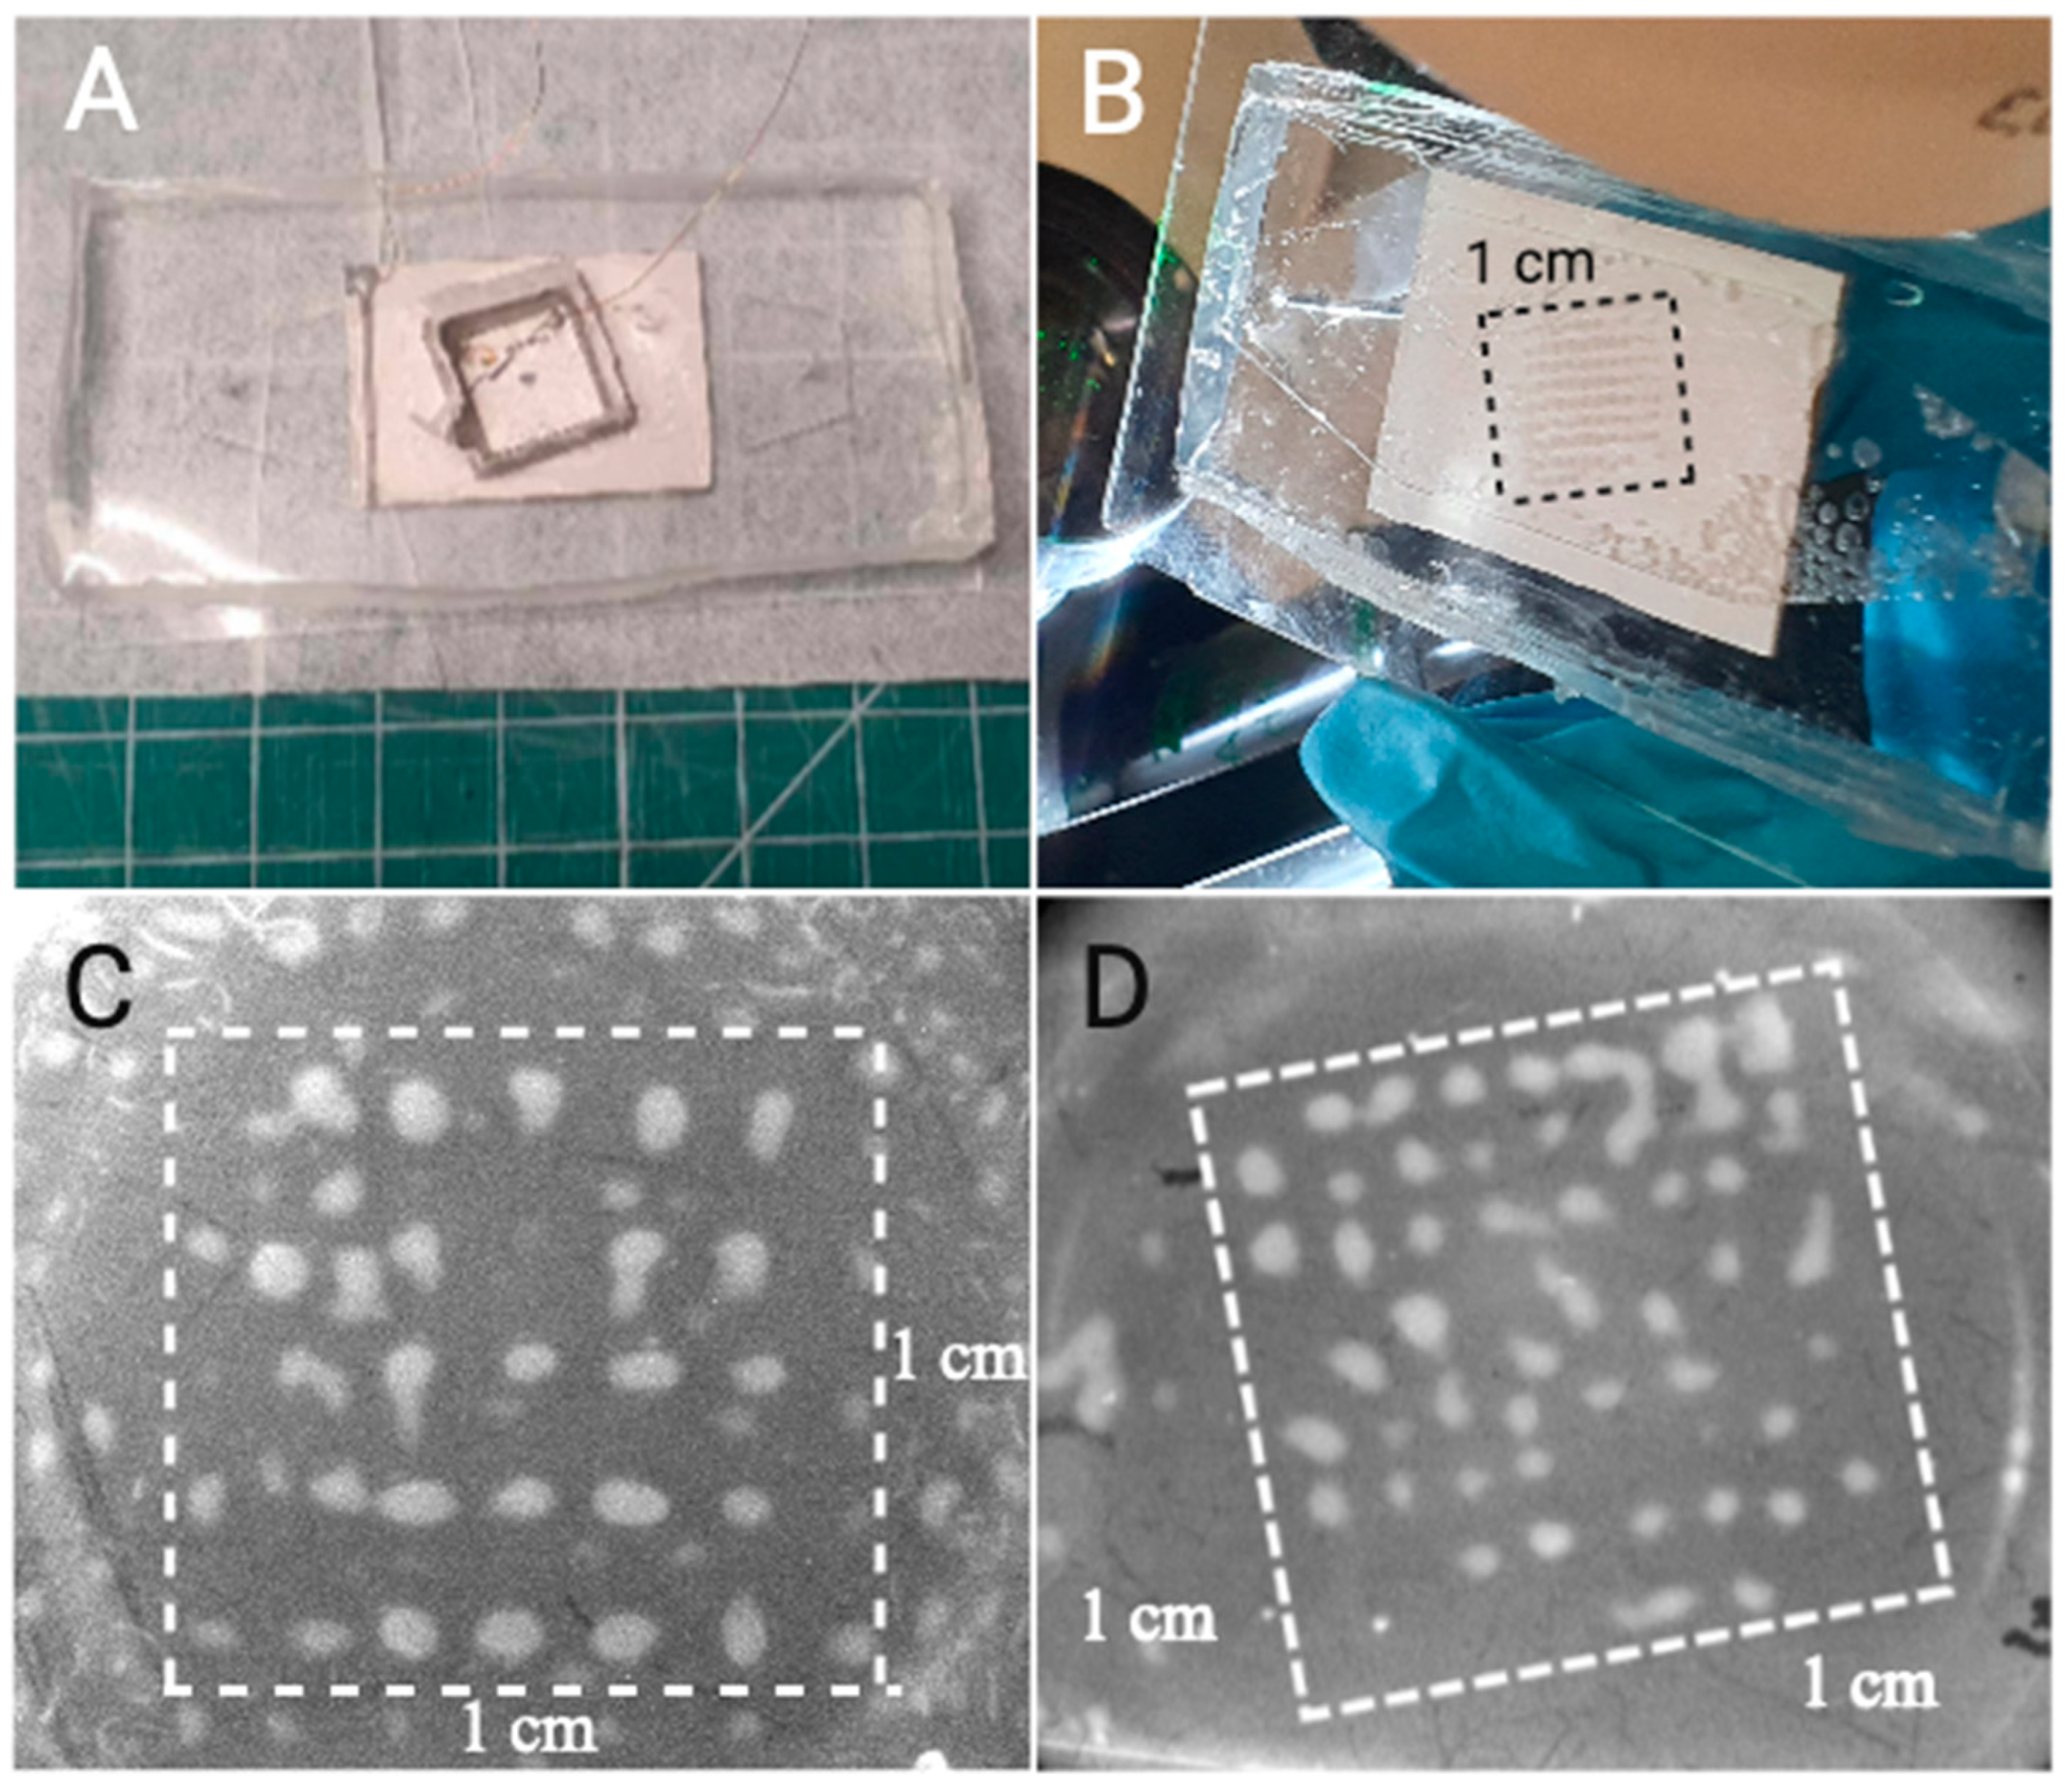
Figure 3.
Silica-Enhanced Seed Particle Method nanoparticle enrichment at a flow rate of 5 mL/min using the EchoTilt device. The increase in fluorescence is attributed to the flowing nanoparticle solution interacting with the cluster. The particles used were 100 nm (green), 200 nm (blue) and 500 nm (magenta).
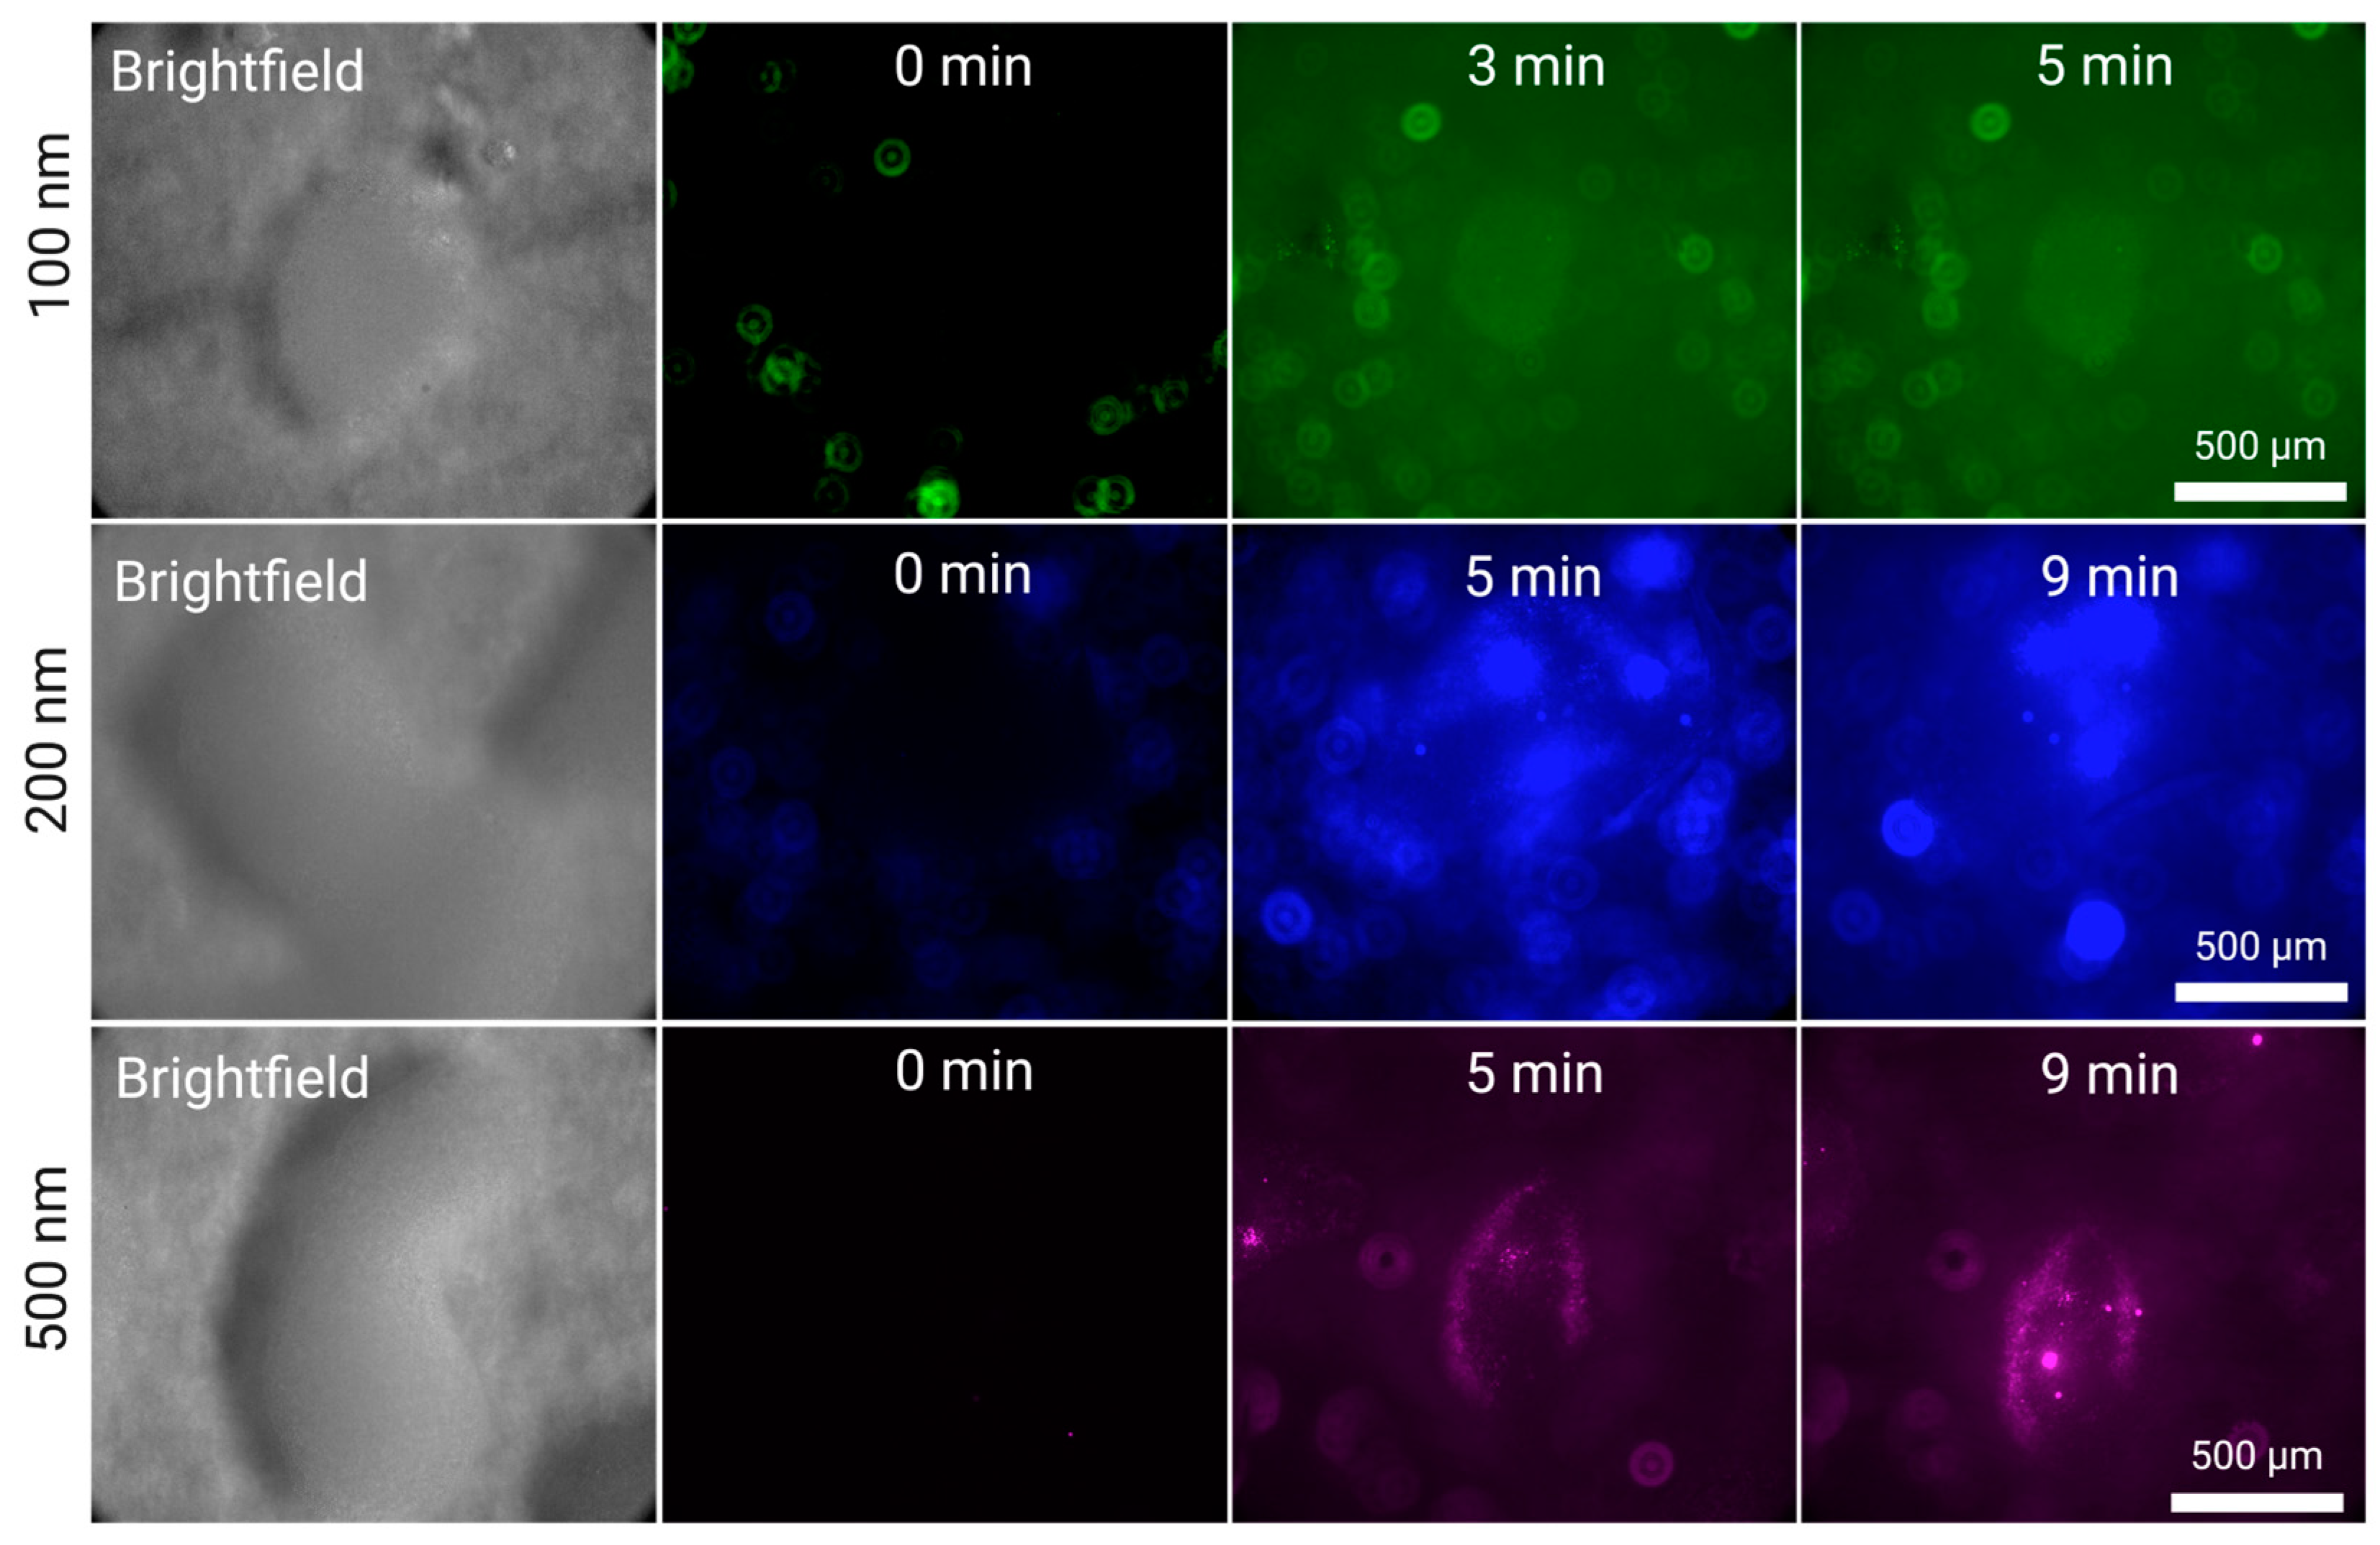
Figure 4.
Silica-Enhanced Seed Particle Method nanoparticle enrichment at a flow rate of 5 mL/min using the EchoTilt device. The increase in fluorescence is attributed to the flowing nanoparticle solution interacting with the cluster. The particles used were 25 nm (red), and 50 nm (orange).
Figure 4.
Silica-Enhanced Seed Particle Method nanoparticle enrichment at a flow rate of 5 mL/min using the EchoTilt device. The increase in fluorescence is attributed to the flowing nanoparticle solution interacting with the cluster. The particles used were 25 nm (red), and 50 nm (orange).
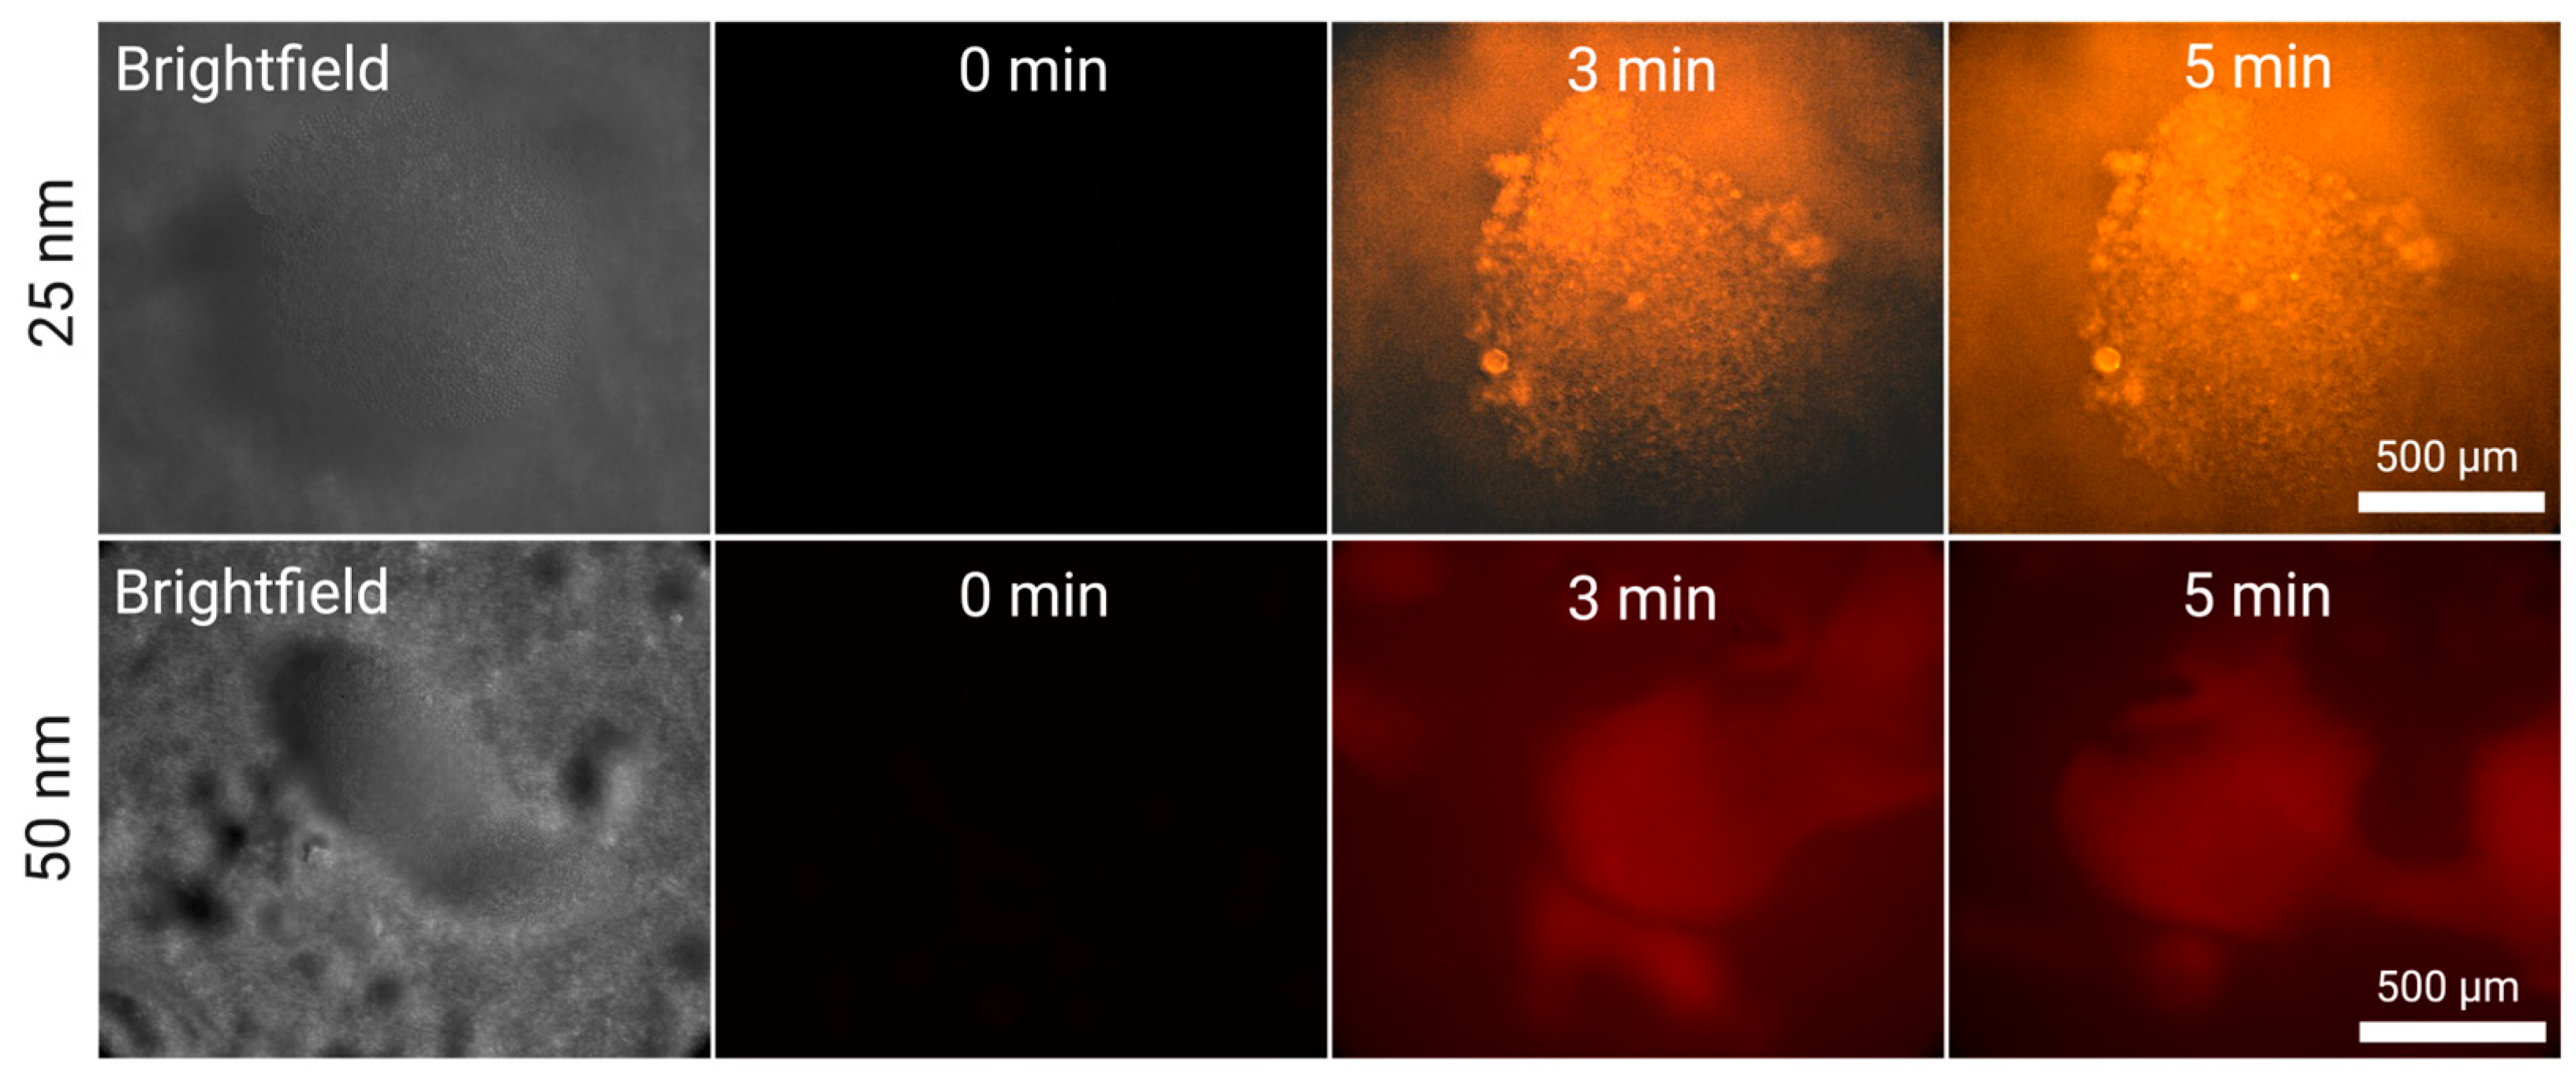
Figure 5.
Nanoparticle washing from a silica cluster at a flow rate of 0.5 mL/min directly after enrichment at 5 mL/min. The decrease in fluorescence is attributed to the nanoparticles being washed away from the cluster. The particles used were 25 nm (red), 50 nm (orange), 100 nm (green), 200 nm (blue) and 500 nm (magenta).
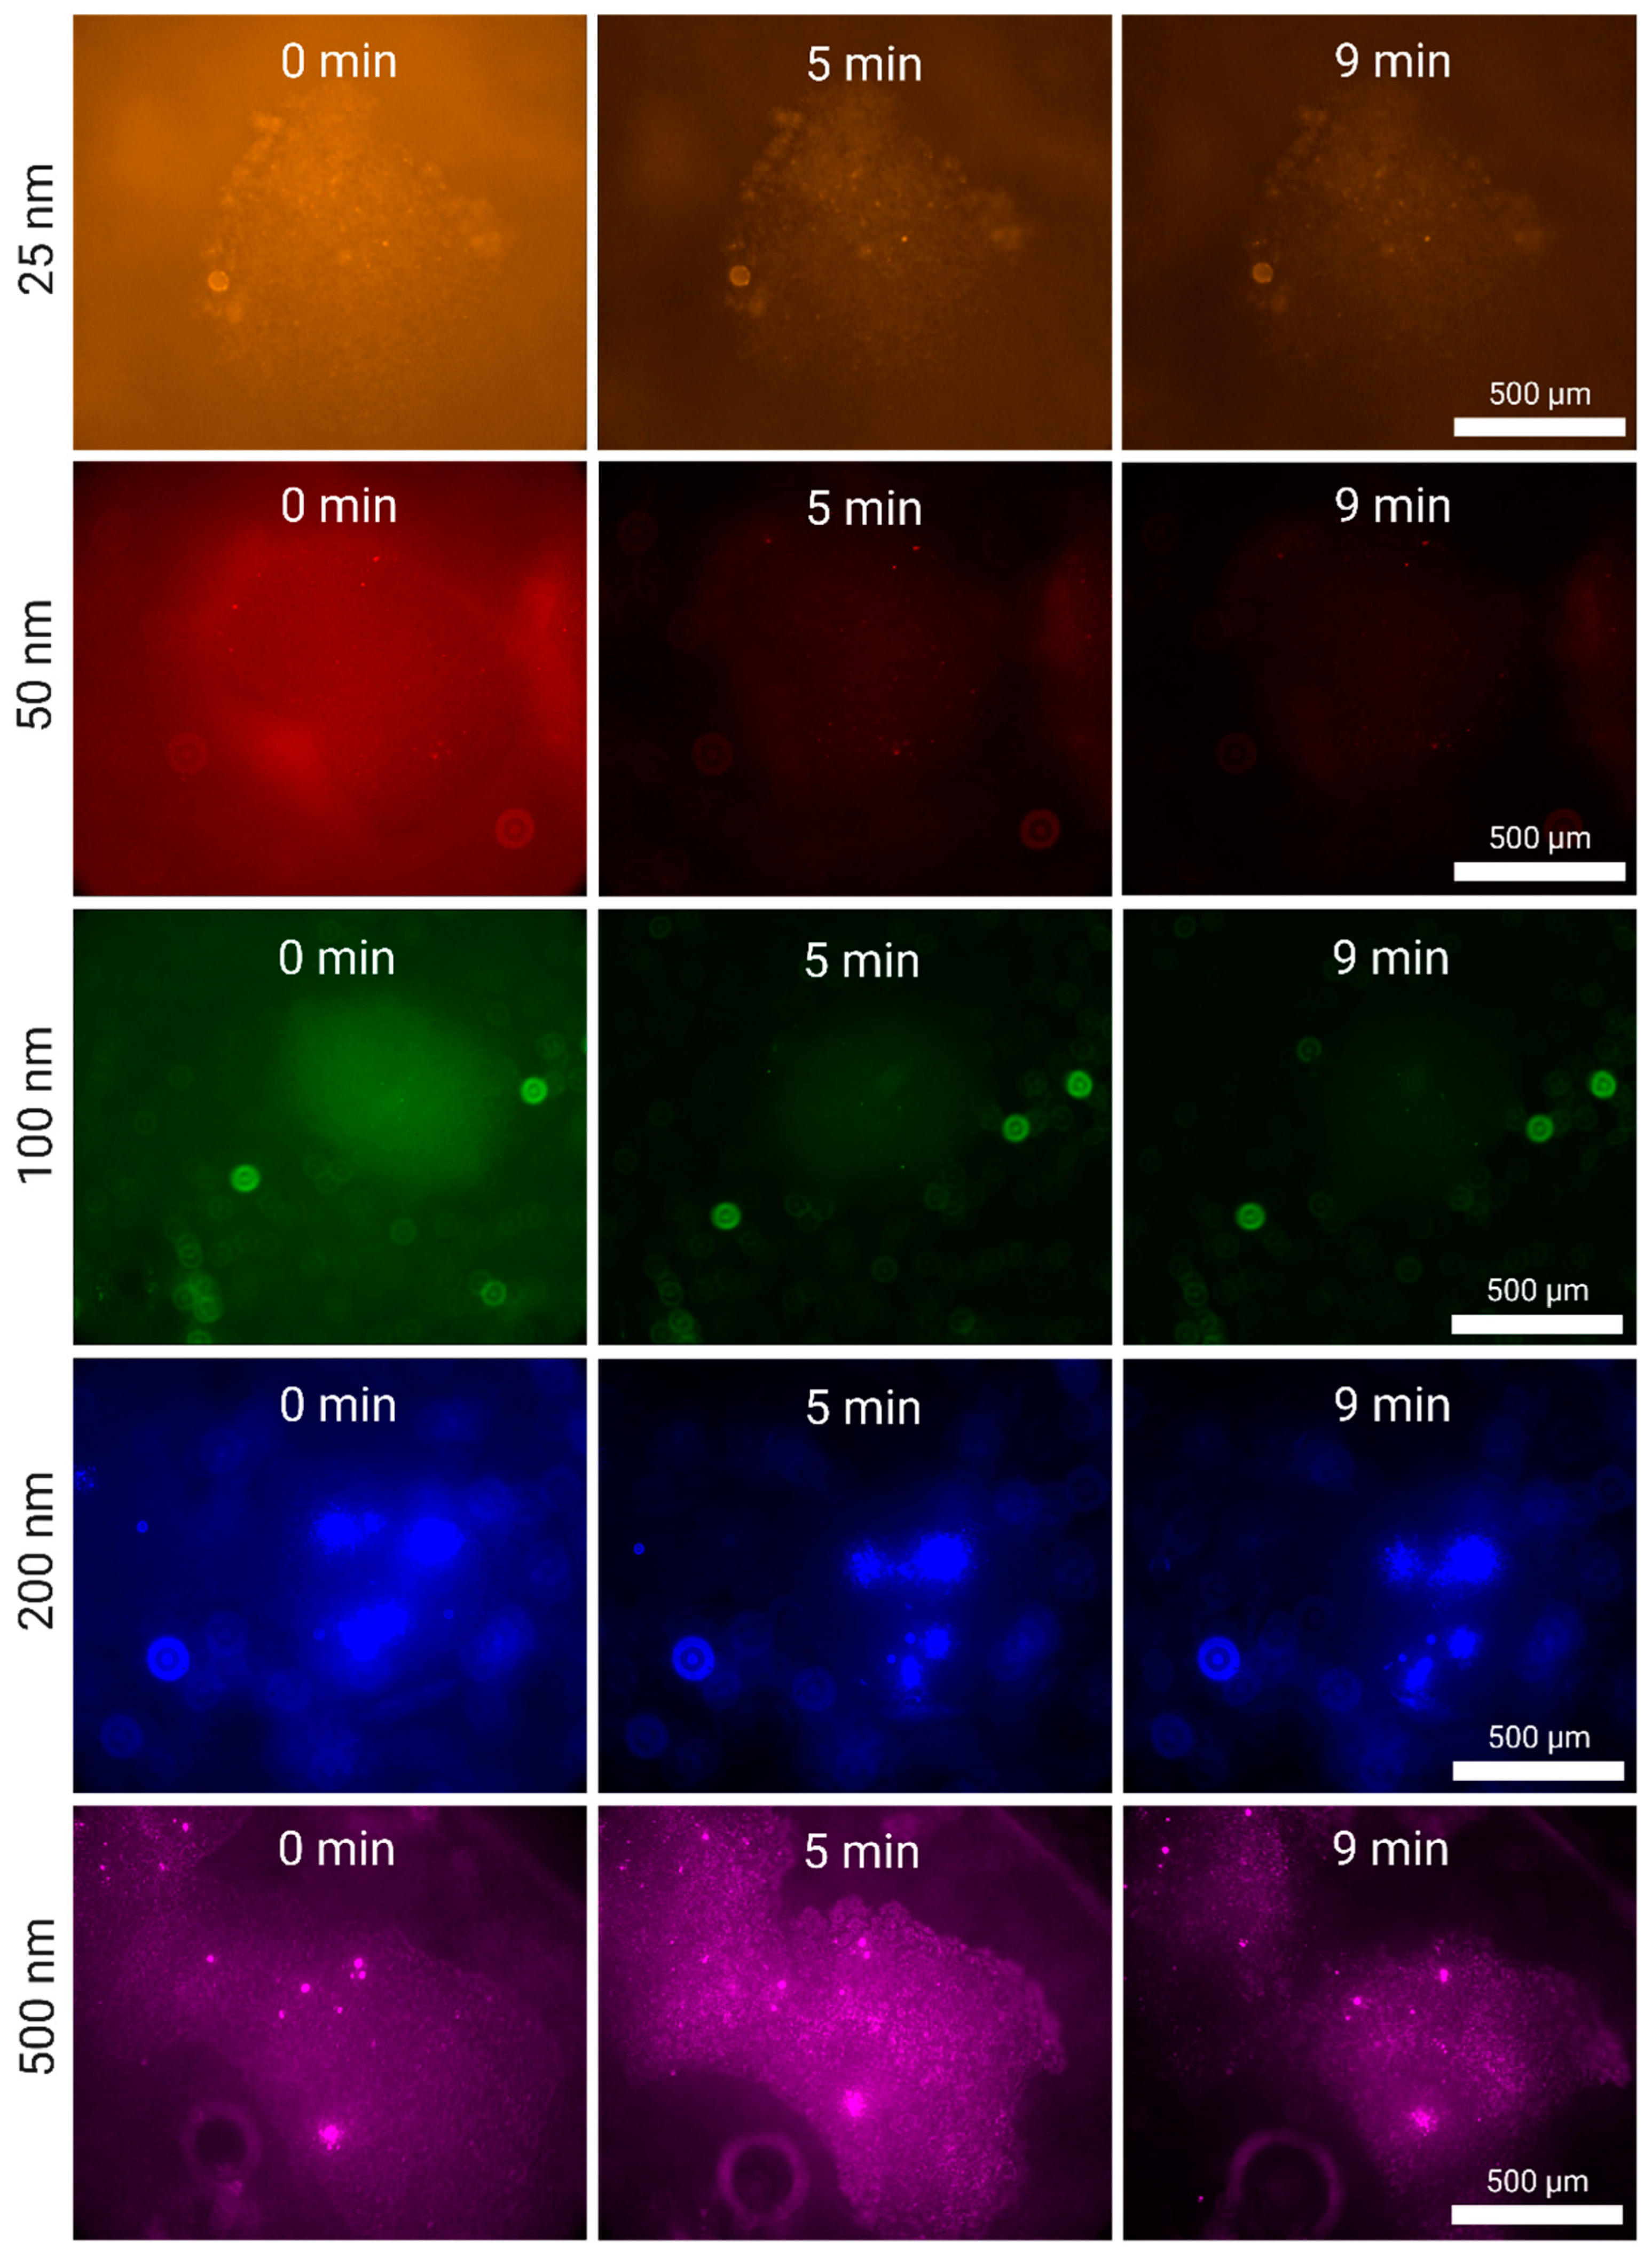
Figure 6.
(A) Enrichment performance at 5 mL/min, for 4 minutes, for a total of 20 mL of solution processed. (B) Enrichment performance at 2 mL/min, for 10 minutes, for a total of 20 mL of solution processed. (C) Washing at 0.5 mL/min after the nanoparticle enrichment experiments. The decrease in fluorescence is attributed the nanoparticles being displaced by the flowing MQ water from their clusters. The particles used were 50 nm (red), 100 nm (green), 200 (blue) and 500 (magenta).
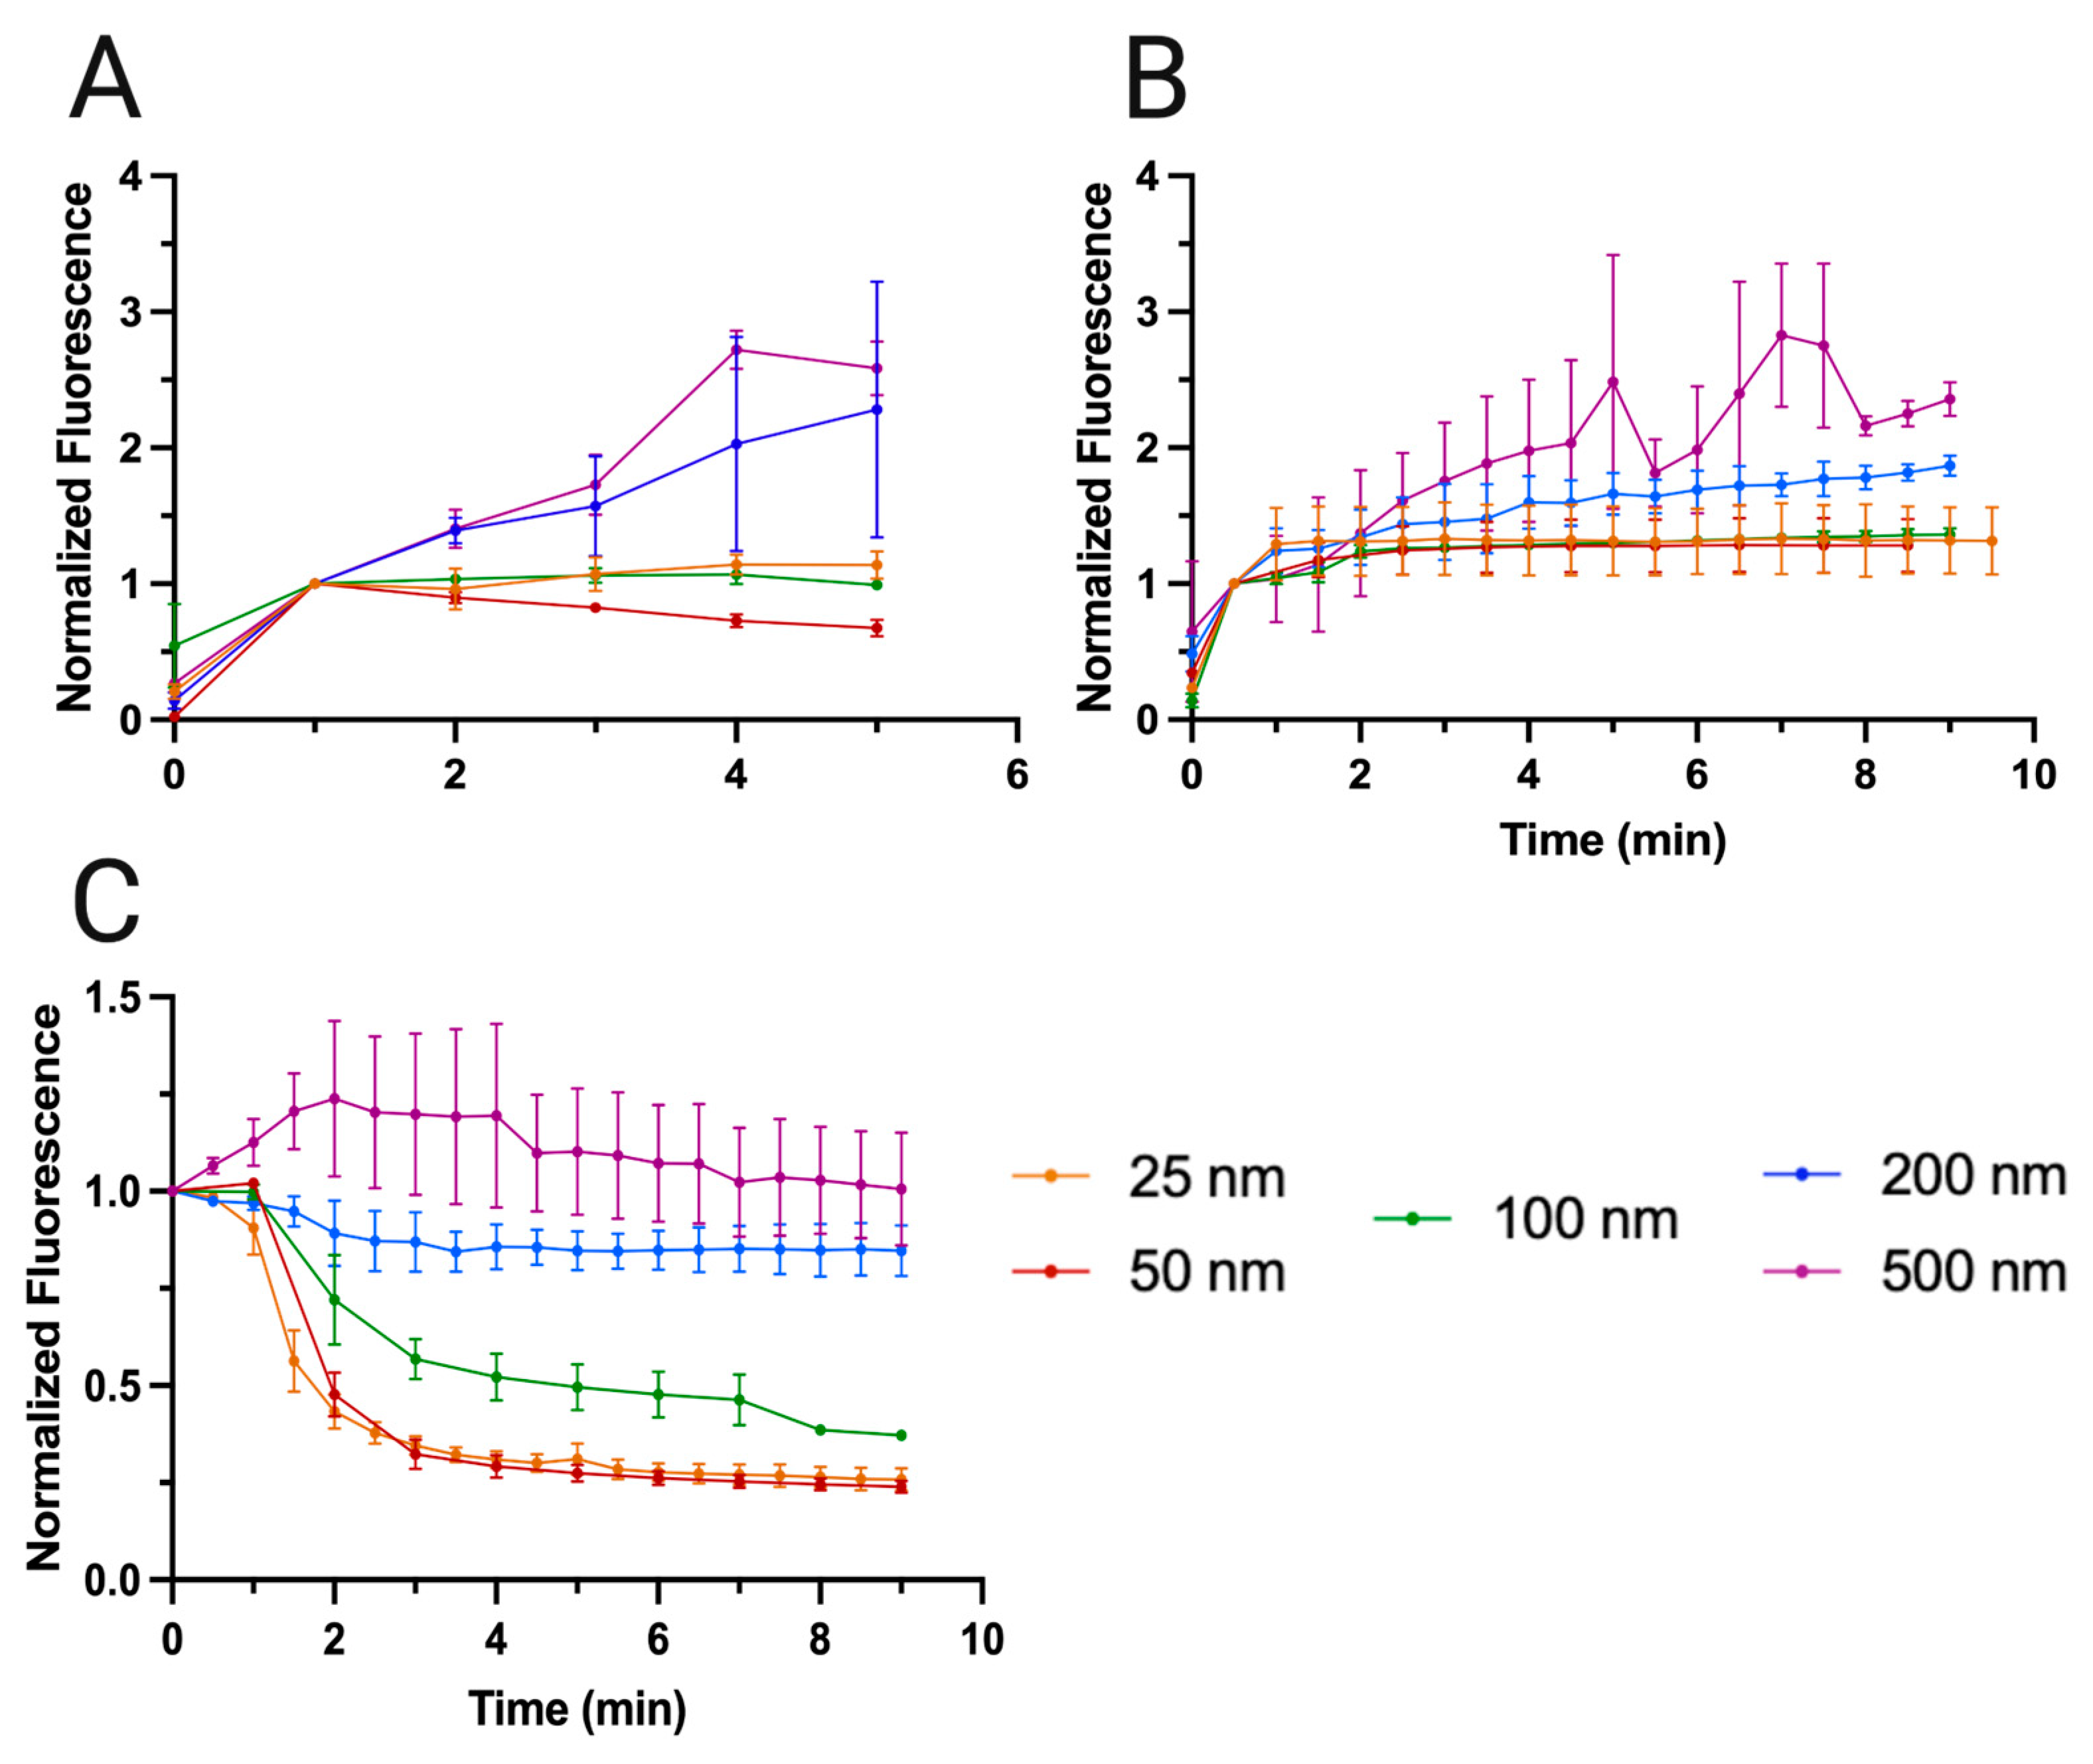

Table 1.
Percentage of fluorescence lost relative to the first data normalized data point during 10 minutes of washing at 0.5 mL/min. Negative values correspond to an increase in fluorescence compared to the first point.
Table 1.
Percentage of fluorescence lost relative to the first data normalized data point during 10 minutes of washing at 0.5 mL/min. Negative values correspond to an increase in fluorescence compared to the first point.
| Fluorescence loss per Particle Size (nm) | |||||
|---|---|---|---|---|---|
| Time (min) | 25 | 50 | 100 | 200 | 500 |
| 2 | 56.7% | 52.4% | 28.0% | 10.9% | -23.8% |
| 4 | 69.1% | 70.9% | 47.9% | 14.4% | -19.4% |
| 6 | 72.3% | 73.8% | 52.3% | 15.2% | -7.2% |
| 8 | 73.6% | 75.4% | 61.5% | 15.1% | -2.8% |
Disclaimer/Publisher’s Note: The statements, opinions and data contained in all publications are solely those of the individual author(s) and contributor(s) and not of MDPI and/or the editor(s). MDPI and/or the editor(s) disclaim responsibility for any injury to people or property resulting from any ideas, methods, instructions or products referred to in the content. |
© 2024 by the authors. Licensee MDPI, Basel, Switzerland. This article is an open access article distributed under the terms and conditions of the Creative Commons Attribution (CC BY) license (http://creativecommons.org/licenses/by/4.0/).
Copyright: This open access article is published under a Creative Commons CC BY 4.0 license, which permit the free download, distribution, and reuse, provided that the author and preprint are cited in any reuse.


