
Submitted:
17 November 2024
Posted:
18 November 2024
You are already at the latest version
Abstract
The non-linearity and randomness existing composite materials like concrete make it a challenging topic in safety analysis and reliability design of structures. In view of the unique capability of nonlocal macro-meso-scale consistent damage (NMMD) model in dealing with non-linearity of crack evolutions, the stochastic extension of NMMD model is proposed to analyze stochastic fracture behaviors of concrete materials. In this extended model, the stochastic harmonic function method of second kind is employed to characterize the spatial variability of concrete property. Numerical examples of three point bending beams without defect and with various sizes of initial crack demonstrate that the stochastic NMMD model is capable of not only capturing the uncertain fluctuations of peak load but also simulating the random walk of crack path with instantaneous transition of fracture modes as observed in experiments. Meanwhile, the effectiveness of stochastic NMMD model only assigned with a single random field (i.e., Young’s modulus) also implies the conventional assertion that stochastic simulations of quasi-brittle fracture should contain at least two mechanical properties with spatial randomness might be overly arbitrary. Last but not least, the investigation of fracture energy with stochastic fluctuations reveals that randomness as a result of heterogeneity would more-or-less improve the fracture toughness of concrete materials in the statistical sense.
Keywords:
Nonlocal macro-meso-scale consistent damage model
; Fracture energy
; Random field
; Concrete materials
; Stochastic model
1. Introduction
Up to now, concrete is the most widely used composite material in civil engineering. The two remarkable features of concrete material, i.e., non-linearity and randomness (Li and Chen 2009 [1]; Li et al. 2014 [2]), make it still a challenging topic in safety analysis and reliability design of architecture structures.
The non-linearity of concrete material mainly originates from the microcrack nucleation and the macroscopic crack growth. Ever since the groundbreaking work of Griffith (1921 [3]), fracture mechanics and damage mechanics have become the two mainstream approaches in dealing with crack evolution. In the framework of fracture mechanics (Anderson 2005 [4]), the hypothetic pre-existing crack as a geometric entity is extracted from the cracked solid body, and then the eccentric equilibrium equation of crack tip becomes the primary task for crack propagation. Along this line, many important concepts of driving force attached to the crack tip, such as energy release rate (Irwin 1956 [5]), stress intensity factor (Irwin 1957 [6]), J-integral (Rice 1968 [7]) and crack-tip opening displacement (Wells 1963 [8]), have been successively proposed. Correspondingly, the accompanied resistances, e.g., fracture energy, fracture toughness and the critical crack-tip opening displacement, regarded as the constant material properties for a crack to resist fracture, are left to the experimental measurement. However, the ongoing experimental observations reveal that a realistic crack would arise at the location far from the pre-existing crack tip (Haeri et al. 2014 [9]; Cao et al. 2023 [10]; etc.) and the aforementioned fracture parameters (especially the fracture energy) depend on the crack size (instead of being the constant properties) for a broad category of engineering materials including concrete (Malvar and Warren 1988 [11]; Refai and Swartz 1988 [12]; Gao et al. 2022 [13]; etc.), which challenge the two fundamental hypotheses in fracture mechanics. On the other hand, damage mechanics (Lemaitre 2012 [14]), without introducing the hypothesis of pre-existing crack, has the potential advantages in overcoming the drawbacks of fracture mechanics. Although the solid mathematical foundation has been already established in the earlier days (Simó and Ju 1987 [15]; Ju 1989 [16]), traditional local damage models remain far from being popular in simulations of cracking problems due to the lack of appropriate crack representation. Such an embarrassed situation sustains a relatively long period of time perhaps until the appearances of peridynamics (Silling 2000 [17]; Silling et al. 2007 [18]; Sheikhbahaei et al. 2023 [19]) and phase field model (Bourdin et al. 2000 [20]; Borden et al. 2012 [21]; Wu 2017 [22]; Feng and Li 2023 [23]).
With taking advantages of both peridynamics and phase field model, the nonlocal macro-meso-scale consistent damage (NMMD) model (Lu and Chen 2020 [24]; Chen et al. 2021 [25]) opens up a new avenue in simulation of crack evolution from nucleation to propagation. In NMMD model, meso-structure of material point-pairs adopted from peridynamics (Silling 2000 [17]; Silling et al. 2007 [18]) is employed to represent crack topology in geometry. By advocating the geometry-energy translational mechanism, which is linked with an energetic degradation factor also existing in phase field model (Bourdin et al. 2000 [20]; Wu 2017 [22]), the governing equations of NMMD model are constructed on the basis of continuum damage mechanics (Li et al. 2014 [2]). Theoretically speaking, the NMMD model can be deemed as the communication bridge connecting peridynamics and phase field model. Compared to the two popular approaches, nevertheless, numerical evidences (Ren et al. 2023 [26]; Chen et al. 2024 [27]) have demonstrated that the NMMD model owns the highest computational efficiency, for instance, the CPU time consuming of NMMD model is merely one-tenth of phase field model and only one-thirtieth of peridynamics for the same problems with considerable degrees of freedom and similar hardware. Besides, issues of the fixed Poisson’s ratio in bond-based scheme (Silling 2000 [17]), the zero-energy modes of state-based formulation (Silling et al. 2007 [18]) and the mesh-size (or particle distance) sensitivity of strain-softening regime (Sheikhbahaei et al. 2023 [19]) suffered by peridynamics due to the reformulation of differential equations, can be overcome spontaneously by NMMD model (Lu and Chen 2020 [24]; Ren et al. 2024 [28]). Benefiting from the intrinsic macro-meso-scale consistent mechanism, the NMMD model can capture the experimentally-observed non-constant fracture parameters (Lu et al. 2024 [29]), which cannot be predicted by phase field model with logical consistency. In recent years, some representative applications of NMMD model include various quasi-static fractures with different mechanisms (Ren et al. 2023 [26]; Xia et al. 2024 [30]; Ren et al. 2024 [31]), dynamic crack branching with and without rate-dependent effect (Lu and Chen 2021 [32]; Zhao et al. 2024 [33]) and even thermo-mechanical coupling cracking problems (Lv et al. 2024 [34]). However, almost all of these works focus on the deterministic perspective with neglecting the ubiquitous randomness (or stochasticity) existing in engineering materials and structures.
For heterogeneous materials like concrete, randomness plays an important role in the mechanical behaviors (Li and Chen 2009 [1]; Li et al. 2014 [2]), including stochastic fluctuations of bearing capacity and fracture toughness, random walk of crack path with uncertainty transition of fracture modes. To this end, this paper focuses on material randomness, and extends the deterministic NMMD model to the stochastic version equipped with stochastic harmonic function method of second kind. The effects of material randomness in the stochastic NMMD model are investigated in behaviors of load-displacement responses of the entire cracking process, crack patterns and energy dissipations (especially fracture energy).
The rest sections are arranged as follows. In Section 2, the basic idea and numerical implementation of deterministic NMMD model are briefly introduced. On that basis, the stochastic extension of NMMD model for concrete materials are depicted in Section 3 with sufficient details. Numerical examples of three point bending beams without and with various sizes of initial crack, concerning the influence of random fields with different correlation lengths and the stochastic fracture failure analysis by using the stochastic NMMD model, are discussed in Section 4. Conclusions and problems to be studied in the future are given in Section 5.
2. Deterministic NMMD Model
Let () be the reference configuration of a solid body, and denote the external boundary with the outward normal vector . The density of body force vector is distributed in the interior of the solid body, and on the exterior, the surface traction vector and the prescribed displacement vector are respectively applied on Neumann part and Dirichlet part . The resulting displacement vector and effective stress tensor of any material point are denoted by and , correspondingly.
The governing equation of NMMD model (Lu and Chen 2020 [24]; Chen et al. 2021 [25]) are established on the framework of continuum damage mechanics (Li et al. 2014 [2]) in the manner of articulation, accuracy and effectiveness, i.e.,
with the following Neumann and Dirichlet conditions
where is the divergence operator, and denotes the physical translation from geometry damage to the energy one .
In NMMD model, the geometry damage at macroscale is expressed by the ratio of damaged mesoscale point-pairs to all the point-pairs within an influence domain (see Figure 1 for the intuitive illustration) with a radius of , similar to peridynamics (Silling 2000 [17]; Silling et al. 2007 [18]), that is
where the influence domain is actually the -dimensional ball intersecting with the reference configuration, is the influence function with the default convention for isotropic materials, and is the mesoscale damage of point-pair . It should be noted that the point set shown in Figure 1 is the simplest case of the -point meso-structures (Chen et al. 2024 [27]).
In dealing with the evolution of mesoscale damage, the natural deformation (also called predominant elongation) is employed to depict the separation of a material point-pair, namely
and hence the rate-independent evolution of mesoscale damage can be expressed as
where: denotes the maximum deformation of a material point-pair during the possible loading and unloading history; is the critical threshold relating to tensile strength and Young’s modulus of materials; is the evolution law of mesoscale damage that can be determined from the Ab-initio molecular dynamics simulation, but herein the specified formulation is adopted (Lu and Chen 2020 [24])
in which is left to be calibrated by some kind of standard tests of material.
Up to now, there are two approaches to establish the relationship between damage variables in geometric and in mechanical (or energetic) senses: the macroscopic (Lu and Chen 2020 [24]) and the mesoscopic (Ren et al. 2024 [28]). In this paper, the macroscopic approach is preferred due to the simplicity, and it reads
where is called energetic degradation factor, which is utilized from phase field model (Bourdin et al. 2000 [20]; Wu 2017 [22]). It is physically identified that the energetic degradation factor must be a nonincreasing and convex function of geometry damage (Chen et al. 2021 [25]), which reveals the nonlinear translation mechanism from geometry damage to energy damage that the irreversible breakage of mesoscale point-pairs in geometry leads to the non-commensurate energetic degradation. For quasi-brittle materials like concrete, the energetic degradation factor can be empirically taken as (Lu et al. 2024 [29])
where and are the two degradation parameters, which can be physically identified by the standard test specimens.
Once the formulation of effective stress tensor is determined for the specified material, the solutions of NMMD model (i.e., the displacement vector and the geometry damage ) can be directly obtained by the following weak form
with the discretization of finite element method, where denotes the symmetric gradient of test function . It should be noted that the arc-length method (e.g., May and Duan 1997 [36]) is necessary for capturing the post-peak behavior of strain-softening. In the solution process, cracks represented by the geometry damage naturally form as a result of deformation without any extra crack tracking strategy.
3. Stochastic Extension of NMMD Model for Concrete Materials
In this section, the deterministic NMMD model described in Section 2 is extended by incorporating random spatial fluctuations in the material properties to describe stochastic fracture behavior in heterogeneous materials like concrete. Due to incomplete observation and imperfect control (Li and Chen 2009 [1]) during the manufacturing process, the constituents (e.g., aggregate configurations and locations, inhomogeneous distribution of water and holes with various shapes), in addition to non-uniform drying and hardening, make the physical parameters of concrete materials hard to be measured precisely in practice. The method of packing aggregates and generating interface layers (Yang et al. 2019 [37]; Xia et al. 2021 [38]; etc.), though proved to be feasible to depict the concrete heterogeneity, suffers expensive computational costs and even sometimes un-convergence problems, excepting the complicated pre-processing. In this paper, the characterization of uncertain fluctuations is therefore preferred to be included in the formulation of random fields.
For concrete materials considered herein, the infinitesimal strain tensor is sufficient to measure the resulting deformation intensity, and hence the effective stress tensor in Eq. (9) is expressed as
where is the fourth-order elastic tensor with the essential concentration of material properties. If isotropic property is further considered, we have
which involves Young’s modulus and Poisson's ratio , where and are respectively the super-symmetric identity tensor and the trace projection tensor, or alternatively in the index form, i.e., and, by the representation of Kronecker delta function .
In the framework of stochastic representation and computer simulation, the uncertain fluctuation of material parameter of at each material point is assigned to a non-zero Gaussian random field, that is
where is the mean value, and is the zero-mean Gaussian random field sharing the same standard deviation with .
To generate the zero-mean Gaussian random field , Karhunen-Loève expansion (KL) method (Kosambi 1943 [39]) and the classical spectral representation method (Shinozuka and Deodatis 1991 [40]; 1996 [41]) are available choices. However, these two common methods work adequately for low-dimensional problems. The challenge of large computational cost is encountered by both methods when simulating high-dimensional random fields (Chen et al. 2018 [42]). To solve this issue, the concept of stochastic harmonic function (SHF) was proposed by Chen and Li (2011 [43]). Similar to the classical spectral representation method, random fields are still represented as the combination of a series of harmonic components in SHF method. The difference is that, in the SHF method, the wave numbers of the harmonic components are also random, not just the phase angles. Precisely because of this, the target wave-number power spectral density (PSD) function can be reproduced by SHF method with only a limited number of harmonic components. According to the probability distribution of the wave number within each wave-number subdomain, this method can be further divided into the SHF of the first kind (SHF-I; Chen and Li 2011 [43]) and of the second kind (SHF-II; Sun et al. 2011 [44]).
Herein the SHF-II method endowed with tensor products expansion (Liang et al. 2012 [45]; Chen et al., 2018 [42]) is adopted, and for two-dimensional cases, i.e., , it reads
where is the independently random phase distributed uniformly over , and are the random wave numbers required to be positive, represent the two truncation numbers. According to the relationship between autocorrelation function and PSD function, namely the Wiener-Khinchin formula (Li and Chen 2009 [1]), the amplitude in Eq. (13) can be given by
where represents the target PSD function of random field in the first-quadrant.
For the stationary Gaussian random field usually employed to characterize the condensed state of material properties, the form of is taken as (Vanmarcke 2010 [46])
where: is the standard deviation of the zero-mean random field , and can be determined by the mean value and the coefficient of variation , i.e., ; the scale parameter can be expressed by , and is the correlation length of .
In practical implementation of SHF-II method, once a material property is specified to the non-zero Gaussian random field with positive wave-number domain , where and are the lower and upper bounds of the wave numbers, the wave-number domain can be discretized a series of small regions, i.e., , and . And then, in each small wave-number region , and in Eq. (13) can be deemed as uniform distributions.
4. Numerical Examples
Let us consider the three-point bending concrete beam (TPBB) tests conducted by Grégoire et al. (2013 [47]), the geometry and boundary conditions are shown in Figure 2, in which the thickness and height are and , respectively. Each beam is simply supported at the bottom edge, and the vertical force is applied at the midpoint of the top edge of the beam. During the loading process, the force at loading point, the displacement of loading point (DLP) and the crack mouth opening displacement (CMOD) are recorded. The preliminary analyses of these beams assumed to plane stress problems were performed previously by Lu et al. (2024 [29]) using the deterministic NMMD model, and the mechanical parameters (including Young’s modulus , Poisson’s ratio , radius of influence domain , critical elongation and the two degradation parameters and ) listed in Table 1 were determined according to the experiments (Grégoire et al. 2013 [47]).
In this section, consistent with Lu et al. (2024 [29]), different notch-to-depth ratios, i.e., with the notch width of , are considered for investigating stochastic fluctuations of bearing capacity, fracture energy and the random walk of crack path with uncertainty transition of fracture modes by using the proposed stochastic NMMD model. Based on the intuition sharpened by hundreds of numerical examples of deterministic NMMD model, only the spatial variability of Young's modulus is considered in the following analyses.
4.1. Influence of Random Fields with Different Correlation Lengths
Without loss of generality, the configuration of TPBB is might as well divided into three parts according to material properties, as shown in Figure 3. The Young’s modulus in the region of initial notch is set to zero, and the random filed of Young’s modulus is generated only in the region where the crack is expected to propagate. Apart from the two cases, the mean value of Young’s modulus, i.e., , is adopted in the remaining regions. Correspondingly, the mesh is refined only within the range of random field and a coarse mesh is used in the remaining region. Additionally, the material points are only placed at the Gaussian integration points of elements within the mesh refined region. The aforementioned mesh discretization strategy and arrangement of material points are solely aimed at reducing unnecessary computations.
Shown in Figure 4 is the comparison of random field samples with three different correlation lengths, i.e., . In the three cases, the coefficient of variation is and the truncation number of the wave number in each dimension of wave-number domain is taken to be , i.e., . From Figure 4 (though only displayed ten samples in each case), it is clearly found that the larger the correlation length, the more pronounced homogeneity of random field. Visually speaking, these samples of Young’s modulus are very similar to the realistic concrete materials containing aggregates and holes with various shapes. In other words, the method of packing aggregates and generating interface layers (Yang et al. 2019 [37]; Xia et al. 2021 [38]) can be alternatively replaced by the formulation of random field in the numerical generation of concrete materials.
After computation of stochastic NMMD model, the load-CMOD curves and load-DLP curves for the case , which are obtained from the experiments (Grégoire et al. 2013 [47]), the deterministic NMMD model (Lu et al. 2024 [29]) and the proposed stochastic NMMD model with numerical samples concerning different correlation lengths, are depicted in Figure 5 and Figure 6. It can be concluded from Figure 5 and Figure 6 that, as the correlation length decreases, the dispersion of the curves gradually decreases, which is consistent with the conclusions reached when considering the spatial variability of the critical elongation (Ren et al. 2021 [48]). Especially, when the correlation length is , the results of the numerical samples closely match the results of the deterministic analysis. The reason is that the topologic damage defined in Eq. (3) itself represents the mean of the mesoscale damage within the influence domain.
When the correlation length becomes as small as the mesh size, the Young’s modulus in the random field tends to become a series of independent and identically distributed random variables. Since the Young’s modulus characterizes the ability of material to resist deformation, this also means, from a qualitative perspective, that the deformations of point pairs are independent and identically distributed random variables. According to the law of large numbers, as the number of independent and identically distributed random variables approaches infinity, the variance of their mean tends to zero. Therefore, the topologic damage calculated from the numerical samples is close to the result of the deterministic analysis, leading to the reduction in the variability of the curves. On the other hand, for the appropriate choice of correlation length, the fluctuation of load-displacement responses in experimental observation (Grégoire et al. 2013 [47]) can be completely covered by the stochastic NMMD model.
The crack patterns calculated by numerical samples with different correlation lengths are shown in Figure 7. From Figure 7 it can be observed that when the correlation length of the random field is , the zig-zag crack patterns will emerge with the instantaneous transition from mode-I to mixed-mode, which is very closed to the experimental results (Yin et al. 2023 [51]). Nevertheless, in the other two cases, the cracks are straighter. The reason for the occurrence of the above phenomenon with small correlation length has already been explained when investigating the variation in the dispersion of the curves aforementioned.
Based on the above analysis of numerical results, it can be concluded that when the correlation length is comparable to the size of influence domain, the range of load-CMOD curves of numerical samples matches well with the experimental results, and the crack patterns is also consistent with physical phenomena.
4.2. Stochastic Fracture Failure Analysis
In this subsection, the cases with the correlation length are investigated. Shown in Figure 8 and Figure 9 are the load-CMOD curves and load-DLP curves of the experimental results (Refai and Swartz 1988 [12]), deterministic results (Lu et al. 2024 [29]) and numerical samples obtained by the proposed stochastic NMMD model. From Figure 8, it can be seen that the load-CMOD curves of numerical samples with fall within the range of experimental results, indicating that the nonlinear characteristics of the fracture failure process can be captured by NMMD model. It is also of interest to see that in Figure 9 as the notch-to-depth varies from zero to , the characteristics of snap-back gradually decrease.
Crack patterns of specimens with different notch-to-depth are plotted in Figure 10. As expected and consistent with the experimental phenomena, the crack still initiates from the tip of the initial notch (or from the midspan in the case of ), propagates tortuously in the vertical direction, and eventually reaches the upper edge of the TPBB. Thus, the numerical results of NMMD model can be more closely align with physical reality by introducing the spatial variability of material properties. That is to say, the stochastic NMMD model with single random field (namely Young’s modulus) can pretty well capture not only the stochastic fluctuations of bearing capacity but also the random walk of crack path. This discovery shakes up the accustomed cognition (Le et al. 2016 [52]; Gorgogianni et al. 2022 [53]) that stochastic simulations of quasi-brittle fracture should contain at least two mechanical properties with spatial randomness.
In the published paper (Lu et al. 2024 [29]), it is found that the NMMD model does not require the input of fracture energy but can still yield the conclusion that fracture energy is not a constant but rather depends on the notch-to-depth . This phenomenon can also be observed from experiments. However, a slight drawback of this work is that there is only one result for each notch-to-depth case. Therefore, to further strengthen the foundation of the conclusion mentioned before, the fracture energy obtained from stochastic analysis is also calculated here. For the TPBB tests, the fracture energy can be expressed as
where is the total length of the crack that can be measured by the topologic damage in Eq. (3), and represents the energy dissipation at the cutting displacement of loading point. As depicted in Figure 11, can be determined by
The comparison of fracture energy of the experiment (Refai and Swartz 1988 [12]), deterministic analysis (Lu et al. 2024 [29]) and stochastic simulation is plotted in Figure 12 with the cutting displacement tends to infinity, i.e., . It can be seen that the experimental results can be enveloped by the numerical sample results. Moreover, when the notch-to-depth is less than , it is of interest to see that the mean value of numerical samples is larger than that of deterministic results (Lu et al. 2024 [29]). The reason is that fracture energy represents the material's ability to resist fracture from the physical perspective, i.e., the greater the fracture energy, the more energy is dissipated as the crack propagates within the material.
Recalling the stochastic results shown in Figure 10, the crack paths are tortuous with instantaneous transition of fracture modes, while without considering the spatial variability of the material properties, the crack paths are always straight along the direction the initial crack (i.e., mode-I) as shown in Lu et al. (2024 [29]). As a result, the crack length in the former case is significantly greater than in the latter, leading to higher energy dissipation. In contrast, when the notch-to-depth exceeds , the influence of the random field on the propagation of crack decreases, resulting in the mean value of fracture energy becoming closer to the deterministic results. Anyway, the logical inconsistency with physical phenomena in models that use constant fracture energy as an input parameter, such as the crack band model (Jirásek and Bauer 2012 [49]), the gradient-enhanced damage model (Geers et al. 1998 [50]), and the phase-field model (Bourdin et al. 2000 [20]; Wu et al. 2017 [22]), is once again validated by non-constant fracture energy observed experimentally and numerically.
5. Conclusions
In this paper, the deterministic nonlocal macro-meso-scale consistent damage (NMMD) model is extended to analyze stochastic fracture behaviors of typical composite materials like concrete with the equipment of stochastic harmonic function method of second kind. In the proposed stochastic NMMD model, non-linearity caused by crack evolution and randomness resourced from uncertain distribution of concrete materials are unified in the manner of articulation. Numerical examples of three point bending beams without and with various sizes of initial crack, also compared with the experimental observations, demonstrate the effectiveness of stochastic NMMD model. The main conclusions are given as follows:
(1) Though directly inherited the deterministic NMMD model, the proposed stochastic version still manifests different capacities of capturing fracture behaviors of concrete materials as observed in experiments, including stochastic fluctuations of peak load and random walk of crack path with instantaneous transition of fracture modes.
(2) It is widely believed that stochastic simulations of quasi-brittle fracture should contain at least two mechanical properties with spatial randomness. However, the preliminary success of stochastic NMMD model only assigned with a single random field (i.e., Young’s modulus) implies that the previous understanding might be inappropriate.
(3) It is found that in quasi-brittle fracture problems the mean value of fracture energy obtained by the stochastic NMMD model as an output always greater than that obtained by the deterministic NMMD model with the mean value of random field as an input parameter. Such an unexpected result is attributed to the nonlinear energy-dissipating capacity of crack, that is, the extension of zig-zag crack appearing in the stochastic model requires more energy than that of straight crack occurring in the deterministic model.
Although proved to be feasible and effective, the presented stochastic NMMD model still needs further improvements in the future, including the revelation of relationship between the correlation length of the random field and the size of influence domain, the extension of anisotropic randomness and the analysis of dynamic cracking problems with rate-dependent effect.
Author Contributions
Conceptualization, Guangda Lu and Jiankang Xie; Data curation, Guangda Lu; formal analysis, Guangda Lu and Jiankang Xie; funding acquisition, Guangda Lu; investigation, Jiankang Xie; methodology, Guangda Lu; project administration, Guangda Lu; Resources, Guangda Lu; Software, Guangda Lu and Jiankang Xie; Supervision, Guangda Lu; validation, Guangda Lu and Jiankang Xie; visualization, Jiankang Xie; writing—original draft preparation, Guangda Lu and Jiankang Xie; writing—review and editing, Guangda Lu. All authors have read and agreed to the published version of the manuscript.
Funding
This research was funded by National Natural Science Foundation of China, grant number 12202314.
Data Availability Statement
Data supplied on request.
Acknowledgments
The support of National Natural Science Foundation of China (Grant No. 12202314) are highly appreciated. We are highly grateful to Prof. Jianbing Chen from Tongji University for his instructive comments and great encouragement, and to Mr. Yudong Ren from Tongji University for his help.
Conflicts of Interest
The authors declare no conflicts of interest.
References
- Li, J.; Chen, J.B. Stochastic Dynamics of Structures; John Wiley & Sons, Singapore, 2009.
- Li, J.; Wu, J.Y.; Chen, J.B. Stochastic Damage Mechanics of Concrete Structures; Science Press (in Chinese), Beijing, 2014.
- Griffith, A.A. The phenomena of rupture and flow in solids. Philosophical Transactions of the Royal Society of London A 1921, 221, 163–198. [Google Scholar]
- Anderson, T.L. Fracture Mechanics: Fundamentals and Applications, 3rd ed.; CRC press, Boca Raton, 2005.
- Irwin, G.R. Onset of Fast Crack Propagation in High Strength Steel and Aluminum Alloys. In: Proceedings of the second sagamore ordnance materials conference, 1956, 2, 289–305. [Google Scholar]
- Irwin, G.R. Analysis of stresses and strains near the end of a crack transversing a plate. Journal of Applied Mechanics 1957, 24, 361–364. [Google Scholar] [CrossRef]
- Rice, J.R. A path independent integral and the approximate analysis of strain concentration by notches and cracks. Journal of Applied Mechanics 1968, 35, 379–386. [Google Scholar] [CrossRef]
- Wells, A.A. Application of fracture mechanics at and beyond general yielding. British Welding Journal 1963 10, 563–570.
- Haeri, H.; Shahriar, K.; Marji, M.F.; Moarefvand, P. Experimental and numerical study of crack propagation and coalescence in pre-cracked rock-like disks. International Journal of Rock Mechanics and Mining Sciences 2014, 67, 20–28. [Google Scholar] [CrossRef]
- Cao, P.; Zhou, T.; Ju, Y.; Zhu, J. Mixed mode I/II fracture behavior of CSTBD sandstone specimen under different loading angles. Geomechanics and Geophysics for Geo-Energy and Geo-Resources 2023, 9, 54. [Google Scholar] [CrossRef]
- Malvar, L. J.; Warren, G. E. Fracture energy for three-point-bend tests on single-edge-notched beams. Experimental Mechanics 1988, 28, 266–272. [Google Scholar] [CrossRef]
- Refai, T.M.E.; Swartz, S.E. Mode I fracture-energy methods for concrete. Experimental Mechanics 1988, 28, 395–401. [Google Scholar] [CrossRef]
- Gao, S.; Qi, L.; Zhu, Y.; Wang, W. Effect of notch depth ratio on mode I and mixed mode I-II fracture properties of engineered cementitious composites (ECC). International Journal of Solids and Structures 2022, 236, 111363. [Google Scholar] [CrossRef]
- Lemaitre, J. A Course on Damage Mechanics, 2nd ed.; Springer, Berlin, 1996.
- Simó, J.C.; Ju, J.W. Strain- and stress-based continuum damage models-I. Formulation. International Journal of Solids and Structures 1987, 23, 821–840. [Google Scholar] [CrossRef]
- Ju, J.W. On energy-based coupled elastoplastic damage theories: Constitutive modeling and computational aspects. International Journal of Solids and Structures 1989, 25, 803–833. [Google Scholar] [CrossRef]
- Silling, S.A. Reformulation of elasticity theory for discontinuities and long-range forces. Journal of the Mechanics and Physics of Solids 2000, 48, 175–209. [Google Scholar] [CrossRef]
- Silling, S.A.; Epton, M.; Weckner, O.; Xu, J.; Askari, E. Peridynamic states and constitutive modeling. Journal of Elasticity 2007, 88, 151–184. [Google Scholar] [CrossRef]
- Sheikhbahaei, P.; Mossaiby, F.; Shojaei, A. An efficient peridynamic framework based on the arc-length method for fracture modeling of brittle and quasi-brittle problems with snapping instabilities. Computers and Mathematics with Applications 2023, 136, 165–190. [Google Scholar] [CrossRef]
- Bourdin, B.; Francfort, G.A.; Marigo, J.J. Numerical experiments in revisited brittle fracture. Journal of the Mechanics and Physics of Solids 2000, 48, 797–826. [Google Scholar] [CrossRef]
- Borden, M.J.; Verhoosel, C.V.; Scott, M. A.; Hughes, T. J.; Landis, C. M. A phase-field description of dynamic brittle fracture. Computer Methods in Applied Mechanics and Engineering 2012, 217-220, 77–95. [Google Scholar] [CrossRef]
- Wu, J.Y. A unified phase-field theory for the mechanics of damage and quasi-brittle failure. Journal of the Mechanics and Physics of Solids 2017, 103, 72–99. [Google Scholar] [CrossRef]
- Feng, Y.; Li, J. A unified regularized variational cohesive fracture theory with directional energy decomposition. International Journal of Engineering Science 2023, 182, 103773. [Google Scholar] [CrossRef]
- Lu, G.D.; Chen, J.B. A new nonlocal macro-meso-scale consistent damage model for crack modeling of quasi-brittle materials. Computer Methods in Applied Mechanics and Engineering 2020, 362, 112802. [Google Scholar] [CrossRef]
- Chen, J.B.; Ren, Y.D.; Lu, G.D. Meso-scale physical modeling of energetic degradation function in the nonlocal macro-meso-scale consistent damage model for quasi-brittle materials. Computer Methods in Applied Mechanics and Engineering 2021, 374, 113588. [Google Scholar] [CrossRef]
- Ren, Y.D.; Chen, J.B.; Lu, G.D. A structured deformation driven nonlocal macro-meso-scale consistent damage model for the compression/shear dominate failure simulation of quasi-brittle materials. Computer Methods in Applied Mechanics and Engineering 2023, 410, 115945. [Google Scholar] [CrossRef]
- Chen, J.B.; Xie, J.K.; Lu, G.D. A new exploration of mesoscopic structure in the nonlocal macro-meso-scale consistent damage model for quasi-brittle materials. Computer Methods in Applied Mechanics and Engineering 2024, 432, 117456. [Google Scholar] [CrossRef]
- Ren, Y.D.; Lu, G.D.; Chen, J.B. Physically consistent nonlocal macro–meso-scale damage model for quasi-brittle materials: A unified multiscale perspective. International Journal of Solids and Structures 2024, 293, 112738. [Google Scholar] [CrossRef]
- Lu, G.D.; Chen, J.B.; Ren, Y.D. New insights into fracture and cracking simulation of quasi-brittle materials based on the NMMD model. Computer Methods in Applied Mechanics and Engineering 2024, 432, 117347. [Google Scholar] [CrossRef]
- Lu, G.D.; Chen, J.B. Dynamic cracking simulation by the nonlocal macro-meso-scale damage model for isotropic materials. International Journal for Numerical Methods in Engineering 2021, 122, 3070–3099. [Google Scholar] [CrossRef]
- Zhao, Z.W.; Du, C.B.; Sun, L.G. , Du, N. Simulation of the dynamic cracking of brittle materials using a nonlocal damage model with an effective strain rate effect. Computer Methods in Applied Mechanics and Engineering 2024, 418, 116579. [Google Scholar]
- Xia, X.Z.; Wang, X.; Lu, G.D.; Gu, X.; Lv, W.F.; Zhang, Q.; Ma, L.Z. A new nonlocal macro-micro-scale consistent damage model for layered rock mass. Theoretical and Applied Fracture Mechanics 2024, 133 Part A, 104540. [Google Scholar] [CrossRef]
- Lv, W.F.; Lu, G.D.; Xia, X.Z.; Gu, X.; Zhang, Q. Energy degradation mode in nonlocal macro-meso-scale damage consistent model for quasi-brittle materials. Theoretical and Applied Fracture Mechanics 2024, 130, 104288. [Google Scholar] [CrossRef]
- Li, J.; Ren, X.D. Stochastic damage model for concrete based on energy equivalent strain. International Journal of Solids and Structures 2009, 46, 2407–2419. [Google Scholar] [CrossRef]
- Ren, Y.D.; Chen, J.B.; Lu, G.D. Mesoscopic simulation of uniaxial compression fracture of concrete via the nonlocal macro–meso-scale consistent damage model. Engineering Fracture Mechanics 2024, 304, 110148. [Google Scholar] [CrossRef]
- May, I.; Duan, Y. A local arc-length procedure for strain softening. Computers & Structures 1997, 64, 297–303. [Google Scholar]
- Yang, Z. J.; Li, B. B.; Wu, J. Y. X-ray computed tomography images based phase-field modeling of mesoscopic failure in concrete. Engineering Fracture Mechanics 2019, 208, 151–170. [Google Scholar] [CrossRef]
- Xia, Y.; Wu, W.; Yang, Y.; Fu, X. Mesoscopic study of concrete with random aggregate model using phase field method. Construction and Building Materials 2021, 310, 125199. [Google Scholar] [CrossRef]
- Kosambi, D.D. Statistics in function space. Journal of the Indian Mathematical Society 1943, 7, 76–88. [Google Scholar]
- Shinozuka, M.; Deodatis, G. Simulation of stochastic processes by spectral representation. Applied Mechanics Reviews 1991, 44, 191–204. [Google Scholar] [CrossRef]
- Shinozuka, M.; Deodatis, G. Simulation of multi-dimensional gaussian stochastic fields by spectral representation. Applied Mechanics Reviews 1996, 49, 29–53. [Google Scholar] [CrossRef]
- Chen, J.B.; He, J.R.; Ren, X.D. , Li, J. Stochastic harmonic function representation of random fields for material properties of structures. Journal of Engineering Mechanics 2018, 144, 04018049. [Google Scholar]
- Chen, J.B.; Li, J. Stochastic harmonic function and spectral representations. Chinese Journal of Theoretical and Applied Mechanics 2011, 43, 505–513. [Google Scholar]
- Sun, W.L.; Chen, J.B.; Li, J. Stochastic harmonic functions of second kind spectral representations. Journal of Tongji University: Natural Science (in Chinese) 2011, 39, 1413–1419. [Google Scholar]
- Liang, S.X.; Sun, W.L.; Li, J. Simulation of multi-dimensional random fields by stochastic harmonic functions. Journal of Tongji University: Natural Science (in Chinese) 2012, 40, 965–970. [Google Scholar]
- Vanmarcke, E. Random fields: Analysis and synthesis. World Scientific, Singapore, 2010.
- Grégoire, D.; Rojas-Solano, L.B.; Pijaudier-Cabot, G. Failure and size effect for notched and unnotched concrete beams. International Journal for Numerical and Analytical Methods in Geomechanics 2013, 37, 1434–1452. [Google Scholar] [CrossRef]
- Ren, Y.D.; Chen, J.B. Simulation of behaviour of typical concrete specimens based on a nonlocal macro-meso-scale consistent damage model. Chinese Journal of Theoretical and Applied Mechanics (in Chinese) 2021, 53, 1196–1211. [Google Scholar]
- Jirásek, M.; Bauer, M. Numerical aspects of the crack band approach. Computers & Structures 2012, 110-111, 60-78.
- Geers, M.; de Borst, R.; Brekelmans, W. , Peerlings, R. Strain-based transient-gradient damage model for failure analyses. Computer Methods in Applied Mechanics and Engineering 1998, 160, 133–153. [Google Scholar]
- Yin, X.; Li, Q. H.; Wang, Q.M.; Reinhardt, H. W.; Xu, S. L. The double-K fracture model: A state-of-the-art review. Engineering Fracture Mechanics 2023, 277, 108988. [Google Scholar] [CrossRef]
- Le, J. L.; Eliáš, J. A probabilistic crack band model for quasibrittle fracture. Journal of Applied Mechanics 2016, 83, 051005. [Google Scholar] [CrossRef]
- Gorgogianni, A.; Eliáš, J.; Le, J. L. Mesh objective stochastic simulations of quasibrittle fracture. Journal of the Mechanics and Physics of Solids 2022, 159, 104745. [Google Scholar] [CrossRef]
Figure 1.
Meso-structure of NMMD model.
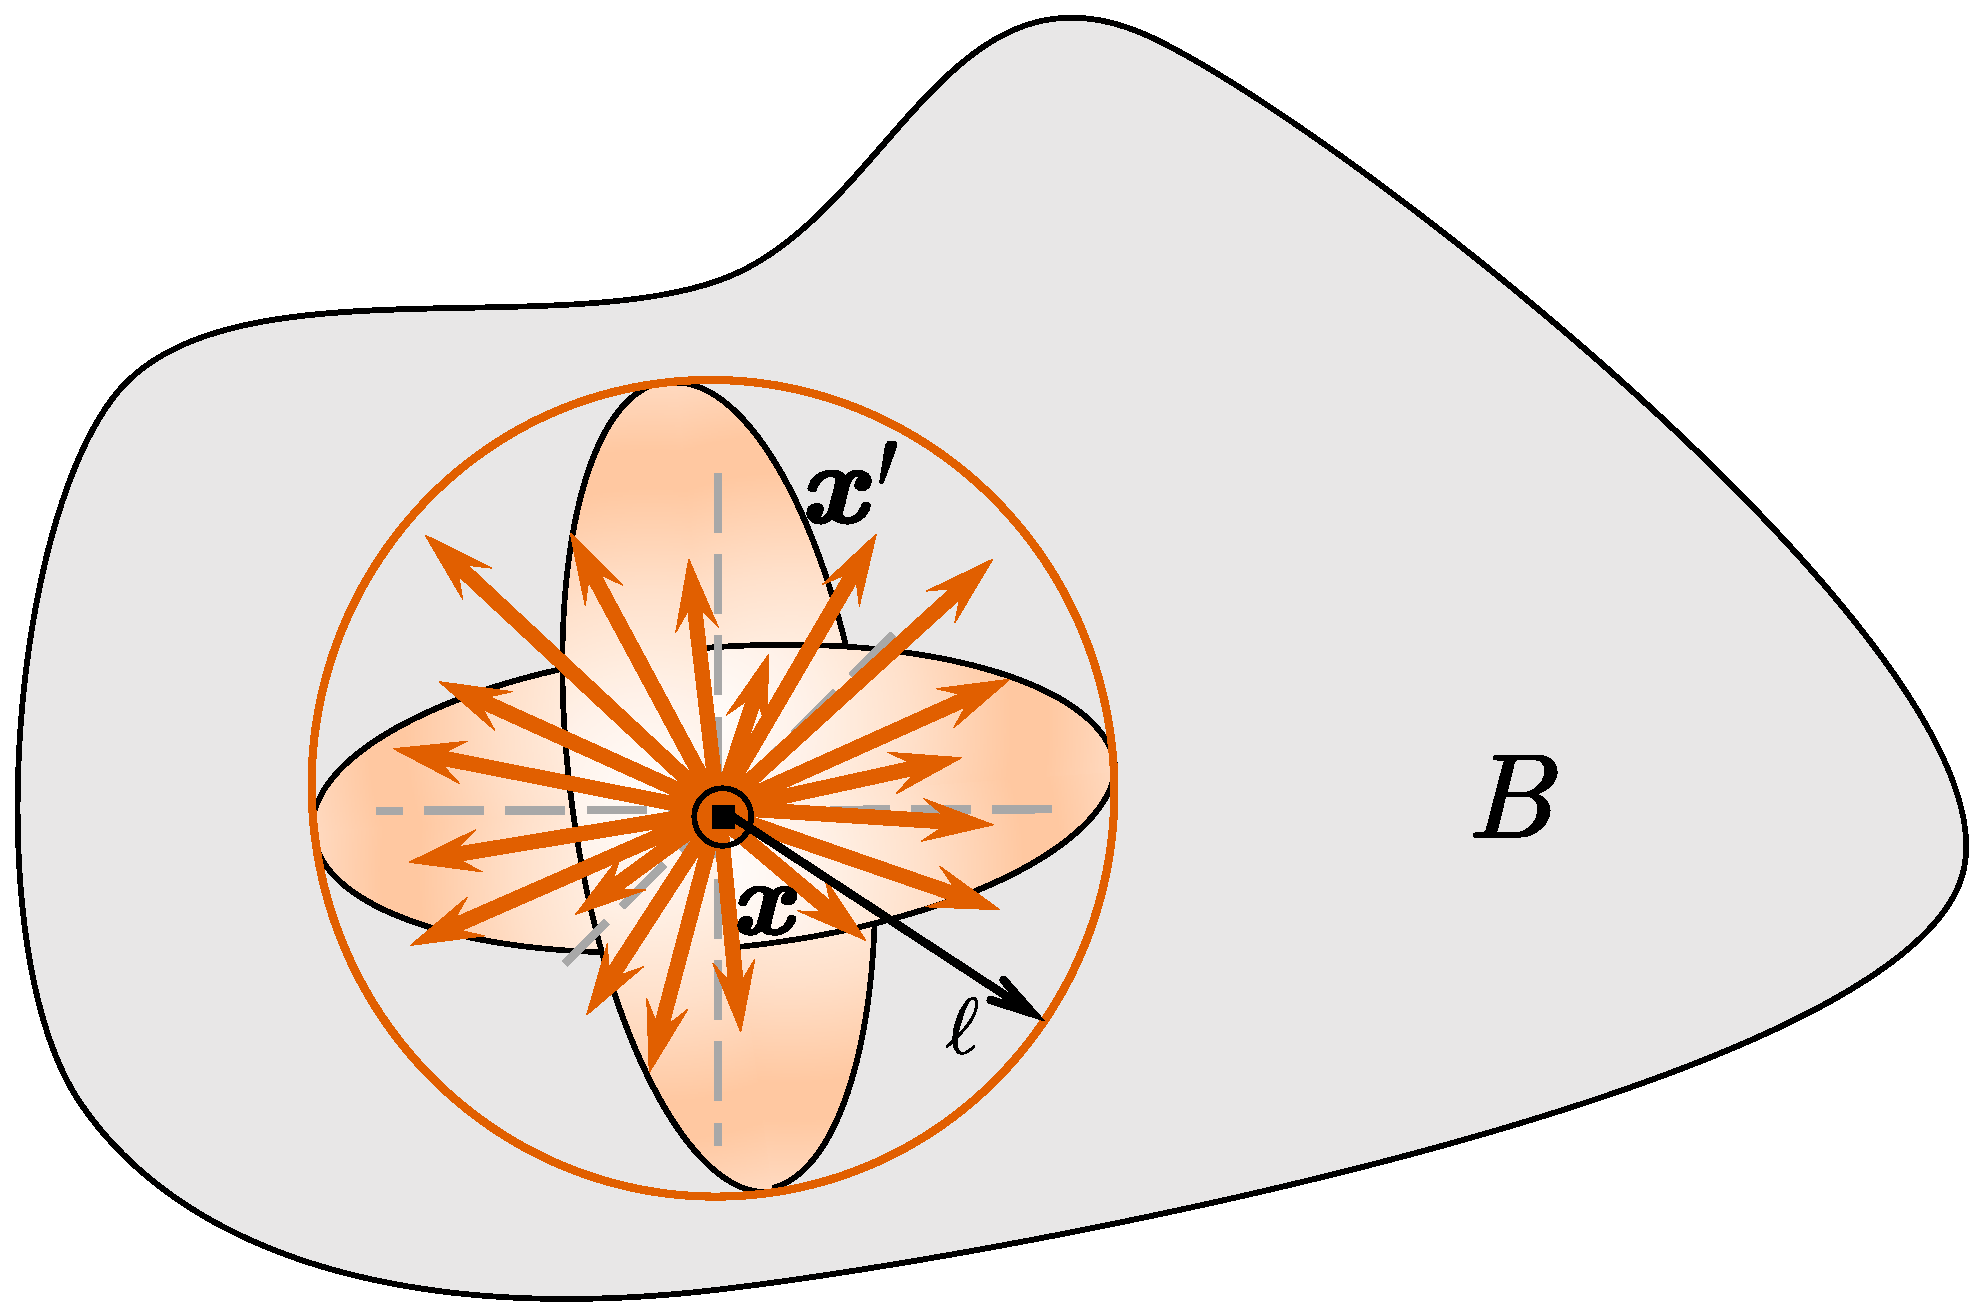
Figure 2.
Geometry and boundary conditions of TPBB.
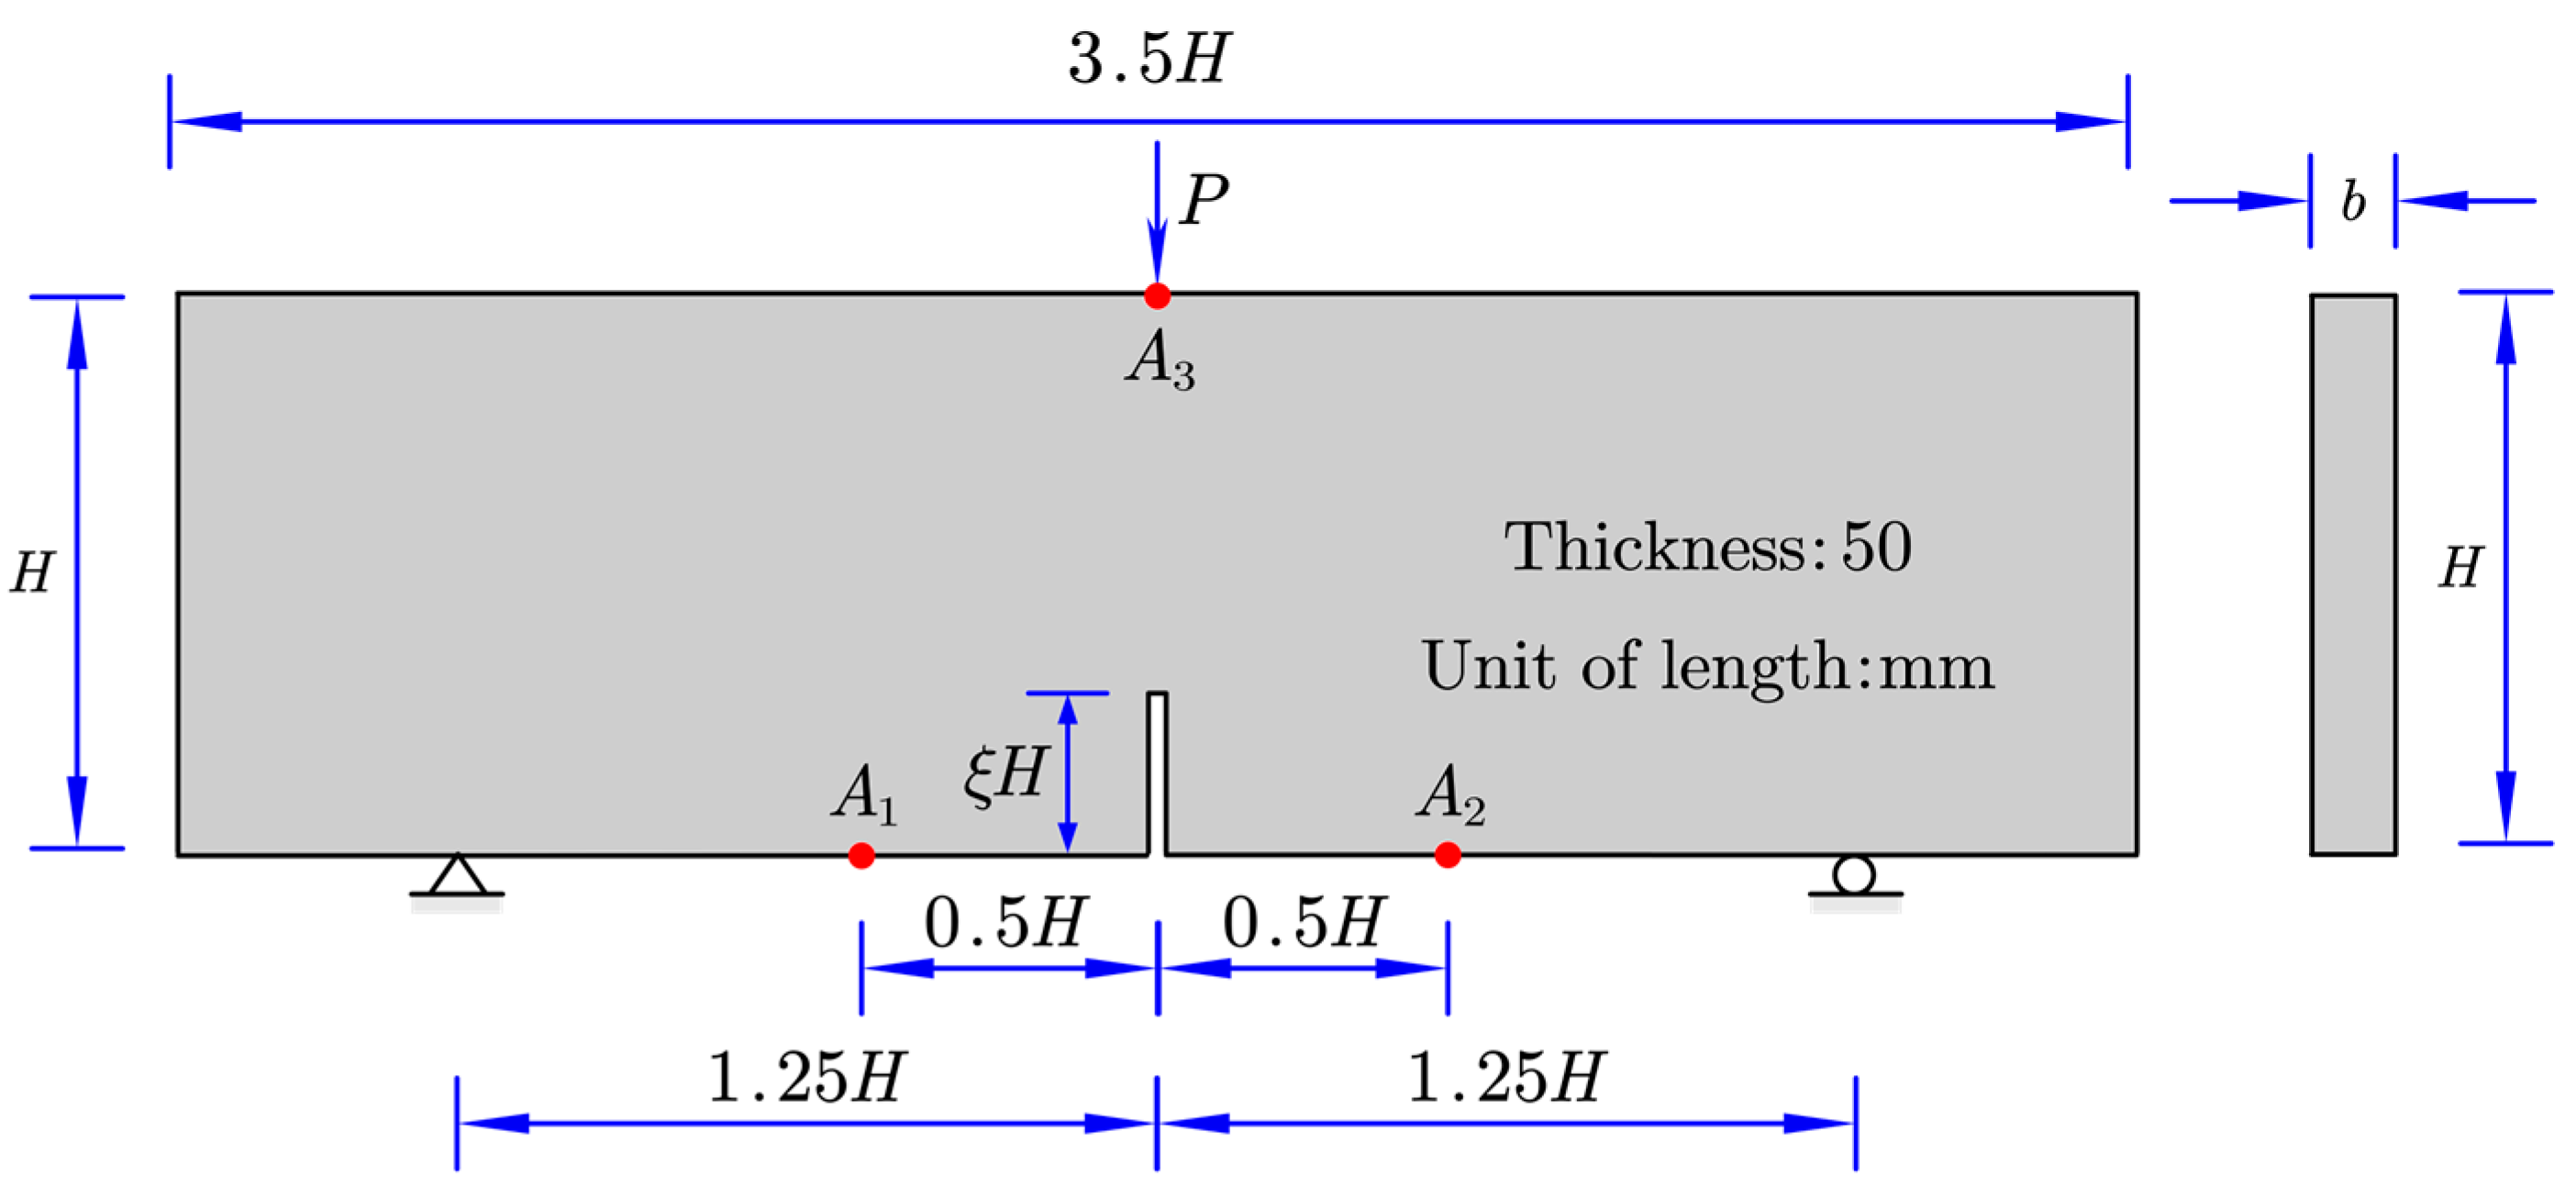
Figure 3.
Region partition of TPBB.
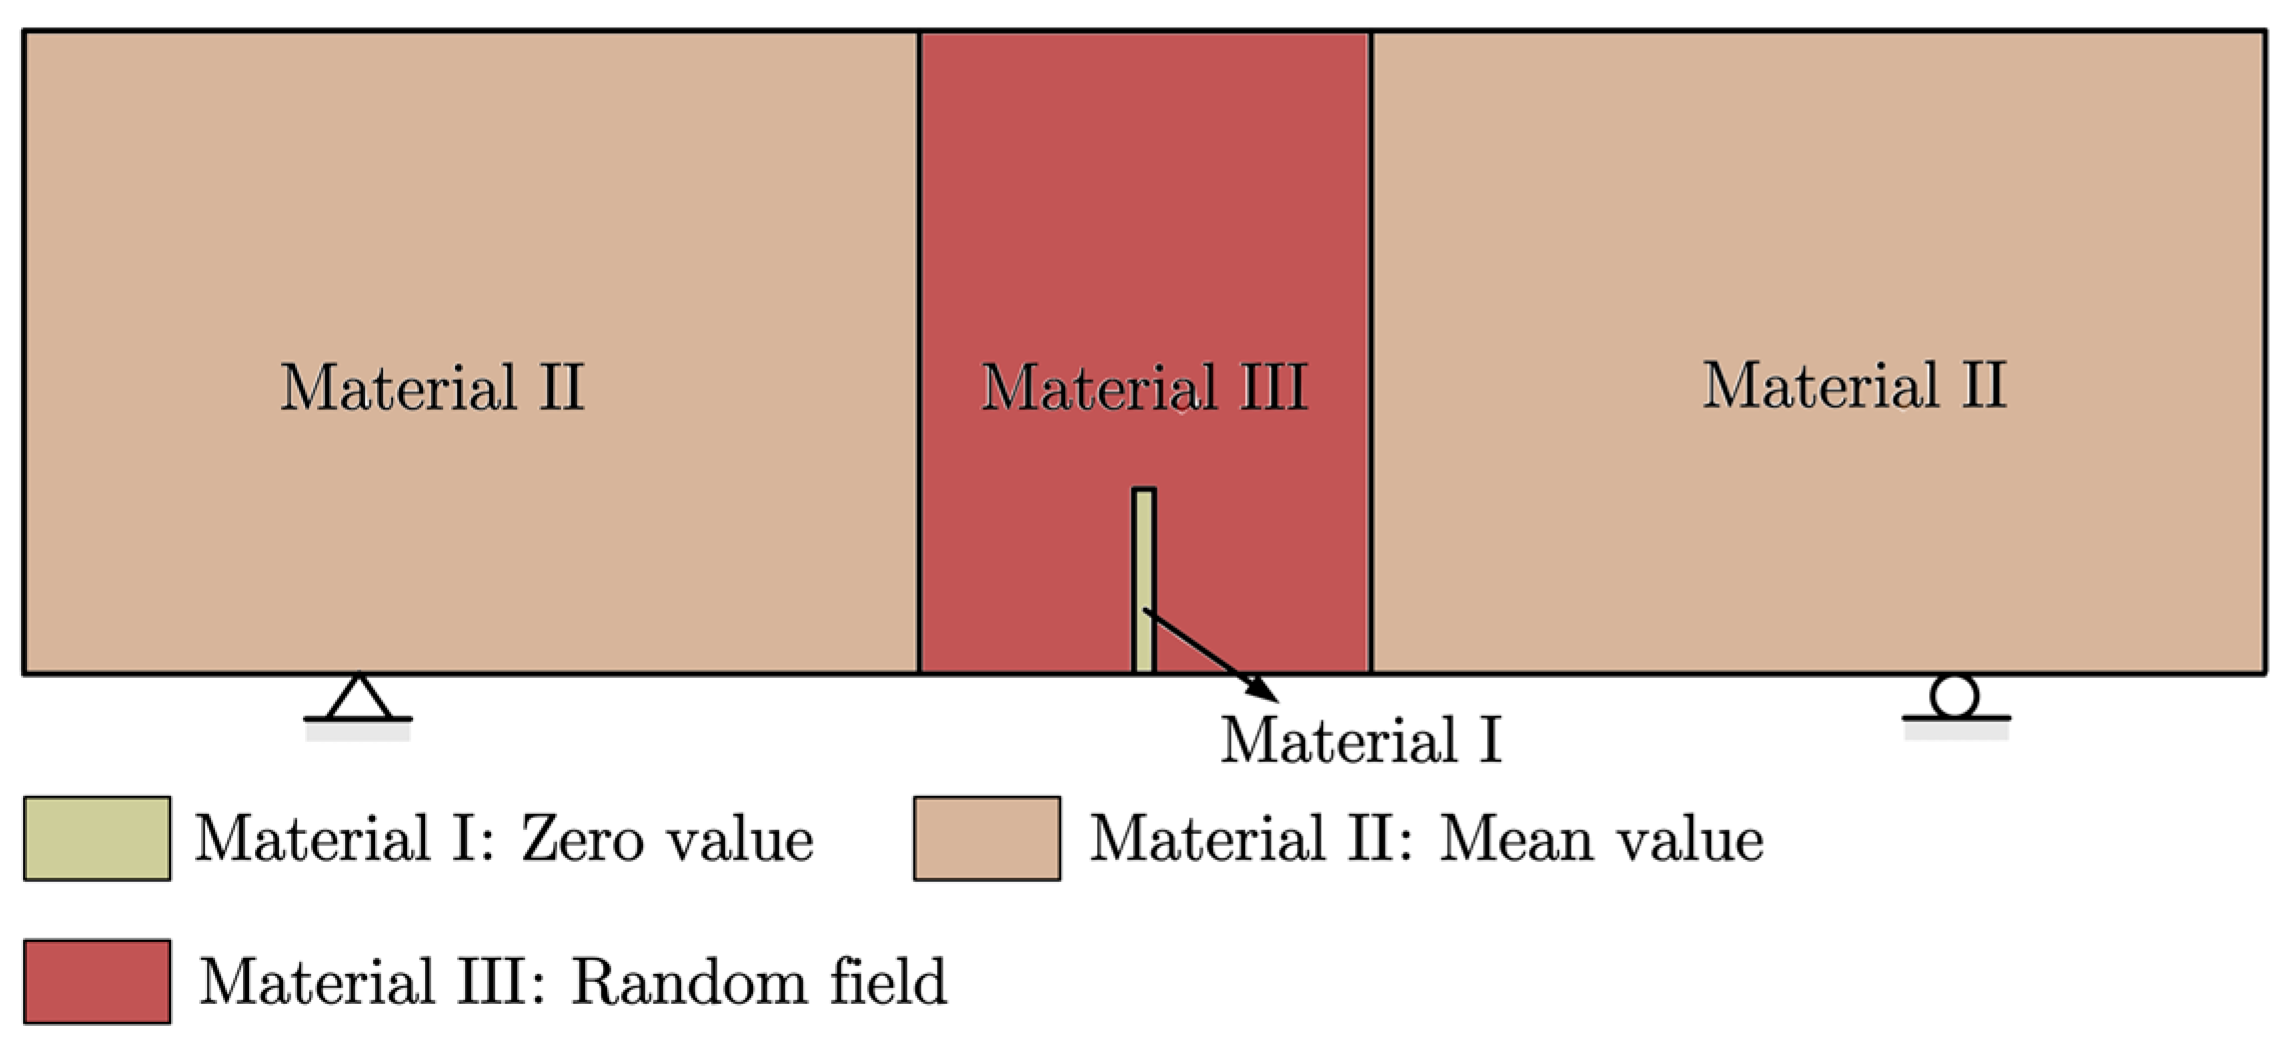
Figure 4.
Samples of random field with different correlation lengths: (a) ; (b) ; (c) .
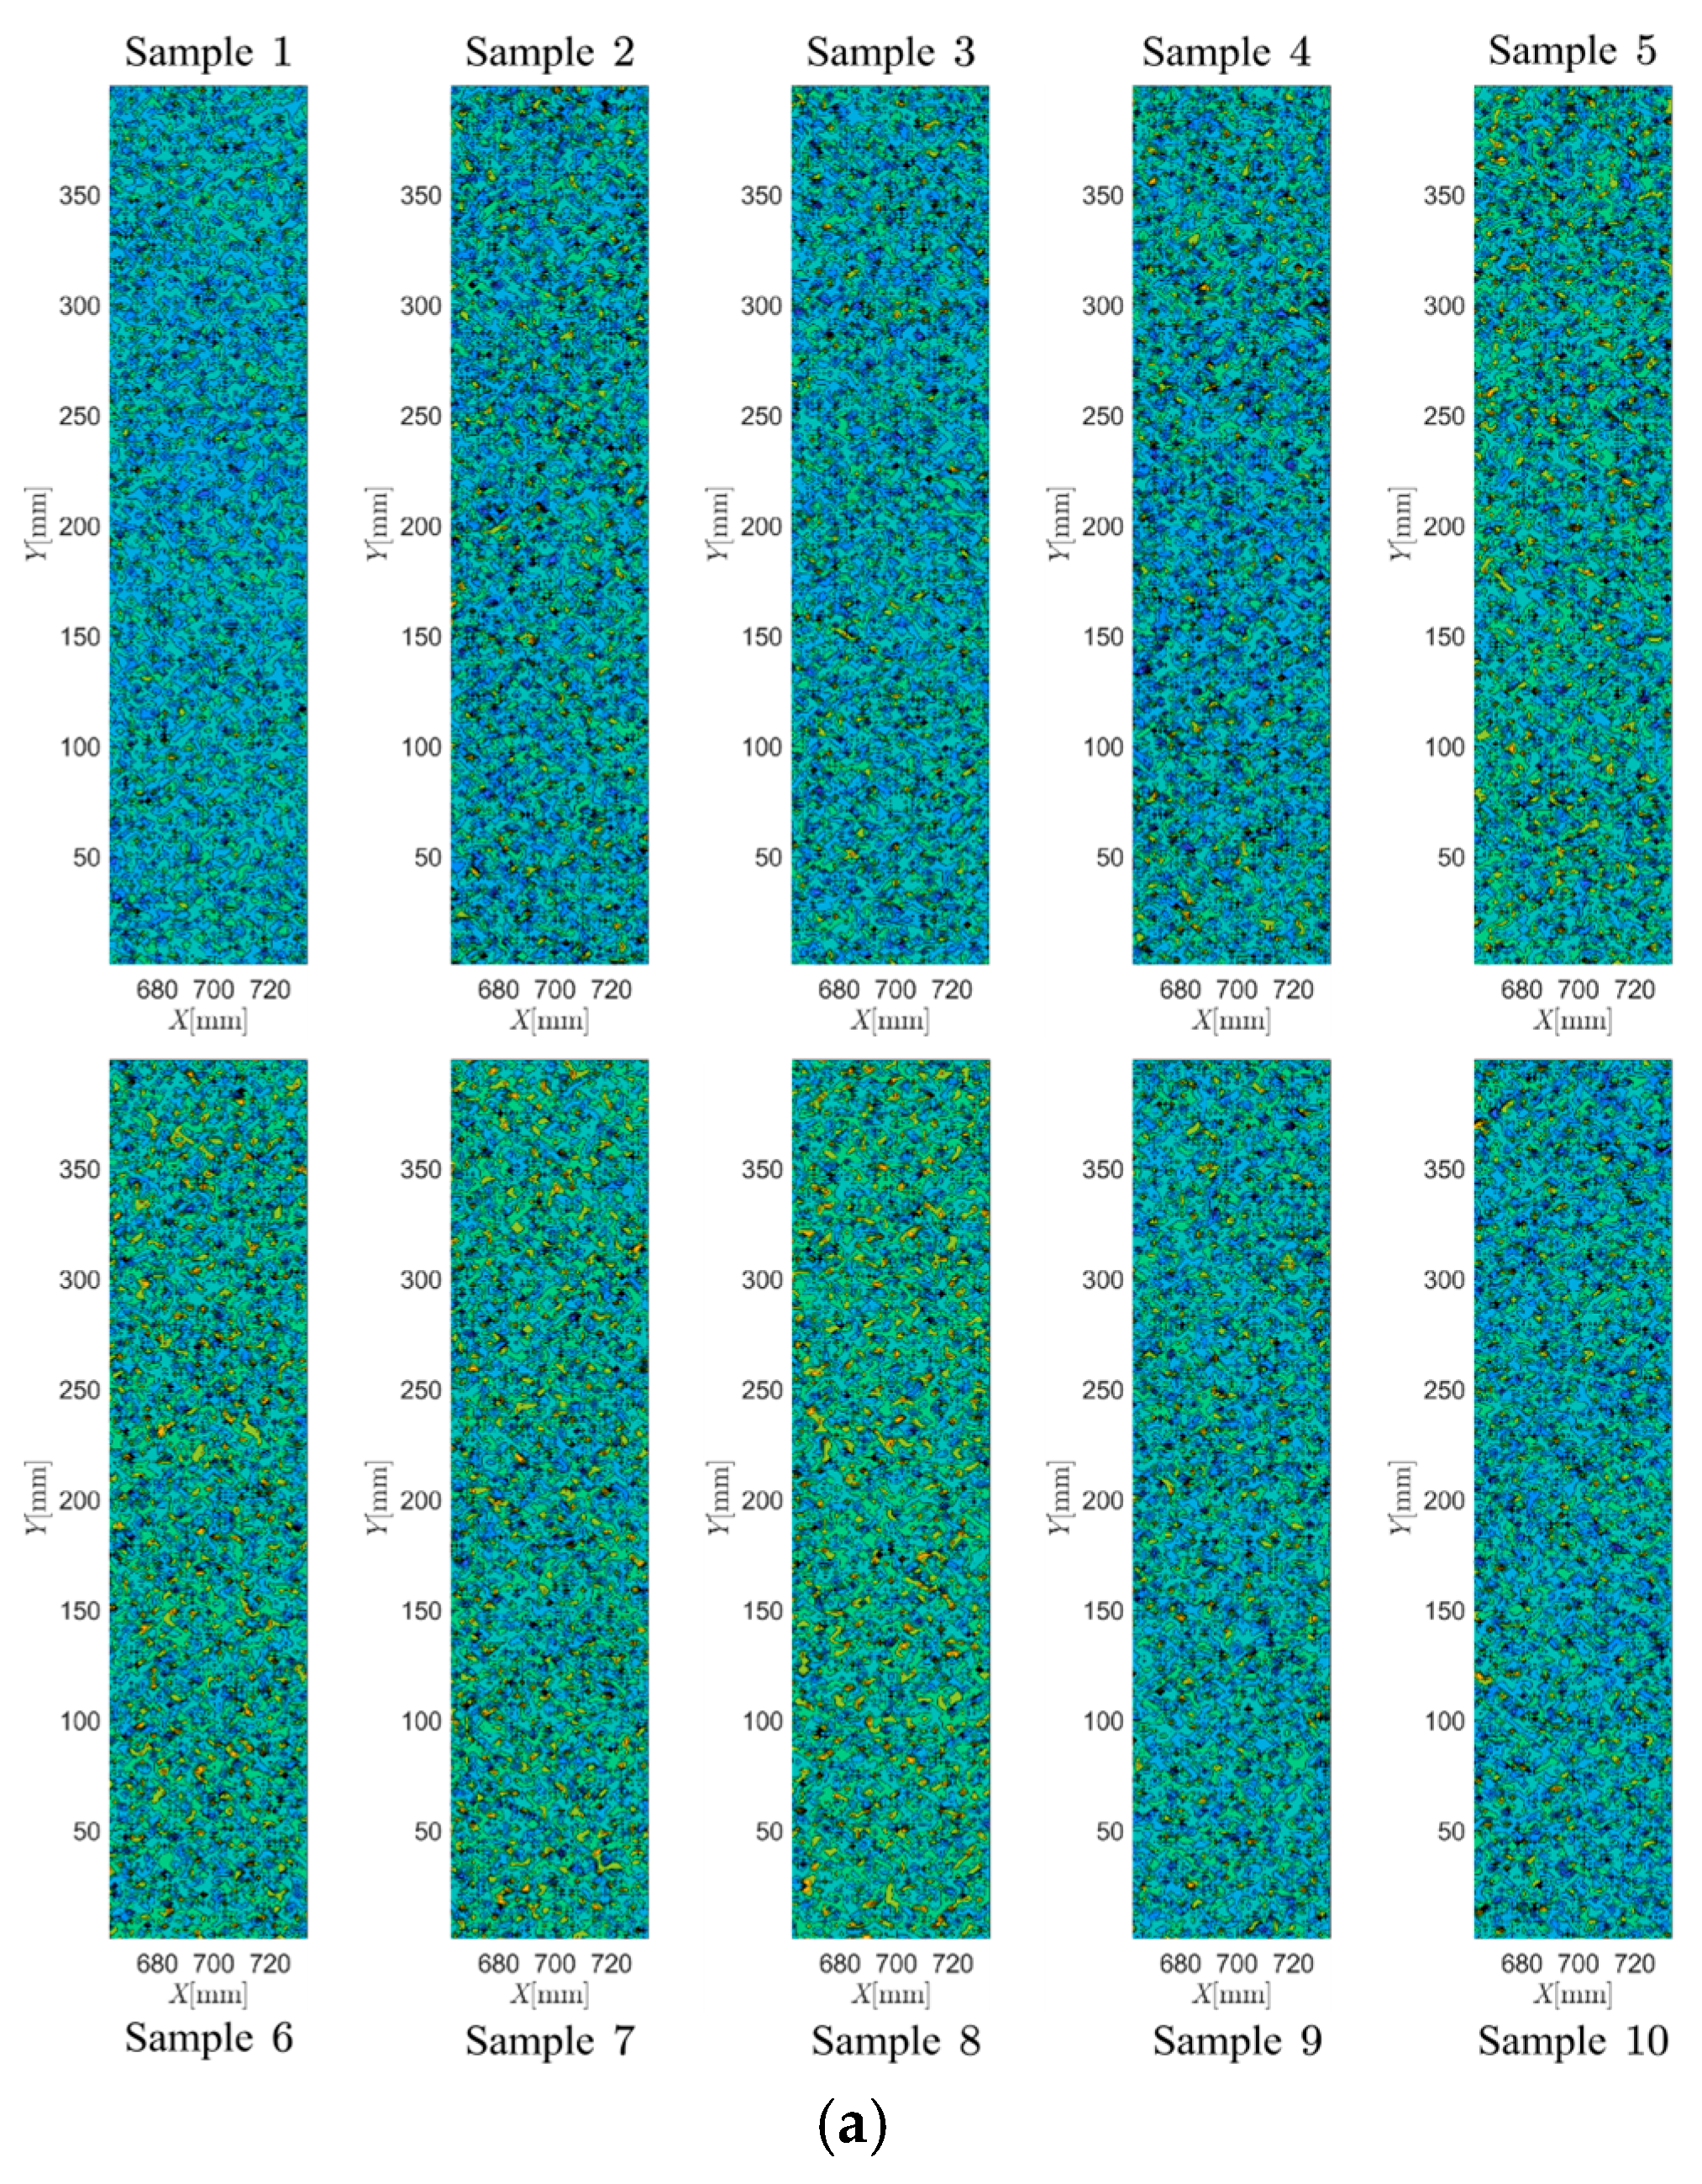
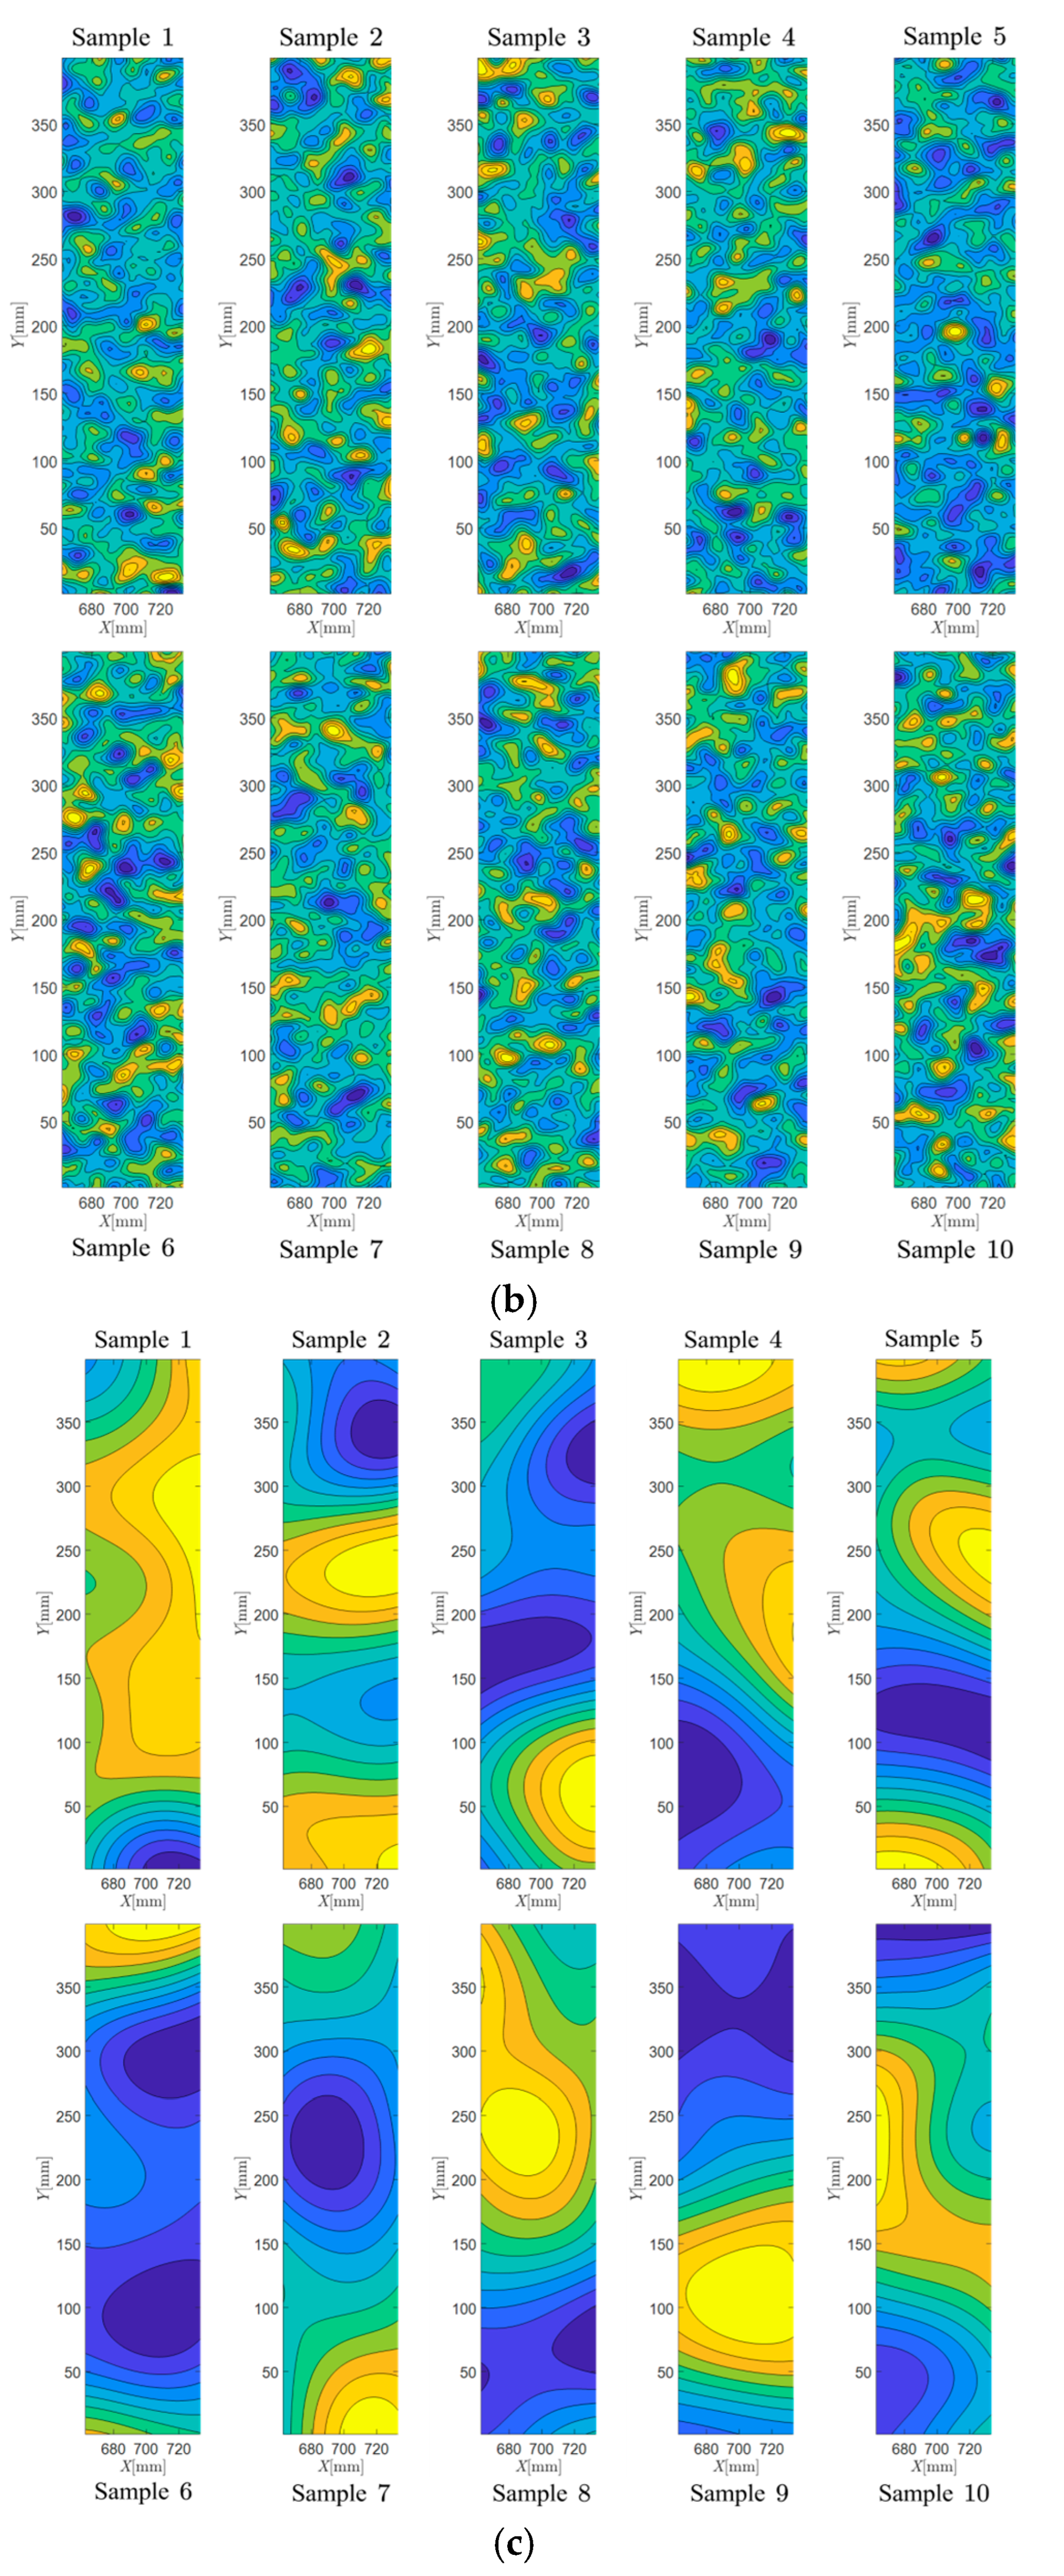
Figure 5.
Comparison of the load versus CMOD curves with different correlation lengths: (a) ; (b) ; (c) .
Figure 5.
Comparison of the load versus CMOD curves with different correlation lengths: (a) ; (b) ; (c) .
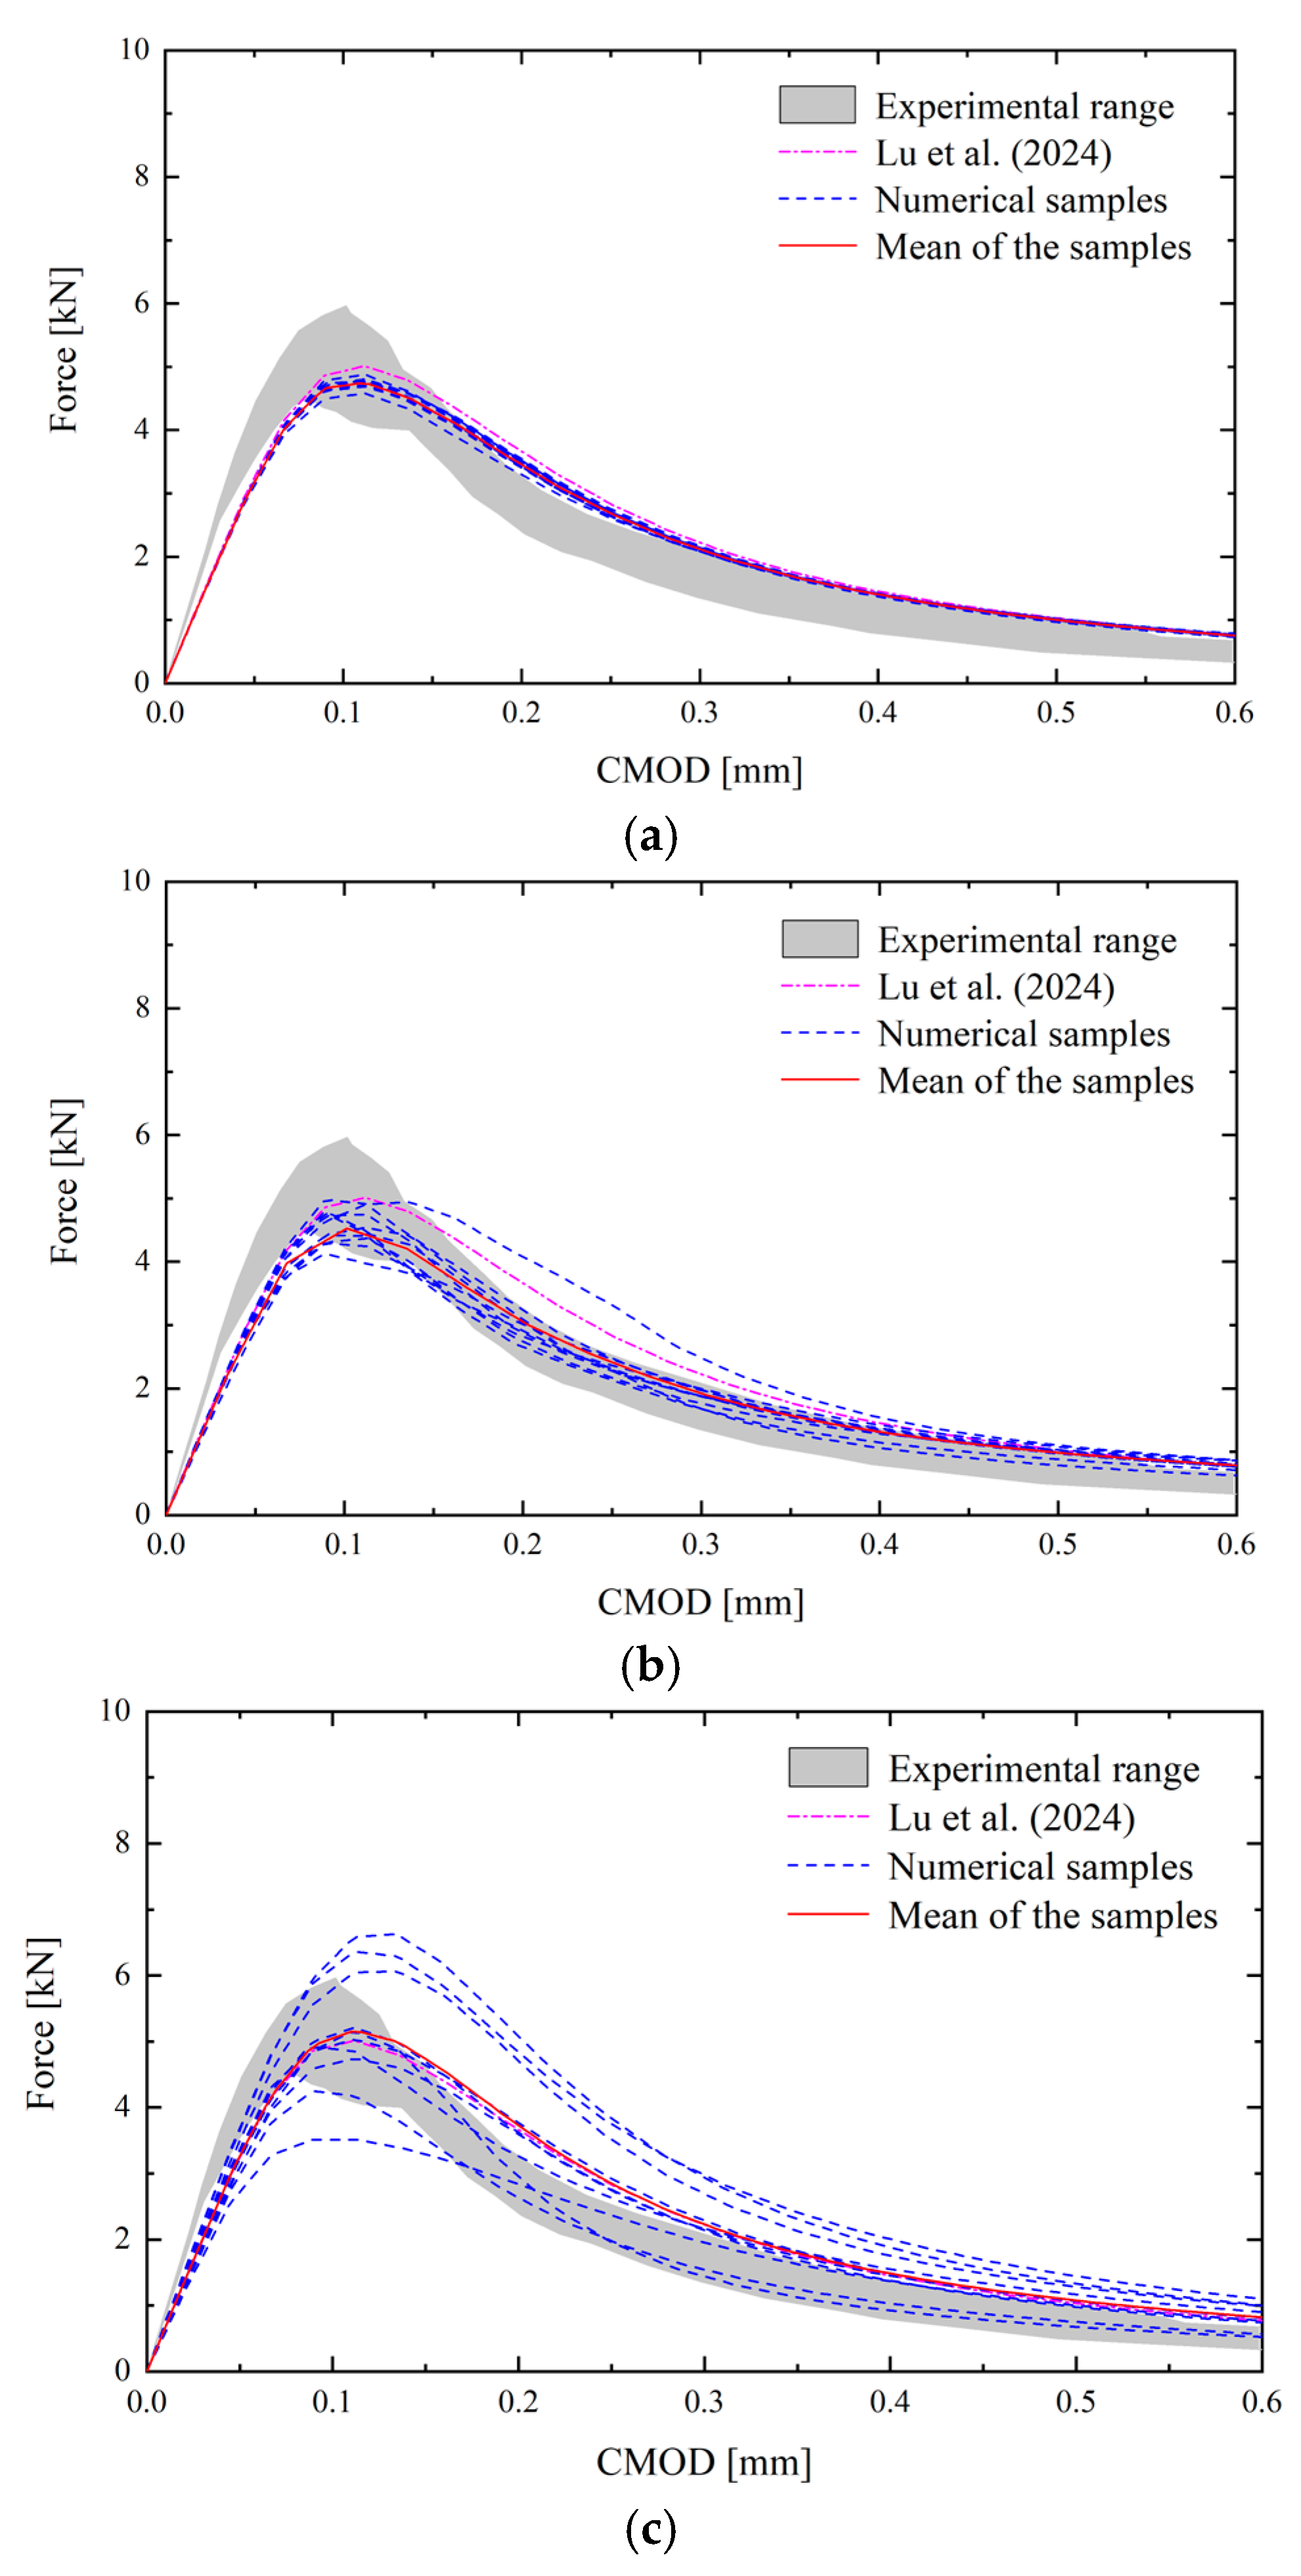
Figure 6.
Comparison of the load versus DLP curves with different correlation lengths: (a) ; (b) ; (c) .
Figure 6.
Comparison of the load versus DLP curves with different correlation lengths: (a) ; (b) ; (c) .
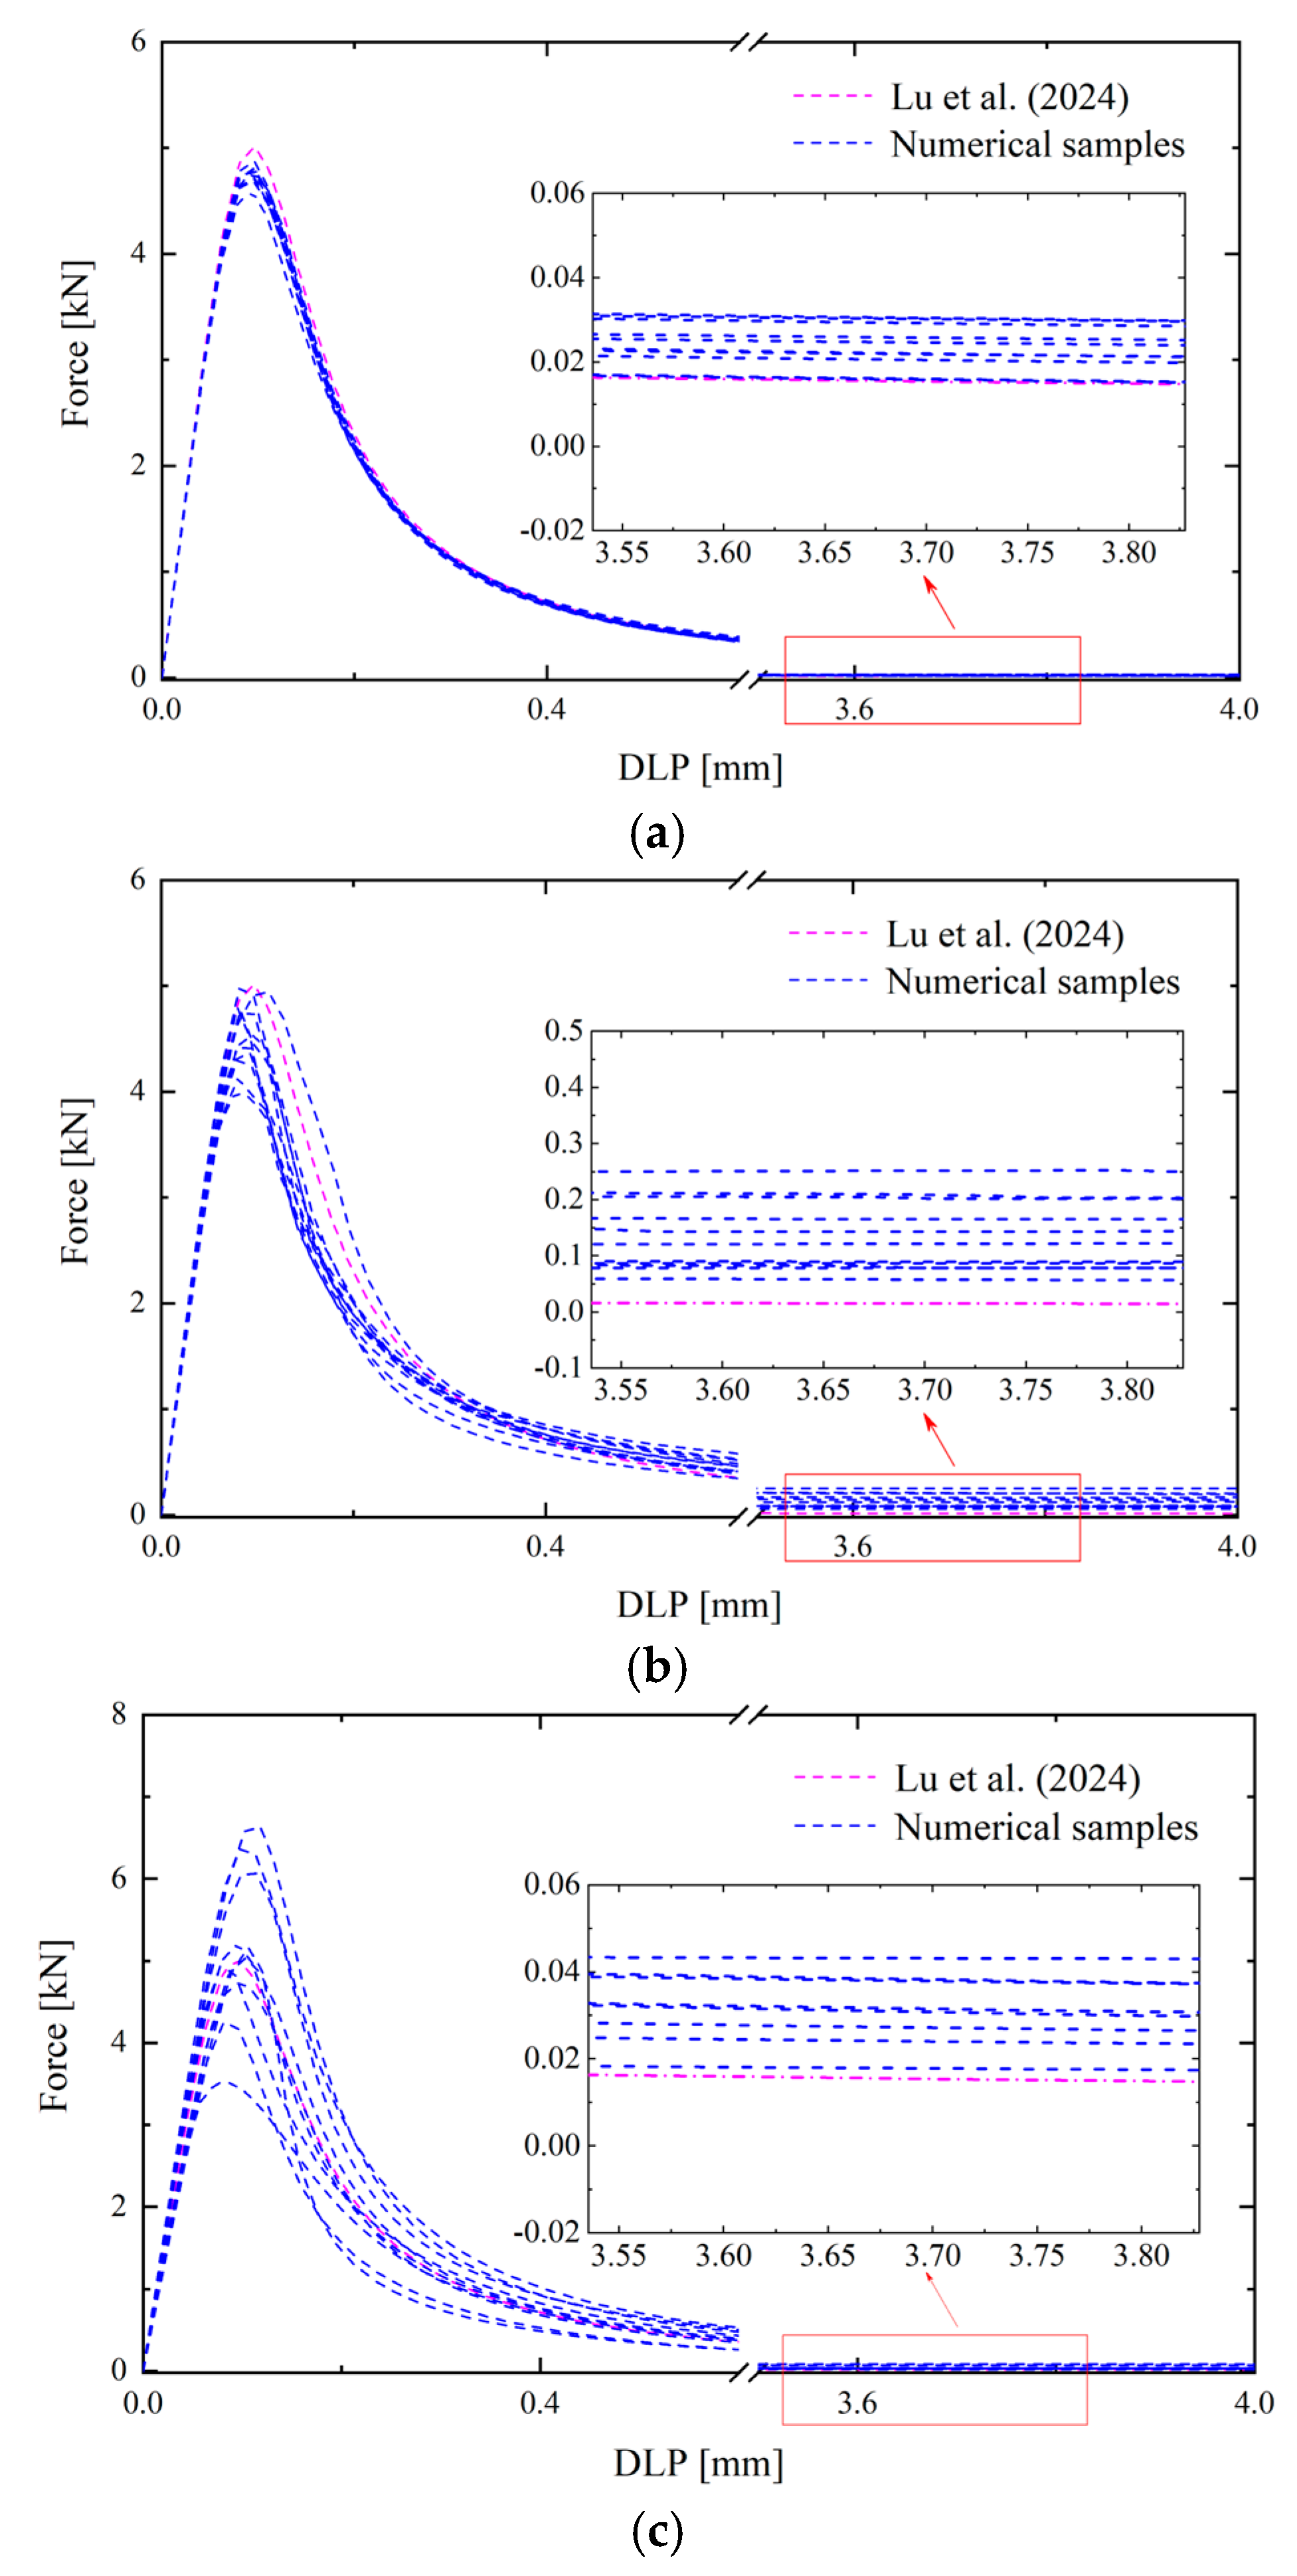
Figure 7.
Comparison of the crack patterns with different correlation lengths: (a) ; (b) ; (c) .
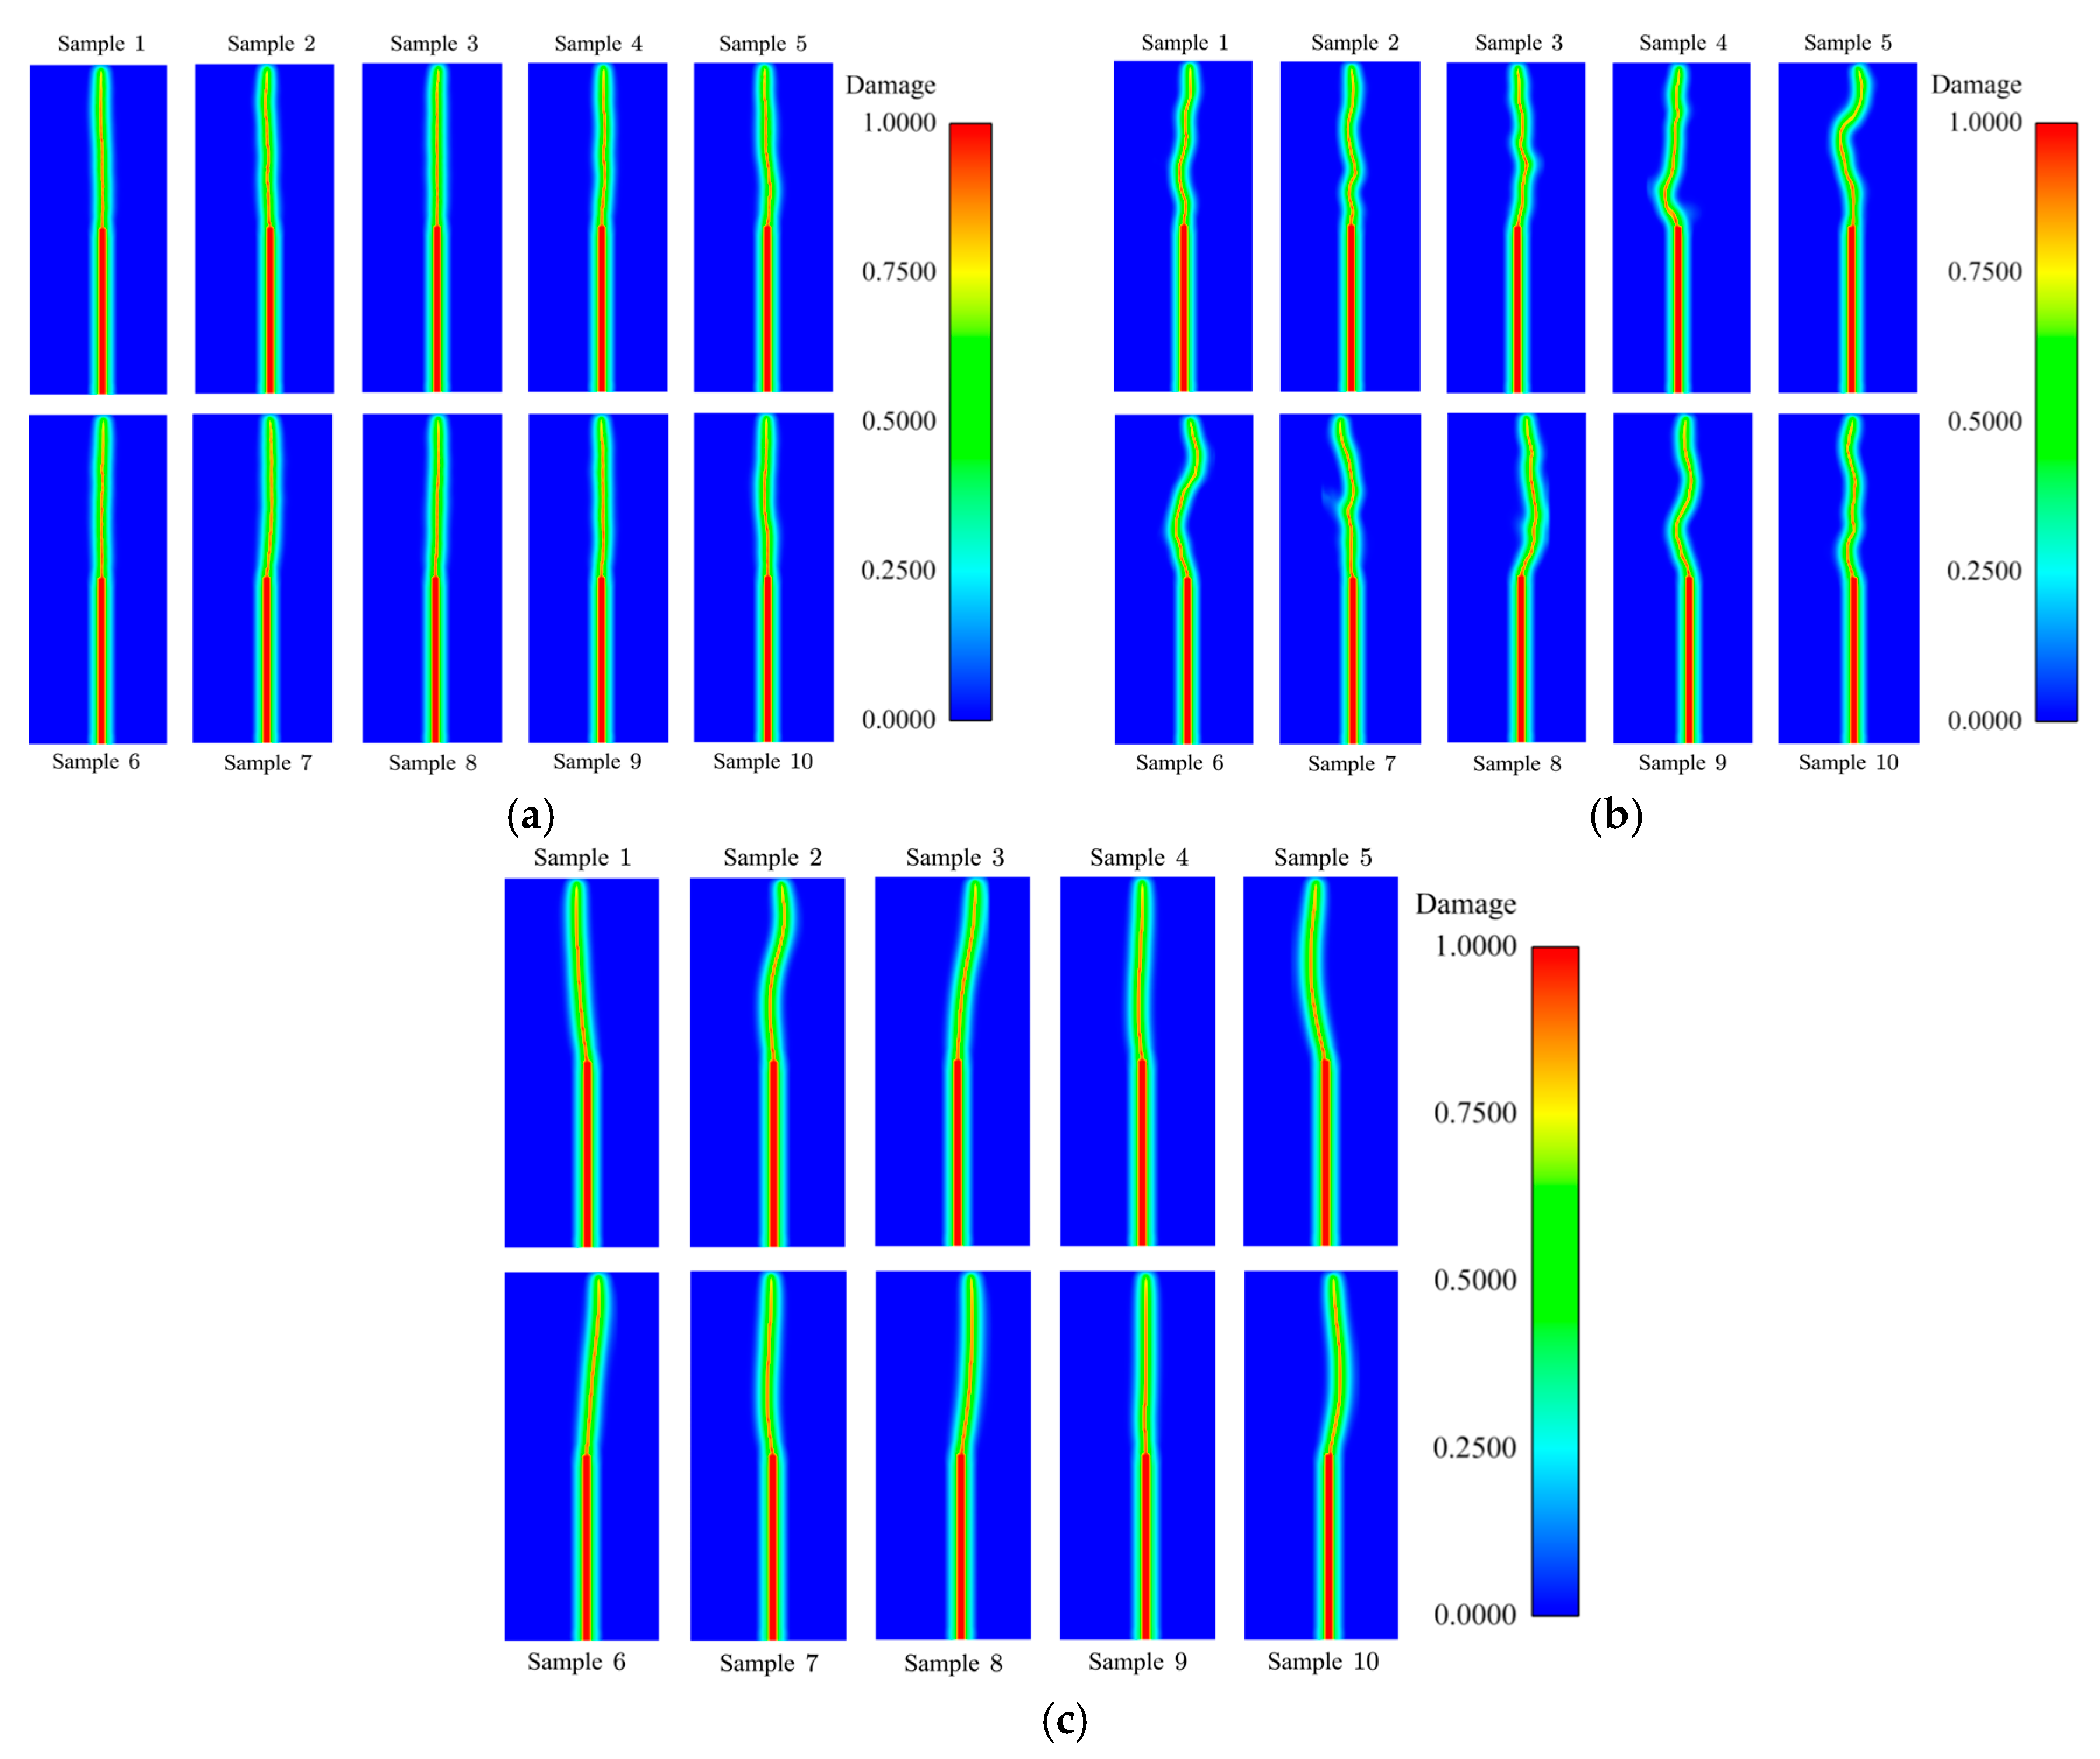
Figure 8.
Comparison of the load versus CMOD curves obtained from the experiments, deterministic results and numerical samples in the stochastic NMMD model for different notch-to-depth cases: (a) ; (b); (c); (d); (e); (f); (g); (h).
Figure 8.
Comparison of the load versus CMOD curves obtained from the experiments, deterministic results and numerical samples in the stochastic NMMD model for different notch-to-depth cases: (a) ; (b); (c); (d); (e); (f); (g); (h).
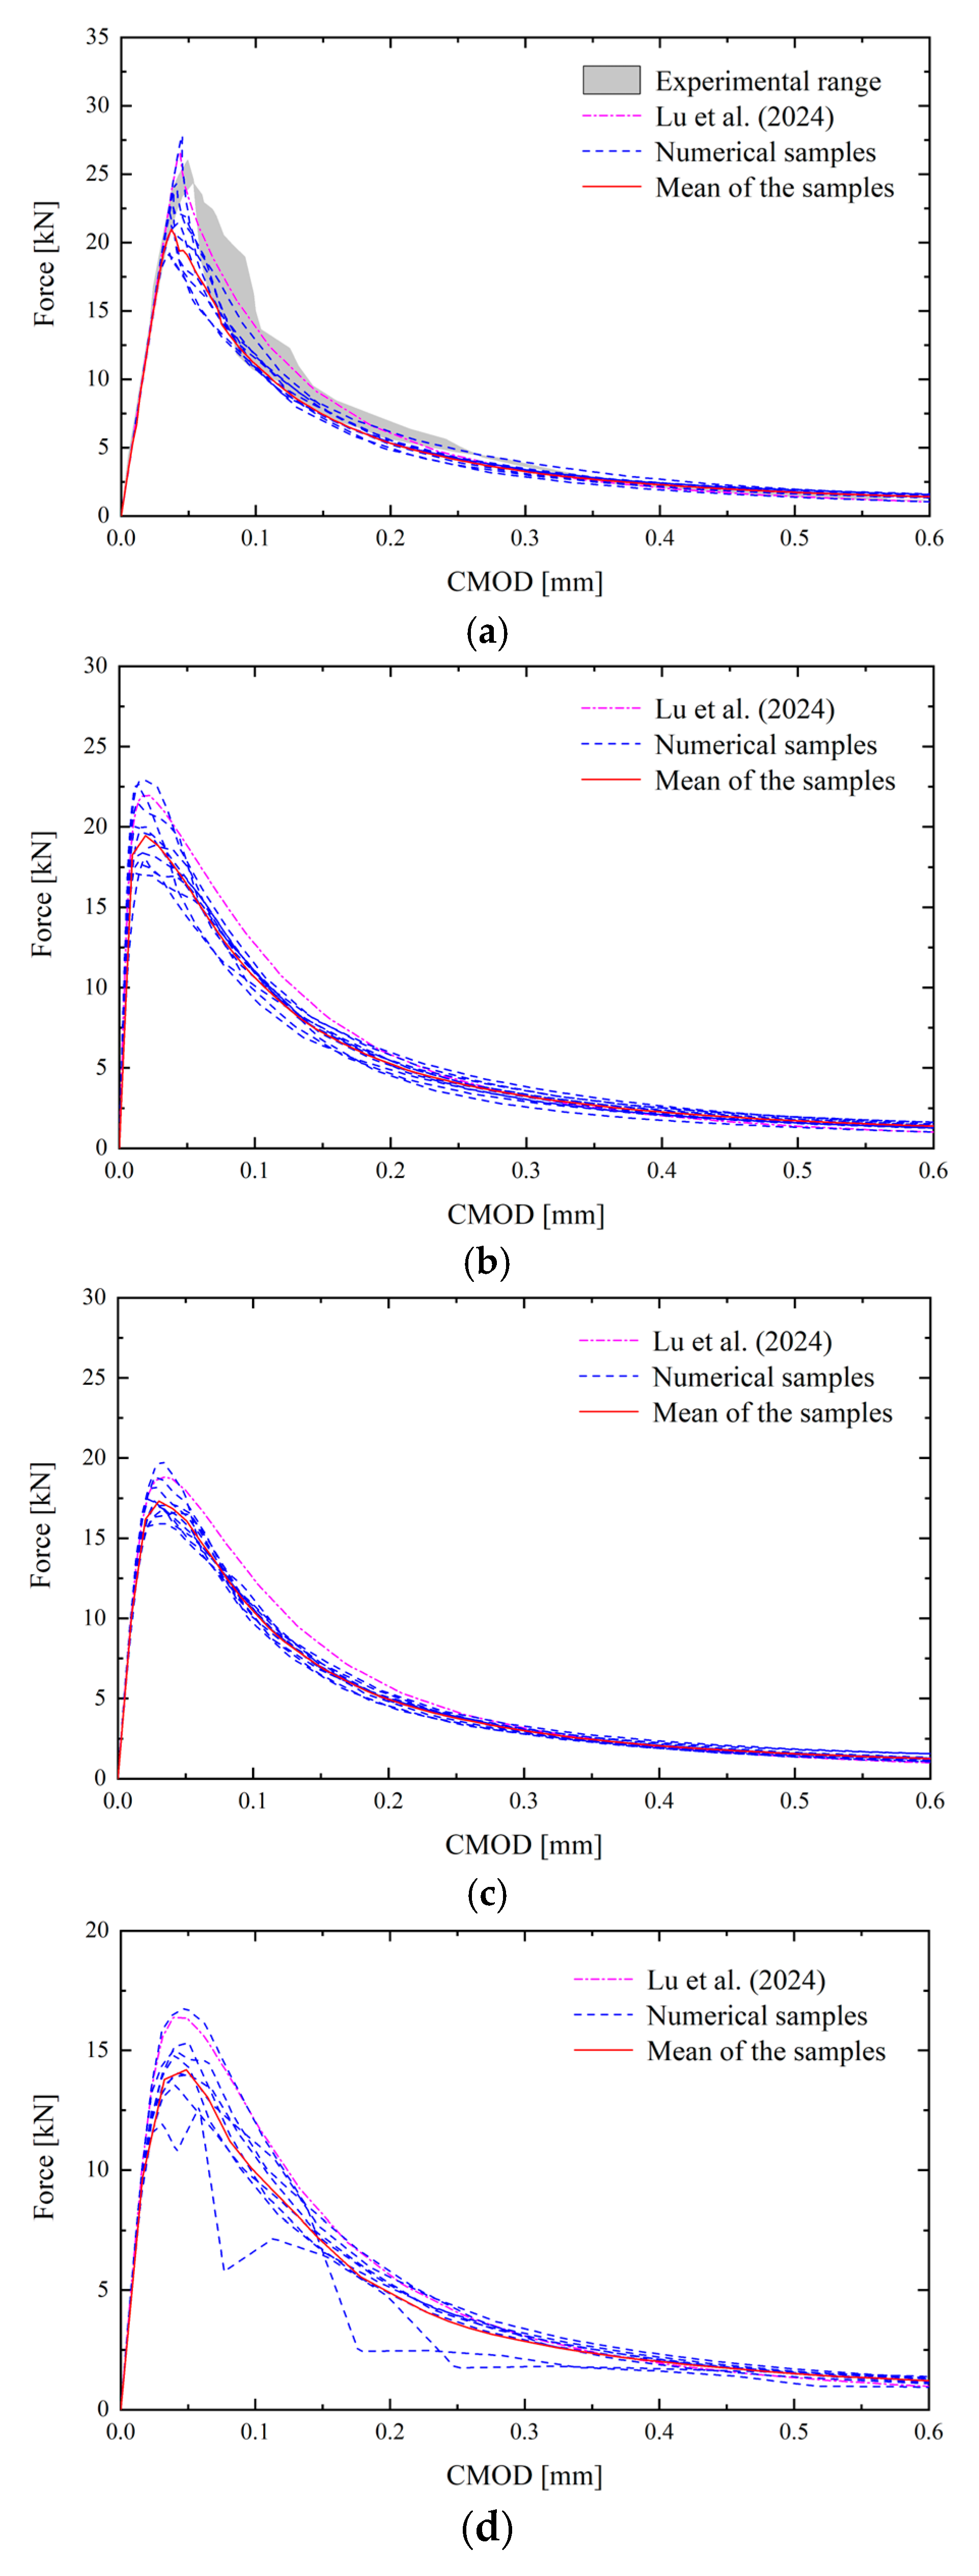
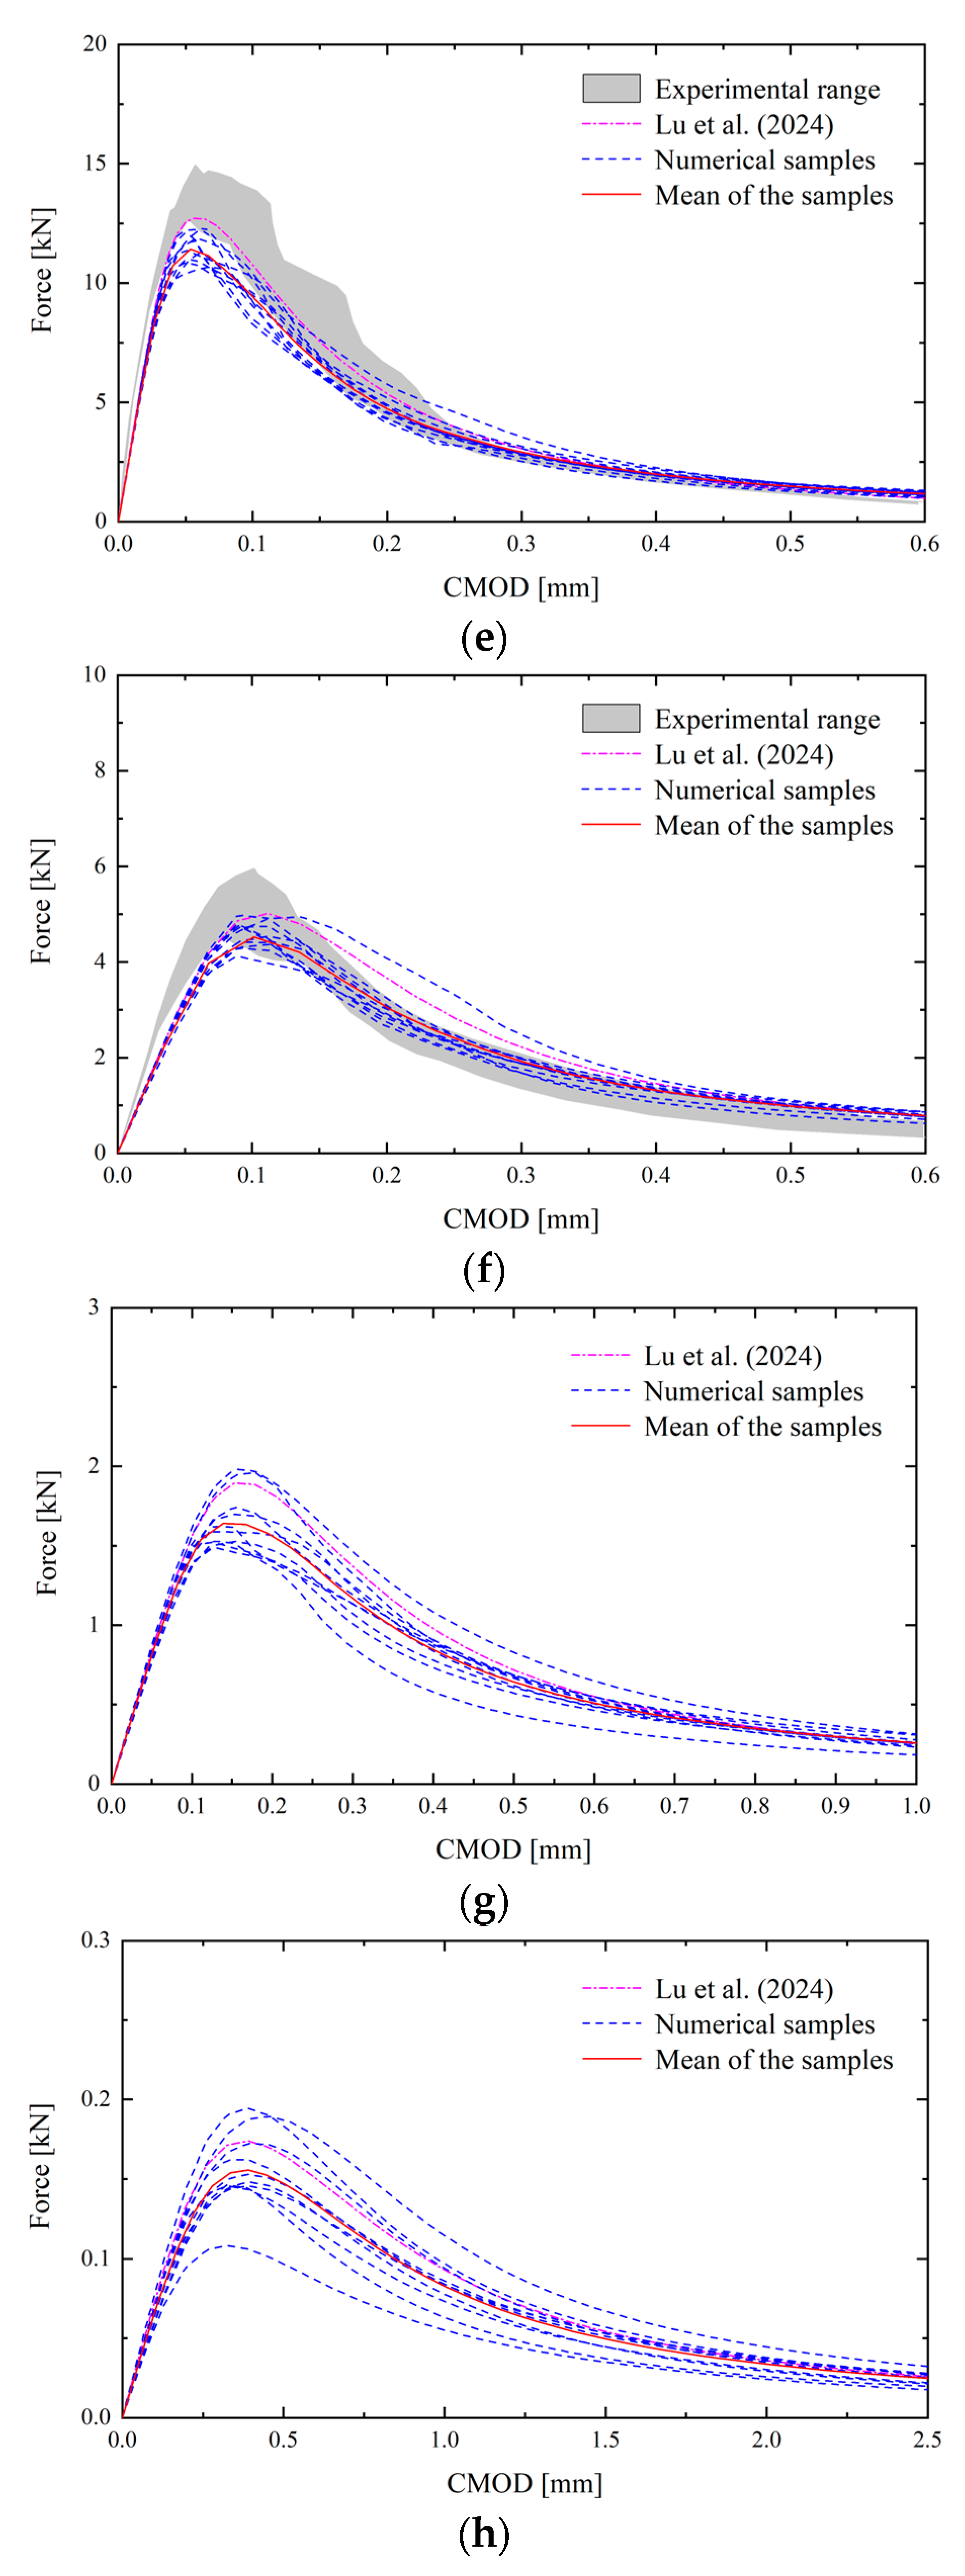
Figure 9.
Comparison of the load versus DLP curves obtained from the deterministic and stochastic NMMD model for different notch-to-depth cases: (a) ; (b); (c); (d); (e); (f); (g); (h).
Figure 9.
Comparison of the load versus DLP curves obtained from the deterministic and stochastic NMMD model for different notch-to-depth cases: (a) ; (b); (c); (d); (e); (f); (g); (h).
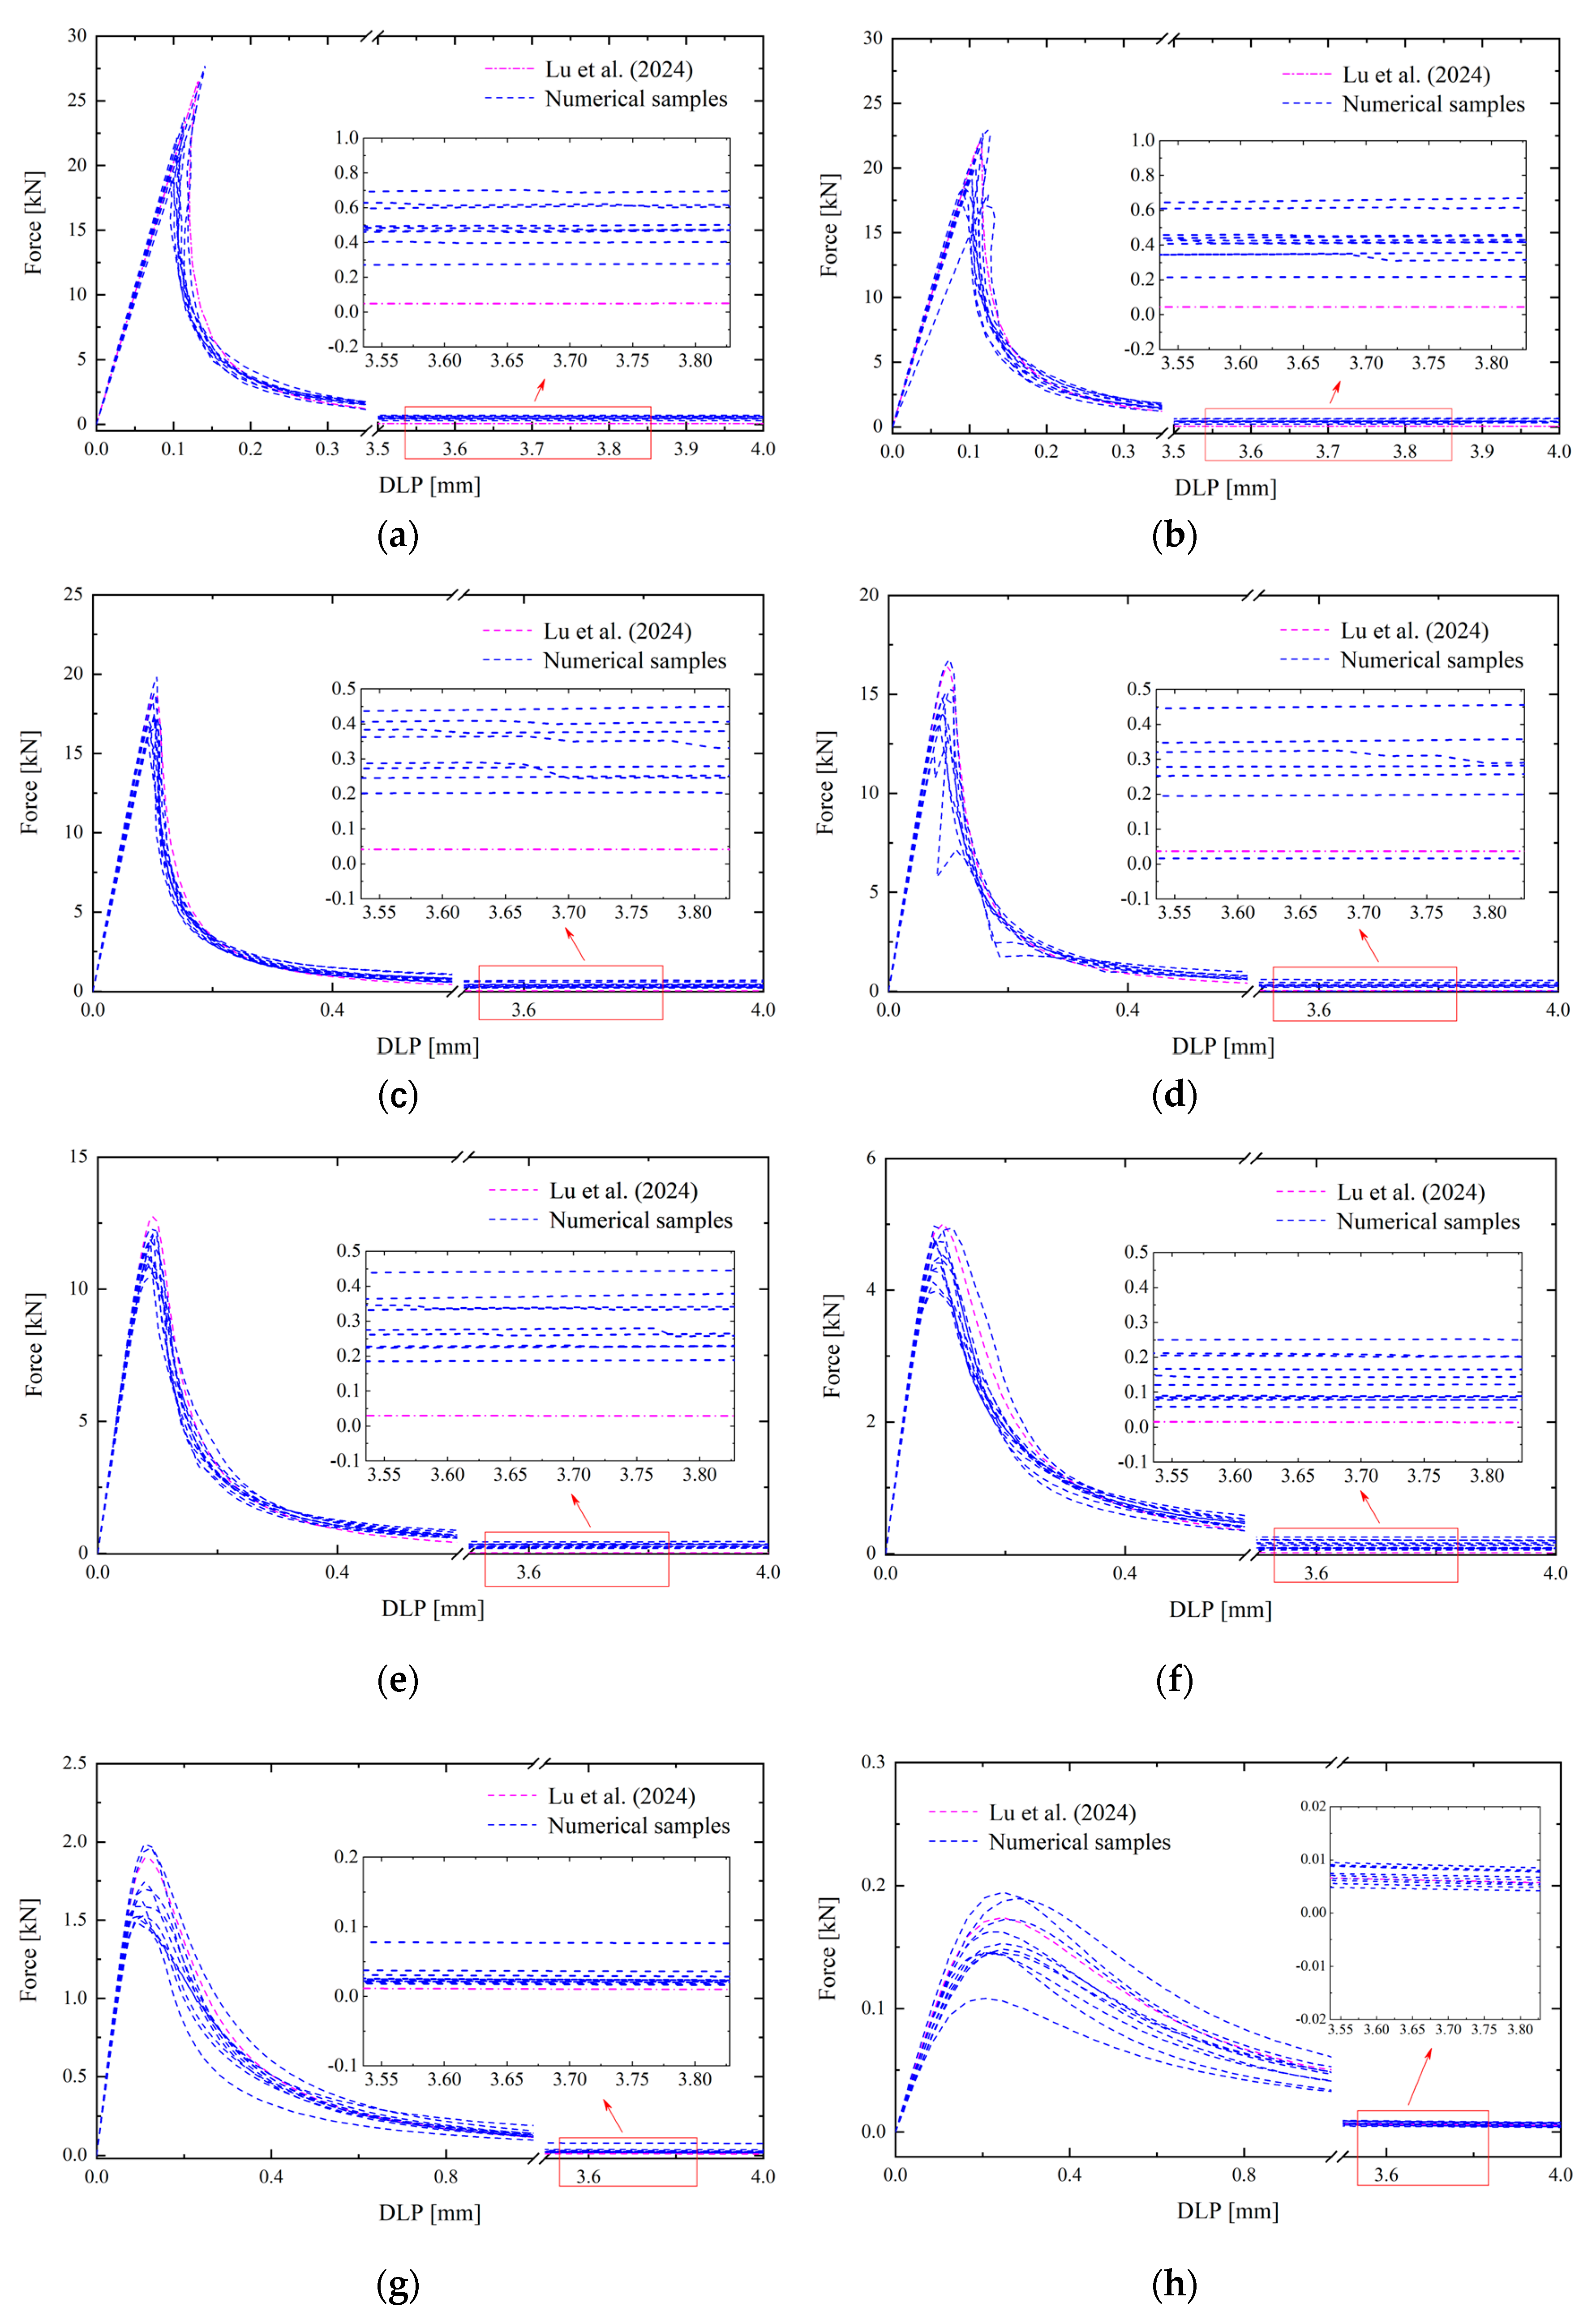
Figure 10.
Crack patterns obtained from stochastic NMMD model for different notch-to-depth cases: (a) ; (b); (c); (d); (e); (f); (g); (h).
Figure 10.
Crack patterns obtained from stochastic NMMD model for different notch-to-depth cases: (a) ; (b); (c); (d); (e); (f); (g); (h).
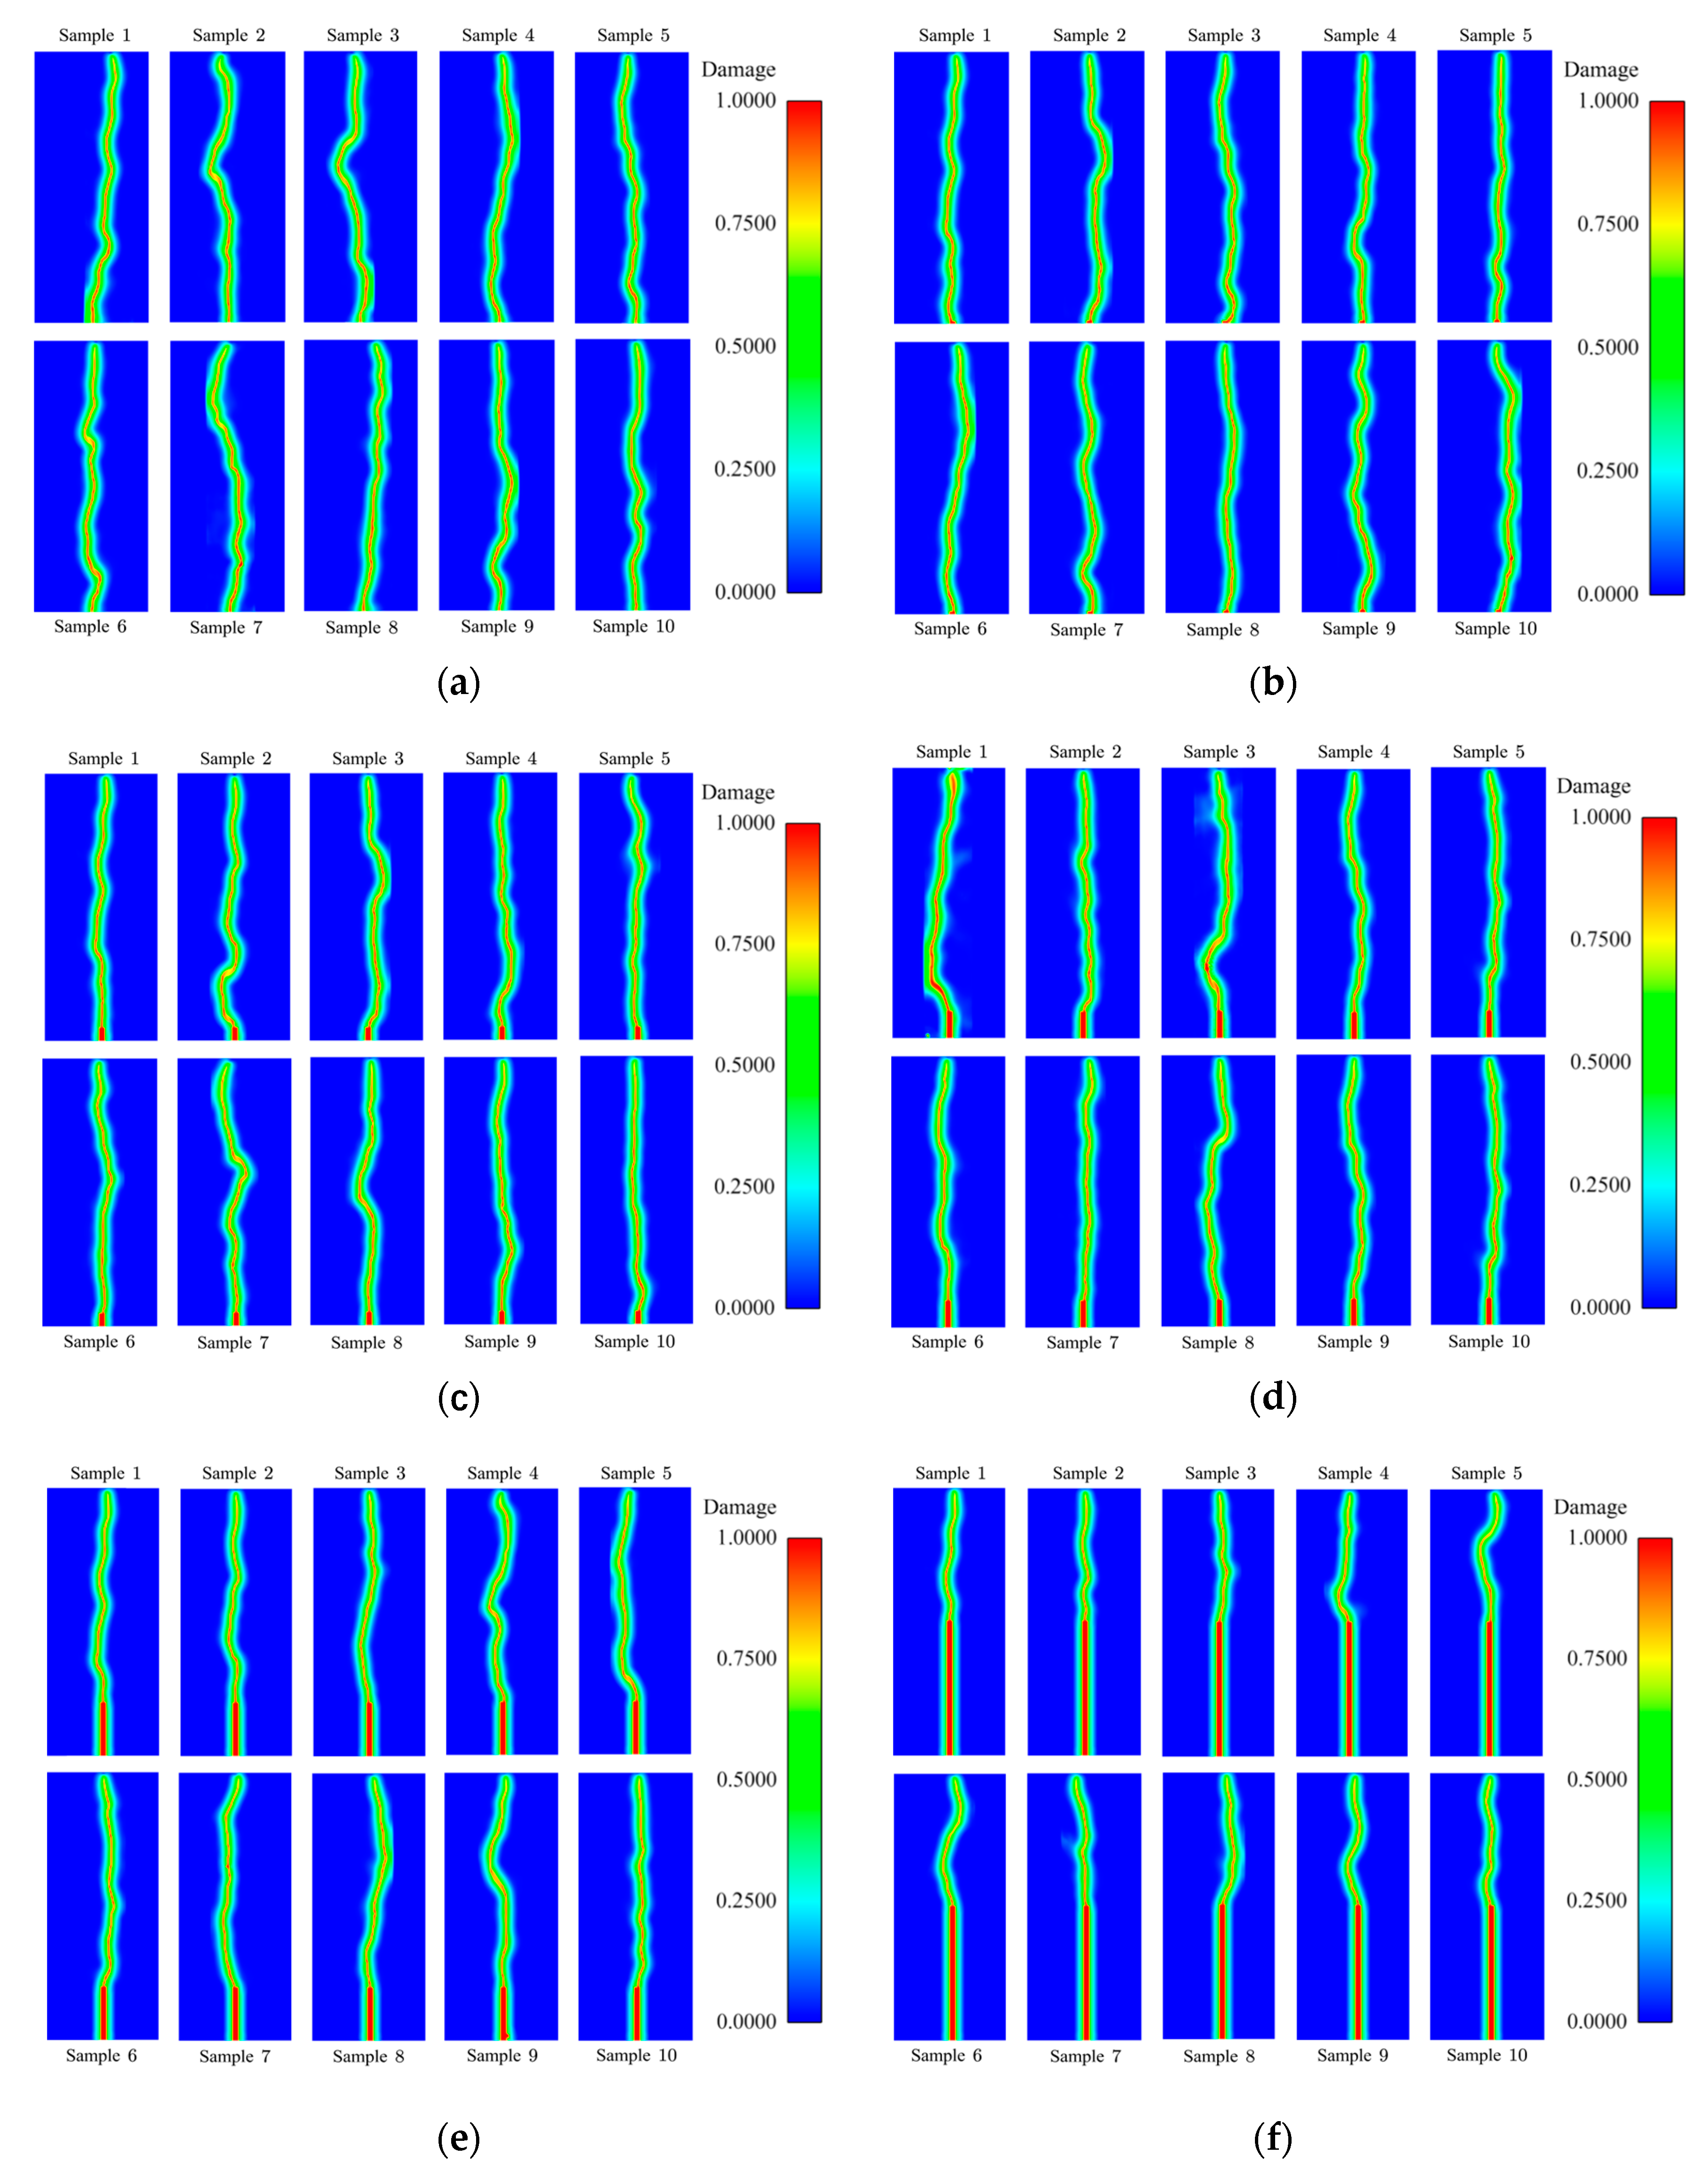
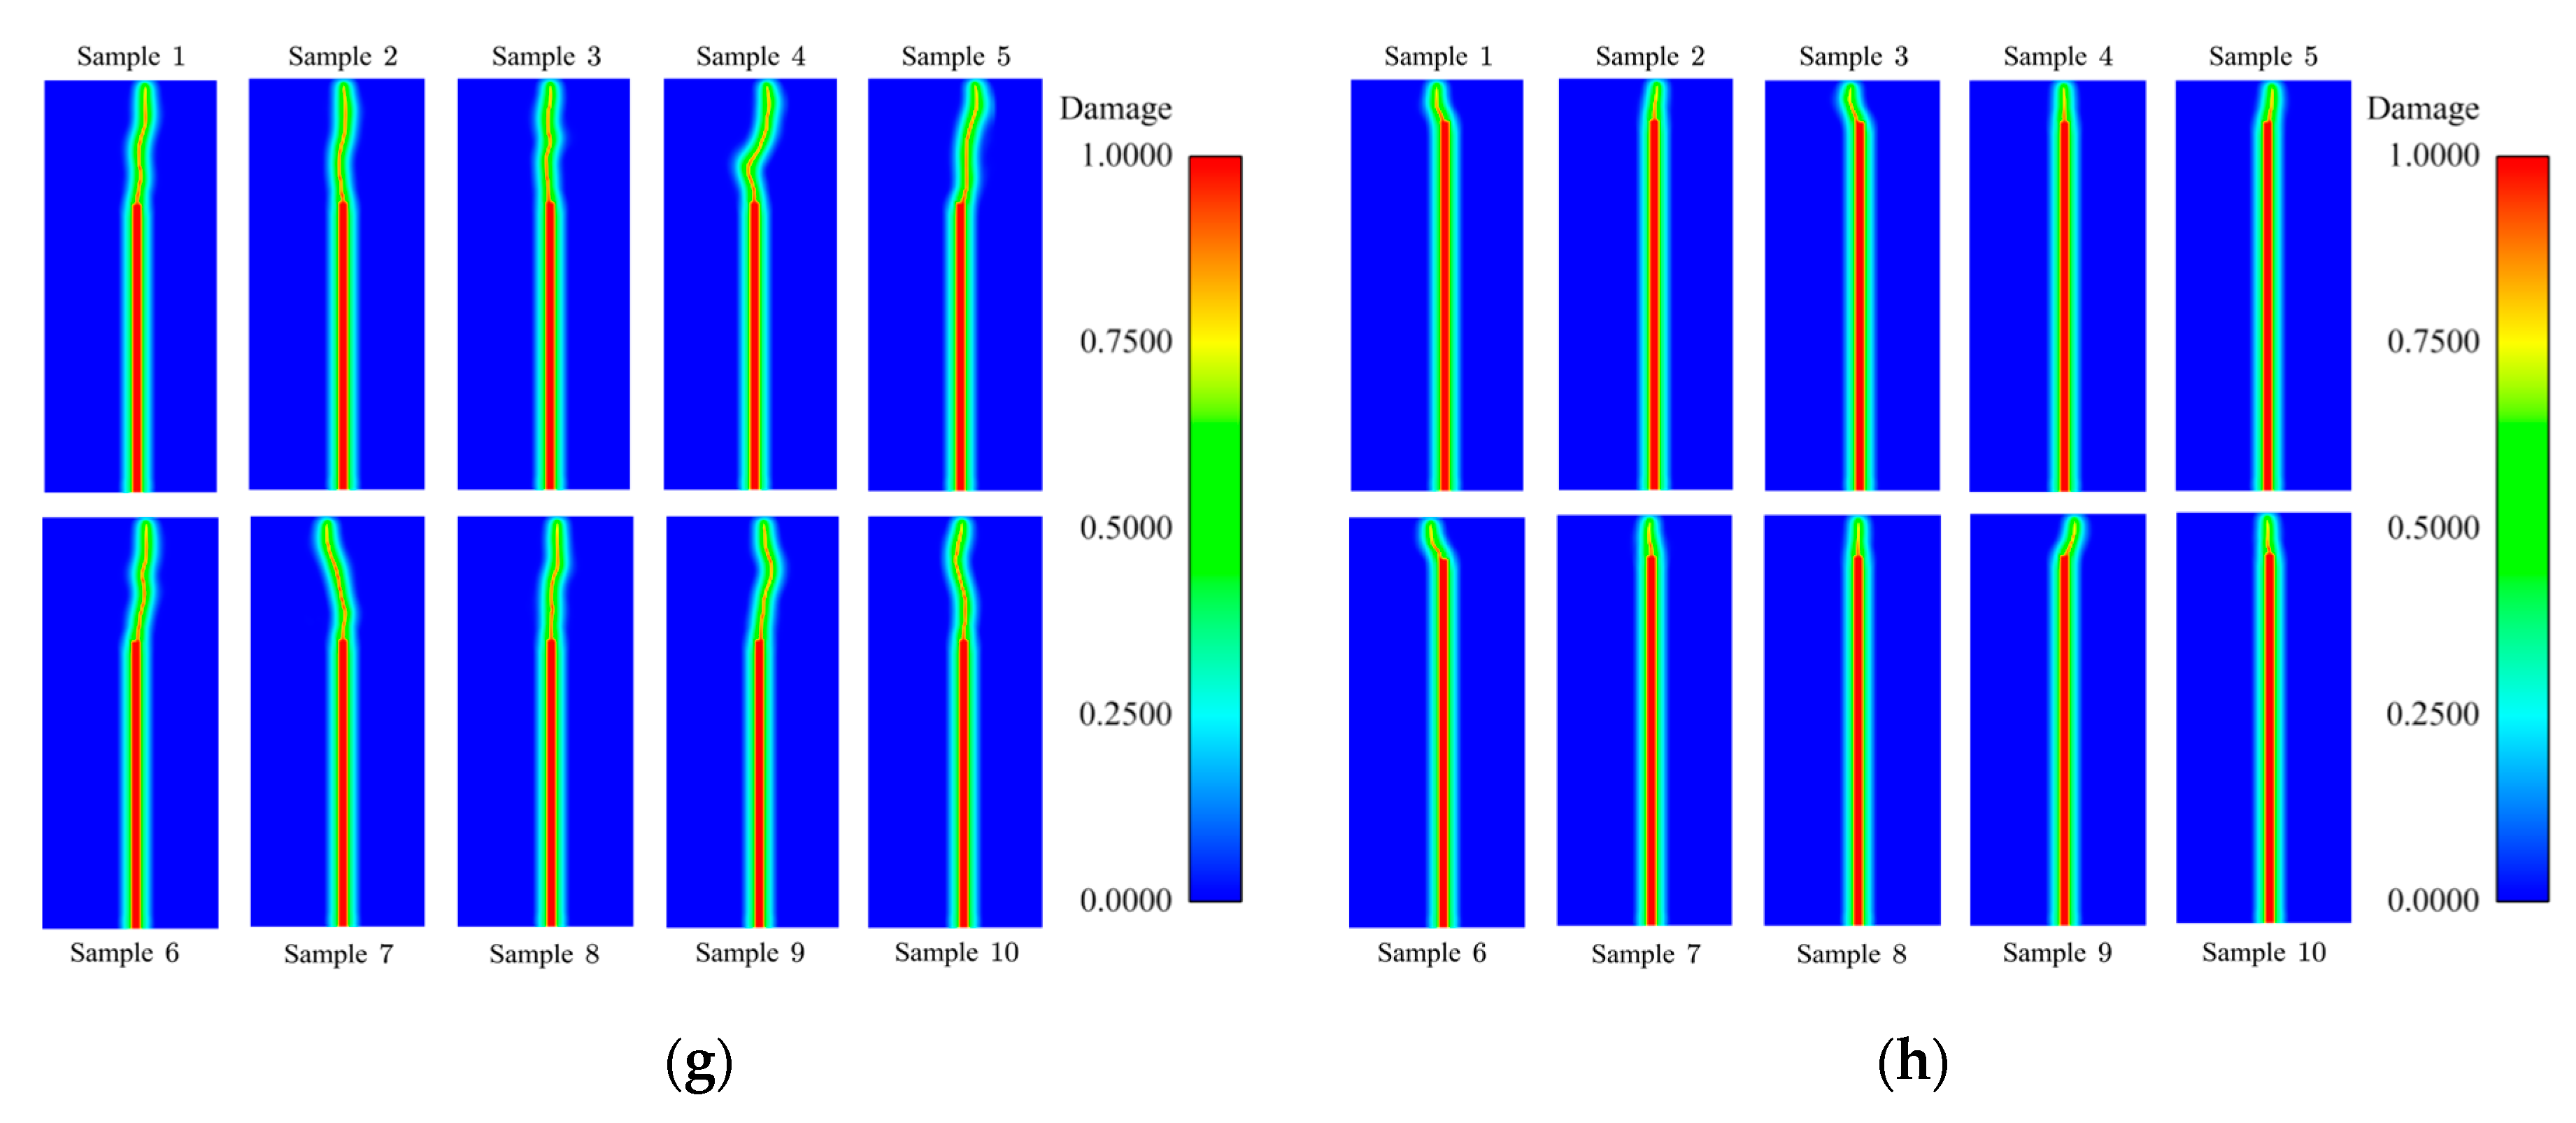
Figure 11.
Schematic diagram of fracture energy calculation.
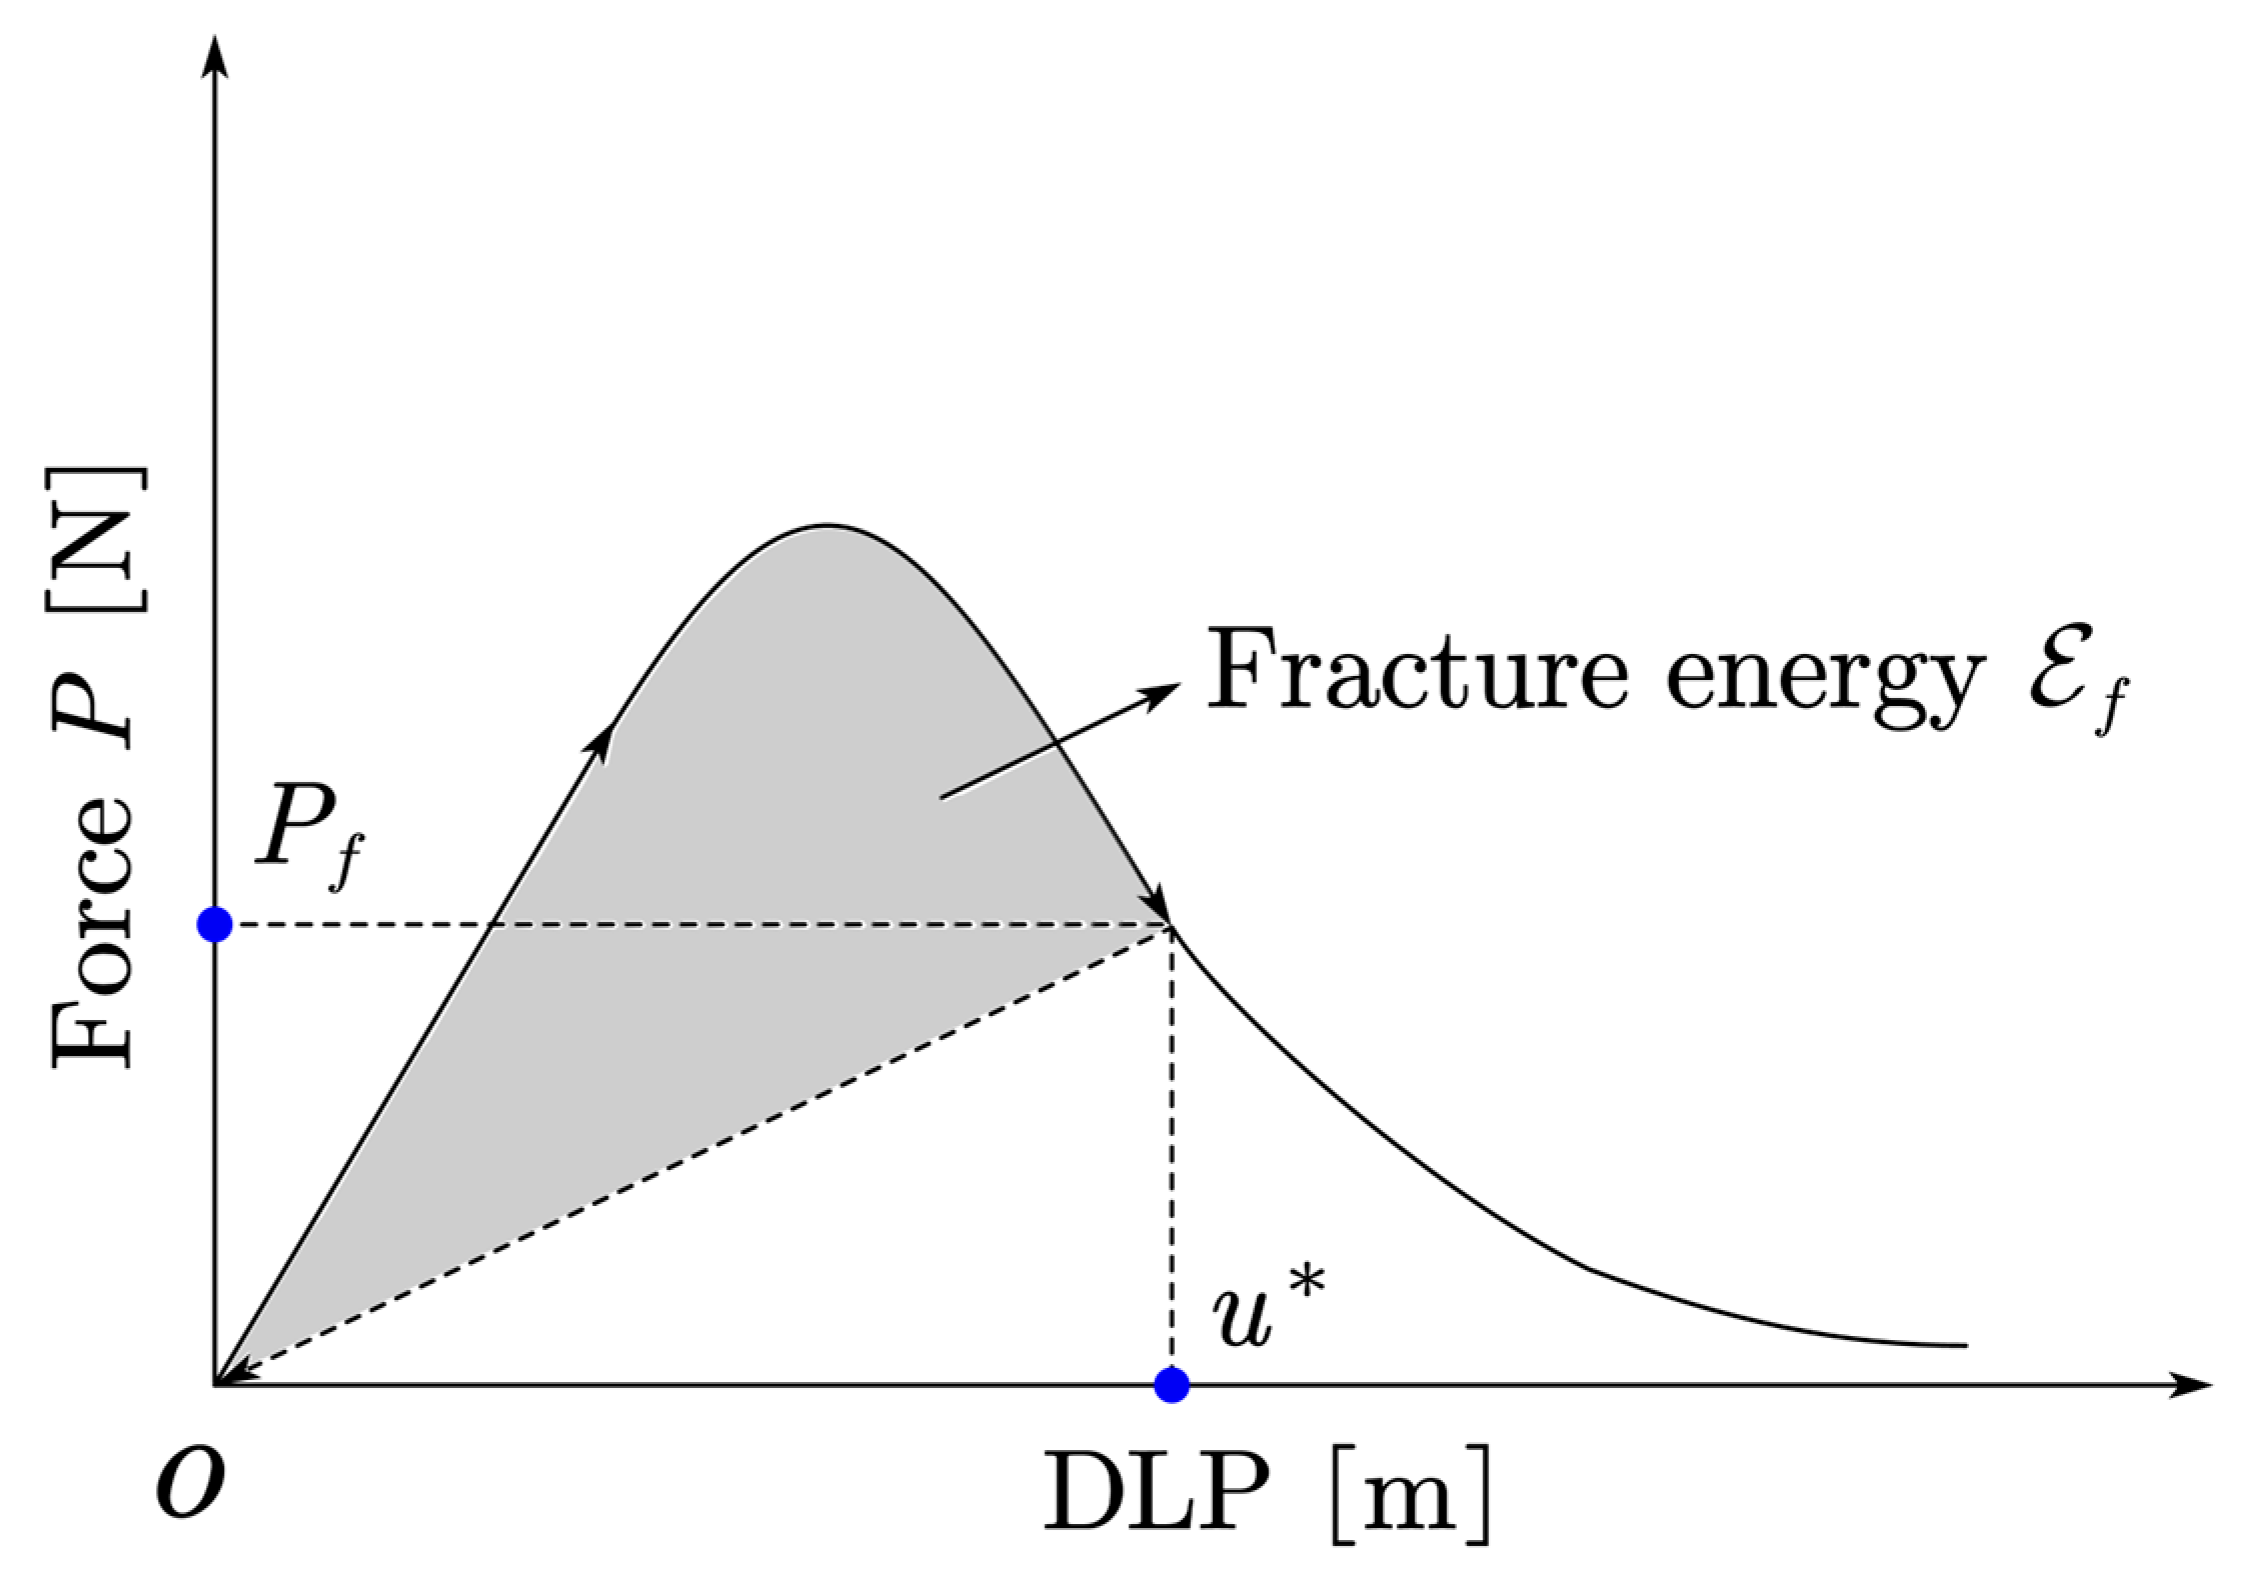
Figure 12.
Comparison of fracture energy obtained from the experiment, deterministic result and numerical and the proposed stochastic NMMD model.
Figure 12.
Comparison of fracture energy obtained from the experiment, deterministic result and numerical and the proposed stochastic NMMD model.


Table 1.
Mechanical parameters in the mean sense of concrete.
Disclaimer/Publisher’s Note: The statements, opinions and data contained in all publications are solely those of the individual author(s) and contributor(s) and not of MDPI and/or the editor(s). MDPI and/or the editor(s) disclaim responsibility for any injury to people or property resulting from any ideas, methods, instructions or products referred to in the content. |
© 2024 by the authors. Licensee MDPI, Basel, Switzerland. This article is an open access article distributed under the terms and conditions of the Creative Commons Attribution (CC BY) license (http://creativecommons.org/licenses/by/4.0/).
Copyright: This open access article is published under a Creative Commons CC BY 4.0 license, which permit the free download, distribution, and reuse, provided that the author and preprint are cited in any reuse.


