
Submitted:
13 November 2024
Posted:
14 November 2024
You are already at the latest version
Abstract
There is a critical need to understand and optimize the extrudability of AA6xxx alloys, which are widely used in industries due to their favorable combination of strength, formability, and corrosion resistance. Surface cracking during the extrusion process remains a significant challenge. While previous studies have investigated surface cracking using various techniques, the underlying mechanisms remain elusive, especially regarding the role of important alloying elements such as copper. This research provides a thorough investigation on the effect of copper additions on the solidus temperature, hot deformation behavior and extrudability of AA6xxx alloys using experimental and numerical methods. The material’s solidus temperature and constitutive behavior were determined. Extrusion trials were conducted for alloys with different Cu levels using a flat die over a range of extrusion speeds with the resulting surface defects being examined. The findings indicate that although the Cu content had little impact on the hot compression behavior, it did affect the solidus temperature. Alloys with a higher level of Cu had a lower solidus temperature and hence the maximum extrusion speed for a given temperature was lower. Numerical simulations demonstrated that surface cracking occurred once the surface temperature of the alloy reached 96% of the solidus temperature.
Keywords:
aluminum alloys
; hot deformation behavior
; Extrusion behavior
; Surface cracking
; Extrusion limit diagram
Introduction
The automotive industry is highly motivated to find ways to reduce vehicle weight to meet global emissions standards, while improving crashworthiness qualities [1]. AA6xxx alloys, with magnesium (Mg) and silicon (Si) as the main alloying elements, are extensively employed in various automotive components such as wheels, bumpers, suspension parts, and body parts [2,3]. This preference is due to their combination of high strength-to-weight ratio, good formability, and excellent corrosion resistance [3,4,5,6]. It has been reported that a 10% reduction in vehicle weight can lead to a 7% improvement in fuel economy [7], so the usage of aluminum in North American vehicles is expected to continue to rise, potentially reaching up to 540 pounds per vehicle by 2030 [8]. This increased adoption of aluminum for body-in-white structures will reduce vehicle weight and enhance fuel economy thereby diminishing greenhouse gas emissions [9].
Extrusion is a manufacturing process that is used for production of materials with a consistent cross-sectional profile. Approximately 80% of extruded aluminum parts are made from the 6xxx series [10]. Research has shown that incorporating copper (Cu) into AA6xxx alloys significantly enhances yield strength and ultimate tensile strength [3]. Research has also been conducted on the hot deformation behavior of AA6xxx alloys [11,12,13,14]. It has been found that the flow stress of the material is closely related to the detailed chemical composition and initial microstructure of the alloy, while also being very sensitive to the temperature and strain rate. The flow stress usually increases quickly with the increase of the strain and reaches a peak flow stress at a small strain.
For AA6xxx alloys, the flow stress stabilizes near the peak stress due to the high stacking fault energy of aluminum, which facilitates dislocation slip [15]. Xu et al. [16] studied the hot deformation behavior of Al-0.85Mg-1.0Si-0.44Cu, after DC casting, and homogenization at 560 °C for 4 hours followed by air cooling. The steady state flow stress increased as the deformation temperature decreased, and the strain rate increased. Yang et al. [17] studied the hot deformation behavior of 6A82 containing 0.46% Cu, where the material was homogenized at 560 °C for 6h followed by water quenching. The flow stress curves showed a steady state when the deformation temperature was higher than 460 °C. Wang et al. [18] studied the hot deformation behavior of AA6061(1.08Mg-1.06Si-0.34Cu) that was homogenized at 555 °C for 6h followed by air cooling. The true stress reaches a plateau following the rapid increase at the initial stage of the deformation. Despite many studies conducted on the hot flow stress of AA6xxx alloys, the effect of Cu as an alloying element on the hot flow stress behavior of the material has not been systematically investigated.
Extrudability refers to the ability to push a material through a die at high speed without defects. The extrudability of a material can be shown graphically using an extrusion limit diagram (ELD), which typically includes two limit lines: the pressure limit and the temperature limit. By examining these diagrams, engineers and researchers can determine the conditions under which a material can be successfully extruded without defects. The ELDs of many different types of materials have been developed. Clade and Sheppard [19] developed ELDs for AA6063, AA5456, and AA2014 at a ram speed of 14 mm/s in direct extrusion. Notably, AA6063 has a significantly larger extrusion process window relative to other Al alloys, which makes it a highly extrudable material. The author indicated that this is because AA5456 and AA2014 are heavily alloyed and resulting in the presence of many different low melting phases. In addition, ELDs were developed for other materials. For example, Kim et al. [20] investigated the effect of scandium (Sc) additions on the hot extrudability of AA7075. Sun et al. [21] constructed an ELD for the superalloy Inconel 690 with a high nickel content, based on hot processing map. Bai et al. [22] constructed the ELD for magnesium alloy using an artificial neural network method. Lapovok [23] built the ELD for AZ31 by FE simulations and the extrusion speeds and ratios were qualified as a function of the initial billet temperature. Barnett et al. [24] built the ELDs of Mg-Al-Zn alloys using the empirical models. Wang et al. [25] developed the ELDs for AZ31 and AM30 by using their flow stress data.
The literature reveals that despite many ELD’s being developed, there is limited literature on the ELD of AA6xxx, specially regarding the role of copper additions. Consequently, this study focuses on the influence of Cu content on hot deformation behavior and extrudability of a high strength AA6xxx alloy. Numerical simulations were used to facilitate construction of the extrusion limit diagram, to characterize the extrusion behavior as a function of Cu content.
Materials and Methods
Starting Material
High strength AA6xxx alloys (based on AA6082) with Cu additions of 0, 0.3, 0.6 and 0.9 wt. % were used in this study with the chemical composition presented in Table 1. Extrusion billets with a length of 200 mm and a diameter of 101.6 mm were cast using a direct chill (DC) method. The billets were then homogenized at 550 °C for 2 hours to obtain a uniform distribution of particles, such as Mg2Si, Cu containing Q phase, Al2Cu, and Al(FeMn)Si [26] in the microstructure. Figure 1 presents the microstructure of the 0.6 wt. % Cu material. After homogenization, the number of particles decrease due to the dissolution of Si eutectics, Mg2Si and Cu containing phases, while the Fe containing constituent particles usually transform from a plate shape into a more rounded shape[26,27].
DSC and Hot Compression Tests
Differential scanning calorimetry (DSC) tests were performed on all four materials in the as cast and homogenized conditions to obtain the solidus temperatures. The tests were conducted using a NETZSCHTM DSC 404C Pegasus thermal analyzer. The equipment chamber contained two crucibles: one for the sample and another for the reference sample. In this study, the empty crucible served as the reference. Prior to the measurements, the machine was calibrated using a high-purity Indium.
During the extrusion process the material experiences a large strain in a short period of time, which means the material deforms at strain rate that can reach as high 100-200/s. Hot compression tests were conducted to examine the hot deformation behavior. Low strain rate hot compression tests were performed at strain rates of 0.1/s, 1/s and 10/s and at deformation temperatures of 450 °C, 500 °C, and 550 °C, respectively using the GleebleTM 3500 thermal-mechanical testing machine. High strain rate tests at 50/s and 100/s were performed on the cam plastometer at the University of Tokyo at a deformation temperature of 550 °C.
Extrusion Trials
The homogenized billets of the 0.6Cu and 0.9Cu materials were extruded into round bars with a diameter of 25 mm. Referring to Figure 2a shows a cross-sectional view of the extrusion process, whereas the Figure 2b shows details of the die bearing geometry. The die had a 25mm long flat bearing and a feeder pocket (100 mm in diameter x 25mm in depth) was used to permit continuous extrusion. Table 2 summarizes the extrusion trials which were run for each alloy. In all cases, the initial billet temperature was set to 500 °C, and the tooling temperature including container and die was set to 480 °C. The surface morphology of the extruded samples was analyzed using ZeissTM Leo 1530 UltraPlus FESEMs.
Numerical Modelling
The commercial software package DEFORMTM 2D was used to simulate the extrusion process. Figure 2 schematically illustrates the setup and mesh configuration of the tooling, including ram, die, feeder, container, and billet. Due to the axisymmetric nature of the round bar, only half of it is modeled. The tooling is defined as rigid, while the billet is assumed to be a rigid-viscoelastic material. The billet has a finer mesh at the die corner due to the severe deformation in that area and a minimum mesh size of 0.25 mm was utilized for the region near the die corner.
For the AA6xxx material, published thermal physical properties for AA6082 were used. The AA6082 material studied by Mahmoodkani [28] had a similar chemical composition to the current material except for the addition of Cu. This assumption was considered reasonable as experiments have shown that while Cu does have some effect on thermal conductivity in aluminum alloys the effect in solid solution is somewhat minor [29]. A friction coefficient of 0.3 between the die bearing and the material was applied based on Ref. [30]. The Sellars-Tegart constitutive model [31] was used in this work, as shown in equation (1). The values of the material constants in the model were obtained by fitting the model to the measured stress-strain curves from hot compression tests done in this research.
σ=1/α * ln[(Z/A) ^ (1/n) + ((Z/A) ^ (2/n) + 1) ^ (1/2)]
Results and Discussion
DSC Test
By examining the measured DSC traces for each alloy, the solidus temperatures were identified and are summarized in Table 3. The effect of Cu content on the solidus temperature is shown in Figure 3 for both the as cast and homogenized materials. The results show that as the Cu content increases from 0 to 0.9, the solidus temperatures of the as cast material decrease from 598 °C to 581 °C, and the solidus temperatures of the homogenized material decrease from 602 °C to 583 °C. The solidus temperature of the homogenization material is lower than the as-cast material due to the removal of micro segregation and the dissolution and redistribution of secondary phases which delays melting to higher temperatures [26].
Hot Compression Testing
Figure 4(a) shows the steady state flow stress as a function of deformation temperature in the range 450 °C - 550 °C for the 0.3Cu material for strain rates from 0.1-89/s. Figure 4b,c show corresponding plots for the 0.6Cu and 0.9Cu materials respectively. Comparison of the flow stress response of the 3 materials for similar deformation conditions shows that the differences are relatively minor. Taking the flow stress data at 500 °C as an example, at strain rates of 0.1, 1, and 10/s, the variations in steady state flow stress between the 0.3Cu and 0.9Cu materials are less than 6%. Therefore, a constitutive model specifically for the 0.6Cu material was developed and utilized to represent all three materials in this study.
Using the measured data, the parameters required in the Sellars-Tegart model were determined and these values are summarized in Table 4. Figure 5 shows the model-predicted values of flow stress as compared to the measured data for the three copper contents and also includes data from the literature for an AA6082 without a Cu addition [32]. Referring to Figure 5, the differences between the model predicted flow stress and the measured flow stress are within ± 10% range and confirms that the addition of Cu has a minimal effect on the hot flow stress.
Extrudate Characterization
Figure 6 shows the surface morphology of extrudates with different Cu contents. Figure a,b, illustrate surfaces produced at a ram speed of 20mm/s for the 0.6Cu and 0.9Cu materials respectively. Small micro-sized cracks are apparent for the 0.6Cu material in Figure 6a, with the cracks located along the boundaries of individual grains, as shown at higher magnification in Figure 6c. In contrast, the extrudates generated by the 0.9Cu material using the same die and extrusion speed in Figure 6b exhibited significantly larger surface cracks when compared to the 0.6Cu extrudates. The cracks were again predominantly concentrated along the grain boundaries as evidenced by Figure 6d. The addition of Cu lowers the solidus temperature of the material, consistent with previous literature [33,34] and which was also observed in the DSC tests conducted in this work. The 0.6Cu material had a solidus temperature of around 590 °C while the 0.9Cu alloy had a significantly lower solidus temperature of 583 °C. For the same extrusion speed, both materials reached the same exit temperature during the extrusion process due to the same constitutive model and thermal physical properties being used. However, a larger portion of the grain boundaries melted with the higher copper content indicating the reduced solidus temperature can promote surface cracks earlier under similar extrusion conditions.
Grains are individual crystals within the material, and their boundaries represent areas where the crystal structure’s orientation changes. Grain boundary is the interface between two grains in a polycrystalline material. Upon heating grain boundaries can exhibit significant disorder, which, in the most extreme cases, may lead to the formation of nanometer-scale intergranular films with liquid-like properties [35]. Hsieh et al. [36] found that the high angle grain boundary became disordered as temperature increasing, and the complete grain boundary melting occurs abruptly at melting point in polycrystalline Al specimens. F. Weinburg and E. Teghtsoonian [37] found that for aluminum bi-crystals grain boundary melting was observed after the melting point of the bulk material was reached at the high angle grain boundaries. The high-angle grain boundaries were relatively more disordered than that of the low-angle grain boundary. Both papers observed that the high angle grain boundary became disordered as temperature increasing before the grain boundary completely melted at the material’s melting point in pure Al.
The gradual disordering of the grain boundary at temperature lower than the bulk material’s melting point is referred as grain boundary pre-melting and this phenomenon can weaken the mechanical strength of the material [35,36]. Rad et al. [35] mentioned that grain boundary pre-melting is governed by a disjoining potential, which describes the energy difference between the atomic structure in the liquid-like layer and the one in the bulk. The grain boundary pre-melting took place when the dry grain boundary free energy exceeds twice the free energy of the solid-liquid interface. Grain boundary pre-melting weakens the atomic forces, making cracks more likely to form at the grain boundary when the material is subjected to force during the extrusion process. In addition, the effect of segregation of alloy additions or impurity in the material to the grain boundary in complex alloys also affect the melting point of the material in the grain boundary region [37].
Given this and the uncertainty in measuring the solidus temperature, current results showing the onset of cracking slightly below the melting point appears reasonable.
Numerical Modelling
Stress and Temperature Analysis
Figure 7 illustrates the predicted temperature and stress patterns process for an extrusion speed of 20 mm/s. Figure 7a,b display contour maps showing the temperature and stress distribution, respectively. Notably, the die entry exhibits the highest values for both temperature and stress. Moving away from the die entry radially into the bulk of the extrusion, a discernible decrease in both temperature and stress is evident. The temperature and stress both tend to decrease along the die bearing as the surface material approaches the die exit. Figure 7c illustrates this effect showing the temperature and stress distributions along the die bearing, revealing a consistent decrease in both parameters with increasing distance from the die entry. Conversely, the material on the billet surface, which is in contact with the die, experiences elevated temperature and stress levels due to frictional forces. Given that the material undergoes the highest temperature and stress at the die entry, and the extrudate surface continues to interact with the die bearing, the numerical modeling analysis has been focused on the stress and temperature distribution at the die entry and along the die bearing.
Figure 8 shows the model predictions of the surface temperature and stress distribution (σZ) at the die corner for each extrusion trial. For each extrusion speed, the temperature and σZ values at the front, middle, and back of the extrusion were extracted through post-processing of the simulation results. The error bar of the stress distribution was determined by taking the stress values from a few consecutive simulation steps at a certain stroke. The model-predicted surface temperature was converted into a fraction of the solidus temperature (Fs) so that the two materials could be compared more easily, and the surface cracking behavior better understood. Fs is defined as the ratio of the temperature of the material to its melting point and in this case the measured solidus temperature was used as the melting point. In addition, the results from the SEM observations of surface cracking are captured in Figure 8 as the symbol color; green indicating no cracking, orange representing micro-cracking seen in the SEM but not visible to the naked eye and red indicating visible cracking.
Figure 8 shows that the predicted material surface stress at the die corner is essentially the same for both materials over the experimental extrusion speeds but does decrease very slightly as the surface temperature increases for both materials. The results also show that as the surface temperature increases beyond approximately 0.96 of the solidus temperature (0.96Fs), which is 566°C for 0.6Cu and 560°C for 0.9Cu, surface cracks start to appear and become more pronounced as the surface temperature continues to increase. The extrudates show surface cracks at a higher extrusion speed in the extrusion trial. Referring to Figure 8, the extrusion speed does not impact the model-predicted stress because when the extrusion speed increases, the stress decreases due to the rise in temperature [38]. Therefore, it is reasonable to use temperature as a criterion to construct the extrusion limit diagram for the materials.
Extrusion Limit Diagram
The extrusion limit diagram (ELD) graphically defines a workable area for an extrusion process. The experimentally validated numerical model was used to construct the extrusion limit diagram to reveal the effect of Cu content on the ELD. Figure 9 shows the model predicted temperature limit lines which were determined numerically based on the combination of extrusion speed and initial billet temperature that resulted in a predicted surface temperatures of the material at the die corner. The green and yellow lines represent die corner surface temperatures 0.96Fs, 0.98Fs respectively, whereas the red line represents conditions where the surface temperature reached the solidus of the material. Overlaid on this graph are data points (“x”) representing experimental observations of surface cracking at the back of the extrudate. It can be observed from the two figures that for both materials when the surface temperature of the extrusion falls between the solidus and 0.98Fs lines, visible cracks appear on the surface of the extrudate (shown as red data points in Figure 9). When the surface temperature of the extrudate falls between the 0.98Fs line and the 0.96Fs line, micro cracks are observed on the surface of the extrudate (shown as orange data points in Figure 9). It is also observed that when the surface temperature of the extrudate is below the 0.96Fs for the 0.9Cu material, no surface cracks, either visible or on the micro scale were observed.
Figure 10 shows the effect of Cu additions to the AA6082 based composition, on the model-predicted ELD. The temperature limit lines shown in these ELDs were produced for each alloy by considering the combination of extrusion speed and initial billet temperature that would result in a surface temperature of 0.96Fs for each alloy. Referring to Figure 10, the progressive increase in Cu content within the AA6xxx alloy results in a reduction of the available extrusion workspace due to a decrease in solidus temperature. It is worth noting that this is just one part of a traditional ELD. The other part depends on the pressure of the extrusion press for a certain die geometry.
Conclusions
This research examined the impact of Cu additions up to 0.9 wt. % on the extrudability of high-strength AA6xxx alloys using an AA6082 base material. The following specific conclusions can be drawn from this study:
- Under the conditions studied, Cu content in the range 0 – 0.9 wt. % appeared to have minimal impact on the hot compression flow stress.
- When the surface temperature reached 0.96Fs at the die entry corner, cracks appeared on the extrudate.
- Extrusion trials using an AA6082 base alloy with different Cu levels showed that materials with higher Cu levels exhibited surface cracking at lower extrusion speeds. This can be linked to the surface temperature of the material reaching 0.96Fs.
- The progressive addition of Cu up to 0.9 wt. % reduces the extrusion limit diagram (ELD) operating area due to a decrease in the solidus temperature.
Author Contributions
Conceptualization, X.W.; methodology, X.W.; software, X.W.; validation, X.W.; formal analysis, X.W.; investigation, X.W. and N.P.; resources, N.P. and M.W.; data curation, X.W.; writing—original draft preparation, X.W. and M.K.; writing—review and editing, all authors; visualization, X.W.; supervision, M.W.; project administration, W.P. and N.P.; funding acquisition, W.P. All authors have read and agreed to the published version of the manuscript.
Funding
This research was funded by NSERC (Natural Sciences and Engineering Research Council of Canada) (Grant numbers CRDPJ 520748).
Institutional Review Board Statement
Not applicable.
Informed Consent Statement
Not applicable
Data Availability Statement
The data presented in this study are available on request from the corresponding author. The data are not publicly available due to their extremely large size
Acknowledgments
The author extends appreciation to NSERC for funding this research work.
Conflicts of Interest
The authors declare no conflicts of interest.
References
- W. Wellbrock, D. Ludin, L. Röhrle, W. Gerstlberger, Sustainability in the automotive industry, importance of and impact on automobile interior – insights from an empirical survey, International Journal of Corporate Social Responsibility 5 (2020) 10. [CrossRef]
- S. Yuan, L. Chen, J. Tang, G. Zhao, C. Zhang, J. Yu, Correlation between homogenization treatment and subsequent hot extrusion of Al–Mg–Si alloy, J Mater Sci 54 (2019) 9843–9856. [CrossRef]
- Prantik Mukhopadhyay, Alloy Designation, Processing, and Use of AA6XXX Series Aluminium Alloys, ISRN Metallurgy 2012 (2012) e165082. [CrossRef]
- I.N. Fridlyander, V.G. Sister, O.E. Grushko, V.V. Berstenev, L.M. Sheveleva, L.A. Ivanova, Aluminum Alloys: Promising Materials in the Automotive Industry, Metal Science and Heat Treatment 44 (2002) 365–370. [CrossRef]
- J. Hirsch, B. Skrotzki, G. Gottstein, Aluminium Alloys: The Physical and Mechanical Properties, John Wiley & Sons, 2008.
- Aluminium applications – Transport, (n.d.). https://www.aluminiumleader.com/application/transport/ (accessed October 31, 2022).
- Aluminum Continues Unprecedented Growth in Automotive Applications, Light Metal Age Magazine (2020). https://www.lightmetalage.com/news/industry-news/automotive/aluminum-continues-unprecedented-growth-in-automotive-applications/ (accessed July 31, 2023).
- 2015 North American Light Vehicle Aluminum Content Study.pdf, (n.d.).
- M.T. Islam, A.B. Abdullah, A.I. Hussin, M.F. Jamaludin, Weight Reduction Strategies in Passenger Car Manufacturing: Current Trends and Prospects, in: Springback Assessment and Compensation of Tailor Welded Blanks, CRC Press, 2022.
- G. Al-Marahleh, Effect of heat treatment on the distribution and volume fraction of Mg2Si in structural aluminum alloy 6063, Met Sci Heat Treat 48 (2006) 205–209. [CrossRef]
- C. Zhang, C. Wang, R. Guo, G. Zhao, L. Chen, W. Sun, X. Wang, Investigation of dynamic recrystallization and modeling of microstructure evolution of an Al-Mg-Si aluminum alloy during high-temperature deformation, Journal of Alloys and Compounds 773 (2019) 59–70. [CrossRef]
- H. Liao, Y. Wu, K. Zhou, J. Yang, Hot deformation behavior and processing map of Al–Si–Mg alloys containing different amount of silicon based on Gleebe-3500 hot compression simulation, Materials & Design (1980-2015) 65 (2015) 1091–1099. [CrossRef]
- I. Schindler, P. Kawulok, V. Očenášek, P. Opěla, R. Kawulok, S. Rusz, Flow Stress and Hot Deformation Activation Energy of 6082 Aluminium Alloy Influenced by Initial Structural State, Metals 9 (2019) 1248. [CrossRef]
- S. Liu, Q. Pan, H. Li, Z. Huang, K. Li, X. He, X. Li, Characterization of hot deformation behavior and constitutive modeling of Al–Mg–Si–Mn–Cr alloy, J Mater Sci 54 (2019) 4366–4383. [CrossRef]
- M. Muzyk, Z. Pakieła, K.J. Kurzydłowski, Generalized Stacking Fault Energies of Aluminum Alloys–Density Functional Theory Calculations, Metals 8 (2018) 823. [CrossRef]
- Y. Xu, H. Nagaumi, Y. Han, G. Zhang, T. Zhai, The Deformation Behavior and Microstructure Evolution of a Mn- and Cr-Containing Al-Mg-Si-Cu Alloy During Hot Compression and Subsequent Heat Treatment, Metall Mater Trans A 48 (2017) 1355–1365. [CrossRef]
- Q. Yang, D. Yang, Z. Zhang, L. Cao, X. Wu, G. Huang, Q. Liu, Flow behavior and microstructure evolution of 6A82 aluminium alloy with high copper content during hot compression deformation at elevated temperatures, Transactions of Nonferrous Metals Society of China 26 (2016) 649–657. [CrossRef]
- X. Wang, J. Qin, H. Nagaumi, R. Wu, Q. Li, The Effect of α-Al(MnCr)Si Dispersoids on Activation Energy and Workability of Al-Mg-Si-Cu Alloys during Hot Deformation, Advances in Materials Science and Engineering 2020 (2020) e3471410. [CrossRef]
- M.P. Clade, T. Sheppard, Extrusion limit diagrams containing structural and topological information for AA 6063 aluminium alloy, Materials Science and Technology 9 (1993) 313–318. [CrossRef]
- J.H. Kim, J.T. Yeom, J.K. Hong, S.Y. Shim, S.G. Lim, N.K. Park, Effect of scandium on the hot extrudability of 7075 aluminum alloy, Met. Mater. Int. 16 (2010) 669–677. [CrossRef]
- C. Sun, Y. Xiang, G. Liu, X. Zuo, M. Wang, Q. Zhang, Extrusion limit diagram of IN 690 super-alloy tube based on hot processing map, Int J Adv Manuf Technol 89 (2017) 3419–3428. [CrossRef]
- S. Bai, G. Fang, J. Zhou, Construction of three-dimensional extrusion limit diagram for magnesium alloy using artificial neural network and its validation, Journal of Materials Processing Technology 275 (2020) 116361. [CrossRef]
- R.Y. Lapovok, M.R. Barnett, C.H.J. Davies, Construction of extrusion limit diagram for AZ31 magnesium alloy by FE simulation, Journal of Materials Processing Technology 146 (2004) 408–414. [CrossRef]
- M. Barnett, J. Yao, C. Davies, Extrusion limits for AZ alloys with Al contents <3%, Deakin University, 2003. https://dro.deakin.edu.au/articles/conference_contribution/Extrusion_limits_for_AZ_alloys_with_Al_contents_3_/20545275/1 (accessed November 2, 2022).
- Y.X. Wang, X.Q. Zeng, W.J. Ding, A.A. Luo, A.K. Sachdev, Development and Validation of Extrusion Limit Diagram for AZ31 and AM30 Magnesium Alloys, MSF 546–549 (2007) 327–332. [CrossRef]
- A. Woźnicki, B. Leszczyńska-Madej, G. Włoch, J. Madura, M. Bogusz, D. Leśniak, Homogenization of Extrusion Billets of a Novel Al-Mg-Si-Cu Alloy with Increased Copper Content, Materials 16 (2023) 2091. [CrossRef]
- L.E.B. Dæhli, S.N. Olufsen, T.A. Kristensen, T. Børvik, O.S. Hopperstad, Influence of constituent particles on fracture of aluminum alloys under high-triaxiality loading, Materials Science and Engineering: A 864 (2023) 144531. [CrossRef]
- Y. Mahmoodkhani, J. Chen, M.A. Wells, W.J. Poole, N.C. Parson, The Effect of Die Bearing Geometry on Surface Recrystallization During Extrusion of an Al-Mg-Si-Mn Alloy, Metall Mater Trans A 50 (2019) 5324–5335. [CrossRef]
- A. Zhang, Y. Li, Thermal Conductivity of Aluminum Alloys—A Review, Materials 16 (2023) 2972. [CrossRef]
- X. Wang, Effect of Cu and die geometry on the extrudability of AA6xxx Alloys, (n.d.).
- K.E. Tello, A.P. Gerlich, P.F. Mendez, Constants for hot deformation constitutive models for recent experimental data, Science and Technology of Welding and Joining 15 (2010) 260–266. [CrossRef]
- C. Liu, Microstructure evolution during homogenization and its effect on the high temperature deformation behaviour in AA6082 based alloys, University of British Columbia, 2017. [CrossRef]
- S.Y. Chang, L.C. Tsao, T.Y. Li, T.H. Chuang, Joining 6061 aluminum alloy with Al–Si–Cu filler metals, Journal of Alloys and Compounds 488 (2009) 174–180. [CrossRef]
- H.-M. Helwig, F. Garcia-Moreno, J. Banhart, A study of Mg and Cu additions on the foaming behaviour of Al–Si alloys, J Mater Sci 46 (2011) 5227–5236. [CrossRef]
- M. Torabi Rad, G. Boussinot, M. Apel, Dynamics of grain boundary premelting, Sci Rep 10 (2020) 21074. [CrossRef]
- T.E. Hsieh, R.W. Balluffi, Experimental study of grain boundary melting in aluminum, Acta Metallurgica 37 (1989) 1637–1644. [CrossRef]
- F. Weinberg, E. Teghtsoonian, Grain-boundary melting, Acta Metallurgica 5 (1957) 455–464. [CrossRef]
- I. Flitta, T. Sheppard, Effect of pressure and temperature variations on FEM prediction of deformation during extrusion, Materials Science and Technology 21 (2005) 339–346. [CrossRef]
Figure 1.
Optical microstructures of the 0.6Cu material in the (a) as cast and (b) as homogenized conditions by anodizing using Barker’s reagent.
Figure 1.
Optical microstructures of the 0.6Cu material in the (a) as cast and (b) as homogenized conditions by anodizing using Barker’s reagent.
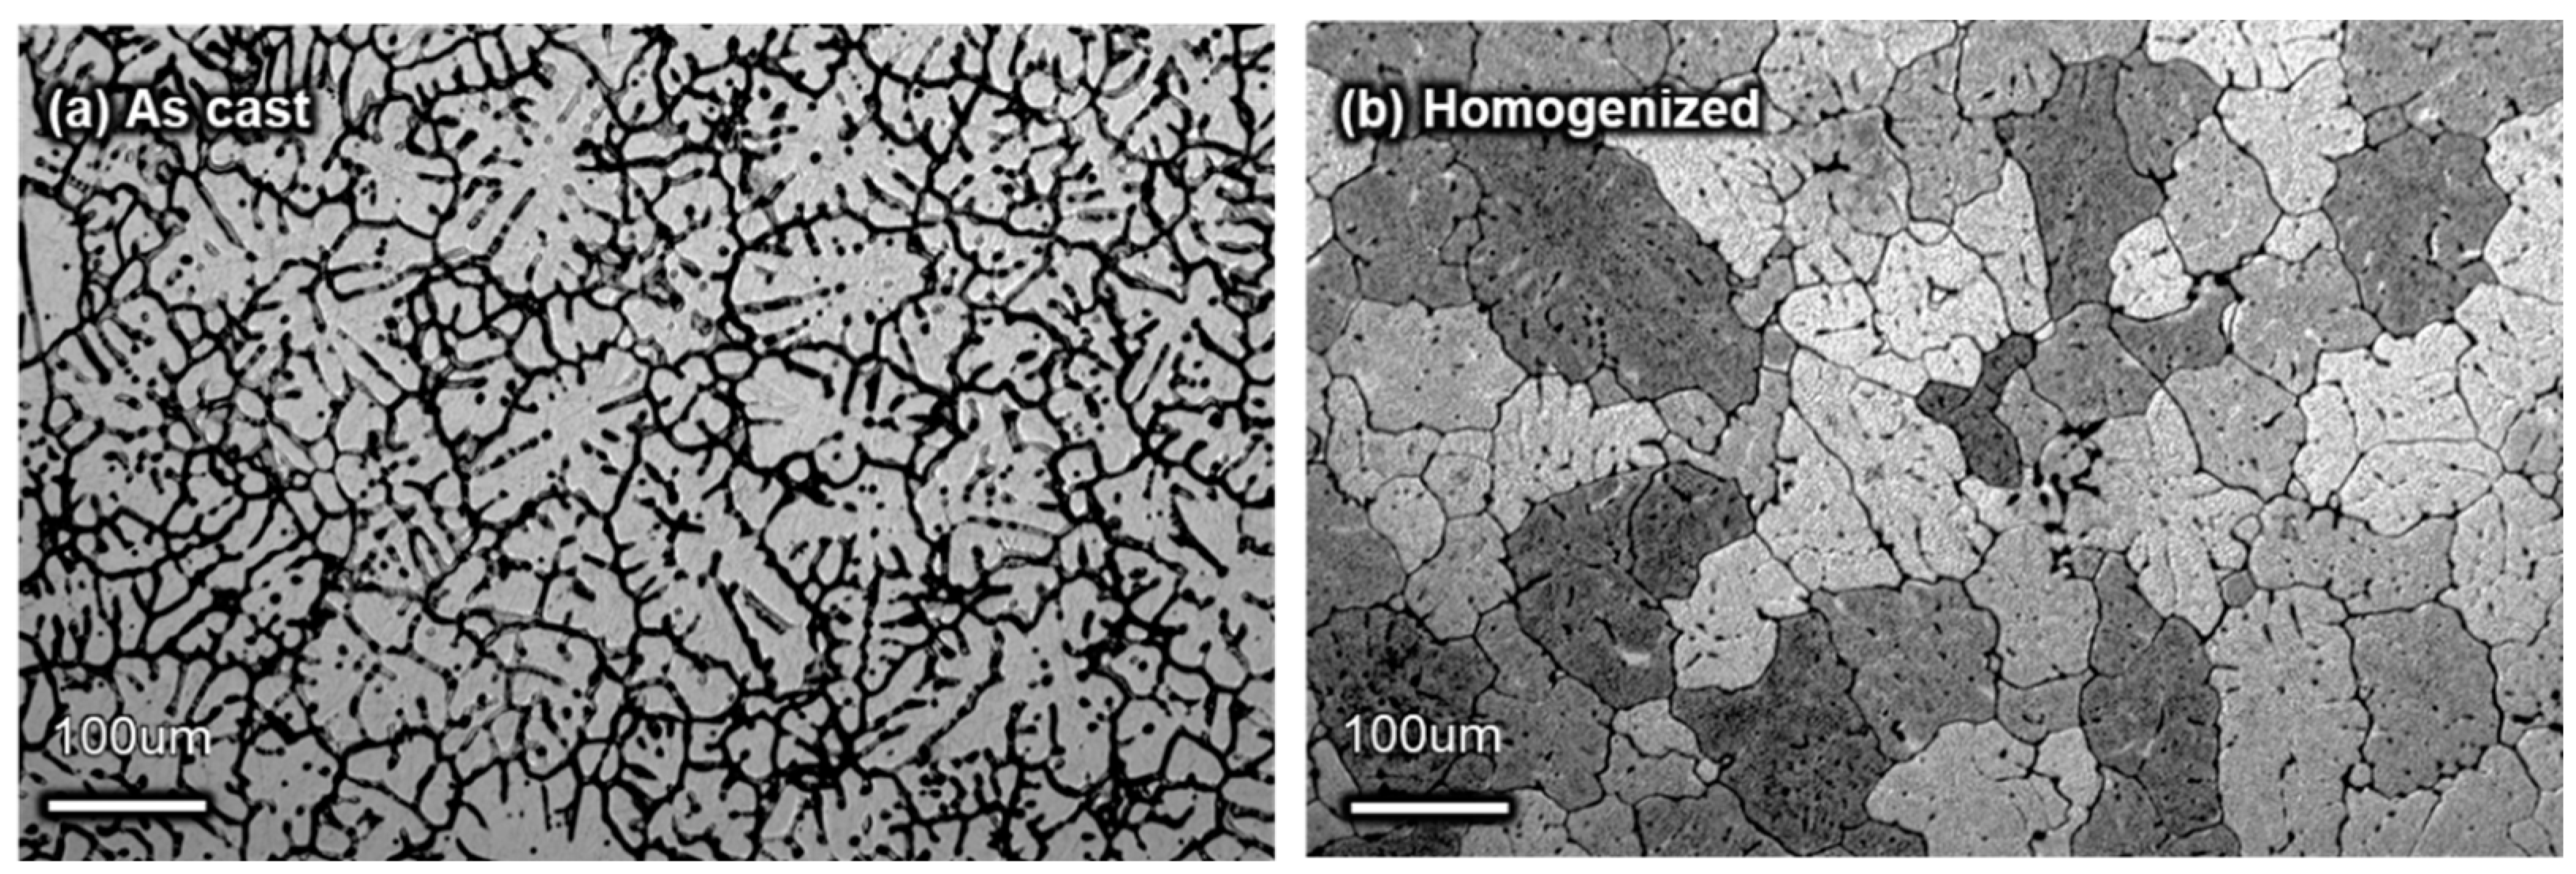
Figure 2.
(a) X-sectional view of the extrusion process and (b) the details of the flat die geometry used in this research showing the location of a thermocouple (TC) by a solid green dot.
Figure 2.
(a) X-sectional view of the extrusion process and (b) the details of the flat die geometry used in this research showing the location of a thermocouple (TC) by a solid green dot.
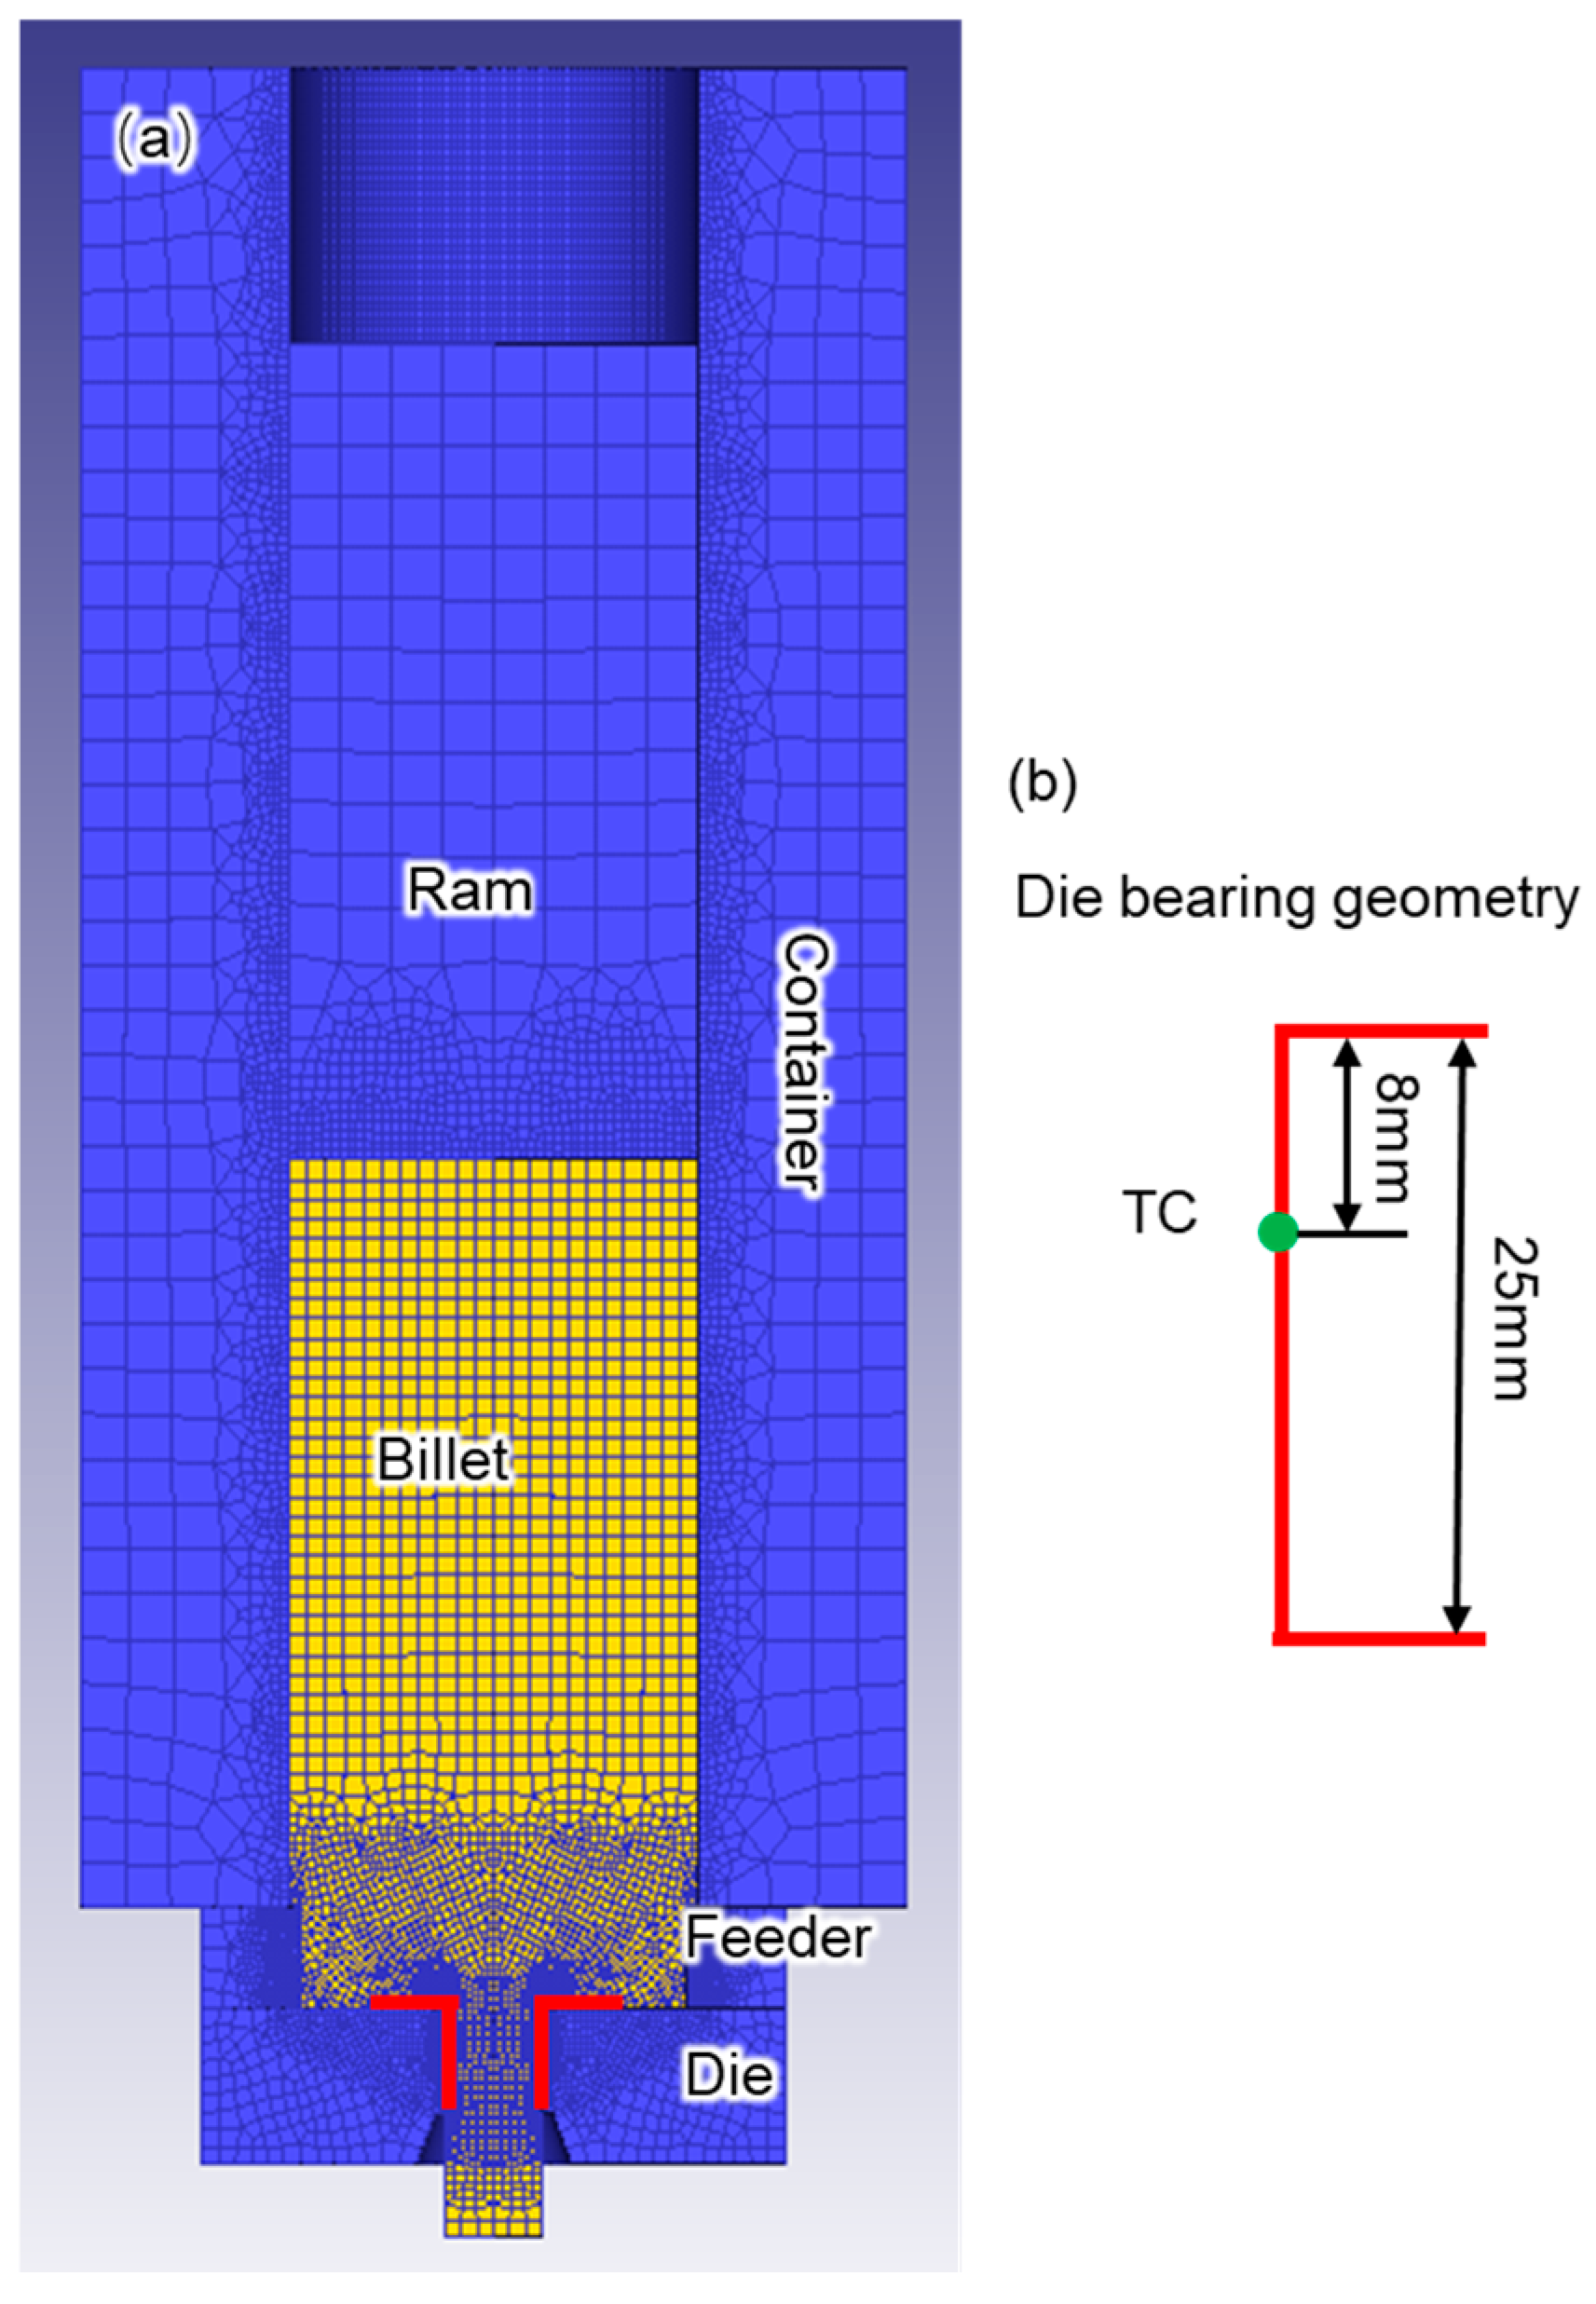
Figure 3.
Measured solidus temperature based on DSC tests as a function of Cu content for as cast and homogenized conditions.
Figure 3.
Measured solidus temperature based on DSC tests as a function of Cu content for as cast and homogenized conditions.
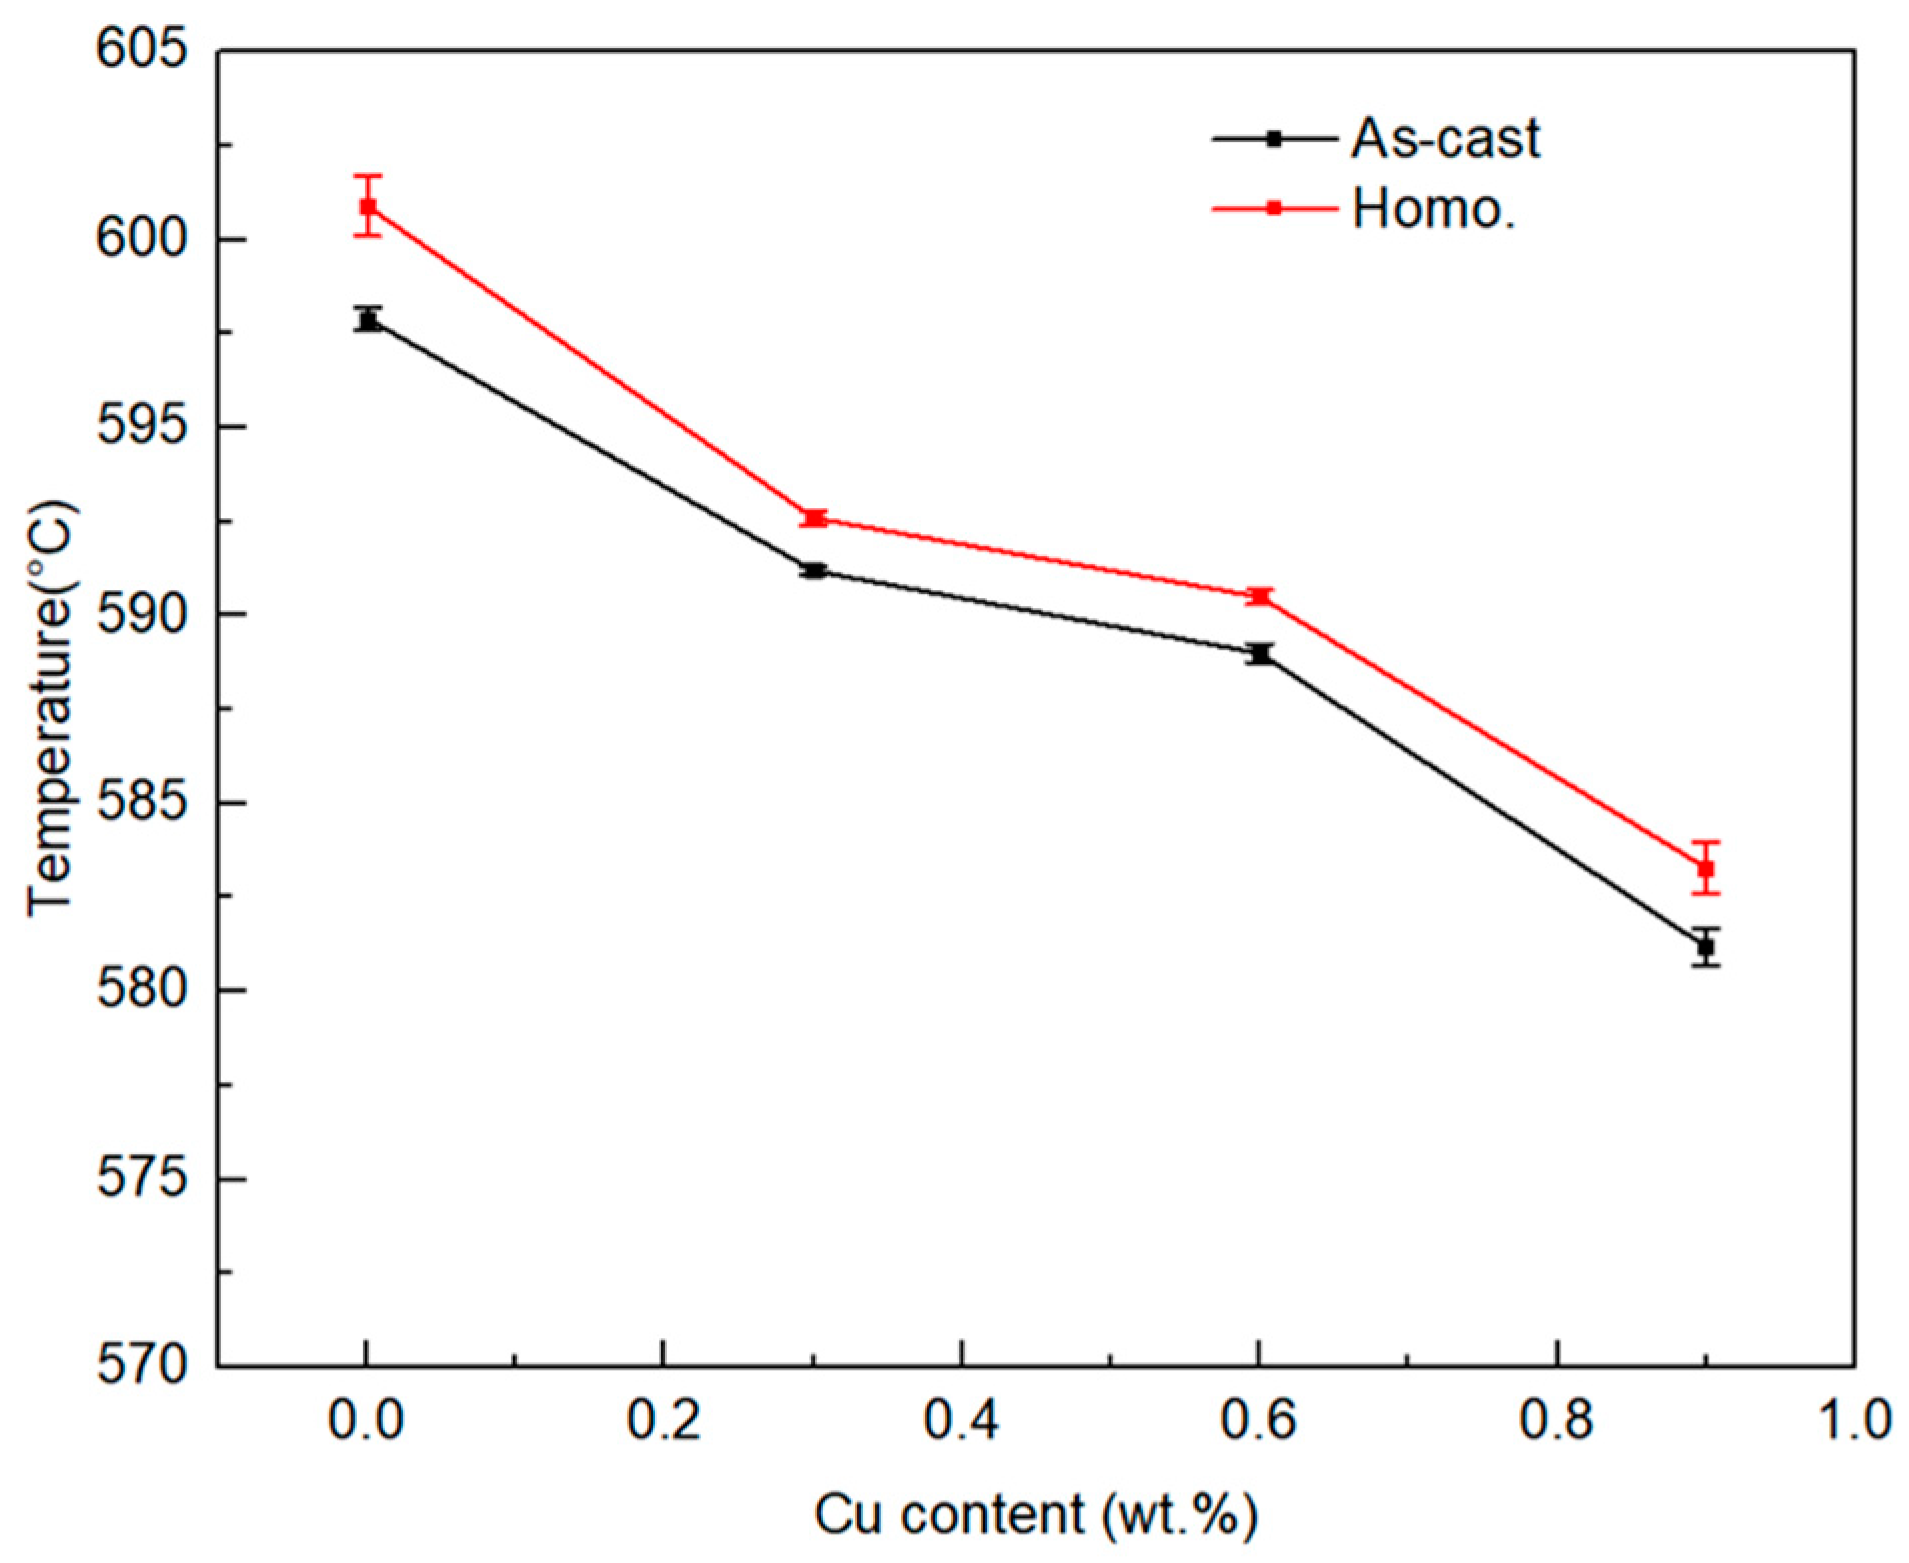
Figure 4.
Measured steady state flow stress at different hot deformation temperatures and strain rates for (a) 0.3Cu, (b) 0.6Cu, and (c) 0.9Cu at different strain rate.
Figure 4.
Measured steady state flow stress at different hot deformation temperatures and strain rates for (a) 0.3Cu, (b) 0.6Cu, and (c) 0.9Cu at different strain rate.
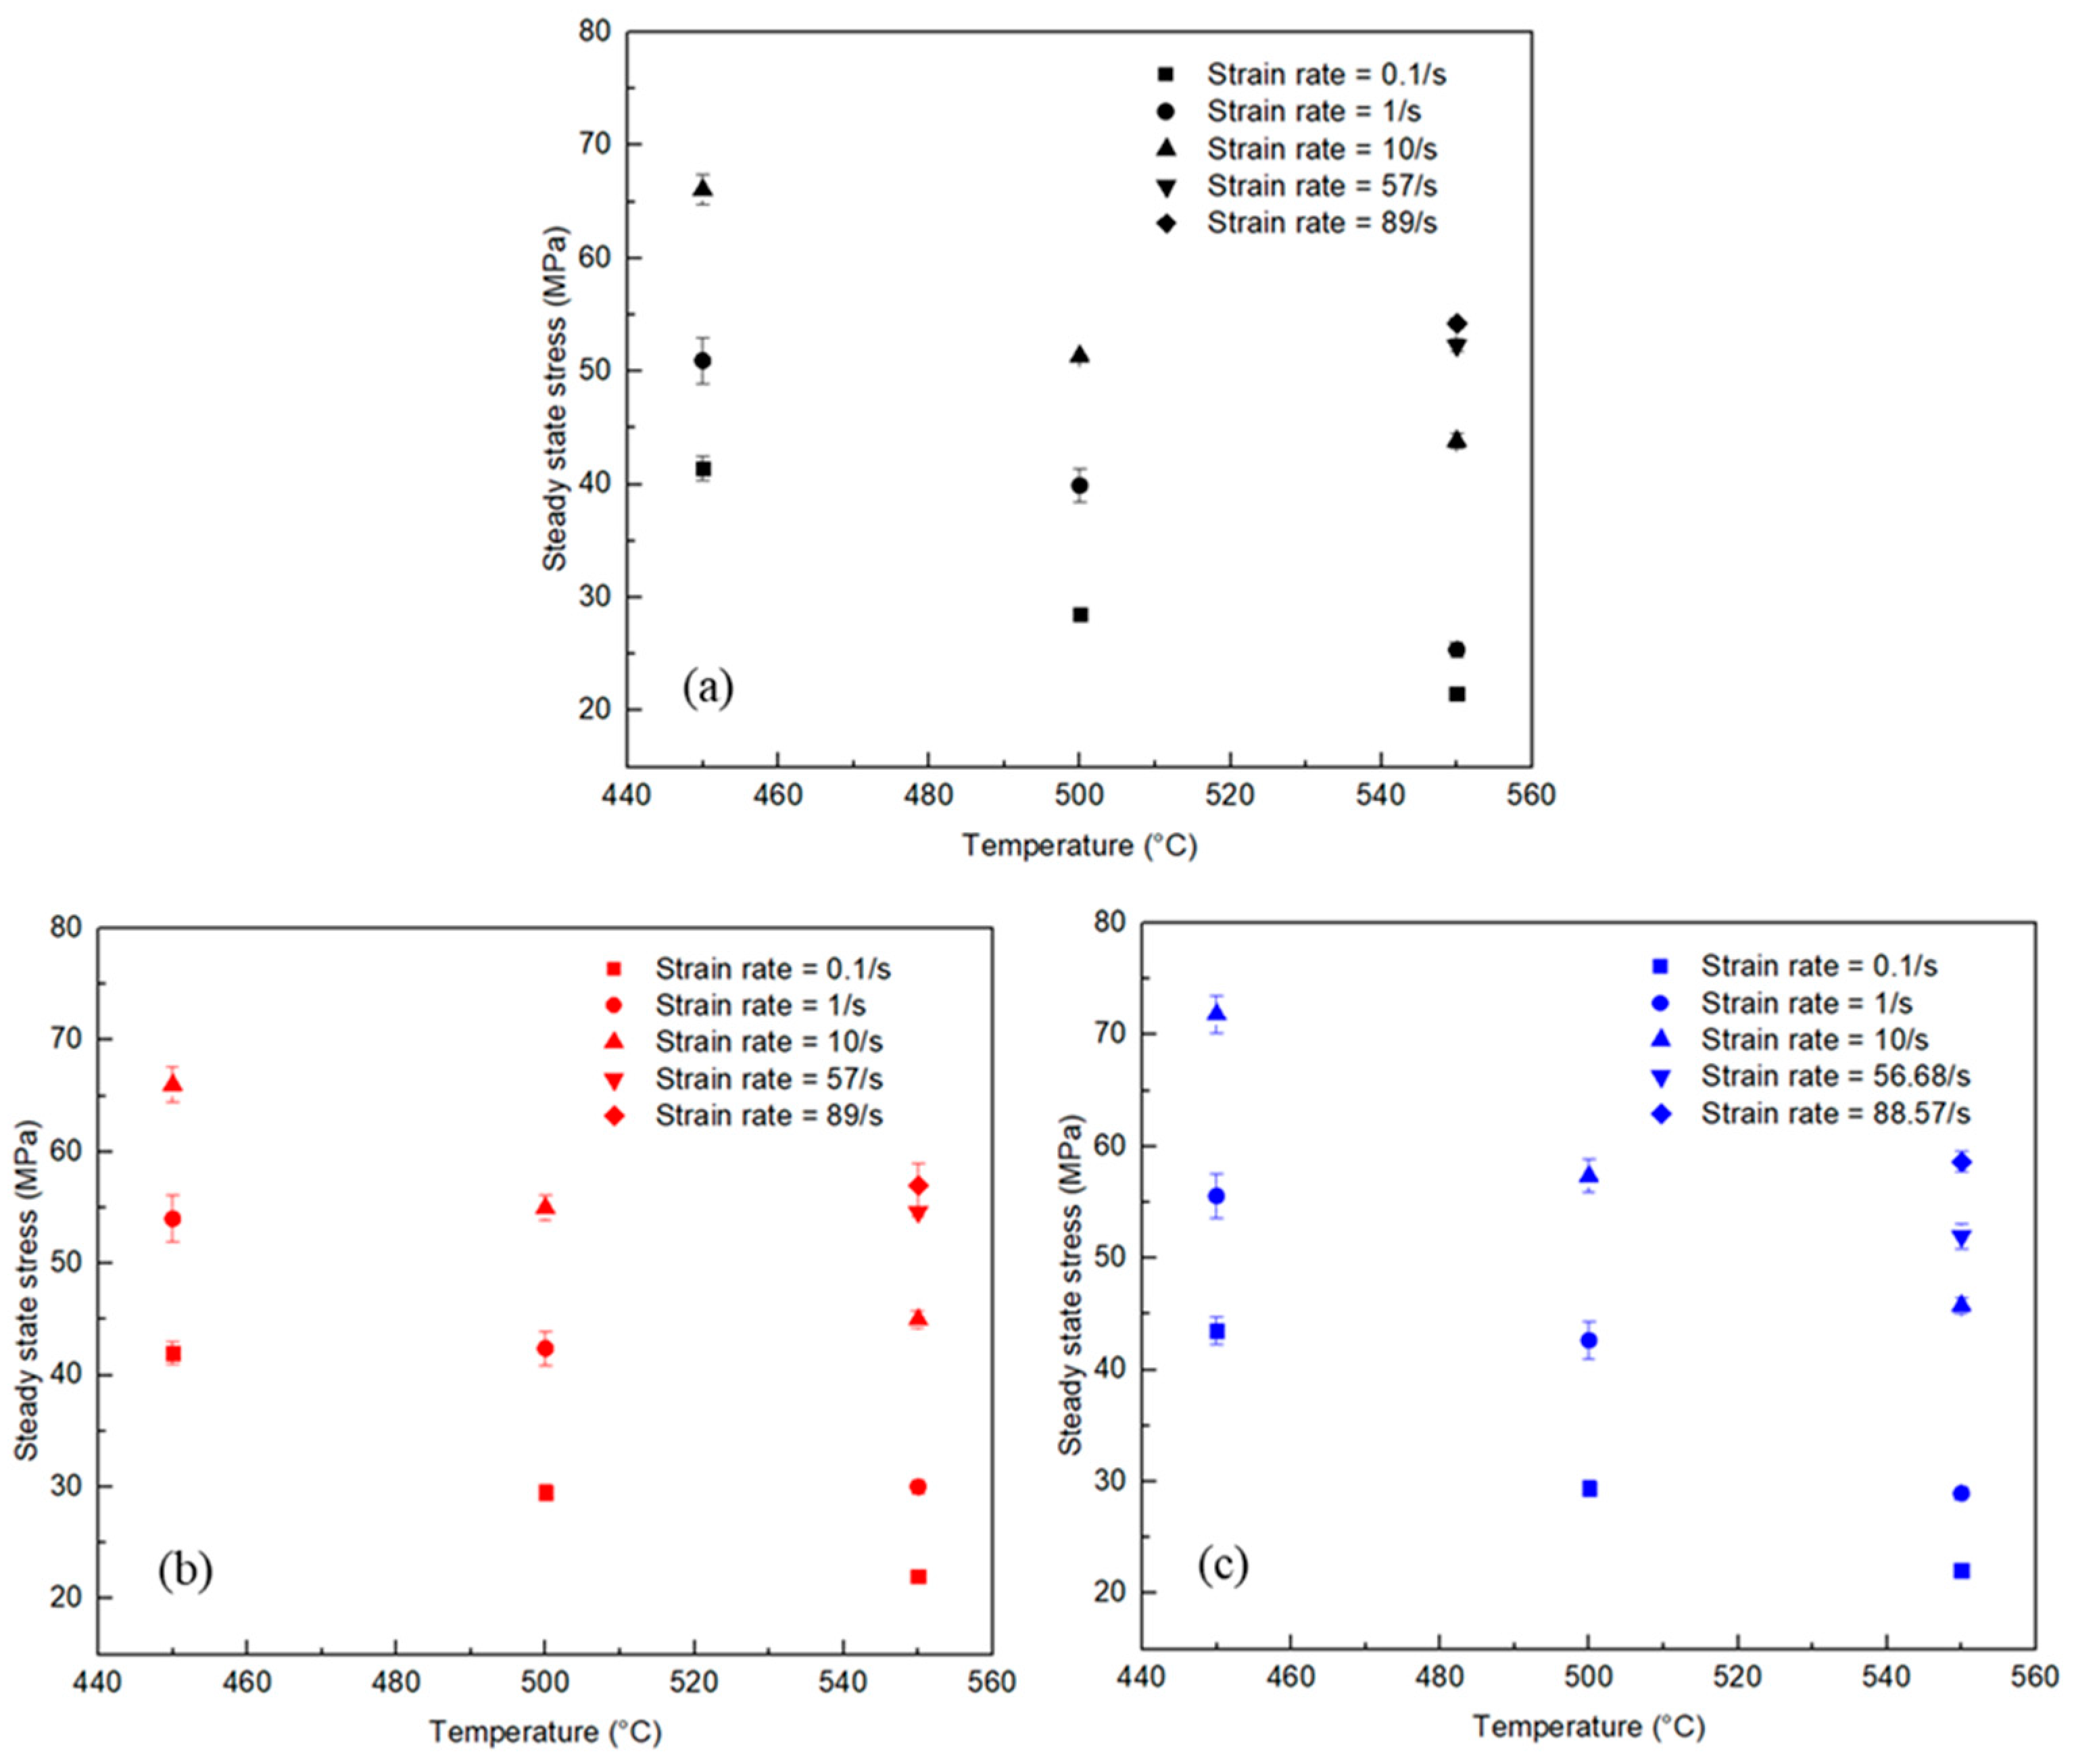
Figure 5.
Comparison of model predicted and measured flow stress for 0.3Cu, 0.6Cu, 0.9Cu and 0Cu [32]. The dotted lines represent ± 10 % of the measured data.
Figure 5.
Comparison of model predicted and measured flow stress for 0.3Cu, 0.6Cu, 0.9Cu and 0Cu [32]. The dotted lines represent ± 10 % of the measured data.
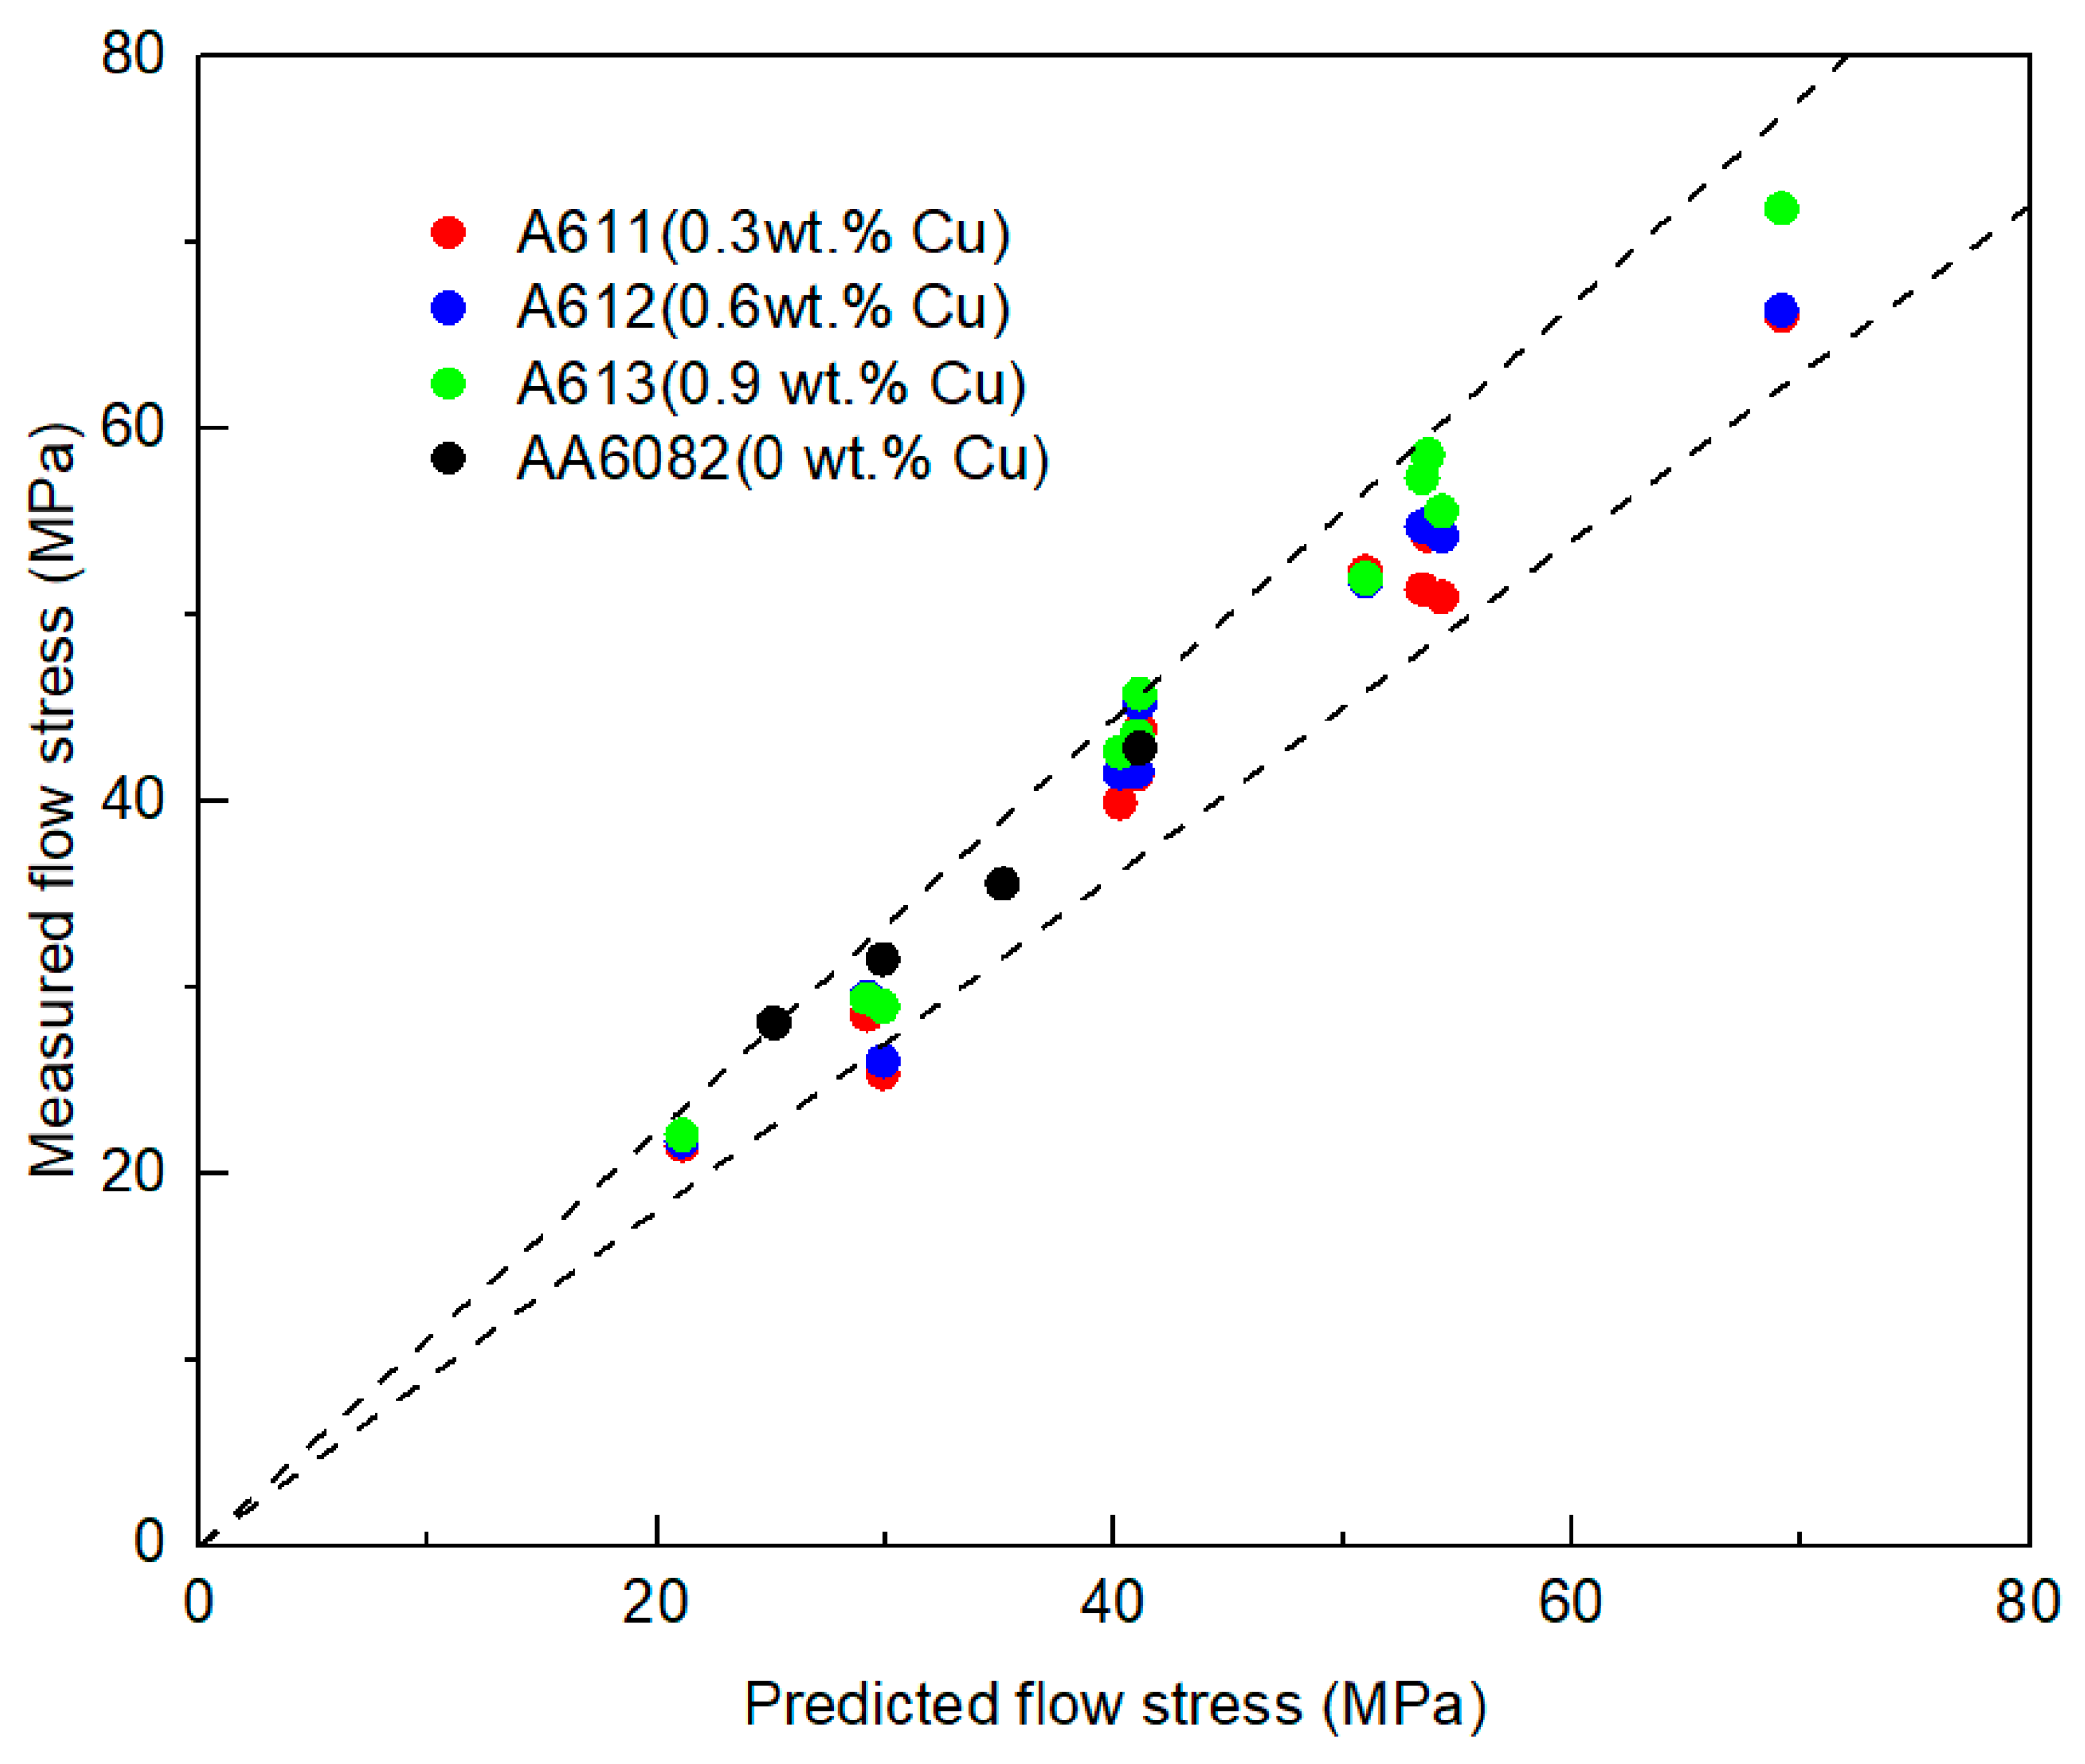
Figure 6.
Surface morphology of extrudates produced for different Cu contents. (a) and (b) are surface morphology images of 0.6Cu and 0.9Cu with micro cracks and visible cracks, respectively, extruded at a ram speed of 20 mm/s, (c) and (d) are the high magnification images of (a) and (b) showing the crack location.
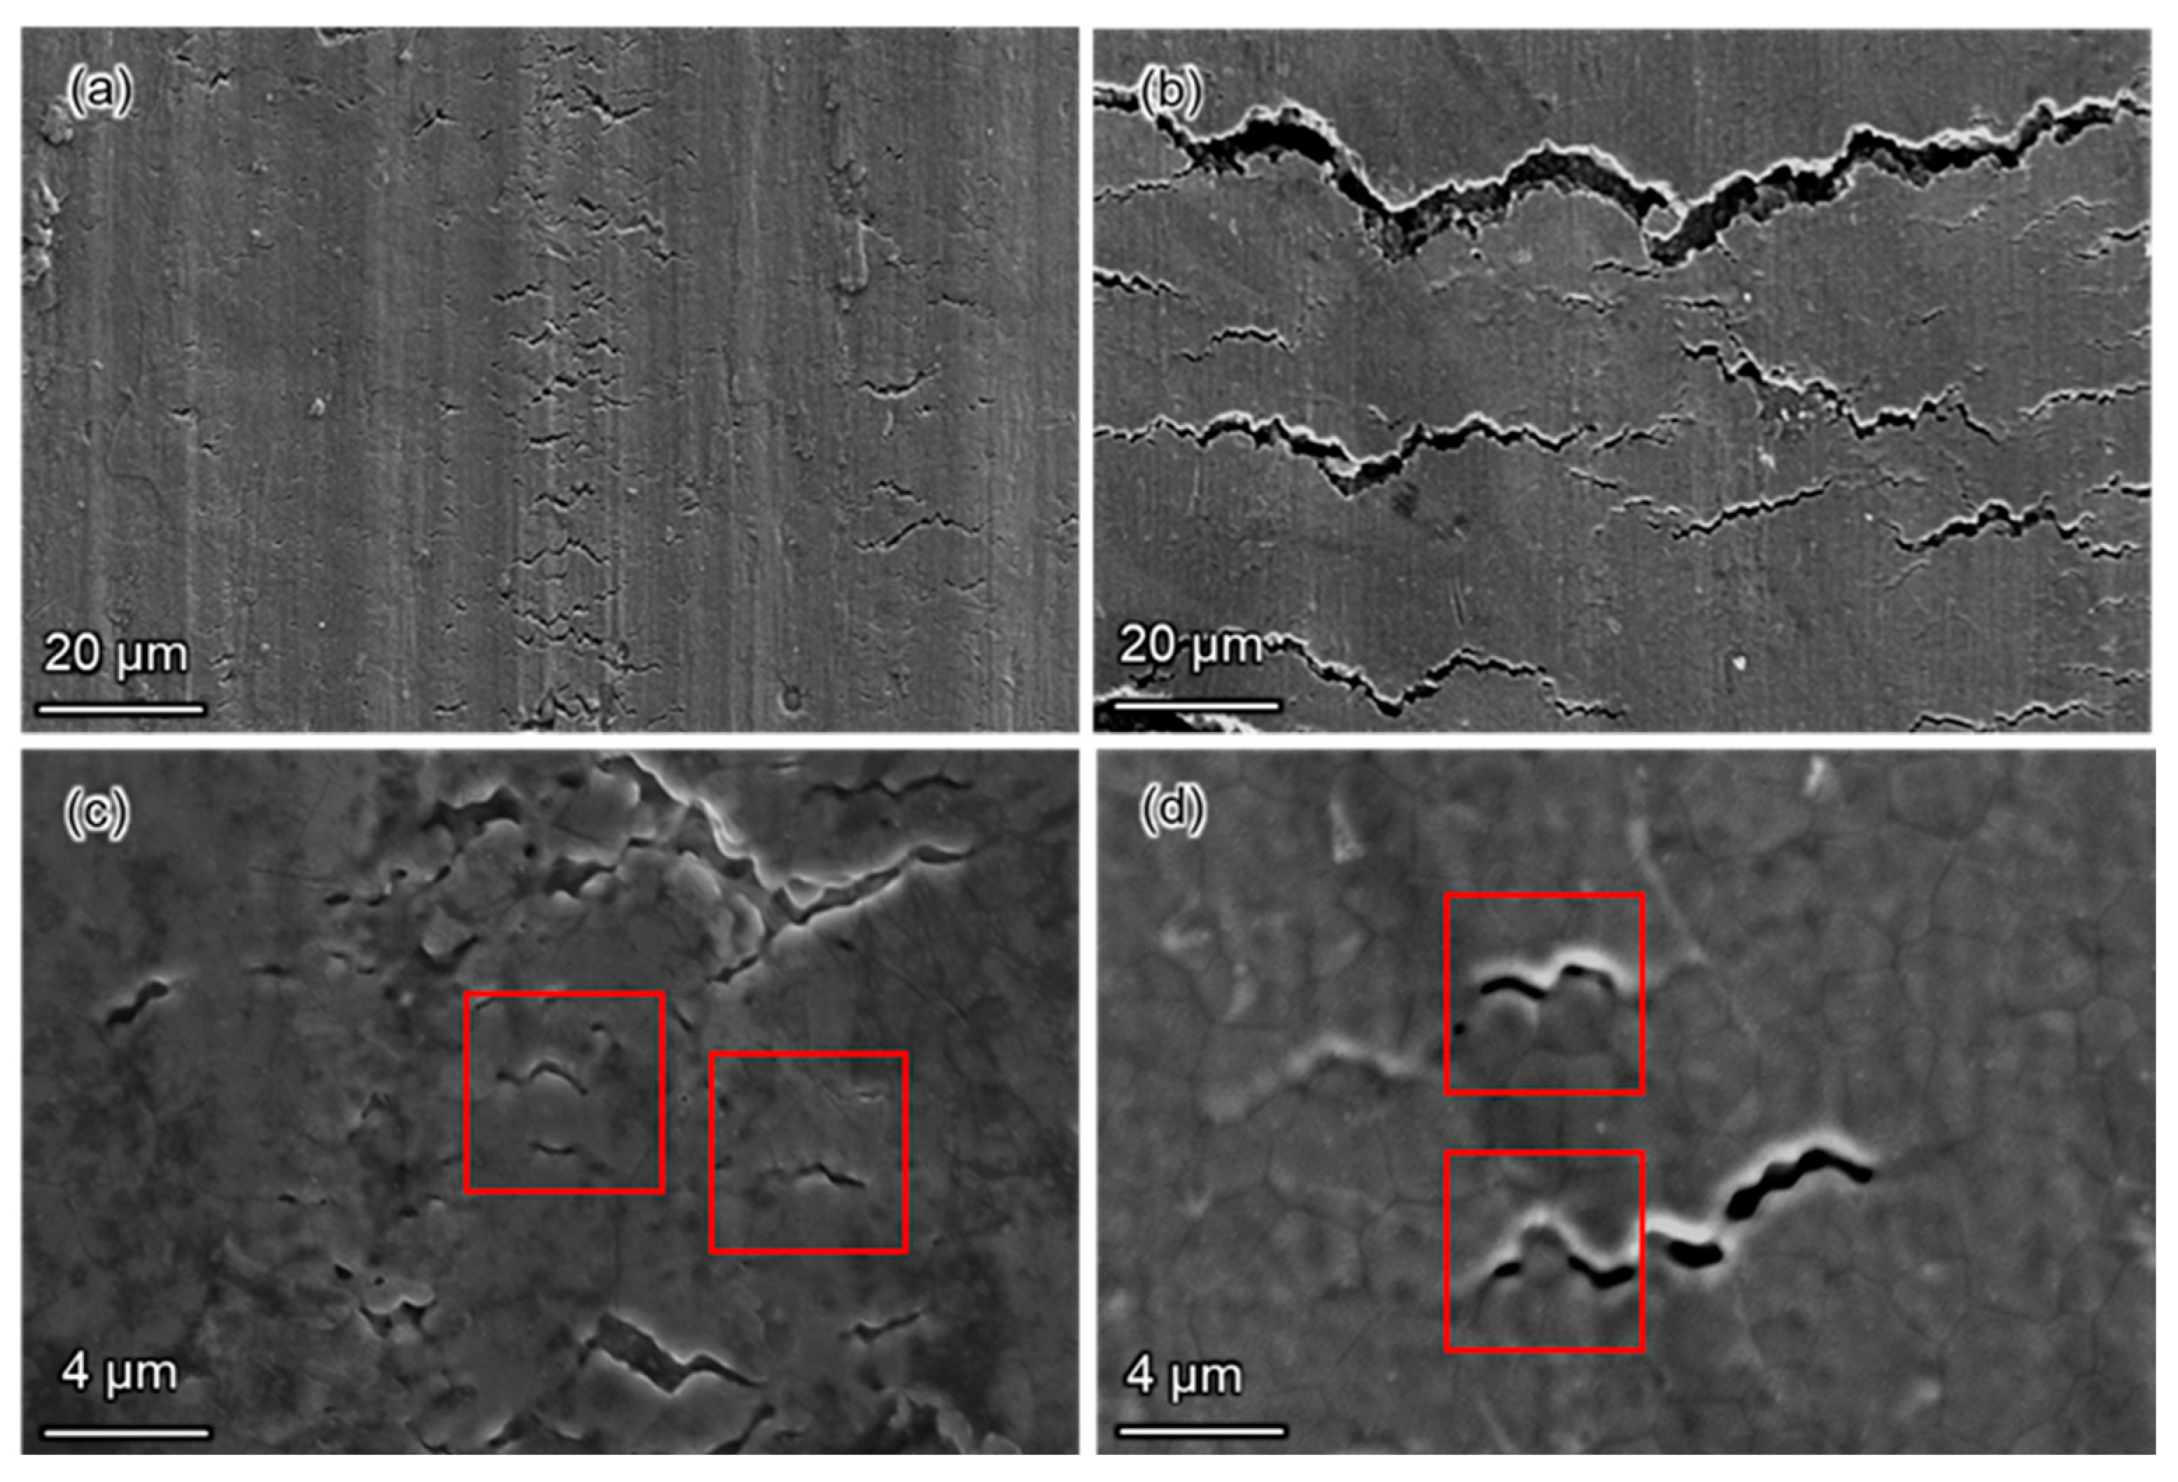
Figure 7.
Temperature and stress distribution contour maps in the billet during extrusion showing that the maximum temperature and stress appear at the die corner indicated by a blue square in (a) and (b) respectively with (c) showing the temperature and stress distribution along the die bearing for a ram speed of 20 mm/s.
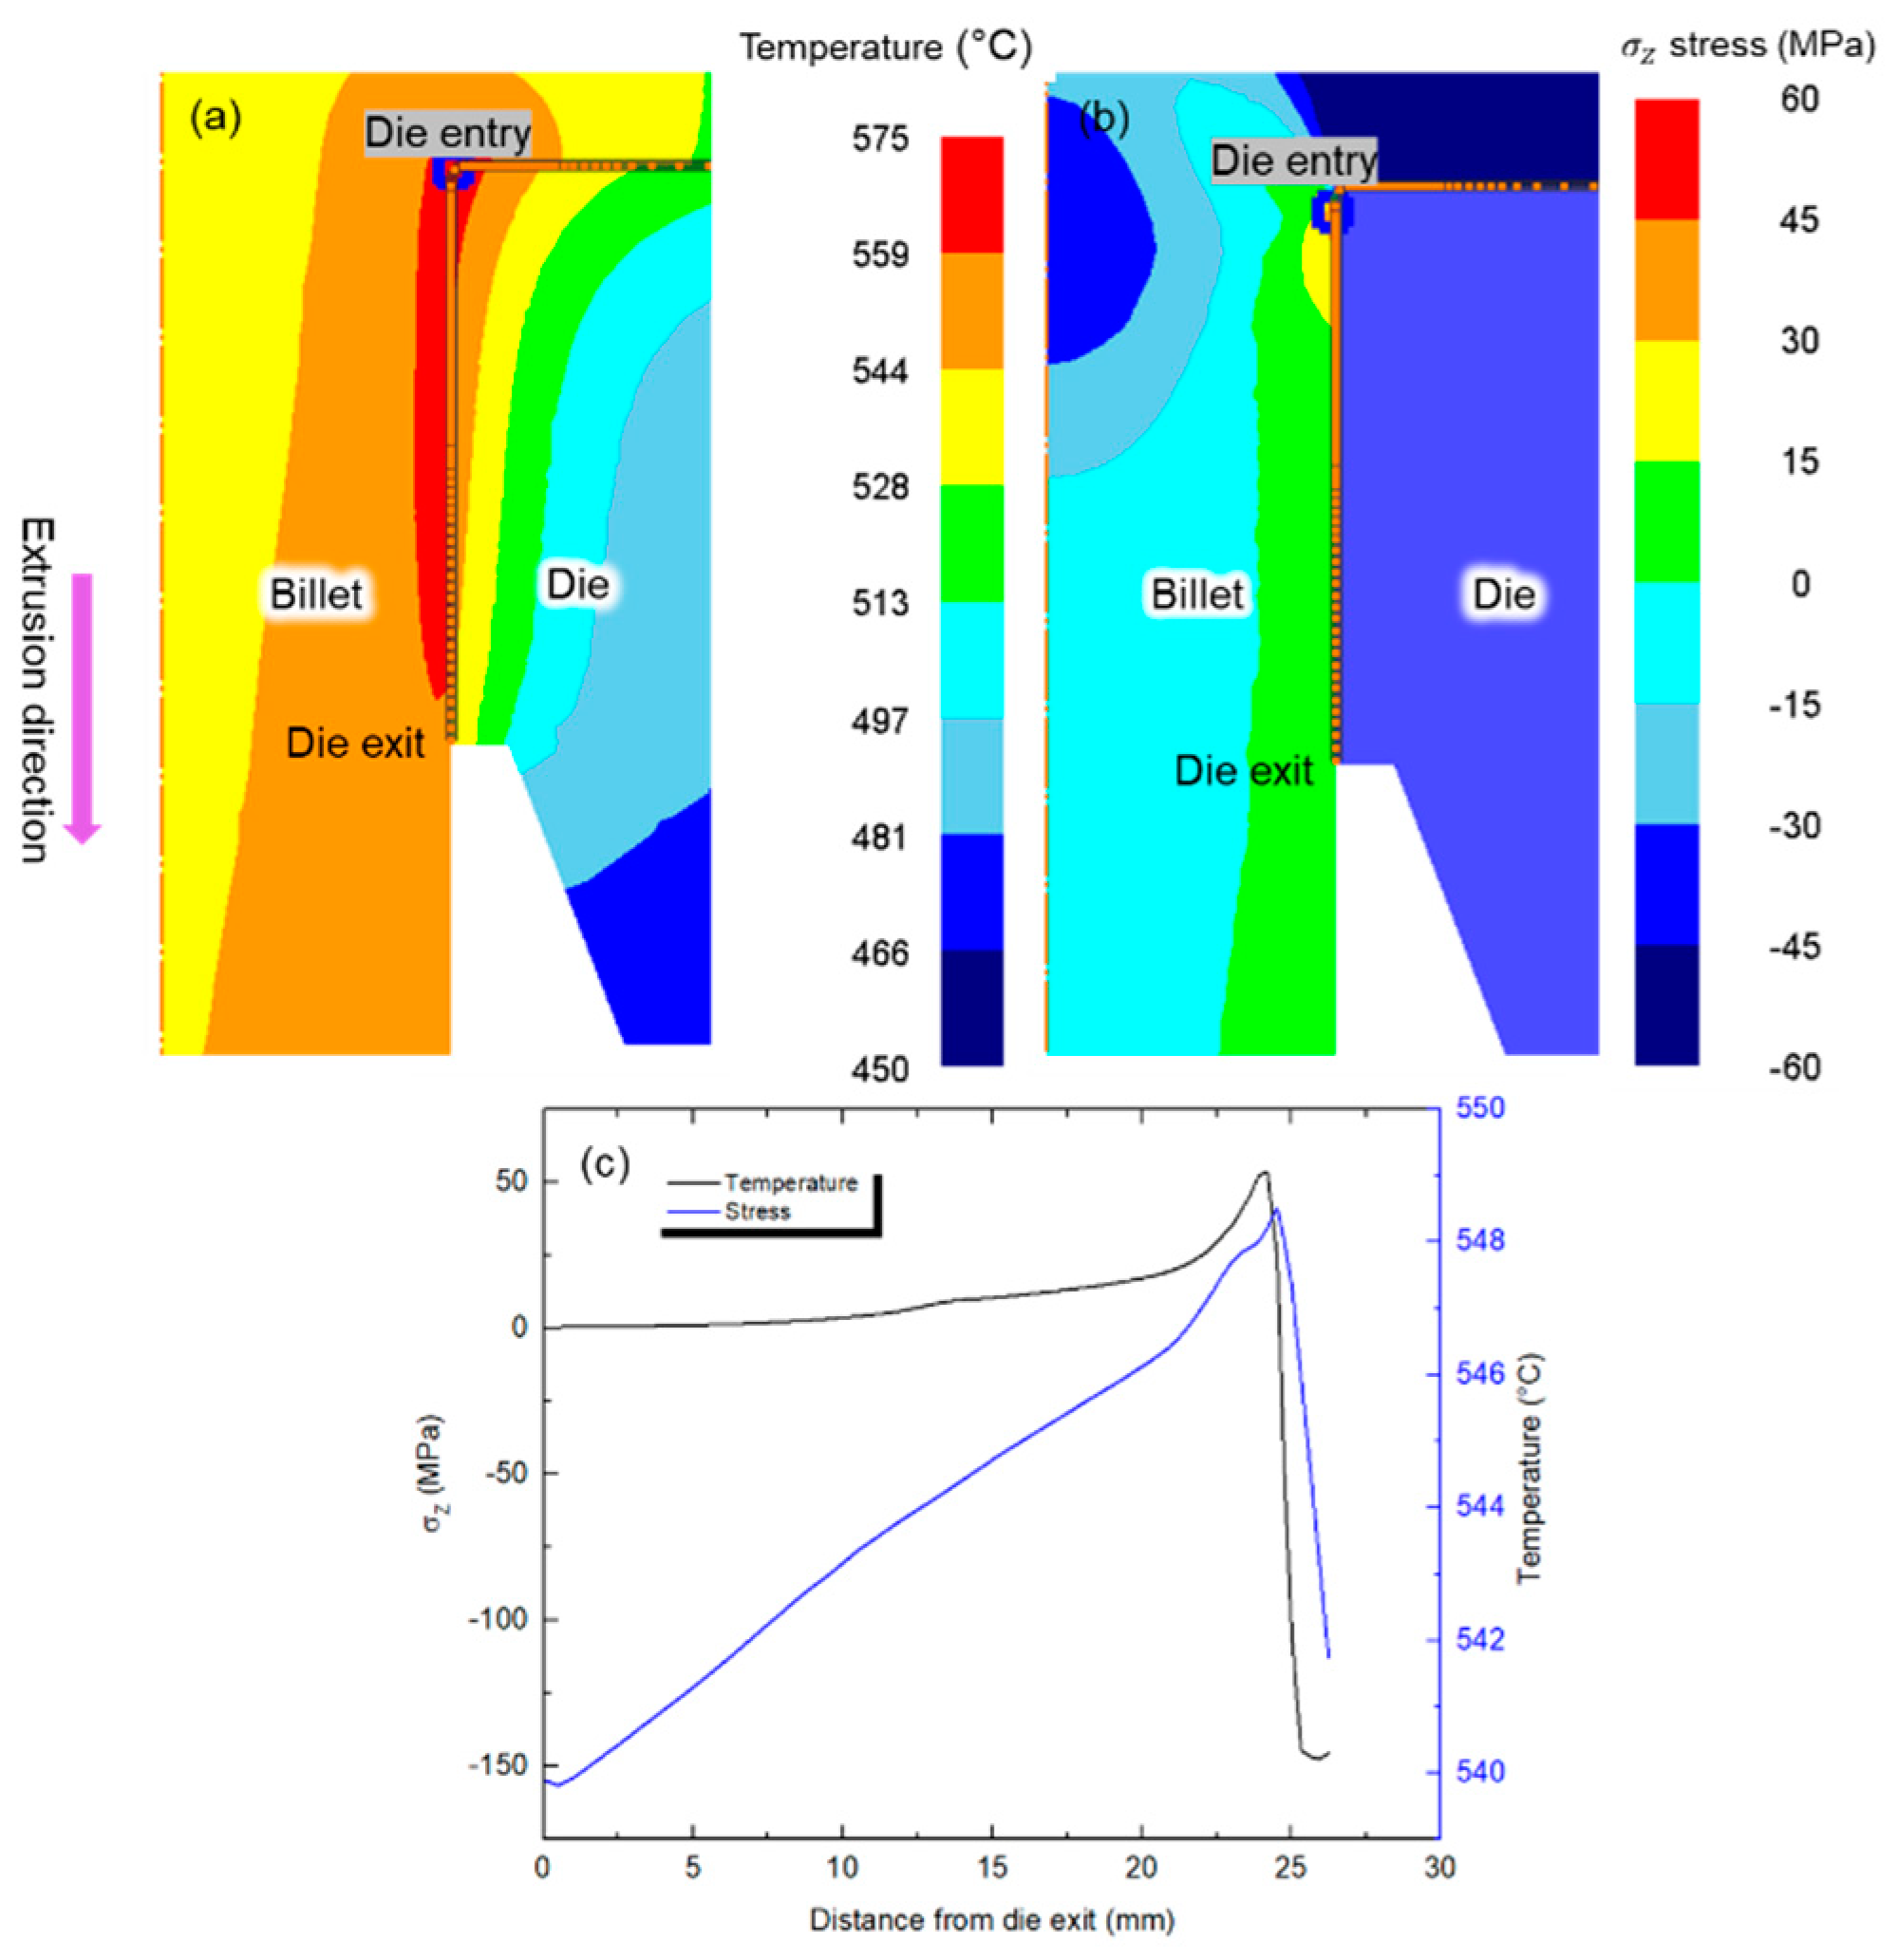
Figure 8.
Model predicted z at the die corner and temperature (corresponding Fs) at the die corner at varying extrusion speeds for 0.6Cu and 0.9Cu materials. The colors of the data points represent visual observations of surface cracking during the extrusion trial: Green represents no cracking, yellow means micro cracking and red means visible cracking.
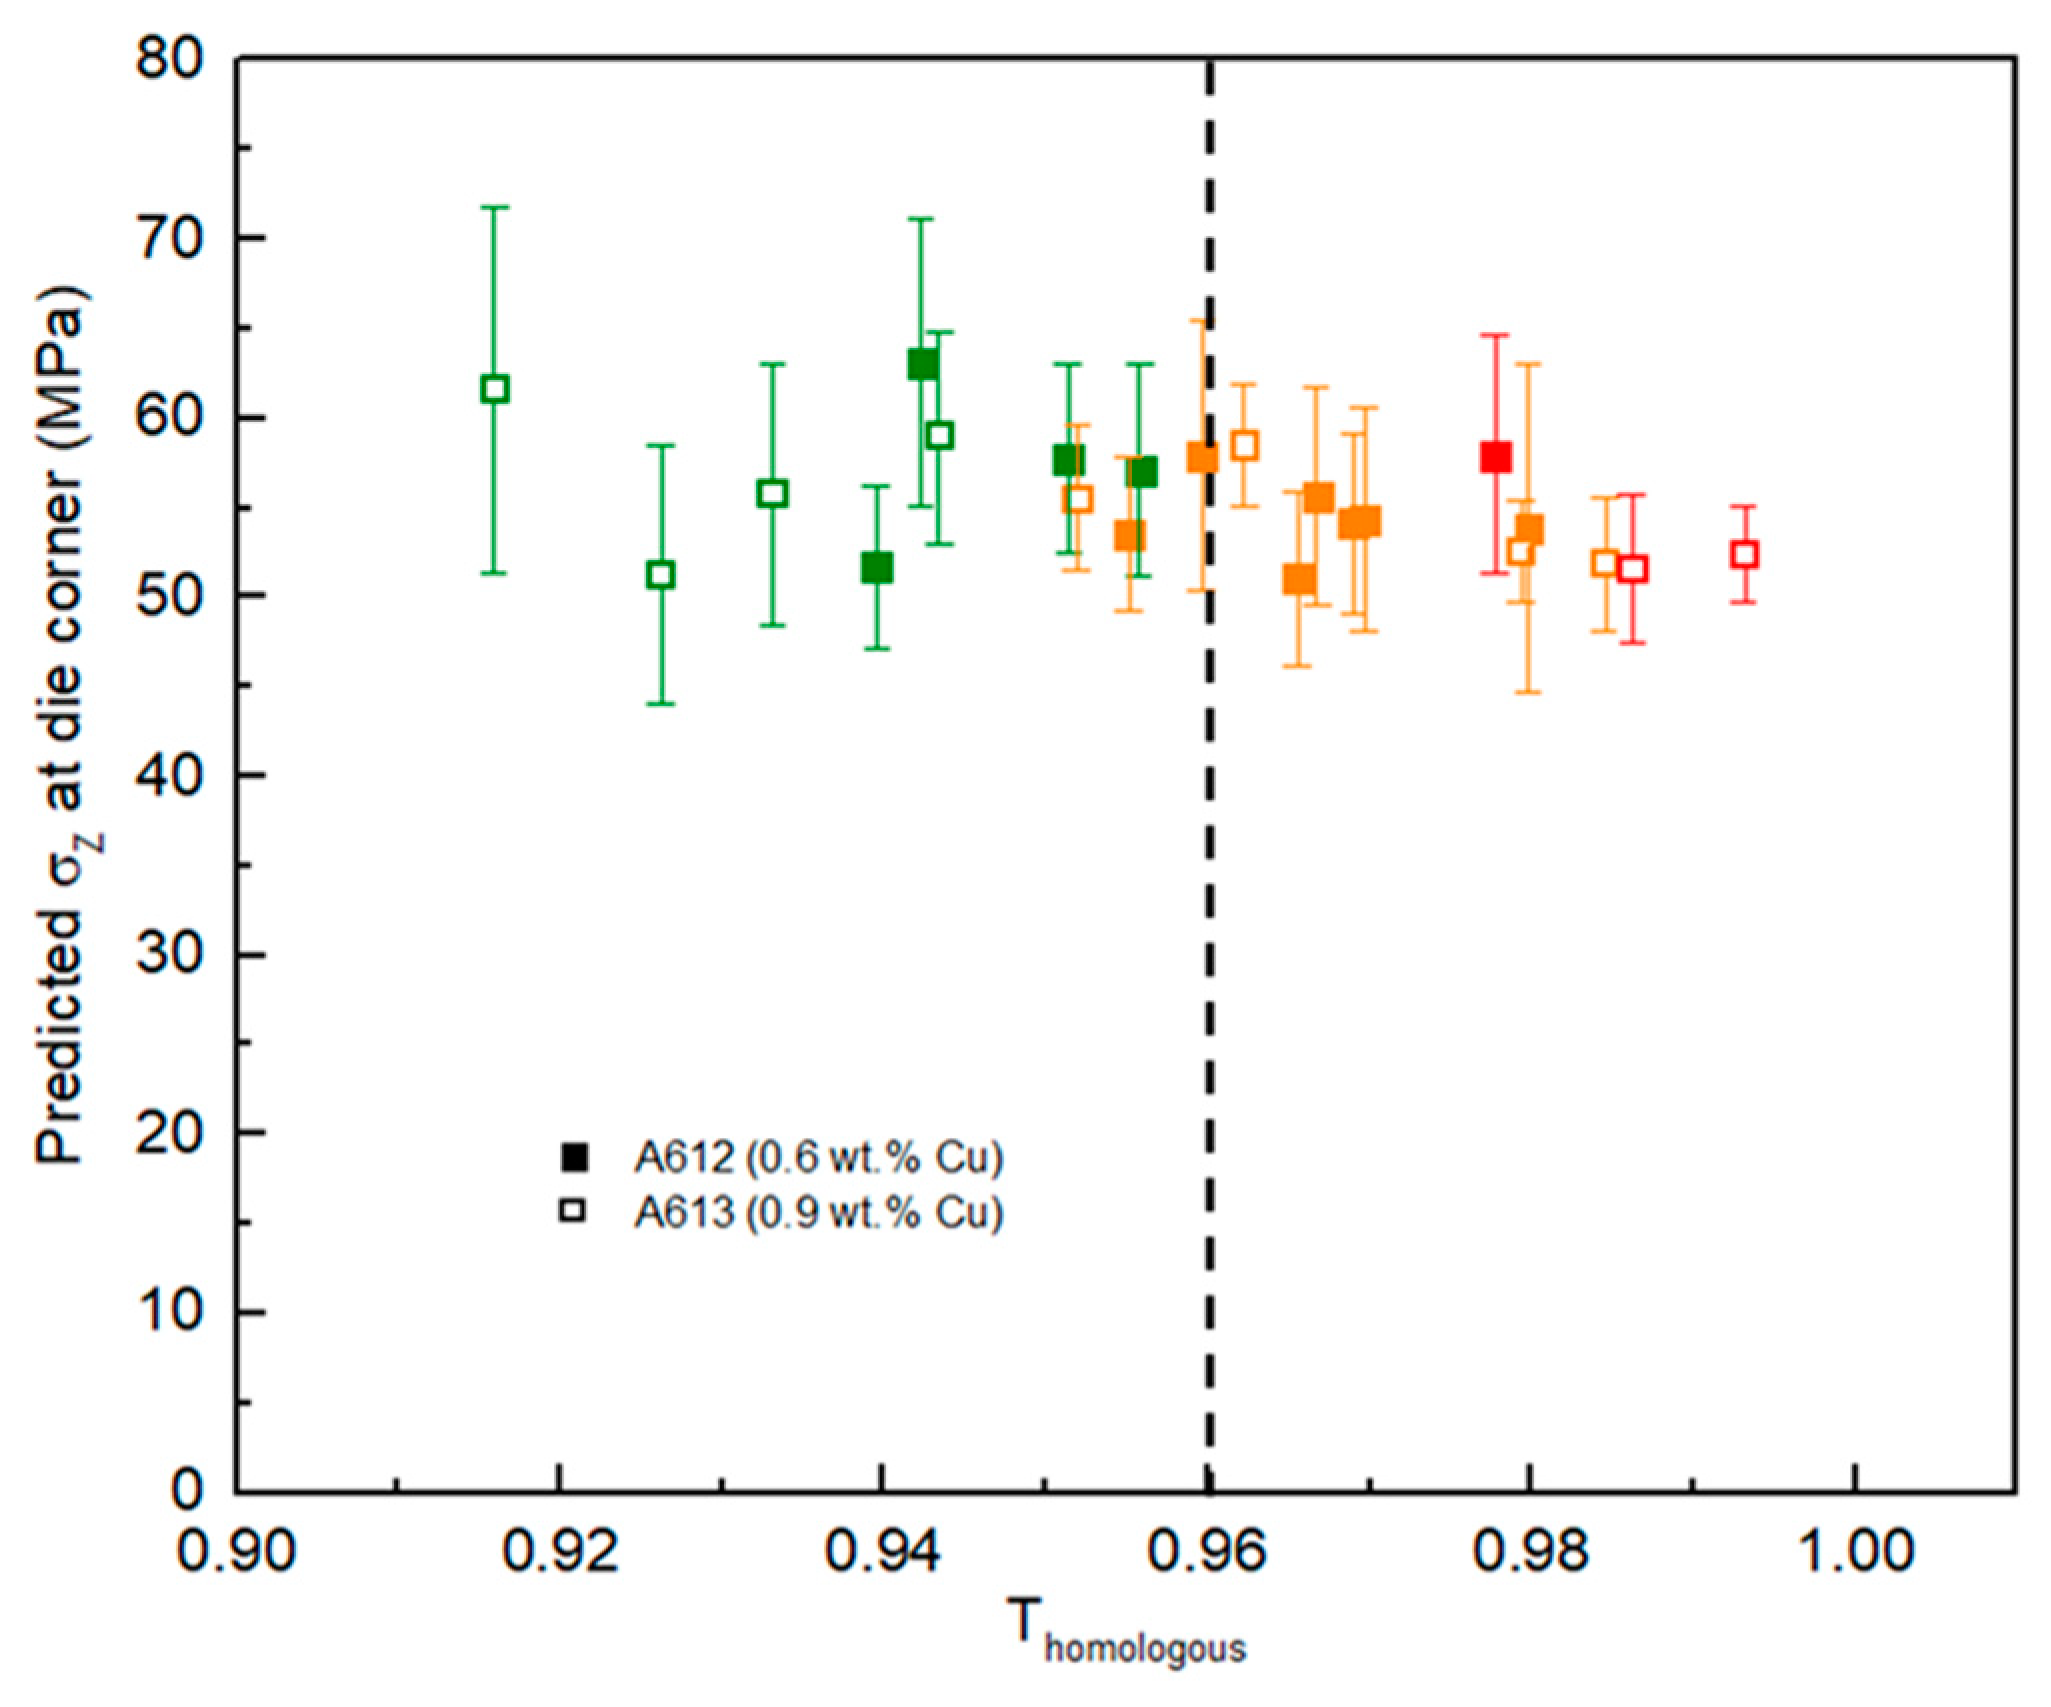
Figure 9.
Model predicted ELDs (lines) and experimental observations of surface morphology conditions (“x”) at the back of the extrudates with: (a) 0.6Cu and (b) 0.9Cu.
Figure 9.
Model predicted ELDs (lines) and experimental observations of surface morphology conditions (“x”) at the back of the extrudates with: (a) 0.6Cu and (b) 0.9Cu.
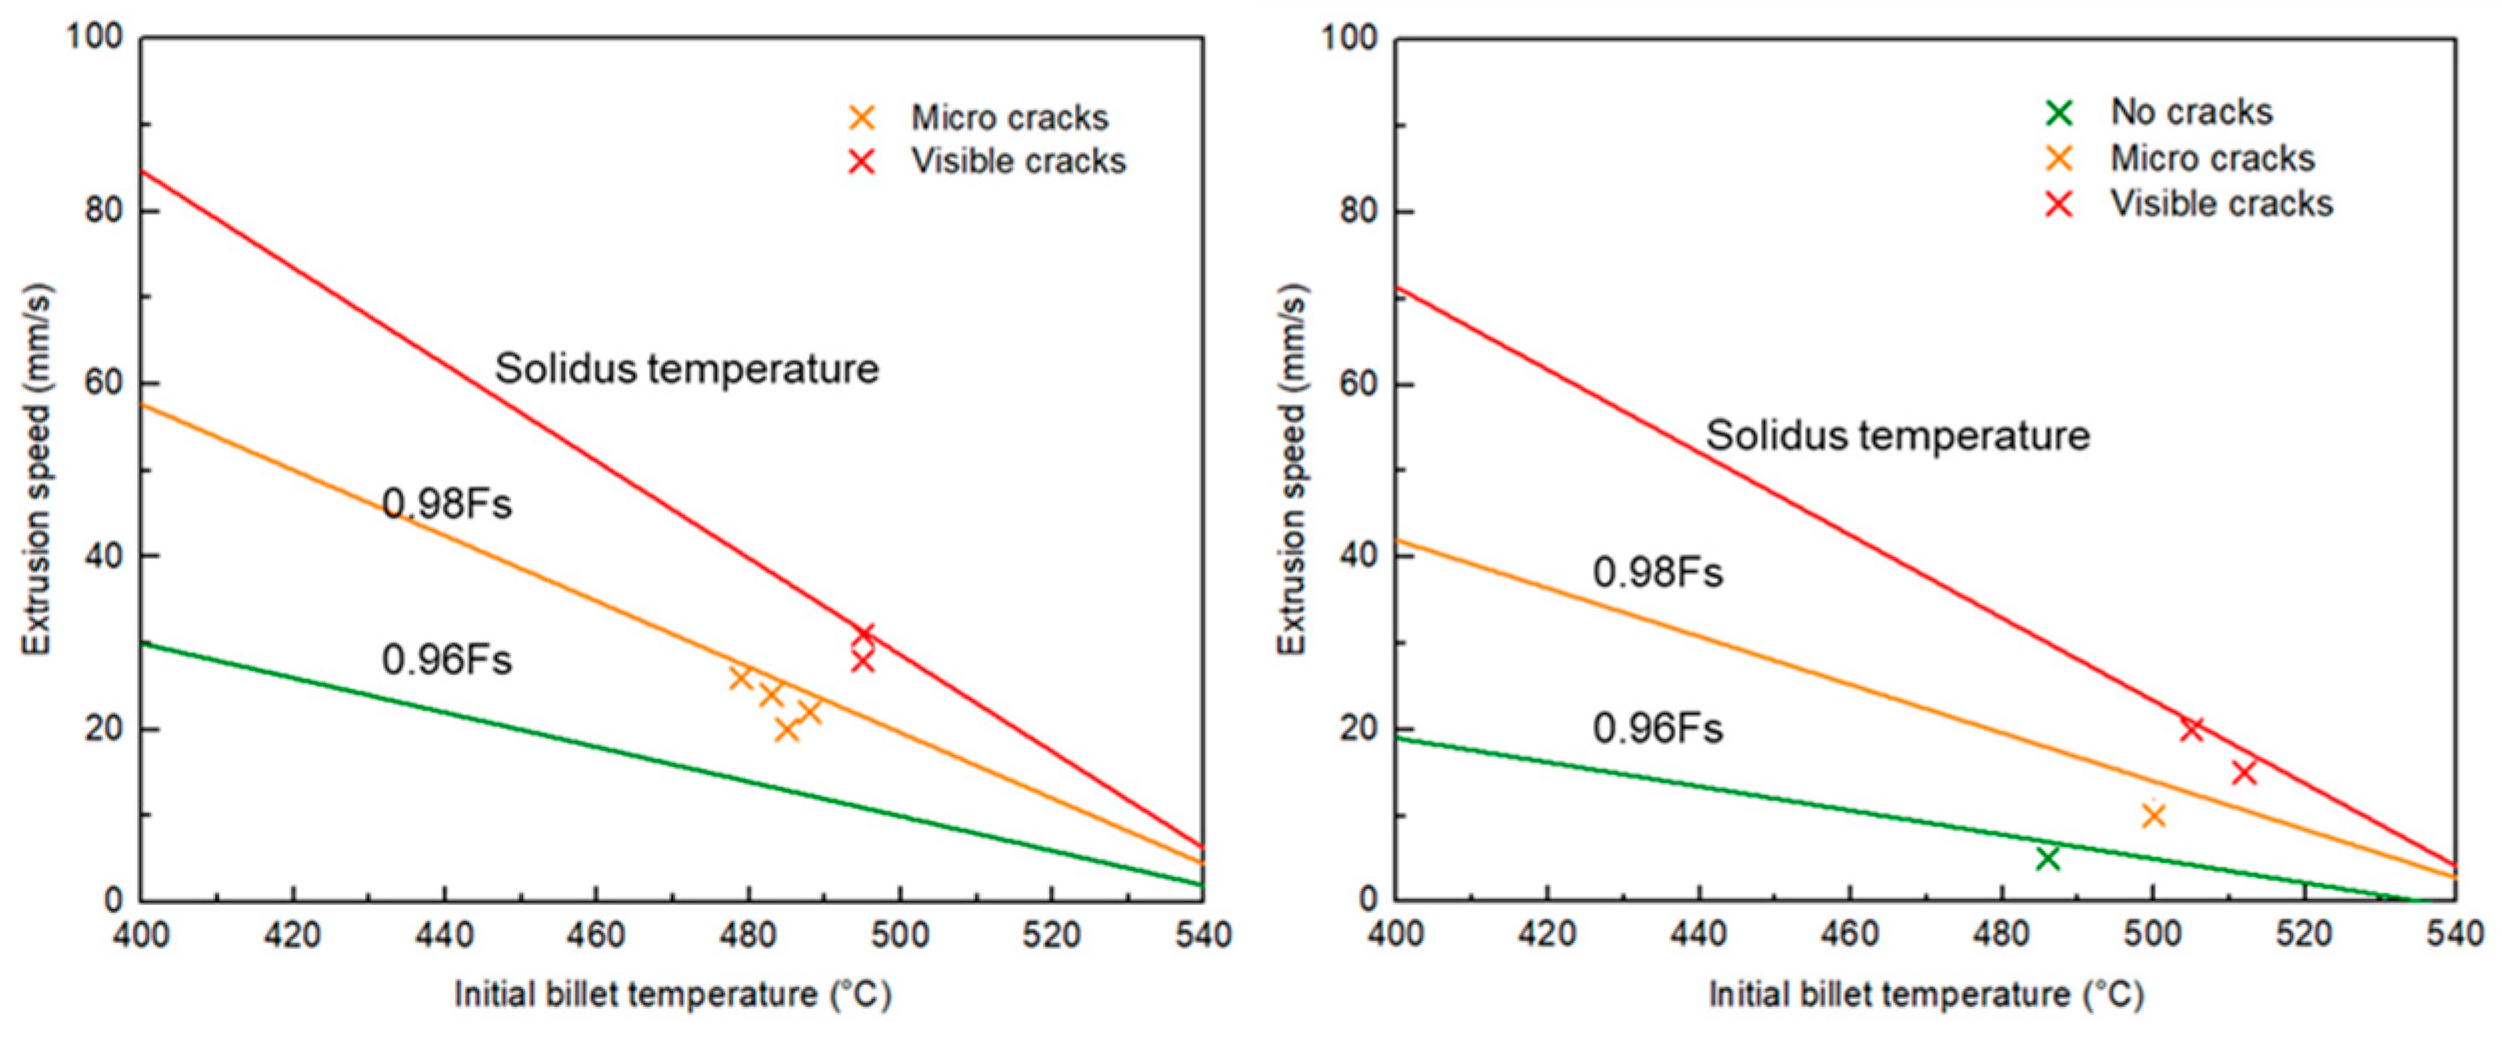
Figure 10.
Model-predicted ELD showing the effect of Cu addition on extrudability using a surface temperature limit line of 0.96Fs for all alloys and for a flat extrusion die.
Figure 10.
Model-predicted ELD showing the effect of Cu addition on extrudability using a surface temperature limit line of 0.96Fs for all alloys and for a flat extrusion die.
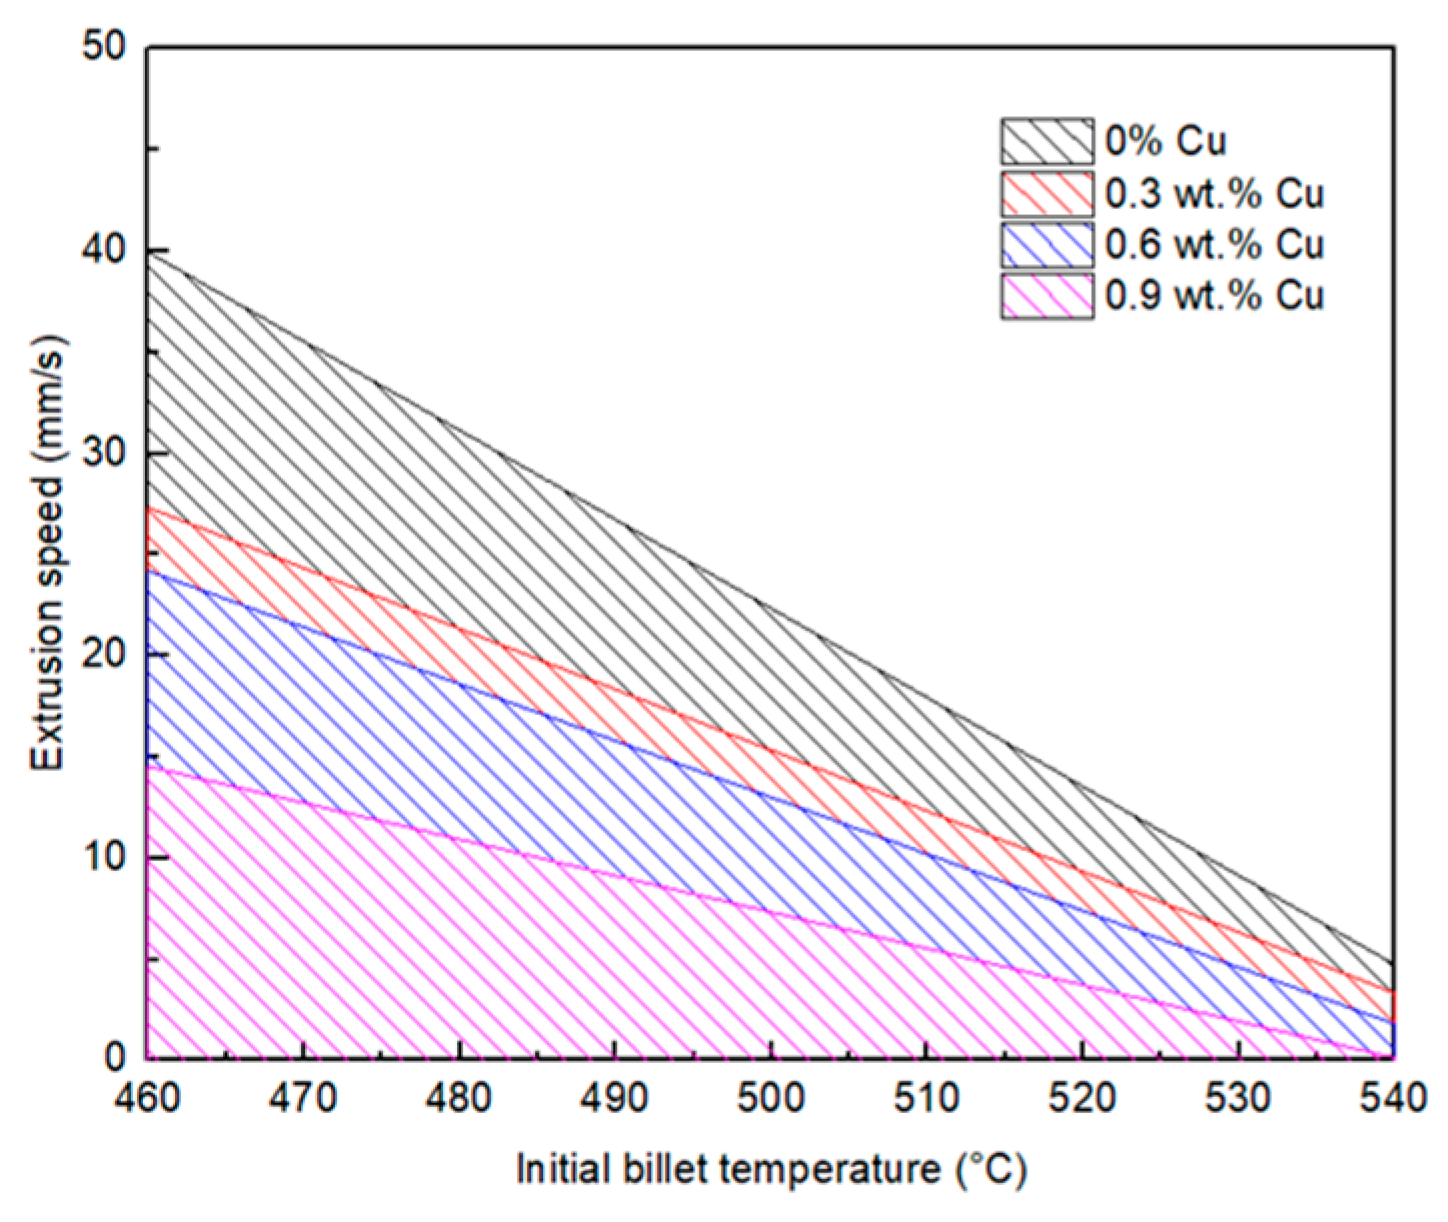

Table 1.
Chemical compositions (weight percentage).
| Cu | Fe | Mg | Mn | Si | Ti | Cr | V | Al |
|---|---|---|---|---|---|---|---|---|
| 0.0Cu | 0.19 | 0.69 | 0.52 | 1.01 | 0.02 | 0.15 | 0.01 | Bal. |
| 0.3Cu | 0.20 | 0.71 | 0.51 | 1.04 | 0.02 | 0.15 | 0.01 | Bal. |
| 0.6Cu | 0.20 | 0.69 | 0.51 | 1.02 | 0.02 | 0.15 | 0.01 | Bal. |
| 0.9Cu | 0.22 | 0.70 | 0.51 | 1.03 | 0.02 | 0.15 | 0.01 | Bal. |
Table 2.
Extrusion parameters used in each trial.
| Material | Extrusion Speed (mm/s) |
|---|---|
| 0.6Cu | 20, 22, 24, 26, 28, 31 |
| 0.9Cu | 5, 10, 15, 20 |
Table 3.
Measured solidus temperature of each material based on DSC tests (°C).
| Material | 0Cu | 0.3Cu | 0.6Cu | 0.9Cu |
|---|---|---|---|---|
| As-cast | 598 | 592 | 589 | 581 |
| Homo. | 602 | 593 | 590 | 583 |
Table 4.
Constitutive model parameters for 0.6Cu material.
| Material Model Parameter | Value |
|---|---|
| A | 1.23x10¹⁵/s |
| α | 0.023/MPa |
| n | 5.99 |
| Q | 225kJ/mol/K |
| R | 8.314J/mol/K |
Disclaimer/Publisher’s Note: The statements, opinions and data contained in all publications are solely those of the individual author(s) and contributor(s) and not of MDPI and/or the editor(s). MDPI and/or the editor(s) disclaim responsibility for any injury to people or property resulting from any ideas, methods, instructions or products referred to in the content. |
© 2024 by the authors. Licensee MDPI, Basel, Switzerland. This article is an open access article distributed under the terms and conditions of the Creative Commons Attribution (CC BY) license (http://creativecommons.org/licenses/by/4.0/).
Copyright: This open access article is published under a Creative Commons CC BY 4.0 license, which permit the free download, distribution, and reuse, provided that the author and preprint are cited in any reuse.


