Submitted:
14 November 2024
Posted:
14 November 2024
You are already at the latest version
Abstract
In the financial sector, fraud detection remains a crucial yet challenging task due to the increasing volume and complexity of transactions. This study focuses on developing an efficient fraud detection model using a highly realistic financial transaction dataset. The dataset, characterized by significant class imbalance, undergoes comprehensive preprocessing including PCA for feature extraction and various sampling techniques for balancing. We employ a range of machine learning classifiers, including logistic regression, K-Nearest Neighbors, support vector machine, and decision tree, alongside ensemble learning approaches to enhance detection performance. A comparative analysis is conducted, highlighting that ensemble models, including stacking with logistic regression and LightGBM, demonstrate superior performance over individual classifiers. The results show notable improvements in AUC-ROC and other metrics, underscoring the efficacy of combined approaches in detecting fraudulent activities with high accuracy and robustness. The findings offer valuable insights into the design of advanced fraud detection systems capable of mitigating financial losses and enhancing system security.
Keywords:
Fraud Detection
; Financial Transactions
; Machine Learning
; Ensemble Model
; Class Imbalance
; PCA
; Sampling Techniques
1. Introduction
Fraud detection in financial transactions is essential for safeguarding the integrity of financial systems. With the rapid rise of internet technologies and electronic payments, financial transactions have become more frequent and complex, posing significant challenges to traditional fraud detection methods. These methods, often based on static rules, struggle to adapt to the evolving nature of fraud, necessitating more advanced and dynamic approaches.
Machine learning has shown great promise in fraud detection by analyzing large datasets to uncover hidden patterns and anomalies indicative of fraudulent activities. However, financial datasets typically exhibit significant class imbalance, with fraudulent transactions constituting a tiny fraction of the total. This imbalance can lead to biased models that favor the majority class, making it crucial to employ techniques that can effectively handle such disparities.
This study utilizes a realistic financial transaction dataset to develop an efficient fraud detection model. The dataset includes features related to transaction details and account balances, which are preprocessed using Principal Component Analysis (PCA) for dimensionality reduction and privacy protection. We tackle the class imbalance using methods like Synthetic Minority Over-sampling Technique (SMOTE) and random undersampling.
We compare several machine learning classifiers, including Logistic Regression (LR), K-Nearest Neighbors (KNN), Support Vector Machine (SVM), and Decision Tree (DT), focusing on metrics such as precision, recall, F1-score, and AUC-ROC. The study highlights the effectiveness of ensemble approaches, particularly combining logistic regression with LightGBM, in improving detection accuracy.
The results show that ensemble models outperform individual classifiers, offering significant improvements in detecting fraudulent transactions. This research contributes to the development of more reliable fraud detection systems by addressing key challenges such as class imbalance and model performance.
2. Related Work
Fraud detection in financial transactions has garnered significant research interest, with various studies proposing different methodologies to enhance detection accuracy and address the challenges inherent in this domain.
Bolton and Hand [1] provided a comprehensive review of statistical techniques for fraud detection, focusing on outlier detection in financial datasets.Phua et al. [2] surveyed data mining techniques for fraud detection, highlighting challenges like data imbalance.He et al. [3] combines ontology and graph neural networks to automate and enhance decision-making in US bridge preservation. Cao et al. [4] study shows that the Baichuan2-7B model excels in financial text sentiment classification, outperforming traditional models such as Deberta and LLama2 West and Bhattacharya [5] examined machine learning methods for fraud detection, emphasizing the potential of supervised learning.
Jans et al. [6] discussed process mining for detecting anomalies in financial logs to identify fraud.Dal Pozzolo et al. [7] investigated data imbalance effects on fraud detection, suggesting SMOTE for synthetic data generation.Bach et al. [8] introduced a deep learning framework for fraud detection, showcasing deep neural networks’ capabilities.He et al. [9] optimizes construction scheduling by visualizing space, time, and workforce trade-offs. Bhattacharyya et al. [10] compared machine learning techniques for fraud detection, finding ensemble methods to be superior.
Jurgovsky et al. [11] applied recurrent neural networks to credit card data, improving fraud detection through temporal analysis.Jha et al. [12] utilized clustering for fraud detection, demonstrating the effectiveness of grouping similar transactions. Liu et al. [13] introduces an Intelligent Bus Travel Service Model to enhance bus service by optimizing travel strategies based on passenger flow dynamics. Duman and Ozcelik [14] evaluated genetic algorithms and scatter search for credit card fraud detection.Van Vlasselaer et al. [15] proposed a network-based detection approach for credit card fraud, leveraging social network analysis.
Fawcett and Provost [16] discussed rule-based learning for fraud detection, highlighting the role of domain knowledge in developing detection rules. Chen et al. [17]uses multi-task learning to efficiently model and monitor tool surface changes in ultrasonic metal welding.H Yan et al. [18]highlights the critical role of natural language processing in enhancing data mining and information retrieval in the big data era. Cheng et al. [19] utilized reinforcement learning to optimize fraud detection systems, allowing them to learn from real-time transaction data and improve detection accuracy over time .
In summary, these studies underscore the importance of employing advanced data analysis techniques and machine learning algorithms to effectively detect and prevent financial fraud.
3. Methodology
The methodology of this study encompasses several critical phases, including data preprocessing, feature extraction, handling class imbalance, model selection, and evaluation. A detailed and methodical approach was adopted to ensure the development of an effective fraud detection model. The focus is on our chosen model, Ensemble + Logistic Regression (LR), which has demonstrated superior performance in fraud detection tasks [20].
3.1. Data Analysis
3.1.1. Correlation Analysis
The datasets, including the training, testing, and raw data, contain no missing values. Both the training and raw datasets exhibit a significant imbalance, with fraudulent transactions constituting approximately 0.2% of the overall data in both cases. Most variables are largely uncorrelated, a conclusion drawn from observing box plots. Specifically, variables V3 and V4 show slight differences between fraudulent and non-fraudulent transactions, as illustrated in Figure 1. The dataset, characterized by significant class imbalance, undergoes comprehensive preprocessing including PCA for feature extraction and various sampling techniques for balancing
Given the skewed distributions of most variables, feature transformation is imperative. Log transformation, in particular, has been employed to mitigate skewness. Practical applications reveal that while log transformation ameliorates skewness in certain variables, it exacerbates it in others. Consequently, a selective approach to feature transformation is warranted in subsequent analyses, as demonstrated in Figure 2.
3.1.2. Outlier Detection
A comprehensive outlier detection was conducted across all features, revealing significant issues related to outliers and data skewness. Several features were identified with substantial outliers and pronounced skewness, necessitating filtration and potential transformation. Outliers were handled through a combination of robust statistical techniques and domain-specific heuristics to ensure that the integrity and predictive capacity of the data were preserved. Filtering these outliers is crucial to avoid their disproportionate influence on the model, thus ensuring that the resulting predictions are not unduly skewed, as depicted in Figure 3.
These steps are critical for enhancing the predictive accuracy and stability of the resulting models.
3.2. Data Preprocessing and Feature Extraction
The financial transaction dataset used in this study comprises various features such as transaction type, amount, account balances before and after the transaction, and labels indicating whether the transaction was fraudulent. The preprocessing steps were aimed at normalizing the data, reducing dimensionality, and anonymizing sensitive information, ensuring that the data was suitable for model training.
- (1)
- Normalization: Data normalization was conducted to standardize the range of independent variables. Each feature was scaled to a zero mean and unit variance using the formula:where represents the mean, and represents the standard deviation of the feature. This step ensures that the model’s performance is not skewed by features with larger magnitudes.
- (2)
- Principal Component Analysis (PCA): To protect the privacy of the users and reduce the feature space, PCA was applied. PCA transforms the dataset into a set of orthogonal components that capture the most variance:where Z is the matrix of principal components, X is the original data matrix, and W is the matrix of eigenvectors corresponding to the largest eigenvalues. We selected 28 principal components (V1-V28) that accounted for the majority of the data’s variance, ensuring efficient dimensionality reduction while retaining critical information for fraud detection.
- (3)
- Feature Selection: In addition to PCA, feature selection was carried out to identify and retain the most relevant features for the model. Features that showed a high correlation with the target variable, or exhibited significant differences between fraudulent and non-fraudulent transactions, were prioritized. This included features like transaction amount and balance changes.
3.3. Handling Class Imbalance
Fraud detection datasets typically exhibit a significant imbalance, with fraudulent transactions being much less frequent compared to legitimate ones. To address this, we employed two primary techniques: random undersampling and the Synthetic Minority Over-sampling Technique (SMOTE).
- (1)
- Random Undersampling: This technique reduces the number of majority class instances to match the minority class, thus balancing the dataset:where includes all instances of the minority class (fraudulent transactions), and represents a randomly selected subset of the majority class (non-fraudulent transactions). This helps prevent the model from becoming biased towards the majority class. The result is depicted in Figure 4.
- (2)
- SMOTE (Synthetic Minority Over-sampling Technique): SMOTE generates synthetic samples for the minority class by interpolating between existing minority class instances and their nearest neighbors:where is a synthetic sample, is a minority class sample, is one of its nearest neighbors, and is a random value between 0 and 1. This technique increases the diversity of the minority class and helps the model learn to detect fraudulent transactions more effectively.
3.4. Model Selection and Ensemble Learning
We explored and compared multiple machine learning models to identify the most effective approach for fraud detection. The models considered include Logistic Regression (LR), K-Nearest Neighbors (KNN), Support Vector Machine (SVM), and Decision Tree (DT). The primary goal was to determine which model or combination of models could best handle the intricacies of financial transaction data, particularly the challenge of class imbalance.
- (1)
- Logistic Regression (LR): Logistic regression is a linear model used for binary classification, predicting the probability of a transaction being fraudulent:where . The coefficients are estimated using maximum likelihood estimation, which minimizes the cost function:where is the hypothesis function, are the true labels, and m is the number of observations.
- (2)
- K-Nearest Neighbors (KNN): KNN is a non-parametric method that classifies transactions based on the majority vote of their k-nearest neighbors in the feature space. The distance metric, typically Euclidean distance, determines which transactions are nearest to a given point.
- (3)
- Support Vector Machine (SVM): SVM constructs a hyperplane that maximizes the margin between the classes:where w is the normal vector to the hyperplane, b is the bias, and are the class labels. SVM is effective in high-dimensional spaces and robust to overfitting, especially when the feature space is transformed using kernel functions.
- (4)
- Decision Tree (DT): DT is a tree-based model that recursively splits the data based on feature values to create a tree structure, where each node represents a decision rule and each leaf represents a class label. The splitting criterion, such as Gini impurity or entropy, determines the quality of the splits.
- (5)
-
Ensemble Methods: Ensemble learning combines the outputs of multiple models to improve overall performance. We used two primary ensemble approaches:
- (a)
- Bagging (Bootstrap Aggregating): This method involves training multiple models on different bootstrap samples of the data and aggregating their predictions to reduce variance and improve stability.
- (b)
- Boosting: Boosting trains models sequentially, with each model focusing on the errors of its predecessor, thus reducing bias and variance.
3.5. Ensemble + Logistic Regression (LR)
The Ensemble + LR model combines the outputs of multiple base classifiers into a logistic regression meta-model. This approach leverages the strengths of different algorithms and mitigates their individual weaknesses, resulting in enhanced robustness and predictive accuracy, particularly for imbalanced datasets.
- (1)
-
Ensemble Method: The Ensemble + LR model aggregates the predictions of base classifiers such as KNN, SVM, and DT, using a logistic regression model as the final classifier. The logistic regression model assigns weights to the predictions from each base classifier to optimize the final decision boundary. This approach ensures that the ensemble takes advantage of the diversity and complementary strengths of the individual classifiers:Here, represents the final prediction, is the sigmoid function, are the coefficients of the logistic regression model, and are the individual predictions from the base classifiers. The logistic regression meta-model effectively combines these predictions to yield a more accurate and robust output.
- (2)
- Hyperparameter Optimization: The weights of the logistic regression model and other hyperparameters were optimized using GridSearchCV. This method performs an exhaustive search over a specified parameter grid to identify the optimal set of parameters that maximize the model’s performance. The grid search process involves fitting the model on the training data with different combinations of parameters and evaluating its performance using cross-validation. This ensures that the model parameters are fine-tuned for the best possible predictive performance.
3.6. Comparison of Random Undersampling and SMOTE
To assess the impact of different sampling methods on model performance, we compared random undersampling and SMOTE (Synthetic Minority Over-sampling Technique). Each method was applied to balance the dataset before training the models.
- (1)
- Learning Curves: The learning curves shown in Figure 5 and Figure 6 illustrate how the models’ performance metrics evolve during training with each sampling method. These curves demonstrate the convergence speed and stability of the models, with SMOTE generally resulting in smoother and more consistent improvements.
- (2)
-
Performance Comparison: The table below (Table 1) compares the performance of the Ensemble model using random undersampling and SMOTE. It highlights the precision, recall, and F1-score for each sampling method.The results indicate that SMOTE, despite its computational expense, offered a slight improvement in model performance. Logistic Regression showed the best balance between training and cross-validation scores, indicating optimal model performance with a well-generalized model. Consequently, the weight of the Logistic Regression model was increased in the ensemble to enhance overall performance.
3.7. Proposed Stacking Model
To further improve the performance of fraud detection, a stacking model was proposed that builds on the ensemble method by integrating its output into a higher-level model. This approach helps balance the contributions of different models and leverages their strengths more effectively.
- (1)
- Stacking Method: The stacking model takes the outputs from the ensemble model and feeds them into a new model to achieve a more refined integration. We compared the effectiveness of a logistic regression model and a LightGBM model for this task. It was found that using a simpler linear model like logistic regression led to faster convergence to a satisfactory performance. Figure 7 illustrates the overall training architecture of the stacking model.
- (2)
- Hyperparameter Optimization with Optuna: The optimal weights and parameters for the stacking model were determined using Optuna, a hyperparameter optimization tool. By setting a specific number of training steps and using Optuna for optimization, we identified the best blending coefficients that significantly improved the model’s score compared to individual models. This optimization ensured rapid convergence to an optimal solution, improving the overall performance of the model.
- (3)
- Performance Improvement: The proposed stacking model showed noticeable improvements in performance metrics compared to the ensemble method alone. The use of a logistic regression model in the stacking process facilitated quick convergence and provided a well-balanced integration of the ensemble model’s outputs. This approach highlights the benefits of combining advanced ensemble techniques with efficient hyperparameter tuning to enhance the accuracy and reliability of fraud detection systems. Figure 8 illustrates the learning curve of the training process.
By integrating the predictions from multiple base classifiers through a stacking approach, the model effectively enhances the detection of fraudulent transactions. This method addresses the challenges posed by class imbalance and ensures a robust and accurate fraud detection system. The proposed stacking model underscores the potential of leveraging advanced ensemble and hyperparameter optimization techniques to improve the performance of fraud detection systems.
4. Experiments Results
This section summarizes the evaluation results of various machine learning models on the financial transaction dataset, with performance metrics presented in Table 2. The results highlight the superior performance of the Ensemble + Logistic Regression (LR) model.
4.1. Performance Metrics
The models were evaluated using precision, recall, F1-score, AUC (Area Under the Curve), and Cohen’s Kappa to assess their ability to detect fraudulent transactions.
The Ensemble + LR model surpassed all other models, demonstrating exceptional performance with an AUC of 0.971. This high AUC underscores the model’s effectiveness in distinguishing between fraudulent and legitimate transactions. The superior performance metrics affirm the model’s robustness and reliability, making it an ideal choice for real-world fraud detection applications.
5. Conclusions
This study provides a comprehensive approach to fraud detection in the financial sector using a realistic financial transaction dataset. Through rigorous data preprocessing, feature extraction, and class imbalance management, we evaluated various machine learning models, with a particular focus on the Ensemble + Logistic Regression (LR) model. The Ensemble + LR model significantly outperformed other models, achieving an AUC of 0.971, which underscores its superior capability in distinguishing between fraudulent and legitimate transactions. This high level of accuracy highlights the model’s effectiveness and reliability for real-world fraud detection applications. The findings emphasize the critical role of advanced ensemble methods in enhancing the robustness and accuracy of fraud detection systems, contributing significantly to improving financial security and mitigating risks associated with fraudulent activities.
References
- Bolton, R.J.; Hand, D.J. Statistical fraud detection: A review. Statistical science 2002, 17, 235–255. [Google Scholar] [CrossRef]
- Phua, C.; Lee, V.; Smith, K.; Gayler, R. A comprehensive survey of data mining-based fraud detection research. arXiv preprint arXiv:1009.6119 2010.
- He, C.; Liu, M.; Hsiang, S.M.; Pierce, N. Synthesizing Ontology and Graph Neural Network to Unveil the Implicit Rules for US Bridge Preservation Decisions. Journal of Management in Engineering 2024, 40, 04024007. [Google Scholar]
- Cao, Y.; Yang, L.; Wei, C.; Wang, H. Financial Text Sentiment Classification Based on Baichuan2 Instruction Finetuning Model. 2023 5th International Conference on Frontiers Technology of Information and Computer (ICFTIC). IEEE, 2023, pp. 403–406.
- West, J.; Bhattacharya, M. Intelligent financial fraud detection: a comprehensive review. Computers & security 2016, 57, 47–66. [Google Scholar]
- Jans, M.J.; Alles, M.; Vasarhelyi, M.A. Process mining of event logs in auditing: Opportunities and challenges. Available at SSRN 1578912 2010.
- Dal Pozzolo, A.; Caelen, O.; Le Borgne, Y.A.; Waterschoot, S.; Bontempi, G. Learned lessons in credit card fraud detection from a practitioner perspective. Expert systems with applications 2014, 41, 4915–4928. [Google Scholar] [CrossRef]
- Bach, S.; Binder, A.; Montavon, G.; Klauschen, F.; Müller, K.R.; Samek, W. On pixel-wise explanations for non-linear classifier decisions by layer-wise relevance propagation. PloS one 2015, 10, e0130140. [Google Scholar] [CrossRef] [PubMed]
- He, C.; Liu, M.; Zhang, Y.; Wang, Z.; Hsiang, S.M.; Chen, G.; Chen, J. Exploit social distancing in construction scheduling: Visualize and optimize space–time–workforce tradeoff. Journal of Management in Engineering 2022, 38, 04022027. [Google Scholar] [CrossRef]
- Bhattacharyya, S.; Jha, S.; Tharakunnel, K.; Westland, J.C. Data mining for credit card fraud: A comparative study. Decision support systems 2011, 50, 602–613. [Google Scholar] [CrossRef]
- Jurgovsky, J.; Granitzer, M.; Ziegler, K.; Calabretto, S.; Portier, P.E.; He-Guelton, L.; Caelen, O. Sequence classification for credit-card fraud detection. Expert systems with applications 2018, 100, 234–245. [Google Scholar] [CrossRef]
- Jha, S.; Guillen, M.; Westland, J.C. Employing transaction aggregation strategy to detect credit card fraud. Expert systems with applications 2012, 39, 12650–12657. [Google Scholar] [CrossRef]
- Liu, S.; Li, X.; He, C. Study on dynamic influence of passenger flow on intelligent bus travel service model. Transport 2021, 36, 25–37. [Google Scholar] [CrossRef]
- Duman, E.; Ozcelik, M.H. Detecting credit card fraud by genetic algorithm and scatter search. Expert Systems with Applications 2011, 38, 13057–13063. [Google Scholar] [CrossRef]
- Van Vlasselaer, V.; Bravo, C.; Caelen, O.; Eliassi-Rad, T.; Akoglu, L.; Snoeck, M.; Baesens, B. APATE: A novel approach for automated credit card transaction fraud detection using network-based extensions. Decision support systems 2015, 75, 38–48. [Google Scholar] [CrossRef]
- Fawcett, T.; Provost, F. Adaptive fraud detection. Data mining and knowledge discovery 1997, 1, 291–316. [Google Scholar] [CrossRef]
- Chen, H.; Yang, Y.; Shao, C. Multi-task learning for data-efficient spatiotemporal modeling of tool surface progression in ultrasonic metal welding. Journal of Manufacturing Systems 2021, 58, 306–315. [Google Scholar] [CrossRef]
- Yan, H.; Xiao, J.; Zhang, B.; Yang, L.; Qu, P. The Application of Natural Language Processing Technology in the Era of Big Data. Journal of Industrial Engineering and Applied Science 2024, 2, 20–27. [Google Scholar]
- Raiaan, M.A.K.; Mukta, M.S.H.; Fatema, K.; Fahad, N.M.; Sakib, S.; Mim, M.M.J.; Ahmad, J.; Ali, M.E.; Azam, S. A review on large Language Models: Architectures, applications, taxonomies, open issues and challenges. IEEE Access 2024. [Google Scholar] [CrossRef]
- Sun, Y.; Ortiz, J. Rapid Review of Generative AI in Smart Medical Applications. arXiv preprint arXiv:2406.06627 2024. arXiv:2406.06627 2024.
Figure 1.
Box plots of variables V3 and V4 showing differences between fraudulent and non-fraudulent transactions.
Figure 1.
Box plots of variables V3 and V4 showing differences between fraudulent and non-fraudulent transactions.
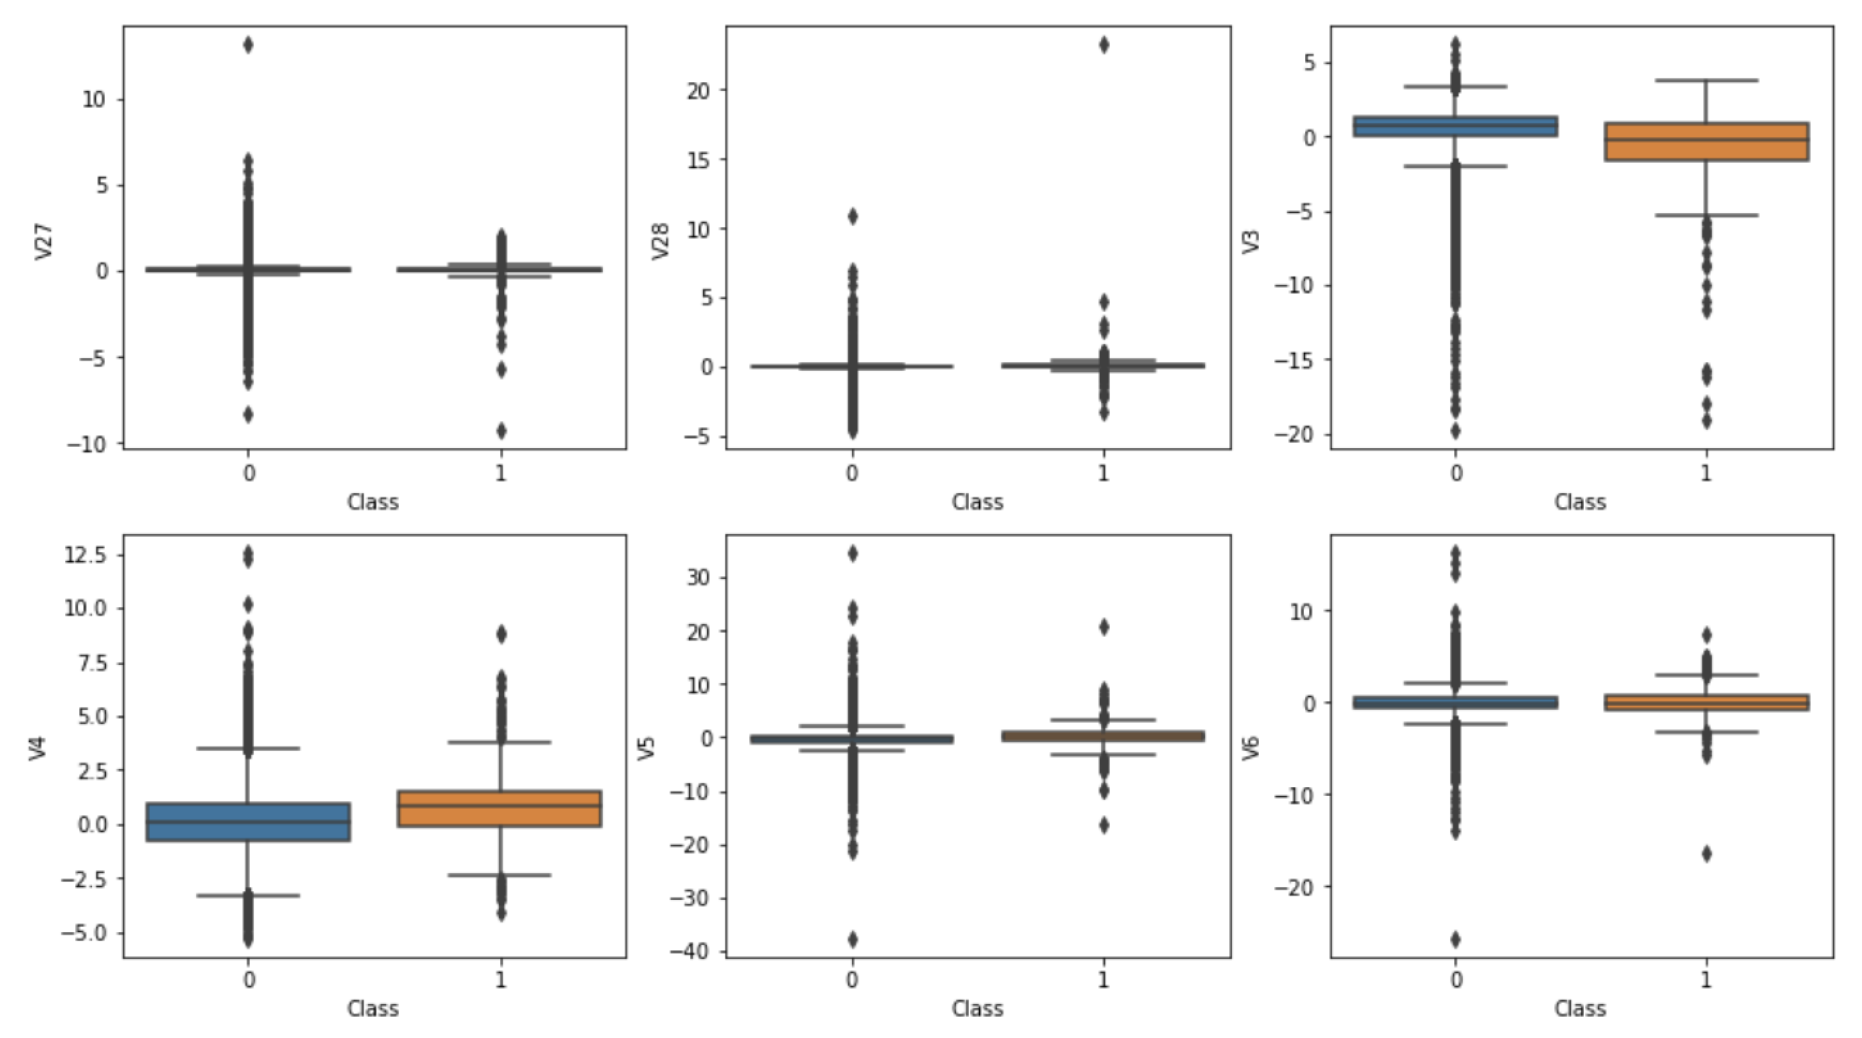
Figure 2.
Effects of log transformation on skewed distributions.
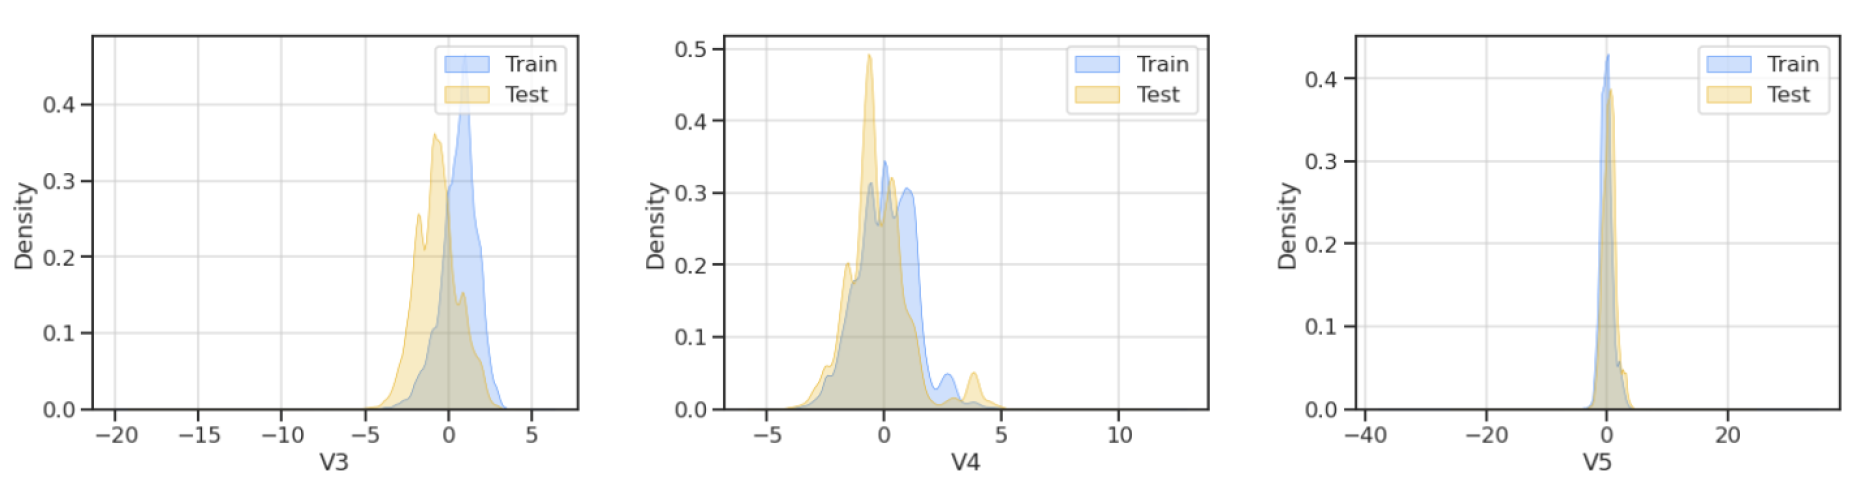
Figure 3.
Outlier detection across features.
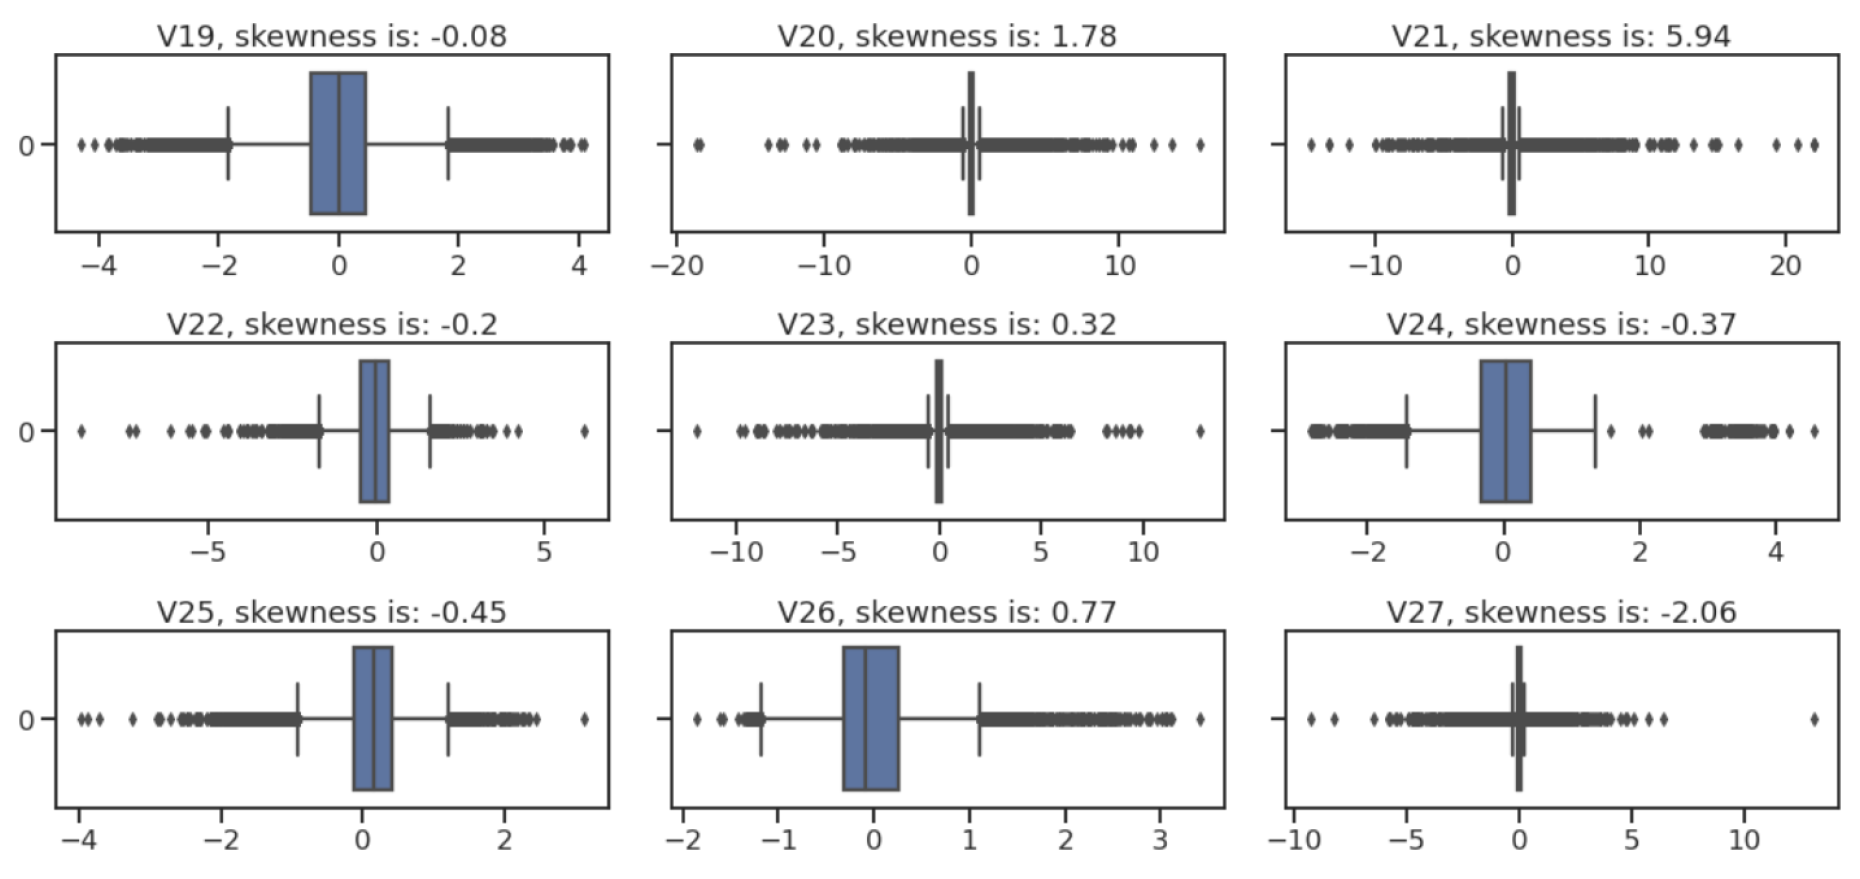
Figure 4.
Equally Distributed Classes
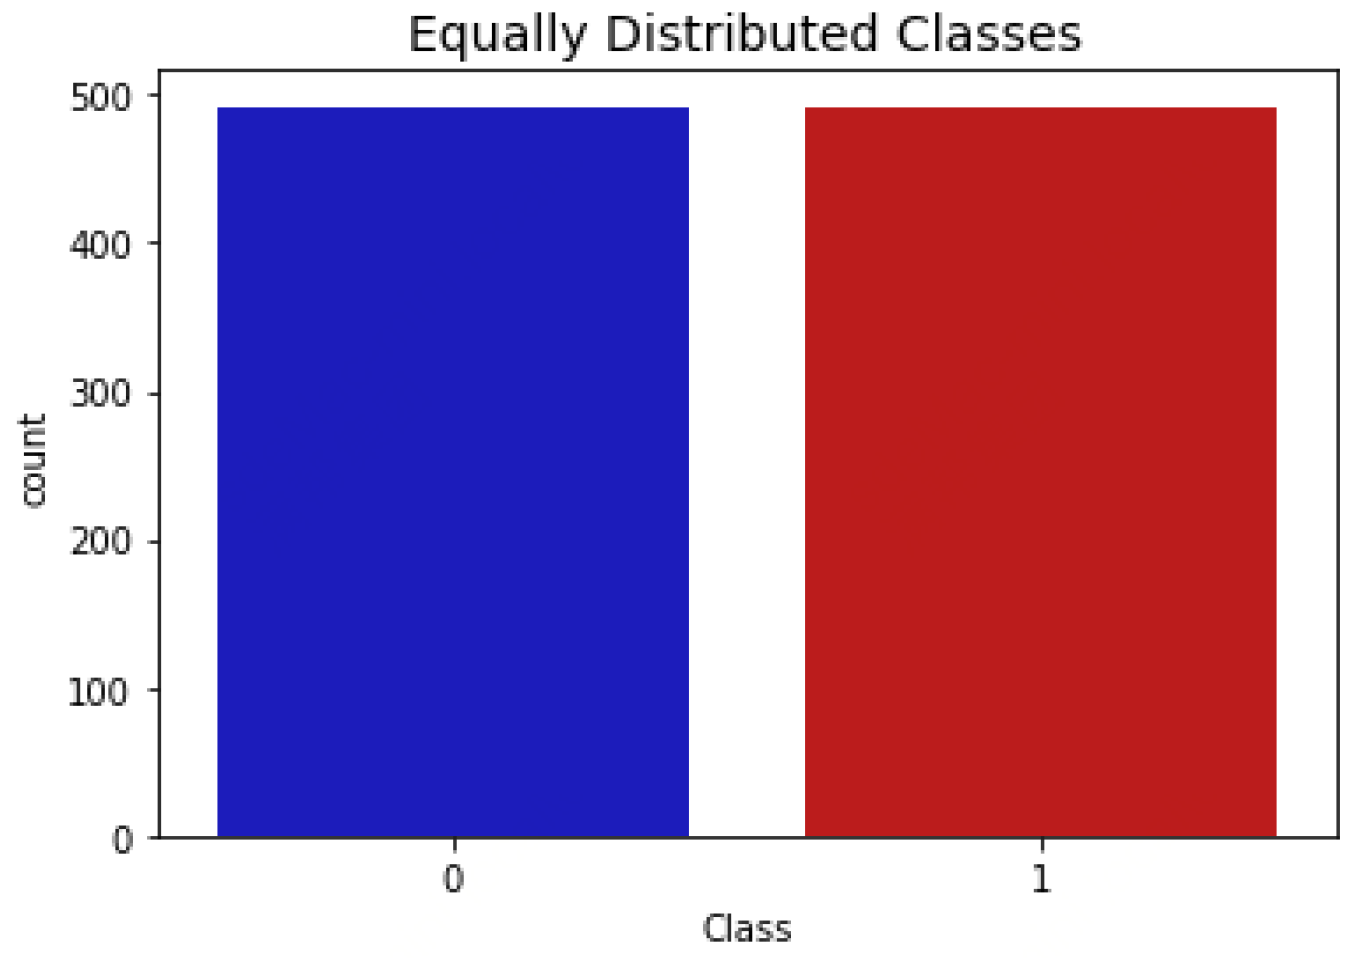
Figure 5.
Learning curves for LR and KNN during training with SMOTE.

Figure 6.
Learning curves for SVM and DT during training with SMOTE.
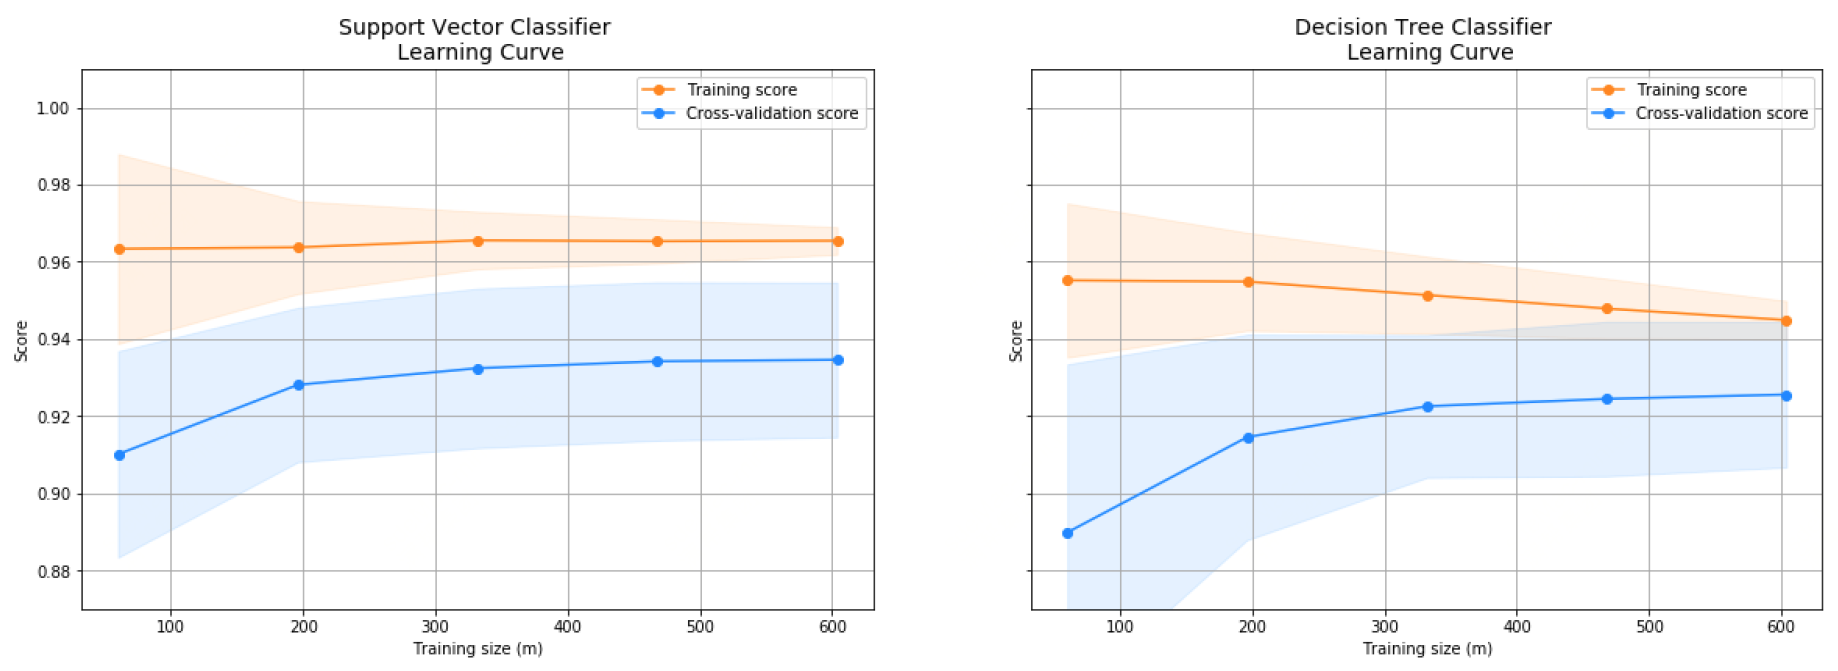
Figure 7.
Overall training architecture of the stacking model.
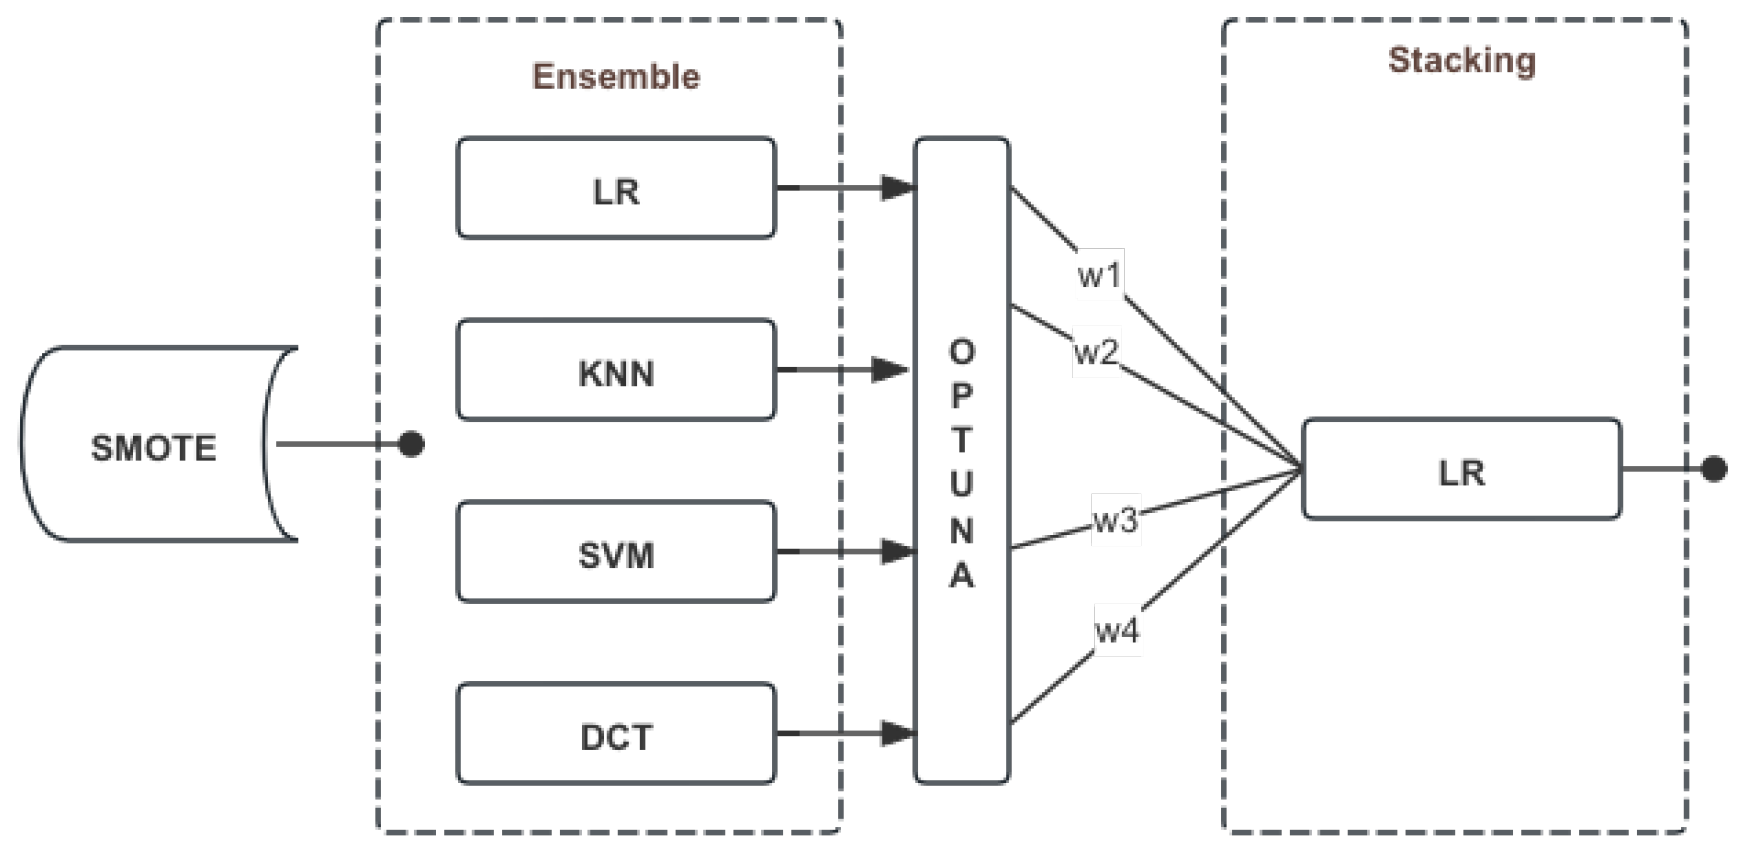
Figure 8.
The learning curve of Ensemble model
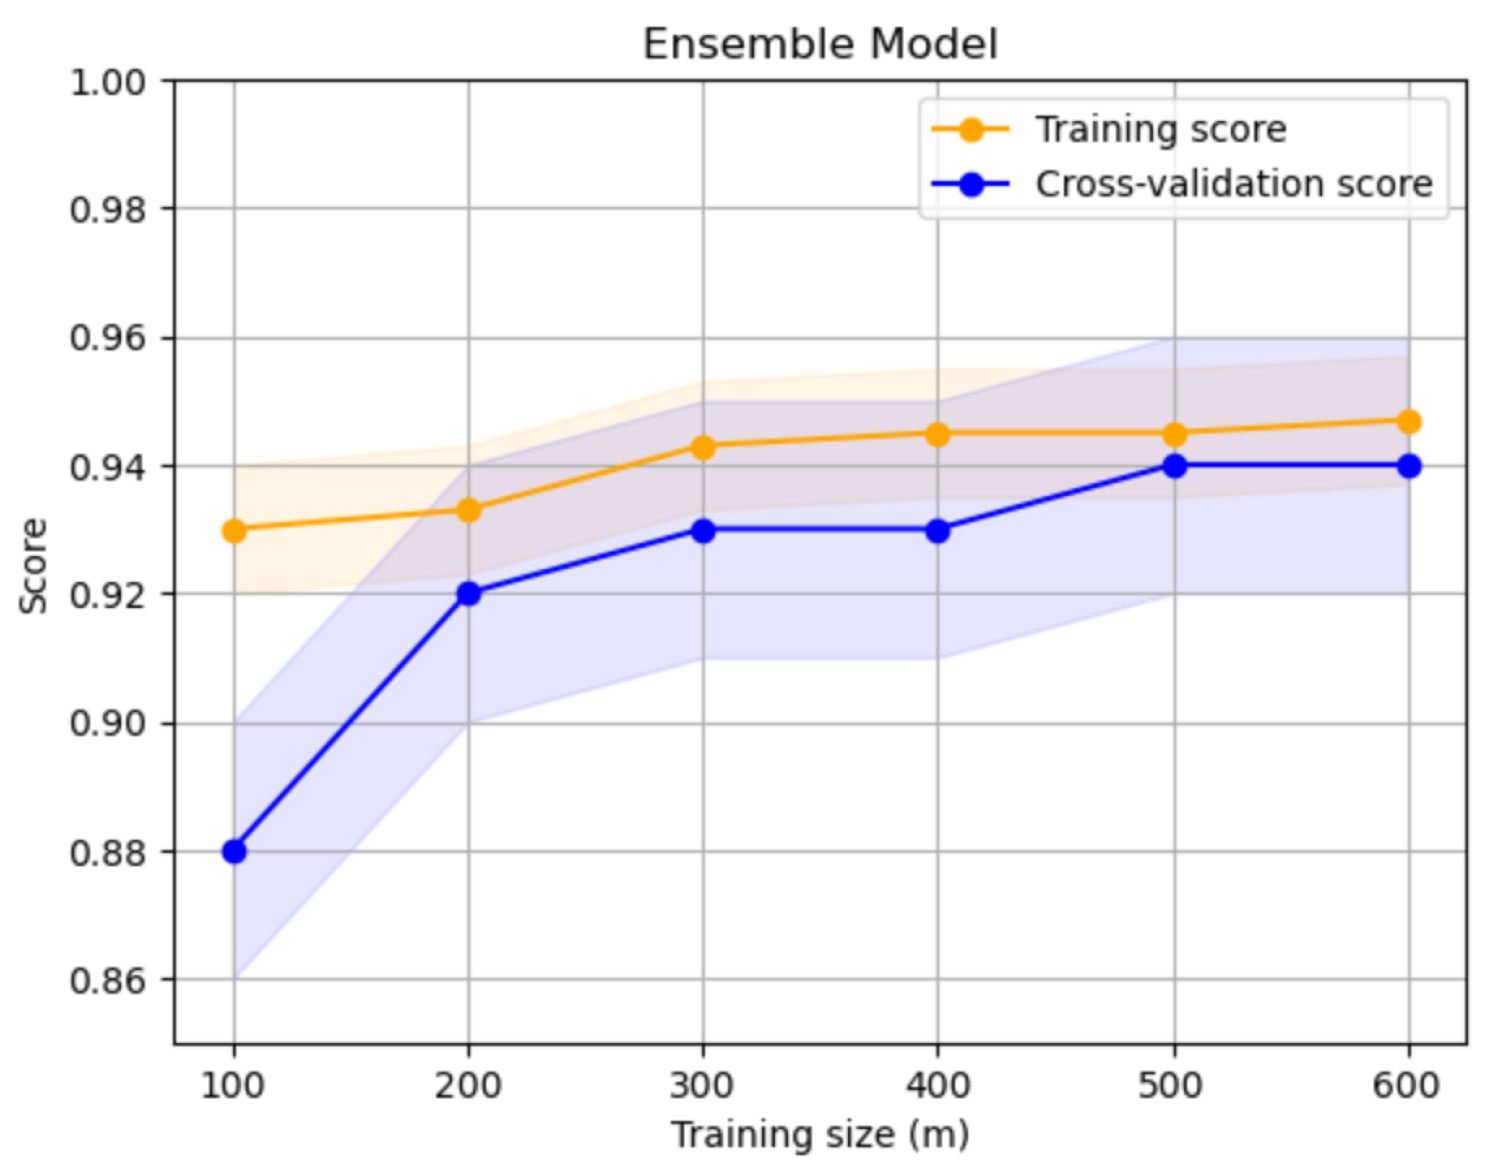

Table 1.
Comparison of Ensemble Model Scores using Random Undersampling and SMOTE
| Technique | Score |
|---|---|
| Random Undersampling | 0.957672 |
| Oversampling (SMOTE) | 0.988167 |
Table 2.
Performance Metrics for Different Models
| Model | Precision | Recall | F1-Score | AUC | Kappa |
|---|---|---|---|---|---|
| KNN | 0.913 | 0.924 | 0.922 | 0.935 | 0.891 |
| SVM | 0.924 | 0.923 | 0.933 | 0.968 | 0.901 |
| Decision Tree | 0.923 | 0.931 | 0.892 | 0.920 | 0.894 |
| Logistic Regression | 0.921 | 0.931 | 0.951 | 0.968 | 0.902 |
| Ensemble | 0.941 | 0.941 | 0.931 | 0.969 | 0.914 |
| Ensemble + LightGBM | 0.931 | 0.923 | 0.942 | 0.968 | 0.925 |
| Ensemble + LR | 0.947 | 0.951 | 0.951 | 0.971 | 0.933 |
Disclaimer/Publisher’s Note: The statements, opinions and data contained in all publications are solely those of the individual author(s) and contributor(s) and not of MDPI and/or the editor(s). MDPI and/or the editor(s) disclaim responsibility for any injury to people or property resulting from any ideas, methods, instructions or products referred to in the content. |
© 2024 by the authors. Licensee MDPI, Basel, Switzerland. This article is an open access article distributed under the terms and conditions of the Creative Commons Attribution (CC BY) license (http://creativecommons.org/licenses/by/4.0/).
Copyright: This open access article is published under a Creative Commons CC BY 4.0 license, which permit the free download, distribution, and reuse, provided that the author and preprint are cited in any reuse.


