
Submitted:
13 November 2024
Posted:
14 November 2024
You are already at the latest version
Abstract
This research aims to determine and improve accuracy of a water leakage detection model proposed in preliminary research. The poor results for water leakage sound (recall) and background noise (specificity) were clarified using countermeasures in accordance with each condition. Additionally, frequency amplification in the range of 500–600 Hz, attenuation of weak components, and a band-stop filter were used to remove the 50 Hz component and harmonics. Pre-processing was carried out in the form of amplification with weak noise removed using a band-stop filter. The results showed that application of the proposed model improved detection accuracy by 80% at observation points that initially had poor accuracy. Thus, the proposed method was effective in improving performance of the RP-CNN model in detecting leakage.
Keywords:
convolutional neural network
; noise reduction
; poor accuracy cases
; principal component analysis
; recurrence plot
; water leakage detection
1. Introduction
1.1. Background
The deteriorating state of urban infrastructure in Japan, including maintenance and upgrades, is estimated to cost huge amounts of money to rectify. Therefore, to address these challenges, Infrastructure Maintenance, Renewal, and Management Technology designated a national project by the Council for Science, Technology, and Innovation called the Strategic Innovation Promotion Program (SIP) FY 2014–2018. During the SIP, the authors participated in Research and Development of Sensing Data Collection, Transmission, and Processing Technology for Social Infrastructure (Underground Structures). It was reported that the water supply pipeline network facility had a total length of 18 times the circumference of the equator, covering approximately 70% of water supply assets worth 40 trillion yen. As the proportion of old pipe that exceeds its service life of 40 years increases, it becomes necessary to switch from conventional methods to the use of advanced technologies. In order to address the issue of water supply pipeline infrastructure, SIP conducted research on the development and placement of high-sensitivity sensor terminals to construct a leakage detection model based on field test data acquired in the cities of Kawasaki and Kitakyushu.
In accordance with the first stage of SIP results, a discrimination method integrating visualization and image recognition of sound data was designed. Further research was conducted on leakage discrimination based on the test data obtained in the field. Geometric visualization was performed to analyze the characteristics of leakage sounds depending on the strength of deterministic properties. This included the use of water leakage sounds, background noise (data measured when there is no leakage), and tests to determine whether the data were probabilistic [1]. Second, there was a focus on the differences in the deterministic properties of leakage sound time series data. Additionally, the acquired data were visualized on a two-dimensional plane using a recurrence plot (RP). The visualized images served as input data for machine learning used to fabricate a leakage discrimination model with a convolutional neural network (CNN) [2]. Third, the RP-CNN model was applied to the actual data to verify accuracy of leakage discrimination. An average accuracy of more than 80% was obtained, confirming effectiveness of the proposed combined RP-CNN method [3]. Meanwhile, accuracy of model assessment was improved by applying filter processing focusing on the frequency components of the acoustic data [4].
The results of leakage detection did not show improvement in some points even after pre-processing. This also led to the inability of BA (balanced accuracy), an indicator of accuracy in machine learning, to exceed 80% [4]. In addition, points 3-B and 4-B had less accurate results, leading to the need for discrete research conducted by water leakage investigators (five engineers with more than 10 years of experience in a water leakage detection company) using human hearing. Identifying the causes of inaccuracy at these points is a challenge that should be overcome by developing new technologies exceeding the level of conventional methods used by leakage investigators.
In this research, Section 1 focuses on the background to improving accuracy of the water leakage detection model previously proposed [4]. It also aims to identify and improve the causes of low accuracy. Additionally, this section reviews the latest trends in water leakage detection, clarifying the originality of the present research. Section 2 describes the acoustic data used during the analysis, including items and observation equipment. This also provides an overview of a RP-CNN model applied to water leakage detection. In Section 3, dimension reduction of acoustic data (features based on frequency components) is performed using principal component analysis (PCA). This visualizes the uniqueness of the points showing inaccuracy by positioning samples based on principal component scores. This section examines two types of inaccuracies – inaccuracy of results to leakage (recall) and background noise (specificity) – including considering improvement measures for each result. However, to improve recall, an amplification is specifically proposed within the frequency range of 500–600 Hz estimated as the characteristic range of water leakage sound, combined with weak frequency reduction. In order to improve specificity, the use of a band-stop filter is proposed to remove the frequency component of 50 Hz and respective harmonics considered as AC noise (noise from the electric current source), to improve specificity. Additionally, in this section, the pre-processing proposed in the previous section is applied (centered on the characteristics of leakage sound and removal of electric current noise in acoustic data). Leakage detection testing using the RP-CNN model is carried out, verifying the usefulness of this research. Finally, in Section 4, the conclusions are reported, along with future work to explore more effective ways to apply the proposed pre-processing method.
1.2. Literature Review
This section reviews certain previous research on water leakage detection conducted in recent years to show the latest trends. Asada et al. [5] proposed a water leakage detection method using transient test-based techniques (TTBTs). The method uses transient phenomena in pipes depending on optimization processes and characteristics of pressure wave propagation associated with reflection to detect leakage. Furthermore, it was successfully used to detect leakage in spiral pipe, as well as network connections with different diameters (pipe reducers). Pressure gauges were installed at pipe connection points, with operated valves at the bottom to detect leakage throughout the pipe network.
Meniconi et al. [6] used the TTBT approach to detect faults on long main transmission lines, which are difficult to inspect due to limited access. The analysis results indicated that this approach can reduce the adverse effects of changes in initial conditions and flow boundaries, allowing identification of issues in the system. However, only specific areas could be thoroughly eliminated, with two leaks detected with good precision. The system’s complexity, as a result of branching off the main pipeline and interactions with pressure waves during transients, complicated the implementation of TTBTs, as additional pressure waves produced by the branching must be identified [7,8]. The development of methods focusing on transient phenomena at pipe branches aims to expand leak detection to more complex systems [9,10,11].
Duan [12] investigated the effect of pipe joints on transient frequency response using numerical simulations in the frequency and time domains and the linear transfer matrix method. The results indicated that this method is more effective for detecting pipe leaks than measuring leaks. Kim et al. [13] and Kim [14] also conducted experiments on transient-based leak detection for multi-branch pipes.
Shirahata & Numazu [15] conducted research using several ensemble learning methods, including applying CNN on infrared images of rigid PVC pipe used for sewers and then compared the results. The verified results showed that the AdaBoost method had the highest F-value (0.75) and accuracy among the ensemble learning methods. Furthermore, the artificial neural network was the second highest-performing method, with accuracy of 0.72 and F-value of 0.73.
In recent years, research on water leakage detection focusing on the application of machine learning methods and IoT technology using sensor or camera data was introduced [16,17,18,19]. Quantitative data often used included hydraulic physics variables such as water pressure and flow in pipe. This also comprised acoustic data from sensors installed on pipe. In general, the purpose of using IoT communication technology was to monitor pipe networks. The machine learning methods adopted comprised feature extraction using PCA [20,21], ensemble learning [22,23], and CNN [24,25,26]. Specific research used deep learning such as CNN, and this method needs to be considered for developing leakage detection technology.
Hu et al. [27] classified various methods for detecting and determining leakage locations in water distribution systems into two categories: model and data-based methods. They also reviewed leakage detection methods. They stated that the weakness of model-based method was due to the lack of a calibrated hydraulic model used to distinguish water leakage. The discrimination results were also greatly influenced by model and measurement errors. The weakness of the data-based method was because it required a large amount of data to identify water leakage, and the detection results were greatly influenced by data shortages, abnormal values, and noise. Therefore, the preference for model or data-based methods depends on the amount of data obtained from the actual network and difficulty in developing a hydraulic model of the network in question. Tina et al. [28] proposed a leakage detection method combining pipe flow rate measurements using sensors and an Arduino system merged with IoT technology. The sensors were placed at the start and end points of the pipe, while the flow data obtained from the two were compared to detect leakage. This research verified leakage detection using the proposed method prototype. The results showed that assuming no difference in flow between the start and end points, then no leakage was detected.
Recent research on monitoring water distribution networks and leakage detection using IoT technology and hydraulic and deep learning model are important themes. Based on the literature review, our research focuses on two attributes that have not been adequately considered. First, this is centered on leakage detection methods when acoustic data are used for analysis. In previous research, data such as changes in water pressure, pipe vibrations, or infrared images were used for analysis or training. However, research on the use of acoustic data to detect leakage is lacking. This method was considered suitable for continuous monitoring of leakage in pipelines, due to the easy acquisition of acoustic data, and the conventional process adopted by water management companies, namely the survey procedure relying solely on human hearing.
Second, there is a focus on the usefulness of deep learning method in this context. This method is associated with the black box problem – the process of information generated that cannot be clearly understood. Therefore, research may be conducted without discerning the fundamental reasons behind the ability of deep learning to detect leakage. Ito et al. [4] explored the CNN model using a RP-CNN model, and reported that at certain points, detection accuracy was below 80%. However, the causes of this low accuracy were not properly investigated.
The present research analyzes past failure cases, by using PCA to reduce the dimensions of features based on frequency components and to investigate the causes of inaccuracy. The distinctiveness of points with low accuracy was visualized through a sample plot diagram obtained from the principal component scores. This method was used to address the earlier-mentioned problems, serving as a differentiating element from previous research. Additionally, our research refers to the results of the blind test conducted by leakage investigators using human hearing, particularly when evaluating statistical analysis and model accuracy. This increased the reliability of the results, providing original values not recorded in previous research.
2. Materials and Methods
2.1. Overview of Dataset
Acoustic data collection, focusing on water leakage sound and background noise in fields located in the Kanto region, was carried out using sensors. Additionally, the water leakage sound was recorded before carrying out repairs, and recording the background noise depended on reinstalling the sensors after repairs had been completed. Regarding background noise, other conditions remained the same except for the presence or absence of water leakage. When leakage occurred, a location was selected enabling the installation of sensors, such as gate valves, water control valves, or a fire hydrant, at the shortest distance. This ensured the sound label did not only contain noise. Sensors A and B installed at two locations closest to leakage point were used to collect both sounds. The measurement distance from each sensor to the leakage point differed, and there may also have been branches or bends in pipe from the location. Despite there being only one leakage point at each location, the sounds obtained from the two sensors differed. Leakage was detected using a correlation formula to compare the sound when it occurred and the background noise after repairs had been completed. The dataset focused on ductile iron pipe, because this research aimed to conduct a basic analysis of acoustic data recorded from such a pipe network.
Water leakage sound and background noise were recorded before and after repairs at the same location. The data about the existing conditions of leakage location were the same. This resulted in a quality dataset for machine learning, perceived as a significant advantage. Furthermore, acoustic data obtained at five leakage locations using 10 observation points, were used. When leakage occurred at a particular location, the sound data were collected at two points: sensors A and B. Therefore, the acoustic data were symbolized in pairs as {1-A | 1-B},..., {5-A | 5-B}, with a sampling frequency of 10,000 Hz. Frequency components greater than 5,000 Hz (Nyquist frequency) could not be reproduced accurately due to aliasing effects, leading to exclusion from the data analysis. The information about 10 acoustic data used as the research object are shown in Table 1, including leakage volume (L/min), measurement distance (m), sensor installation location (m), causes of leakage, water pressure (MPa), pipe diameter (mm), and soil cover (mm). The results of the blind test conducted by leakage investigators using the acoustic data are shown in Table 2.
2.2. Overview of Water Leakage Determination Based on RP-CNN Model
A RP-CNN model was adopted to determine leakage, using the CNN, a type of deep learning method. This was also applied using the representation of recorded water leakage sound and background noise (RP) data for learning and assessment (Figure 1). Leakage was distinguished using the deterministic nature of the difference between the leak sound and background noise [1]. The discrimination accuracy of the RP-CNN model was previously verified [3,4], which showed it could distinguish between leakage sound and background noise with an accuracy rate of approximately 80% in some locations.
The learning and assessment datasets are crucial when using a machine learning method. However, previous research [4] focused on evaluating the generalization performance using learning data from several locations (besides assessment data) in a 9-point model (Figure 2). The present research concentrated on investigating the causes of less accurate cases (points 3-B and 4-B) and the improvement process. In order to verify the effectiveness of feature amplification and the use of band-stop filters to eliminate AC frequency interference (pre-processing), a 10-point model was adopted with the assessment data applied to the learning process. Therefore, the difficulty in determining leakage sound and background noise observed at various locations, including the possibility of assessment errors, were evaluated using a general model.
3. Results and Discussion
3.1. PCA Application Method
Principal component analysis is a statistical method that reduces multidimensional data to a low-dimensional space without losing important information. It is often used for dimension reduction and visualization in data evaluation. According to the Scikit-Learn Data Analysis Implementation Handbook (Shuwa System), the main purposes of dimensionality reduction are data compression and data visualization. This is provided by algorithms such as PCA, feature selection, and non-negative matrix factorization. Additionally, PCA has been previously used to investigate the causes of low accuracy at several locations [4,29]. The implementation of dimension reduction and visualization comprised two stages:
Stage 1 Application of Fast Fourier Transform (FFT) (data dimension reduction)
Based on previous research, the effective frequency range for detecting leakage in ductile iron pipe is less than 1,500 Hz [30]. Our research focused on 153 frequency components of approximately 1,500 Hz obtained from FFT. For data grouping, the frequency components were divided into 15 categories (<100 Hz, <200 Hz, ..., <1400 Hz, <1500 Hz), with each represented by a mean value. In this process, the data were converted into 15 dimensions. The implementation of this method ensured the number of variables (n = 15) used in the PCA did not exceed the number of samples (n = 20).
Stage 2 Application of PCA (dimension reduction and visualization)
Considering the 15-dimensional data (FFT), PCA was used to obtain the first (PC1) and second (PC2) principal components. We then positioned the samples according to the PC1 and PC2 scores to classify locations with (10 locations) and without leakage (10 locations). In the PCA stage, the data were also re-standardized by centralizing (making the mean value 0) and scaling (making the standard deviation 1). This analysis was performed using version 4.3.2 of Windows software.
3.2. Sample Position Results Based on PCA Scores
A box plot diagram was generated using 15-dimensional data to distinguish between water leakage sound and background noise. The median value for water leakage reached a peak within the frequency range of variables X4–X6. Meanwhile, background noise reached a peak at variable X1, gradually decreasing in the higher frequency range (Figure 3). This implied that the average characteristic pattern between the two differed.
The results of the sample position in accordance with the principal component scores are shown in Figure 4. The contributions of PC1 and PC2 were 0.696 and 0.150, respectively. The focus on leakage sound denoted by ● in Figure 4 implied that it was mostly distributed in the positive direction on PC1 (horizontal axis). However, the background noise denoted by ▲ was mostly distributed in the negative direction on PC1 (horizontal axis). Leakage sound in samples 3-B and 4-B was not located in the zone where the other points were distributed but was projected into the area occupied by the background noise. Compared to the results of the blind test (Table 2), the sound in samples 3-B and 4-B were consistently disregarded. The low accuracy in samples 3-B and 4-B in the RP-CNN model was caused by low recall and specificity outcomes for leakage sound and background noise, respectively. This suggested that there may be a problem with the acoustic data of leakage sound (recall). The acquired sound characteristics were distorted by certain influences resembling background noise. This made assessment difficult for both the RP-CNN model and the investigators. Additionally, both leakage sound and background noise from the same location were detected on the right and left sides of the PC1 axis, respectively. In sample 4-B with low accuracy, the left–right relationship on the PC1 axis was maintained, but in 3-B, leakage sound and background noise were on the left and right sides, respectively. Aside from the left–right inversion pattern, a characteristic of sample 3-B was a short distance between leakage sound and background noise compared to other samples.
3.3. Pre-Processing for Emphasizing Leakage Sound and Eliminating Background Noise
Section 3.2 showed that the possible causes of low accuracy at points 3-B and 4-B was the interference in acoustic data. Recording and transmission were carried out using acoustics by altering the frequency characteristics, while considering distortion and noise. An acoustic device (an equalizer) was used to improve sound quality and reduce certain frequencies, thereby overcoming the problem of noise, howling, or excessive echo.
Water leakage sound is similar to background noise because its unique characteristics do not fully reach the recording point (sensor). This causes the characteristics that should be present in leakage sound data to be weakened. In such cases, it becomes necessary to focus on emphasizing leakage sound characteristics. Therefore, to improve accuracy of sound detection on data with such problems, a pre-processing method that concentrates or reduces certain frequency bands was considered an effective countermeasure.
A typical example of the FFT spectrum compares leakage sound and the background noise at point 1-B (Figure 5). This showed that the sound spectrum had a peak in the relatively high-frequency region, greater than 500 Hz. For the background noise, the frequency region greater than 500 Hz showed a flat pattern without peaks. This pattern was observed at other locations, including 1-B. The box plot of data transformed into 15 dimensions showed that leakage sound had a peak of approximately 500 Hz (Figure 3).
Considering this result, further analysis assumed the frequency region that characterized leakage sound was within 500–600 Hz, leading to the application of an amplification process. However, not all frequency components within 500–600 Hz were amplified. Amplification was performed only when the absolute value of the Fourier transform result, |X(k)|, exceeded 5.5 (with k as the frequency value), to reduce the influence on background noise. Additionally, for sound to reach ideal conditions, it is important to increase and reduce necessary and unnecessary sound, respectively. A reduction can also be performed to eliminate weak noise, aside from amplifying certain frequencies. Therefore, frequencies with |X(k)| > 0.9 were also reduced in this process.
The present research also concentrated on the eradication of sounds similar to water leaks (pseudo-leak sounds), such as transformer sound, by adopting a method of eliminating 50 and 60 Hz frequency components including respective harmonics using a band-stop filter. This also aimed to reduce errors in identifying acoustic data affected by transformer sound, thereby increasing specificity.
Figure 6 shows an example of changes in RP of leakage sound at point 4-B (from 2000 to 2002) after the amplification process, where a honeycomb pattern was observed. These results implied that by amplifying the frequency components of 500–600 Hz, the typical leakage sound at point 4-B was successfully acquired.
The dimension reduction and data visualization methods with PCA used in Section 3.2 were applied to verify the effect of pre-processing. The outcome before and after the application of the process was compared (Figure 7). Adjustments are made by amplifying and reducing frequency components with |X(k)| > 5.5 and |X(k)| < 0.9, respectively. Meanwhile, this amplification and reduction improved leakage sound and background noise. Similar peak changes were obtained when assuming that the background noise within the frequency range of 500–600 Hz had the same characteristics as leakage sound. The slope pattern of the 15-dimensional data implied that these frequencies did not show changes as observed in leakage sound. Therefore, the assumption that the typical region of leakage sound was within 500–600 Hz, including the decision to target this frequency range for the amplification process, can be considered appropriate.
3.4. Water Leakage Determination Test Using RP-CNN Model
This research examined the effect of the proposed pre-processing: (1) strengthening the frequency components within 500–600 Hz only for |X(k)| > 5.5 (prominence in the characteristics of typical leakage sound); (2) removing frequency components with |X(k)| < 0.9 (weak noise reduction); and (3) using a band-stop filter to eliminate the 50 Hz frequency and respective harmonics (AC noise removal). These three pre-processing methods were verified in the present research. Specifically, two types of datasets (with and without pre-processing) were acquired and accuracy of RP-CNN model compared after usage. The testing data differed from the training data used to build the model. The setting values of RP-CNN model follow: interval 0.016 seconds, size 64, LPF 4000 Hz, and batch size 16. In terms of determining the number of epochs, the model with the highest accuracy on the testing data was adopted as the best (epoch = 10). It is generally recommended to treat validation data and training data separately. Validation data are used to adjust hyperparameters, such as batch size, when building the model.
The results after applying the RP-CNN model on the three methods are shown in Table 3. Initially, the results for without pre-processing showed that recall for 3-B and 4-B was 0%. Furthermore, for 3-B and 4-B, the RP-CNN model considered leakage sound as background noise, resulting in a recall of 0%. These results are in accordance with previous research [4] and the positioning performed using principal component scores. However, the results with pre-processing showed that recall for 3-B and 4-B increased to 64.4% and 81.4%, respectively. This suggested improvement due to application of pre-processing. Although the increase in recall accuracy was confirmed in all cases, a negative aspect (adverse impact of applying pre-processing, i.e., a decrease in specificity) was observed in five out of every 10 cases. The issue was observed in 1-B, where specificity decreased by more than 20%. Despite the improved recall for the expected results, the problem of specificity remained.
Recall for 3-B was lower than for other points and the limitations proven by the pre-processing effect. The PCA showed that 3-B tended to have unique acoustic data and a pattern differing from the other points, with the leakage sound and background noise on the left and right sides of the PC1 axis, respectively. Further data collection and accumulation are required, irrespective of whether the data are unique or there are similar cases. This research needs further in-depth observation, considering implementation in the real world.
4. Conclusions
This research investigated the causes of inaccurate cases associated with leakage determination using RP-CNN to gain insights that improved the generalization performance of the model. A basic analysis of leakage sound and background noise was conducted in water pipe, while performing visualized acoustic data using FFT and RP, as well as the evaluating the results. Additionally, a pre-processing method was proposed for acoustic data, including RP pattern changes. Accuracy of leakage detection using the RP-CNN model was studied. The results from this research follow:
- (1)
- The frequency components obtained from the FFT to 1,500 Hz showed that the data obtained were converted into 15 dimensions, leading to PCA. The results from the sample classification using the PC1 and PC2 scores showed that leakage sound at points 3-B and 4-B was in an area occupied by a lot of background noise. This was consistent with the blind test conducted by leakage investigators, in which the sound at points 3-B and 4-B could not be identified.
- (2)
- Based on the differences in the FFT spectrum, an amplification process was applied within the frequency range of 500–600 Hz for water leakage sound. After its application, a new honeycomb pattern was found in RP at the problematic location. This showed that the amplification process within this range effectively focused on the characteristics of leakage sound.
- (3)
- To test the effectiveness of the proposed pre-processing method, two datasets were obtained (with and without pre-processing), followed by comparing accuracy of the RP-CNN model. The results without pre-processing showed recall for points 3-B and 4-B of 0%, while after pre-processing application, these increased to 64.4% and 81.4%, respectively. This implied improvement in recall with application of pre-processing.
The present research focused on the frequency components of 500–600 Hz. The amplification process confirmed a honeycomb pattern in leakage sound RP at the problematic location. However, the location of frequency components that best reflected the characteristics of leakage sound was not completely clear. Sensitivity analysis in the future should change the amplified frequency components while drawing RP and identifying those containing the most characteristics of leakage sound. This was crucial in exploring more effective ways of applying the proposed pre-processing method.
Author Contributions
Conceptualization, M.A.C., T.S., and Y.A.; methodology, M.A.C., and Y.A.; software, T.S.; validation, M.A.C., and Y.A.; formal analysis, M.A.C. and T.S.; investigation, M.A.C.; resources, M.A.C. and X.D.; data curation, M.A.C. and T.S.; writing—original draft preparation, M.A.C. and Y.A.; writing—review and editing, M.A.C.; visualization, M.A.C; supervision, Y.A., T.K., and A.K.; project administration, Y.A.; funding acquisition, Y.A.. All authors have read and agreed to the published version of the manuscript.
Funding
This research was funded by JSPS KAKENHI, grant number JP22K0427 and the Tokyo Metropolitan Government Advanced Research Program (R4-2).
Data Availability Statement
The raw data supporting of this research will be made available from the authors on request.
Acknowledgments
The first author is grateful to the Tokyo Human Resources Fund (THRF) for the financial support during his graduate school duration encompassing this research study.
Conflicts of Interest
The authors declare no conflicts of interest.
Abbreviations
| SIP | strategic innovation promotion program |
| RP | recurrence plot |
| CNN | convolutional neural network |
| BA | balanced accuracy |
| PCA | principal component analysis |
| TTBTs | transient test-based techniques |
| FFT | fast Fourier transform |
References
- Nam, Y.; Fujimoto, Y.; Arai, Y.; Kunizane, T.; Koizumi, A. Water Pipe Leak Detection Based on Deterministic Properties of Time Series Data. Journal of Japan Society of Civil Engineers, Ser. G. 2019, Vol. 75, No. 6, pp. II 219–II 230, . [CrossRef]
- Nam, Y.; Arai, Y.; Kunizane, T.; Koizumi, A. Developing of Water Leakage Discrimination Model using Recurrence Plot and Convolutional Neural Network. Journal of Japan Society of Civil Engineers, Ser. G. 2020, Vol. 76, o. 6, pp. II 273–II 284, . [CrossRef]
- Shimada, M.; Arai, Y.; Kunizane, T.; Koizumi, A. Evaluation of the Water Leakage Detection Model by Training Multiple Water Leakage Sounds. Journal of Japan Society of Civil Engineers, Ser. G. 2022, Vol. 78, No. 6, pp. II 141–II 152, . [CrossRef]
- Ito, K.; Arai, Y.; Caronge, M.A.; Kunizane, T.; Koizumi, A. Improving the Generalization Performance of Water Leakage Detection Model by Noise Reduction Using Pseudo Sounds. Journal of Japan Society of Civil Engineers 2023, Vol. 79, No. 26, p. 23-26009.
- Asada, Y.; Kimura, M.; Azechi, I.; Iida, T. Leak Detection Using Transient Pressure Waves in Pipelines with Multiple Leaks and Characteristic Structure. Journal of Japan Society of Civil Engineers, Ser. B1. 2020, Vol. 76, No. 2, pp. I 937–I 942, . [CrossRef]
- Meniconi, S.; Capponi, C.; Frisinghelli, M.; Brunone B. Leak Detection in a Real Transmission Main Through Transient Tests: Deeds and Misdeeds. Water Resources Research 2021, Vol. 57, No. 3, p. e2020WR027838. [CrossRef]
- Duan, H.F.; Lee, P.J.; Ghidaoui, M.S.; Tuck, J. Transient wave blockage interaction and extended blockage detection in elastic water pipelines. Journal of Fluids and Structures 2014, Vol. 46, pp. 2–16, . [CrossRef]
- Duan, H.F.; Lee, P.J. Transient-based frequency domain method for dead-end side branch detection in reservoir-pipeline-valve system. Journal of Hydraulic Engineering 2016, Vol. 142, No. 2, . [CrossRef]
- Ayati, A.H.; Haghighi, A.; Lee, P. Statistical Review of Major Standpoints in Hydraulic Transient-Based Leak Detection. Journal of Hydraulic Structures 2019, Vol. 5, No. 1, pp. 1–26, . [CrossRef]
- Ferrante, M.; Brunone, B. Leak detection in branched pipe systems coupling wavelet analysis and a Lagrangian model. Aqua 2009, Vol. 58, No. 2, pp. 95–106, . [CrossRef]
- Haghighi, A.; Covas, D.; Ramos, H. Direct backward transient analysis for leak detection in pressurized pipelines: from theory to real application. Aqua 2012, Vol. 61, No. 3, pp. 189–200, . [CrossRef]
- Duan, H.F. Transient frequency response-based leak detection in water supply pipeline systems with branched and looped junctions. Journal of Hydroinformatics 2017, Vol. 19, No. 1, pp. 17–30, . [CrossRef]
- Kim, S.H.; Zecchin, A.; Choi, L. Diagnosis of a Pipeline System for Transient Flow in Low Reynolds Number with Impedance Method. Journal of Hydraulic Engineering 2014, Vol. 140, No. 12, . [CrossRef]
- Kim, S.H. Multiple Leak Detection Algorithm for Pipe Network. Mechanical Systems and Signal Processing 2020, Vol. 139, p. 106645, . [CrossRef]
- Shirahata, H.; Numadu R. Application of Machine Learning for Detection of Leakage in Drain Pipes by Infrared Camera. Journal of AI Data Science 2022, Vol. 3, No. J2, pp. 223–230, . [CrossRef]
- Gama-Moreno, L.A.; Corralejo, A.; Molina, A.R.; Rangel-Torres, J.A.; Hernandez, C.M.; Juarez, M.A. A Design of a Water Tanks Monitoring System Based on Mobile Devices. In: 2016 International Conference on Mechatronics, Electronics and Automotive Engineering (ICMEAE), Cuernavaca, Mexico, 22-25 November 2016, pp. 133–138, . [CrossRef]
- Chan, T.K.; Chin, C.S.; Zhong, X. Review of Current Technologies and Proposed Intelligent Methodologies for Water Distributed Network Leakage Detection. IEEE Access 2018, Vol. 6, pp. 78846–78867, . [CrossRef]
- Guatam, J.; Chakrabarti, A.; Agarwal, S.; Singh, A.; Gupta, S.; Singh, J. Monitoring and Forecasting Water Consumption and Detecting Leakage Using an IoT System. Journal of Water Supply 2020, Vol. 20, No. 3, pp. 1103–1113, . [CrossRef]
- Ayamga, M.A. An IoT-Based Water Leakage Detection and Localization System. Asian Journal of Research in Computer Science 2024, Vol. 17, No. 3, pp. 1–14, http://dx.doi.org/10.9734/AJRCOS/2024/v17i3421.
- Zhuo, M.; Zhang, Q.; Liu, Y.; Sun, X.; Cai, Y.; Pan, H. An Integration Method Using Kernel Principal Component Analysis and Cascade Support Vector Data Description for Pipeline Leak Detection with Multiple Operating Modes. Processes 2019b, Vol. 7, No. 10, pp. 648–665, . [CrossRef]
- Hashim, H.; Ryan, P.; Clifford, E. A Statistically Based Fault Detection and Diagnosis Approach for Non-residential Building Water Distribution Systems. Advanced Engineering Informatics 2020, Vol. 46, pp. 101187, . [CrossRef]
- Ravichandran, T.; Gavahi, K.; Ponnambalam, K.; Burtea, V.; Mousavi, S.J. Ensemble-based Machine Learning Approach for Improved Leak Detection in Water Mains. Journal of Hydroinformatics 2021, Vol. 23 No. 2, pp. 307–323, . [CrossRef]
- Shi, M.; Deng, L.; Yang, B.; Qin, L.; Gu, L. Research on Internal Leakage Detection of the Ball Valves Based on Stacking Ensemble Learning. Measurement Science and Technology 2024, Vol. 35, No. 9, pp. 095109, . [CrossRef]
- Kang, J.; Park, Y.J.; Lee, J.; Wang, S.H.; Eom, D.S. Novel Leakage Detection by Ensemble CNN-SVM and Graph-based Localization in Water Distribution Systems. IEEE Transactions on Industrial Electronics 2018, Vol. 65, No. 5, pp. 4279–4289, . [CrossRef]
- Javadiha, M.; Blesa, J.; Soldevila, A.; Puig, V. Leak Localization in Water Distribution Networks Using Deep Learning. 6th International Conference on Control, Decision and Information Technologies, Paris, France, 23-26 April 2019, pp. 1426–1431, . [CrossRef]
- Cody, R.A.; Tolson, B.A.; Orchard, J. Detecting Leaks in Water Distribution Pipes Using a Deep Autoencoder and Hydroacoustic Spectrograms. Journal of Computing in Civil Engineering 2020b, Vol. 34, No. 2, pp. 1–8, . [CrossRef]
- Hu, Z.; Chen, B.; Chen, W.; Tan, D.; Shen, D. Review of Model-based and Data-driven Approaches for Leak Detection and Location in Water Distribution Systems. Water Supply 2021, Vol. 21, No. 7, pp. 3282–3306, . [CrossRef]
- Tina, J.S.; Kateule, B.B.; Luwemba, G.W. Water Leakage Detection System Using Arduino. European Journal of Information Technologies and Computer Science 2022, Vol. 2, No. 1, pp.1-4, . [CrossRef]
- Kottegoda, N.T.; Rosso, R. Statistics, Probability and Reliability for Civil and Environmental Engineers, McGraw-Hill International Editions, Civil Engineering Series, Singapore 1998; pp. 388–393.
- Kawamura, W.; Arai, Y.; Koizumi, A.; Inakazu, T.; Yokokawa, K.; Kaji, K.; Suzuki, K.; Ariyoshi, H.; Moriyama, S. An Analysis of Pipeline Sensing Data Use for Detecting Water Leakage. Journal of Japan Society of Civil Engineers, Ser. G. 2016, Vol. 72, No. 6, pp. 187–194, . [CrossRef]
Figure 1.
Flowchart of water leakage-determination using RP-CNN model. for 9- and 10-point models.
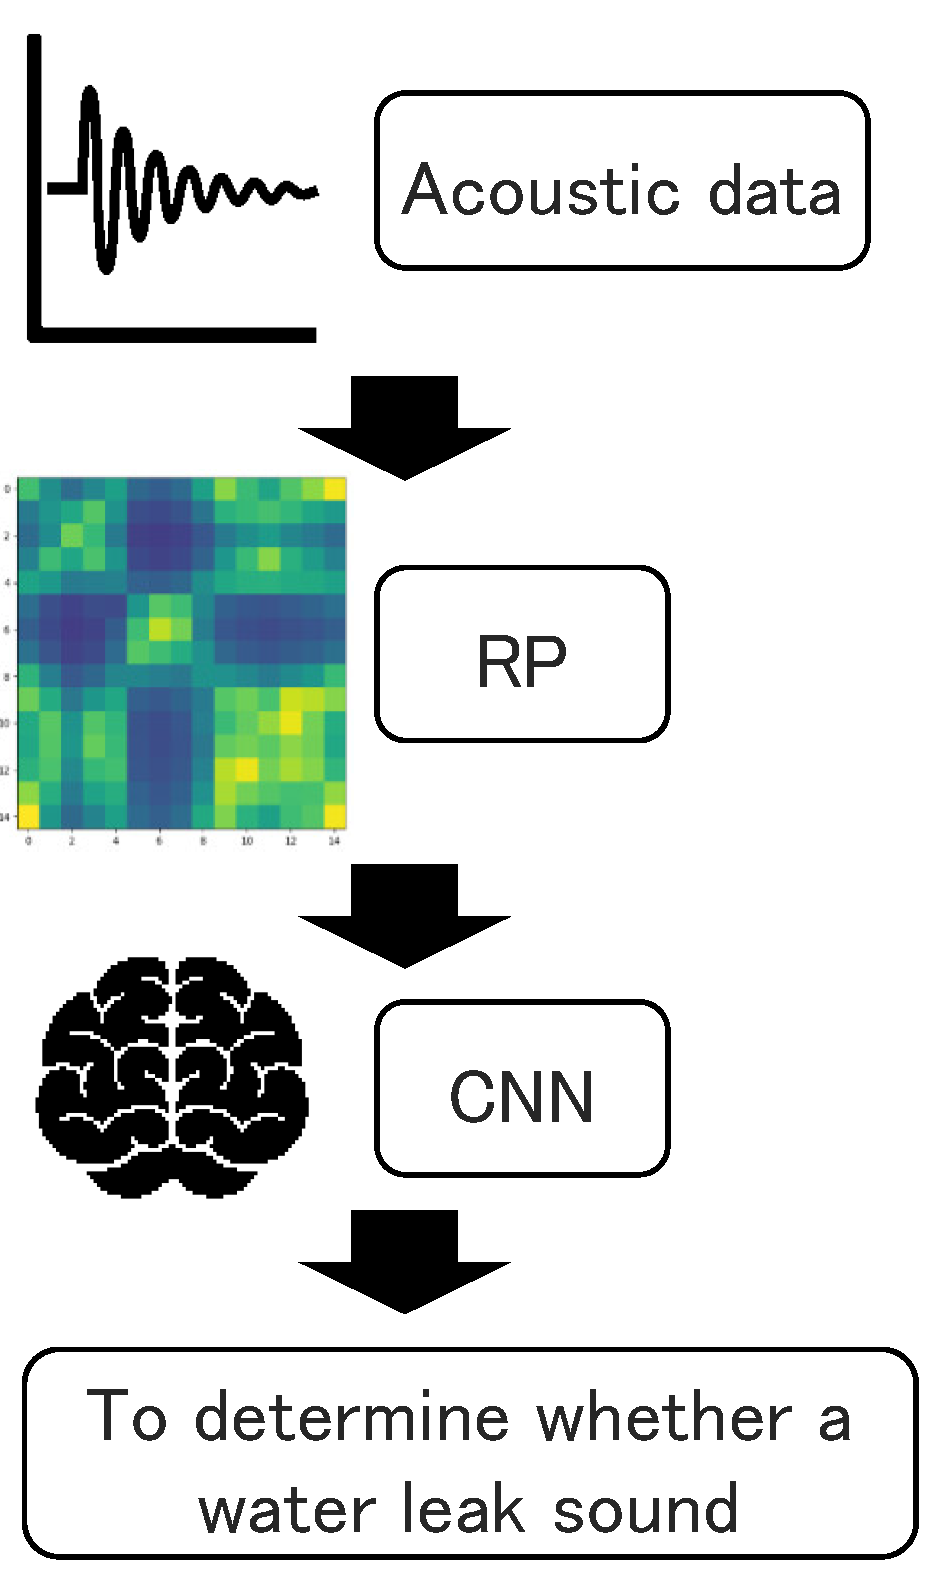
Figure 2.
Learning and assessment data.
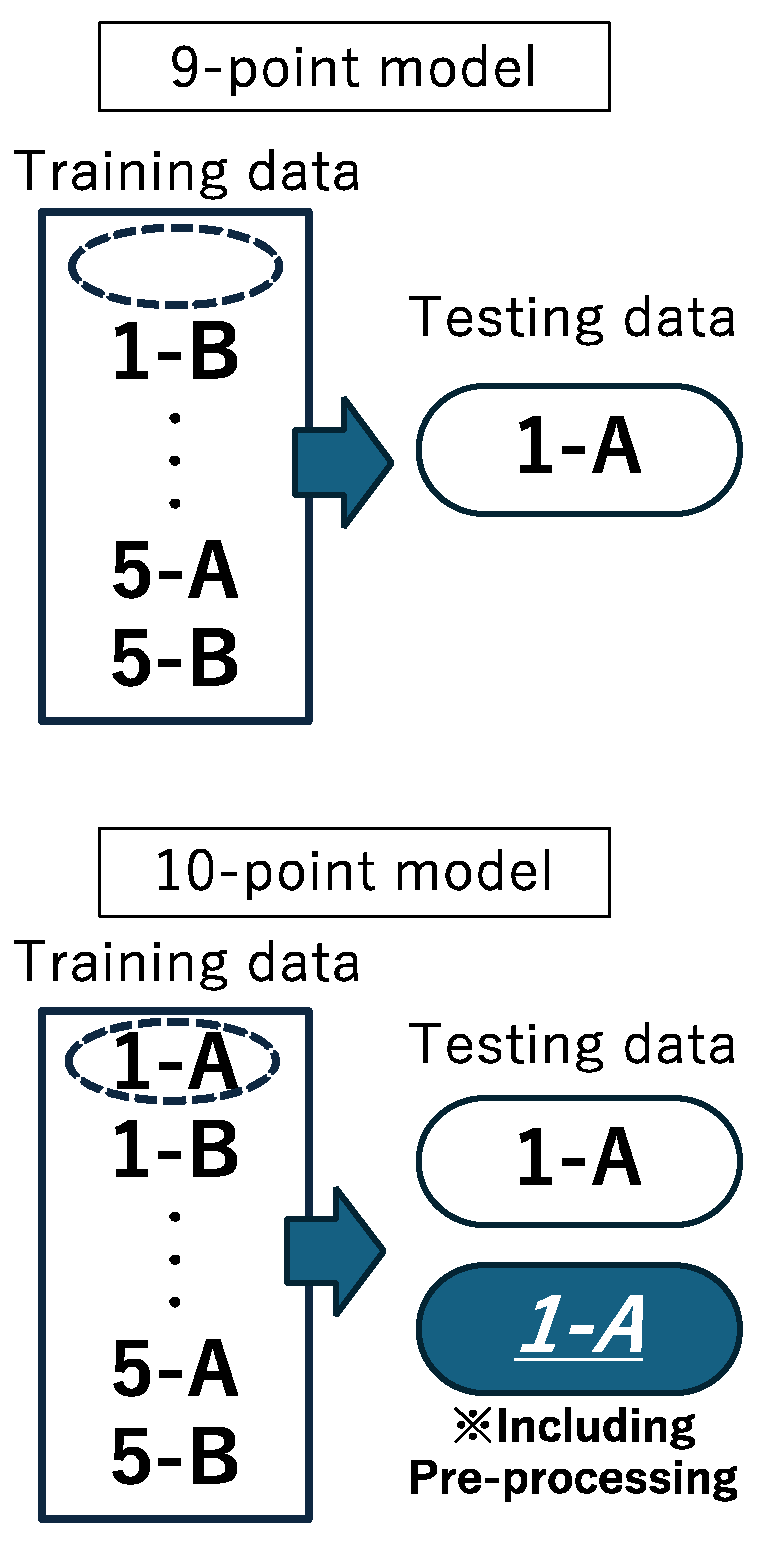
Figure 3.
Box plot of acoustic data converted into 15 dimensions.
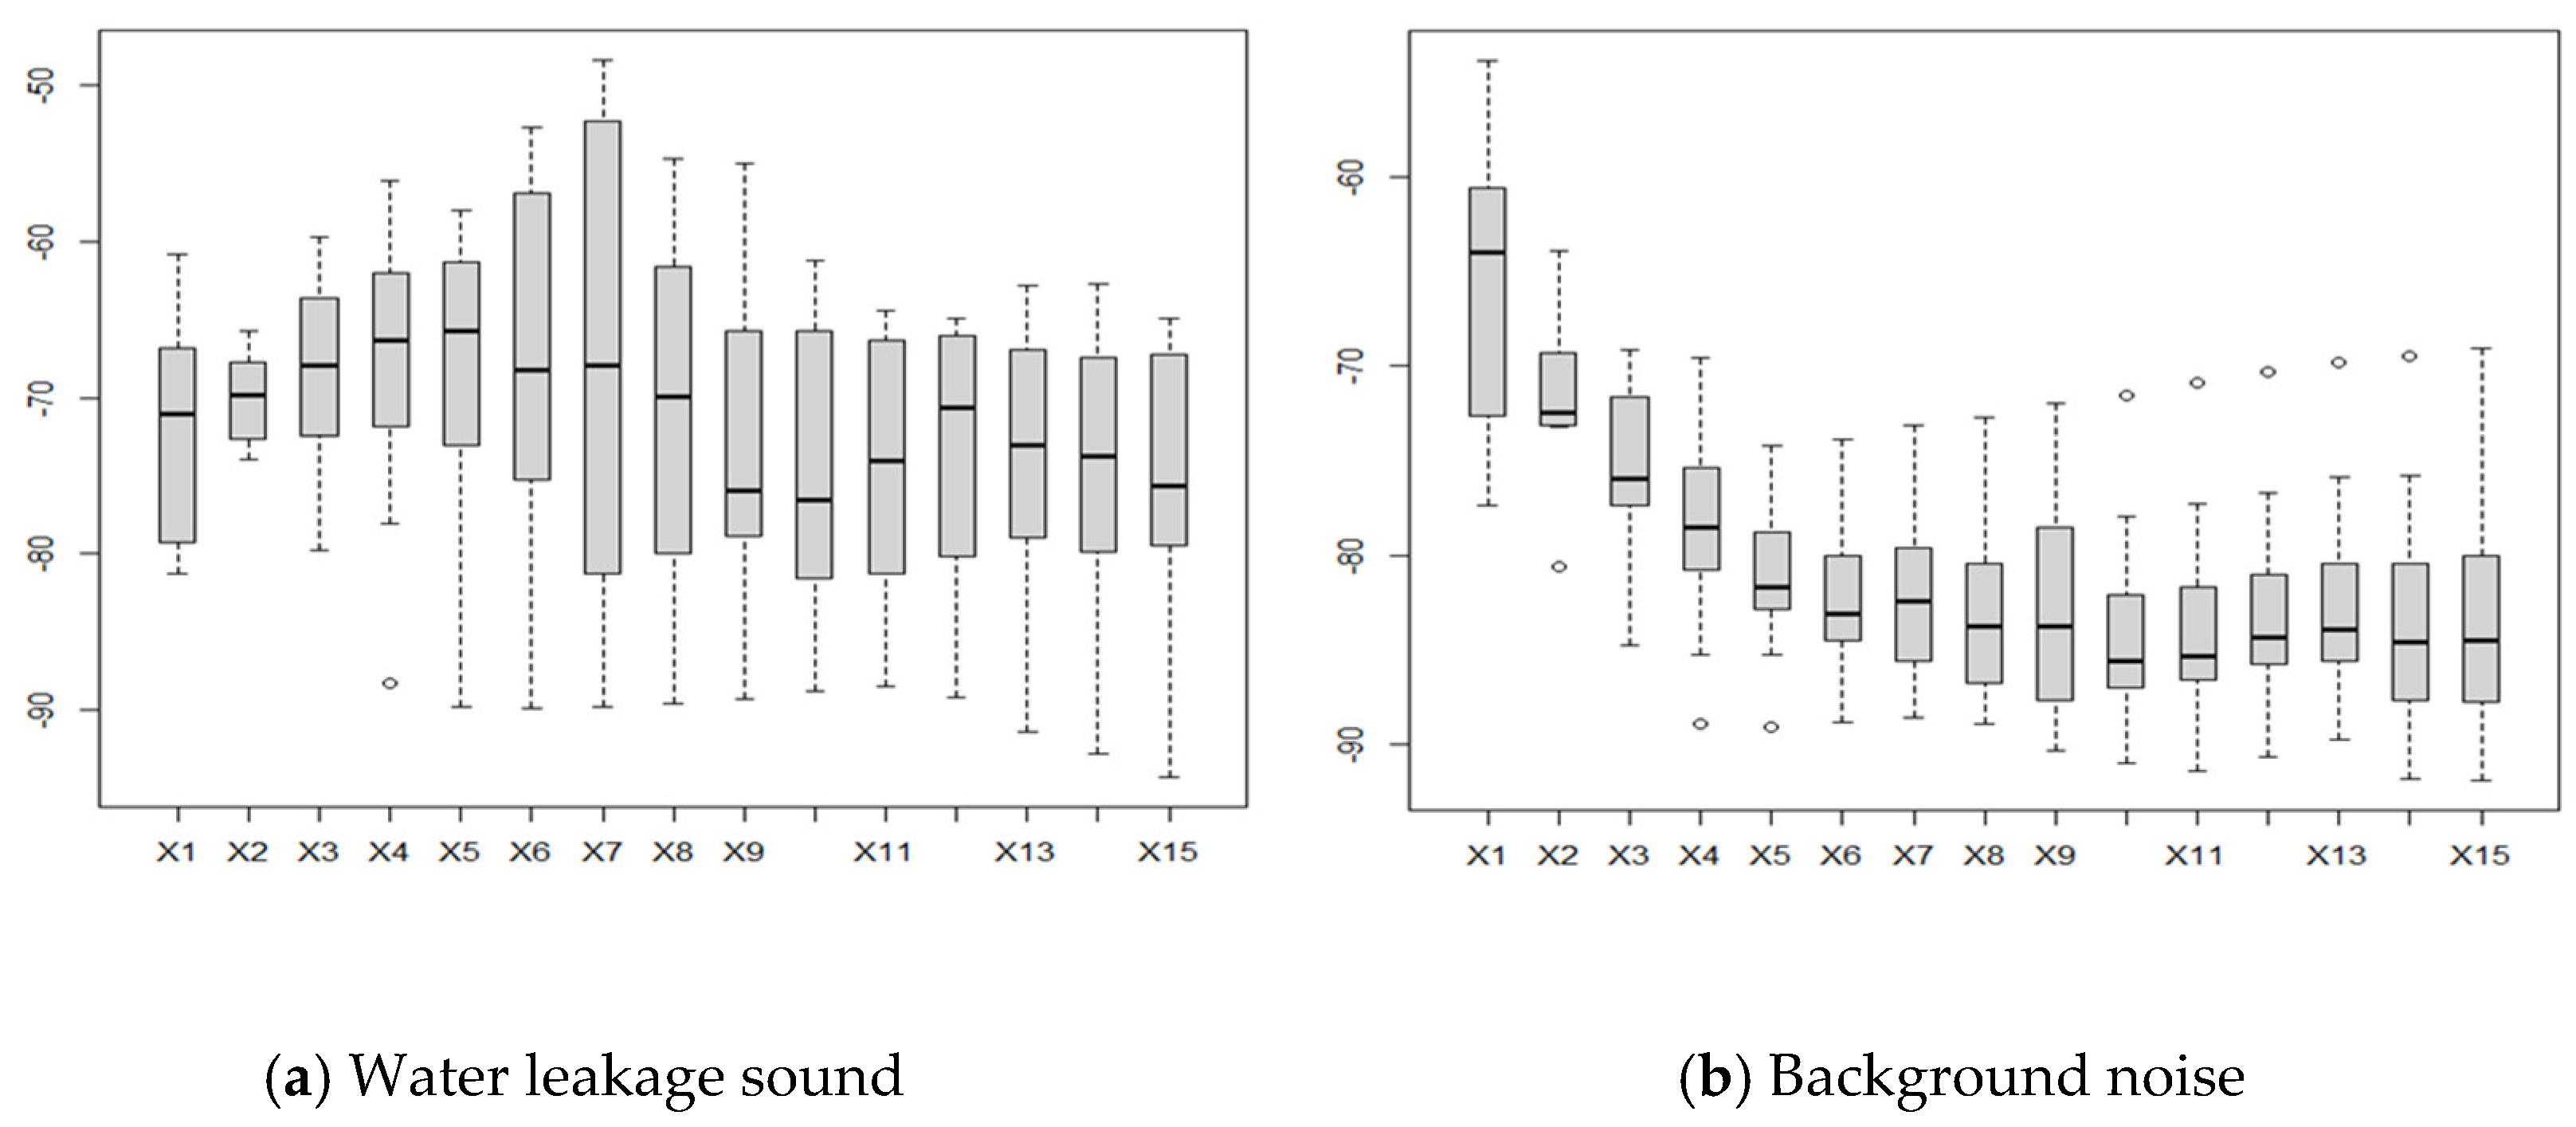
Figure 4.
Positioning results based on principal component scores (horizontal axis, 1st principal component [PC1]; vertical axis, 2nd principal component [PC2]).
Figure 4.
Positioning results based on principal component scores (horizontal axis, 1st principal component [PC1]; vertical axis, 2nd principal component [PC2]).
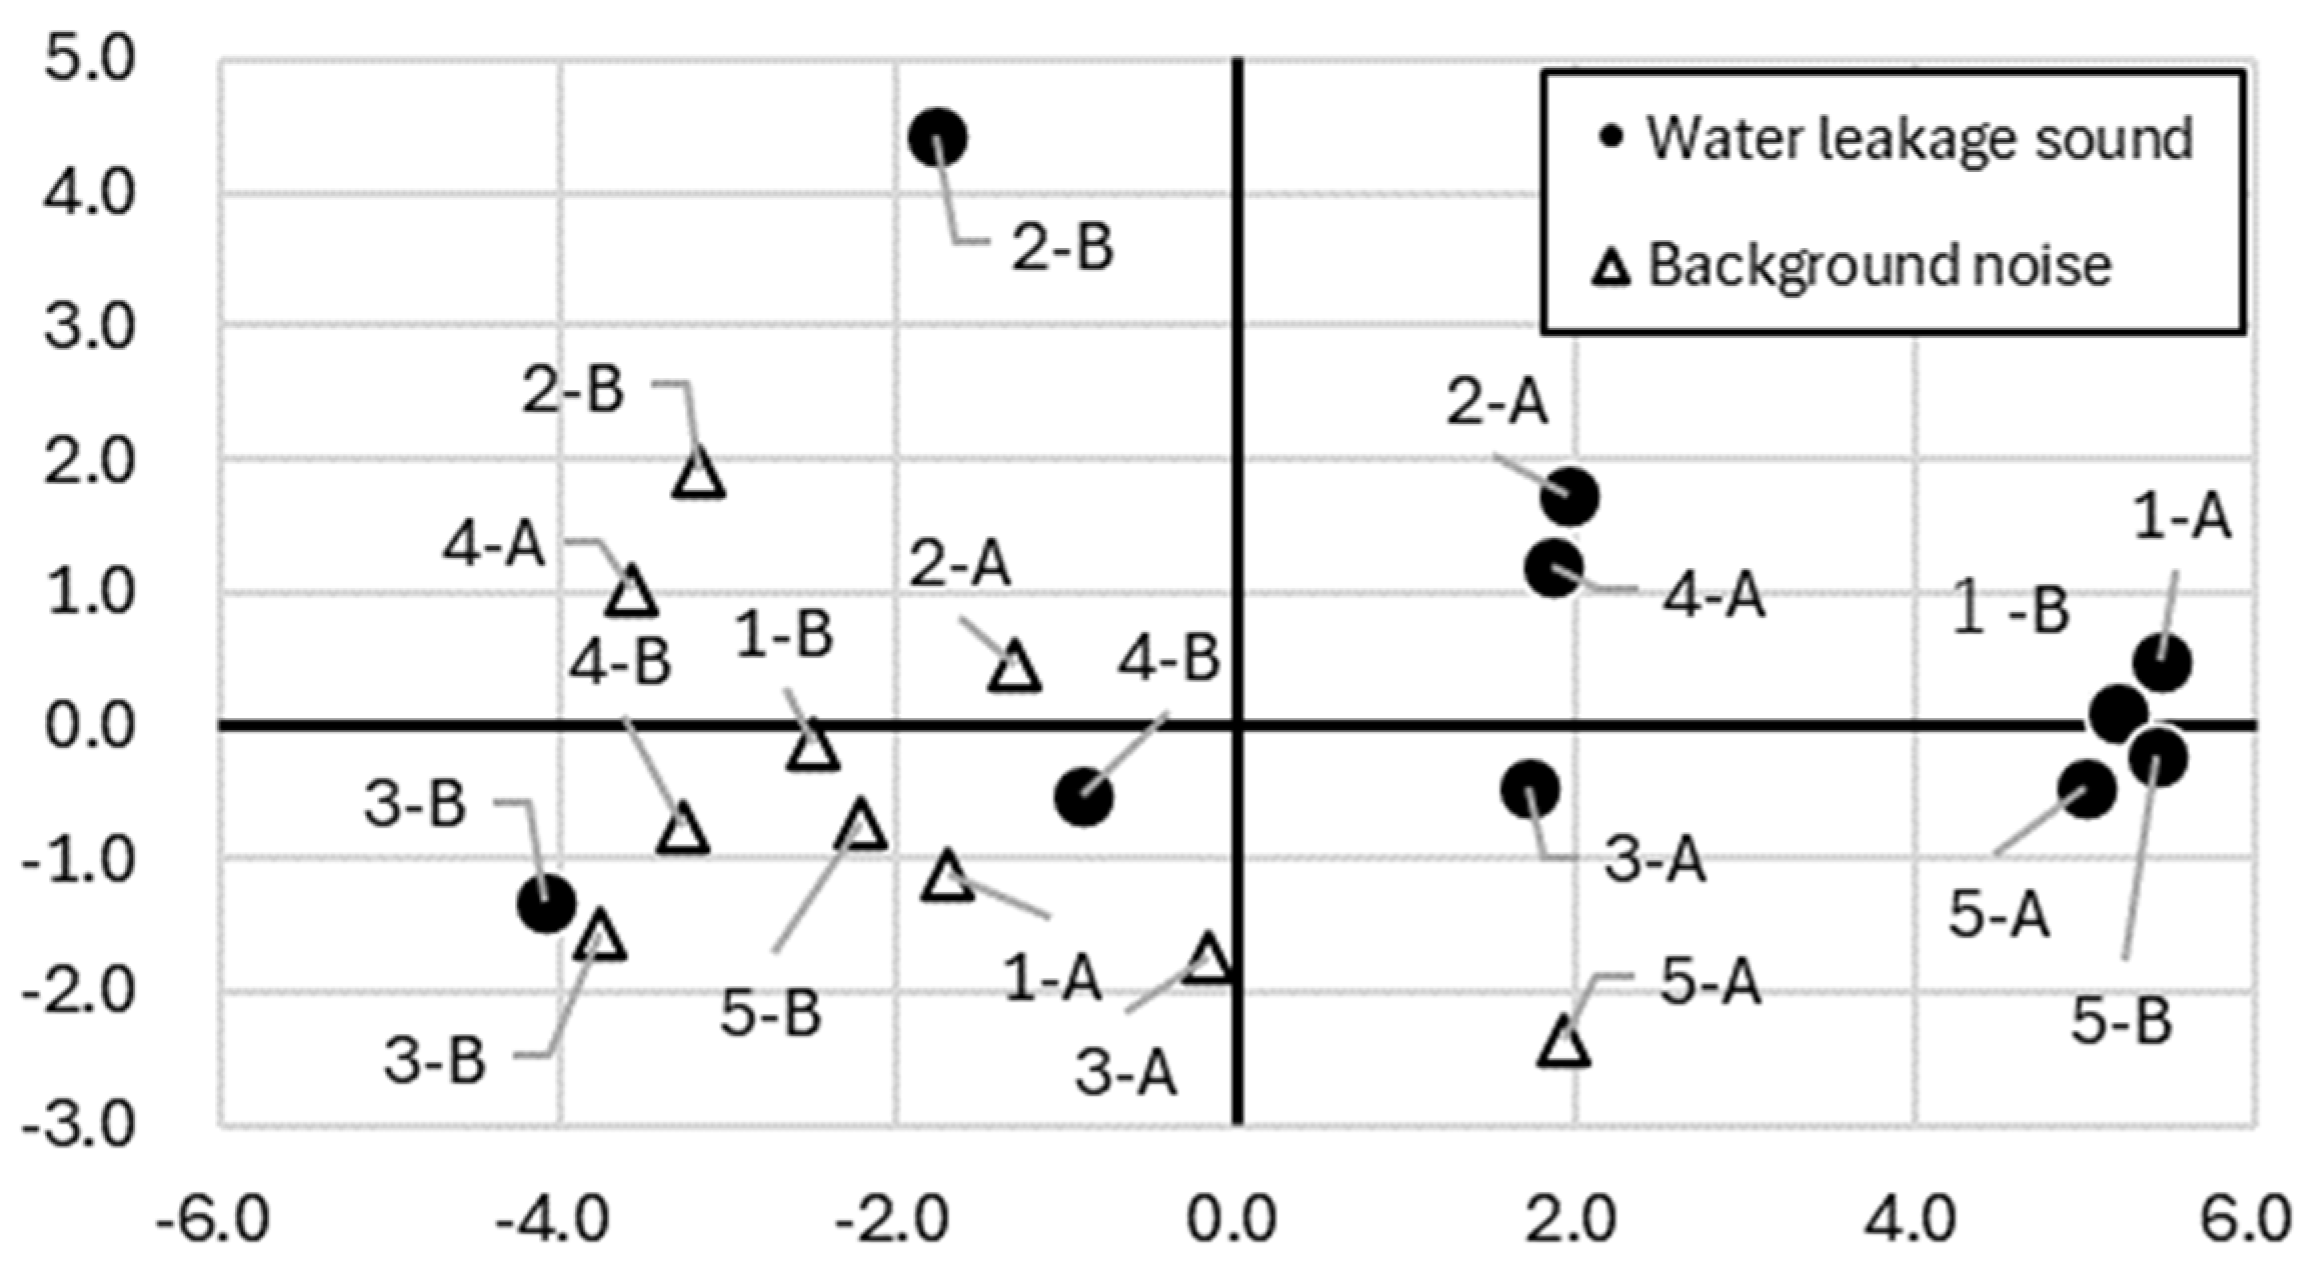
Figure 5.
FFT spectrum of point 1-B.
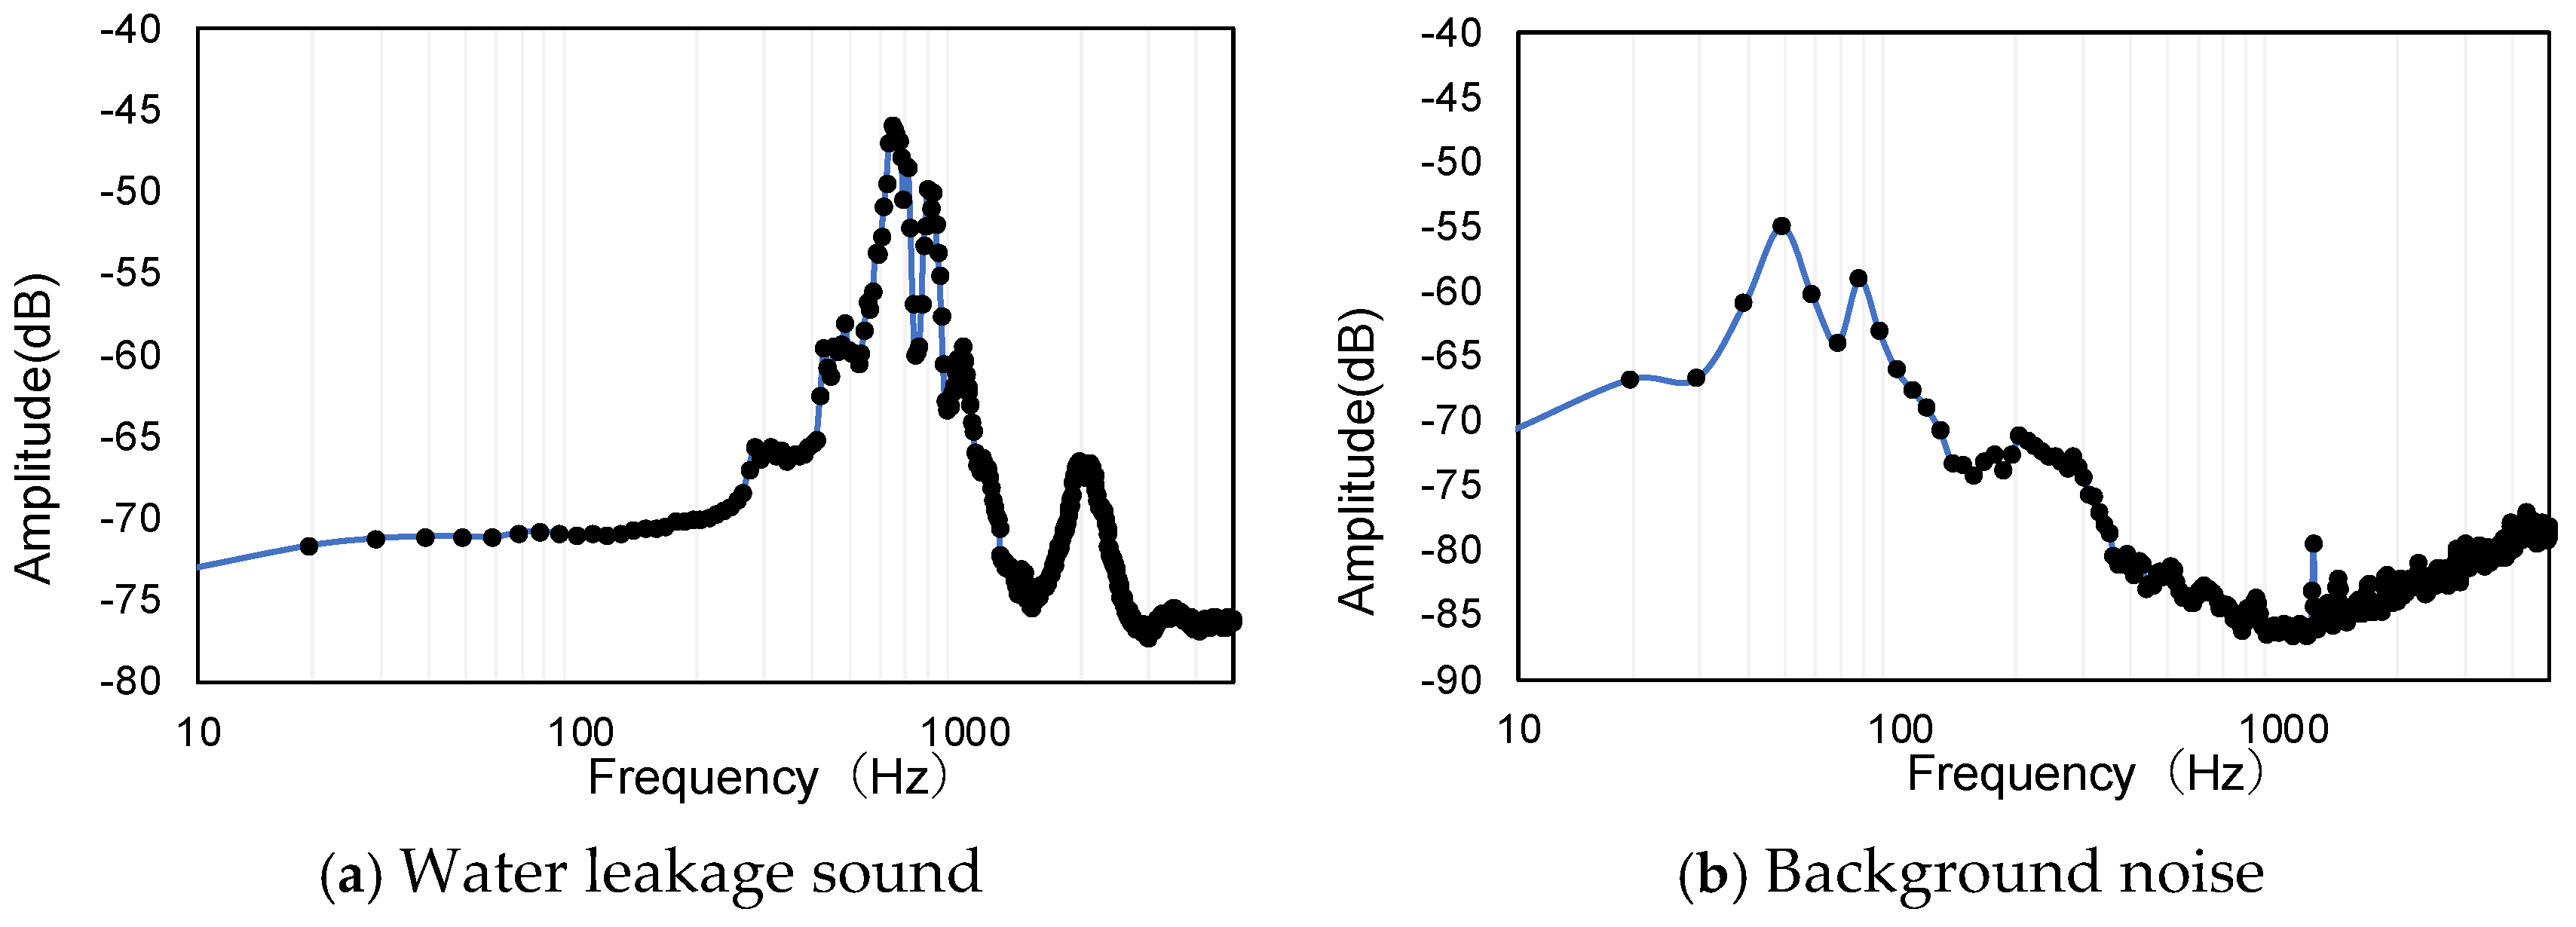
Figure 6.
Changes in RP due to amplification process of point 4-B (RP number 2000 to 2002).
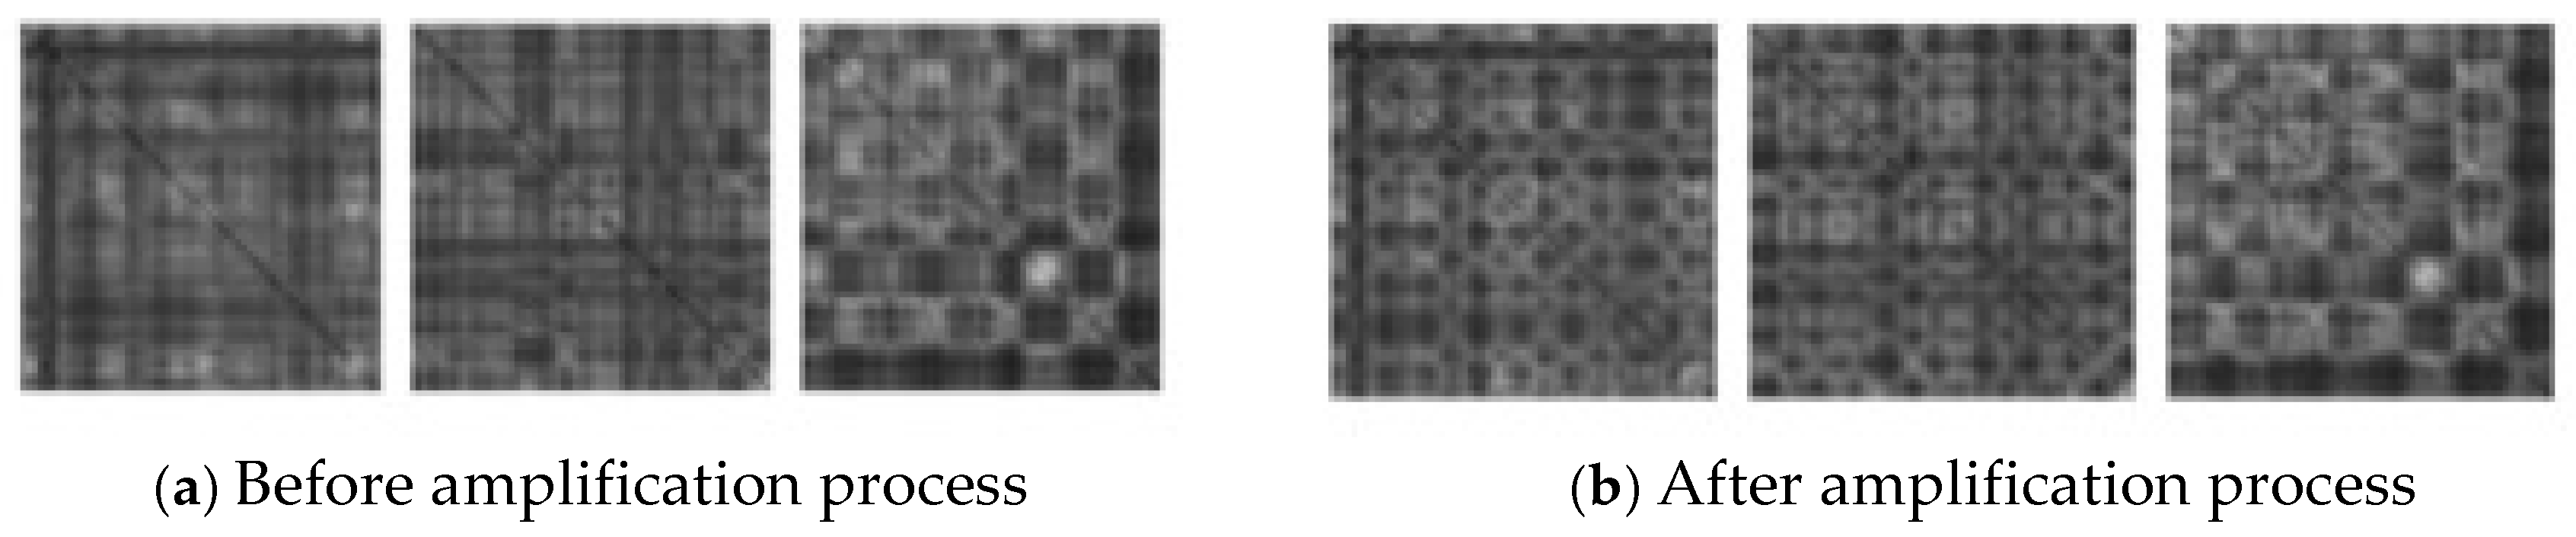
Figure 7.
Results of applying the proposed method (15-dimensional data).
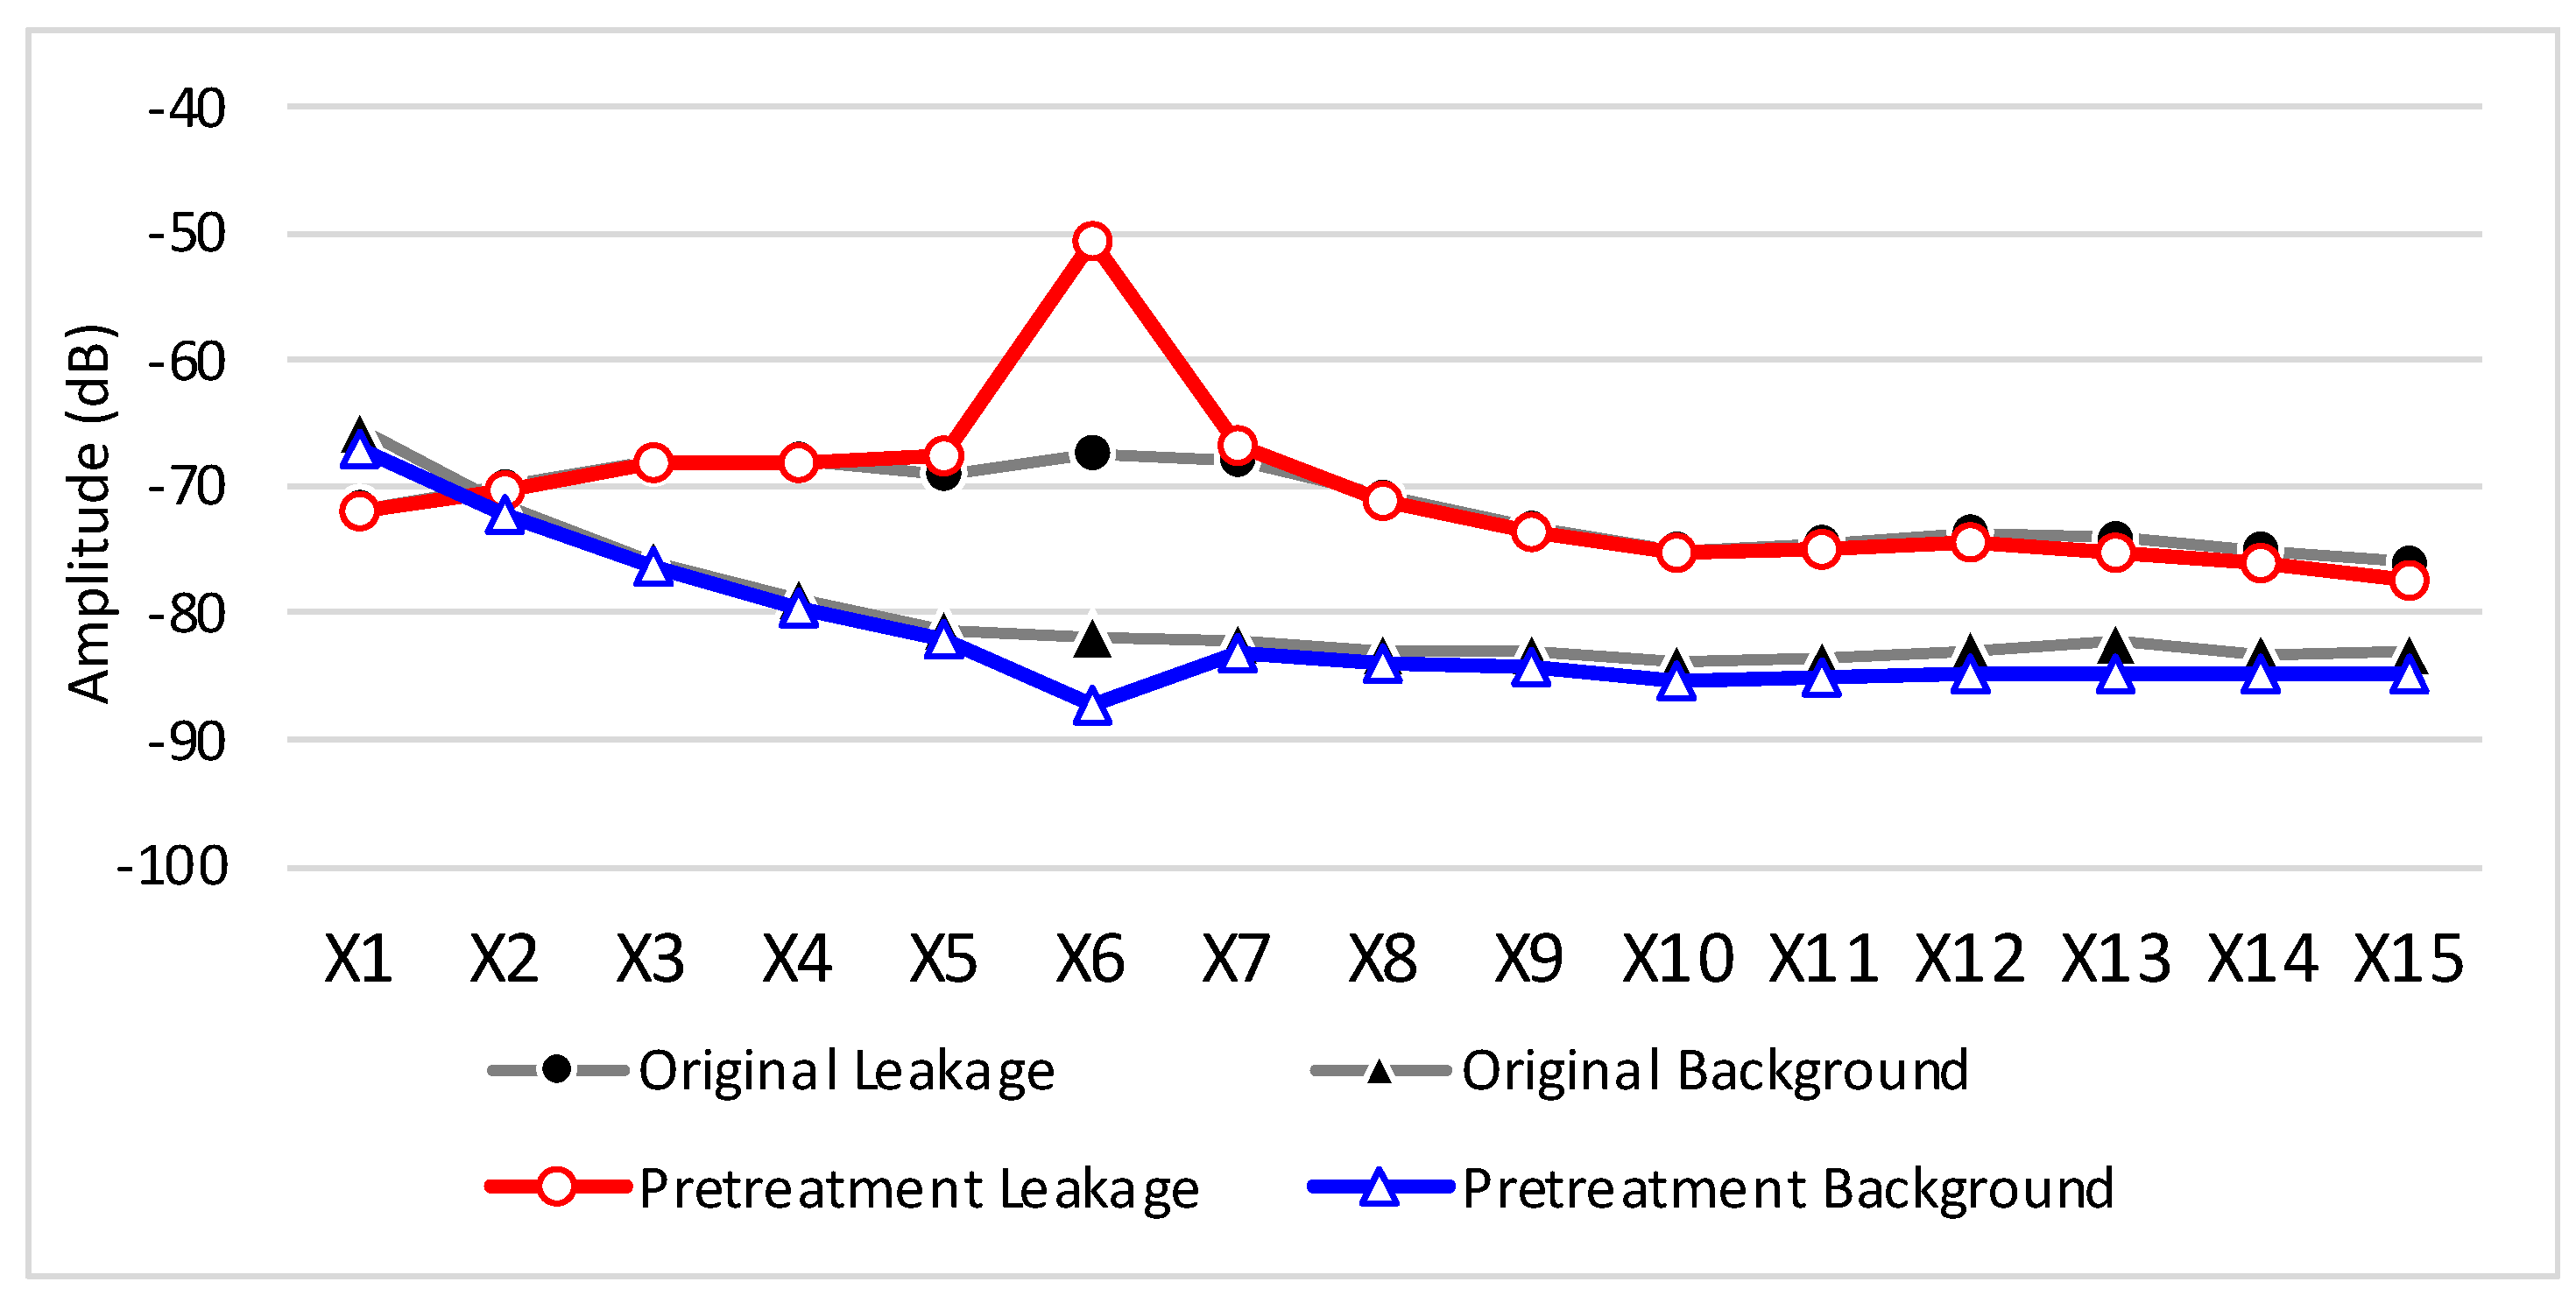

Table 1.
Detailed information on acoustic data.
| Point | Leakage volume (L/min) | Measurement distance (m) | Sensor location (m) | Cause of leakage | Water pressure (MPa) | Pipe diameter (mm) | Soil cover (mm) |
|---|---|---|---|---|---|---|---|
| 1-A | 61.10 | 23.30 | gate valve | water faucet- bolt corrosion |
0.40 | 75 | 1250 |
| 1-B | 21.90 | fire hydrant | |||||
| 2-A | 34.35 | 113.00 | gate valve | water faucet- bolt corrosion |
0.35 | 150 | 1350 |
| 2-B | 24.30 | gate valve | |||||
| 3-A | 106.49 | 51.60 | gate valve | water faucet- corrosion |
0.35 | 100 | 1230 |
| 3-B | 47.90 | fire hydrant | |||||
| 4-A | 3.58 | 0.13 | gate valve | flange loose- bolt | 0.44 | 100 | 1200 |
| 4-B | 38.07 | gate valve | |||||
| 5-A | 93.25 | 13.70 | gate valve | water faucet- corrosion | 0.50 | 100 | 1220 |
| 5-B | 44.80 | gate valve |
Table 2.
Blind test results conducted by water leakage investigators.
| Point | Water leak sound | Background noise |
|---|---|---|
| 1-A | A high-pitched, resonant sound. Easy to determine water leak. | A general noise (buzzing). No sound of water leak is heard. |
| 1-B | A distinctive high-pitched sound (koo). Easy to determine water leak. | Some noise, but no sound of water leak is heard. |
| 2-A | Difficult to distinguish, but a low resonant sound (rumble). Determined to be a water leak. | A general noise (rumble). No sound of water leak is heard. |
| 2-B | A low-pitched sound of water leak. Easy to determine. | No sound of leaking can be heard. |
| 3-A | A distinctive high-pitched and resonant sound. Easy to determine. | A general noise (rumble). No water leak sound is heard. |
| 3-B | Noise and a constant low resonance. Cannot be determined as the sound of a water leak. | A general noise (rumble). No sound of leaking water can be heard. |
| 4-A | A high-pitched, distinctive sound (goo). Easy to determine. | It sounds like running water. There are no other characteristic sounds of leakage. |
| 4-B | Noise and low-pitched sound. Cannot be determined as a water leak sound. | A high, constant sound (transformer sound). No sound of leakage can be heard. |
| 5-A | A distinctive high-pitched and resonant sound. Determined to be a water leak. | The sound of leakage (a continuous high-pitched, resonant sound) cannot be heard. |
| 5-B | Sound is faint but high-pitched and resonant. Determined to be a water leak. | A general noise (rumble). No sound of leaking water can be heard. |
Table 3.
Results of applying the RP-CNN model to the assessment data.
| (a) Data without pre-processing | ||||
| Point | Epoch | Accuracy (%) | ||
| BA | Recall | Specificity | ||
| 1-A | 10 | 99.3 | 99.9 | 98.7 |
| 1-B | 99.8 | 100.0 | 99.6 | |
| 2-A | 94.9 | 95.4 | 94.3 | |
| 2-B | 94.6 | 97.7 | 91.5 | |
| 3-A | 98.4 | 99.3 | 97.5 | |
| 3-B | 49.4 | 0.0 | 98.8 | |
| 4-A | 98.1 | 99.6 | 96.6 | |
| 4-B | 46.8 | 0.0 | 93.6 | |
| 5-A | 99.6 | 99.3 | 99.9 | |
| 5-B | 98.6 | 97.4 | 99.8 | |
| (b) Data with pre-processing | ||||
| Point | Epoch | Accuracy (%) | ||
| BA | Recall | Specificity | ||
| 1-A | 10 | 97.8 | 99.9 | 95.6 |
| 1-B | 89.4 | 100.0 | 78.8 | |
| 2-A | 97.9 | 100.0 | 95.8 | |
| 2-B | 95.8 | 100.0 | 91.6 | |
| 3-A | 99.5 | 100.0 | 98.9 | |
| 3-B | 81.8 | 64.4 | 99.2 | |
| 4-A | 95.9 | 100.0 | 91.8 | |
| 4-B | 88.7 | 81.4 | 95.9 | |
| 5-A | 99.6 | 100.0 | 99.1 | |
| 5-B | 99.7 | 100.0 | 99.4 | |
Disclaimer/Publisher’s Note: The statements, opinions and data contained in all publications are solely those of the individual author(s) and contributor(s) and not of MDPI and/or the editor(s). MDPI and/or the editor(s) disclaim responsibility for any injury to people or property resulting from any ideas, methods, instructions or products referred to in the content. |
© 2024 by the authors. Licensee MDPI, Basel, Switzerland. This article is an open access article distributed under the terms and conditions of the Creative Commons Attribution (CC BY) license (http://creativecommons.org/licenses/by/4.0/).
Copyright: This open access article is published under a Creative Commons CC BY 4.0 license, which permit the free download, distribution, and reuse, provided that the author and preprint are cited in any reuse.


