Preprint
Article

This version is not peer-reviewed.

Declining Prey Size in the Southern African Pleistocene: Evaluating the Human Impact

Submitted:

13 November 2024

Posted:

14 November 2024

You are already at the latest version

Abstract

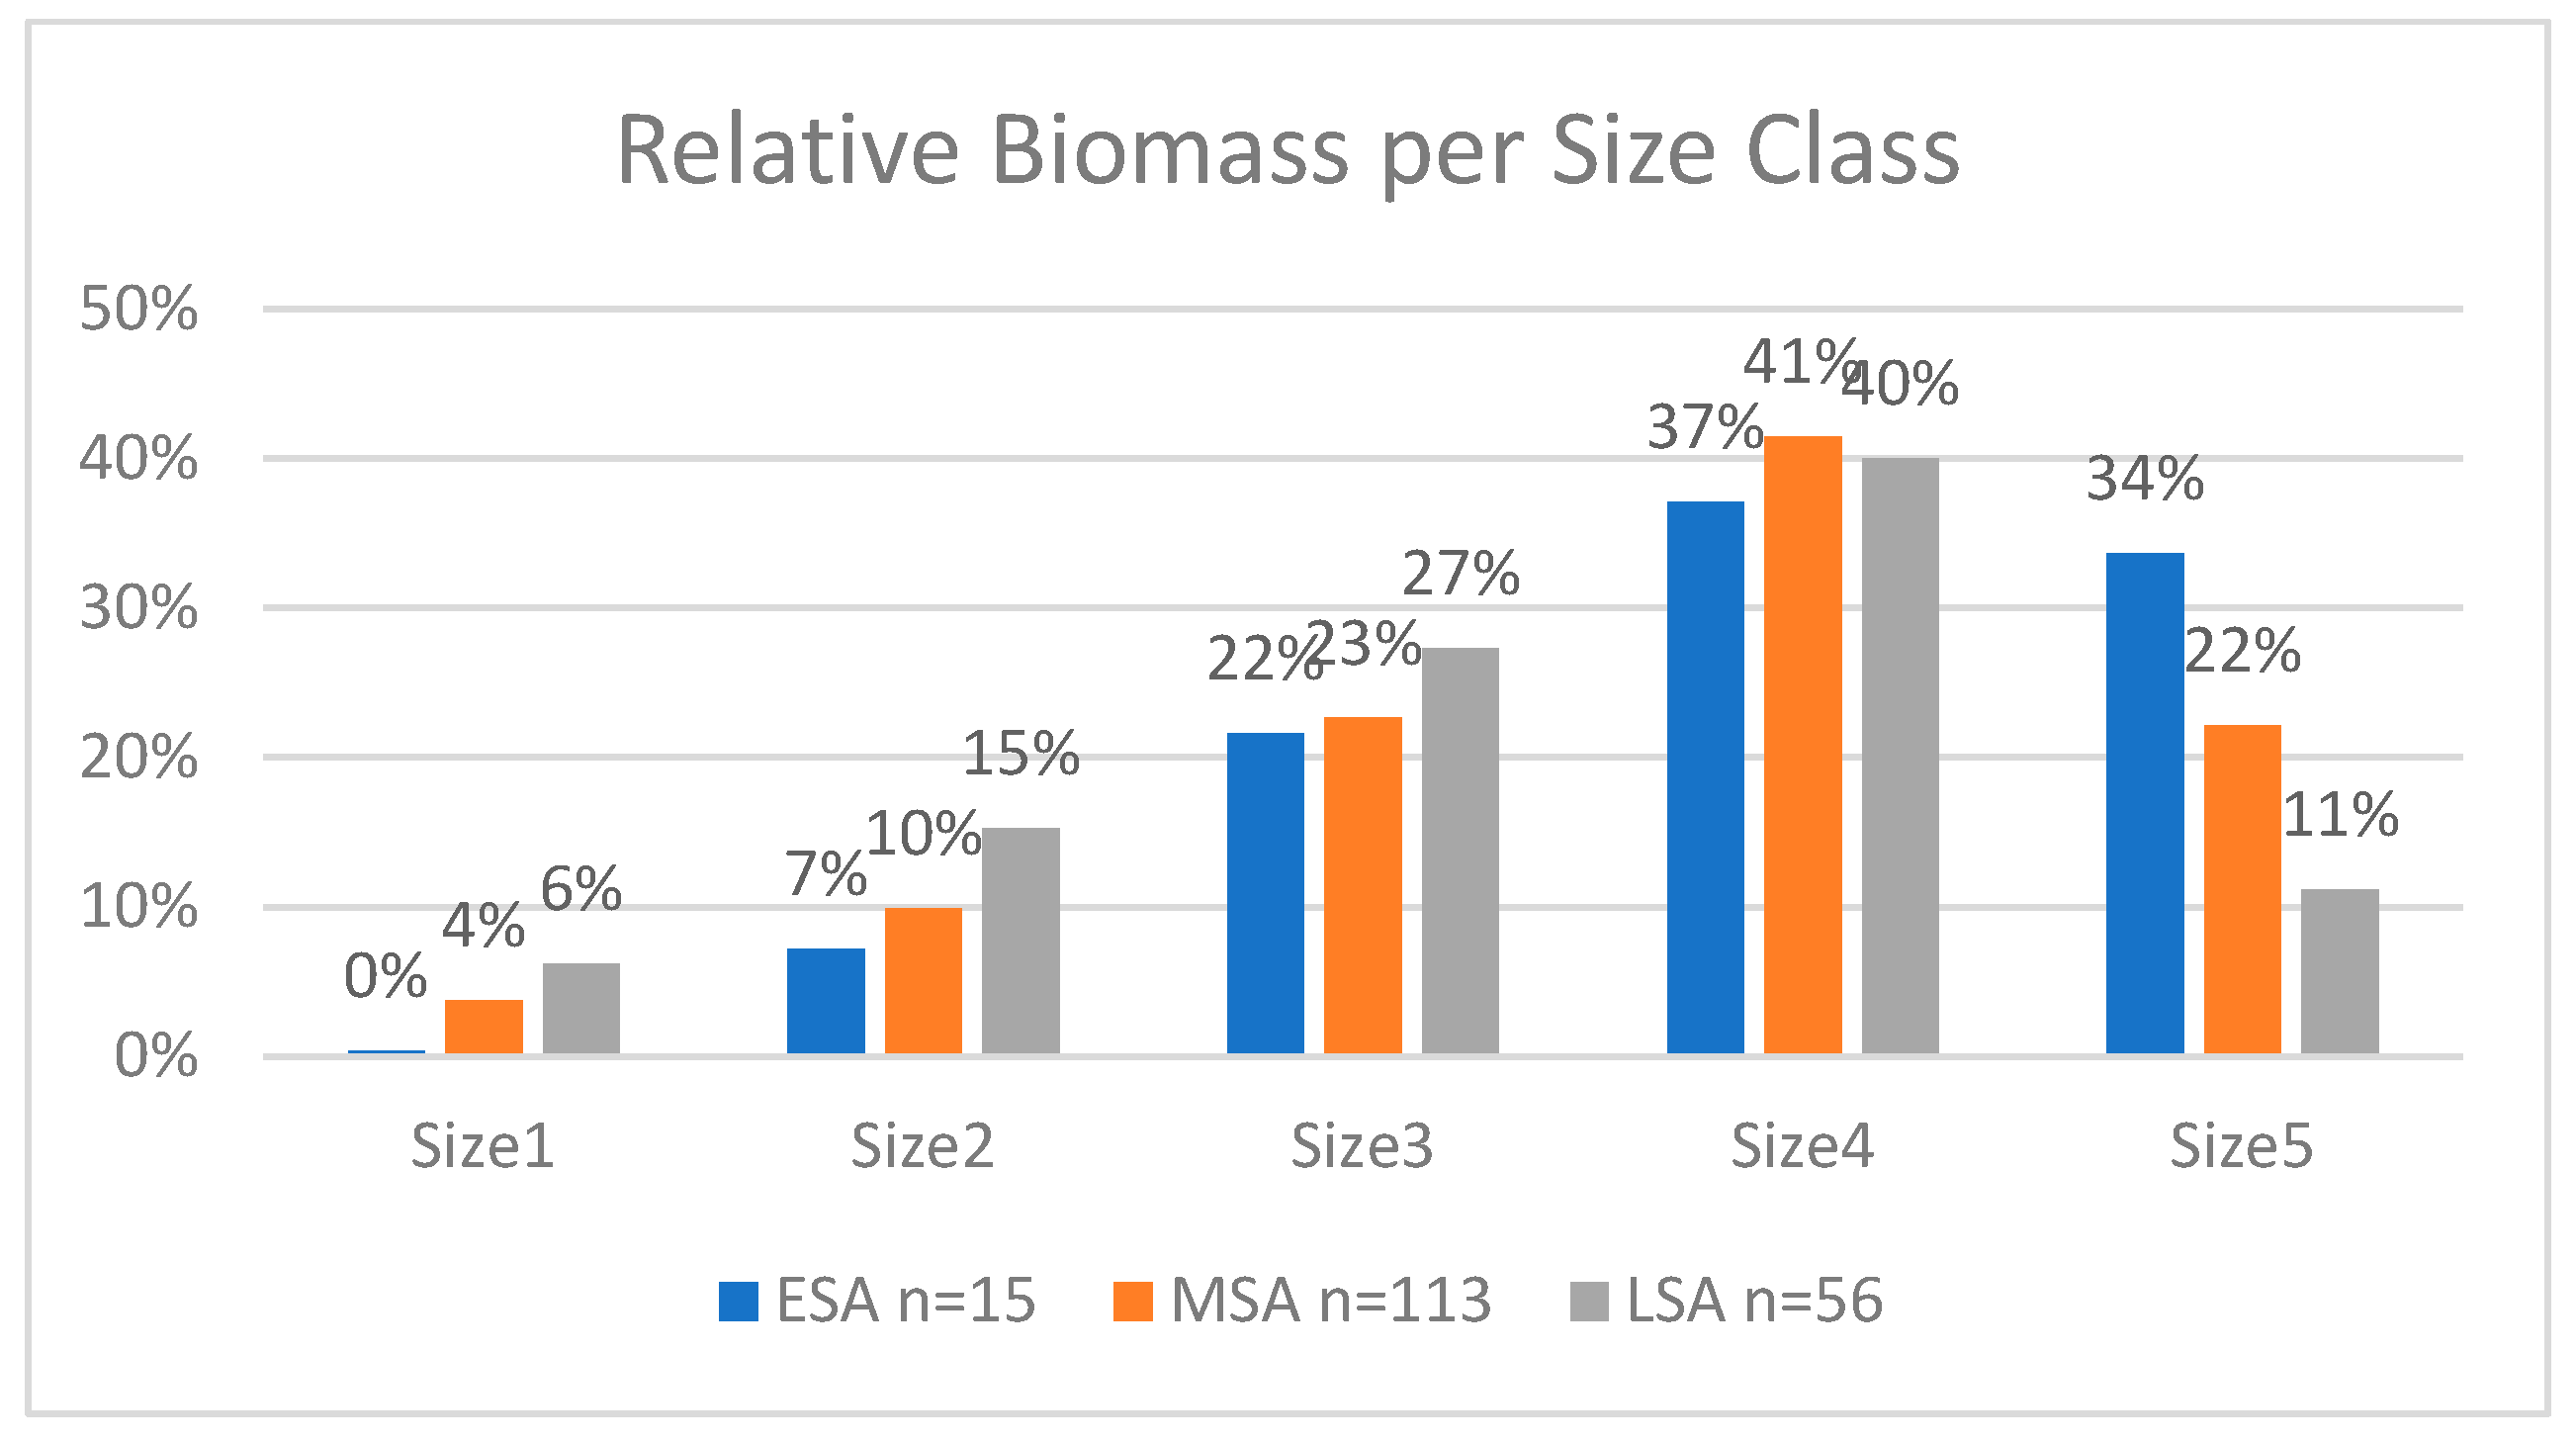
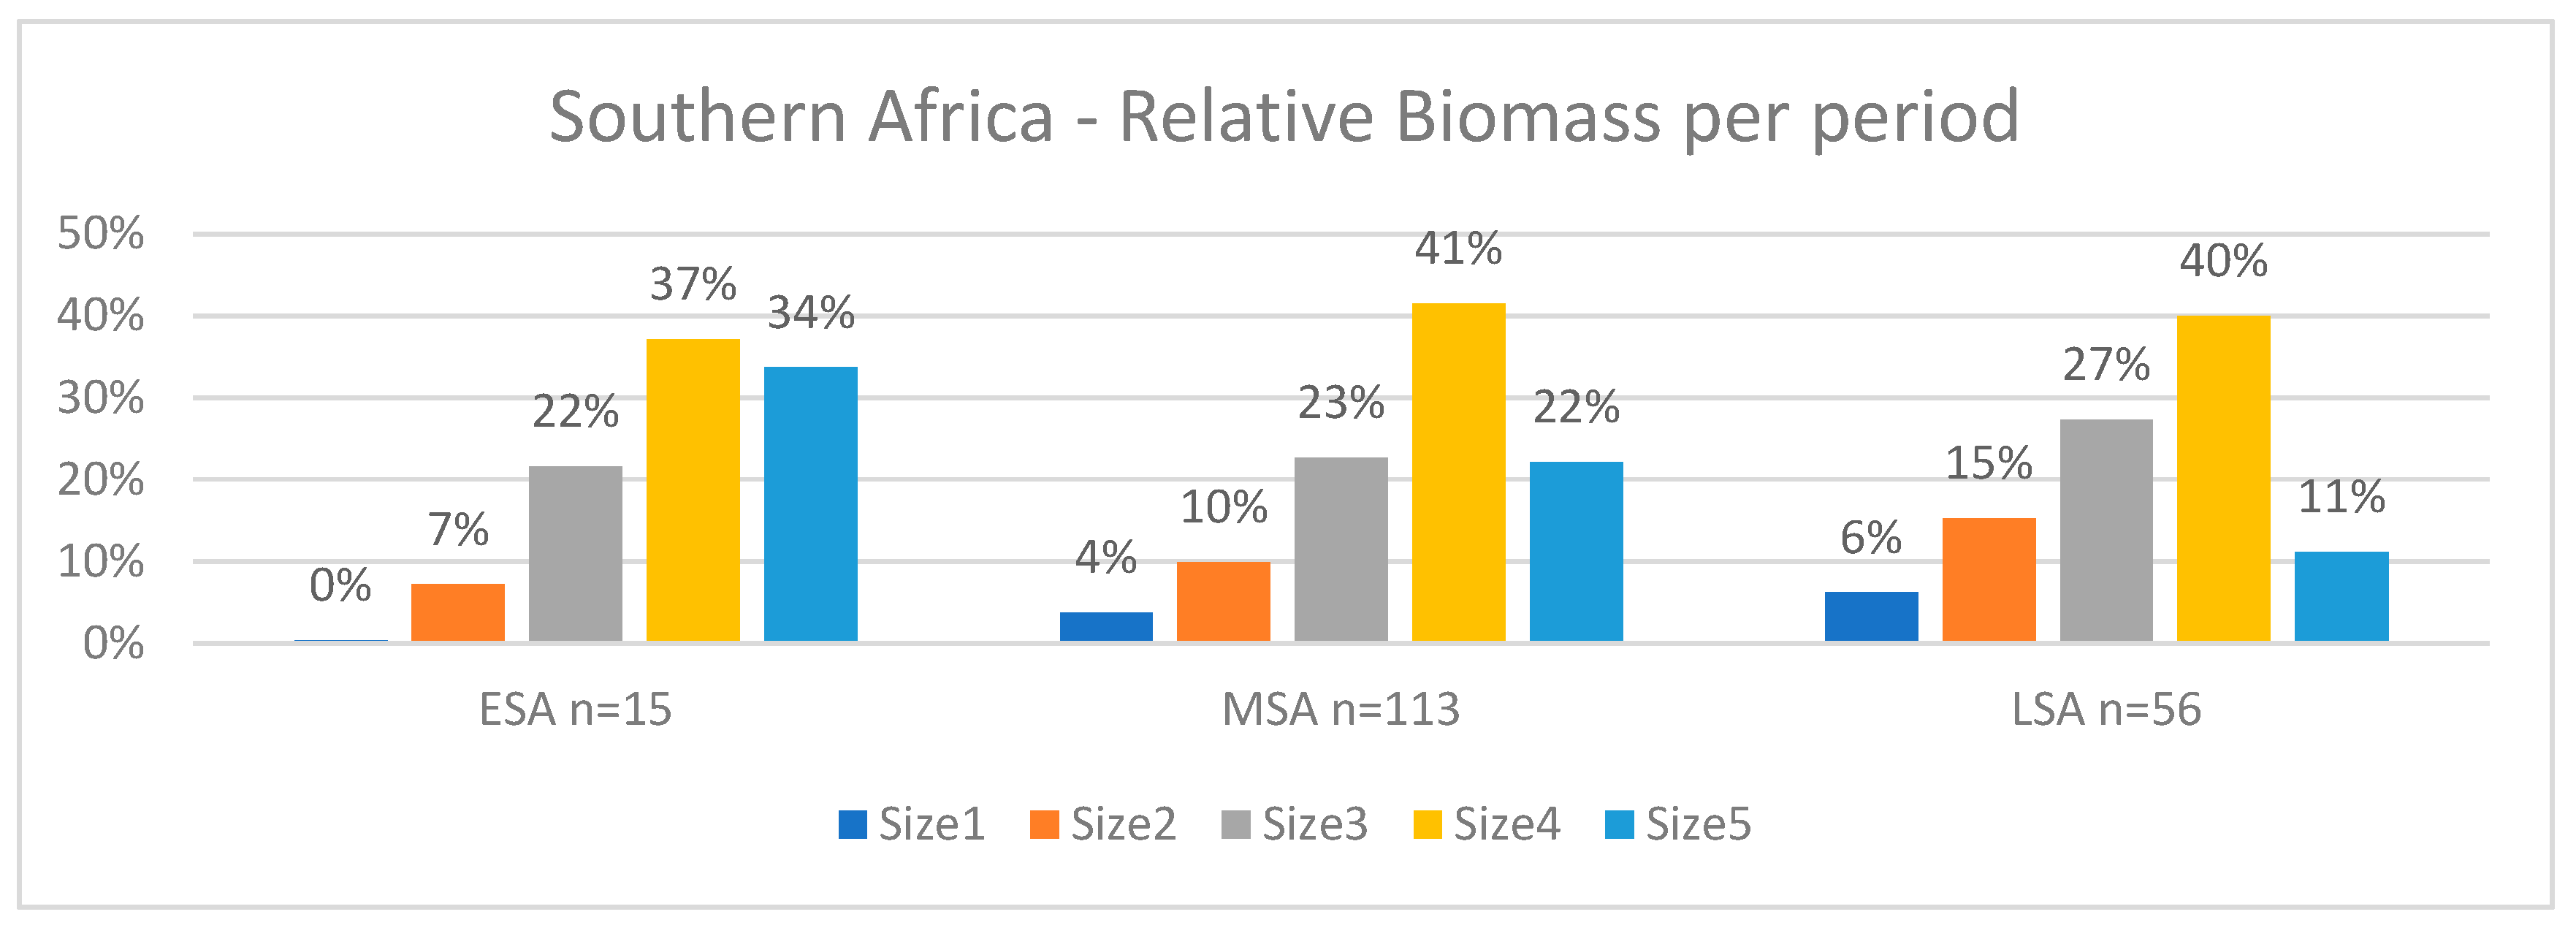
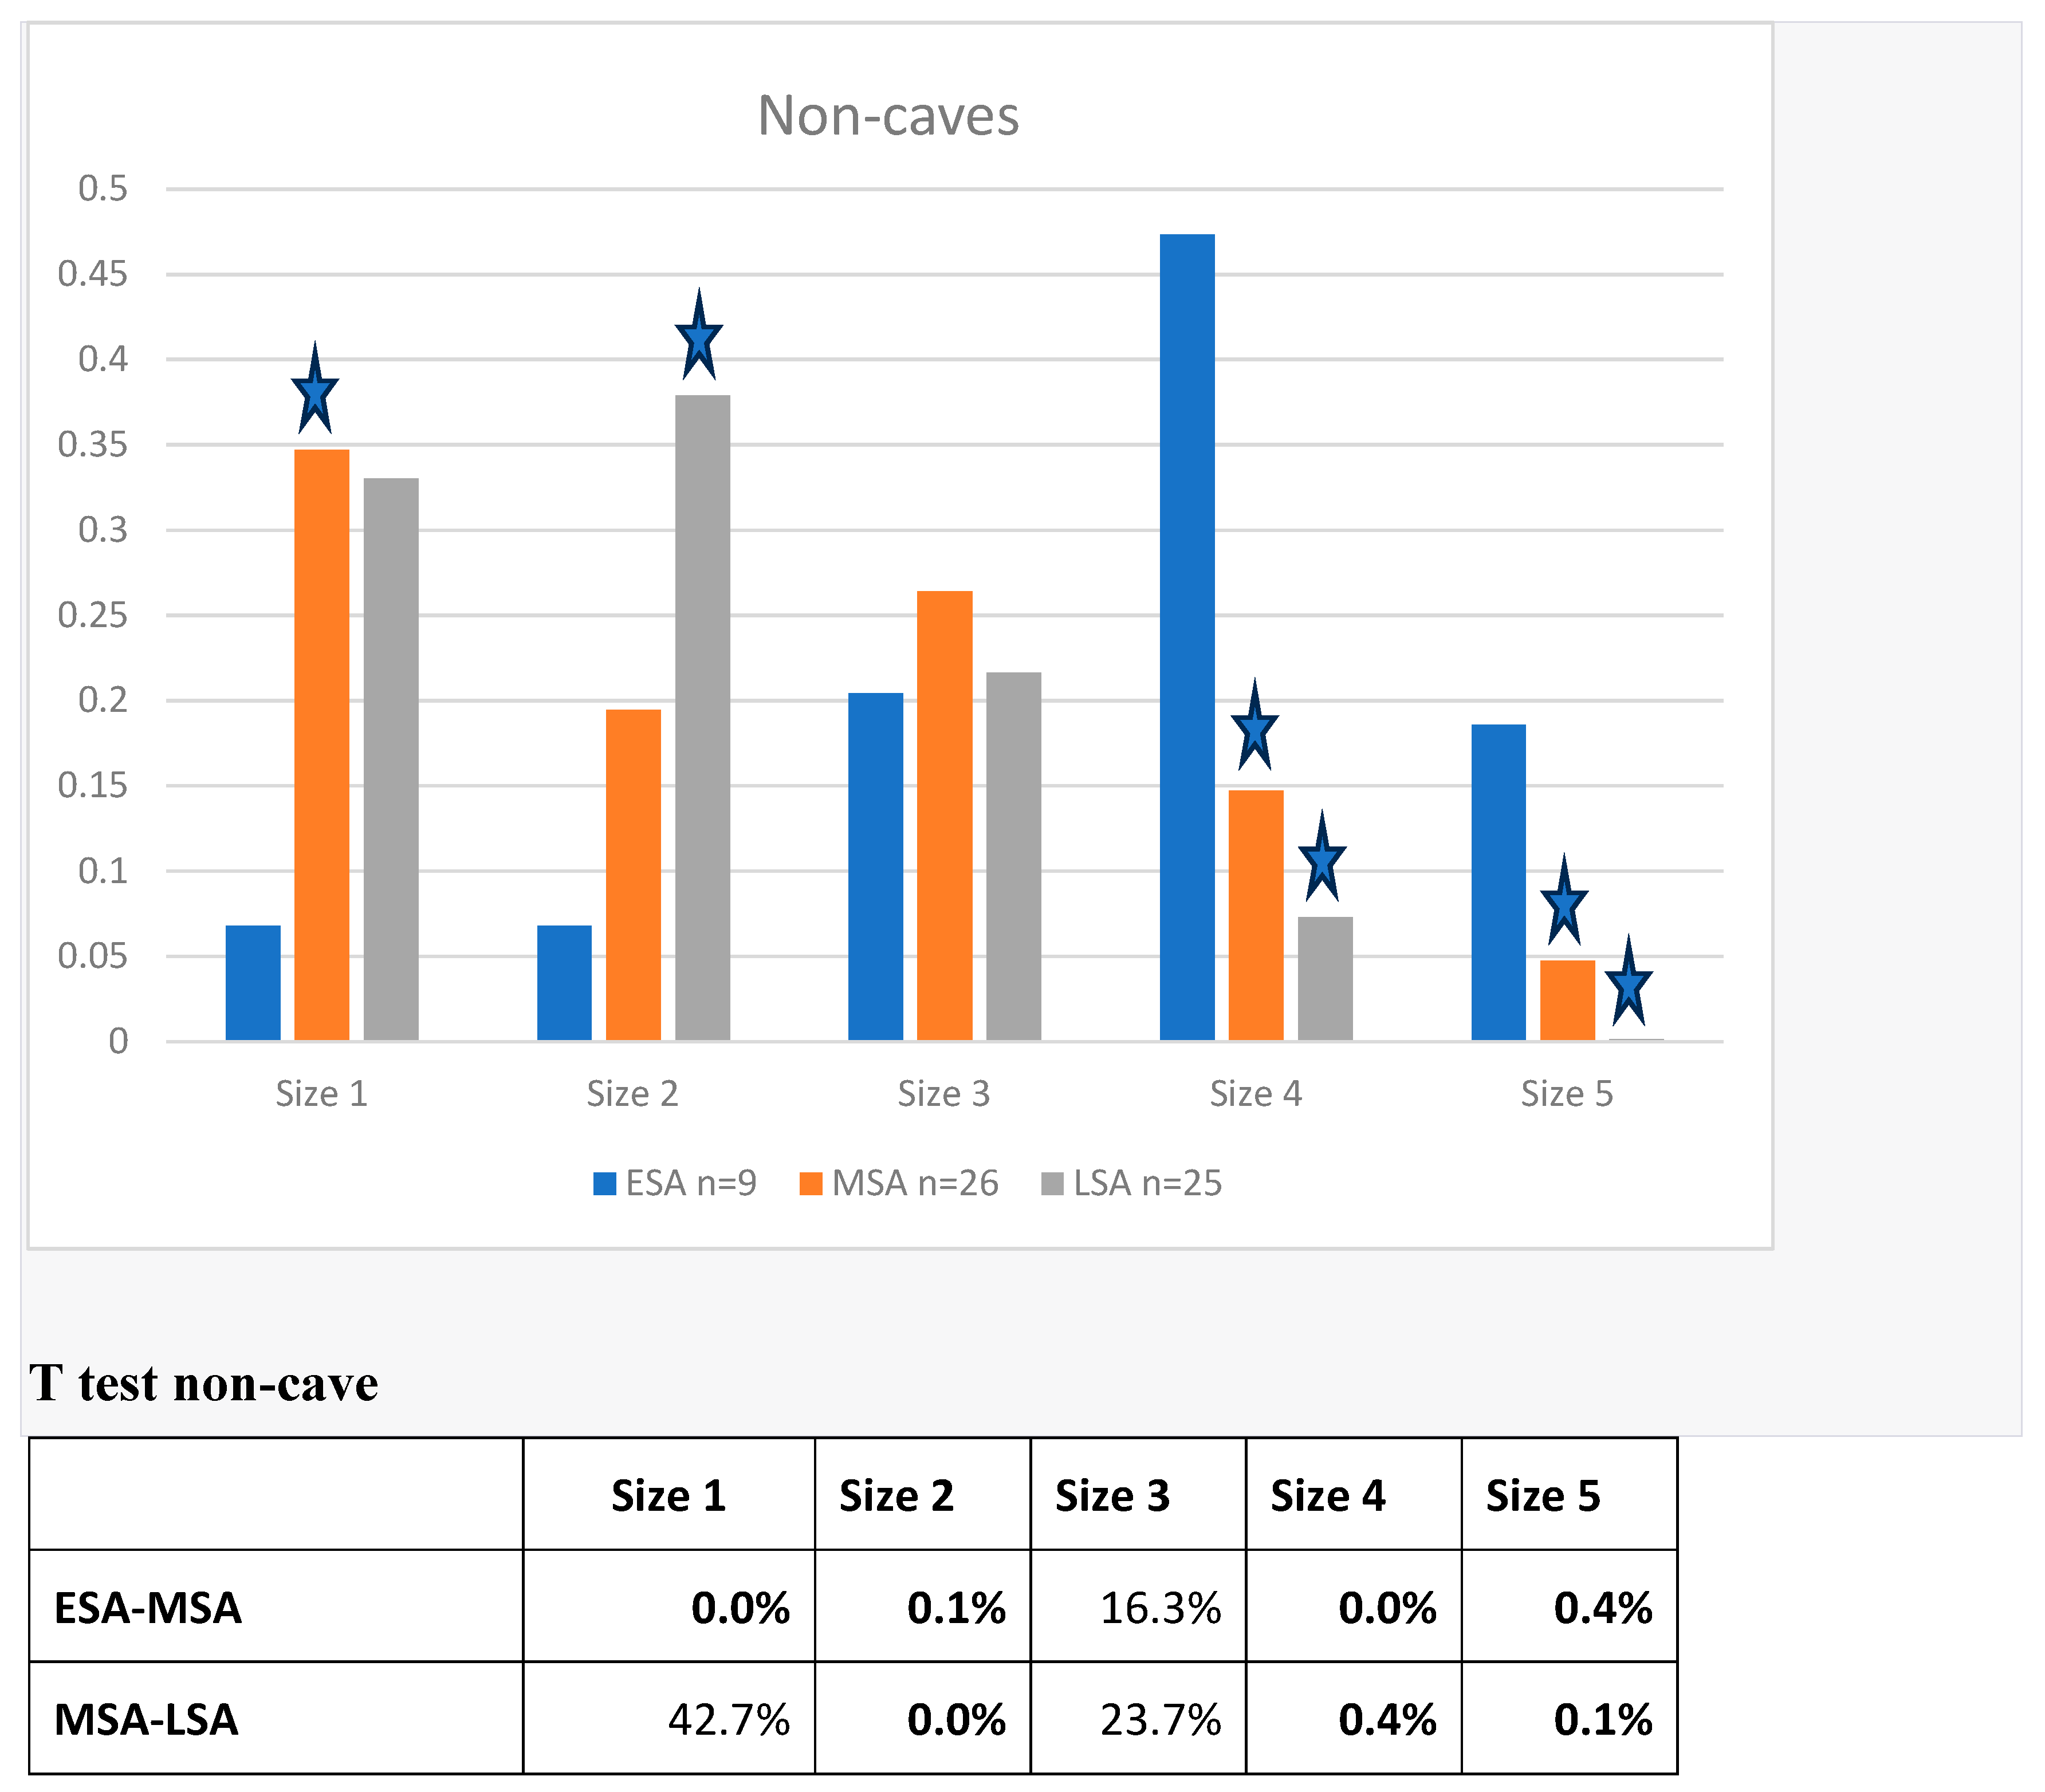
Megafauna extinctions are known from the Late Quaternary. This study analyzes trends in prey size from 184 contexts across 49 archaeological sites in southern Africa to assess changes in prey size during the Pleistocene, including the pre-Late Quaternary transition between the Early Stone Age (ESA) and the Middle Stone Age (MSA). Very large prey (>950kg) accounted for over 34% of the biomass in the ESA, declining to 22% in MSA and 11% in LSA, with a compensatory increase in the contribution of smaller (<295 kg) prey that increased from 7% in the ESA to 37% in the MSA and to 48% in the LSA. These trends persisted even when only non-cave sites were considered. We also hypothesize that targeting fat in prey because of a constraint on protein consumption by humans could have been a causal factor in the decline.

Keywords: 
;  ;  ;  ;  

Introduction

Accumulating evidence suggests biased large prey species’ population declines and extinctions before the well-studied Late Quaternary Megafauna Extinction (LQE) (Barnosky et al., 2004).
Here, we present the results of a study of prey size trends in Pleistocene southern Africa based on an analysis of 184 layers from 49 archaeological sites covering the entire Pleistocene. The central position of Africa in human evolution and the relative scarcity of late ESA and early MSA sites in eastern Africa make this study of particular importance.
Establishing 62 million years of terrestrial herbivores’ mean body size increase, Smith et al. (2018) observed that by the beginning of the Late Pleistocene, the mean body mass of terrestrial mammals in Africa was half that found on other large continents. They remarked that human coexistence with large herbivores on the continent could be a cause for the decline. In East Africa, Faith et al. (2019) identified a Pliocene-Pleistocene herbivores’ size decline, which began with the extinction of large browsers seven million years ago. The decline of C3 vegetation could explain the decline. However, about a million years ago, a significant decrease in the richness of large grazer species occurred despite an increase in C4 biomass. Concurrently, there was a marked increase in the presence of size 2 species (weighing between 18-80 kilograms) starting around 1.8 million years ago and continuing throughout the rest of the Pleistocene. Similar trends were identified by (Bibi and Cantalapiedra, 2023).
Confirming the trend, Potts et al. (2020) and Faith et al. (2012) identified a faunal turnover in eastern Africa between approximately 780,000 and 320,000 years ago, during which smaller species gradually supplanted larger ones just before the Middle Stone Age (MSA) and Homo sapiens appearance. In the Southern Levant, an analysis of 133 stratigraphic layers across 58 Pleistocene and Early Holocene archaeological sites revealed a decline in the weighted mean body mass of prey in archaeological sites. This trend commenced during the Acheulean and continued throughout the Paleolithic period. No associated climatic fluctuations could be identified as triggers for these faunal size declines (Dembitzer et al., 2021). In a recent study, a trend of megaherbivore prevalence decline in five multi-cultural test cases in Africa, Spain, and France was identified in tandem with the appearance of the Middle Paleolithic and the Levallois method much before the LQE (Ben-Dor and Barkai, 2023).
While no in-depth pre-Late Pleistocene study concerning prey size trends has been published for Europe, preliminary observations have suggested a congruous decline at the Acheulean/Middle Paleolithic transition in the Iberian Peninsula (Yravedra, 2001; Rodríguez et al., 2011).
To sum up, there are significant indications for human prey size decline before the LQE.

Methodology

There could be extended periods of regional density declines prior to actual extinctions or extirpations of species (Dembitzer et al., 2021; Lomolino, 2023). We, therefore, attempted to identify general trends of prey animal representation in the archaeological record rather than species extinctions.
Archaeological sites contain zoological evidence in the form of fossilized bones that were brought to site by humans and other predators. Identification of human agency in these situations is partial as consumption of very large prey like elephants usually leave no cut marks on the bones (Haynes and Klimowicz, 2015). We therefore used the assemblages as paleontological data for trends in the availability of prey for predation, be it from humans or other predators. We do assume in our analysis that humans preferred to hunt larger prey when it was available Ben-Dor and Barkai, 2020).
To ensure the comprehensiveness of the analysis, we checked the list of sites against two lists of southern African sites: one encompassing 450 dated lithic assemblages that demarcate the durations of the Earlier Stone Age (ESA), Middle Stone Age (MSA) and Later Stone Age (LSA) and their respective technocomplexes (Lombard et al., 2022), and another comprising 211 sites with faunal remains, including both archaeological and paleontological contexts (Avery, 2019).
Table 1. Revised chrono-stratigraphic Stone Age sequence for southern Africa after Lombard et al. (2022).
Technocomplex 2012 suggested durations Revised age estimates
Median age Mean age±SD Most probable duration
LATER STONE AGE
ceramic final Later Stone Age <2 ka AD 774 AD 795± 698 AD 1493-97
final Later Stone Age 0.1-4 ka 546 BC 658 BC±1290 AD 632-1948 BC
Wilton 4-8 ka 4387 BC 4260 BC±1574 2686-5834 BC
Oakhurst 7-12 ka 8814 BC 8797 BC±2042 6755-10839 BC
Robberg 12-18 ka 13 705 BC 14 584 BC±3389 11 195-17 973 BC
early Later Stone Age 18-40 ka 25 998 BC 28 474 BC±8780 19 694-37 254 BC
MIDDLE STONE AGE
final Middle Stone Age 20-40 ka 37.7 ka 38.8 ±8.9 ka 29.9-47.7 ka
post-Howiesons Poort 45-58 ka 55.1 ka 53±6.6 ka 46.4-59.6 ka
Howiesons Poort 58-66 ka 62.4 ka 62.9±11.4 ka 51.5-74.3 ka
Still Bay 70-77 ka 75.2 ka 78.1±10.7 ka 67.4-88.8 ka
Mossel Bay 77-105 ka 88.2 ka 87.9±10.5 ka 77.4-98.4 ka
early Middle Stone Age 130-300 ka 206.5 ka 196.5±70 ka 126.5-266.5 ka
EARLIER STONE AGE
Fauresmith 200-600 ka 305 ka 352.6± 118.9 ka 233.7-471.5 ka
Acheulean 300 ka-1.5 Ma 770 ka 834.2± 402.6 431.6 ka-1.23 Ma
Oldowan 1.5-2 Ma 1.61 Ma 1.63 Ma± 546.5 ka 1.08-2.18 Ma
This cross-referencing process identified 61 archaeological sites containing 329 stratigraphic layers or excavated spits for which NISP (Number of Identified Specimens) data were available. We excluded contexts with a total NISP count of less than 30 since, in the averaging method, each layer gets equal weight, and we strived to eliminate random accumulations. This elimination resulted in the inclusion of 184 layers/spits from 49 sites in the analysis (see Supplementary Material). Due to the relatively limited availability of MNI (Minimum Number of Individuals) data, we did not perform a detailed analysis of this aspect of the dataset.
Table 2. Dataset description.
Period N sites N layers Avg. NISP/layer
LSA 21 56 550
MSA 26 113 933
ESA 8 15 1459
It should be noted that there is only data from 15 layers from 8 sites in the ESA. However, the NISP per site is high at 1459 compared to 933 in the MSA and 550 in the LSA.
To classify the animal species within appropriate size classes, we employed average weight data and referred to the Bovids size class system (Clark and Plug, 2008). The size classes were as follows: Bov 1 <23 kg; Bov 2 23-84 kg; Bov 3 85-295 kg; Bov 4 296-950 kg; Bov 5 >950 kg. We used size classes average weight to calculate faunal biomass because faunal size class are commonly reported for southern African sites. The approach allowed the incorporation of the commonly found data on size classes alone, not identified to species or genus level, expanding the scope of the analysis.
We calculated the relative presence of each size class within each context by dividing the total NISPs for the size class by the total NISPs of the context (layer/spit). Then, we calculated the average for each period by averaging the relative presence of each size class in all the contexts for the period. The model assumes that each context represents a distinct behavioral pattern rather than providing an absolute measure of the number of animals accumulated within the layer.
To assess the statistical significance of the declines in the relative presence of larger-size classes and the increase in the relative presence of smaller-size classes during the ESA-MSA transition and the MSA-LSA transition, we conducted t-tests for each size class after normalizing the dataset.
To further comprehend the implications of the declines in prey size, it is necessary to consider the relative energy derived from different size classes. For this purpose, we developed a biomass multiplier for the various size classes, which involved the following steps:
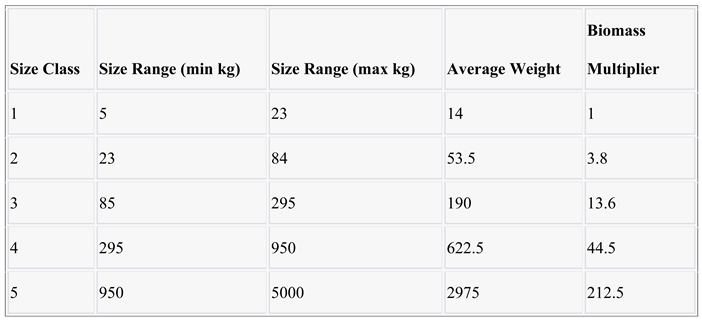
  • We calculated the average weight within each size class.
  • Taking the average weight of size class 1 as the reference, we divided the average weight of each size class by the average weight of size class 1 to determine the multiplier.
  • The average relative presence of each size class within each period was multiplied by the corresponding relative size multiplier.
  • To obtain the ratio of each size class within the period, we divided the result from step 3 by the sum of the multiplied size classes for that period.
Table 3. Size classes - size ranges, average weights, and biomass multipliers for each size class:.
Preprints 139434 i001
By considering the relative biomass contribution of each size class, we can estimate the relative energy that could be obtained from the prey of different sizes. This step may provide a more comprehensive understanding of the implications for humans of the observed changes in the relative presence of different size classes.
We restricted the calculation to biomass and not the caloric content of the prey because the caloric content is strongly associated with the fat content of the animal, which fluctuates widely between seasons, genders, and age groups (Owen-Smith, 2002). These parameters are not available in the dataset.

Results

NISP data t-tests indicate statistically significant prey large size declines and small size inclines at archaeological sites between the ESA and MSA and between the MSA and LSA (Figure 1).
For the transition from the ESA to the MSA, we found statistically significant declines in size classes 5 and 4 and a non-significant decline in size 3, indicating a decrease in the relative presence of larger prey animals. Additionally, there was a significant increase in the size class 1 and a non-significant increase in size 2 presence, indicating an increase in the representation of smaller prey animals during this transition.
The same trend continued between the MSA and the LSA. There was a statistically significant decline in size classes 5 and 4, a significant increase in the relative presence of size class 2, and a non-significant increase in size 1.
These changes in prey size distribution provide valuable insights into potential shifts in hunting strategies, resource availability, and human-animal interactions across these archaeological phases.

Biomass Contribution Analysis

The application of the biomass contribution analysis reveals the significant impact of the decline in size 5 (>950 kgs) prey on the overall biomass distribution throughout the periods. This trend is consistently observed in both the transition to the MSA and later to the LSA. In the MSA, the decline in size 5 compared to the ESA was compensated by a relative increase in size 4 and the smaller sizes 1 and 2, while size 3 remained at the same share of the biomass. In the LSA, however, a further decline in size 5 was compensated for by an increase in the share of sizes 1-3, but the share of size 4 persisted, indicating a further tendency to rely on smaller prey (Figure 2).
It is important to highlight that although the two largest size groups consistently accounted for most of the biomass throughout the Pleistocene, their combined share diminished throughout the Periods. In the ESA, size classes 5 and 4 collectively contributed 71% of the biomass, which decreased to 65% in the MSA and further declined to 51% in the LSA. Despite their declining proportion, these findings underscore the significant role played by larger prey animals in terms of biomass throughout all three archaeological periods. The results also underscore the increasing contribution of biomass of the small sizes 1 and 2 (5-84 kgs) in the LSA, from 7% of the biomass in the ESA to 21% in the LSA.

Discussion

The cumulative pattern observed in these records is influenced by preference and availability. There is evidence for humans’ historical preference for large prey based both on ethnographic (Jochim, 1981; Redford, 1992; Bodmer et al., 1997; Bennett et al., 2002; Jerozolimski and Peres, 2003; Hill et al., 2019; Ripple et al., 2019)and archaeological (Bunn and Ezzo, 1993; Hawkes et al., 2001; Bunn, 2006; Surovell and Waguespack, 2009; Speth, 2010; Broughton et al., 2011; Wood and Marlowe, 2013; Dominguez-Rodrigo et al., 2014; Ben-Dor and Barkai, 2020; Linares Matás and Yravedra, 2022). Thus, a decline in prey size in archaeological sites may have reflected a decrease in the availability of such prey.
The results suggest a trend of declining prey size in southern Africa in the transitions between the ESA, the MSA, and the LSA.
It is noteworthy that there is a substantial disparity between the NISP-based analysis and the biomass-based analysis. The cumulative NISPs of size classes 1 and 2 account for a significant proportion (58% in MSA and 69% in LSA) of the total NISPs, whereas the cumulative biomass contribution is much lower (7% in MSA and 13% in LSA). This divergence between the relative quantity of small prey and its biomass contribution is not unique to human predation. Studies on lion predation in the Kruger National Park (Owen-Smith & Mills, 2008) have demonstrated a similar pattern, where the relative number of small prey kills significantly outweighs their biomass contribution. The inclusion of the analysis of the biomass contribution, though more roughly estimated, adds insight as it represents the parameter that drove the prey acquisition – the need for energy. The analysis emphasizes the relative importance of the successive declines in the contribution of the very large (>950) prey between the periods. Both declines in the MSA and the LSA were statistically significant, based on the NISP data, and the fact that the decline is also found in the larger dataset of the MSA and the LSA places a higher probability on the correctness of the earlier decline between the ESA and the MSA despite the ESA’s relatively smaller number of contexts and sites.
The data shed light on the changing dynamics of prey availability and exploitation strategies. The decline in very large prey and the subsequent compensatory increase in smaller prey may indicate shifts in hunting technology (e.g., Lombard, 2021). According to ethnographic data (Churchill, 1993), hunting very large prey fundamentally differs from hunting smaller prey. Megaherbivores like elephants and rhinos do not tend to escape in the face of a threat and are usually hunted by limiting their mobility, by a pit trap, for example, and subsequent dispatching by thrusting spears. Smaller prey tends to escape and is hunted by first hitting it with a sharp point to cause bleeding and then tracking the wounded prey. This difference may explain the evolution of hunting weapons (Ben-Dor and Barkai, 2023) with the decline in prey size from the earliest evidence for a hunting weapon in the form of a wooden-tipped spear (Bridgland et al., 1999) (in Europe) through stone-tipped spears in the MSA (Wilkins et al., 2012) to projectile weapons near the end of the MSA and during the LSA (Lombard, 2020).
For example, in the southern African context, previous research by Clark and Plug (2008) identified a decrease in prey size at Sibudu Cave during the Howiesons Poort phase (Table 1), which was associated with climate change (Clark, 2013). They found 68% of NISPs from size class 1, compared to 21% in the post-Howiesons Poort phase. The introduction of the bow and arrow (e.g., Lombard, 2011; Backwell et al., 2018), and possibly also snares (Wadley, 2010) at Sibudu Cave during the Howiesons Poort could be seen as an adaptation to the increased relative availability of small prey.
To further explore the changing prey size pattern in southern Africa, we compared the trends of relative biomass contribution of the size groups in southern Africa and the Levant (Dembitzer et al., 2021) (Figure 3 and Figure 4, respectively). The most conspicuous phenomenon in the Levant is the disappearance of elephants by the end of the Acheulean, while in southern Africa, elephants are found in archaeological sites throughout the Pleistocene, although, as the data show, in declining rates. The size grouping and the periods dealt with are slightly different in the Levant paper; however, a clear difference emerges between the regions. In the Levant, there is a clear trend of the dominance of one size group in each period and the replacement of the dominant size group by the next smaller one in each successive period. By the UP and the Epipaleolithic (EP), the smallest size groups contributed two-thirds of the biomass in this region. In southern Africa, however, the decline in the largest size class’s contribution is more gradual compared to the Levant, and the core of the contribution remains in size classes 4 and 3 (85-950 kgs), which compose more than half of the biomass, in the ESA, MSA, and LSA.
This difference in large prey availability could be attributed to South Africa’s large geographic landmass compared to the southern Levant, a small cul de sac. Also, sub-Saharan Africa, or the Afrotropic, is one of the most biodiverse regions globally, with only the southern American neotropics having a greater species diversity. In sub-Saharan Africa, southern Africa has the greatest carrying capacity (Kier et al., 2005; Mutke and Barthlott, 2005).
Smith et al. (2019b), who explored subsistence patterns in Africa during the Middle Pleistocene, also found a decline in prey size in Africa during the period. They concluded that the decline they identified was only an artifact of the dominance of cave sites during the MSA, to which smaller prey body parts were transported compared to the ESA. However, based on our analysis, prey size decline also occurred in non-cave sites in the MSA (Figure 5), with significant t-test results for a decline in size classes 4 and 5 and an increase in size classes 1 and 2 between the ESA and the MSA – and the trend continues through the LSA. It is quite likely that the cause and effect are opposite to what Smith et al. (2019b) assumed, i.e., that the dominance of cave sites in the MSA is a result of the decline in the share of size 5 prey, which was previously more often consumed at the open killing sites.

Climate and Prey size Decline

A general trend of increasing aridity, accompanied by heightened climatic variability, has been observed in both East Africa (Trauth et al., 2010; Faith, 2014; Potts and Faith, 2015) and Southern Africa (Ziegler et al., 2013; Caley et al., 2018; Scott and Neumann, 2018; Mackay et al., 2022) during the Pleistocene. These climatic shifts have been implicated in human speciation and cultural transformations throughout the Pleistocene (Gosling et al., 2022). Specifically, Potts et al. (2018) describe a notable correlation between a drying trend, herbivores’ size reduction, and events of speciation and cultural change. In eastern Africa, this correlation is evidenced by a faunal turnover in which smaller species supplant larger, extinct species. This turnover is temporally and spatially associated with increased climatic variability, the emergence of Homo sapiens, and the appearance of the Middle Stone Age (MSA) in East Africa. A possible human-climate shared responsibility for the size decline is raised by Potts et al. (2020), who propose that human predation could have contributed to the turnover, with the advent of MSA stone points likely serving as an adaptive response to the necessity of hunting smaller prey.
To conclude that climate influenced prey size decline, especially the pronounced decline in size 5 prey identified here, one must explain why a climate change would preferentially affect size 5 prey. Reconstructing herbivore distribution in Africa, Hempson et al. (2015) found that elephants exhibited a lack of response to vegetation composition due to their ability to utilize low-quality forage. However, water dependency can be a limiting factor for the groups of mostly large nonruminants (e.g., elephants and rhinos) and large water-dependent browsers. This analysis may point to a potential biased climate change effect of declining large prey when water bodies’ numbers and levels decline.
There is ongoing debate about the extent of climate change during the transition from the ESA to the MSA in southern Africa, and regions within southern Africa are differently influenced by climatic change (Wurz, 2014). However, recent indications point to a relatively wet period at the early MSA (Mis 8-6) from Wonderwerk Cave, Kathu Pan, Bundu Farm, and Florisbad (Lukich and Ecker, 2022). Moreover, the stability in the relative biomass share of size 4 (Figure 2), which also includes water-dependent species, points to a weaker influence of this factor if, indeed, drying reduced the distribution of water bodies.
The transition to the LSA occurred during MIS 3, marked by fluctuating climatic conditions that included moist and cool periods (Lukich and Ecker, 2022). However, in the southern Cape, it was associated with hyperaridity and a hiatus in some sites (Wurz, 2013).
To sum up, climate reconstruction of the entire southern African region is a work in progress, but at the moment, there is no strong evidence for a major drying up of water bodies in the transition between the ESA and the MSA and the MSA and the LSA, and thus we could not conclude that there was a climatic reason for the identified decline.
In the Levant, no association was found between the size decline and climatic indicators pointing to a possible anthropogenic contribution to the decline (Dembitzer et al., 2021). Further research of prey size dynamics during the pre-LQE in Europe and the rest of Asia may provide a better picture of human-prey size historical relationships and a more definitive answer regarding the climatic versus anthropogenic contribution to the changes.

Was Human Predation a Factor in the Decline in Prey Size?

Identifying prey size declines at various times and places throughout prehistory, as we detailed in the introduction, and the finding of this research naturally raises the question of human contribution to the decline. A large body of research advocates anthropogenic cause for the LQE (e.g., Koch and Barnosky, 2006; Sandom et al., 2014; Smith et al., 2019a; Taylor Lemoine et al., 2023), but that conclusion is not unanimously accepted (e.g., Wroe et al., 2013; Grayson and Meltzer, 2015; Meltzer, 2020).
Martin (1966) was the first to offer the hypothesis regarding declines in earlier periods. However, it was not until much later that it was followed by Smith et al. (2018), who suggested that a decline in Africa’s pre-Late Pleistocene presence of large mammals was noticed in the form of half the expected mean body size of terrestrial mammals at the beginning of the Late Pleistocene (125 ka) compared to other large continents and that the long coexistence of humans and mammals on the continent could provide an explanation for the decline.
Faith et al. (2020) accepted Homo sapiens’ contribution to the herbivores’ size decline in Africa, presumably beginning around 300 ka but objected to relating any contribution on the part of previous Homo species. Interestingly, Faith et al. (2019) identified a significant decline in the richness of large grazer species a million years ago despite an increase in C4 biomass, but they attributed the decline to abiotic causes. The decline in prey size in the Levant between the Lower Paleolithic and the Middle Paleolithic was not accompanied by climate change, leading to a possibility of anthropogenic cause (Dembitzer et al., 2021).
For proponents of the anthropogenic contribution to megafaunal extinction, a key question is why and how humans exerted additional predation pressure compared to other predators, leading to the continuous biased population declines of the largest megafaunal species. We propose a driver of this size bias throughout the Paleolithic period – the human quest for fat to mitigate a protein metabolism constraint.
Speth and Spielmann (1983) hypothesized that due to limitations in utilizing protein as an energy source (Rudman et al., 1973; Bilsborough and Mann, 2006), humans can become dependent on a relatively high level of fat consumption. This dependency may have led humans to target prey with high-fat reserves preferentially. Consequently, large species, having high-fat reserves, were a preferred target of human predation. Another unique human pattern, targeting the fatter reproductive segment of prime adults in prey species (Stiner, 1990), could have made the species’ populations less stable, exposing them to extinction or population decline risks. Furthermore, the human pursuit of fat led to preferential transportation of fatty parts and wasteful prey exploitation at higher rates and more sensitive seasons to the prey’s population growth than established predators.
Plenty of evidence from ethnographic sources shows that prey’s fat content was a major choice criterion (Lee, 1969; Tindale, 1972; Jochim, 1981; Coote and Shelton, 1992; Speth, 2010; Kelly, 2013; Tanner, 2014). Kelly (2013) sums the evidence in his authoritative volume ‘The Lifeways of Hunter-Gatherers.’ in a section on the pivotal role of fat (p. 71) and concludes (p. 74): “It may, therefore, be fat rather than protein that drives the desire for meat in many foraging societies.”
Below, we describe how fat-directed hunting could have affected the stability of the human prey population.

Hunting Very Large Prey

Larger mammals have been found to buffer a higher relative amount of fat compared to smaller mammals (Pitts and Bullard, 1967; Calder, 1984) and tend to maintain relatively high levels of fat during periods of nutritional stress (Lindstedt and Boyce, 1985; Owen-Smith, 2002) when fat becomes scarcer. Based on a dataset of the body composition of 257 wild East African common prey animals (Ledger, 1968), large prey mammals were found to contain significantly more body fat, relative to their body weight, than smaller animals (Ben-Dor et al., 2011).
Very large terrestrial animals have survival benefits because of their lower predation risk and because they can utilize low-quality forage and are relatively energetically efficient in relation to their body size (Lindstedt and Boyce, 1985; Owen-Smith, 2002). On the other hand, they are less tolerant if there is predation risk because of their low initial population densities and slower life histories (Cardillo et al., 2005).

Preferential Hunting of Prime Adults

There are plenty of archaeological sites worldwide and throughout the Middle and Late Pleistocene where preferential hunting of prime adults was identified (Stiner, 1990; Enloe, 1997; Hoffecker, 1999; Adler, 2006; Burke, 2006; Clark and Plug, 2008; Gaudzinski-Windheuser and Niven, 2009; Prendergast et al., 2009; Gaudzinski-Windheuser and Roebroeks, 2011; Stiner et al., 2011; Speth, 2012; Rodríguez-Hidalgo et al., 2015; Bunn, 2019).
Humans’ preference for targeting prime-adult prey represents an ecologically unprecedented behavior, as they are the only known predators to preferentially focus on the reproductive core of a population (Stiner, 2012).
Prime adult males and females are typically in the middle of their reproductive roles (rut and pregnancy) when their fat content is maximal. By targeting these healthy and mature individuals in the quest for fat, human hunters might have significantly reduced the number of offspring born and limited the genetic diversity within a population, leading to their population declines or extinctions.

The Biased Transportation of Fatty Body Parts

Partial consumption, also known as wasteful consumption, where predators exploit only a portion of their acquired prey, is observed across a wide range of mammal and non-mammal predators. This phenomenon is often associated with increased prey density (Kruuk, 1972; Miller et al., 1985; Court, 1996; Stirling and Guravich, 1998; Fantinou et al., 2008).
Partial transportation of butchered prey body parts is a common human behavior, and in several cases, fat-biased transportation has been shown (Morin, 2012; Morin and Ready, 2013). Speth (1983) first identified the human need for fat to supply the non-protein component of the diet when finding preferential transportation of fatty body parts in a bison kill site in New Mexico.
Agam and Barkai (2016) suggest that the high fat content in proboscideans’ heads was a primary reason for their preferential transport to central locations. For example, in the difficult-to-access Bolomor Cave, elephant heads were transported to the cave with great effort in MIS 9 to MIS 6 (Blasco and Fernández Peris, 2012). In Gesher Not Ya’acov, 780 thousand years ago, an elephant head was positioned and damaged in such a way as to suggest deliberate breakage for brain extraction (Goren-Inbar et al., 1994). Additionally, recent research has uncovered deliberate accumulation and preservation of fallow deer metapodials, indicative of medium-term marrow storage, at Qesem Cave around 400,000 to 200,000 years ago (Blasco et al., 2019).

A Possible Combined Fat-Targeting and Climatic Influence as a Cause of Prey Size Decline and Evolutionary and Cultural Changes

Here, we described how fat-targeting of prey may create population growth pressure. We accept that climate change could have also caused prey population changes and speciation. It is conceivable that, in certain circumstances, fat-targeting increases a species’ sensitivity to population effects of abiotic factors. For example, Potts and Faith (2015) identified nine periods of high climatic variability associated with human evolutionary and cultural changes, and it is possible that climatic and fat-targeting prey population effects combined to cause the observable change in the prey populations and the resultant evolutionary and cultural change.

Conclusions

A study examining the zooarchaeological record of 184 stratigraphic layers in South Africa identified a decline in prey size between the Earlier Stone Age (ESA) and the Middle Stone Age (MSA), as well as between the MSA and the Later Stone Age (LSA). A biomass analysis of the decline found that the most significant contribution was the decline in large (>950 kgs) megaherbivores throughout the transitions between the ESA, the MSA, and the LSA. This finding aligns with previous observations of prey size decline in East Africa and the Levant during the Middle to Late Pleistocene and the global Late Quaternary Megafauna Extinction. By extending the recognition of these patterns to South Africa, the study contributes to understanding the broader impacts of prey size declines on human evolution and behavioral adaptations.
Despite a known continent-wide pattern of drying and increased climatic variability in Africa, in the present climatic reconstruction record of southern Africa, we could not identify climatic indicators such as a reduction in the number and water level of water bodies that could explain the marked declines in size 5 prey biomass contributions in the MSA and the LSA. We proposed that fat-targeting dictated prey choice and exploitation patterns that could impose population pressure on prey in general and large and medium-sized prey in particular, leading to the observed pattern of gradual prey size decline. Identifying the decline further supports our hypothesis of the need to adapt to prey size decline as a primal selecting agent in human physiological and cultural evolution. Since Homo neanderthalensis was subject to a similar protein constraint as humans (Ben-Dor et al., 2016), further studies of prey size dynamics, especially in Europe, may further contribute to the testing of the hypothesis.

Supplementary Materials

The following supporting information can be downloaded at the website of this paper posted on Preprints.org.

Data Availability

The database of this paper can be found in an Excel file in Medeley.com DOI:10.17632/2z9v7b9vp3.1.

Conflicts of Interest

The authors declare no conflicts of interest.

References

  1. Adler, D. 2006. Ahead of the game. Current Anthropology 47(1):89-118.
  2. Agam, A. and Barkai, R 2016. Not the brain alone: The nutritional potential of elephant heads in Paleolithic sites. Quat Int 406:218-226. [CrossRef]
  3. Avery, DM. 2019. A fossil history of southern African land mammals: Cambridge University Press.
  4. Backwell, L. Bradfieldm, J. Carlson, K.J. Jashashvili, T. Wadley, L. and d’Errico F 2018 The antiquity of bow-and-arrow technology: evidence from Middle Stone Age layers at Sibudu Cave. Antiquity 92(362):289-303.
  5. Barnosky, AD. Koch, PL. Feranec, R.S. Wing, S.L. and Shabel AB 2004. Assessing the causes of Late Pleistocene extinctions on the continents. Science 306(5693):70-75. [CrossRef]
  6. Ben-Dor, M. and Barkai, R 2020. The importance of large prey animals during the Pleistocene and the implications of their extinction on the use of dietary ethnographic analogies. Journal of Anthropological Archaeology 59:101192. [CrossRef]
  7. Ben-Dor, M. and Barkai, R 2023 The Evolution of Paleolithic Hunting Weapons: A Response to Declining Prey Size. Quaternary 6(3):46. [CrossRef]
  8. Ben-Dor, M. Gopher, A. and Barkai, R 2016 Neandertals’ large lower thorax may represent adaptation to high protein diet. American Journal of Physical Anthropology 160(3):367-378. [CrossRef]
  9. Ben-Dor, M. Gopher, A. Hershkovitz, I. and Barkai, R 2011. Man the fat hunter: The demise of Homo erectus and the emergence of a new hominin lineage in the Middle Pleistocene (ca. 400 kyr) Levant. PLoS One 6(12):e28689. [CrossRef]
  10. Bennett, E. Eves, H. Robinson, J. and Wilkie, D 2002 Why is eating bushmeat a biodiversity crisis. Conserv Biol Pract 3(1):28-29.
  11. Bibi, F. and Cantalapiedra, J.L 2023. Plio-Pleistocene African megaherbivore losses associated with community biomass restructuring. Science 380(6649):1076-1080. [CrossRef]
  12. Bilsborough, S. and Mann, N 2006. A review of issues of dietary protein intake in humans. Int J Sport Nutr Exerc Metab 16(2):129-152. [CrossRef]
  13. Blasco, R. and Fernández Peris, J 2012 A uniquely broad spectrum diet during the Middle Pleistocene at Bolomor Cave (Valencia, Spain). Quat Int 252:16-31. [CrossRef]
  14. Blasco, R. Rosell, J. Arilla, M. Margalida, A. Villalba, D. Gopher, A. and Barkai, R 2019. Bone marrow storage and delayed consumption at Middle Pleistocene Qesem Cave, Israel (420 to 200 ka). Science Advances 5(10):eaav9822. [CrossRef]
  15. Bodmer, R.E. Eisenberg, J.F. and Redford, K.H 1997. Hunting and the likelihood of extinction of Amazonian mammals: Caza y Probabilidad de Extinción de Mamiferos Amazónicos. Conservation Biology 11(2):460-466. [CrossRef]
  16. Bridgland, DR. Field, M.H. Holmes, J.A. McNabb, J. Preece, R.C. Selby, I. Wymer ,J.J. Boreham, S. Irving, B.G. and Parfitt, S.A 1999. Middle Pleistocene interglacial Thames–Medway deposits at Clacton-on-Sea, England: reconsideration of the biostratigraphical and environmental context of the type Clactonian Palaeolithic industry. Quat Sci Rev 18(1):109-146. [CrossRef]
  17. Broughton, J.M. Cannon, M.D. Bayham, F.E. and Byers, D.A 2011. Prey body size and ranking in zooarchaeology: Theory. empirical evidence, and applications from the northern Great Basin. American Antiquity 76(3):403-428. [CrossRef]
  18. Bunn, HT. 2006. Meat made us human. In: Ungar, P.S. editor. Evolution of the human diet: The known, the unknown, and the unknowable: Oxford University Press. p 191-211.
  19. Bunn, HT. 2019. Large ungulate mortality profiles and ambush hunting by Acheulean-age hominins at Elandsfontein, Western Cape Province, South Africa. Journal of Archaeological Science 107:40-49. [CrossRef]
  20. Bunn, H.T. and Ezzo, J.A 1993. Hunting and scavenging by Plio-Pleistocene hominids: Nutritional constraints, archaeological patterns, and behavioural implications. Journal of Archaeological Science 20(4):365-398. [CrossRef]
  21. Burke, A. 2006. Neanderthal settlement patterns in Crimea: a landscape approach. Journal of Anthropological Archaeology 25(4):510-523. [CrossRef]
  22. Calder, W.A. 1984. Size, function and life history. Cambridge, Mass.: Harvard University Press.
  23. Caley, T. Extier ,T. Collins, JA. Schefuß, E. Dupont, L. Malaizé, B. Rossignol, L. Souron, A. McClymont, E.L. and Jimenez-Espejo, F.J 2018. A two-million-year-long hydroclimatic context for hominin evolution in southeastern Africa. Nature 560(7716):76-79. [CrossRef]
  24. Cardillo, M. Mace, G.M. Jones, K.E. Bielby, J. Bininda-Emonds, O.R. Sechrest, W. Orme, C.D.L. and Purvis, A 2005. Multiple causes of high extinction risk in large mammal species. Science 309(5738):1239-1241. [CrossRef]
  25. Churchill, SE. 1993. Weapon technology, prey size selection, and hunting methods in modern hunter-gatherers: Implications for hunting in the Palaeolithic and Mesolithic. Archeological Papers of the American Anthropological Association 4(1):11-24. [CrossRef]
  26. Clark, J.L. and Plug, I 2008. Animal exploitation strategies during the South African Middle Stone Age: howiesons Poort and post-Howiesons Poort fauna from Sibudu cave. Journal of Human Evolution 54(6):886-898. [CrossRef]
  27. Coote, J. and Shelton, A 1992. Anthropology, Art, and Aesthetics: Clarendon Press.
  28. Court ,G. 1996. The seal’s own skin game. NATURAL HISTORY 105(8):36-41.
  29. Dembitzer, J. Barkai, R. Ben-Dor, M. and Meiri, S 2021. Levantine Overkill: 1.5 Million Years of Hunting Down the Body Size Distribution in the Paleolithic Southern Levant. Quat Sci Rev 276(107316). [CrossRef]
  30. Dominguez-Rodrigo, M. Bunn, H.T. Mabulla, A.Z.P. Baquedano, E. Uribelarrea, D. Perez-Gonzalez, A. Gidna, A. Yravedra, J. Diez-Martin, F. Egeland, C.P. et al. 2014. On meat eating and human evolution: A taphonomic analysis of BK4b (Upper Bed II, Olduvai Gorge, Tanzania), and its bearing on hominin megafaunal consumption. Quat Int 322:129-152. [CrossRef]
  31. Enloe, J.G. 1997. Seasonality and age structure in remains of Rangifer tarandus: Magdalenian hunting strategy at Verberie. Anthropozoologica 25(26):95-102.
  32. Faith, J.T. 2014. Late Pleistocene and Holocene mammal extinctions on continental Africa. Earth-Science Reviews 128:105-121. [CrossRef]
  33. Faith, J.T. Potts, R. Plummer, T.W. Bishop, L.C. Marean, C.W. and Tryon, CA 2012. New perspectives on middle Pleistocene change in the large mammal faunas of East Africa: Damaliscus hypsodon sp. nov.(Mammalia, Artiodactyla) from Lainyamok, Kenya. Palaeogeogr, Palaeoclimatol, Palaeoecol 361:84-93. [CrossRef]
  34. Faith, J.T. Rowan, J. and Du, A 2019. Early hominins evolved within non-analog ecosystems. Proceedings of the National Academy of Sciences:21478-21483. [CrossRef]
  35. Faith, J.T. Rowan, J. Du, A. and Barr W.A 2020. The uncertain case for human-driven extinctions prior to Homo sapiens. Quatern Res 96:88-104. [CrossRef]
  36. Fantinou, A. Perdikis, D.C. Maselou, D. and Lambropoulos, P 2008. Prey killing without consumption: Does Macrolophus pygmaeus show adaptive foraging behaviour? Biol Control 47(2):187-193. [CrossRef]
  37. Gaudzinski-Windheuser, S. and Niven, L 2009. Hominin Subsistence Patterns During the Middle and Late Paleolithic in Northwestern Europe. In: Hublin, J.J. and Richards, M.P. editors. Evolution of Hominin Diets: Integrating approaches to the study of palaeolithic subsistence. Berlin: Springer Verlag. p 99-111. [CrossRef]
  38. Gaudzinski-Windheuser, S. and Roebroeks, W 2011. On Neanderthal Subsistence in Last Interglacial Forested Environments in Northern Europe. In: Conard, N.J. and Richter, J. editors. Neanderthal Lifeways, Subsistence and Technology. Dordrecht: Springer. p 61-71. [CrossRef]
  39. Goren-Inbar, N. Lister, A. Werker, E. and Chech, M 1994. A butchered elephant skull and associated artifacts from the Acheulian site of Gesher Benot Ya’aqov, Israel. Paleorient:99-112.
  40. Gosling, W.D. Scerri, E.M. and Kaboth-Bahr, S 2022. The climate and vegetation backdrop to hominin evolution in Africa. Philosophical Transactions of the Royal Society B 377(1849):20200483.
  41. Grayson, D.K. and Meltzer, D.J 2015. Revisiting Paleoindian exploitation of extinct North American mammals. Journal of Archaeological Science 56:177-193. [CrossRef]
  42. Hawkes, K. Oconnell, J.F. Blurton, Jones N.G. Bell, D. Bird, R. Bird, D. Hames, R. Ivey, P. Judge, D. and Kazankov, A 2001. Hunting and nuclear families: Some lessons from the Hadza about mens work. Current Anthropology 42(5):681-709. [CrossRef]
  43. Haynes G, and Klimowicz J. 2015. Recent elephant-carcass utilization as a basis for interpreting mammoth exploitation. Quat Int 359:19-37. [CrossRef]
  44. Hempson, G.P. Archibald, S. and Bond, W.J 2015. A continent-wide assessment of the form and intensity of large mammal herbivory in Africa. Science 350(6264):1056-1061. [CrossRef]
  45. Hill, J.E. DeVault, T.L. and Belant, JL 2019. Cause-specific mortality of the world’s terrestrial vertebrates. Global Ecology and Biogeography 28(5):680-689. [CrossRef]
  46. Hoffecker, JF. 1999. Neanderthals and modern humans in Eastern Europe. Evol Anthropol 7(4):129-141.
  47. Jerozolimski, A. and Peres C.A 2003. Bringing home the biggest bacon: a cross-site analysis of the structure of hunter-kill profiles in Neotropical forests. Biological Conservation 111(3):415-425. [CrossRef]
  48. Jochim, MA. 1981. Strategies for survival: Cultural behavior in an ecological context. NY: Academic Press.
  49. Kelly, RL. 2013. The lifeways of hunter-gatherers: The foraging spectrum. Cambridge: Cambridge University Press.
  50. Kier, G. Mutke, J. Dinerstein, E. Ricketts, T.H. Küper, W. Kreft H. and Barthlott, W 2005. Global patterns of plant diversity and floristic knowledge. Journal of Biogeography 32(7):1107-1116. [CrossRef]
  51. Koch, P.L. and Barnosky, A.D 2006. Late Quaternary Extinctions : State of the Debate. Annual Review of Ecology, Evolution and Systematics 37:215-252. [CrossRef]
  52. Kruuk, H. 1972. Surplus killing by carnivores. J Zool 166(2):233-244. [CrossRef]
  53. Ledger, HP. 1968. Body composition as a basis for a comparative study of some East African mammals. Symposium of the Zoological Society of London 21:289-310.
  54. Lee, RB. 1969. Eating Christmas in the Kalahari: American Museum of Natural History New York.
  55. Linares Matás, G.J. and Yravedra, J 2022. ‘We hunt to share’: social dynamics and very large mammal butchery during the Oldowan–Acheulean transition. World Archaeology:1-31. [CrossRef]
  56. Lindstedt, S.L. and Boyce, M.S 1985. Seasonality, fasting, endurance, and body size in mammals. American Naturalist 125:873-878. [CrossRef]
  57. Lombard, M. 2011. Quartz-tipped arrows older than 60 ka: further use-trace evidence from Sibudu, KwaZulu-Natal, South Africa. Journal of archaeological Science 38(8):1918-1930. [CrossRef]
  58. Lombard, M. 2020. The tip cross-sectional areas of poisoned bone arrowheads from southern Africa. Journal of Archaeological Science: Reports 33:102477. [CrossRef]
  59. Lombard, M. 2021. Variation in hunting weaponry for more than 300,000 years: A tip cross-sectional area study of Middle Stone Age points from southern Africa. Quat Sci Rev 264:107021. [CrossRef]
  60. Lombard, M. Bradfield, J. Caruana, M.V. Makhubela, T.V. Dusseldorp, G.L. Kramers, J.D. and Wurz, S 2022. The Southern African Stone Age Sequence Updated (II). South African Archaeological Bulletin 77(217):172-212.
  61. Lomolino, M.V. 2023. The ecological and geographic dynamics of extinction: Niche modeling and ecological marginalization. Proceedings of the National Academy of Sciences 120(3):e2220467120. [CrossRef]
  62. Lukich, V. and Ecker, M 2022. Pleistocene environments in the southern Kalahari of South Africa. Quat Int 614:50-58. [CrossRef]
  63. Mackay, A. Armitage SJ. Niespolo, E.M. Sharp, W.D. Stahlschmidt, M.C. Blackwood, A.F. Boyd, K.C. Chase, B.M. Lagle, S.E. and Kaplan, C.F 2022. Environmental influences on human innovation and behavioural diversity in southern Africa 92–80 thousand years ago. Nature Ecology & Evolution 6(4):361-369. [CrossRef]
  64. Meltzer, D.J. 2020. Overkill, glacial history, and the extinction of North America’s Ice Age megafauna. Proceedings of the National Academy of Sciences:202015032. [CrossRef]
  65. Miller, F.L. Gunn, A. and Broughton, E 1985. Surplus killing as exemplified by wolf predation on newborn caribou. Canadian Journal of Zoology 63(2):295-300. [CrossRef]
  66. Morin, E. 2012. Reassessing Paleolithic subsistence: the Neandertal and modern human Foragers of Saint-Césaire: Cambridge University Press.
  67. Morin, E. and Ready, E 2013. Foraging goals and transport decisions in western Europe during the Paleolithic and early Holocene. Zooarchaeology and Modern Human Origins: Springer. p 227-269.
  68. Mutke, J. and Barthlott, W 2005. Patterns of vascular plant diversity at continental to global scales. Biologiske skrifter 55(4):521-531. [CrossRef]
  69. Owen-Smith, R.N. 2002. Adaptive herbivore ecology: From resources to populations in variable environments. Cambridge: Cambridge University Press.
  70. Pitts, G.C. and Bullard, T.R 1967. Some interspecific aspects of body composition in mammals. Body Composition in Animals and Man: National Academy of Sciences, Washington DC. p 45-70.
  71. Potts, R. Dommain, R. Moerman, J.W. Behrensmeyer, A.K. Deino, A.L. Riedl, S. Beverly, E.J. Brown, E.T. Deocampo, D. and Kinyanjui, R 2020. Increased ecological resource variability during a critical transition in hominin evolution. Science advances 6(43):eabc8975. [CrossRef]
  72. Potts, R. and Faith, J.T 2015. Alternating high and low climate variability: The context of natural selection and speciation in Plio-Pleistocene hominin evolution. Journal of human evolution 87:5-20. [CrossRef]
  73. Prendergast, M.E. Yuan, J. and Bar-Yosef, O 2009. Resource intensification in the Late Upper Paleolithic: a view from southern China. Journal of Archaeological Science 36(4):1027-1037. [CrossRef]
  74. Redford, K.H. 1992. The empty forest. Bioscience 42(6):412-422. [CrossRef]
  75. Ripple, W.J. Wolf, C, Newsome, T.M. Betts, M.G. Ceballos, G. Courchamp, F. Hayward, M.W. Van Valkenburgh, B. Wallach, A.D. and Worm, B 2019. Are we eating the world’s megafauna to extinction? Conservation Letters 12(3):e12627. [CrossRef]
  76. Rodríguez-Hidalgo, A. Saladie, P. Olle, A. and Carbonell, E 2015. Hominin subsistence and site function of TD10. 1 bone bed level at Gran Dolina site (Atapuerca) during the late Acheulean. J Quat Sci 30(7):679-701. [CrossRef]
  77. Rodríguez, J. Burjachs, F. Cuenca-Bescós, G. García, N. Van der Made, J. González, A.P. Blain, H-A. Expósito, I. López-García, J.M. and Antón MG 2011. One million years of cultural evolution in a stable environment at Atapuerca (Burgos, Spain). Quat Sci Rev 30(11-12):1396-1412. [CrossRef]
  78. Rudman, D. Difulco, T.J. Galambos, J.T. Smith, R.B. Salam, A.A. and Warren, W.D 1973. Maximal rates of excretion and synthesis of urea in normal and cirrhotic subjects. J Clin Invest 52:2241-2249.
  79. Sandom, C. Faurby, S. Sandel, B. and Svenning, J-C 2014. Global late Quaternary megafauna extinctions linked to humans, not climate change. Proc R Soc B: The Royal Society. p 20133254. [CrossRef]
  80. Scott, L. and Neumann, F.H 2018. Pollen-interpreted palaeoenvironments associated with the Middle and Late Pleistocene peopling of Southern Africa. Quat Int 495:169-184. [CrossRef]
  81. Smith, F.A. Smith, R.E.E. Lyons, S.K. and Payne, J.L 2018. Body size downgrading of mammals over the late Quaternary. Science 360(6386):310-313. [CrossRef]
  82. Smith, F.A. Smith, R.E.E Lyons, S.K. Payne, J.L. and Villaseñor, A 2019a. The accelerating influence of humans on mammalian macroecological patterns over the late Quaternary. Quat Sci Rev 211:1-16. [CrossRef]
  83. Smith, G.M. Ruebens, K. Gaudzinski-Windheuser, S. and Steele, T.E 2019b. Subsistence strategies throughout the African Middle Pleistocene: Faunal evidence for behavioral change and continuity across the Earlier to Middle Stone Age transition. Journal of Human Evolution 127:1-20. [CrossRef]
  84. Speth, J.D. 1983. Bison kills and Bone counts: Decision making by ancient hunters. Chicago: University of Chicago Press. [CrossRef]
  85. Speth, J.D. 2010. Big-Game Hunting: Protein, Fat, or Politics? The Paleoanthropology and Archaeology of Big-Game Hunting: Springer. p 149-161.
  86. Speth, J.D. 2012. Middle Palaeolithic subsistence in the Near East. Before Farming 2012(2):1-45. [CrossRef]
  87. Speth, J.D. and Spielmann K.A 1983. Energy source, protein metabolism, and hunter-gatherer subsistence strategies. Journal of Anthropological Archaeology 2:1-31. [CrossRef]
  88. Stiner, M. 2012. Competition theory and the case for Pleistocene Hominin-Carnivore Co-evolution. J Taphon 10(3):129-145.
  89. Stiner, M.C. 1990. The use of mortality patterns in archaeological studies of hominid predatory adaptations. Journal of anthropological archaeology 9(4):305-351. [CrossRef]
  90. Stiner, M.C. Gopher, A. and Barkai, R 2011. Hearth-side socioeconomics, hunting and paleoecology during the late Lower Paleolithic at Qesem Cave, Israel. Journal of human evolution 60:213-233. [CrossRef]
  91. Stirling, I. and Guravich, D 1998. Polar Bears: University of Michigan Press.
  92. Surovell, T.A. and Waguespack, N.M 2009. Human prey choice in the Late Pleistocene and its relation to megafaunal extinctions. In: Haynes, G. editor. American megafaunal extinctions at the end of the Pleistocene: Springer Dordrecht. p 77-105.
  93. Tanner, A. 2014. Bringing home animals: Mistissini hunters of northern Quebec. Bringing Home Animals: Memorial University Press.
  94. Taylor Lemoine, R. Buitenwerf, R. and Svenning, J-C 2023. Megafauna extinctions in the late-Quaternary are linked to human range expansion, not climate change. Anthropocene. [CrossRef]
  95. Tindale, NB. 1972. The Pitjandjara. In: Bicchieri MG, editor. Hunters and gatherers today. New York: Holt, Rinehart and Winston. p 217-268.
  96. Trauth, M.H. Maslin, M.A. Deino, A.L. Junginger, A. Lesoloyia, M. Odada, E.O. Olago, D.O. Olaka, L.A. Strecker, M.R. and Tiedemann, R 2010. Human evolution in a variable environment: the amplifier lakes of Eastern Africa. Quat Sci Rev 29(23-24):2981-2988. [CrossRef]
  97. Wadley, L. 2010. Were snares and traps used in the Middle Stone Age and does it matter? A review and a case study from Sibudu, South Africa. Journal of Human Evolution 58(2):179-192. [CrossRef]
  98. Wilkins, J. Schoville, B.J. Brown, K.S, and Chazan, M 2012. Evidence for early hafted hunting technology. Science 338(6109):942-946. [CrossRef]
  99. Wood, B.M. and Marlowe, F.W 2013. Household and kin provisioning by Hadza men. Hum Nat 24(3):280-317. [CrossRef]
  100. Wroe, S. Field, J.H. Archer, M. Grayson, D.K. Price, G.J. Louys, J. Faith, J.T. Webb, G.E. Davidson, I. and Mooney, S.D 2013. Climate change frames debate over the extinction of megafauna in Sahul (Pleistocene Australia-New Guinea). Proceedings of the National Academy of Sciences 110(22):8777-8781. [CrossRef]
  101. Wurz, S. 2013. Technological trends in the Middle Stone Age of South Africa between MIS 7 and MIS 3. Current Anthropology 54(S8):S305-S319. [CrossRef]
  102. Wurz, S. 2014. Southern and east African Middle Stone Age: geography and culture. Encyclopedia of global archaeology 2014:6890-6912.
  103. Yravedra, J. 2001. Zooarqueología de la Península Ibérica: implicaciones tafonómicas y paleoecológicas en el debate de los homínidos del Pleistoceno Medio-Superior. BAR Int Ser 979.
  104. Ziegler, M. Simon, M.H. Hall, I.R. Barker, S. Stringer, C. and Zahn, R 2013. Development of Middle Stone Age innovation linked to rapid climate change. Nature communications 4(1):1905. [CrossRef]
Figure 1. Relative NISP per size class. * denotes significant change from the previous period.
Preprints 139434 g001
Figure 2. Relative biomass by prey size class.
Preprints 139434 g002
Figure 3. Southern Africa – Relative Biomass per period.
Preprints 139434 g003
Figure 4. The Levant – Relative biomass per period.
Preprints 139434 g004
Figure 5. Relative NISP by size class in non-cave sites.
Preprints 139434 g005
Disclaimer/Publisher’s Note: The statements, opinions and data contained in all publications are solely those of the individual author(s) and contributor(s) and not of MDPI and/or the editor(s). MDPI and/or the editor(s) disclaim responsibility for any injury to people or property resulting from any ideas, methods, instructions or products referred to in the content.
Copyright: This open access article is published under a Creative Commons CC BY 4.0 license, which permit the free download, distribution, and reuse, provided that the author and preprint are cited in any reuse.
Prerpints.org logo

Preprints.org is a free preprint server supported by MDPI in Basel, Switzerland.

Subscribe

Disclaimer

Terms of Use

Privacy Policy

Privacy Settings

© 2025 MDPI (Basel, Switzerland) unless otherwise stated