1. Introduction
The current recommended approach for diagnosing renal stones is transitioning from the utilization of computed tomography (CT) to ultrasonography (US) [
1]. Identification of a stone using the US may necessitate a CT scan for further assessment [
2]. However, if a stone is not visualized on the CT scan, the patient would have undergone unnecessary radiation exposure. Repeated exposure to ionizing radiation is of great concern in patients with recurrent renal stones who need several CT scans with an increasing risk of accumulating ionizing radiation [
3]. This underscores the significance of selecting the most suitable imaging modality to minimize patient risk. Therefore, the shift from the temptation of CT scanning to the US imaging approach has recently been the focus of interest for most researchers.
When assessing safety considerations, the US is generally viable for patients requiring repetitive renal imaging, particularly those with recurrent renal stones or uncertain diagnoses [
4]. It is crucial to acknowledge that undergoing multiple renal CT scans may result in an elevated risk of accumulating radiation over time [
5]. This accrued ionizing radiation from numerous CT scans has the potential to be associated with a heightened risk of developing specific types of cancers , albeit the clinical manifestation of these risks may take several years to become evident [
6,
7]. US is the go-to imaging method in the emergency room because it is accessible, inexpensive, and simple to use, offering notable advantages from a cost-effectiveness perspective [
8]. While CT scanning is widely accessible and employs advanced technology to ensure ease of use and accuracy, integrating cutting-edge technology entails substantial costs and necessitates specialized equipment [
9,
10]. Hence, the US is the preferred approach in the context of economic renal stones management.
The non-contrast CT scan is the most sensitive and specific imaging approach to confirm the presence of renal stones. Therefore, it is recommended by the European Association of Urologists (EAU). Given the cost and radiation concerns, the US imaging investigation was recommended as the initial diagnostic step [
11]. Therefore, if US imaging is readily available in the healthcare facility, it should come first to explore the renal cause of flank pain [
12].
Therefore, the present study aims to assess the sensitivity and specificity of CT and US in detecting and measuring renal stones. Furthermore, it will compare the diagnostic accuracy of both modalities and conduct a comprehensive comparative analysis of their effectiveness. The results will help in the decision-making concerning the use of US versus CT for diagnosing renal stones and emphasize the predictive factors that influence the selection of either modality.
2. Materials and Methods
2.1. Study Design
This retrospective research was conducted at the Radiology Department of Aseer Central Hospital, Abha, Saudi Arabia. It includes patients who had CT and US for suspected renal stones between January 2023 and March 2024. The US and CT of 243 individuals were compared to look for stones. Using CT as the gold standard, the US's sensitivity, specificity, accuracy, and positive and negative predictive values were computed.
2.2. Inclusion and Exclusion Criteria
The study included all adult males and females who presented to the Radiology Department with acute renal colicky pain symptoms. Individuals who were unwilling and uncooperative to participate, pregnant, or suffering from renal failure were excluded from the research.
2.3. CT and US Procedure
Using a US machine equipped with 3.5, 5, and 7.5 MHz probes, a consultant radiologist conducted the US on patients exhibiting signs of acute renal colic. The Doppler facility evaluated the kidneys, ureters, and bladder in several anatomical planes to see stones and gauge their size.
The Siemens CT Somatom Sensation sixty-four was used to complete the patient's CT scan. According to the procedure, the patient, who had a full bladder, was lying supine on a CT examination table. A scan was conducted, with pictures generated at a five mm gap from the upper abdomen area to the pubis symphysis. No intravenous or oral contrast was administered. Stone was defined as any hyperdense foci in the kidney, ureter, bladder, or urethra.
2.4. Ethical Consideration
The study was approved by Aseer Central Hospital’s Institutional Review Board (IRB) on April 9, 2023 (IRB Log No: REC3-8-2023).
2.5. Statistical Analysis
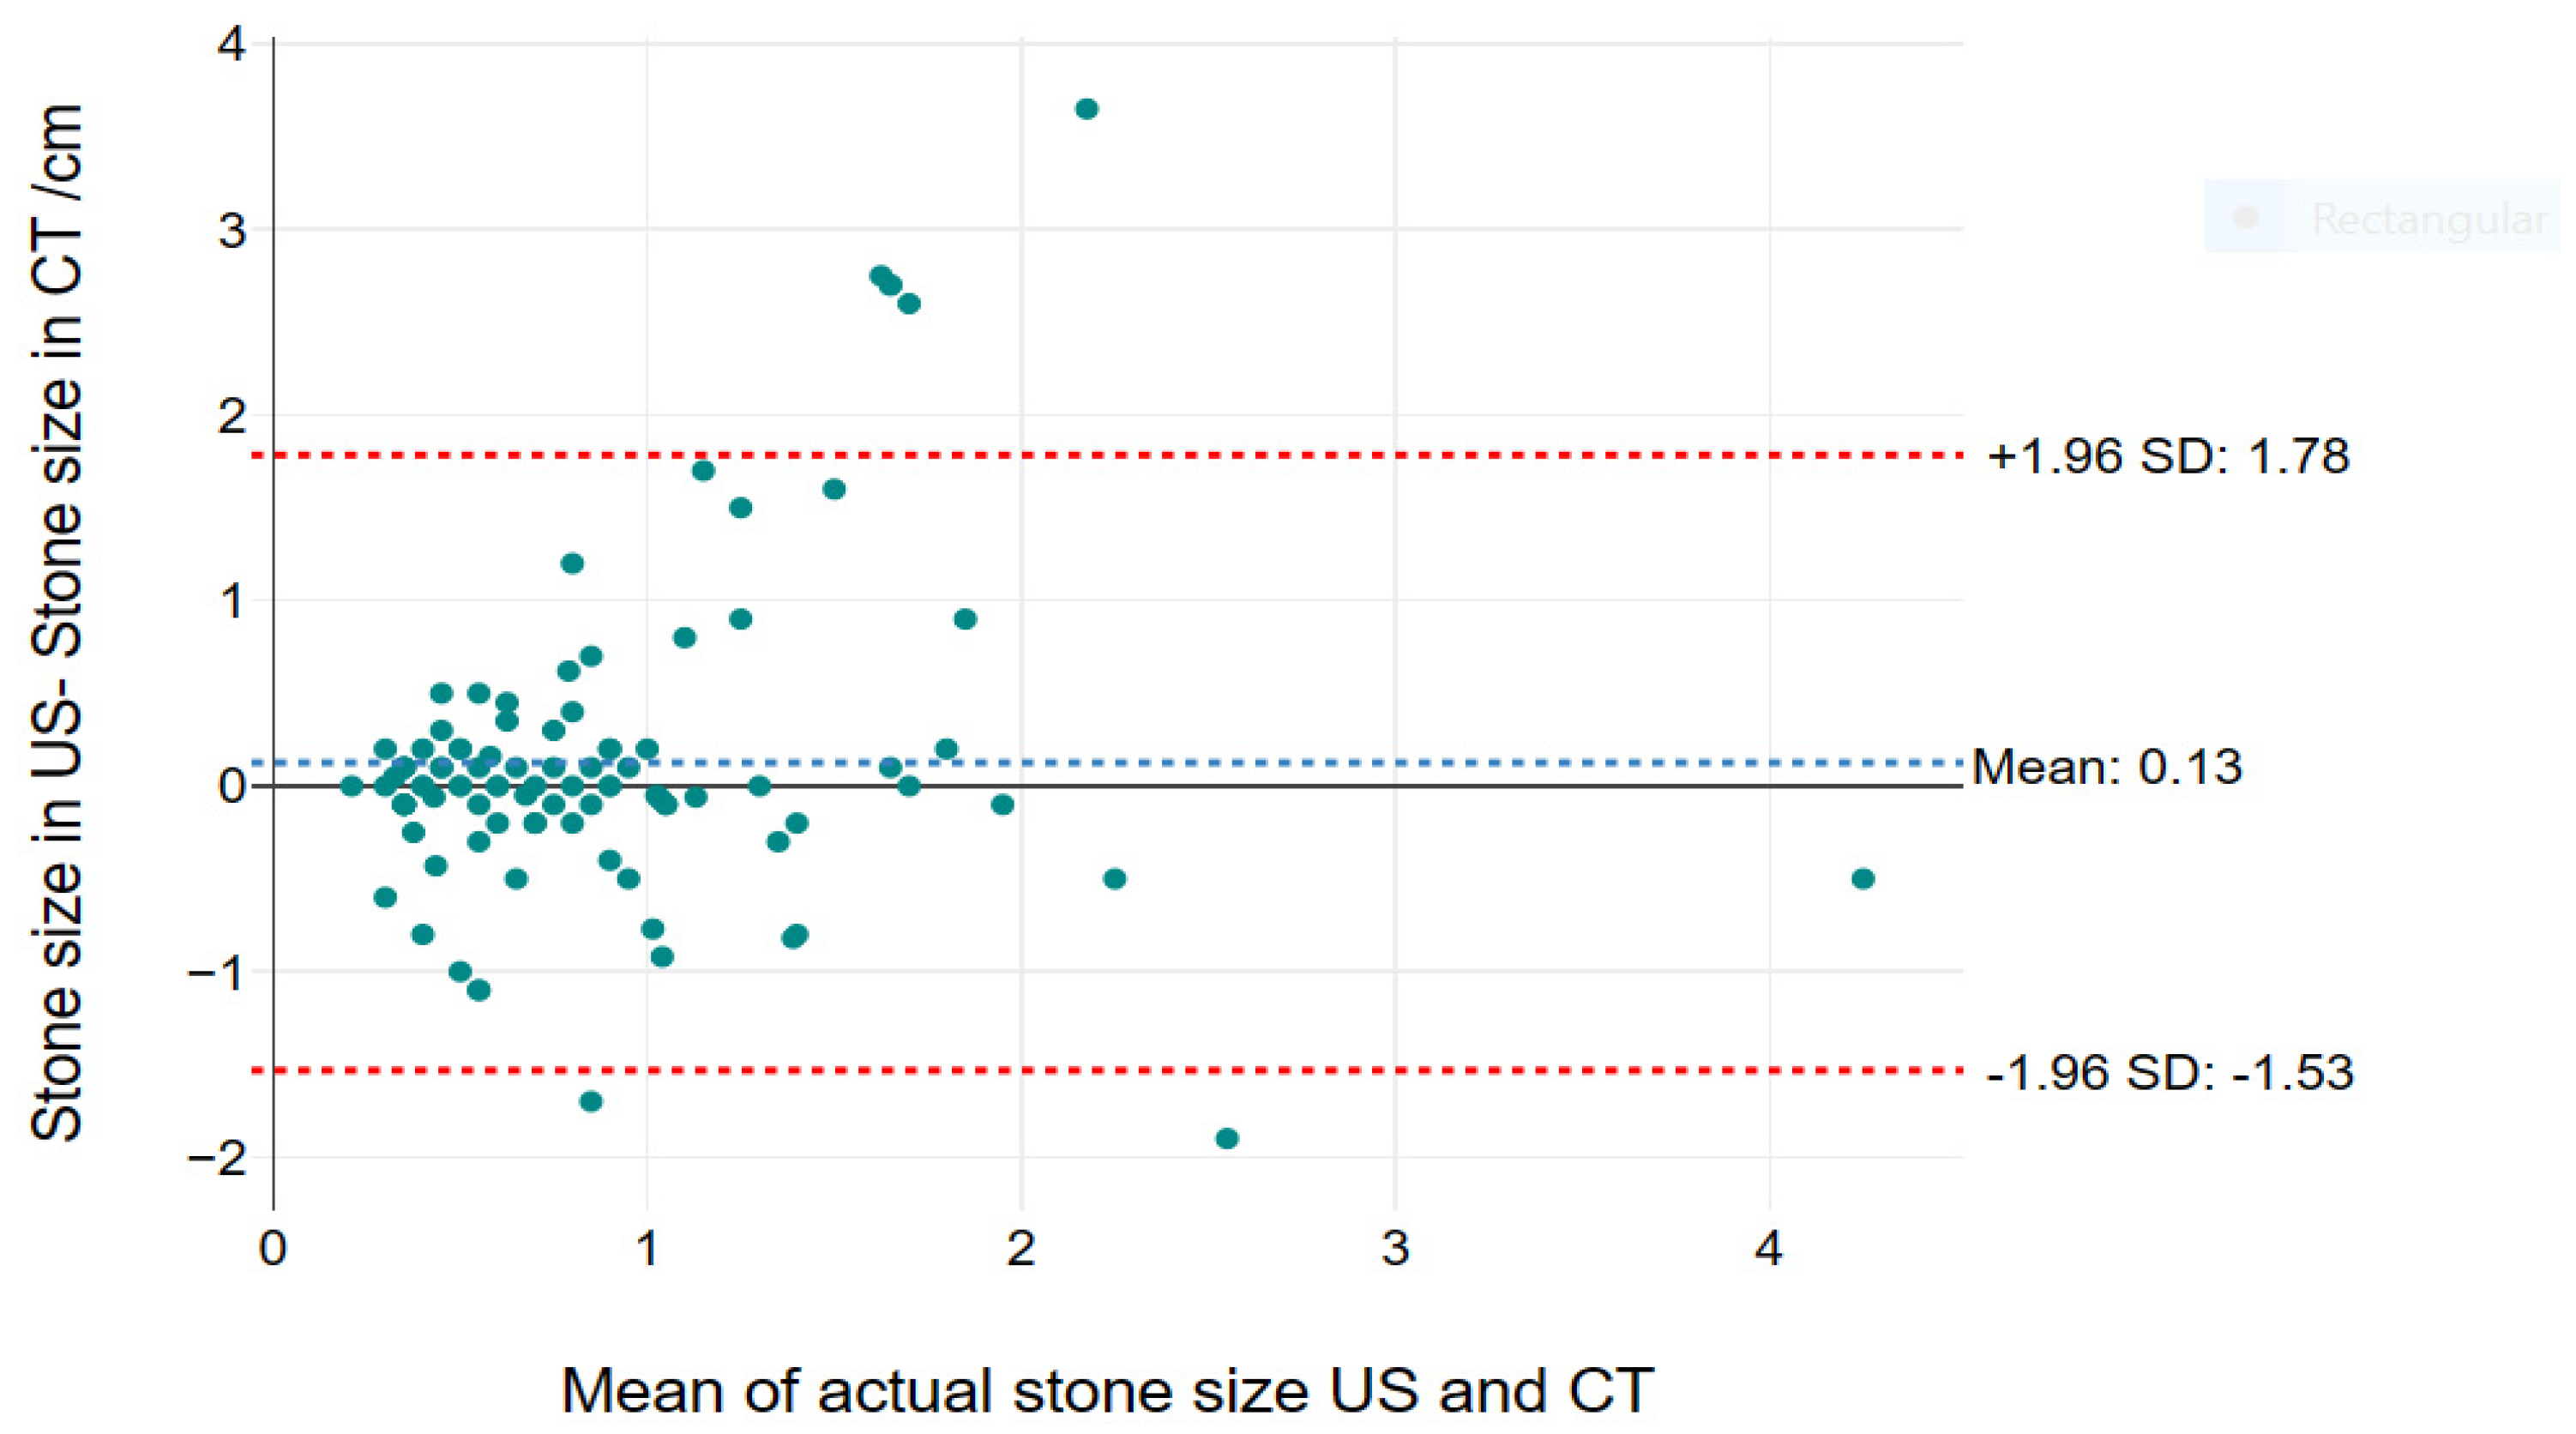
SPSS version 27 was used to input and analyze the data. Using CT as the gold standard, US sensitivity, specificity, accuracy, and positive and negative predictive values were computed. Descriptive statistics were employed to assess demographic information and clinical history. Inferential statistics, including Pearson’s correlation (r), were computed for stone size and number in the US and CT. Bland and Altman's test of the agreement was used to compare both modalities.
3. Results
Table 1 presents the demographic characteristics and clinical histories of 243 patients with CT and US for suspected renal stones. Of these patients, 29.6% were in the age group of 48-61 years, and 28.8% were 33-47 years old. 70% of the patients were male. 46.9% of patient’s blood group was unknown, and 16.9% possessed an A+ blood group. 58% of the patients were within the height range of 165-180 cm. 51.4% had diabetes. 19.8% of the patients were in their first five years of illness, and 57.2% had abnormal creatinine levels.
Table 2 presents the data on stone sizes and their relationship with the CT and US imaging modalities. For stones sized less than 0.5 cm, the US modality identified 5 suspected cases. In the 0.5-0.9 cm category, CT detected 52 cases, while the US identified 56. For stones between 1 and 1.4 cm, 77 cases were identified with CT, and the US identified 75. For the 1.5-1.9 cm category, 17 cases were identified with CT, while the US identified 13 cases. Similarly, stones larger than 2 cm showed 10 cases in CT and 7 in US, while only 1 suspected case was noted. A significant correlation was found between stone size in both modalities, r = 70.784, p-value < 0.001, indicating a reliable association between stone size and the imaging modality used (see
Table 2). Similarly,
Table 3 indicates a significant correlation in identifying stone numbers using both modalities r = 115.37, p-value < 0.001. Multiple stones were observed using both modalities (see
Table 3).
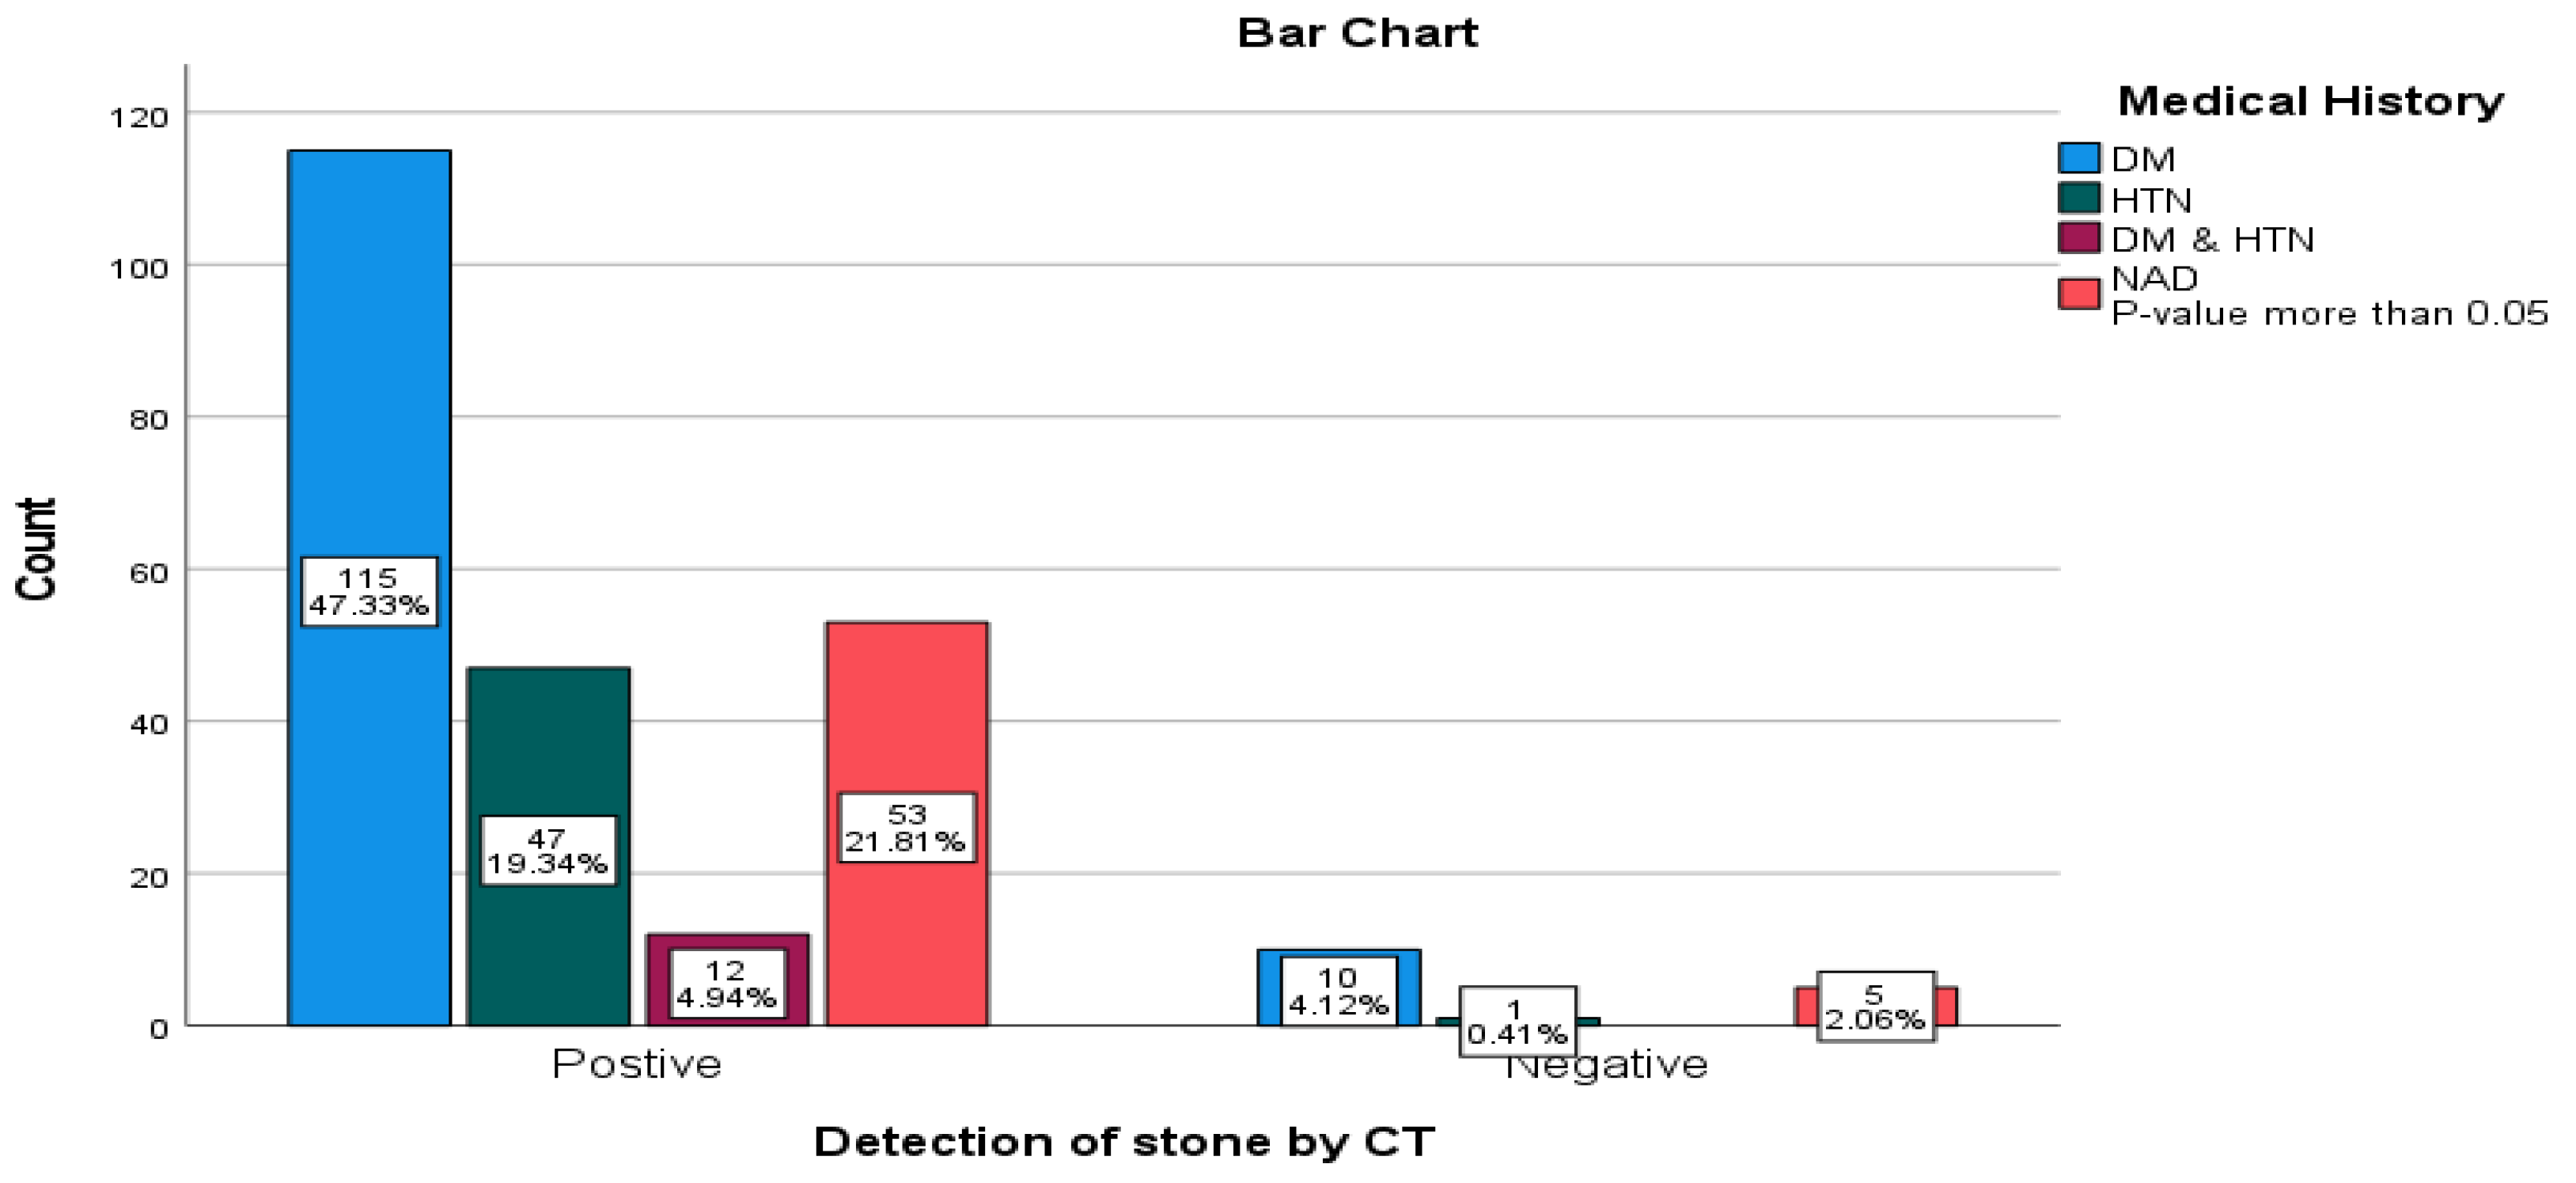
Moreover, medical history and the presence of stone on CT indicated an insignificant correlation, p>0.05 (see
Figure 1). The study also demonstrated that the prevalence of renal stones in the US was 68.3%, using unenhanced CTU as the gold standard, the USG's sensitivity (67.4%), specificity (18.8%), and accuracy (64.2%), positive predictive value (92.2%), and negative predictive value (3.9%) were computed (see
Table 4).
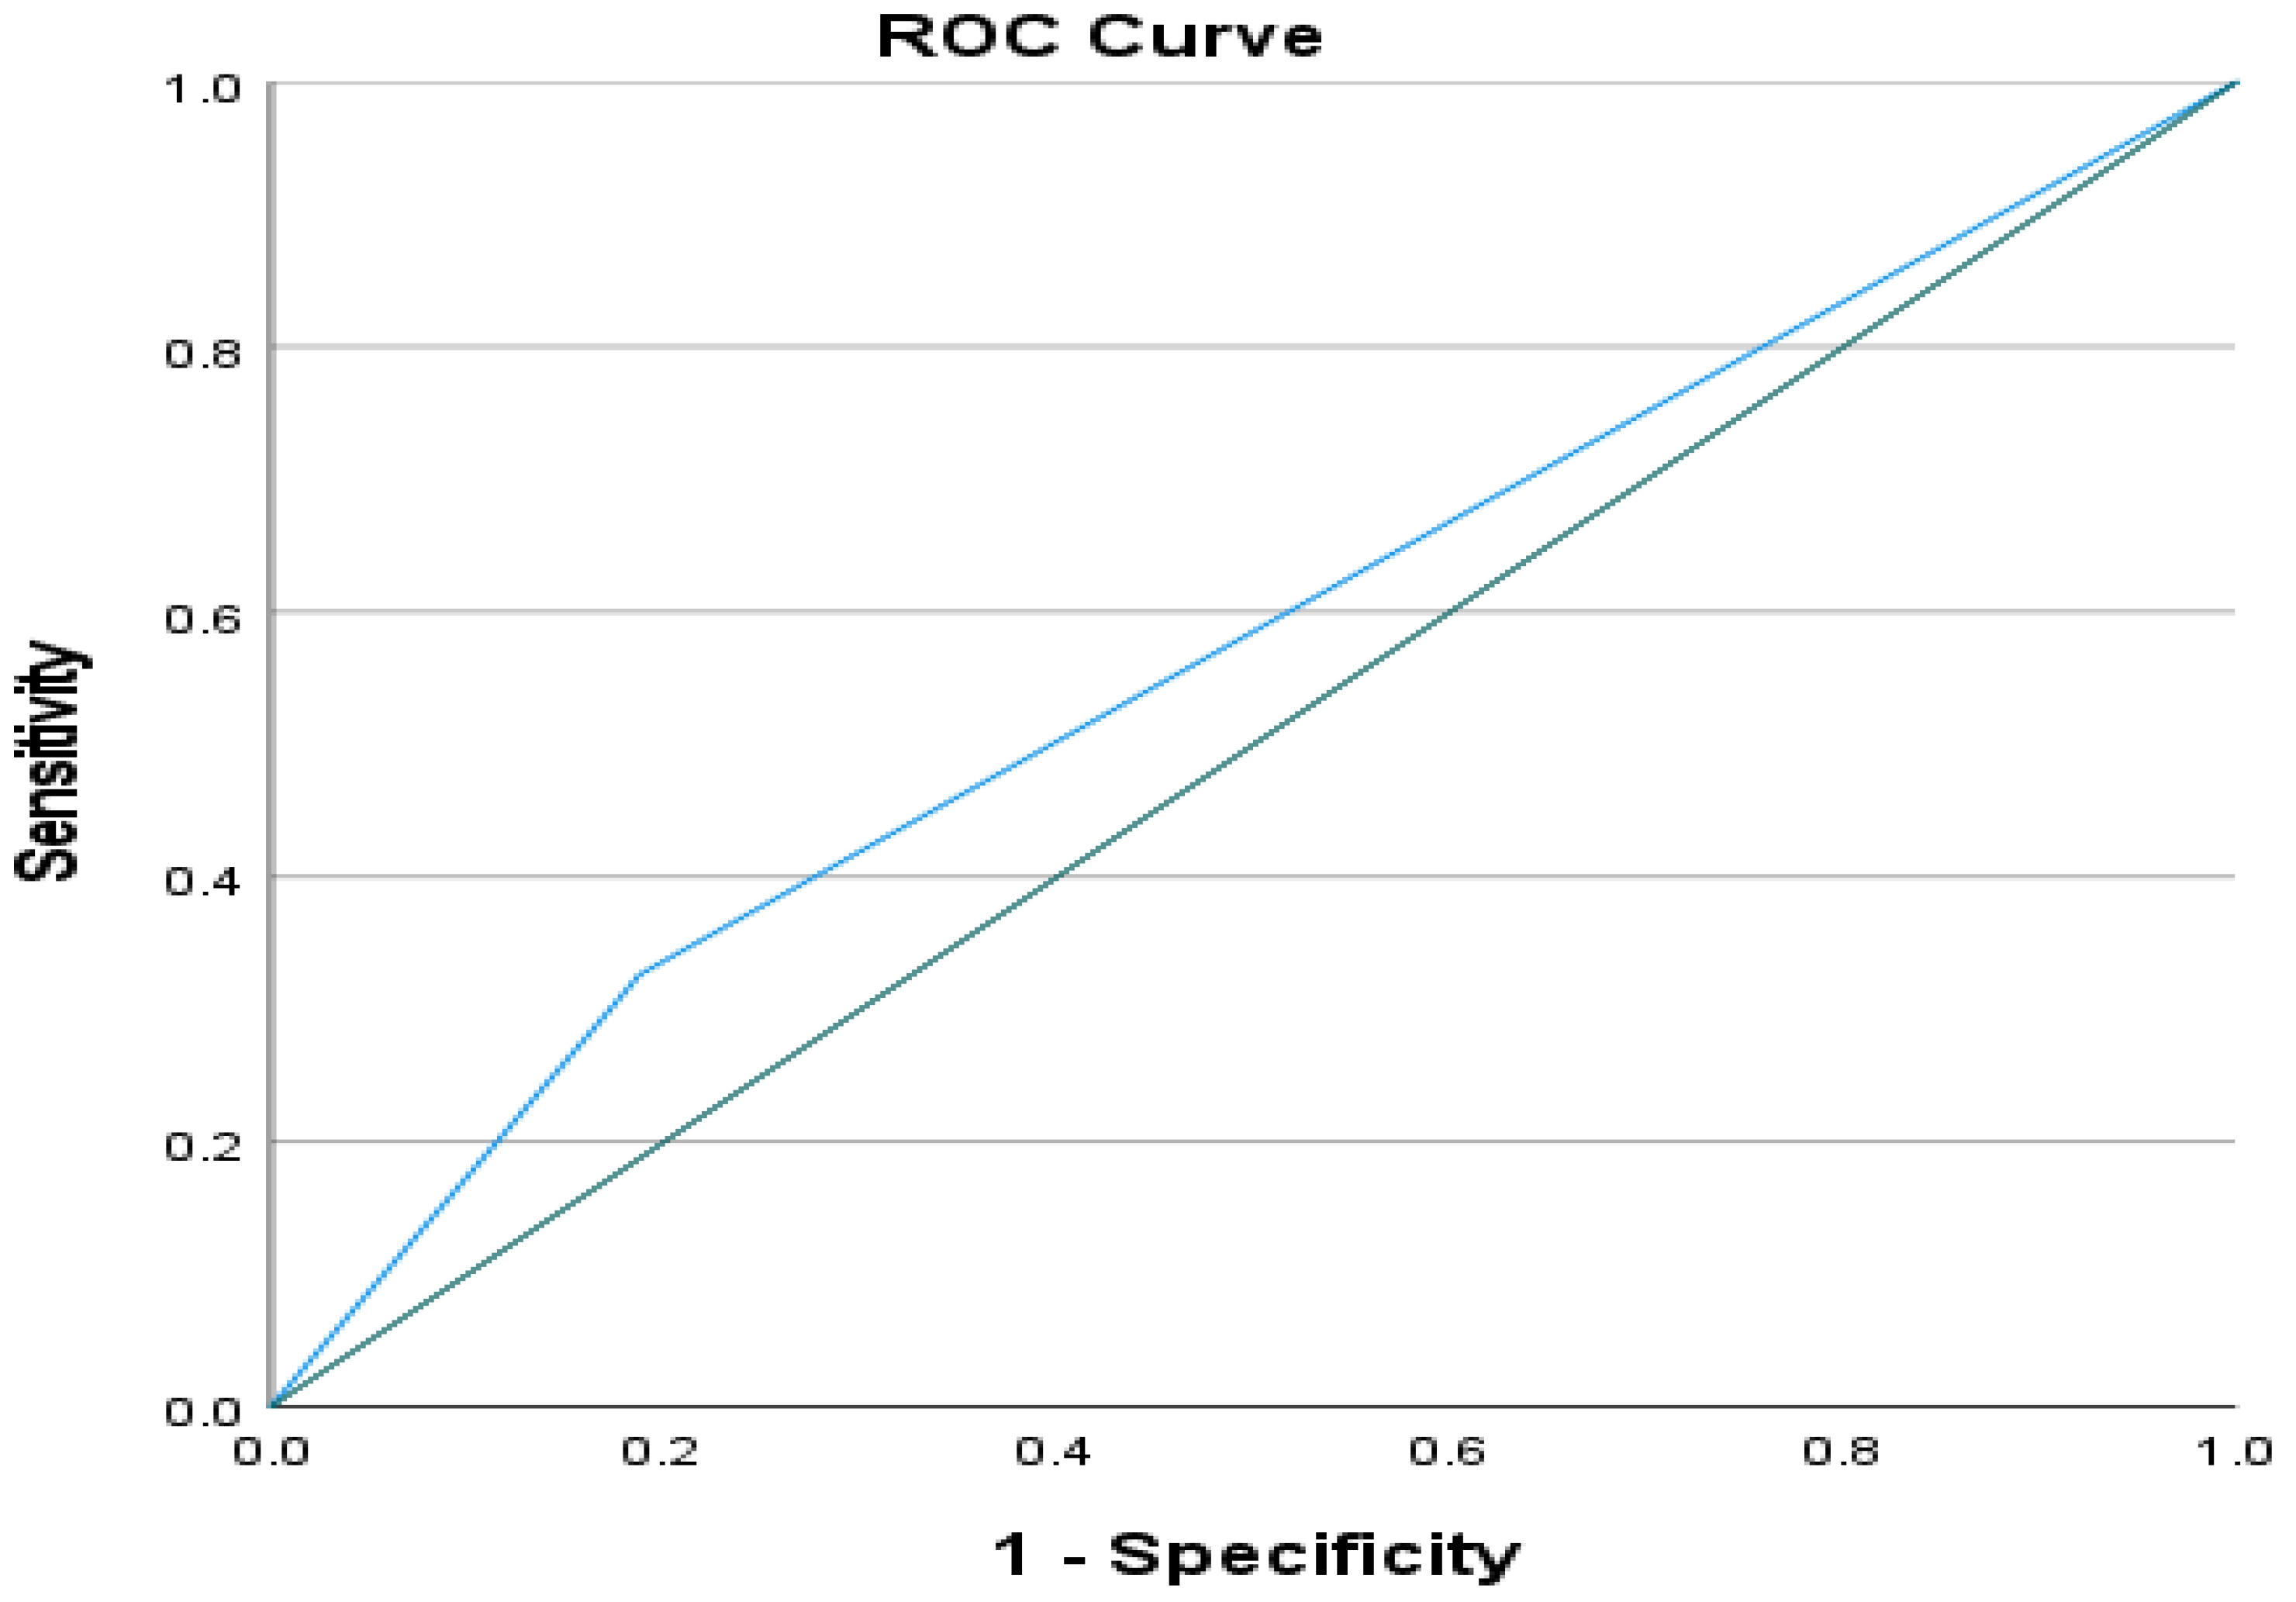
Figure 2 indicates a perfect diagnostic accuracy of renal stones with 0.569 AUC (area under the curve) and 95% CI (0.433-0.706) by the US. Furthermore, in Bland and Altman, for agreement of both modalities in the measurement of stones, it was found the mean difference in size by US and CT was 0.13, with upper and lower limit of agreement was -1.53 to 1.78, the size on US was larger than in CT,
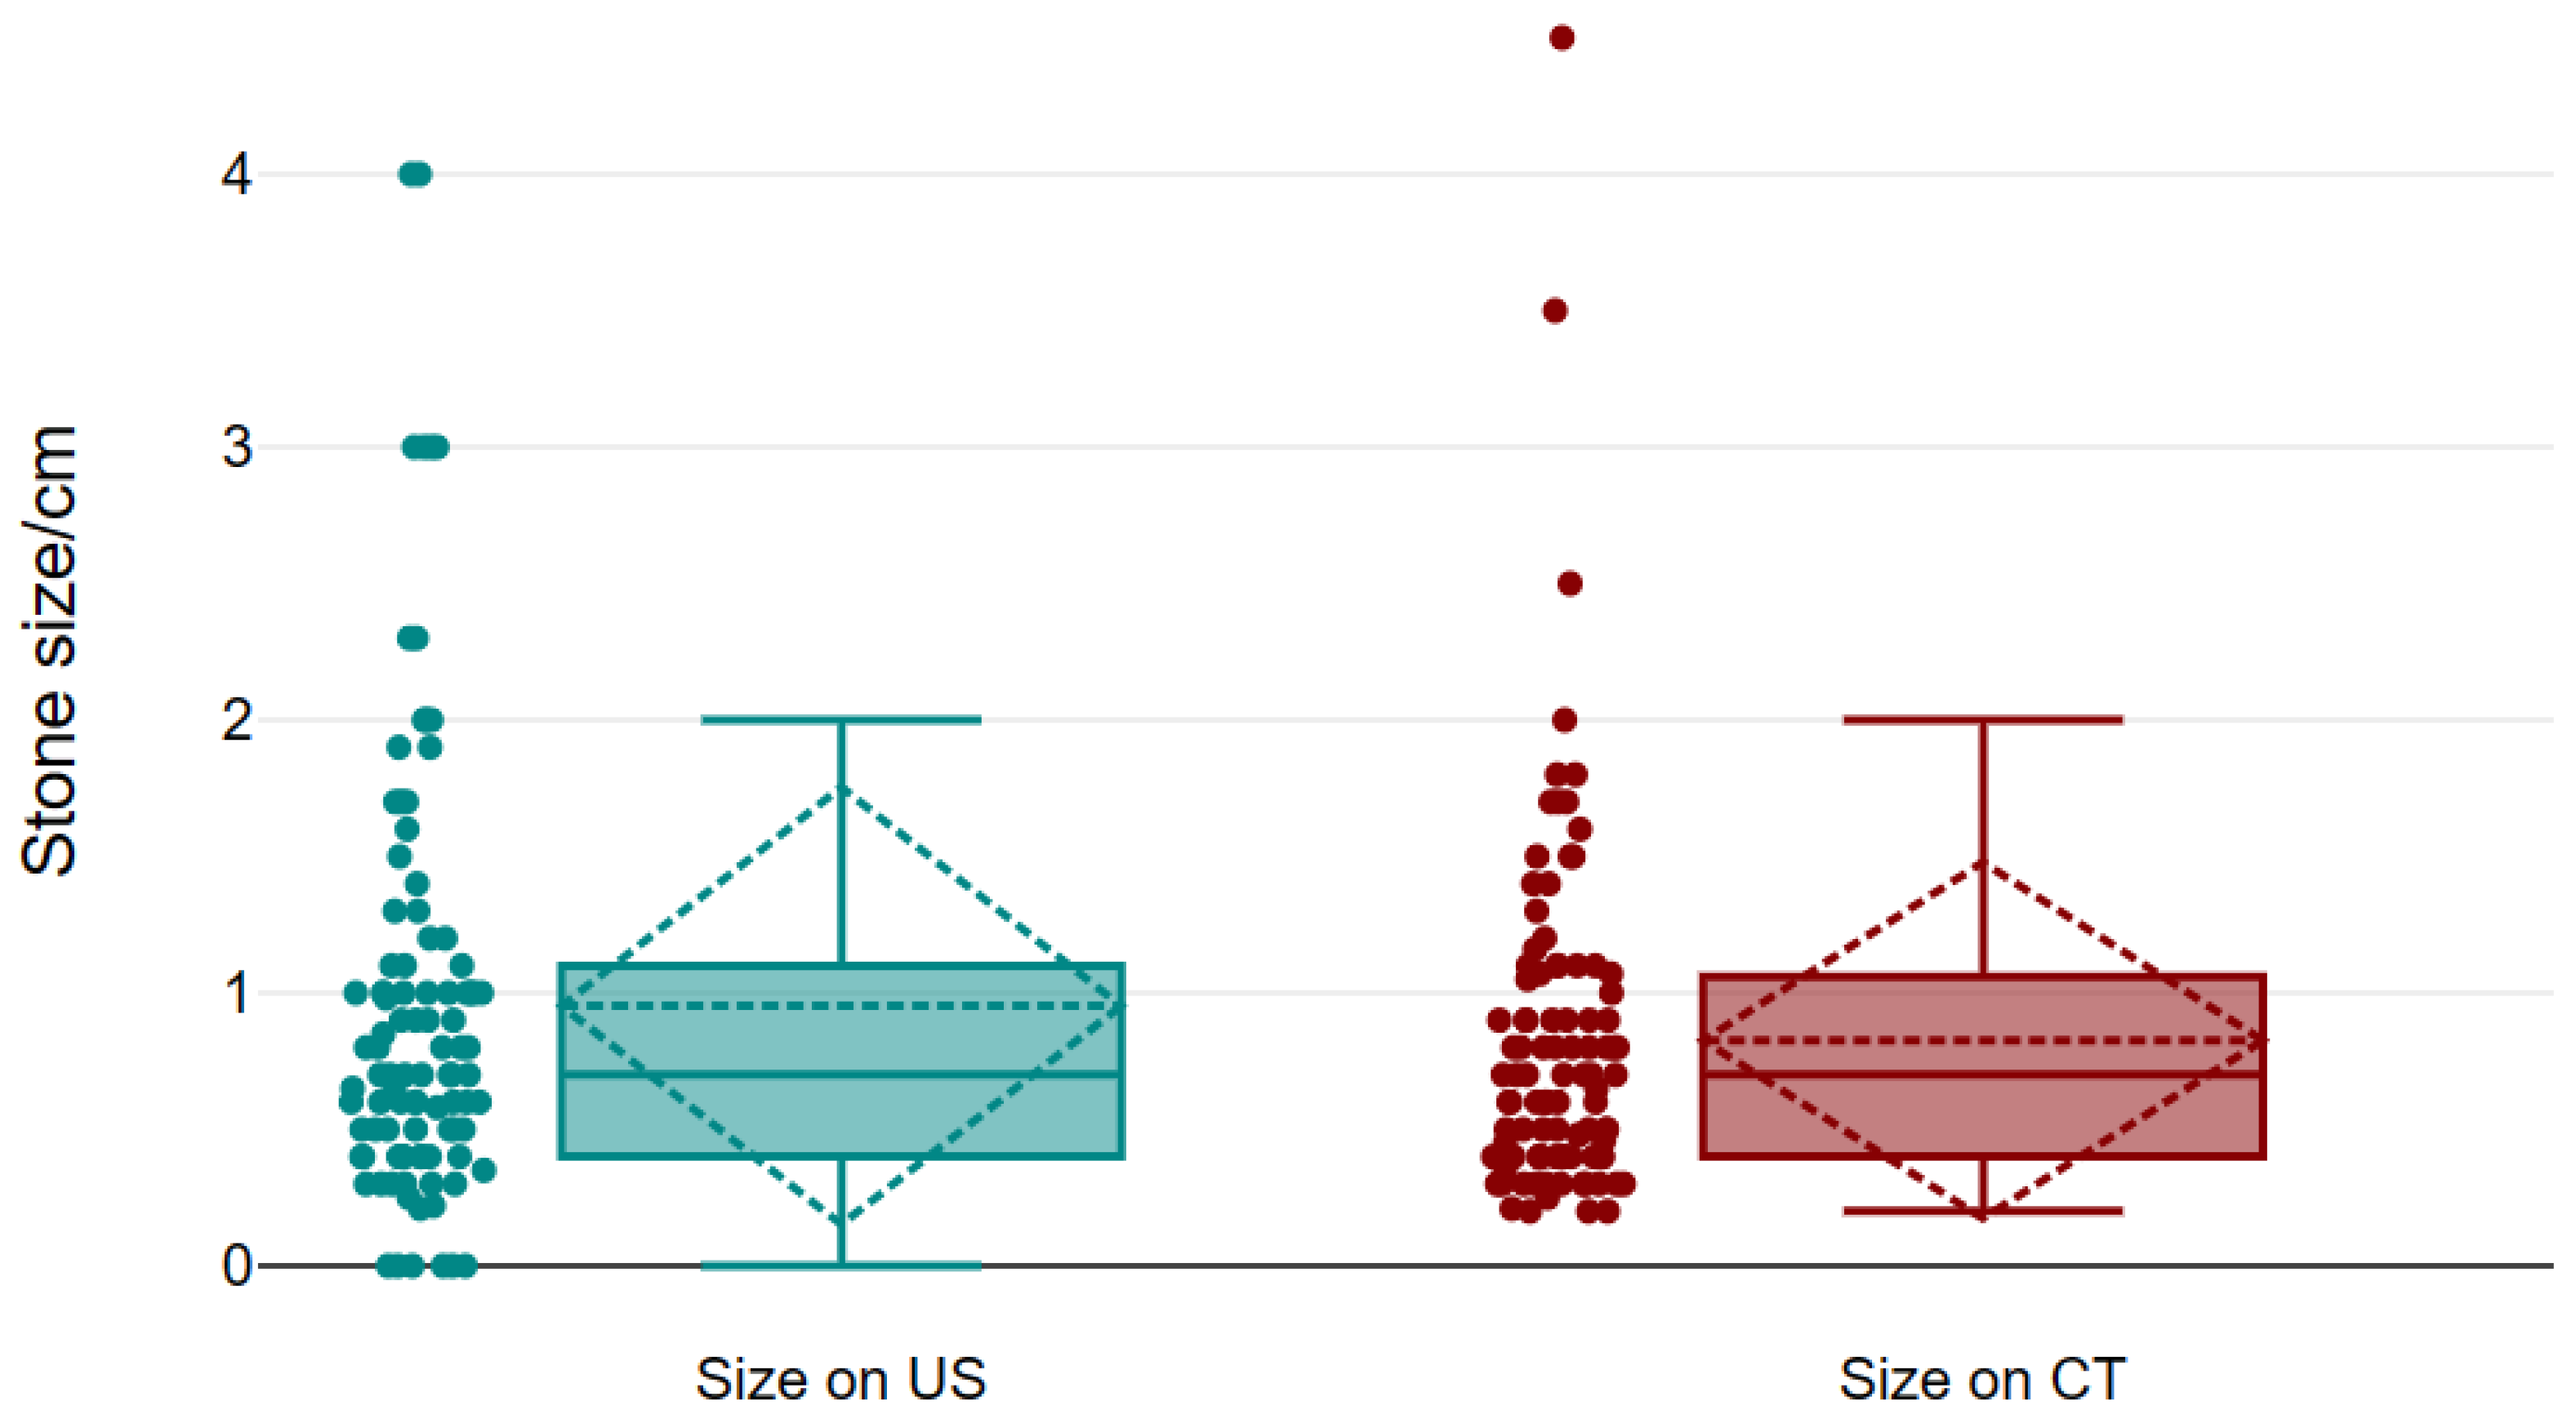
Figure 3. Insignificant differences were noticed between the size in the US and CT. The mean of stone in ultrasosound was 0.95 ± 0.08 mm, and on CT was 0.83 ± 0.07 mm (see
Figure 3 and
Figure 4 and
Table 5).
4. Discussion
Although CT is the golden standard in the diagnosis of renal stones and the associated clinical conditions, injudicious exposure to ionizing radiation is of major concern. Therefore, there is a tendency to revert to using the US imaging approach as a preliminary imaging technique in the emergency departments and points of care to detect renal stones, thus protecting the patient from overexposure to radiation. Patients with recurrent renal stones who require multiple imaging procedures experience substantial advantages when the US is applied as a primary diagnostic procedure in terms of costs and clinical safety [
13].
According to the current study, the apparent prevalence, including the true and false positive cases, represents 68.3%, while the true prevalence, representing the true positive cases, represents 93.4% of the total cases diagnosed as having renal stones. The US showed a high sensitivity of 67.4% and a low specificity of 18.8%. Among those who tested positive for renal stones, 92.2% were truly suffering from renal stones (positive predictive value, PPV), while only 3.9% were truly disease-free (negative predictive value, NPV) by the US. The diagnostic accuracy was 64.2%, reflecting an AUC of 0.57. Furthermore, our findings showed that there is a diagnostic agreement between the US and CT in the detection of renal stones. There was a minimal mean difference between both imaging approaches of 0.13. Although US imaging tends to detect renal stones with a size higher than that detected by CT, the difference is small and statistically insignificant; the US can detect renal stones of 1.78 mm higher than CT, while the CT can detect renal stones 1.53 mm higher than the US.
Using the US to detect renal stones proves effective based on the test results of the agreement. While minor differences might be inconsequential for some patients, they could be critical for others, such as those undergoing surgery or specific treatments, where even small discrepancies can be significant.
The literature review reveals considerable variation in the sensitivity and specificity of the US for detecting renal stones, largely attributed to differences in methodologies and patient populations studied. In an earlier study conducted by Ather et al. (2004), the sensitivity of the US was 81%, and the specificity was 45% [
14]. However, Ray et al. (2010) reported a sensitivity of 45% and specificity of 88% for detecting renal stones by gray US imaging [
15]. For the detection of a single renal stone, Passerotti et al. (2009) found that the US had a sensitivity of 76% and a specificity of 100% when compared to CT [
16]. Allison (2014) compared the sensitivity of US performance between emergency physicians and radiologists and found that point-of-care US conducted by emergency physicians had a sensitivity of 54%, while radiology US conducted by radiologists had a sensitivity of 57%, compared to a sensitivity of 88% for CT. The study indicated that the US is an effective method for the initial detection of renal stones, regardless of minimal differences in sonographer expertise [
16,
17].
Kanno et al. (2014) reported that the US yielded a sensitivity of 78% and a specificity of 83.7% in detecting a single renal stone in 285 examined kidneys, reflecting the effectiveness of the US as an imaging modality [
18]. On the other hand, although there is nearly a sensitivity of 85% and a specificity of 50% for CTU over the US performed either at the bedside or in the radiology department, the overall outcome showed no significant difference at the time of discharge from the emergency department [
13].
Furthermore, the detection of renal stones may vary depending on the side of the kidney being examined. Ulusan et al. (2007) found that the sensitivity of the US for detecting a single stone was 52-57% for the right kidney and 32-39% for the left kidney when tested by two different experts. The study concluded that there is no significant difference in the results of the US when expertise is taken into account [
19]. In contrast to CT, the US is considered an easy and accurate approach as the initial step in detecting renal stones. The current research revealed that the US showed a high sensitivity rate of 67.4% in detecting renal stones, which is consistent with the findings reported in previous literature. This suggests that the US is a valuable diagnostic tool for identifying renal stones.
In addition, Taylor et al., (2022) reported that the PPV of the US was 62% [
1]. On the contrary, the current study reported a higher PPV of 92.2%. The reported high PPV indicates that the US imaging could identify clinically relevant stones, thus reducing the need for CT and exposure to unnecessary irradiation. In a randomized controlled trial, the imaging modalities US, CT, and kidney, ureter, and bladder (KUB) had similar diagnostic accuracy in emergency medical facilities [
4]. The current study found that the accuracy of US detection was 64.2%, which aligns with findings from previous research. The comparison between the US and CT in detecting renal stones has shown that the US detects larger renal stones than CT. According to a study by Passerotti et al. (2009), it was found that in a limited number of cases, the average size of undetected stones in the US was 2.3 mm, indicating the significant clinical implications of this difference [
16]. In accordance with Passerotti and colleagues, Ray et al. (2010) reported a reduction in the sensitivity of US when the size of the renal stones is less than 3 mm [
15]. Contrary to the literature, this study revealed that compared to CT, the variation in stone size detected by the US was 1.78 mm. The results support the significance of the US in the preliminary diagnosis of renal stones, saving the hazards of unnecessary exposure to CT radiation.
Notwithstanding, this study is strengthened by comparing the two imaging modalities, US and CT, by the agreement test (Bland and Altman test of agreement). This statistical test revealed minor differences between the sizes of renal stones we can detect compared to CT. The test of agreement's result strongly supports the US's use in diagnosing renal stones without further doubts.
The primary implication of this study is that the utilization of the US can enhance confidence in its capacity to identify renal stones in emergency departments. By incorporating the US as an initial step, medical practitioners can assess the necessity of a more comprehensive imaging modality such as CT. This strategy can facilitate anticipating which patients require CT for a more exhaustive diagnosis, consequently mitigating unnecessary radiation exposure, particularly for those with negative findings.
Based on our findings, we strongly recommend that healthcare professionals and emergency physicians prioritize using the US as the initial diagnostic tool for detecting renal stones. The CT should be reserved for cases where the benefits of a more advanced imaging method are necessary. Additionally, individuals experiencing recurrent renal stones should undergo an initial evaluation using the US to reduce the potential risks associated with exposure to ionizing radiation.
Some limitations in the current study that should be highlighted are of interest. The findings of this study are based on a small sample size. Therefore, it is important to note that these results should be confirmed and validated through further research involving a larger and more diverse group of patients. The current study did not compare the radiologist's expertise in detecting renal stones. According to the literature, expertise can increase the accuracy of the US in detecting renal stones, thus saving the use of CT to a limited number of patients and reducing the risk of exposure to unnecessary radiation.
5. Conclusions
This study emphasizes the importance of incorporating the US into the diagnostic pathway for renal stones. Considering the patient's clinical presentation, the US can be an initial and non-invasive approach. The accuracy of stone detection using the US closely aligns with that of CT. By prioritizing the US, we can minimize radiation exposure and avoid unnecessary CT scans, especially in cases where renal stones are suspected. Furthermore, the US provides valuable information about stone size and location, aiding treatment planning. While CT remains essential for a comprehensive evaluation, the US offers a cost-effective and efficient starting point. Therefore, a judicious utilization of the US, guided by clinical context, can enhance diagnostic accuracy, and streamline management decisions for patients with suspected renal stones.
Author Contributions
Conceptualization, A.A. and M.A.; methodology, A.A.; software, A.A.; M.A and A.G.; validation, F.A., A.G. and M.A.; formal analysis, R.M.; investigation, W.A.; resources, I.H.; data curation, M.Al, MA.; and AG.; writing—original draft preparation, WA.; M.A.; AG writing—review and editing, F.A.; visualization, A.A.A; A.Al, supervision, A.Al.; M.Al and A.Al project administration, A.A.A; funding acquisition, M.Al. All authors have read and agreed to the published version of the manuscript.
Funding
This research was funded by the Deanship of Scientific Research at King Khalid University (Grant No. RGP2/384/44).
Institutional Review Board Statement
The study was approved by Aseer Central Hospital’s Institutional Review Board (IRB) on April 9, 2023 (IRB Log No: REC3-8-2023) and King Khalid University's ethical review board.
Informed Consent Statement
Patient consent was waived due retrospective nature of the study
Data Availability Statement
The data for this study available upon reasonable request to the corresponding author.
Acknowledgments
The authors extend their appreciation to the Deanship of Scientific Research at King Khalid University for funding this work through large group Research Project under grant number RGP2/384/44 زThe authors extend they're thanks to all in Aseer Central Hospital’s for helping us in data collection.
Conflicts of Interest
The authors declare no conflict of interest.
References
- Taylor, D.Z.; Smith, G.E.; Wiener, S.V. MP33-01 "THAT CAN’T BE A STONE!": PREDICTORS OF FALSE POSITIVITY FOR NEPHROLITHIASIS ON RADIOLOGIC REPORTS OF RENAL SONOGRAMS. Journal of Urology2022, 207. [CrossRef]
- Goel, R.; Jain, A. Improved Detection of Kidney Stone in Ultrasound Images Using Segmentation Techniques. In Lecture Notes in Networks and Systems; Springer Singapore: Singapore, 2020; pp. 623–641.
- Planz, V.B.; Posielski, N.M.; Lubner, M.G.; Li, K.; Chen, G.-H.; Nakada, S.Y.; Pickhardt, P.J. Ultra-Low-Dose Limited Renal CT for Volumetric Stone Surveillance: Advantages over Standard Unenhanced CT. Abdominal Radiology2018, 44, 227–233. [CrossRef]
- Brisbane, W.; Bailey, M.R.; Sorensen, M.D. An Overview of Kidney Stone Imaging Techniques. Nature Reviews Urology2016, 13, 654–662. [CrossRef]
- Abuelhia, E.; Alghamdi, A. Evaluation of Arising Exposure of Ionizing Radiation from Computed Tomography and the Associated Health Concerns. Journal of Radiation Research and Applied Sciences2020, 13, 295–300. [CrossRef]
- Shao, Y.-H.; Tsai, K.; Kim, S.; Wu, Y.-J.; Demissie, K. Exposure to Tomographic Scans and Cancer Risks. JNCI Cancer Spectrum2019, 4. [CrossRef]
- Cao, C.-F.; Ma, K.-L.; Shan, H.; Liu, T.-F.; Zhao, S.-Q.; Wan, Y.; Jun-Zhang; Wang, H.-Q. CT Scans and Cancer Risks: A Systematic Review and Dose-Response Meta-Analysis. BMC Cancer2022, 22. [CrossRef]
- Lentz, B.; Fong, T.; Rhyne, R.; Risko, N. A Systematic Review of the Cost-Effectiveness of Ultrasound in Emergency Care Settings. The Ultrasound Journal2021, 13. [CrossRef]
- Cui, Y.; Sun, Z.; Ma, S.; Liu, W.; Wang, X.; Zhang, X.; Wang, X. Automatic Detection and Scoring of Kidney Stones on Noncontrast CT Images Using S.T.O.N.E. Nephrolithometry: Combined Deep Learning and Thresholding Methods. Molecular Imaging and Biology2020, 23, 436–445. [CrossRef]
- Mukherjee, P.; Lee, S.; Elton, D.C.; Nakada, S.Y.; Pickhardt, P.J.; Summers, R.M. Fully Automated Longitudinal Assessment of Renal Stone Burden on Serial CT Imaging Using Deep Learning. Journal of Endourology2023, 37, 948–955. [CrossRef]
- Hughes, T.; Ho, H.C.; Pietropaolo, A.; Somani, B.K. Guideline of Guidelines for Kidney and Bladder Stones. Türk Üroloji Dergisi/Turkish Journal of Urology2020, 46, S104–S112. [CrossRef]
- Arslan, E.; Mohamed, A.H. Evaluation, Management, and Analysis of Demographic and Radiological Characteristics of Patients with Renal Colic at a Tertiary Hospital in Somalia. African Journal of Emergency Medicine2022, 12, 358–361. [CrossRef]
- Smith-Bindman, R.; Aubin, C.; Bailitz, J.; Bengiamin, R.N.; Camargo, C.A., Jr.; Corbo, J.; Dean, A.J.; Goldstein, R.B.; Griffey, R.T.; Jay, G.D.; et al. Ultrasonography versus Computed Tomography for Suspected Nephrolithiasis. New England Journal of Medicine2014, 371, 1100–1110. [CrossRef]
- Ather, M.H.; Jafri, A.H.; Sulaiman, M.N. Diagnostic Accuracy of Ultrasonography Compared to Unenhanced CT for Stone and Obstruction in Patients with Renal Failure. BMC Medical Imaging2004, 4. [CrossRef]
- Ray, A.A.; Ghiculete, D.; Pace, K.T.; Honey, R.J.D. Limitations to Ultrasound in the Detection and Measurement of Urinary Tract Calculi. Urology2010, 76, 295–300. [CrossRef]
- Passerotti, C.; Chow, J.S.; Silva, A.; Schoettler, C.L.; Rosoklija, I.; Perez-Rossello, J.; Cendron, M.; Cilento, B.G.; Lee, R.S.; Nelson, C.P.; et al. Ultrasound Versus Computerized Tomography for Evaluating Urolithiasis. Journal of Urology2009, 182, 1829–1834. [CrossRef]
- Allison, S.J. Ultrasonography and Computed Tomography: Performance in Detection of Kidney Stones. Nature Reviews Nephrology2014, 10, 611–611. [CrossRef]
- Kanno, T.; Kubota, M.; Sakamoto, H.; Nishiyama, R.; Okada, T.; Higashi, Y.; Yamada, H. The Efficacy of Ultrasonography for the Detection of Renal Stone. Urology2014, 84, 285–288. [CrossRef]
- Ulusan, S.; Koc, Z.; Tokmak, N. Accuracy of Sonography for Detecting Renal Stone: Comparison with CT. Journal of Clinical Ultrasound2007, 35, 256–261. [CrossRef]
|
Disclaimer/Publisher’s Note: The statements, opinions and data contained in all publications are solely those of the individual author(s) and contributor(s) and not of MDPI and/or the editor(s). MDPI and/or the editor(s) disclaim responsibility for any injury to people or property resulting from any ideas, methods, instructions or products referred to in the content. |
© 2024 by the authors. Licensee MDPI, Basel, Switzerland. This article is an open access article distributed under the terms and conditions of the Creative Commons Attribution (CC BY) license (http://creativecommons.org/licenses/by/4.0/).