Submitted:
12 November 2024
Posted:
14 November 2024
Read the latest preprint version here
Abstract
This paper proposes a robust methodology for integrating process-specific data and domain expert knowledge into linked knowledge graphs. These graphs utilize an ontology that provides a standardized vocabulary for material science and facilitates the creation of semantic models for various processes along the digital process chain. A generic template for structuring processes is proposed, simplifying subsequent data retrieval. The templates of specific processes are designed collaboratively by domain and ontology experts aided by a proposed interview template that bridges the knowledge gap. Following the digitalization of material data through semantic modeling, machine-readable data with contextual metadata is stored in a graph database, which can be efficiently queried using the SPARQL language, enabling seamless integration into data pipelines. To demonstrate this approach, a knowledge graph is developed to represent the process chain of AlSi10Mg objects manufactured via permanent mold casting, capturing their complete history from the initial manufacturing step to final non-destructive testing and mechanical characterization. This methodology enhances data interoperability and accessibility while providing context-rich data for training AI models, potentially accelerating new knowledge discovery in material science.
Keywords:
cast AlSi10Mg
; digital process chain
; materials ontology
; knowledge graph template
; knowledge extraction
; digitalization of material knowledge
1. Introduction
In materials science and engineering (MSE), having a well-thought-out, reliable, and consistent method for producing FAIR (Findable, Accessible, Interoperable, Reusable) [1] process and material data is crucial for accelerating material discovery. Adhering to FAIR principles improves the reproducibility and reduces the ambiguity of data, which is extremely important for a domain like MSE characterized by data scarcity and diversity. Adopting the W3C Semantic Web standards to transform materials data to knowledge graphs is one promising way to create FAIR data in MSE, facilitating direct linkage of data generated at different stages in materials process chains. In addition, with the advent of powerful large language models [2], knowledge graphs could serve as a countermeasure to address its performance limitations identified [3] in the MSE domain. For instance, strategies like grounding the output of LLMs on the facts in knowledge graphs could enhance their reliability [4]. The present work is motivated by the need for a clear and systematic digitalization workflow that generates high-quality, semantically structured linked material data. The work presents a user-friendly approach for digitalizing material data, ensuring that the proposed solution can be implemented by not just IT experts, but also materials engineers and scientists from diverse backgrounds.
Different data sources come into consideration when prescribing a digitalization strategy in MSE, such as existing structured and unstructured data collections, as well as actively generated data in research and production. Looking at existing structured data sources serves to point out what is missing in the current digitalization strategies. Several publicly available datasets, such as the ICSD (Inorganic Crystal Structure Database) [5], the OQMD (Open Quantum Materials Database) [6], the Materials Project [7], the MDF (Materials Data Facility) [8] or the NOMAD (Novel Materials Discovery) [9], have been popular databases in the MSE domain in the past decades. However, most of these databases often contain incomplete and ambiguous data points, and they cannot be connected to each other. This is also the case for company-specific internal databases which are not interconnected unstructured data from literature or documents available in MSE. Semantic web technologies allow addressing these challenges, ensuring that material data is structured and connected to related data, not ambiguous, and interoperable.
In the stack of W3C-endorsed technologies, ontologies are fundamental in adding meaning to data, ensuring it is unambiguous and interoperable [10,11,12]. They serve as ’machine-understandable’ representations of a domain, where knowledge is expressed as axioms that can be used to infer new insights from existing data, thereby improving data querying and analysis.
Numerous ontology development efforts have been undertaken to model different sub-domains as well as the general MSE domain. Most of these ontologies either do not adhere to a top-level ontology or utilize BFO [13] or EMMO [14] as the top-level. In the general MSE domain, ontologies like PMD-core [15], MSEO [16], and EMMO are currently popular. Additionally, ontologies have been developed for various subdomains and applications in MSE, such as mechanical testing [17,18,19] and manufacturing [20,21]. Norouzi et al. [22] highlight that despite numerous ontology design efforts in MSE, there is still a need to adopt ontology design patterns based on explicit competency question formulations in the MSE domain.
This work introduces a new mid-level ontology that models generic MSE concepts, along with a domain-level ontology focused on the permanent mold casting process for AlSi10Mg, and the manufacturing and material characterization processes. Importantly, the digitalization strategy is designed to be ontology-agnostic, allowing it to work alongside other ontology development efforts in MSE.
Despite numerous initiatives to develop ontologies in MSE, a lack of focus on practical methods for data annotation and user-friendly workflows that can assist materials scientists in utilizing Semantic Web technologies to produce FAIR data remains. While some related work has been discussed, including a well-documented example of a web-based data infrastructure for generating FAIR tribological data [23], it is clear that a formalized knowledge extraction process is needed to improve communication between ontology developers and materials science experts. Bridging the gap between these disciplines is essential for increasing the acceptance of ontologies in materials science.
Moreover, demonstrating the feasibility and applicability of digitization methods through real-world examples is vital. These efforts not only validate and enhance existing ontologies and knowledge graph structures but also showcase the knowledge gained from digitizing materials science data using Semantic Web technology. A compelling application of generating semantically structured materials data lies in providing context-rich and historically informed data to AI models, which can significantly accelerate material design and optimization processes.
The main objective of this work is to improve the efficiency and effectiveness of digital mapping of chemistry-process-structure-property relationships along industrially relevant process chains through a clear and systematic digitization workflow that generates high-quality, semantically structured, linked materials data. A key focus is on building digital process chains, which are essential for managing the product life cycle of any object and ensuring effective quality control. A methodology for creating digital process chains is particularly critical in engineering, where existing literature has not adequately addressed this need. Consequently, significant efforts have been made to implement the necessary digitalization steps in a user-friendly manner, ultimately contributing to the advancement of digitalization in MSE data.
This work presents a methodology to uniformly structure and represent material data along real-world process chains. Section 2 introduces the underlying experimental dataset for AlSi10Mg, along with the BWMD Ontology and a flexible methodology for digitalizing MSE domain knowledge, supported by representative examples. An interview template is also included to facilitate interaction with domain experts. The resulting data structures and datasets are summarized in Section 3, presented through real-life use cases for knowledge extraction. A first step toward AI-assisted prediction of material properties is taken based on the generated knowledge base, demonstrating its machine readability. Finally, the results are discussed in Section 4 and concluded in Section 5 .
2. Materials and Methods
First, the experimental dataset for the cast material AlSi10Mg, developed within the framework of the MaterialDigital project [24], is introduced, as well as the ontology providing the necessary vocabulary to describe the context of the mentioned material dataset. Second, the methodology for digitalizing process-generated data using Semantic Web technology, known as the ’Graph Designer Workflow’, is presented. This methodology will be illustrated with examples from the aforementioned experimental dataset, highlighting the various steps involved in the proposed approach.
2.1. Description of the Experimental Database for the cast AlSi10Mg
Within the framework of the BWMD project [24] and out of the ’Use Case Metals’, a comprehensive database was generated for the cast aluminium material AlSi10Mg. To this end, different manufacturing routes were followed, aiming to improve the mechanical properties of the cast AlSi10Mg. Various process parameters were applied in the permanent mold casting process, as well as variations of the amounts of Si and Mg in the melt. After the permanent mold casting process, the batches of material produced were heat treated following two steps: first solution annealing, then artificial aging. Small variations were also introduced during these two steps, by modifying the duration and the maximum temperature applied during the solution annealing and aging heat treatment steps. The resulting different manufacturing routes followed, led to different material batches with different mechanical properties, such as tensile strength, ductility, and hardness.
To investigate and mechanically characterize the different material batches, the heat-treated cast parts, were finished as tensile test specimens and metallographic specimens. Those were used to perform tensile tests and Brinell hardness measurements. Additionally, component-like parts were cast, and their defect or porosity distribution was investigated via computer tomography.
The generated experimental database requires a data architecture capable of seamlessly linking the data produced by the different processes of the manufacturing process chain to each of the manufactured or investigated objects. Therefore, a Semantic Web solution was sought to provide interoperable data and design a general process structure pattern to enable the construction and retrieval of the digital process chain of an object. The aim is to digitalize the different production routes with all the relevant contextual data, from a different viewpoint, creating the possibility of storing process information about an object in terms of its chronological history.
2.2. The BWMD Ontology
The first step in generating semantically structured data is establishing a common vocabulary to be formalized in the form of an ontology and a data model, both of which are to be determined by the use case.
An ontology consists of a collection of classes (hierarchically organized following the class-subclass relation), properties and constraints, whereby an ontology aims to describe domain knowledge at a reasonable granularity for better reuse and understanding of the digitalized domain data. Hereafter, it is important to clarify that the classes of an ontology encapsulate a range of categories of objects or concepts that share similar attributes and behaviors. Meanwhile, the instances of a class represent a particular individual inside a given class.
Within the framework of the project MaterialDigital [24], a domain ontology managing class hierarchy, object properties, and data properties, was designed and implemented. This domain ontology was the product of the united efforts and extensive communication between different MSE domain experts. The developed domain module was directly merged with the BFO 2.0 top-level ontology [25] and received the name of ’BWMD Ontology’ [26,27]. The BWMD Ontology contains two layers, a mid-level ontology layer to model material-intensive process chains and a domain layer to model all process details related to the permanent mold casting process for AlSi10Mg, manufacturing and characterization processes (mechanical and analytical). The process chains modeled by the mid-level ontology concepts (classes and properties) include the processed objects and corresponding process-related data (raw data and analyzed properties), the involved process parameters, the involved machines, as well as the necessary research equipment, infrastructure and software. The BWMD Ontology, also enables a simple description of the material structure, which can be specified for the chemical composition, the material volume, and the material surface. The BWMD Ontology does not include axioms beyond subclassing and domains and range restrictions for object and data properties.
Figure 1 schematically shows how the BWMD ontology classes are linked to BFO classes. It exemplifies how the owl:class engineering material from the BWMD Ontology is modeled as a subclass of () the BFO owl:class object. The BFO classes are shown in black and the classes specific to the BWMD Ontology are displayed in green. Details about how instances of these classes are related are expressed by the object properties, depicted in red. This straightforward representation illustrates how an object can interact with a process as an ’input’ or ’output’ instance. A chemical composition could be associated with a particular object through the object property hasStructuralInfo, and each object is associated with a specific object identifier through the object property hasIdentifier, which points to an instance of the class identifier, that could be more specifically represented by one of its subclasses, e.g.: object ID (to identify an object) or material name (to identify a material). On the other hand, the concept of dataset (e.g., a chemical composition) is modeled as a subclass of the IAO (Information Artifact Ontology [28]) owl:class information content entity, where an instance of information content entity can be directly connected to a process, both as input and as output instance.
2.3. The Graph Designer Workflow
The Graph Designer Workflow is a generic digitalization workflow used to model the metadata of arbitrary processes as an interoperable manageable knowledge graph. It includes an ontology, a process data model or process graph template, a set of tools (the Graph Designer Tool), and a data pipeline. It is generic enough to work for different processes, ontologies, and data models, with the outcome being structured data presented as ontology-based knowledge graph(s).
The Graph Designer Workflow is also coupled with a data modeling philosophy, which relies on the idea of creating a data model (or graph) for each impartible process part of the process chain of a labeled product, attaching to each single process its corresponding relevant metadata. In this context, ’process chain’ refers to the sequence of processes. An example of such an impartible process including the input and output objects is represented in Figure 2.
The introduced digital workflow for data structuring is illustrated in Figure 3 and comprehends the following steps:
- Domain knowledge extraction: the first step when semantically modeling a new process, is to establish the necessary vocabulary to describe the knowledge and data to be digitalized. This step is vital and will determine the quality and richness of the digitalized process data. The successful completion of the digitalization process is contingent on efficient communication between domain experts and ontology developers. To overcome the existing knowledge gap between these two involved parties an interview template was created. The interview template enables structured interviews and serves as an information exchange protocol. The output of this step results in the process-specific shared vocabulary, being integrated into the domain ontology selected for the concrete use case. The formalization of the new extracted domain-specific vocabulary into an existing ontology (or into a new domain ontology module) is then performed with the help of the software Protégé [30] or a customized Python script;
- Creation of impartible process graph templates: at this point, a single process step is generically represented as a knowledge graph (hereinafter denoted as ’Process Graph’). For this purpose, the software Inforapid KnowledgeBase Builder [31] is used, which offers a graphical user interface for generating graphs. The Process Graph template generation of an impartible process consists of modifying a generic Process Graph template, based on the information gathered from the interview template filled in the previous step and consequent established domain-specific vocabulary (domain ontology). This step is accomplished with the help of the functionality OWL2KDB of the ’Graph Designer Tool’ [29], which allows the user to import concepts from an existing ontology into the graphing tool. Creating a process-specific Process Graph Template is an iterative process. It might take a few hours to days to semantically represent all relevant parts of the modeled process, depending on its level of description detail and complexity. The generated graph for describing the relevant metadata of the digitalized process is then converted into an Excel template. This substep is performed with the help of another functionality of the Graph Designer Tool, referred to as KDB2Excel;
- Acquisition of process datasets: the previously generated Excel template is duplicated and filled in by the domain experts of the respective process step. In principle, the filling can also be script-controlled. In addition to the captured metadata, the raw data is collected and linked in the filled or annotated Excel template;
- RDF graph data generation: once the Excel templates have been filled with all the available process metadata, those are converted into RDF data via the Graph Designer Tool functionality Excel2RDF. The generated graphs follow the structure defined in the specific Process Graph template and are compatible with the semantic structure of the generic Process Graph template, used as a common pattern;
- Linking of process datasets: this step comes in addition when aiming to build digital process chains out of the different semantic data generated by reproducing the Graph Designer Workflow for each digitalized process along the supply chain. In the last step of data structuring, the process steps are linked according to the sequence of the physical process chain.
At the end of the data structuring procedure, the entire knowledge graph of the process chain is available in a graph database (e.g. [32]) and can be imported and exported using the standardized RDF format for knowledge graphs. Each of the mentioned steps will be explained in detail in the upcoming sections along with real-life examples extracted from the database introduced in Section 2.1.
2.3.1. Systematic Extraction of Domain Expert Knowledge
The interview template supports the knowledge extraction process, which guides the information exchange between the ontology developer and the domain expert. The work of the ontology developer - from outlining the process to developing the ontology – is thus facilitated and errors can be minimized. A draft version of the interview template focused on the semantic description of an experimental process can be downloaded in [33]. The interview template is based on the different phases of an experimental process - the setup, the execution, and the outcome. This structure is intended to assist the domain expert in completing the template.
After a short introduction text for the domain expert in the first tab of the template, the process metadata, software and equipment tabs follow as part of the setup phase. Here, among other things, the contact information of the process owner, but also general information about the process, used software, and used equipment are requested. This is followed by process input and process control parameters as part of the execution phase. These tabs give the ontology developer a lot of important information about the test object (e.g. if preparation steps were performed) as well as information about all parameters controlling the process. Figure 4 shows the table of process control parameters. The yellow hint box is intended to support the domain expert in selecting the control parameters. For each parameter, a definition in English (and for this case also in German), the data type (e.g. string, integer), and the unit (e.g. °C, %) are expected additionally. This list provides the ontology developer with all information about the process control parameters for direct integration into the domain ontology.
In the last phase, the results are handled. The process output and time stamp tabs are provided in the Excel sheet for this purpose. The process output describes, among other things, any changes undergone by the test object and all data generated during the process. The time stamp determines the start and end time of the process. Two additional tabs - input and output data description - allow the domain expert to insert screenshots of the respective data and add a short comment.
Formally, the template is structured so that yes/no questions are included in the first level. If there is a need for further questions for the corresponding answer, these only then unfold. This ensures a clear presentation.
2.3.2. Creating a Process Graph: The Semantic Data Model
The design of the semantic data model is done based on the generic Process Graph template, illustrated in Figure 5. Its core structure consists of 12 node types and 8 object properties directly connected to the Process. If irrelevant to the design of the Process, nodes, and associated object properties can be deleted. During the Process template design, the category of the Process node in Figure 5 needs to be refined (e.g. by PermanentMoldCasting). It is important to note, that the referred template is built on, based on BWMD ontology vocabulary. The nodes represent instances of BWMD classes connected to other instances through object properties from the BWMD ontology. In the following, the meaning of the core nodes and object properties are explained:
- isInputFor and hasOutput are relations to describe the chronological order along the process chain and are attached to nodes, which are either the input for a process (Object and DataSet) or the output thereof (Object and ProcessDataSet). During process design, the categories of the ingoing and outgoing objects can be further specified/refined. The same holds for the ingoing DataSet. The node ProcessDataSet collects all data, that is either generated during the course of a process (e.g. raw data) or is the result thereof (e.g. analyzed material properties);
- The setpoints and controlled variables of the process are assigned to the node ProcessParameterSet;
- Machines, measurement equipment and consumables used within the process are allocated to the node ProcessSetup;
- The node InfrastructureEquipmentSet merges the necessary infrastructure (e.g. connections for cooling water or compressed air);
- Any kind of software (e.g. for data acquisition, unit control, simulation) and scripts (e.g. for data analysis) are assigned to the node SoftwareArchitecture;
- The node Procedure is used, if the process is performed following some rules and standards;
- the node Operator designates the operator of the process;
- The node SubprocessSet integrates all subprocesses, which are helpful to refine the logic or sequence of the process, but do not need to be described in full detail.
The generic graph template is usually extended and modified but without changing the core structure. This is part of the semantic modeling strategy and is of great importance in generating interoperable linked data for the different digitalized processes and retrieving information based on these common patterns.
After the generic Process Graph template is adjusted to semantically describe the metadata generated by the specific modeled process, it is converted into an equivalent Excel template with the functionality KDB2Excel from the Graph Designer Tool.
2.3.3. Template for Metadata Acquisition
The Excel template for metadata acquisition is exemplary displayed for the PermanentMoldCasting process in Figure 6 and contains three sheets. The Spreadsheet user_variables contains the user view for metadata acquisition. Here the value assignment or data annotation takes place. The names in the column Variable name refer to the literal node names from the process graphs (more details later). At this point, it is expected that the domain experts can annotate their data by filling the column Variable value of the Excel template with literal values.
In the gdtriples spreadsheet, the knowledge graph template structure is stored line by line using node names and categories (subject/object name/type) and edge names and categories (predicate name/type). This spreadsheet is not intended to be changed by the user.
In the last spreadsheet namespaces, the mapping of RDF namespace prefixes to namespaces is stored. It is also not intended to be changed by the user.
2.3.4. Handling Cardinalities in Process Graph Templates
In the generic modeling of processes as Process Graphs, one is regularly confronted with the problem that the number of e.g. outgoing objects from a separation process or the number of chemical elements with corresponding weight fractions can vary within a chemical composition. This problem is solved by adding a suffix to the edge name (e.g. hasOutput or hasPart) in the process graph. The suffix {1..n} means, that the following nodes occur at least once or n-times. Where n is a positive integer, thus allowing to model optional properties or relations. Example: Separating hasOutput{1..n} Object.
The curly brace is removed when the Process Graph template is converted to an Excel file. Literals that follow such a {1..n} construct are marked with the combination of ’# ’ and a sequence number within the Excel template in the user view. A variable-value pair marked in this way can be duplicated by the user in the Excel template section user_variables as needed, as illustrated by Figure 7.
2.3.5. Conversion of Metadata Templates to RDF
The completed Excel templates are converted into RDF using the functionality Excel2RDF of The Graph Designer Tool. By assigning values in the Excel template, the Process Graph becomes a graph instance populated with process-specific literal values. All nodes, interpreted as instances of an ontology class, are assigned a unique resource identifier (URI) containing the original node name and a unique identifier. The original node names of the Inforapid KnowledgeBase Builder software are also retained in the RDF file as labels of the type rdfs:label. Similarly, the original node category is retained as rdf:type, which implies that the resource is an instance of an owl:class.
2.4. Linking of Process Datasets
Once all processes have been semantically modeled and all the generated RDF files have been uploaded into a graph database, the next step towards building digital process chains for all the digitalized objects is to link all the individual process graphs generated. The linking is done via the incoming and outgoing objects or datasets of the involved processes and is realized by SPARQL statements creating owl:same_as relations. This is achieved by locating all objects modeled as the output of one specific process using the pattern Process_x hasOutput Object_x, and stating that this object is indeed the same object modeled as inputFor the next chronological process, e.g. Process_y, within the physical process chain. However, it is represented as a different instance, e.g. Object_y. Consequently, the statements added to the graph database containing the disconnected process graphs will follow the pattern Object_x isSameAs Object_y. With the assistance of a reasoner, it can then be inferred, that Object_x was indeed inputFor Process_y.
3. Results
The following section presents the main characteristics of the generated knowledge database for the ’Use Case Metals’ from the MaterialDigital project [24], which is publicly available in RDF format in the Fordatis repository [26]. The added value of the linked data structures to build process chains will be illustrated using exemplary SPARQL queries, representing common knowledge extraction needs in the MSE domain. The integration of machine-readable and context-rich data into a straightforward AI algorithm (a decision regression tree) to predict material properties will be demonstrated by showcasing the task of identifying the optimal production route to maximize the tensile strength of the investigated AlSi10Mg cast alloy.
3.1. Knowledge Base: Manufacturing, Non-Destructive and Destructive Testing of the AlSi10Mg
Using the example of the permanent mold casting process, the application of the BWMD Ontology for the digital representation of MSE processes in the form of process graphs is demonstrated.
Figure 8 shows a portion of the Process Graph of the permanent mold casting process, in which the object identifier (Object_ID_2) and chemical composition (ChemicalComposition_1) are assigned to the cast part (CastPart_1) after the permanent mold casting process (PermanentMoldCasting_1). The ID assignment construct is uniformly inserted in all processes. When assigning the chemical composition (ChemicalComposition_1), it is made clear that this is a chemical composition that should represent the entire material volume (note the node MaterialVolumeStructureInfo_1). To be as generic as possible when creating the process graph, the special modeling construct presented in Figure 8 is used for assigning the weight fractions (WeightFraction_1) of the chemical composition. The hasPart relation connected to the chemical composition nodes is supplemented by the suffix {1..n}. This is to express that the following nodes can occur at least once. This construct is automatically translated during the conversion into an Excel template for metadata acquisition, as already introduced in Section 2.3.4 so that a user can specify any number of chemical elements and their weight fractions in the Excel template. From the node WeightFraction_1, the element symbol (e.g. Mg, Si...), the unit symbol (here %), and the value of the weight fraction are referenced. Additionally, the symbol of the base element (here Al) can be specified.
Another important benchmark of the digitalization strategy with the Graph Designer Workflow is how the process control parameters are semantically connected to the controlled process, an example is illustrated in Figure 9 through the collection node ProcessParameterSet_1 from the core structure introduced in Figure 5. All control variables of the permanent mold casting process are connected to the collection node via the hasPart relation. Exemplary, the nominal values of the mold, the crucible temperature, and the casting pressure are listed (not all process parameters are shown). All three process parameters are physical quantities assigned a value and a unit symbol. At this point, it can be expressed whether the literal (value) to be specified later by the user is, for example, a value of the type double, integer or string.
The completion of all the steps of the Graph Designer Workflow as described in Section 2.3 led to a comprehensive knowledge base containing linked data for all the processes listed in Table 1. Figure 10 displays all the linked instances part of the BWMD dataset, a knowledge graph including 278 digitalized process steps linked based on their chronological order within the corresponding process chain they belong to, and 180 instances of the BFO class object (digitalized intermediate products). A summary of all processes digitalized by following the Graph Designer Workflow is found in Table 1.
3.2. Knowledge Extraction: SPARQL Queries
The complete knowledge graph depicted in Figure 10 is stored in RDF format, hence, all the stored information in the graph can be accessed via SPARQL queries. The SPARQL queries are formulated following the core pattern of the generic Process Graph template. The extraction of knowledge from the developed database will be illustrated through three SPARQL queries designed to retrieve specific information from the large knowledge graph:
- all the Brinell hardness values;
- the process control parameters based on the given identifier of one input object;
- the digital process chain of a particular object based on its label or identifier.
3.2.1. Example 1: Retrieve the Brinell Hardness of All Tested Specimens
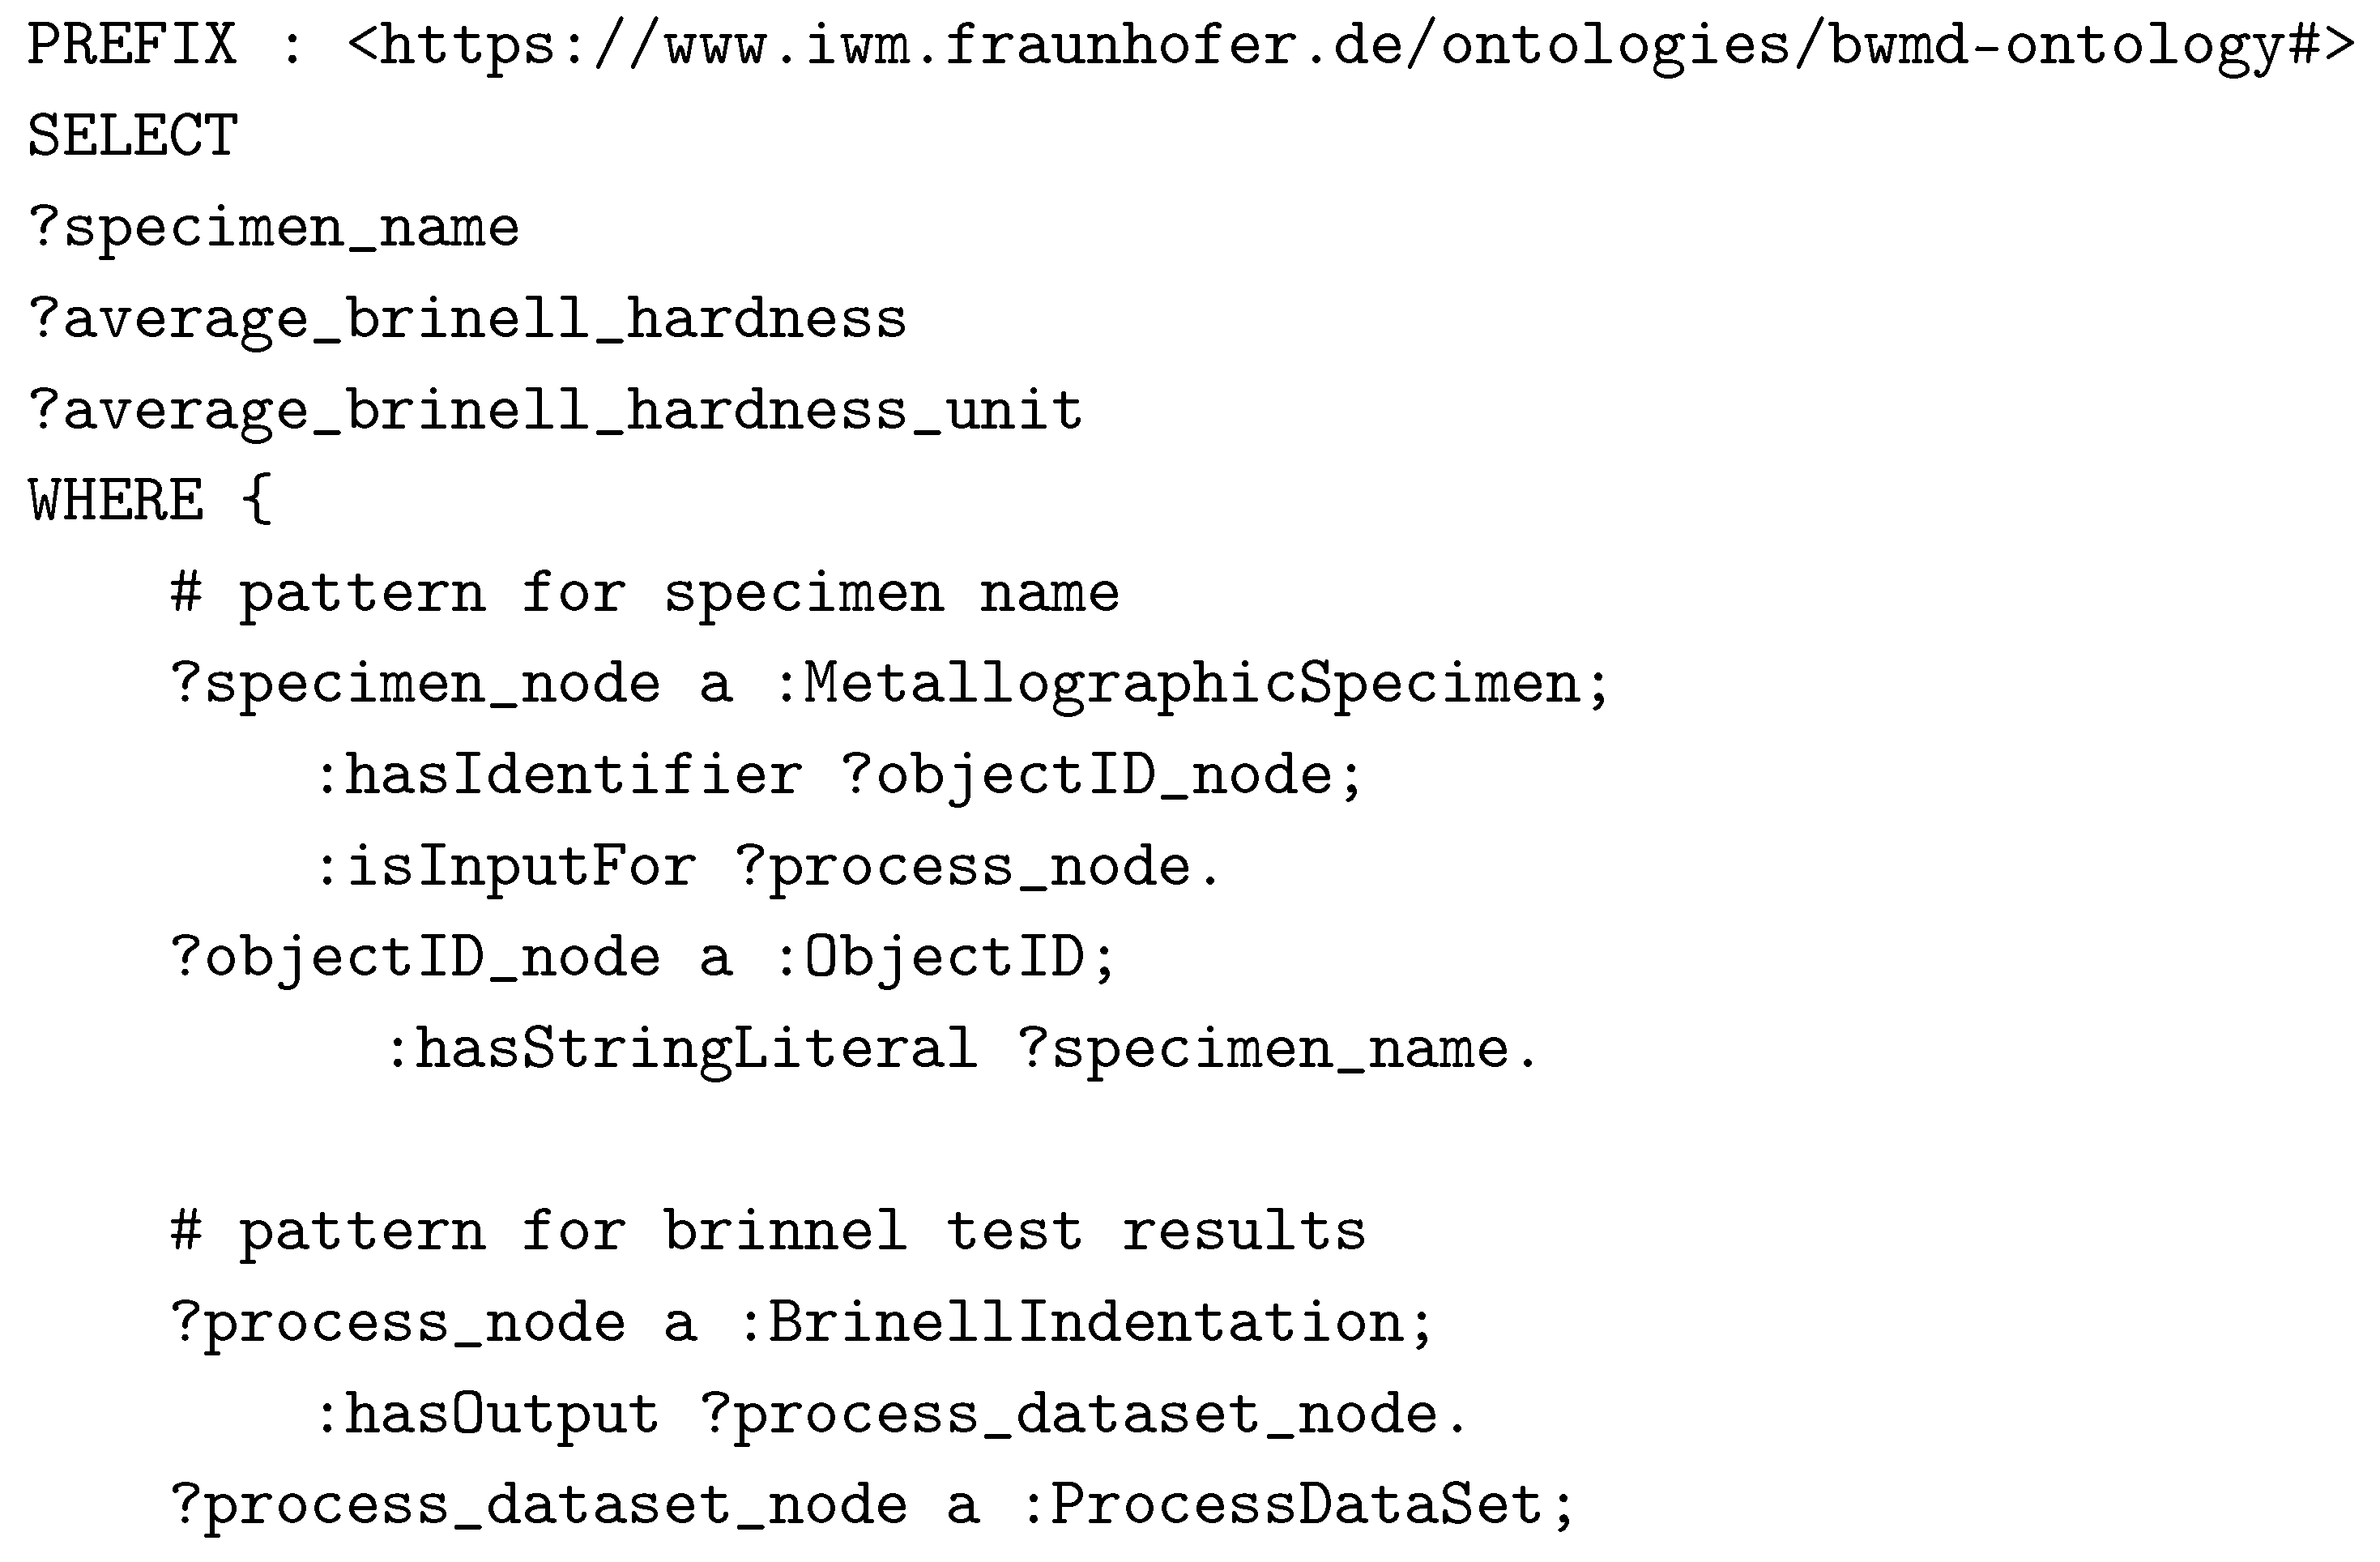
Appendix A.1 outlines the SPARQL query algorithm designed to extract the average Brinell hardness values and their corresponding units for all metallographic specimens modeled as input for the Brinell indentation process. It achieves this by matching specific patterns in the WHERE clause and binding the relevant values to the variables defined in the SELECT statement. For a more intuitive interpretation of the query structure, a graphical representation has been created using the ’sparqlgraphviz’ package for Python [34], as shown in Figure 11. This visualization illustrates the pattern followed by the SPARQL query to identify all instances of the class MetallographicSpecimen, which are modeled as inputs for the BrinellIndentation class (the process). Each output instance of the BrinellIndentation process is represented by an instance of the ProcessDataSet class, linked to a specific average Brinell hardness value and its corresponding unit. Additionally, every instance of the MetallographicSpecimen class is connected to an instance of the ObjectID class, which is associated with a specific specimen name through the data property hasStringLiteral.
The information retrieved by the SPARQL query is presented in Table 2, displaying only the first five matches for clarity.
3.2.2. Example 2: Retrieve the Process Control Parameters Corresponding to One Specific Object Identifier
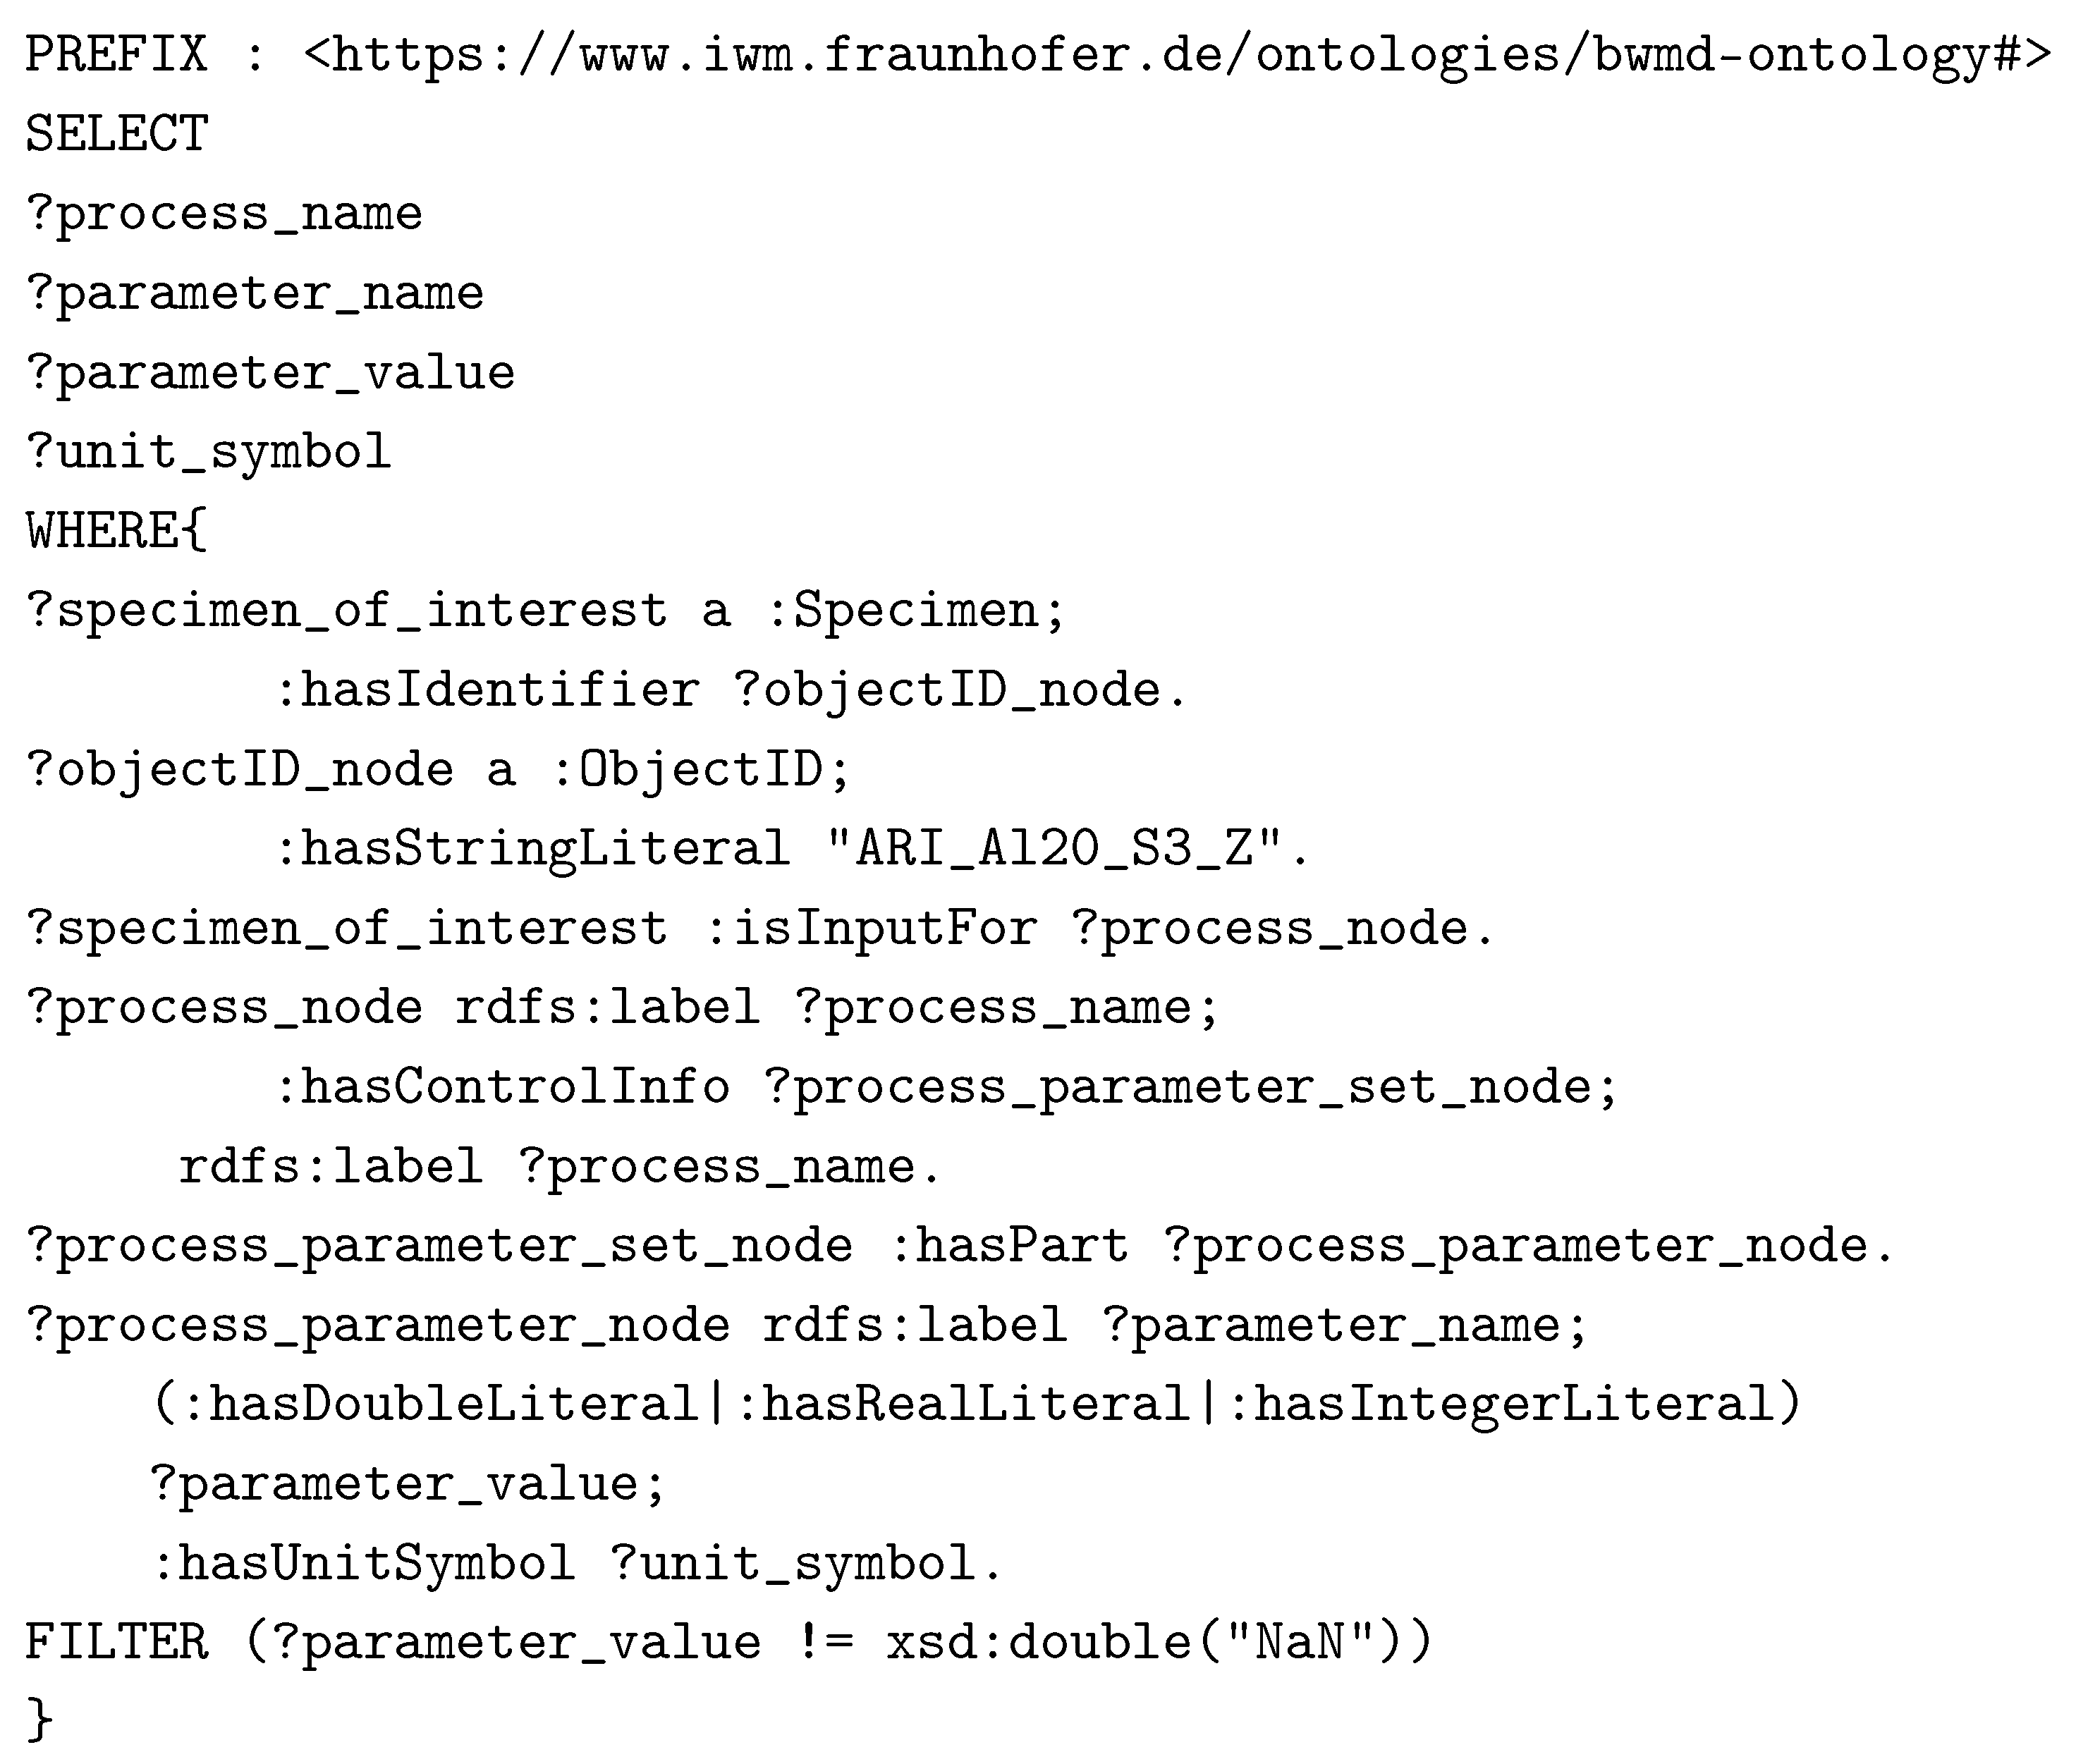
This example demonstrates how the data structures based on the generic Process Graph template enable the search of process control parameters based on a specimen identifier or label. In the present case, the user seeks information regarding a specific specimen, referred to as specimen_of_interest and labeled with the object identifier ARI_Al20_S3_Z. The user wants to know:
- which process(es) utilized this specimen, i.e. the associated process_name;
-
which set of parameter quantities did control the process(es) for which thespecimen_of_interest was used for;
- the values and corresponding units of the set of parameters controlling the output of the process(es).
This knowledge can be extracted from the RDF graph using the following SELECT query presented in Appendix A.2. A graphical representation of this query is depicted in Figure 12. It shows how first the specimen with given object identifier ARI_Al20_S3_Z is located, then follows the pattern given by the object property isInputFor and finds the process for which this specimen was used for. Finally, through the object-property relationship hasControlInfo linking the process_node and the process_parameter_set_node instances, finds the connection to the process_parameter_node instance(s) and their attached data property value(s).
The query result returning the process control parameters, values, and units and the process they belong to, for the specimen with given identifier ARI_Al20_S3_Z are summarized in Table 3. This result clarifies that the investigated specimen was utilized in a quasi-static tensile test, controlled by the specified values for crosshead separation rate and original gauge length, along with their respective units.
3.2.3. Example 3: Retrieve the Digital Process Chain of One Specific Object
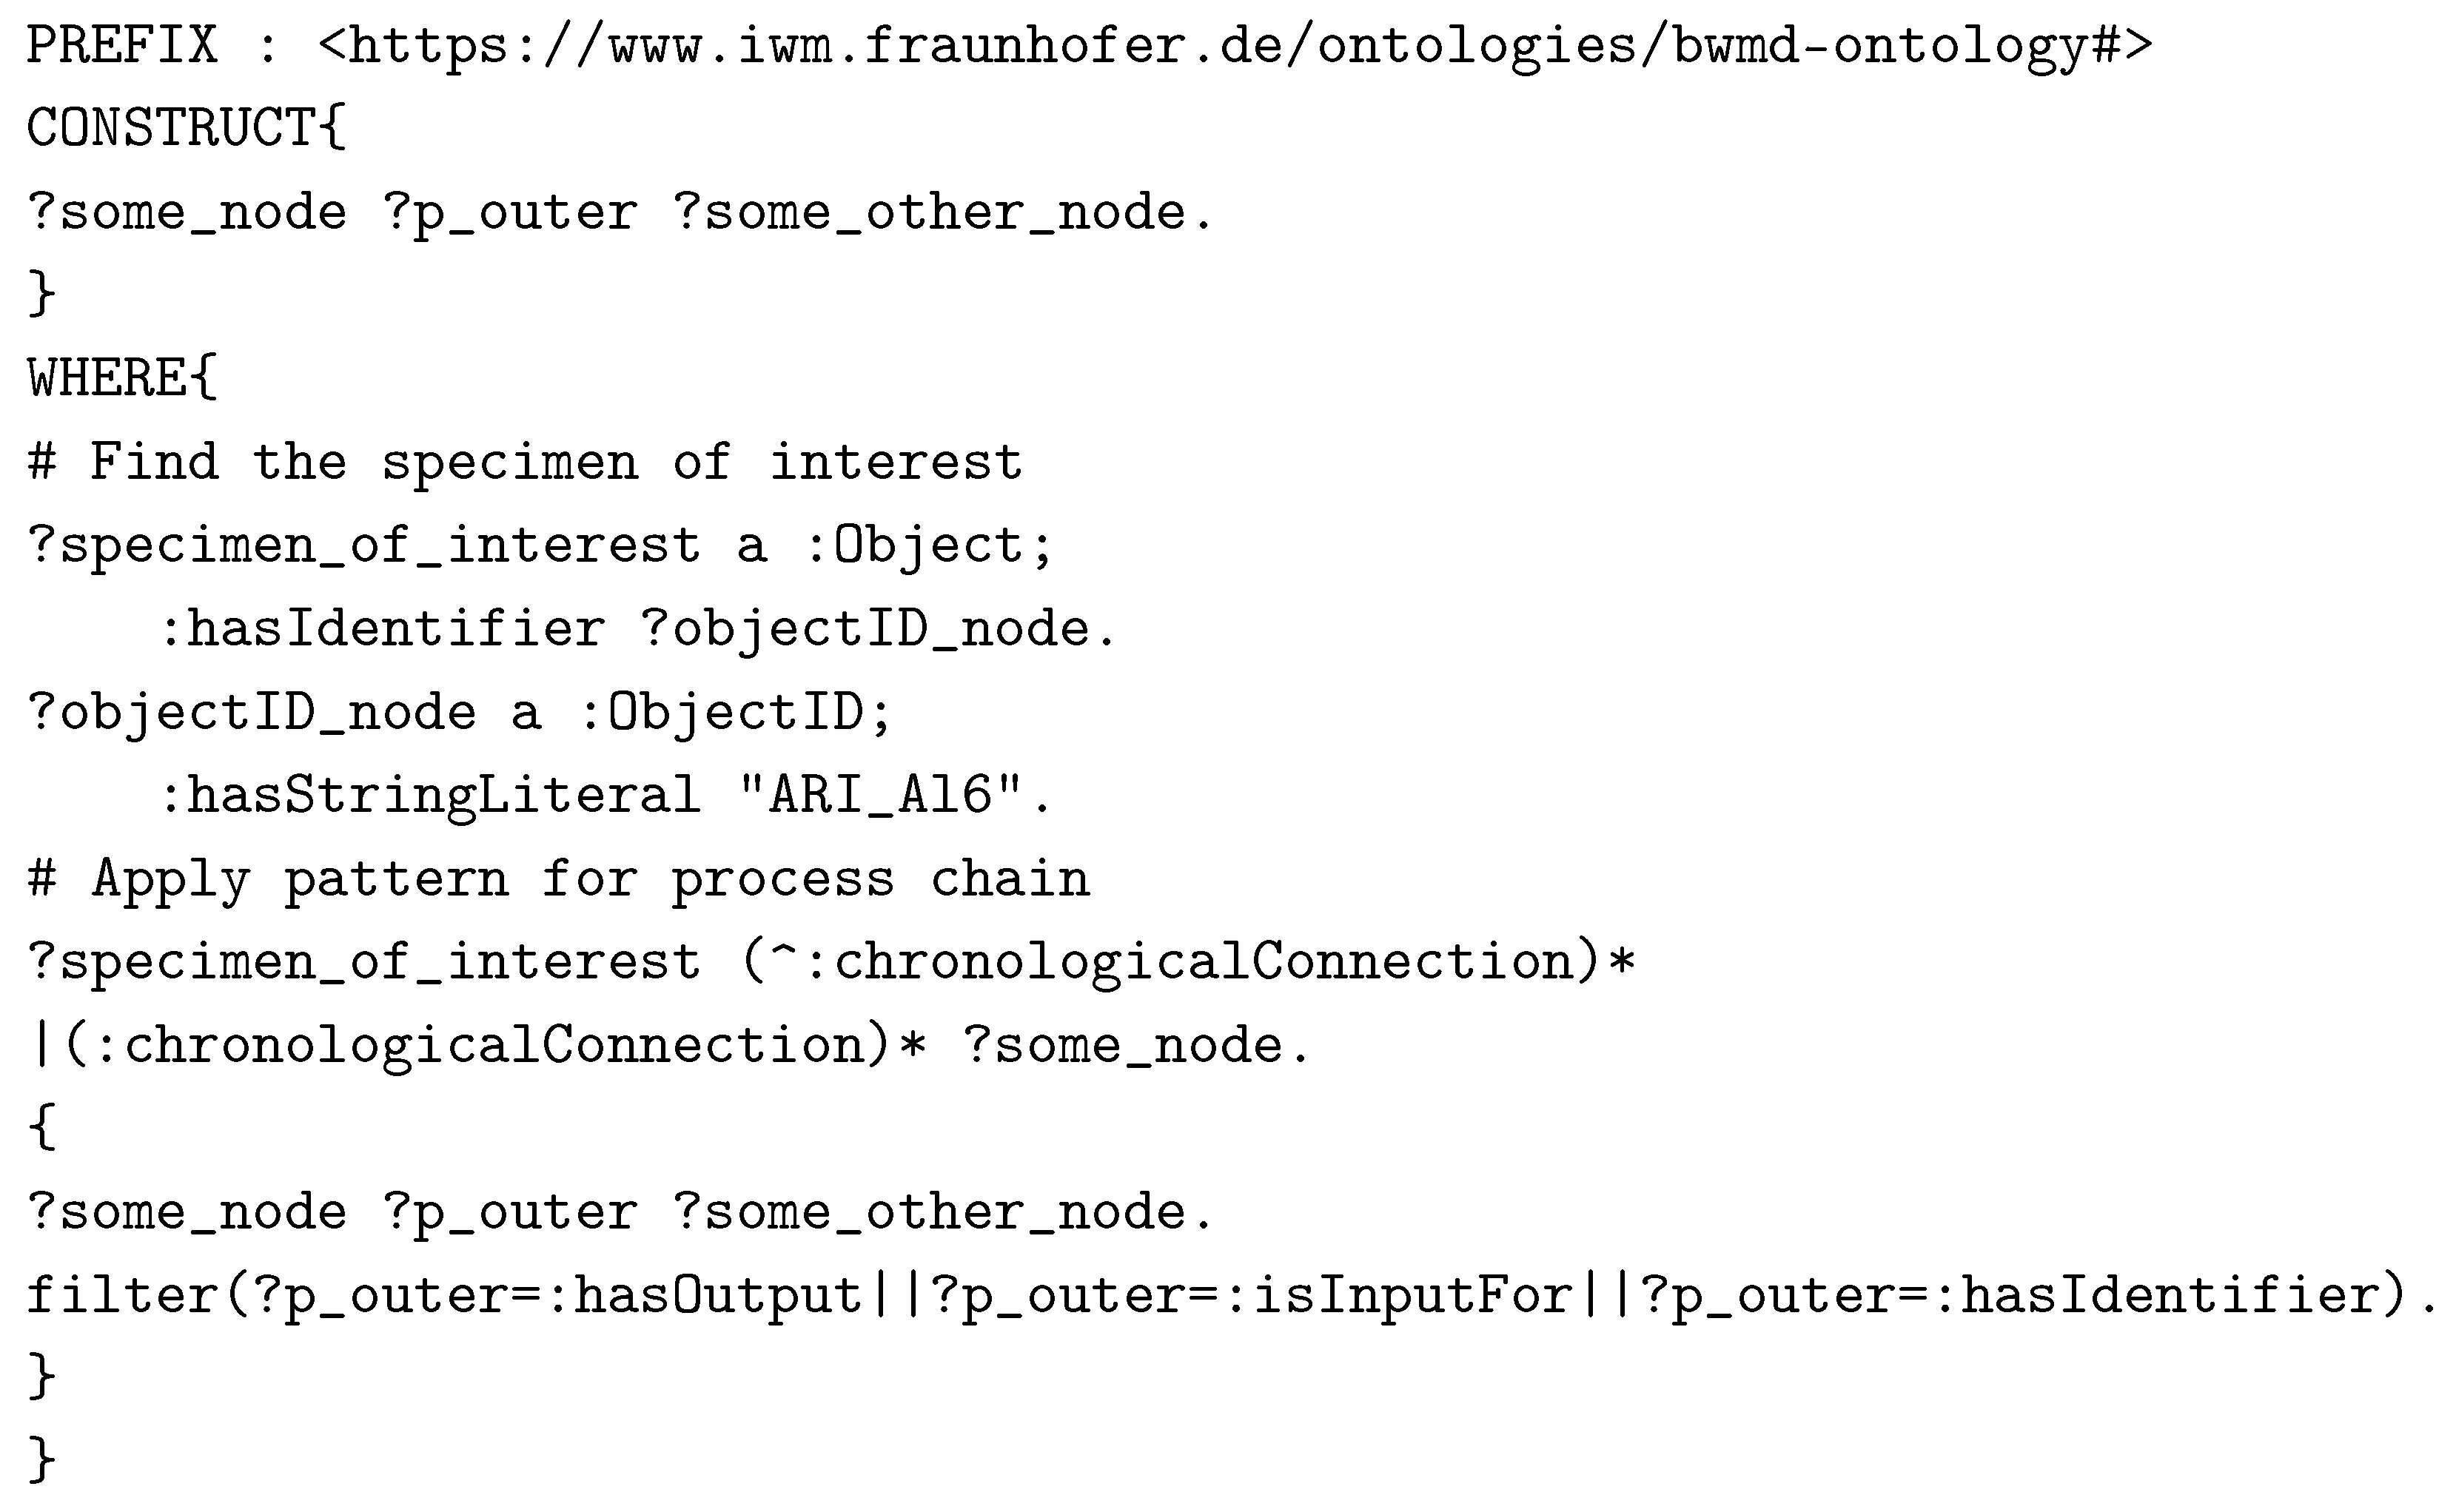
The main scope of this article was to demonstrate the value of the presented digitalization methodology to create MSE semantically structured linked process data (the Graph Designer Workflow) to build digital process chains, herewith, making all digitalized product history traceable along their corresponding product process chain, often referred to as product life cycle. To achieve this, a generic SPARQL query was designed based again on the generic digitalization methodology established and following the pattern determined by the generic Process Graph template. This query must enable the user to extract the full product history of a specific object only based on its given object identifier. The developed generic SPARQL query algorithm for extracting the process chain of a particular object and exemplary demonstrated for the cast part with object identifier ARI_Al6, is presented in Appendix A.3.
It is important to note that to run this query, graph inference needs to be turned on, the ’owl2-rl’ reasoner was used [35]. The CONSTRUCT keyword included at the beginning of the SPARQL query determines the format of the query result, in this case in the form of a graph consisting of multiple triple patterns. The overall purpose of this query is to construct a graph pattern based on the specified pattern included within the WHERE clause, which first finds the specimen_of_interest based on the given object identifier (in this example ’ARI_Al6’ and secondly describes the relationship between entities, connected inwards or backward through the object property chronologicalConnection, whereas the object properties isInputFor and hasOutput are modeled as sub-properties of chronologicalConnection in the BWMD Ontology. The filter included in the WHERE clause ensures that only triples with predicates of type hasOutput, isInputFor, or hasIdentifier are included in the query result.
Figure 13 illustrates graphically the result of the SPARQL process chain query for the object labeled as ARI_Al6, this image displays schematically the mapping between the domain expert (in this example the material science engineer) knowledge regarding the physical process chain of the object investigated, to its digital version, preserving the domain expert knowledge and making it available for other users with no direct possession of such information, as it could be the case of the product supply manager.
3.3. From Knowledge Extraction to New Knowledge Generation
Generating rich semantic structured MSE data with connected process graphs along process chains offers significant benefits. This data can be utilized to feed AI models, enabling new insights, optimization of production steps or mechanical properties, and performing reliable predictions. In this section, a decision regression tree model is trained and validated to illustrate how the RDF graph created for the studied AlSi10Mg in the form of chronologically linked process data, can be exploited to find the optimal production parameters aiming to improve the tensile strength () of the investigated material. For this didactic purpose, the relatively simple Decision Regression Tree model (the DecisionTreeRegressor model) from the ’sklearn.tree’ module included in the ’scikit-learn’ Python package [36] was selected. This model works by continuously splitting a training dataset based on selected feature variable values, resulting in a tree-like structure that performs predictions on the target variable(s). As a result, a trained model capable of assessing the impact of the included feature variables on the target is generated.
The first step in the modeling procedure was to query from the knowledge base all the conducted tensile tests including the previous history information of each tested specimen (the chemical composition from the casting process and the undergone heat treatment steps and corresponding parameters), as well as the resulting material tensile strength from the performed tensile tests. Secondly, the target and feature variables were selected, where:
- was chosen as the target variable or independent variable, to make predictions on;
- the magnesium weight fraction (’weightfraction_Mg[%]’), the annealing duration (’duration_annealing[min]’),the annealing temperature (’temperature_annealing[°C]’), the aging duration (’duration_aging[min]’) and the aging temperature (’temperature_aging[°C]’), represent the feature variables or dependent variables expected to influence the target variable.
In the next step, the retrieved dataset is randomly split into training data (70 % of the dataset) and validation data (30 % of the dataset). Then, the training data is used to train the DecisionTreeRegressor model, which is configured through the following hyperparameters:
- max_depth = 3, which controls the maximum depth of the tree;
- min_samples_split = 6, which determines the minimum amount of samples required to split an internal node;
- min_samples_leaf = 3, representing the minimum amount of samples required per leaf.
In this study case, the model splits the training data into subsets applying the default criterion (the Mean Squared Error) by selecting a feature and a threshold value of the selected feature and searching for the split that minimizes the error of each subset. The splitting process stops once the maximum depth of the tree is reached or the minimum samples per split are reached. The tree grows per split with newly generated branches, composed of nodes representing a decision (internal node) or a prediction (leaf nodes). Figure 14 displays the tree-like form of the fitted DecisionTreeRegressor model. The model predicts that the optimal production route to maximize the tensile strength of the cast AlSi10Mg is achieved for an amount of Mg in the cast melt greater than 0.305 % and an aging duration greater than 120 minutes, where the prediction of the target variable results from averaging the tensile strength value of a data subset composed by 4 samples. It is observed that other included feature variables in the fitted model are not displayed in the tree, this is explained by the low-scored level of importance of these missing variables. The scored level of importance values for performing predictions with the trained model of each considered feature variable are collected in Table 4. The values shown indicate that the main factor influencing the value of the tensile strength (based on the used training data) of the investigated material is the aging duration applied during the heat treatment process. Meanwhile, the amount of Mg in the melt added during the casting process seems to have a small influence on the targeted tensile strength value. In contrast, the other considered production parameters do not have any relevant impact on the tensile strength value.
The quality of the model prediction has been assessed based on the R-squared score or coefficient of determination, whose value indicates how well the fitted model can capture the variability of the target variable. The showcased fitted model performs with an R-squared equal to 0.89, relatively close to 1, and therefore delivers fairly good predictions. The last step to follow at this stage is to test the goodness of the model to perform predictions of the target value based on the left aside validation data. The validation of the trained DecisionTreeRegressor model is depicted in Figure 15. The data points represent the predicted tensile strength values by the trained model versus the experimental ones from the validation dataset. The red line stands for the perfect prediction line.
4. Discussion
While many papers have focused on the development of material ontologies [37,38,39,40] and fewer on the design of knowledge graphs for structuring material data through knowledge graph patterns (e.g., [41,42]), there are no known investigations dedicated to presenting a generic approach for digitalizing material data via a semantic data model that emphasizes the creation of digital process chains. This work aims to design a digitalization strategy focused on developing semantic data models for impartible processes, as introduced in Section 2. Despite existing material ontologies, a new ontology tailored to the digitalization strategy for creating digital process chains within the MSE domain was introduced in Section 2.2. The BWMD ontology employs the BFO 2.0 as a top-level ontology, compatible with the ISO/IEC 19763 standard [43], providing a solid foundation for developing interoperable domain and application ontologies.
The BWMD ontology is the product of a two-year collaborative effort among MSE experts from various German research institutes, initiated in 2018. Although this paper references its non-modularized version for simplicity, a modularized version exists and is published in [44]. This modularized version includes a mid-level module for general concepts and a domain module for specific concepts related to mechanical testing procedures, microstructural features, and specimen preparation.
This article does not advocate for a specific ontology for modeling material data. Parallel developments of mid-level and domain-specific ontologies, such as the PMD-Core ontology [15] from the Material Digital Platform initiative [45], are equally suitable for modeling MSE data. The PMD-Core ontology was initially developed with a bottom-up approach to align with the EMMO [14] and has since been adapted for interoperability with BFO [46]. Another ontology, the MSEO [16], developed within the Materials Open Laboratory initiative, also aligns with BFO principles. Additionally, a mechanical testing domain module [18] was created within the Urwerk project [47], partially covering the MSE domain. Creating mappings between these MSE ontologies can enhance interoperability and mutual benefits.
It is important to note that in addition to the Graph Designer Tool, other digitalization tools are available for material data. Tools like OpenRefine [48], TARQL [49], and Ontopanel [50] offer different approaches for digitalizing and structuring material data. However, the advantages of the Graph Designer Workflow, as presented in this work, are significant. The Graph Designer Tool [51] provides a user-friendly interface for uploading ontology vocabularies into a generic Process Graph template, managing multiple namespaces, and converting the Graph Template into a standard Excel Table for data annotation. This minimizes errors from misinterpreting domain vocabulary and allows domain experts to populate the Process Graph template with real data.
The proposed MSE data digitalization strategy successfully achieves the goal of bridging the existing knowledge gap between domain and ontology experts. While not technological, this challenge poses significant obstacles in digitalizing material science knowledge. Effective information exchange between domain and ontology experts is crucial for designing appropriate semantic models. Understanding the meaning of classes when incorporating new vocabulary into the domain ontology is essential for selecting suitable upper classes from mid-level or top-level ontologies. The quality of this exchange will determine the value of the generated semantically structured data, with a richer vocabulary providing deeper context and knowledge. The interview template introduced in Section 2.3.1 facilitates efficient information exchange, guiding the classification of new concepts according to the semantic schema of the generic Process Graph template in Section 2.3.2. This significantly aids ontology experts in adjusting templates and creating compliant data models. The challenges in knowledge extraction are often overlooked in literature, despite being well-known in the ontology development community. Additionally, using NLP (Natural Language Processing) to extract information from domain-specific literature is a powerful tool for semi-automated domain ontology creation.
The generic aspect of the Graph Designer Workflow implies its possible application with other ontologies or semantic data models. However, the presented work demonstrates its applicability based on the BWMD ontology and the generic process graph template as a semantic data model to efficiently build digital process chains for the cast AlSi10Mg use case. The BWMD Dataset RDF graph, depicted in Figure 10, has been introduced in Section 3. This RDF graph is publicly available in the Fordatis database [26]. The primary objective of this work is to present a generic digitalization method for semantically modeling various processes using different ontologies as base vocabularies and instantiating schemas or generic Process Graph templates. The proposed methodology is demonstrated across ten different processes (see Table 1), showcasing the generality of the solution and the semantic depth of the BWMD ontology. As the disparity of modeled process data increases, more concepts are required to encapsulate the knowledge, leading to an enriched ontology vocabulary. In addition to the RDF graph, two Jupyter Notebooks are also accessible with the created knowledge base for the cast AlSi10Mg, including further SPARQL queries and data visualization features. This aims to add a dimension of user experience to the presented study, as this article intends to be informative and didactic [26].
The advantages of the generic Process Graph template become apparent through the introduced SPARQL query examples in Section 3.2. By following the core pattern of the generic process data model, generic query algorithms can be developed to efficiently and easily extract information stored in the RDF graph connecting all the different digitalized processes. The structure enables retrieval of specific material properties generated via one specific test (see Section 3.2.1) and allows the extraction of other types of information, such as the controlled parameters applied to conduct one specific test (see Section 3.2.2). Unlike traditional SQL databases, graph databases allow for extracting both tabular and graph data based on patterns, thanks to the CONSTRUCT SPARQL query structure. This is illustrated in Section 3.2.3, utilizing the SPARQL query example to retrieve the digital process chain of one specific object. The retrieved object is a piece of the complete RDF Graph and can be visualized as displayed in Figure 13. This example shows the utility of the proposed methodology in creating a data infrastructure that enables a product traceability feature along its digitalized manufacturing process chain. Both the generic Process Graph template and the ’process chain’ query algorithm could be extended to include further process-related information details such as the footprint or the cost associated with the conducted manufacturing step, which could later be used in conjunction with other object history information to find production routes for decreased environmental impact or for reducing production costs of a particular product.
Access to product history information enables the discovery of new production patterns, leading to optimized material properties, as illustrated in Section 3.3. Feeding AI models with context-rich data enhances the material design process, helping to find optimal production paths and allowing for quick solutions to describe phenomena not considered in physical models. If an AI-trained model is fed with a high-quality database (as would be the case of a context-rich graph database), reliable predictions can be made. In the MSE field, this could imply significant cost reduction by creating reduced or optimized material testing programs. Another advantage would be developing robust hybrid models, which would better reproduce the dispersion of apparently similarly generated material experimental data, i.e., generated from similar testing conditions. In such cases, the material scatter can be explained by small differences detected in the control parameters along the digitalized process chain of each tested specimen, e.g., in one or several heat treatment steps, as showcased for the material AlSi10Mg regarding the impact of aging duration on the resulting tensile strength of the material. While this information is common knowledge for the material production expert, it is not necessarily shared by the material engineer who performs simulations with this material, and the information might remain hidden in the form of experimental scatter. Another hidden effect discussed in Section 3.3 is the impact of the variation of the Mg amount in the melt on the tensile strength of the investigated material.
The presented Graph Designer Workflow and the BWMD ontology provide a robust framework for digitalizing material data and creating digital process chains. Furthermore, the digitalized context-rich semantic MSE data offer the perfect basis for training AI models and generating new reliable knowledge. The generic nature and the potential for further development make it a valuable tool for advancing material science and engineering digitalization efforts. While the Graph Designer Workflow offers numerous advantages, there are limitations inherent to working with graph databases, such as the complexity of semantic data models and SPARQL queries. However, advancements in text foundation models offer potential improvements in designing systems that interact with graph databases using natural language. Scalability issues of large graph databases also need to be addressed and approaches like Qlevel [52] provide scalable interfaces. Future work will focus on addressing these challenges, improving user interfaces, and exploring the application of the methodology in other domains.
5. Conclusions
This work aims to accelerate materials discovery by digitalizing data from material process chains in a connected manner, exposing the composition-process-structure-property chain in MSE. Knowledge graphs link data from various processes within material process chains. Using a generic template for creating semantic models simplifies information retrieval, allowing for tracking the complete history of specific labeled objects. Additionally, the use of ontologies ensures unambiguous and interoperable data enriched with domain knowledge.
This work presents a robust methodology, the Graph Designer Workflow, for storing process-specific data and domain knowledge into linked knowledge graphs. A mid-level ontology is developed, and a generic process template is presented, along with instructions for adopting the methodology to specific process chains. The resulting machine-understandable data, stored in a graph database, adheres to the FAIR principles (Findable, Accessible, Interoperable, and Reusable). The entire pipeline is presented in a didactic manner, making it easy for materials-domain experts to adopt the workflows for their digitalization problems.
The methodology is demonstrated through a use case involving the permanent mold casting of AlSi10Mg, including varied chemical composition, non-destructive characterization, specimen extraction, heat treatment, and mechanical testing. The resulting connected knowledge graph, or knowledge base, is used to retrieve and analyze data to investigate the influence of heat treatment and magnesium content on strength properties characterized by tensile tests.
From a scientific and technical point of view, the following increments were made concerning the digital mapping of material-intensive process chains:
- The BWMD ontology was introduced, which is based on the Basic Formal Ontology and provides the necessary mid-level and domain-specific vocabulary for the use case of AlSi10Mg. The mid-level and domain-level parts of the ontology are also available as separate modules. The mid-level ontology module is designed to be general to the MSE domain. Comparisons and connections were made to parallel mid-level ontology design efforts in the MSE domain, highlighting the need to create mappings between these ontologies.
- A generic Process Graph template for mapping material data along process chains was presented, respecting the taxonomy and semantic rules of the mid-level BWMD ontology. The Process Graph template enables a digital representation of impartible processes comprising material process chains. While digitalization efforts like PMD [15] and UrWerk [47] have described modeling of specific processes and process chains in MSE, the presented work provides a generic template that can be adapted for modeling any impartible processes. Further, the ’instantiation’ of this template for ten different processes was presented, demonstrating its generality.
- The so-called graph designer workflow was presented to generate semantic RDF data. The tools part of the workflow is available publicly in [51]. The gap between domain and ontology experts is reduced, making interaction easier using the presented interview template. The workflow is designed to make the user interaction steps easy and intuitive. Users can design the schema describing processes in the interview template and later in a GUI without mastering any schema languages. Tools are designed to convert the GUI template to Excel files, which are used for data input. Here, users can instantiate data in a flat hierarchy, unlike the requirement to preserve data hierarchy in workflows based on schema languages such as LinkML [53] and JSON-Schema. These advantages have led to the adoption of the Graph Designer Workflow in digitalization efforts like AluTrace (referenced as the Fraunhofer IWM toolchain [54,55,56]), iBain [45], Urwerk [47], H2Digital [57], etc.
- A simple and interpretable machine learning model is designed to demonstrate the benefit of creating semantic-rich MSE data. A decision regression tree model is used to predict the maximum tensile strength as a function of heat treatment and chemical composition.
This work successfully accelerates materials discovery by digitalizing data from material process chains using a generic methodology. The resulting knowledge graphs adhere to the FAIR principles and provide a valuable resource for materials-domain experts. Future work will focus on addressing the challenges of semantic data modeling and further improving the user experience.
Funding
The study has received funding from the ’Ministerium für Wirtschaft, Arbeit und Wohnungsbau Baden-Württemberg’ within the framework of the project MaterialDigital.
Data Availability Statement
The complete BWMD dataset, including two Jupyter Notebooks with integrated SPARQL queries to directly interact with the graph data, is published and available for download under MaterialDigital Dataset.
Acknowledgments
This study was funded by the ’Ministerium für Wirtschaft, Arbeit und Wohnungsbau Baden-Württemberg’ as part of the MaterialDigital project.
Abbreviations
The following abbreviations are used in this manuscript:
| FAIR | Findable, Accessible, Interoperable, and Reusable |
| AI | Artificial Intelligence |
| IT | Information Technology |
| ICSD | Inorganic Crystal Structure Database |
| OQMD | Open Quantum Materials Database |
| MDF | Materials Data Facility |
| NOMAD | Novel Materials Discovery |
| MSE | Materials Science and Engineering |
| W3C | World Wide Web Consortium |
| BFO | Basic Formal Ontology |
| OWL | Web Ontology Language |
| IAO | Information Artifact Ontology |
| RDF | Resource Description Framework |
| EU | European Union |
| SLACKS | Semantic Linked Data Stack |
| MMKG | Materials Modeling Knowledge Graph |
| BWMD | Baden Wüttemberg Material Digital |
| SPARQL | SPARQL Protocol and RDF Query Language |
| PMD | Programmed Molecular Dynamics |
| TARQL | SPARQL for Tables |
| NLP | Natural Language Processing |
| GUI | Graphical User Interface |
| JSON | JavaScript Object Notation |
Appendix A. SPARQL Queries
Appendix A.1. SPARQL Query to Retrieve the Brinell Hardness of All Tested Specimens
Appendix A.2. SPARQL Query to Retrieve the Process Control Parameters Corresponding to One Specific Object Identifier
Appendix A.3. SPARQL Query to Retrieve the Digital Process Chain of One Specific Object
References
- Wilkinson, M.D.; Dumontier, M.; Aalbersberg, I.J.; Appleton, G.; Axton, M.; Baak, A.; Blomberg, N.; Boiten, J.W.; da Silva Santos, L.B.; Bourne, P.E.; others. The FAIR Guiding Principles for scientific data management and stewardship. Scientific data 2016, 3, 1–9.
- OpenAI. ChatGPT: Applications and Impacts. https://openai.com/research/chatgpt, 2022.
- Murthy, R.N.; Potu, S.T.; Thomas, A.; Mishra, L.; Prange, N.; Durmaz, A.R. Ontology-conformal recognition of materials entities using language models 2024.
- Pan, S.; Luo, L.; Wang, Y.; Chen, C.; Wang, J.; Wu, X. Unifying large language models and knowledge graphs: A roadmap. IEEE Transactions on Knowledge and Data Engineering 2024.
- Bergerhoff, G. Data base for inorganic crystal structures g. bergerhoff 1984. 33, 79–84.
- Saal, J.E.; Kirklin, S.; Aykol, M.; Meredig, B.; Wolverton, C. Materials Design and Discovery with High-Throughput Density Functional Theory : The Open Quantum Materials Database ( OQMD ) 2013. 65, 1501–1509. [CrossRef]
- Jain, A.; Ong, P.; Hautier, G.; Chen, W.; Gunter, D.; Skinner, D.; Ceder, G.; Persson, K.A. Commentary : The Materials Project : A materials genome approach to accelerating materials innovation Commentary : The Materials Project : A materials genome 2016. 011002. [CrossRef]
- Blaiszik, B.; Chard, K.; Pruyne, J.; Ananthakrishnan, R.; Tuecke, S.; Foster, I. The Materials Data Facility: Data Services to Advance Materials Science Research. JOM: The Journal of the Minerals, Metals & Materials Society 2016, 68, 2045–2052. [CrossRef]
- Draxl, C.; Scheffler, M.; others. NOMAD: The FAIR concept for big data-driven materials science. MRS Bulletin 2019, 44, 124–132. [CrossRef]
- Decker, S.; Erdmann, M.; Fensel, D.; Studer, R. Ontobroker: Ontology Based Access to Distributed and Semi-Structured Information 1999. pp. 351–369. [CrossRef]
- Antoniou, G.; Harmelen, F.V. Web Ontology Language: OWL 2004. pp. 67–92. [CrossRef]
- Ariza-Colpas, P.; Piñeres-Melo, M.; Nieto-Bernal, W.; Morales-Ortega, R. WSIA: Web Ontological Search Engine Based on Smart Agents Applied to Scientific Articles 2019. pp. 338–347. [CrossRef]
- Smith, B.; Almeida, M.; Bona, J.; Brochhausen, M.; Ceusters, W.; Courtot, M.; Dipert, R.; Goldfain, A.; Grenon, P.; Hastings, J.; Hogan, W.; Jacuzzo, L.; Johansson, I.; Mungall, C.; Natale, D.; Neuhaus, F.; Overton, J.; Petosa, A.; Rovetto, R.; Ruttenberg, A.; Ressler, M.; Rudniki, R.; Seppälä, S.; Schulz, S.; Zheng, J. Basic Formal Ontology 2.0: Specification and User’s Guide, 2015. Version 2.0.
- Horsch, M.; Chiacchiera, S.; Schembera, B.; Seaton, M.; Todorov, I. Semantic interoperability Based on the European Materials and Modelling Ontology and its Ontological Paradigm: Mereosemiotics. 14th WCCM-ECCOMAS Congress 2020. [CrossRef]
- PMD Core Ontology (PMDco) v2.0.8. https://github.com/materialdigital/core-ontology, 2024. Accessed: October 2, 2024.
- Hanke, T. MSEO Ontology. https://matportal.org/ontologies/MSEO, 2023. Accessed: June 15, 2023.
- Austin, T.; Bullough, C.; Gagliardi, D.; Loveday, M.; Leal, D. A Guide to the Development and Use of Standard Compliant Data Format for Engineering Materials Test Data; 2010.
- Repository, E. Domain Mechanical Testing Ontology. https://github.com/emmo-repo/domain-mechanical-testing?tab=readme-ov-file, 2024. Accessed: 2024-10-07.
- Schilling, M. Towards digitalization of materials in PMD: An application ontology of the tensile test 2021.
- Usman, Z.; Young, R.; Chungoora, N.; Palmer, C.; Case, K.; Harding, J. Towards a formal manufacturing reference ontology. International Journal of Production Research 2013, 51, 6553 – 6572. [CrossRef]
- Ali, M.; Yang, R.; Zhang, B.; Furini, F.; Rai, R.; Otte, J.; Smith, B. Enriching the functionally graded materials (FGM) ontology for digital manufacturing. International Journal of Production Research 2020, 59, 5540 – 5557. [CrossRef]
- Norouzi, E.; Waitelonis, J.; Sack, H. The landscape of ontologies in materials science and engineering: A survey and evaluation. arXiv preprint arXiv:2408.06034 2024.
- Brandt, N.; Garabedian, N.T.; Schoof, E.; Schreiber, P.J.; Zschumme, P.; Greiner, C.; Selzer, M. Managing FAIR tribological data using Kadi4Mat. Data 2022, 7, 15. [CrossRef]
- Schweizer, C.; Reichenbach, R.; Butz, A.; Lienhard, J.; Herrmann, T.; Preußner, J.; Hartrott, P.v.; Friedmann, V.; Wessel, A.; Thomas, A.; et al.. Abschlussbericht zu MaterialDigital; 2020. [CrossRef]
- Basic Formal Ontology (BFO) 2.0 OWL. https://raw.githubusercontent.com/BFO-ontology/BFO/master/releases/2.0/bfo.owl, 2020.
- Schweizer, C.; Reichenbach, R.; Butz, A.; Lienhard, J.; Herrmann, T.; Preußner, J.; Hartrott, P.v.; Friedmann, V.; Wessel, A.; Thomas, A.; et al.. MaterialDigital Dataset. https://fordatis.fraunhofer.de/handle/fordatis/323, 2023. [CrossRef]
- Schweizer, C.; Hartrott, P.v.; Friedmann, V.; Thomas, A.; Grau, G.; et al.. BWMD ontology. https://gitlab.cc-asp.fraunhofer.de/gf7_public/iwm-gdtool/-/blob/c08de6d4c7bdcdfc4cf0c29fa3d7a99302ce8a2b/BWMD_legacy/BWMD_Ontologie_2020-08-12.owl, 2022.
- Information Artifact Ontology (IAO). https://github.com/information-artifact-ontology/IAO/, 2024. Accessed: 2024-10-23.
- Garcia Trelles, E.; Hartrott, P.v. DIGITAL-WORKFLOW-STEPS-USING-THE-GRAPH-DESIGNER-TOOL. https://gitlab.cc-asp.fraunhofer.de/gf7_public/iwm-gdtool/-/wikis/DIGITAL-WORKFLOW-STEPS-USING-THE-GRAPH-DESIGNER-TOOL, 2022.
- Stanford Center for Biomedical Informatics Research. Protégé. https://protege.stanford.edu/, 2021. Accessed: 2022-06-23.
- Inforapid KnowledgeBase Builder. Inforapid KnowledgeBase Builder. https://www.inforapid.com/, 2021.
- Ontotext. GraphDB. https://graphdb.ontotext.com/documentation/10.2/. Accessed: 2022-06-23.
- Janka-Ramm, M.; Garcia Trelles, E. Interview Template for Domain Knowledge Extraction. https://gitlab.cc-asp.fraunhofer.de/gf7_public/iwm-gdtool/-/blob/5e9b251b8cc0e14a3048af7d8bf5da78b79c2ffc/BWMD_legacy/Interview_format_v3.xlsx, 2023. Accessed: June 2, 2023.
- Aryan, P.R. SparqlGraphViz: Visualize SPARQL Query Results with Graphviz. https://github.com/pebbie/sparqlgpviz, 2021. GitHub repository.
- Ontotext. Reasoning. https://graphdb.ontotext.com/documentation/10.7/reasoning.html, 2023. Accessed: 2023-10-03.
- Pedregosa, F.; Varoquaux, G.; Gramfort, A.; Michel, V.; Thirion, B.; Grisel, O.; Blondel, M.; Prettenhofer, P.; Weiss, R.; Dubourg, V.; Vanderplas, J.; Passos, A.; Cournapeau, D.; Brucher, M.; Perrot, M.; Duchesnay, E. Scikit-learn: Machine Learning in Python. Journal of Machine Learning Research, 2011.
- Cheung, K.; Drennan, J.; Hunter, J. Towards an Ontology for Data-driven Discovery of New Materials. AAAI Spring Symposium: Semantic Scientific Knowledge Integration, 2008, pp. 9–14.
- P. Valledor, D. Diaz, D.B.L.P.E.R.A.M. Ontology for the Steel Domain, 2009.
- Alam, M.; Dittmann, F.; Niebel, M.; Lehmann, J.; Dessı, D.; Morgado, J.F.; von Hartrott, P.; Eberl, C.; Gumbsch, P.; Sack, H. Towards digitizing physical entities in materials science, 2020.
- Bayerlein, B.; Hanke, T.; Muth, T.; Riedel, J.; Schilling, M.; Schweizer, C.; Skrotzki, B.; Todor, A.; Moreno Torres, B.; Unger, J.F.; others. A perspective on digital knowledge representation in materials science and engineering. Advanced Engineering Materials 2022, 24, 2101176. [CrossRef]
- Garabedian, N.T.; Schreiber, P.J.; Brandt, N.; Zschumme, P.; Blatter, I.L.; Dollmann, A.; Haug, C.; Kümmel, D.; Li, Y.; Meyer, F.; others. Generating FAIR research data in experimental tribology. Scientific Data 2022, 9, 315. [CrossRef]
- Bayerlein, B. Towards Interoperability: Digital Representation of a Material Specific Characterization Method 2022.
- International Organization for Standardization.; International Electrotechnical Commission. ISO/IEC 19763-10:2023: Information technology - Metamodel framework for interoperability (MFI) - Part 10: Core model and basic mapping 2023. p. 24. Technical committee: ISO/IEC JTC 1/ISO/IEC JTC 1/SC 32 Data management and interchange.
- The BWMD ontology. https://gitlab.cc-asp.fraunhofer.de/EMI_datamanagement/bwmd_ontology, 2021. Accessed: June 2, 2023.
- Platform Material Digital. https://www.materialdigital.de/.
- Bayerlein, B.; Schilling, M.; Birkholz, H.; Jung, M.; Waitelonis, J.; Mädler, L.; Sack, H. PMD Core Ontology: Achieving semantic interoperability in materials science. Materials & Design 2024, 237, 112603. [CrossRef]
- Fliegener, S.; Rosenberger, J.; Luke, M.; Domínguez, J.M.; Francisco Morgado, J.; Kobialka, H.U.; Kraft, T.; Tlatlik, J. Digital Methods for the Fatigue Assessment of Engineering Steels. Advanced Engineering Materials 2024. [CrossRef]
- OpenRefine. https://openrefine.org/, 2022. Accessed: June 15, 2023.
- TARQL. https://tarql.github.io/, 2019. Accessed: June 15, 2023.
- Chen, Y.; Schilling, M.; von Hartrott, P.; Nasrabadi, H.B.; Skrotzki, B.; Olbricht, J. Ontopanel: A Tool for Domain Experts Facilitating Visual Ontology Development and Mapping for FAIR Data Sharing in Materials Testing. Integrating Materials and Manufacturing Innovation 2022, 11, 545–556.
- IWM-GDTool. https://gitlab.cc-asp.fraunhofer.de/gf7_public/iwm-gdtool, 2022. Accessed: 2023-06-15.
- Bast, H.; Buchhold, B. Qlever: A query engine for efficient sparql+ text search. Proceedings of the 2017 ACM on Conference on Information and Knowledge Management, 2017, pp. 647–656.
- Moxon, S.A.; Solbrig, H.; Unni, D.R.; Jiao, D.; Bruskiewich, R.M.; Balhoff, J.P.; Vaidya, G.; Duncan, W.D.; Hegde, H.; Miller, M.; others. The Linked Data Modeling Language (LinkML): A General-Purpose Data Modeling Framework Grounded in Machine-Readable Semantics. ICBO 2021, 3073, 148–151.
- Huschka, M.; Dlugosch, M.; Friedmann, V.; Trelles, E.G.; Hoschke, K.; Klotz, U.E.; Patil, S.; Preußner, J.; Schweizer, C.; Tiberto, D. Position Paper The “ AluTrace ” Use Case : Harnessing Lightweight Design Potentials via the Materials Data Space ® 2022.
- Huschka, M.; Dlugosch, M.; Friedmann, V.; Trelles, E.G.; Hoschke, K.; Klotz, U.; Patil, S.; Preußner, J.; Schweizer, C.; Tiberto, D. Mat-O-Lab/AluTrace-Data-and-Documentation: v1.0.3, 2023. [CrossRef]
- Huschka, M.; Dlugosch, M.; Friedmann, V.; Trelles, E.G.; Hoschke, K.; Klotz, U.; Patil, S.; Preußner, J.; Schweizer, C.; Tiberto, D. AluTrace Data and Documentation: v0.0.5 2022. [CrossRef]
- H2DIGITAL: Digitale Abbildung einer grünen Wasserstoffwirtschaft. https://www.iwm.fraunhofer.de/de/warum-fraunhofer-iwm/forschungsprojekte-des-fraunhofer-iwm/h2digital.html, 2022. Accessed: 2024-09-25.
Figure 1.
The BWMD process instance modeling philosophy: BFO classes depicted in black, BWMD classes in green, and BWMD object properties in red.
Figure 1.
The BWMD process instance modeling philosophy: BFO classes depicted in black, BWMD classes in green, and BWMD object properties in red.
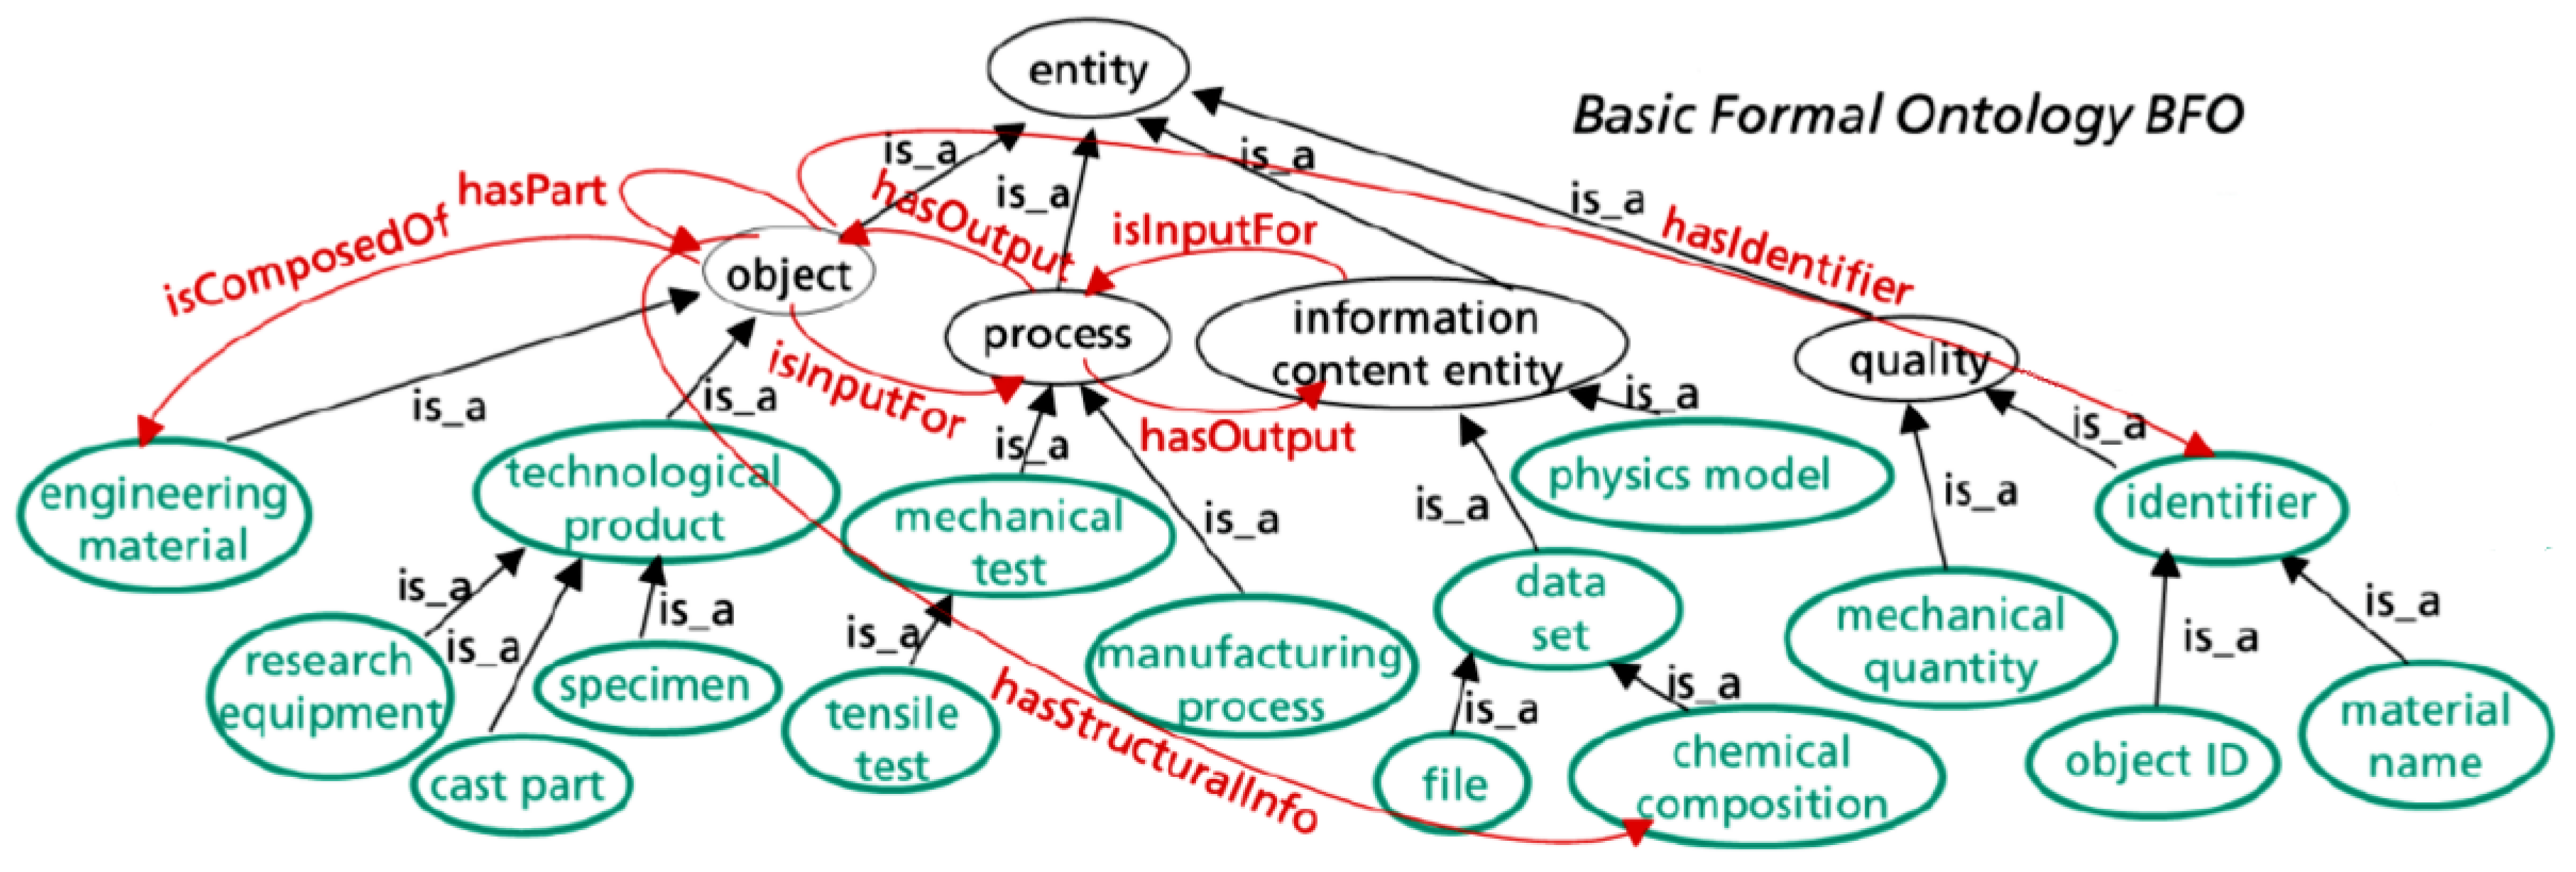
Figure 2.
Schematic representation of the permanent mold casting process including the ingot as input and the cast part as output.
Figure 2.
Schematic representation of the permanent mold casting process including the ingot as input and the cast part as output.
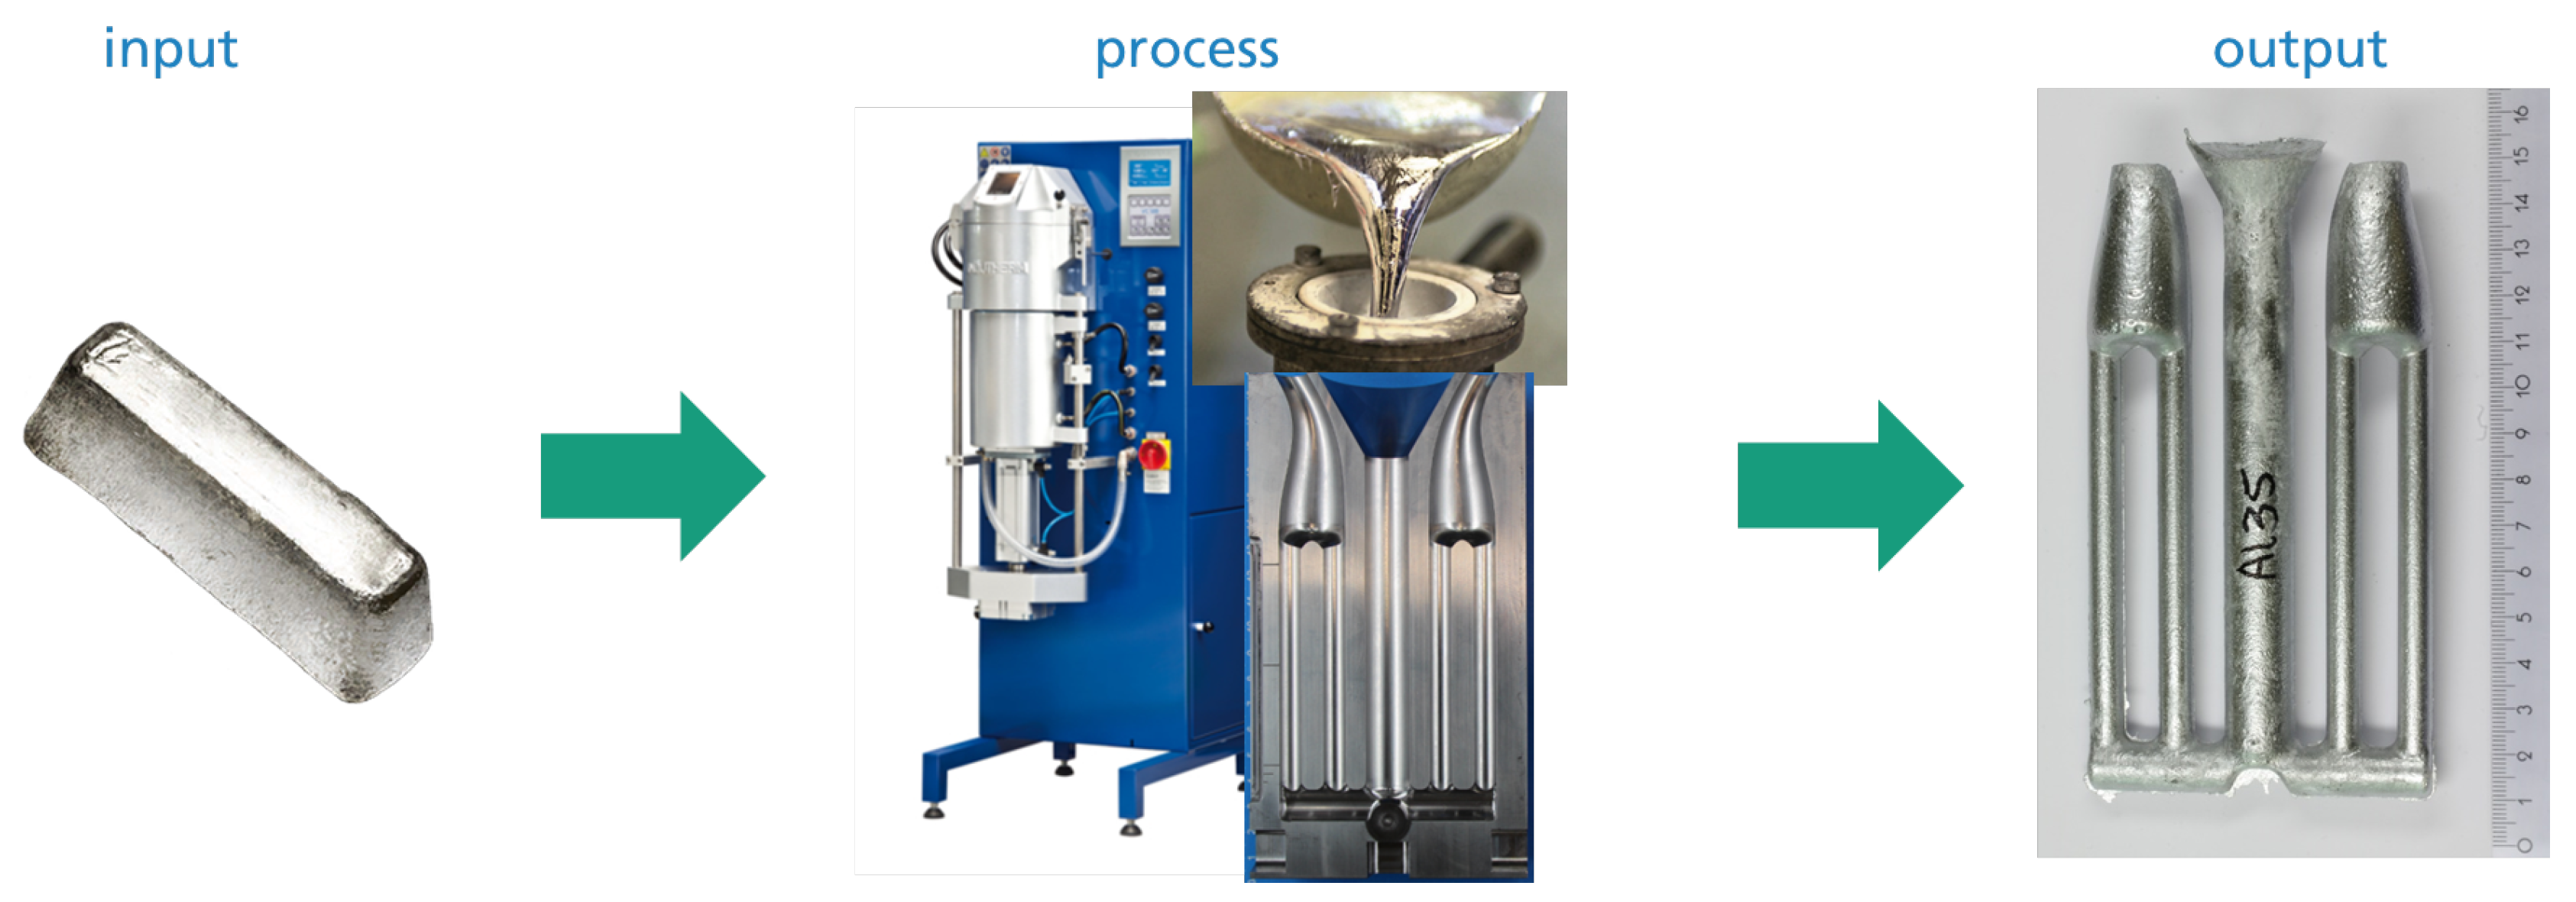
Figure 3.
The Graph Designer Workflow. Extended documentation regarding its application and tools can be found in [29].
Figure 3.
The Graph Designer Workflow. Extended documentation regarding its application and tools can be found in [29].
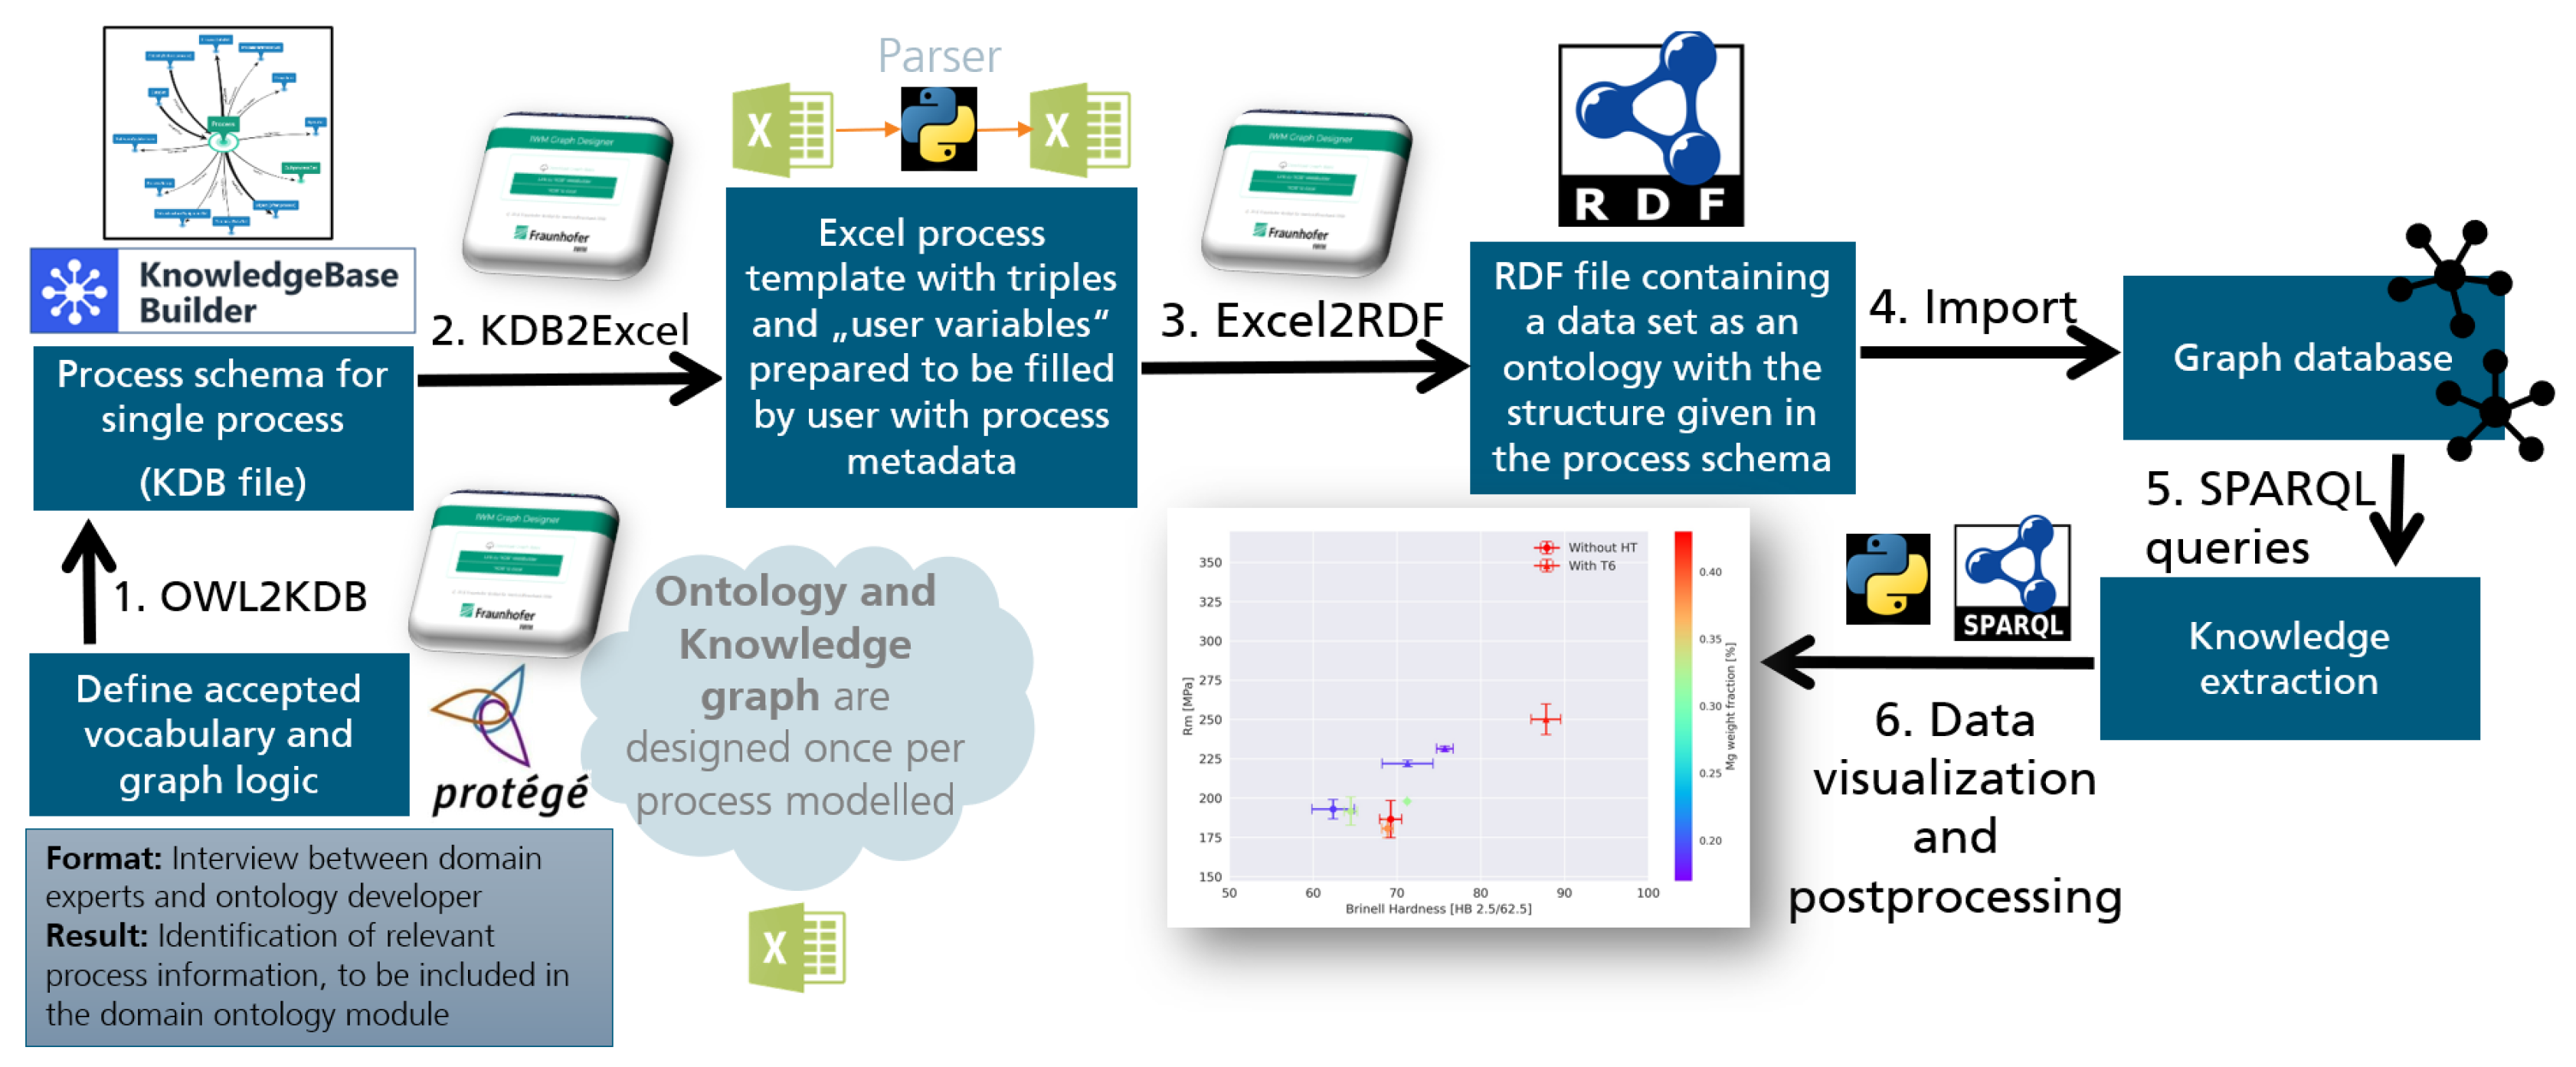
Figure 4.
Detail of the interview Excel sheet regulating the information exchange between the domain expert and the ontology developer: one section of the interview is reserved for collecting the list of parameters that determine a specific outcome of the process to be modeled, in the BWMD Ontology referred to through the class ProcessControlParameters.
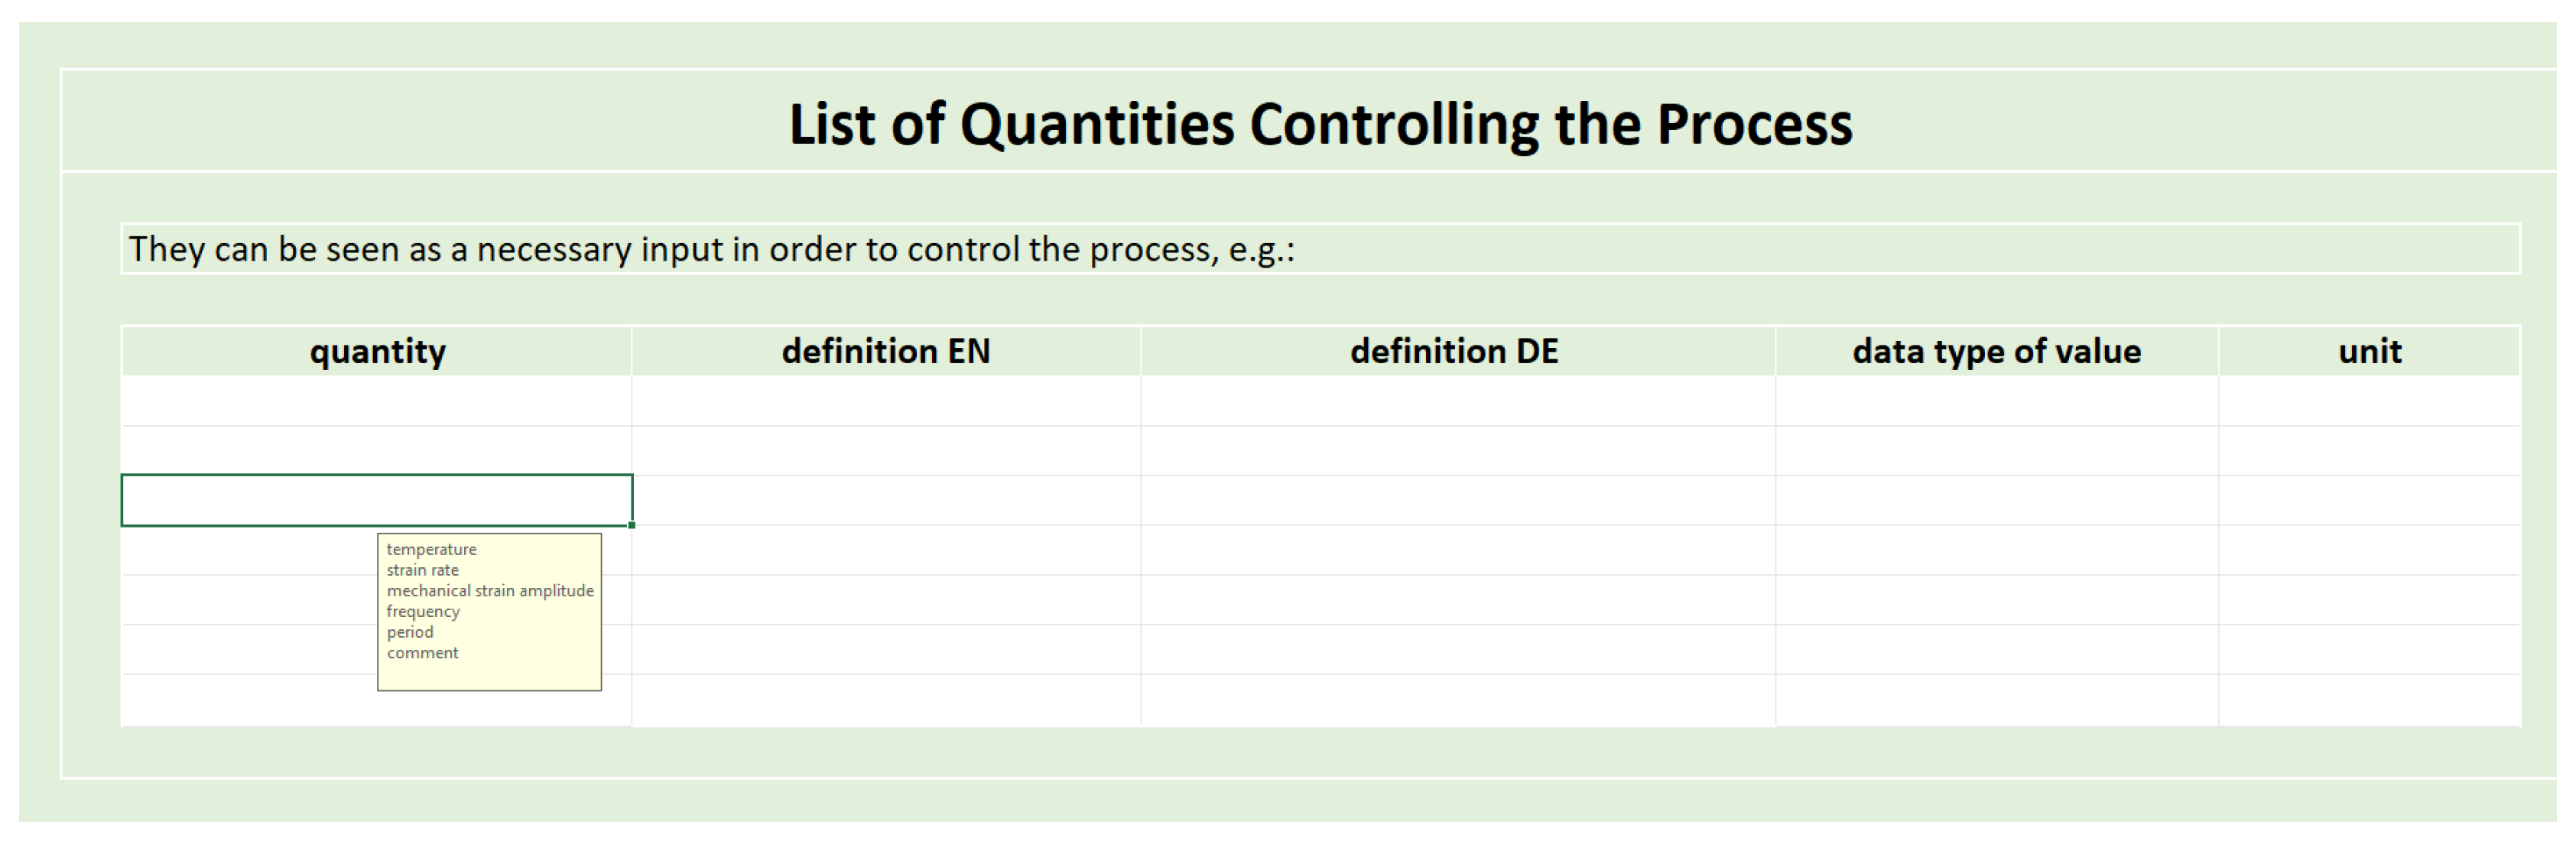
Figure 5.
The generic Process Graph template: a common pattern to describe a process.
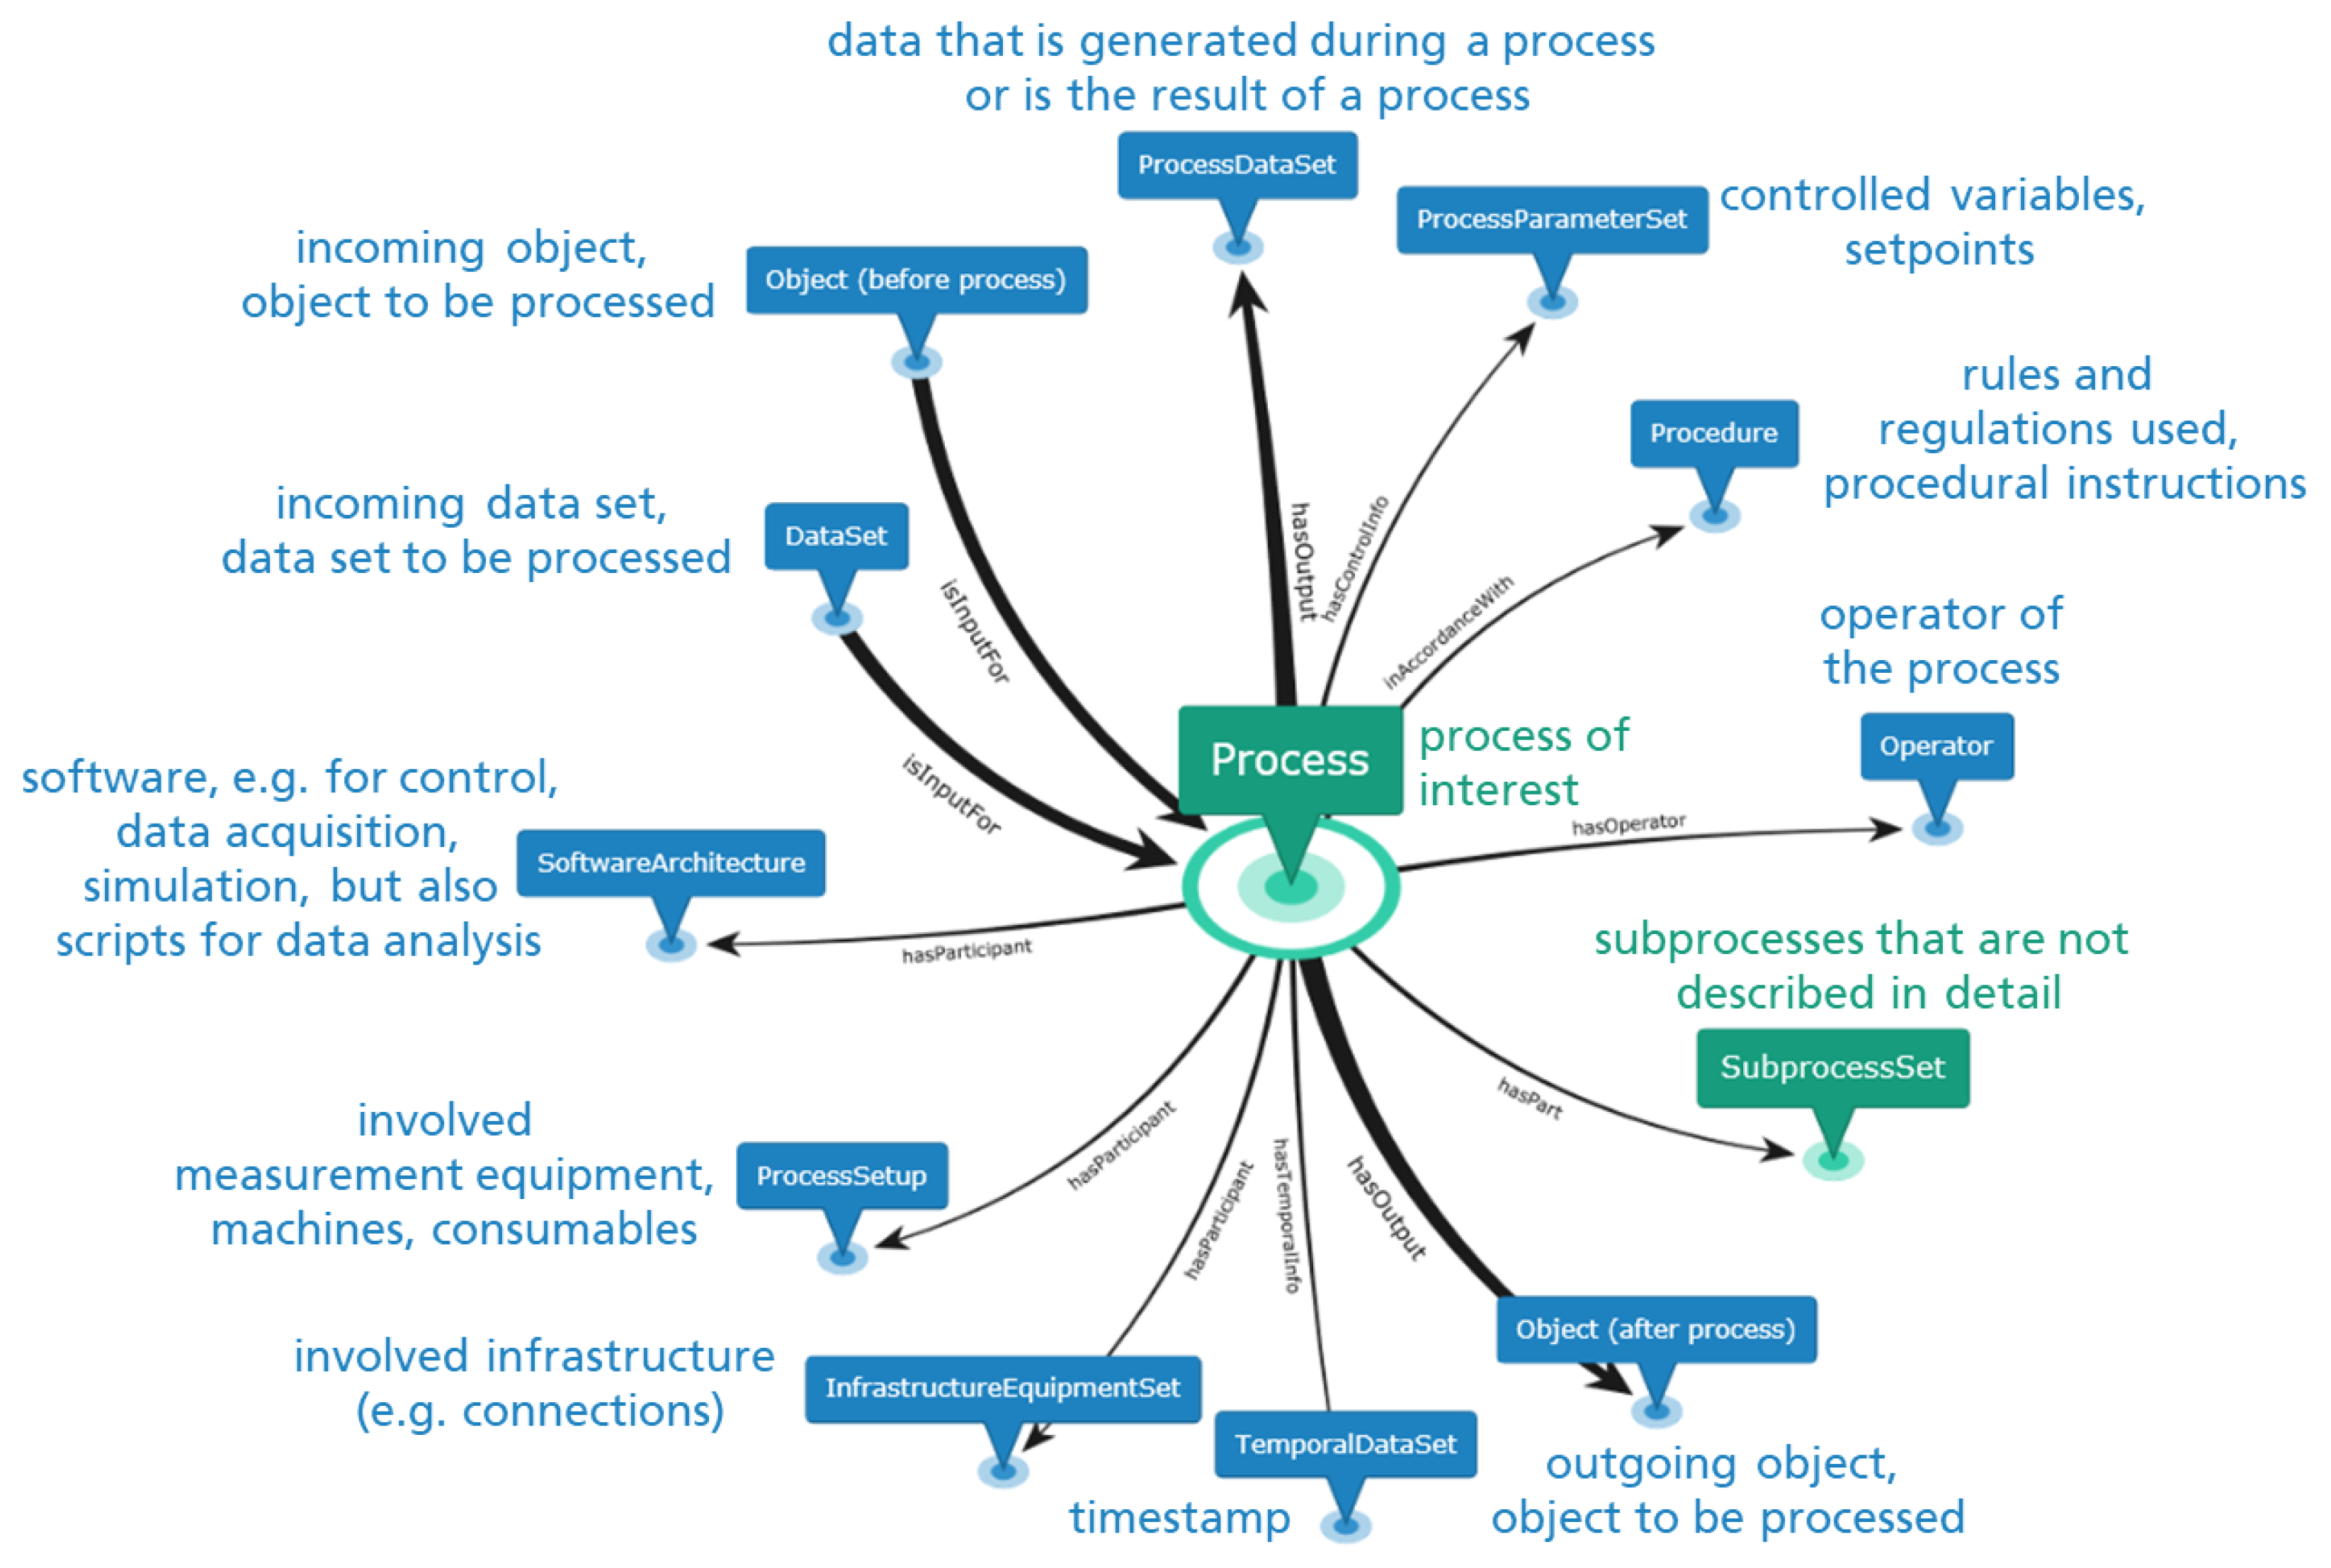
Figure 6.
Details of the Excel template for metadata acquisition: 1.) user_variables: user view including the node names of the literals from the process graphs; 2.) gdtriples: logic of the process graph; 3.) namespaces: ontology IRI and namespace.
Figure 6.
Details of the Excel template for metadata acquisition: 1.) user_variables: user view including the node names of the literals from the process graphs; 2.) gdtriples: logic of the process graph; 3.) namespaces: ontology IRI and namespace.
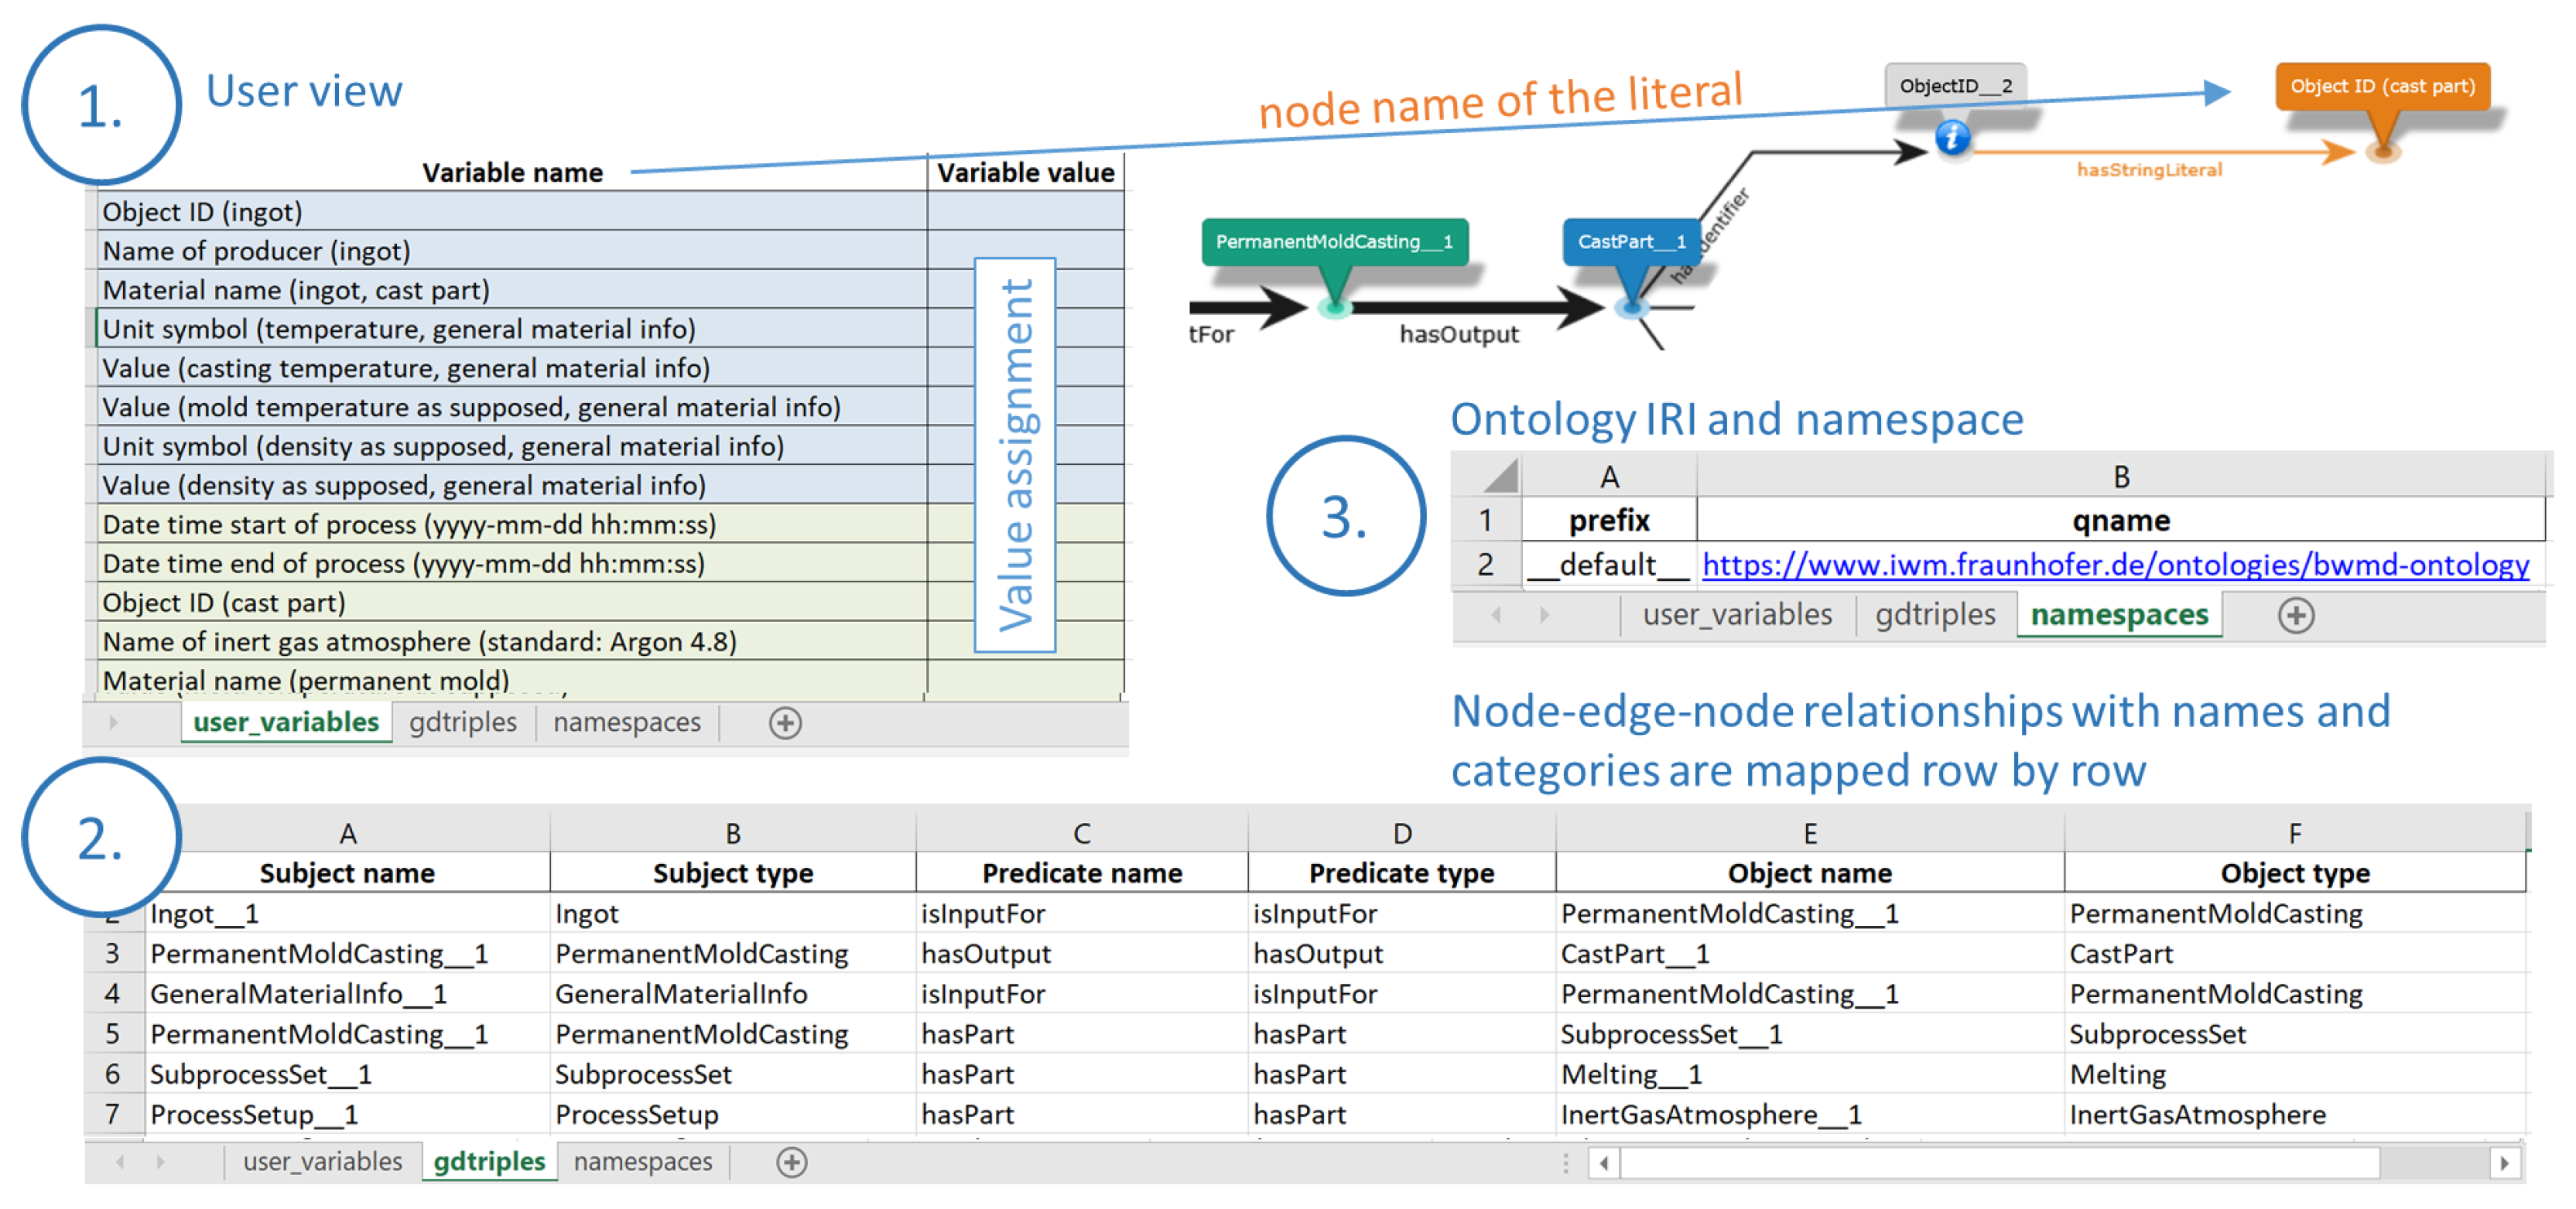
Figure 7.
Exemplary use of the {1..n} construct with the example of user-specific duplication of chemical elements within a chemical composition.
Figure 7.
Exemplary use of the {1..n} construct with the example of user-specific duplication of chemical elements within a chemical composition.
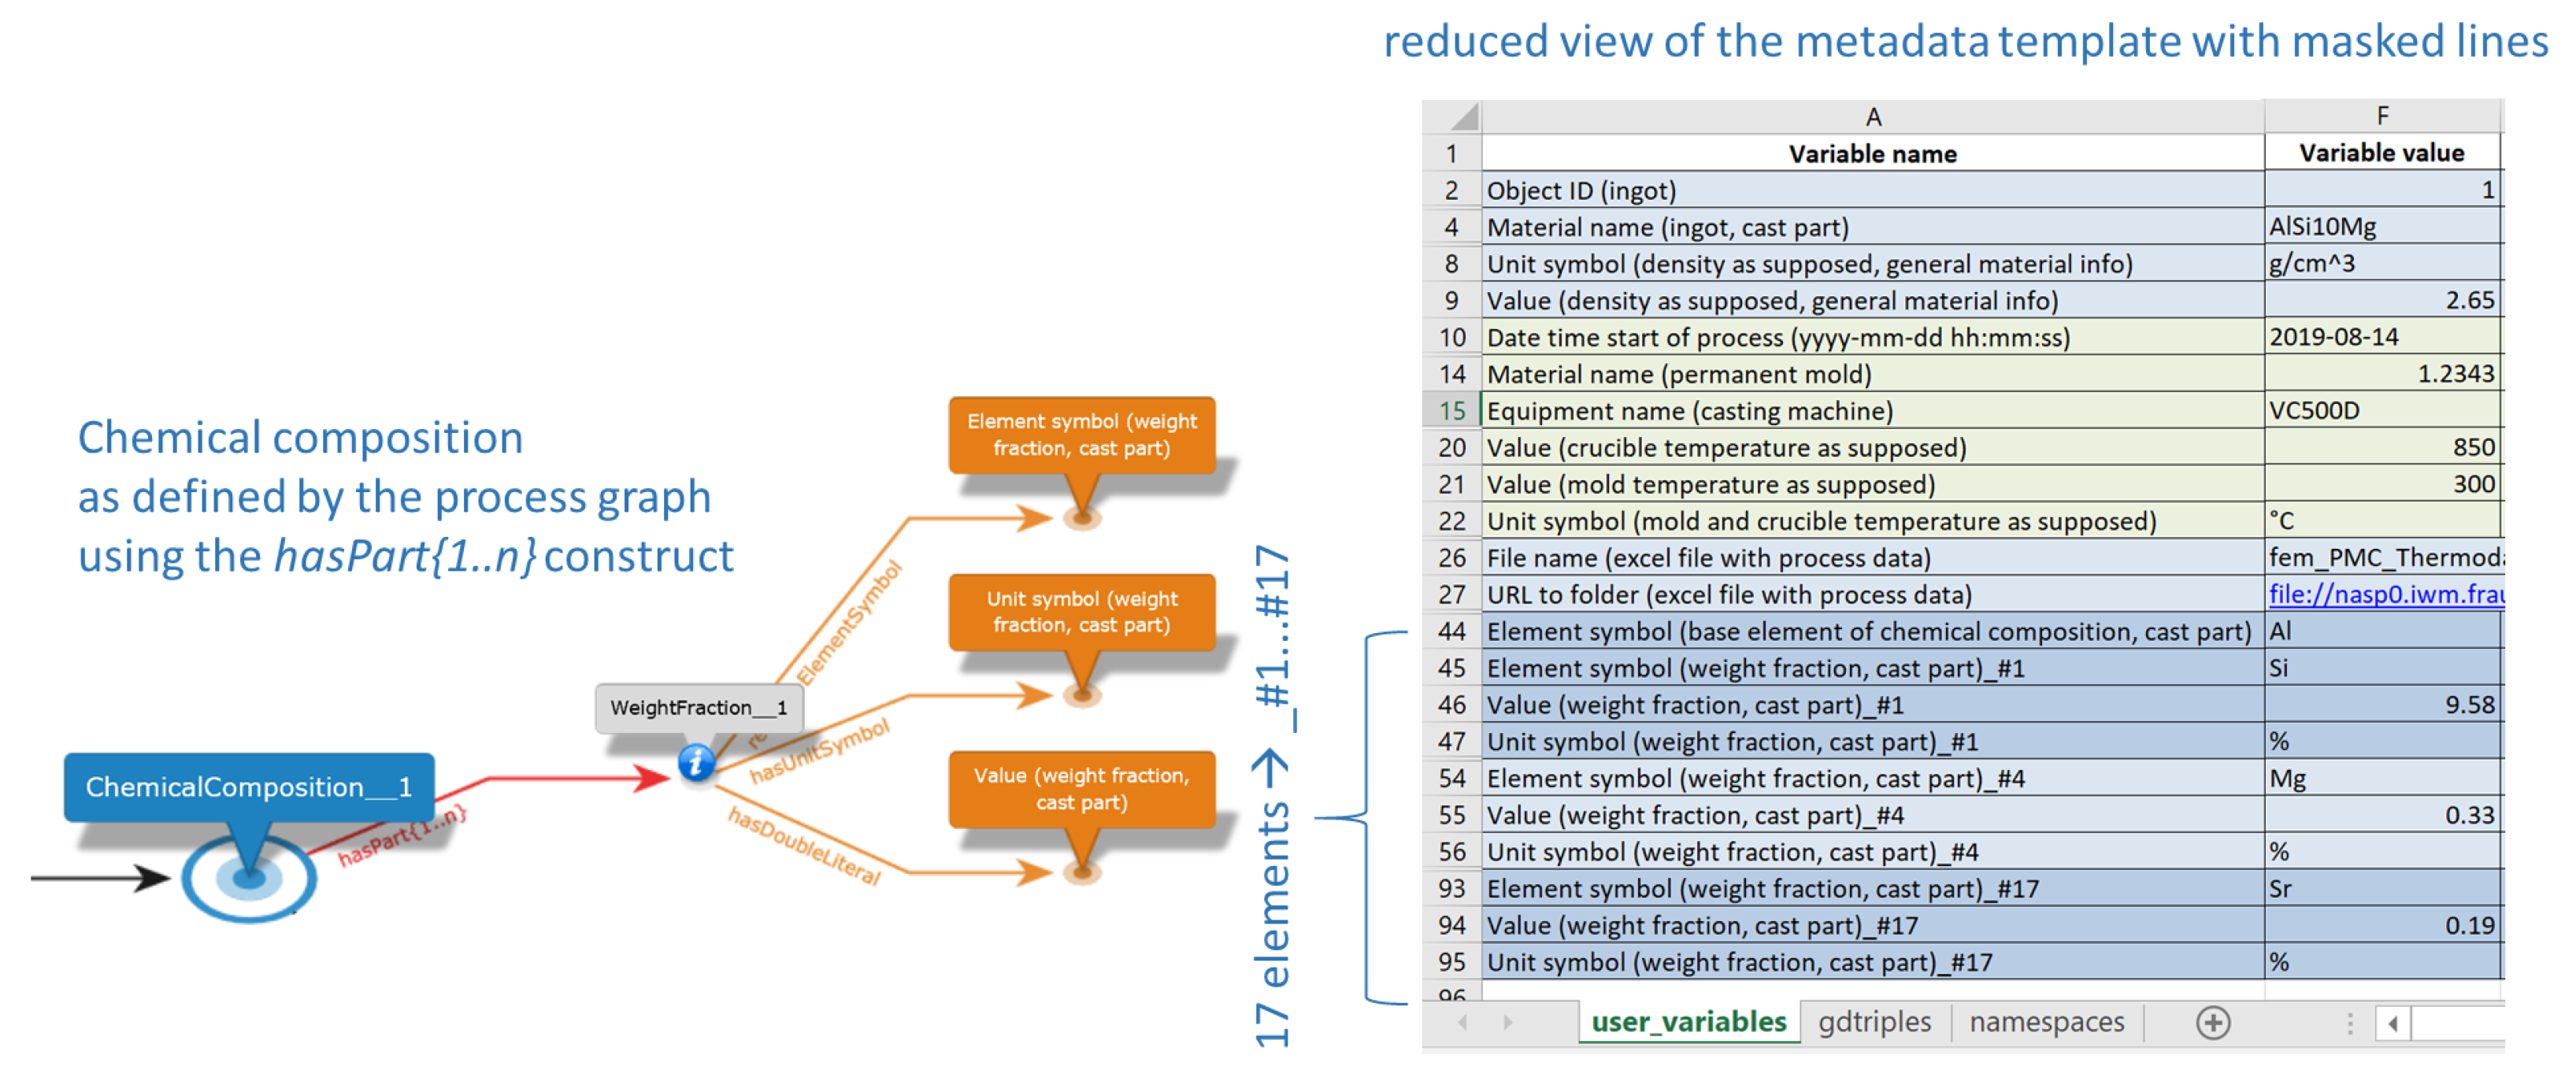
Figure 8.
Description of the assignment of an ID and chemical composition to a cast part.
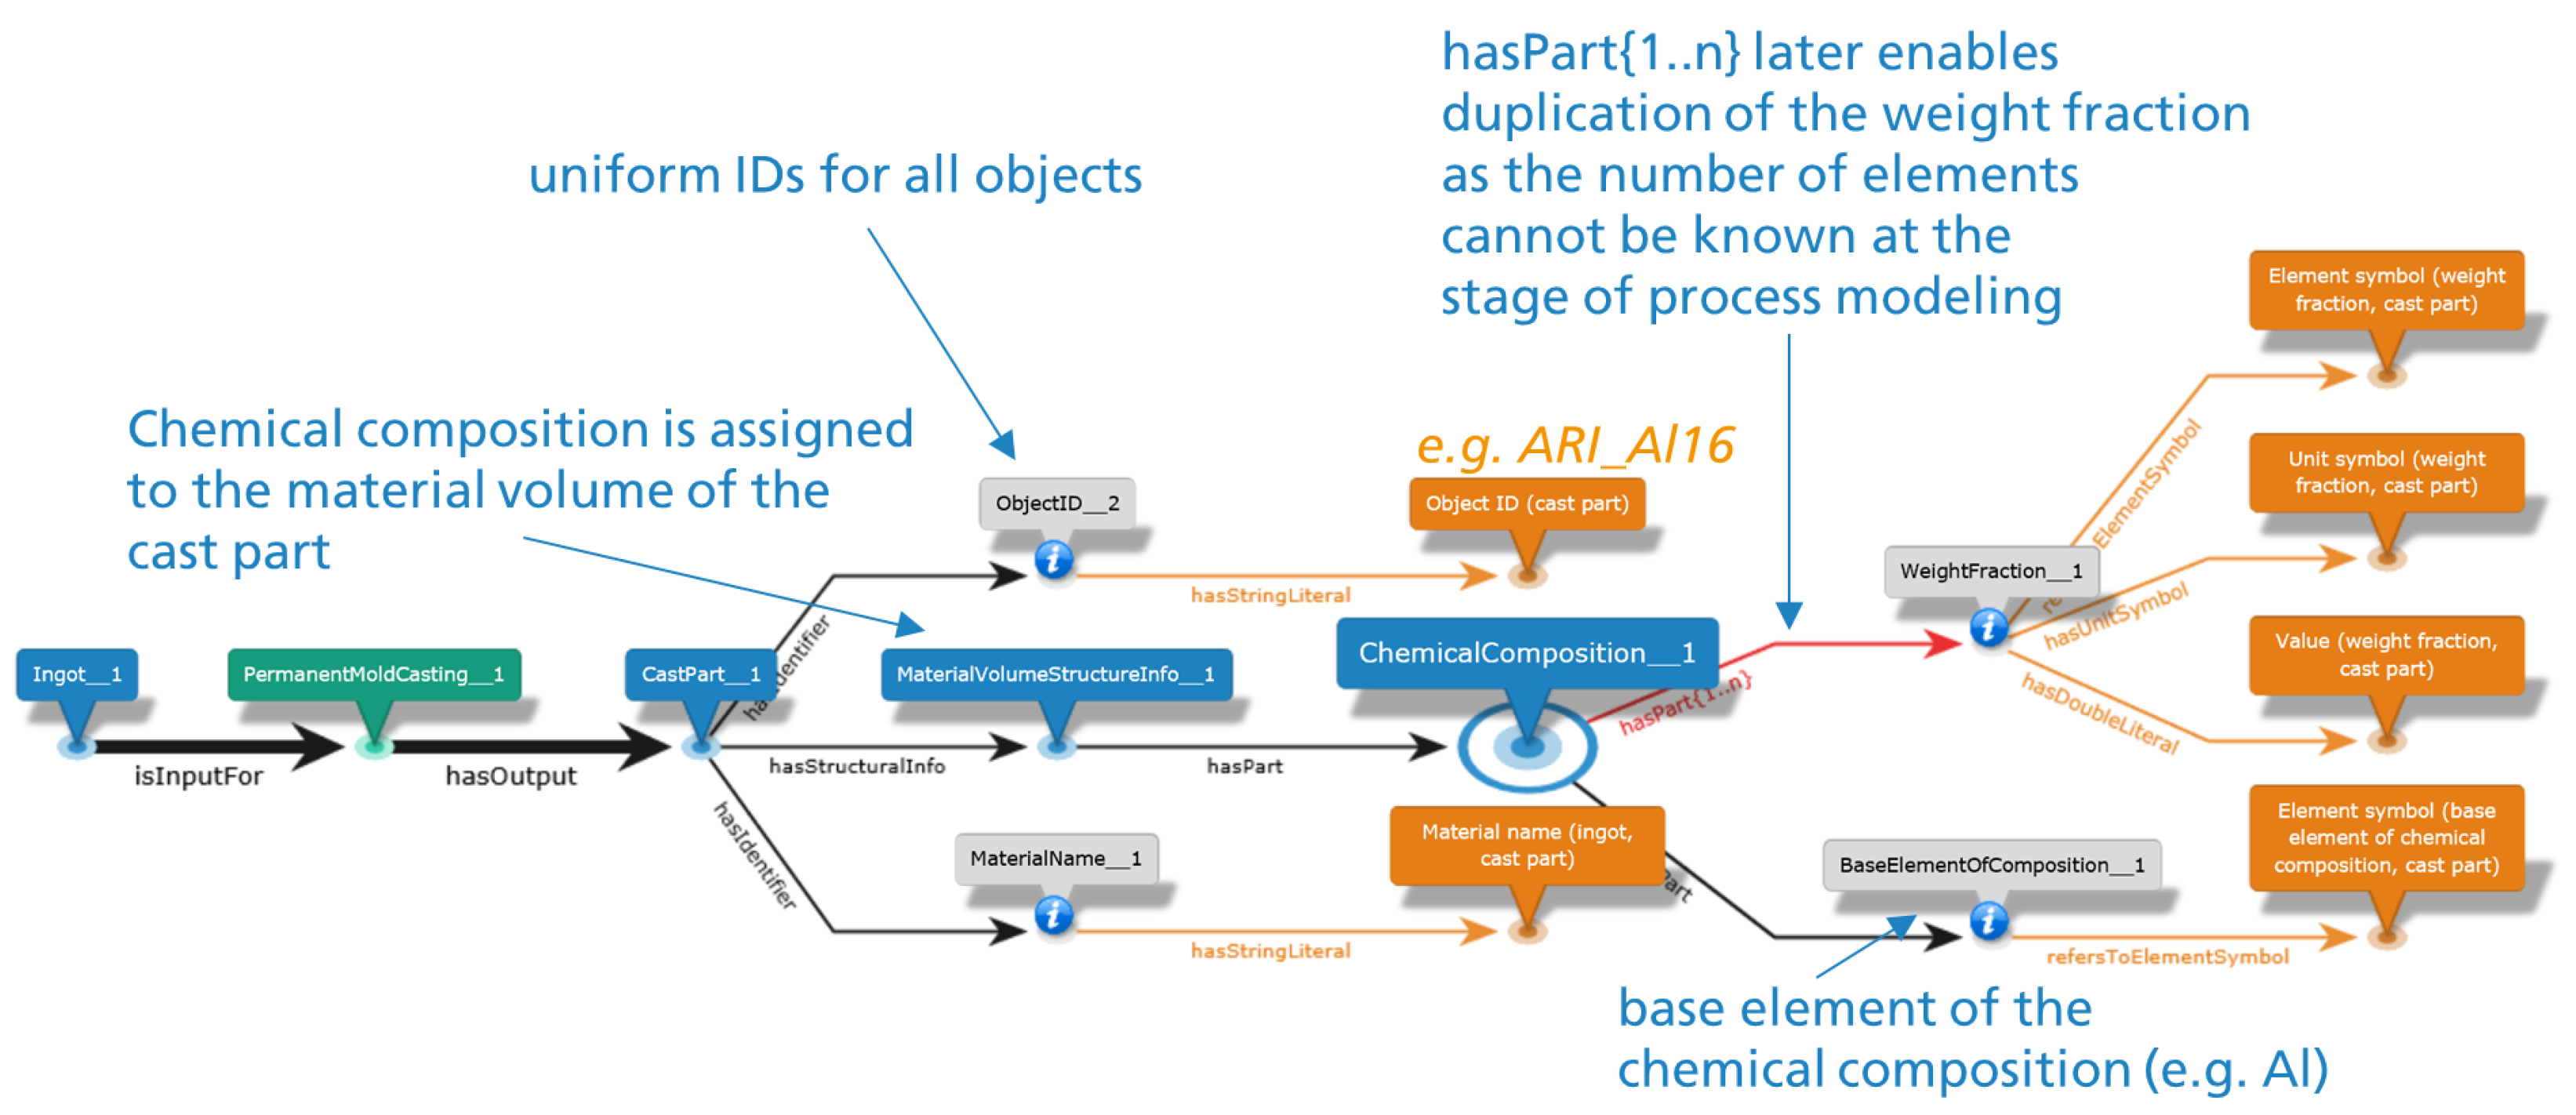
Figure 9.
Description of process parameters and handling of physical quantities and unit symbols.
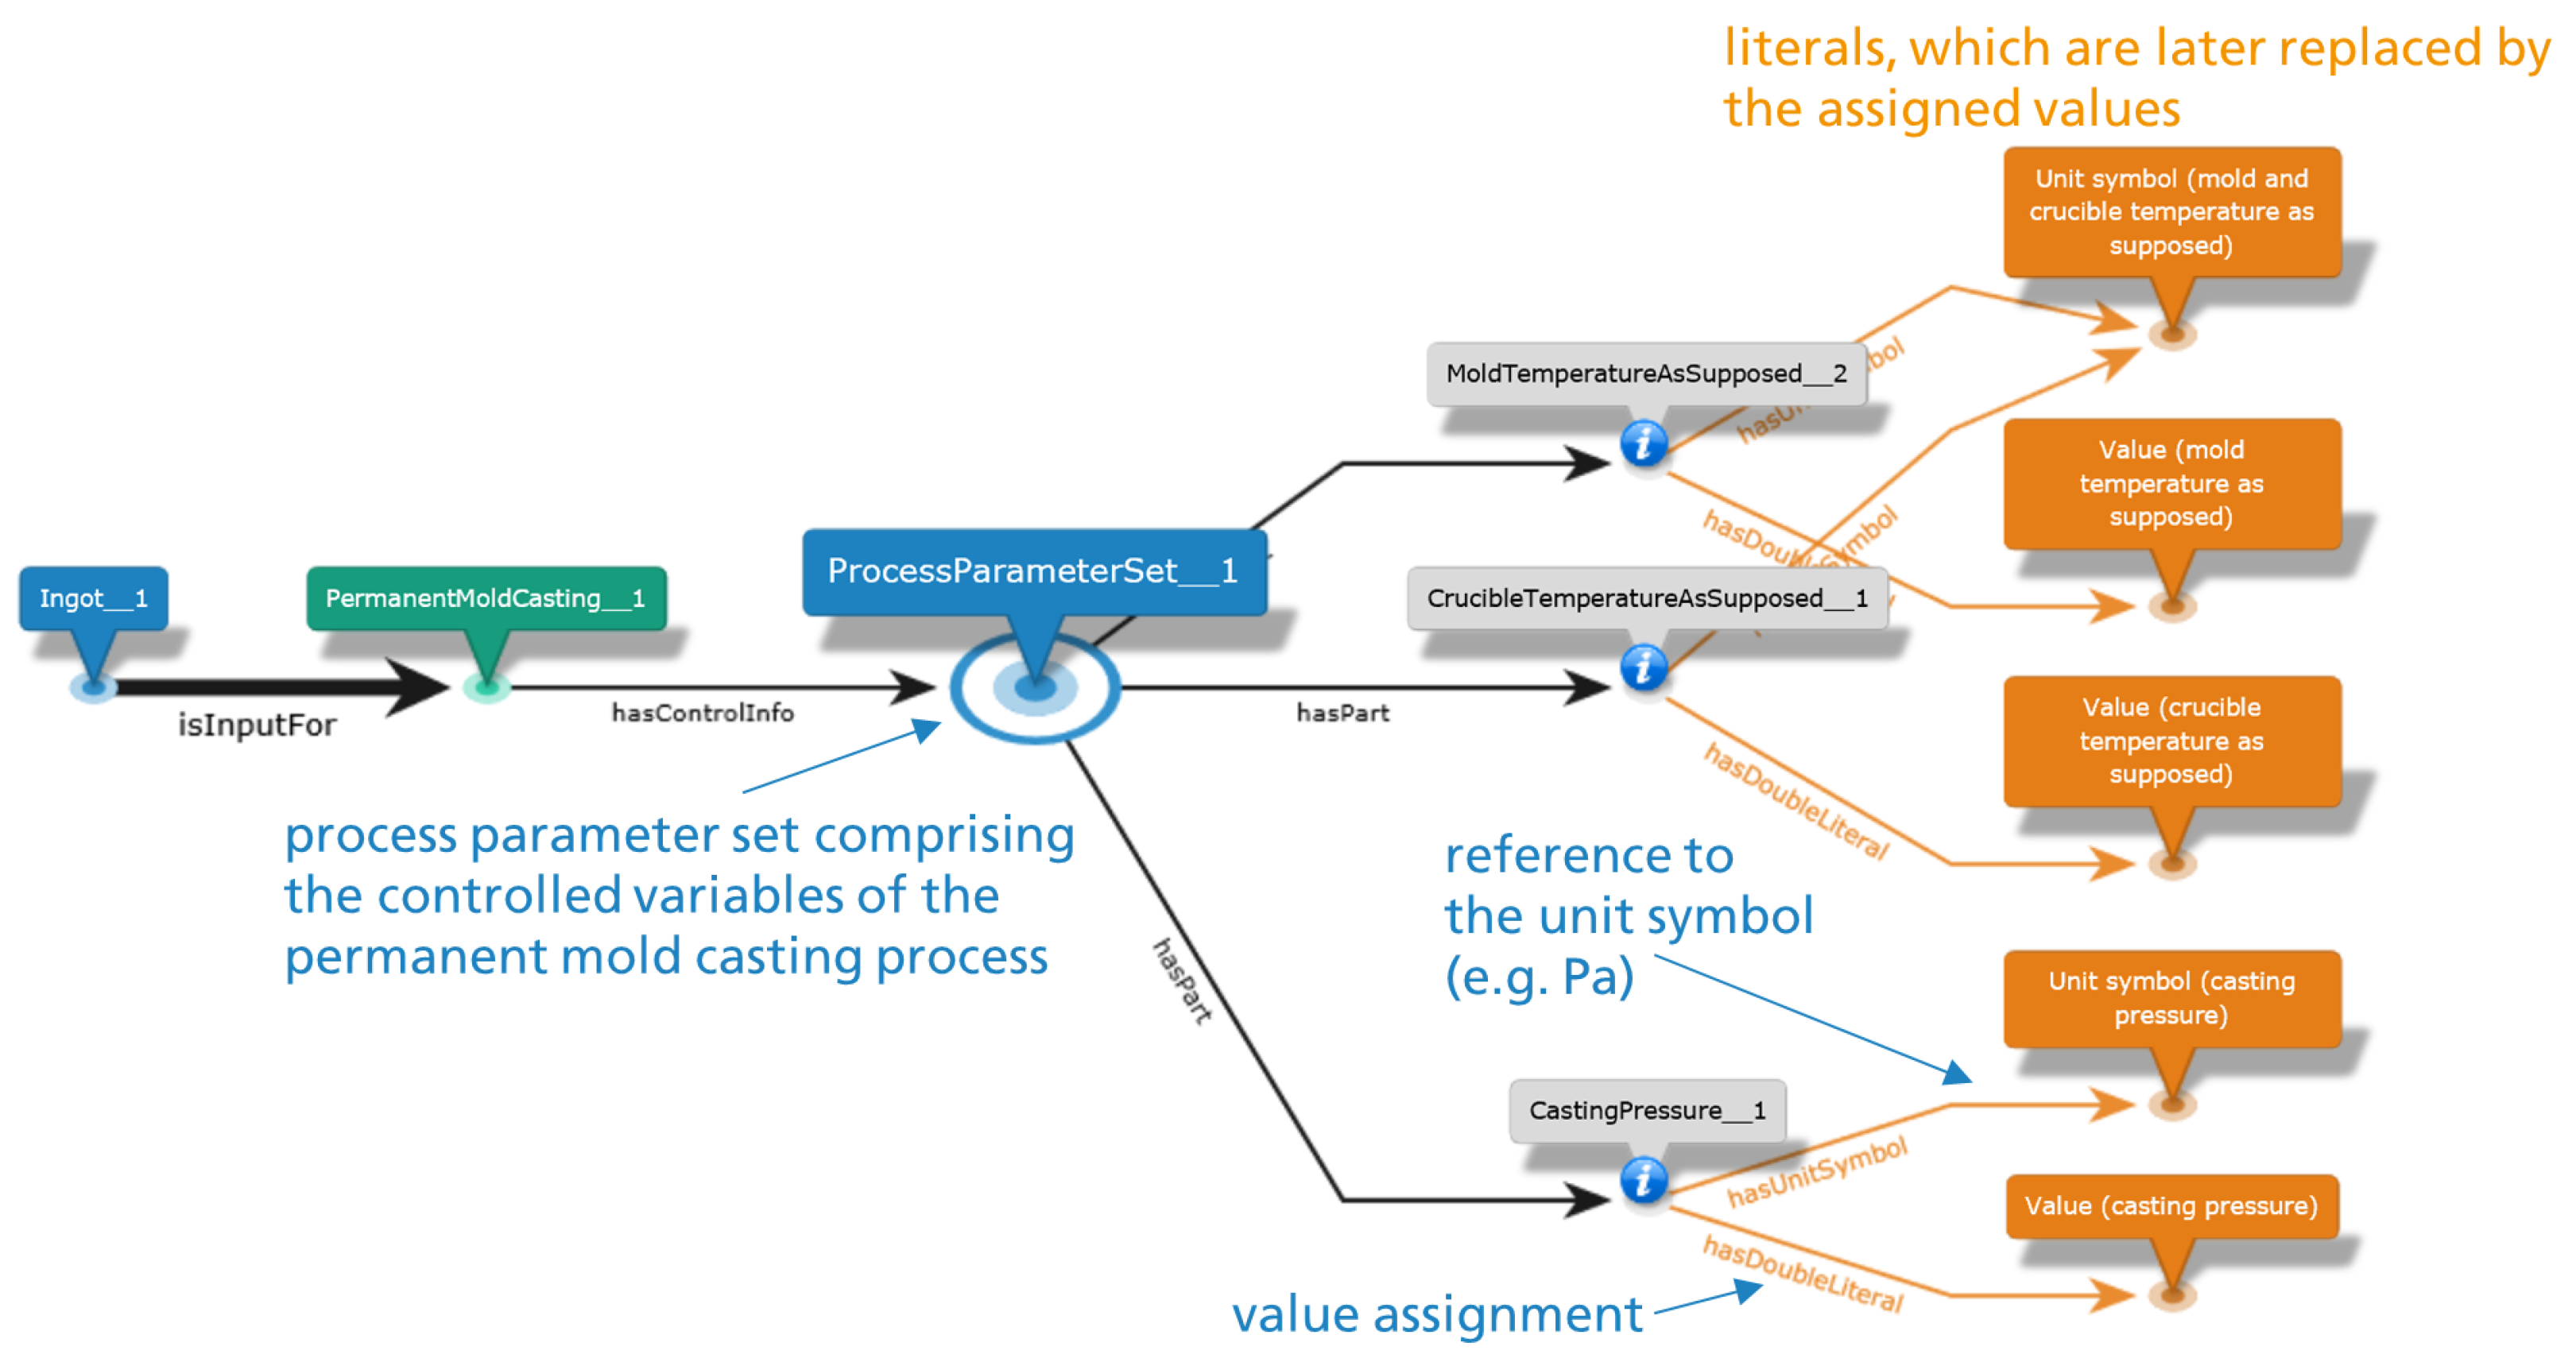
Figure 10.
Visualization of the complete knowledge graph.
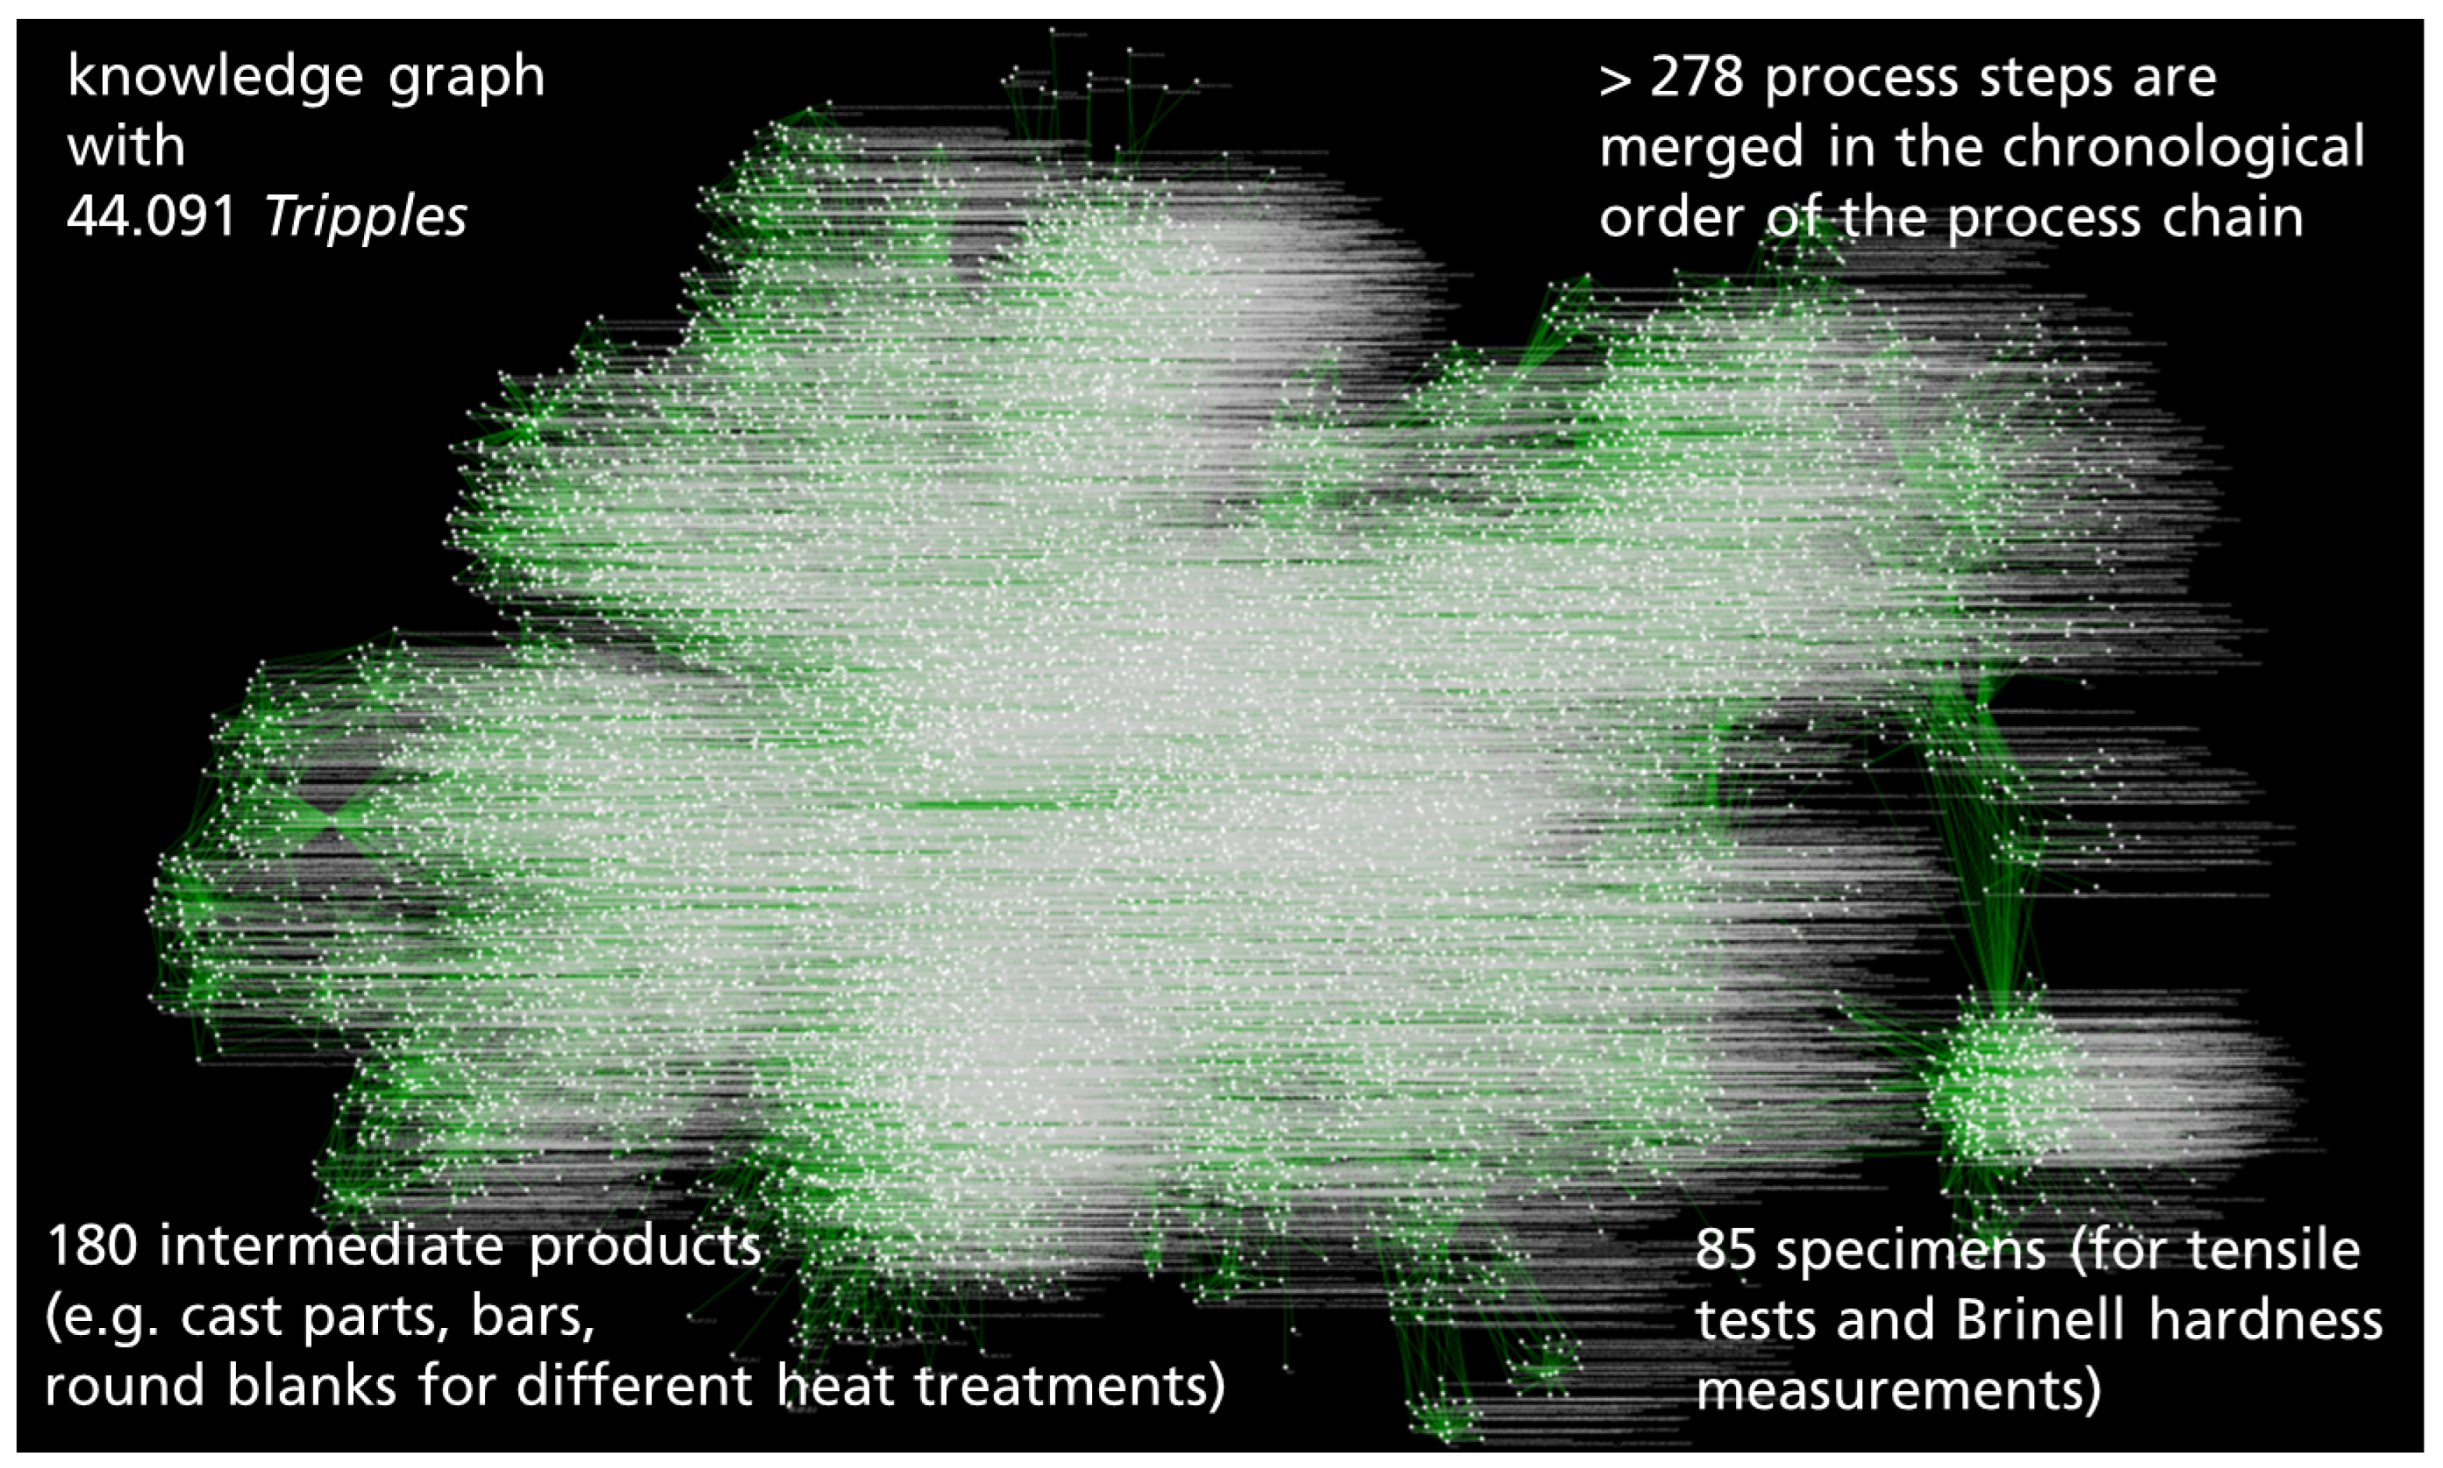
Figure 11.
Visualization of Brinell hardness SPARQL query algorithm.
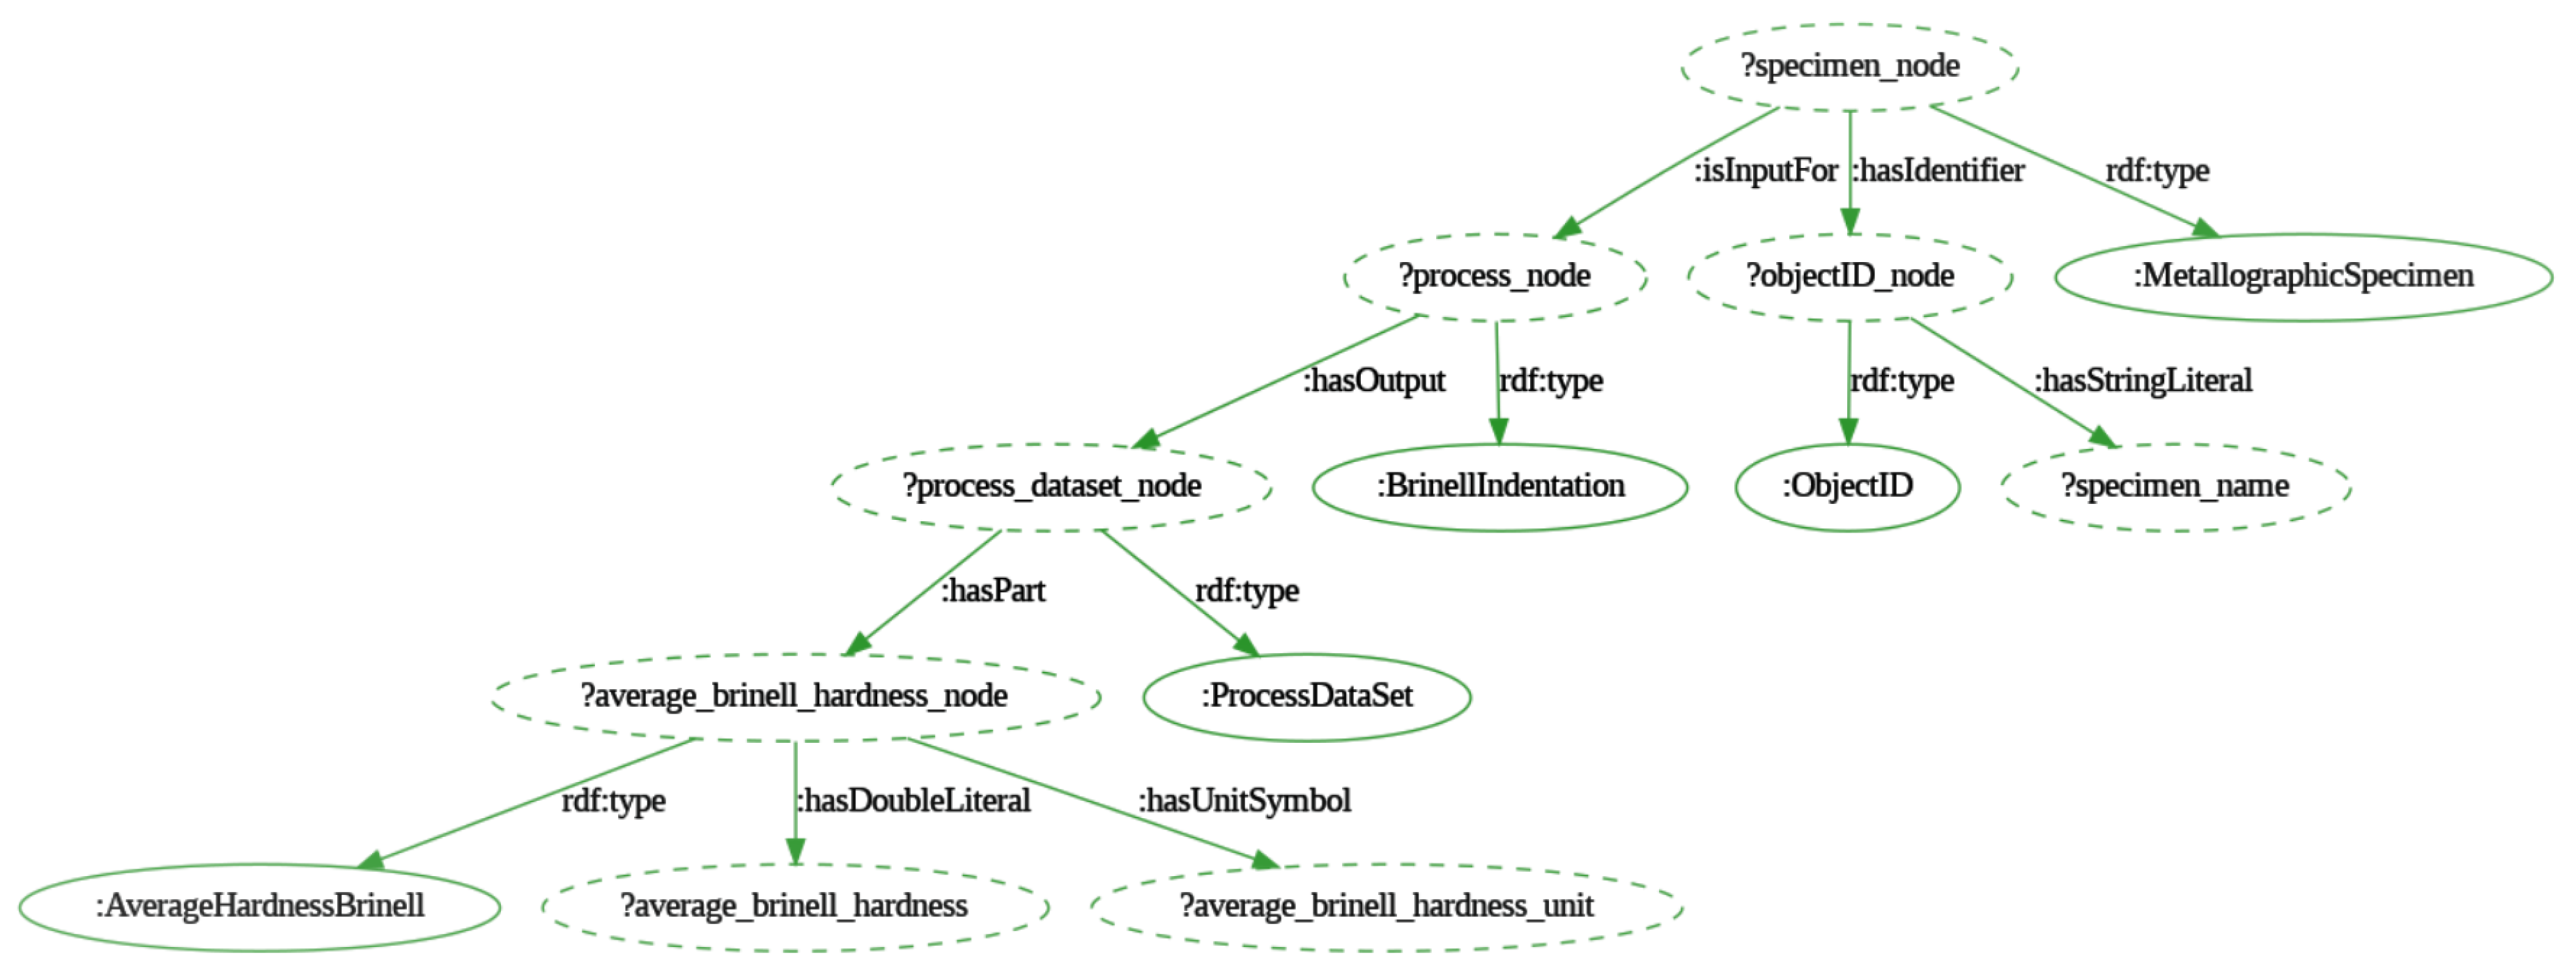
Figure 12.
Visualization of the SPARQL query algorithm the process control parameters corresponding to one specific object identifier.
Figure 12.
Visualization of the SPARQL query algorithm the process control parameters corresponding to one specific object identifier.
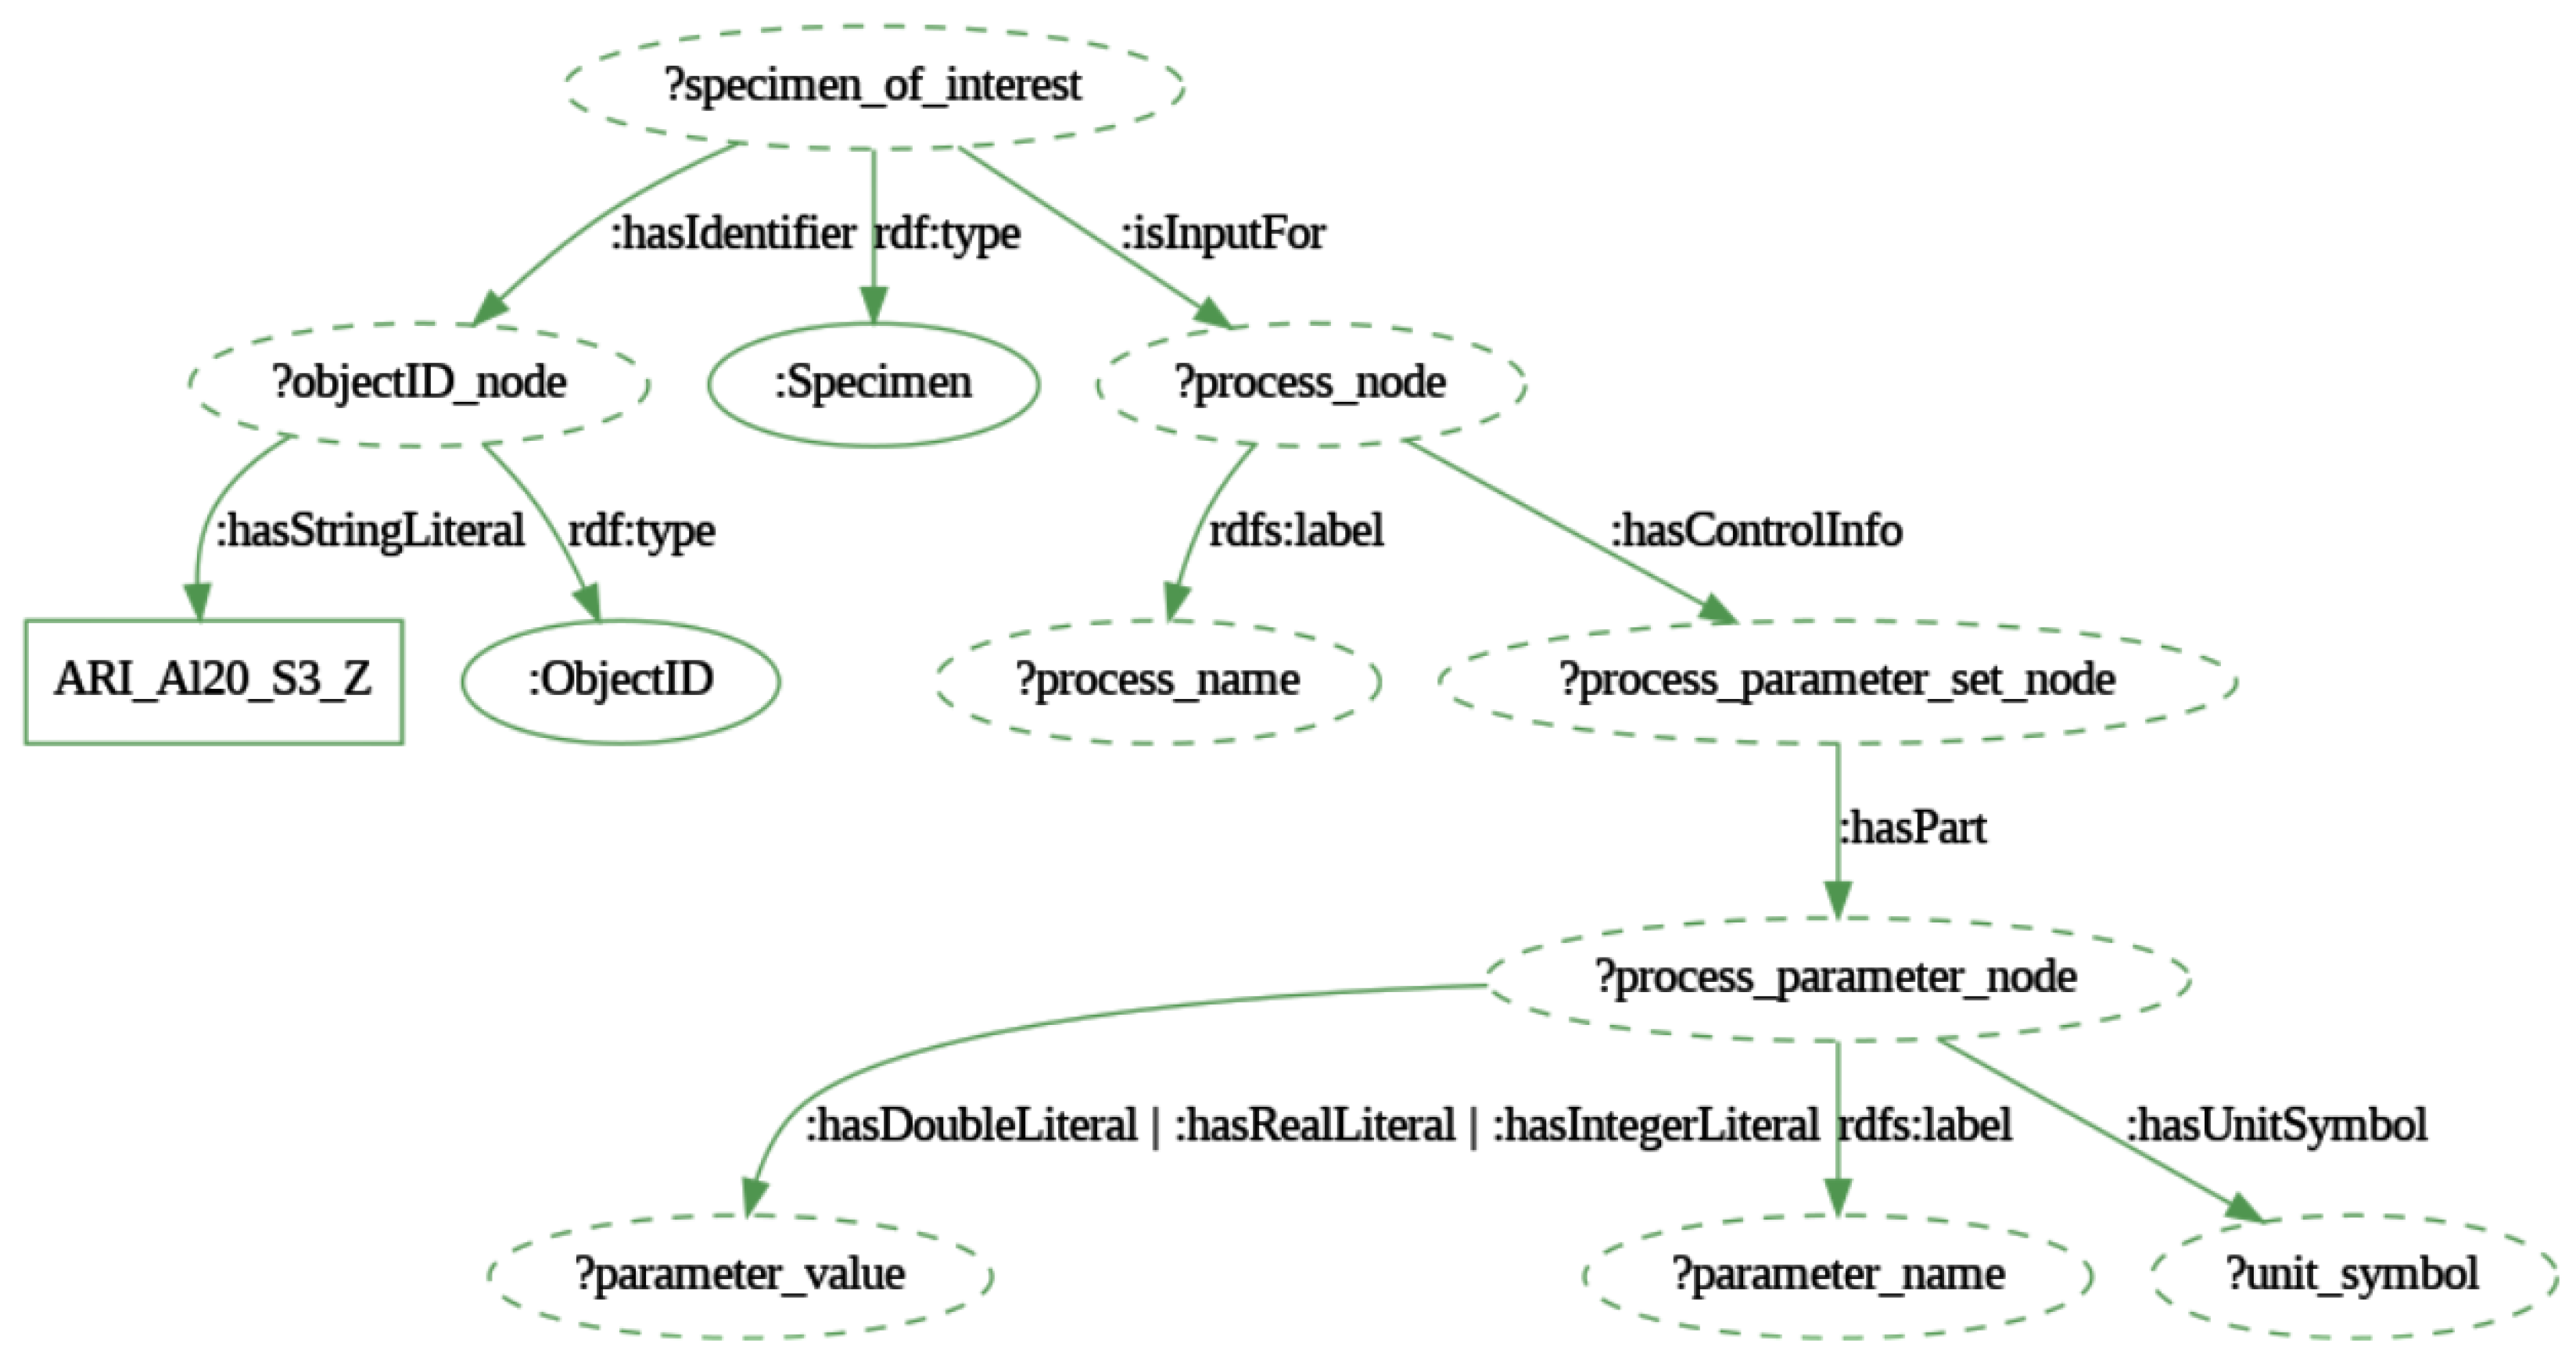
Figure 13.
Visualization of the process chain for the object ARI_Al6 with the help of the GraphDB software frontend for graph visualization [32].
Figure 13.
Visualization of the process chain for the object ARI_Al6 with the help of the GraphDB software frontend for graph visualization [32].
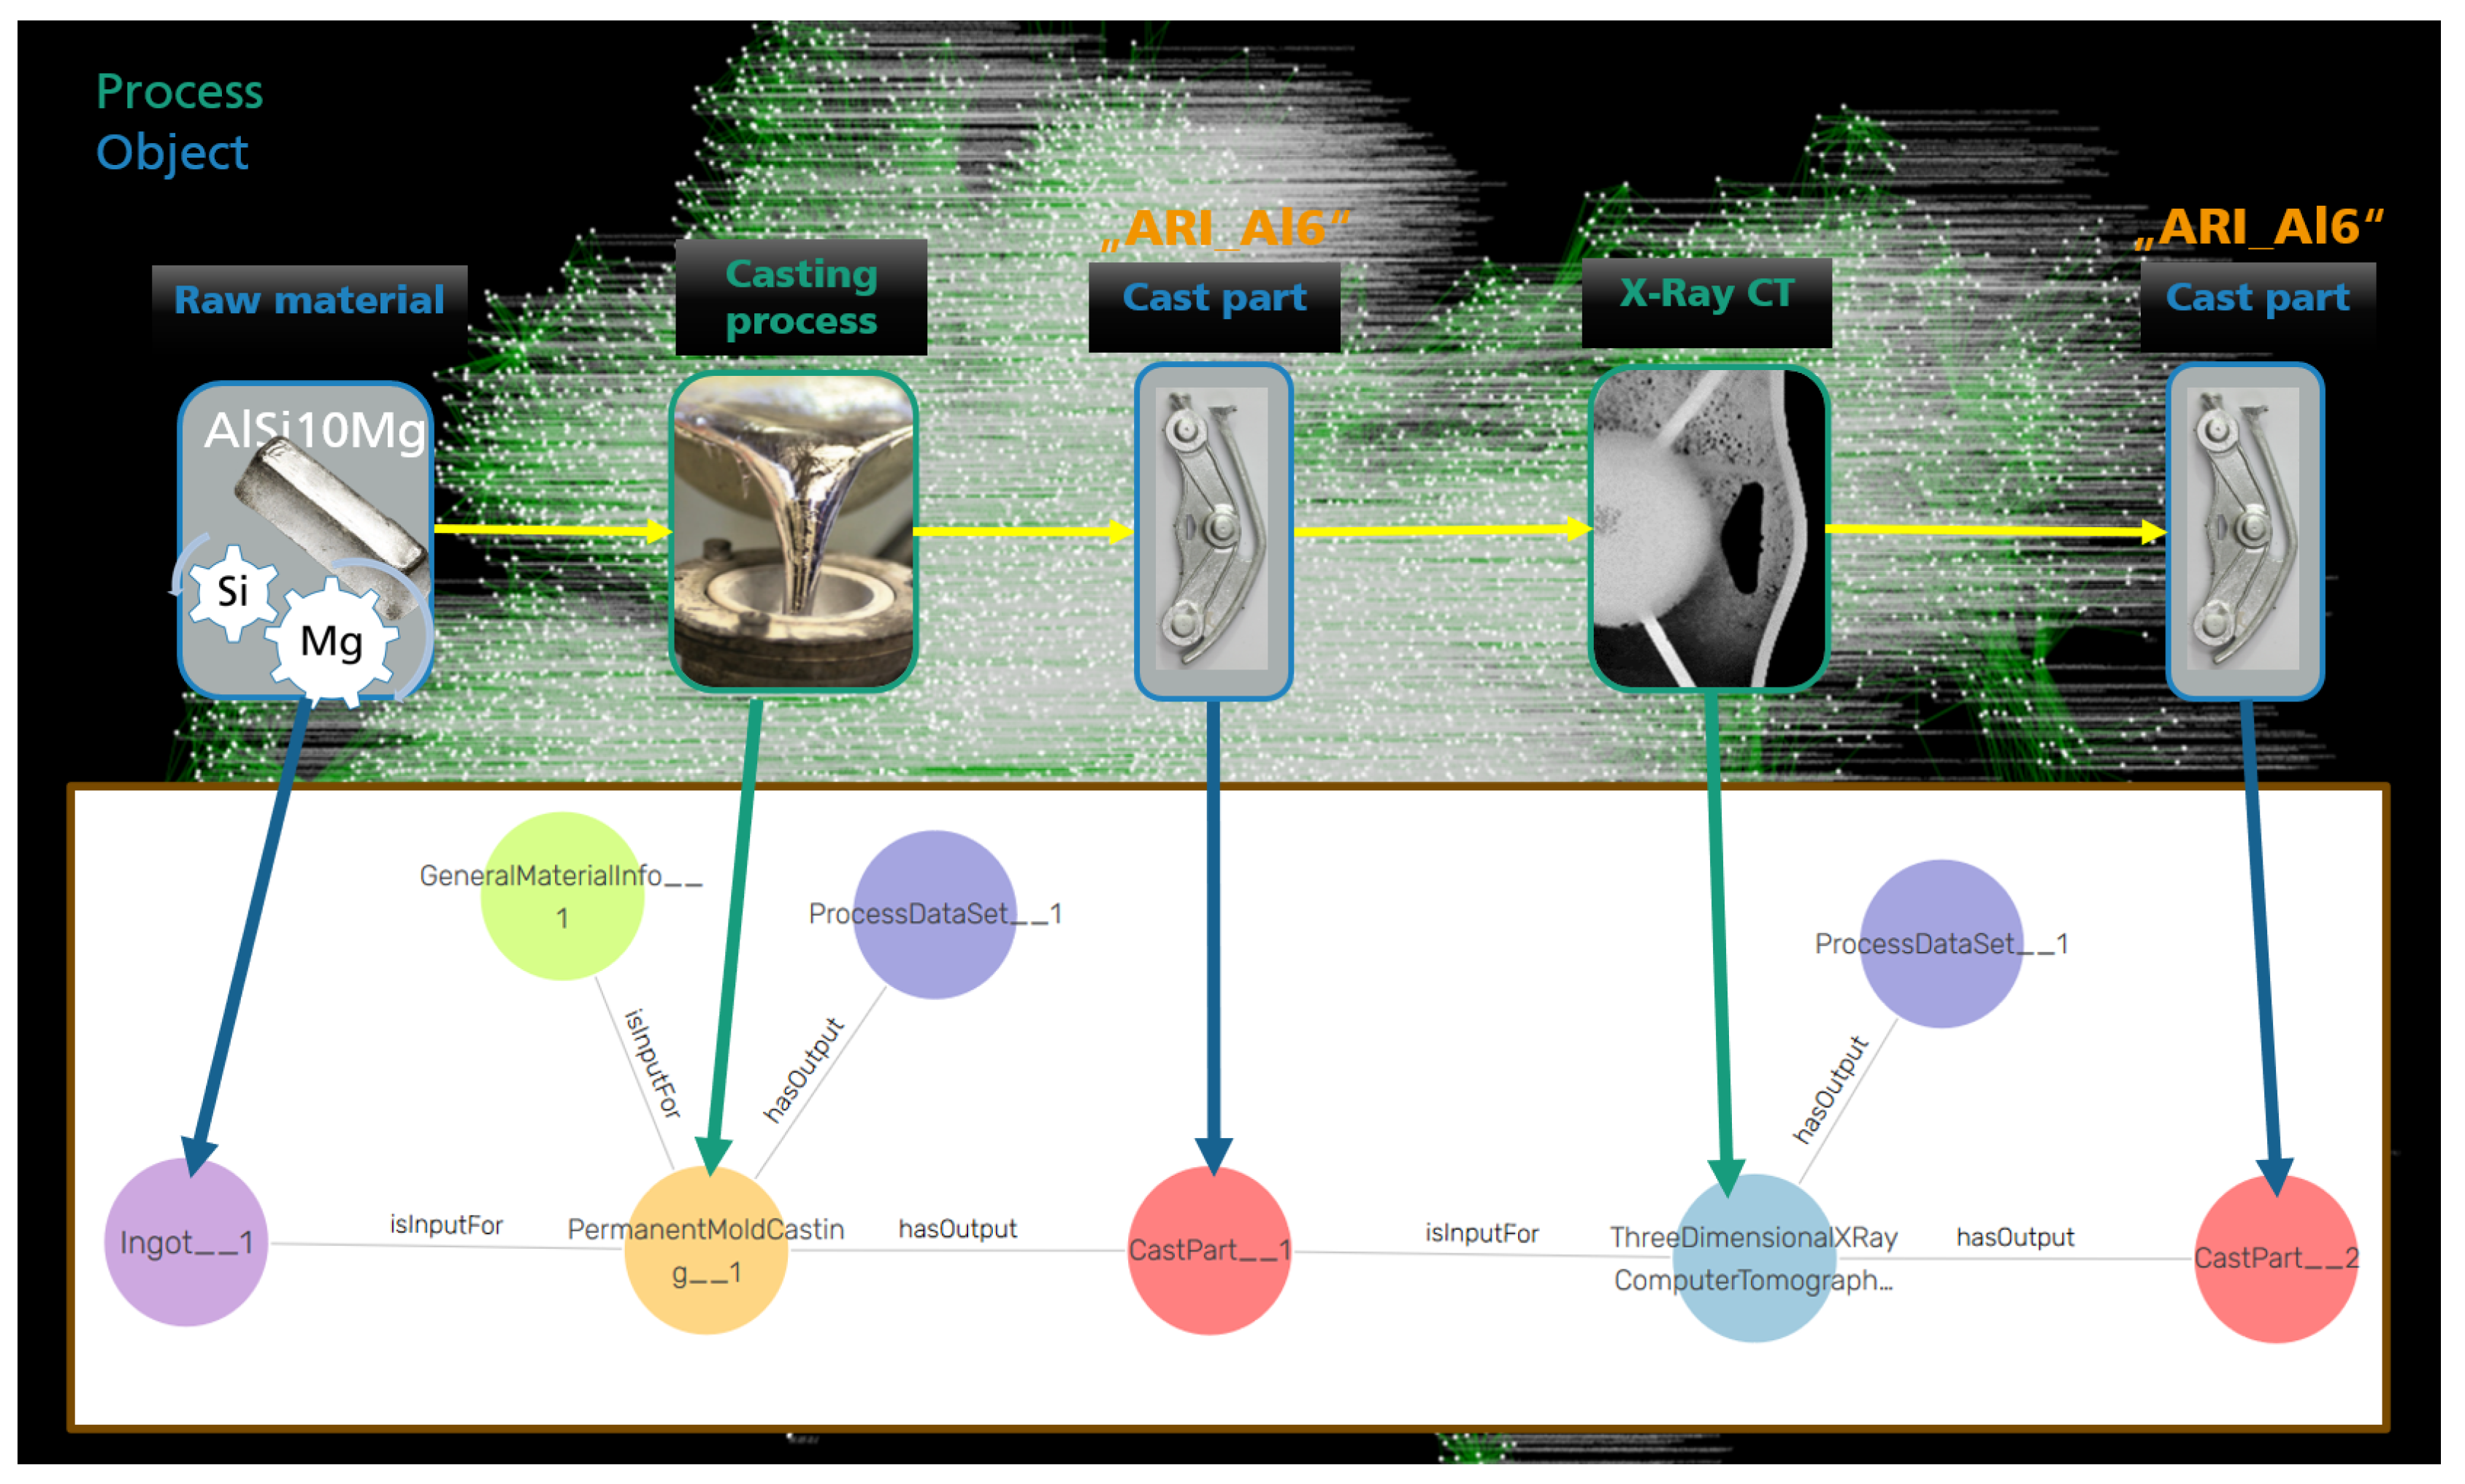
Figure 14.
Using a decision tree to predict the tensile strength of the cast AlSi10Mg based on process chain graph data.
Figure 14.
Using a decision tree to predict the tensile strength of the cast AlSi10Mg based on process chain graph data.
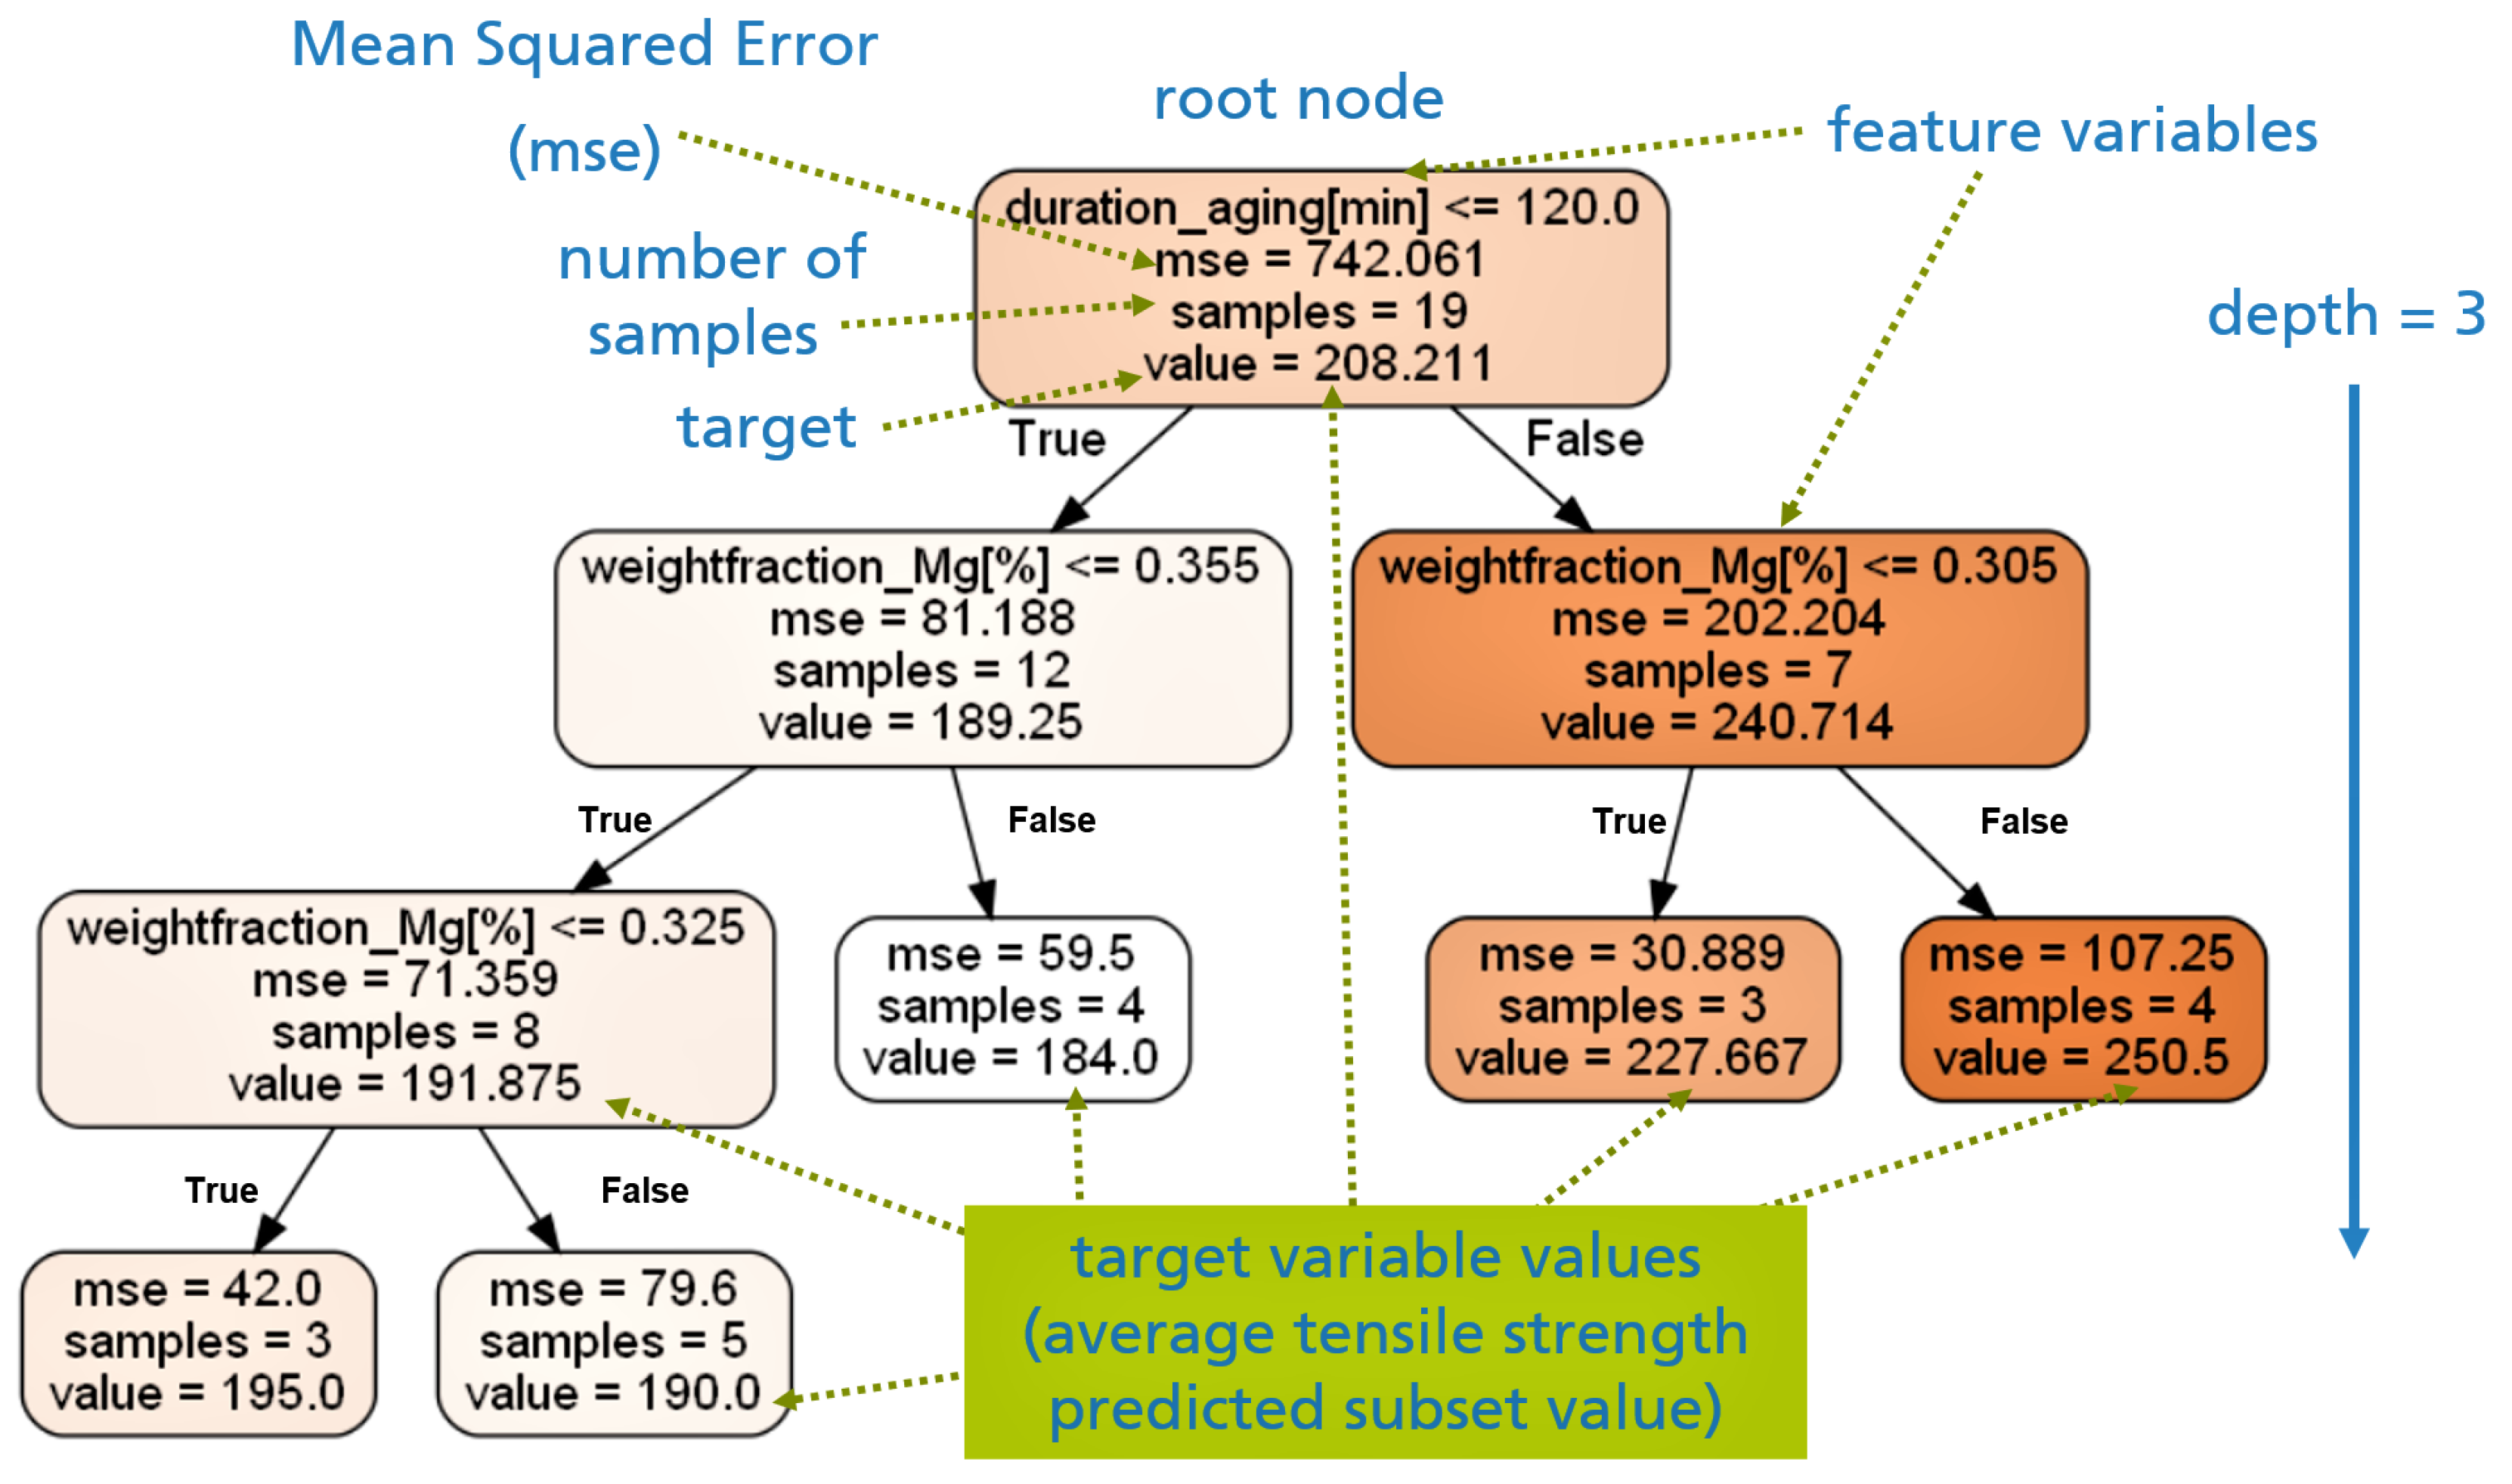
Figure 15.
Validation of the trained DecisionTreeRegressor model with a correlation coefficient of 0.95 and a relative standard error (RSE) of the slope equal to 15.36 %.
Figure 15.
Validation of the trained DecisionTreeRegressor model with a correlation coefficient of 0.95 and a relative standard error (RSE) of the slope equal to 15.36 %.
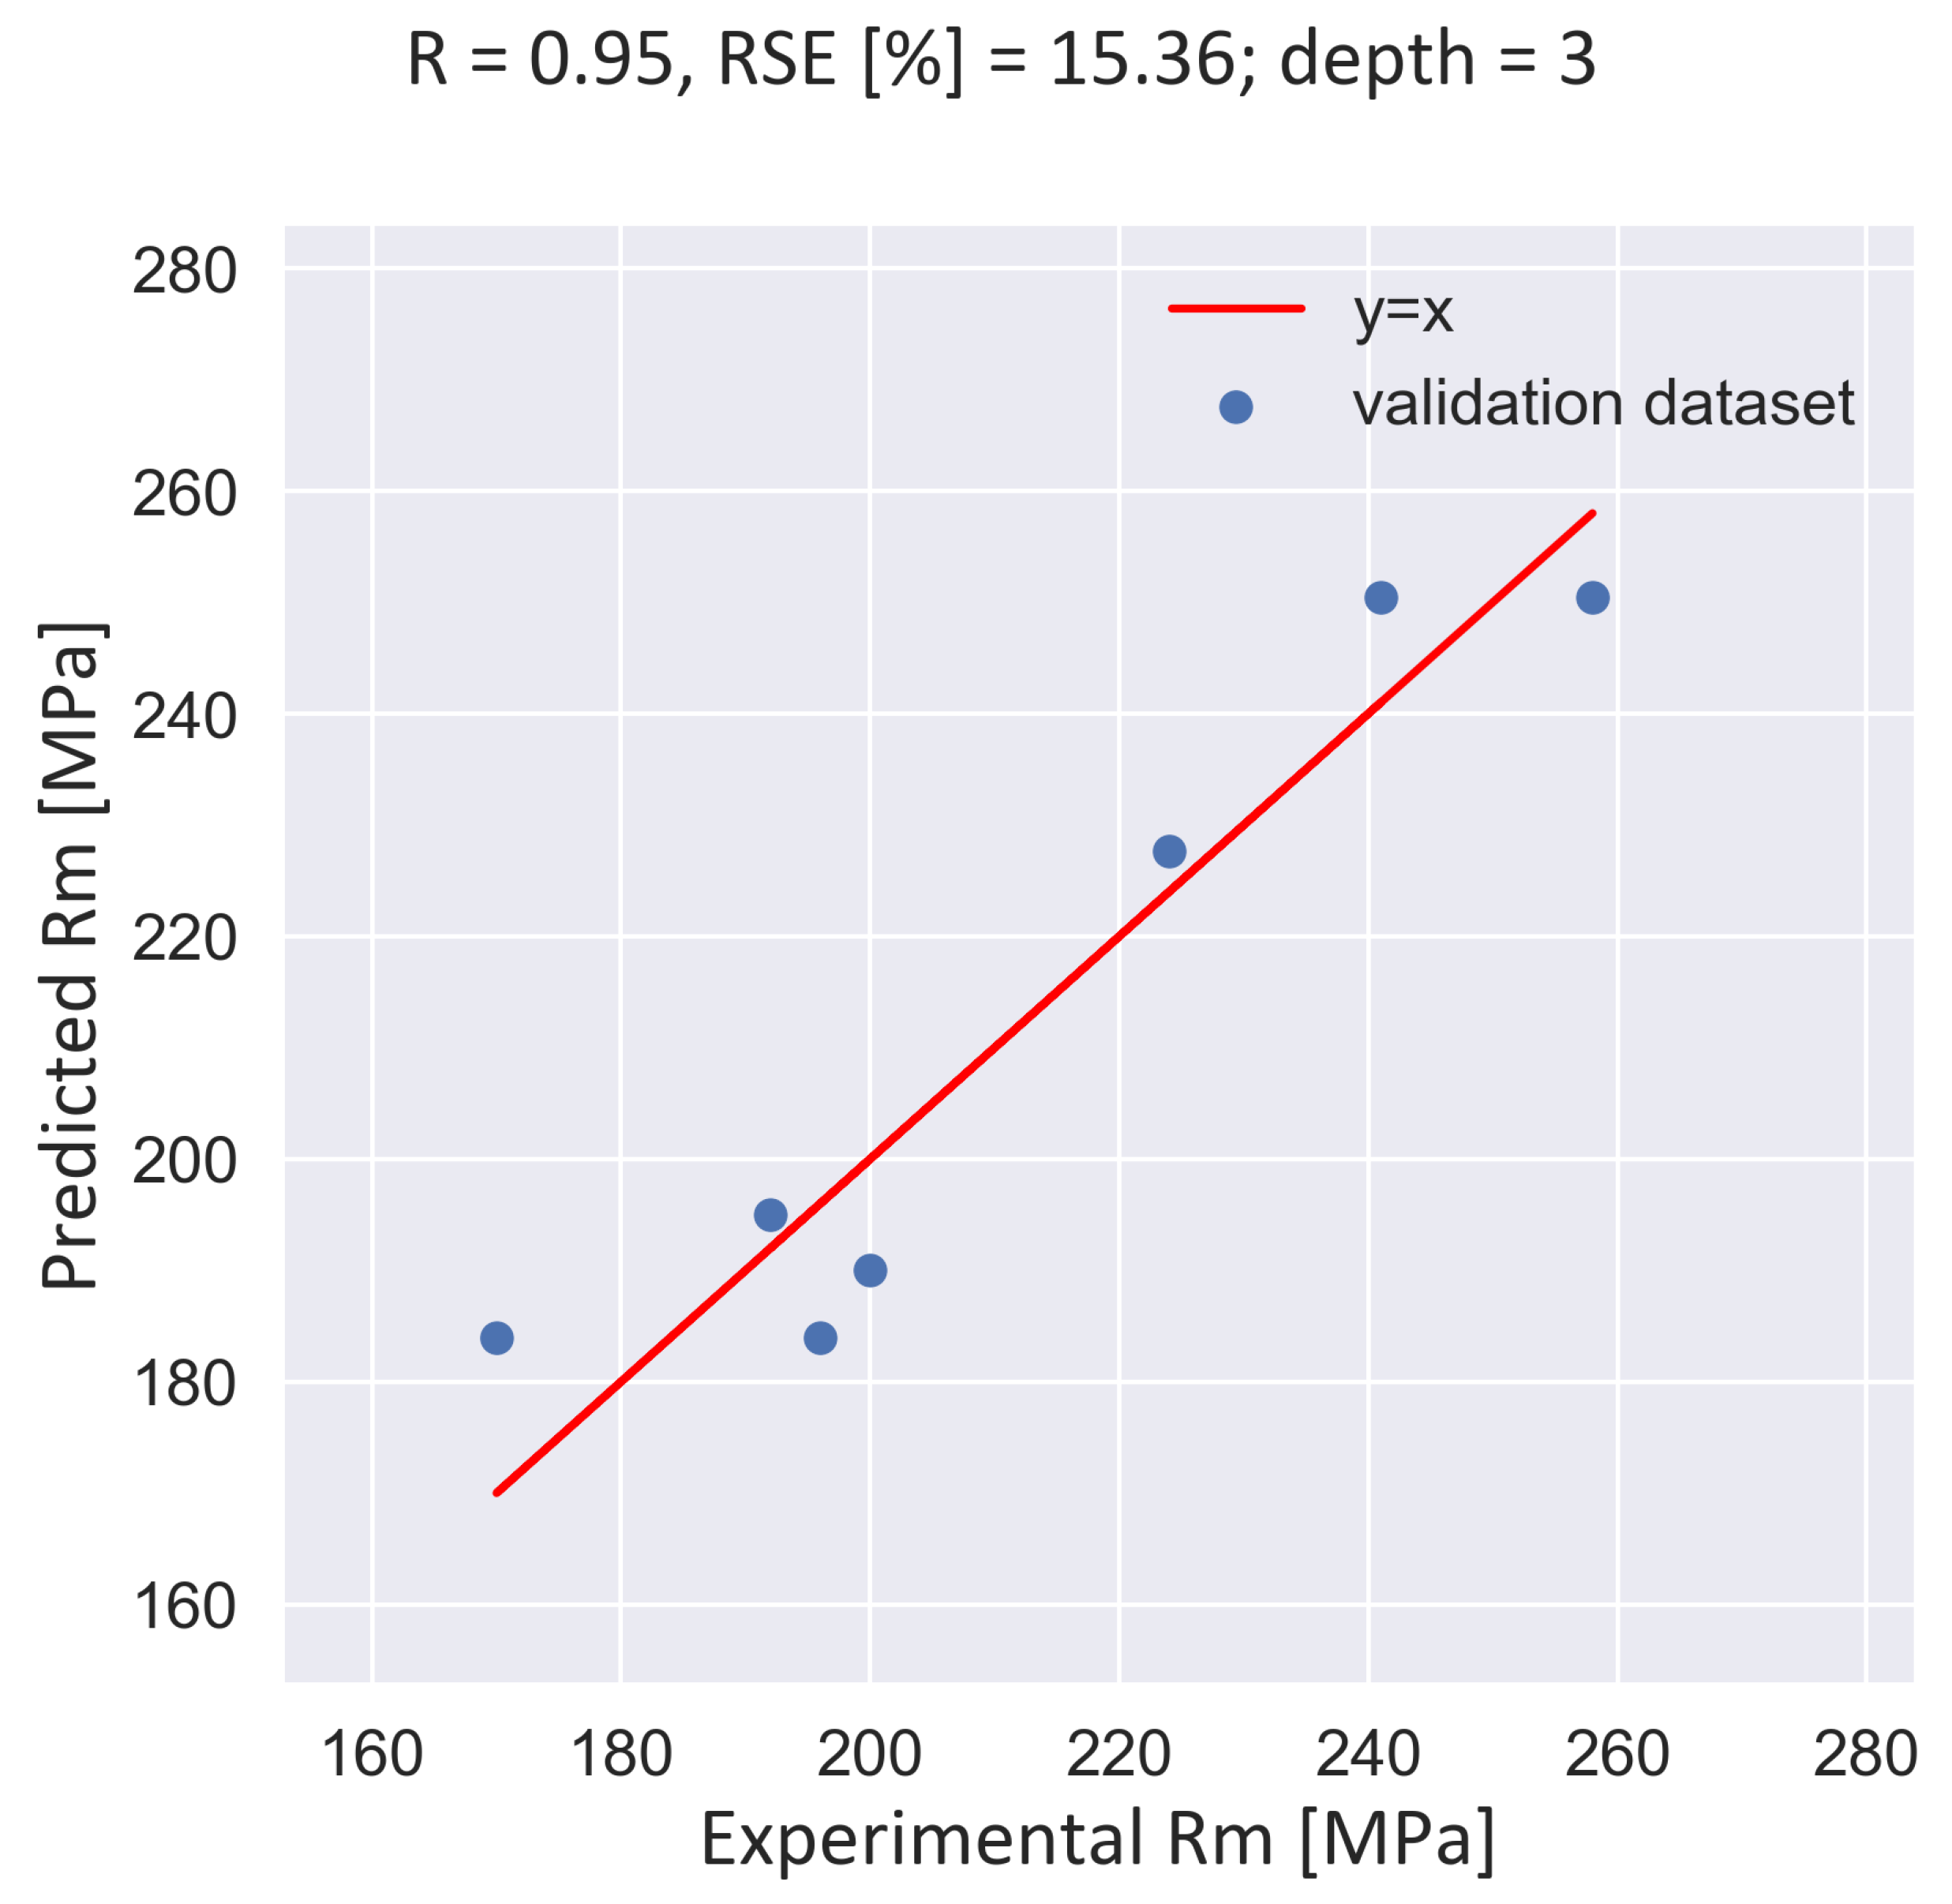

Table 1.
List of digitalized processes and corresponding BWMD Ontology class in the BWMD dataset.
| Process | Category |
|---|---|
| permanent mold casting | bwmd:PermanentMoldCasting |
| 3D X-ray computer tomography | bwmd:ThreeDimensionalXRayComputerTomography |
| wire eroding | bwmd:WireEroding |
| turning | bwmd:Turning |
| separating | bwmd:Separating |
| solution annealing | bwmd:SolutionAnnealing |
| artificial aging | bwmd:ArtificialAging |
| tensile test | bwmd:QuasiStaticTensileTest |
| Brinell indentation | bwmd:BrinellIndentation |
| casting simulation | bwmd:CastingSimulation |
Table 2.
First five matches retrieved by the Brinell hardness SPARQL query.
| specimen_name | average_brinell_hardness | average_brinell_hardness_unit |
|---|---|---|
| ARI_Al19_Stab4_R2 | 87.8 | HB 2.5/62.5 |
| ARI_Al16_S4_R1 | 65.6 | HB 2.5/62.5 |
| ARI_Al26_Stab16_R1 | 63.7 | HB 2.5/62.5 |
| ARI_Al22_Stab8_R9 | 68.2 | HB 2.5/62.5 |
| ARI_Al22_Stab8_R4 | 68.2 | HB 2.5/62.5 |
Table 3.
Result of the control process parameters query for the specimen with object identifier ARI_Al20_S3_Z.
Table 3.
Result of the control process parameters query for the specimen with object identifier ARI_Al20_S3_Z.
| process_name | parameter_name | parameter_value | unit_symbol |
|---|---|---|---|
| QuasiStaticTensileTest__1 | CrossheadSeparationRate__1 | 3.0E-2 | mm/s |
| QuasiStaticTensileTest__1 | OriginalGaugeLength__1 | 9.79E+07 | µm |
Table 4.
Level of importance for making predictions.
| Feature variable | Level of importance [%] |
|---|---|
| duration_aging[min] | 91.4 |
| weightfraction_Mg[%] | 8.6 |
| temperature_aging[°C] | 0.0 |
| temperature_annealing[°C] | 0.0 |
| duration_annealing[min] | 0.0 |
Disclaimer/Publisher’s Note: The statements, opinions and data contained in all publications are solely those of the individual author(s) and contributor(s) and not of MDPI and/or the editor(s). MDPI and/or the editor(s) disclaim responsibility for any injury to people or property resulting from any ideas, methods, instructions or products referred to in the content. |
© 2024 by the authors. Licensee MDPI, Basel, Switzerland. This article is an open access article distributed under the terms and conditions of the Creative Commons Attribution (CC BY) license (http://creativecommons.org/licenses/by/4.0/).
Copyright: This open access article is published under a Creative Commons CC BY 4.0 license, which permit the free download, distribution, and reuse, provided that the author and preprint are cited in any reuse.


