Submitted:
13 November 2024
Posted:
13 November 2024
You are already at the latest version
Abstract
The ability to vote is one of the most valuable rights and privileges afforded by the Constitution of the United States to its citizens. For many, voting is not just a civic duty; it is also a choice, e.g., a way to have a voice regarding issues that affect them and that they care about. Even before the inception of restrictive voter identification laws, civil and voting rights groups have expressed concerns over the impact some laws may have on specific sections of the electorate and consequently, how they influence voter turnout. Indeed, the research on voter participation or suppression is very active. Voting is crucial to our democracy, and any changes to it may affect the efficiency of the democratic process. The bigger question is whether voters behave rationally by engaging in a cost-benefit calculus in deciding whether or not to vote. Using data science, this paper will examine the probability of voting and investigate its impact via cost and benefit among other variables using the 2020 American National Election Studies (ANES) dataset. In addition, the study will also assess the impact voter perceptions of “a sense of duty” on voter turnout. Empirical work provides additional evidence that feelings of civic duty truly do motivate voter turnout (Galais et al. 2016).
Anthony Downs (1957), in his text “An Economic Theory of Democracy,” outlined a theoretical framework from an economic-based approach for voting behavior. Commonly known as the rational choice theory, he discussed similarities of the functions between consumers and voters and between business and political parties while maximizing a utility function. The goal of corporations is to improve their financial gain significantly. The utility for voting shows a lot more complexity and heterogeneity. One can posit that voters endeavor to increase the utility of their vote by maximizing electoral benefits acquired from political propositions (Antunes 2010, p. 157). Such actions have the potential to foster apathy toward political participation, including voting. Using the latest statistical analyses methods, we identify and understand the factors that benefited and hindered voting in the ANES 2020 data and the impact of voter benefits and costs on turnout.
Keywords:
Voting
; Choice or duty probability
; Cost
; Benefit
1. Introduction
In the realm of voter participation, understanding the complexity of voter behavior is crucial for predicting election outcomes. The rational choice model has long been a cornerstone in explaining how individuals make decisions based on maximizing their utility. However, in the context of voting behavior, this traditional model has been modified to incorporate a crucial element—the duty variable. This empirical paper models the modified rational choice model of voting, shedding light on how the sense of duty influences voter decision-making processes. By exploring the interplay between the Downs (1957) rational choice theory and the duty variable (Riker and Ordeshook 1968), this study seeks to explain the process that people undergo in deciding whether or not to vote. The rational choice model can be expanded to integrate a sense of civic duty toward voting, serving as both a constraint and an incentive for voter turnout (Goldfarb et al. 2010). According to the Down’s model, citizens use a simple calculation in the voting decision-making process: if the benefits of voting exceed the cost of voting, they vote; otherwise, they do not. Baron (2012) examined voting as a duty concept. Individuals are more likely to push or press a close partner or friend to vote if they have a political preference, since increasing involvement from like-minded persons is thought to result in greater expected advantages. This idea is consistent with group theories of voter turnout, in which the motivation to vote stems from the possibility of accomplishing communal goals through increased group engagement (Feddersen et al. 2006). Research shows that advertising influences voting turnout and mobilizes partisans (Law 2020).
The rational choice model of voting was initially developed by Downs (1957) and further enhanced by Riker and Ordeshook (1968). Under this model, voters estimate the benefit of voting, the probability that their preferred candidate will win, and the opportunity costs of voting (registration, going to the poll, collecting information, etc.). A paper finds that George Floyd’s murder led to a significant increase in voter registration, as thousands of Americans were motivated to engage politically in response to racial injustice (Holbein, John B. et el. 2023).
In large elections—such as the 2020 presidential election—under the rational model, presumed ‘rational voters’ would choose not to vote because, while the cost of voting is modest, the benefit of voting is likely to be smaller because of the very slight chance of any one voter casting the decisive vote. In reality, most people choose to vote in important elections despite the small possibility of casting a decisive vote. This situation is referred to as “the paradox of voting.” Individuals with a higher opportunity cost are less likely to vote (cost effect) (Faravelli et al. 2019). Individuals weigh their interest in election outcomes against the probability that their vote affects the result (Heckelman et al. 2015).
The basic rational choice model does not appear to describe real world voting events. Rather than dismiss the model outright, scholars of voting behavior have opted to amend it in an attempt to provide a more compelling explanation of voter behavior. One amendment is offered by Riker and Ordeshook (1968) who argued that the act of voting provides citizens with a form of psychic satisfaction of “complying with the ethic of voting…, affirming allegiance to the political system…, affirming partisan preference…, [and] affirming one’s efficacy in the political system,” as well as simply experiencing the joy of participating in the election process. Riker and Ordeshook referred to this satisfaction as citizen duty.
In their seminal study on voter turnout, Wolfinger and Rosenstone (1980) examined the effect of various socioeconomic characteristics. Using the 1972 Current Population survey data on 88,105 respondents, they found that education was the most significant predictor of voting followed by age, religiosity, wealth, and marital status. Gelman et al. (2012) studied the probability that a vote will make a difference in the 2008 presidential election. The ideas of costs and benefits were raised. Of the three methods discussed to evaluate the probability of a decisive vote, with simulations of the election, Gelman et al. (2012) stated that the voting power of the 51 states and the probability of decisive votes could be partitioned and predicted based on partisanship, need of electoral college win, state’s national median level, campaign incentives and organizers, and more. Such a perspective calls for a deep learning algorithm. Lee (2021) presented a voting model based on the public choice economic theory. The voting as altruism is also described in Edlin et al. (2007) and further highlighted in Brennan and Freiman (2023). Additionally, long-term studies examining news content and public opinion surveys revealed a connection: regions with limited coverage of congressional races were linked to decreased voter turnout and a decrease in political expertise (Hayes and Lawless, 2015). Addeo et al. (2024) studied the European voter turnout trends at the regional and country levels overtime, using selected statistical regression methods.
Through meticulous analysis, the Schraufnagel (2020) study considered various factors such as voter registration restrictions, absentee voting laws, early voting availability, and other electoral practices. Notably, states like Oregon emerge as leaders in facilitating easier voting processes, while others, like Texas, lag behind due to limited reforms. The research underscores the significant disparities in voting accessibility among states and highlights the importance of ongoing legislative efforts to enhance voter participation. Citizens see voting as a moral obligation to support their country or as a way to protect their own interests, reflecting a larger cultural norm of responsibility and self-defense (Baron 2012). In politics, social values seem to be more important than the old economic left/right division (Facchini et al. 2019). This is voter behavior showing strategic tendencies regardless of costs (Feddersen et al. 2006).
Research on civic responsibility is compelling in terms of its impact on behavior. Civic duty, which entails a sense of obligation towards society, has primarily been examined in relation to voting. Studies have shown that individuals who strongly identify with civic duty are more inclined to vote because they view voting as a moral responsibility necessary for good citizenship (Blais and Daoust, 2020). However, there is limited research on how civic duty influences behavior in other contexts. For instance, Blais, Galais, and Mayer (2019) discovered that the obligation to stay politically informed is not as prevalent, and for many who feel a duty to vote, their sense of civic duty does not extend to staying informed. Amid the recent pandemic, little is understood about whether civic duty encompasses adherence to behaviors like physical distancing. Voting behaviors may reflect expectations of benefits from electing a favored candidate, fulfilling civic duty, and weighing the costs involved, such as money, time, or energy (Feddersen 2004). Individuals can demonstrate social duties in a variety of settings and situations. For instance, people may express their dedication by patiently standing in line to vote in important elections, even if their single vote has little effect on the outcome (Feddersen et al. 2009). Young people may believe it is their civic duty to engage in the political process. They consider voting as a responsibility and a means of fulfilling their role as citizens in a democracy (Whaley et al. 2021).
2. Description of Data
The American National Election Studies (ANES) 2020 Time Series Study builds upon a longstanding tradition of election studies dating back to 1948 aimed at examining public opinion and voting patterns in U.S. presidential elections. This latest iteration involves reinterviewing respondents from the 2020 ANES, gathering a new cross-sectional sample, and conducting post-election surveys with participants from the General Social Survey (GSS). Interviews were conducted through three different modes: web-based, video, or telephone, depending on the assigned mode group for each respondent. Trained interviewers conducted phone and video interviews utilizing specialized interviewing software installed on computers.
The dataset contains pre-election surveys from August 18, 2020, to November 3, 2020, leading up to the election day on November 3, 2020. Following the election, efforts were made to re-interview as many of the same respondents as possible in post-election surveys conducted between November 8, 2020, and January 4, 2021. For our study, we are only considering the post-election surveys conducted between November 8, 2020, and January 4, 2021.
The ANES 2020 Time Series Study dataset consists of 8,280 individual observations or responses. Each row represents data collected from a unique respondent, participant, or case in the study. These observations may include survey responses, demographic information, and other data points collected during the study period. The dataset contains 1,771 columns, also known as variables or features. Each column represents a specific attribute, characteristic, or measurement associated with the respondents in the study. These variables may include demographic factors (such as age, gender, race, education), political preferences (voting behavior, party affiliation), survey questions, and any other relevant information collected during the study.
In summary, the ANES 2020 Time Series Study dataset comprises 8,280 rows of individual observations, with 1,771 columns of variables representing various aspects of the respondents’ characteristics, opinions, and behaviors. This dataset provides a comprehensive and detailed dataset for conducting analyses and investigations into public opinion and voting behavior during the 2020 U.S. presidential election.
Table 1 presents the demographics of individuals that participated in the ANES 2020 Time Series Study based on the 2020 General Election which include variables such as age, race, gender, education, marital status, occupation, and home ownership.
3. Review of the Statistical Models
In this section, we delve into Data Analytic Strategy and the three distinct statistical modeling approaches: Conditional Inference Trees (CIT), Boruta models, and Generalized Linear Models (GLM). We initially explore CIT, followed by Boruta models, and conclude with an examination of GLM. Each of these methodologies offers unique insights and applications in predictive modeling, contributing to a comprehensive understanding of statistical analysis and machine learning techniques.
3.1. Conditional Inference Tree
Conditional Inference Trees (CIT) extend traditional decision trees, combining interpretability and forecast accuracy. Unlike conventional decision trees prone to overfitting, CIT employs a strict statistical foundation using conditional permutation tests at each node to ensure splits are based on statistically significant differences. This method minimizes overfitting, establishing CIT as a reliable tool for predictive modeling across diverse datasets. The technique’s meticulous conditional inference process contributes to its robustness, enhancing its appeal for achieving a balance between accuracy and interpretability in predictive modeling. Choi (2017) tackled the classification problem by recursively splitting the plane based on characteristics such as vertical lines, giving class labels via majority voting in each zone, and assuring proper categorizations for all points.
To comprehensively assess CIT’s performance, we are conducting extensive experiments, comparing its predictive accuracy with other notable machine learning algorithms. Additionally, our collective effort extends into understanding the interpretability facet of CIT. We aim to unravel how its structure, influenced by statistical significance, contributes to a clearer comprehension of model decisions.
Let X be the dataset with n observations and p features, and let y represent the target variable. The conventional recursive partitioning algorithm initiates tree construction by evaluating candidate splits based on impurity measures such as Gini index or information gain. However, CIT introduces a conditional inference framework, where the process of node splitting is contingent on the outcome of conditional permutation tests.
For a given node in the tree, let represent the region associated with that node. The null hypothesis posits that there is no significant difference in the distribution of the target variable y across the regions defined by the split. The conditional permutation test involves repeatedly permuting the target variable within each region, recomputing the test statistic, and assessing whether the observed statistic falls within the permuted distribution.
The conditional inference process ensures that splits occur only when statistically significant differences are detected. Mathematically, this can be expressed as:
where is the chosen significance level. This strict adherence to statistical significance at each decision node minimizes the likelihood of overfitting and fortifies CIT’s predictive modeling capabilities.
In our empirical assessment, we conduct extensive experiments comparing CIT’s predictive accuracy () with that of other machine learning algorithms. Additionally, the interpretability facet is explored through statistical analysis of the structural attributes influenced by statistical significance, contributing to a nuanced understanding of CIT’s decision-making process. This mathematical underpinning of CIT’s methodology not only enhances the robustness of the model but also provides a systematic framework for evaluating its efficacy in achieving the delicate balance between accuracy and interpretability in predictive modeling.
3.2. Boruta Models
Boruta, an innovative feature selection algorithm, is designed to enhance the interpretability and efficiency of machine learning models by identifying and ranking relevant features within a dataset. Developed as a powerful extension of Random Forests, Boruta operates by comparing the importance of each feature in the actual dataset against its importance in randomized versions of the data. The algorithm is adept at handling complex datasets with a large number of features, providing a transparent and data-driven approach to feature selection. By leveraging the strengths of Random Forests and employing a shadow feature selection process, Boruta strives to offer a comprehensive solution for optimizing model performance.
The Boruta feature selection process involves the following key steps:
- ○
- Boruta begins by creating shadow or “randomized” features based on the original dataset. This is achieved by permuting values within each column to generate a set of synthetic features.
- ○
- A Random Forest model is then trained on the combined set of actual and shadow features. The importance scores of each feature are calculated based on metrics such as Gini impurity or information gain.
- ○
- Boruta performs a statistical test to determine whether the importance score of each actual feature is significantly higher than the maximum importance score observed for its corresponding shadow features. Features with significantly higher importance are labeled as “important,” while those failing the test are deemed “unimportant.”
- ○
- The process is iteratively repeated until all features are either labeled as “important” or “unimportant” or until a predefined number of iterations are reached. This ensures a comprehensive evaluation of feature importance across multiple iterations.
- ○
- Features marked as “important” contribute to the final subset of selected features. This refined feature set is then used for training machine learning models and promoting model efficiency and interpretability.
In our study, we apply Boruta feature selection to enhance the performance of our predictive models. Utilizing the Boruta algorithm in conjunction with machine learning techniques allows us to optimize model interpretability and accuracy by identifying and prioritizing the most relevant features in complex datasets. Our experimental setup involves comprehensive evaluations of Boruta’s effectiveness, comparing model performance with and without feature selection, and examining the impact on predictive accuracy across various machine learning algorithms.
3.3. Generalized Linear Models
Relationships between categorical dependent (response) and independent variables (covariates) are modeled using logistic regressions. Logistic Regression (LR) is the frequently used model to predict categorical responses. Given the values of the covariates, binary logistic regressions calculate the likelihood that a property of a binary variable is present. Here we assume that the data are independent and that is a binary response variable with , () for the presence of the character and for the absence of the character. We are concerned about participation in voting and non participation in voting for our research study. Suppose represent the success probability. Additionally, think of the collection of explanatory variables inputs as being either discrete, continuous, or a combination of both. So, is the number of independent variables in our dataset or model and is the total number of observations. Now we can write the or as,
where
intercept of the logistic model.
effect of variable on .
binary response of individual (voting or not-voting of an individual)
response of independent variable for individual. Where , and .
We can also write as in the logistic function form as,
Here, the ratio of over with
success probability (probability of having voting for individual).
shows the odds of being a voter, a measure that compares the two groups (voters and non-voters) with respect to the predictor variables selected.
Now, to use this model to predict if an individual voted, we need to estimate the parameters of the model. Although we can use the least-squares strategy, maximum likelihood is favored since it has better statistical properties for estimating in the model. The number of in the complete model and the reduced model are denoted by p and r, respectively. Then the likelihood ratio test statistic to test the model is,
where and are the complete model’s and the reduced model’s log likelihoods, respectively. Here, ; and being the number of parameters in the full and the reduced model, respectively.
Cost-Benefit Analysis:
Cost-benefit analysis is a fundamental paradigm in political science and decision theory that is used to assess the rationality of human behaviors, especially when it comes to voting behavior. The cost-benefit model of voting, first introduced by Downs (1957) and expanded upon by Ordeshook (1968), clarifies the calculations people do while determining whether or not to engage in political processes. Mathematically, this can be expressed as:
where R = the net return from voting or reward,
the probability the voter will be decisive,
the utility differential that results when the act of voting is decisive,
positive costs of voting not associated with the outcome,
positive benefits of voting not associated with the outcome/Civic Duty.
Facchini and Jaeck (2019) and Addeo (2024) discussed the cost of electoral activism: if voting is easy, more voters should participate. However, they did not add the reward equation as formulated; they just explained facilitation rules.
4. Analysis of Data and Discussion
We employed a stepwise variable selection method within the dataset to estimate voting behavior, resulting in the identification of approximately 50 variables. Subsequently, we utilized the Boruta approach to further refine the selection, ultimately reducing the number of variables to 21. This curated list includes variables that significantly contribute to explaining the voting behavior. However, upon examination, many of these variables appeared to lack practical relevance in real-life scenarios. Therefore, we supplemented this list by incorporating additional variables based on relevant literature, aiming to establish connections between our research findings and recent scholarly work. Numerous studies indicate that voter identification requirements decrease voter turnout, with certain studies highlighting particularly suppressive effects on minority voters (Alvarez et al. 2011).
Following the methodology outlined by Blais et al. (2015) or Gelman et al. (2010), we embarked on a study aimed at assessing the voting probability utilizing data from the American National Election Studies (ANES). We hypothesize that various factors influence voting behavior. The ANES dataset comprises a sample size of 8,280 respondents and does not encompass variables such as cost and benefit.
Beginning with a General Linear Model (GLM), our approach involves constructing a model that classifies Model voting behaviors based on learning behaviors, with these classes potentially associated with specific labels. Through evaluating the model’s performance using metrics such as Adjusted R-squared or AIC (Akaike Information Criterion), we aim to elucidate the probability of voting.
The variables contributing to the voting probability are shown in Table 2.
These variables will be carefully examined and incorporated into the GLM to analyze their respective impacts on voting behavior.
Variables cost and benefit were retrieved from Schraufnagel et al. (2020) and the Rockefeller Institute of Government (https://rockinst.org/issue-areas/fiscal-analysis/balance-of-payments-portal/).
The map shown in Figure 1 indicates the cost of voting for each state. If the cost is higher, the color is darker red, and if the cost is lower, the color is light green.
Texas has taken the 50th rank, signifying the state with the most restricted electoral atmosphere. Texas has an in-person voter registration deadline 30 days before Election Day, has decreased the number of voting places by more than half in some areas, and has the most stringent pre-registration rule in the country.
The map in Figure 2 indicates the standardized benefit for each state. If the benefit is higher, the color is darker red, and if the benefit is lower, the color is light green.
Virginia and Kentucky rank number one and two respectively in terms of Per Capita Balance of Payments in 2020 without COVID handling.
4.1. Results
Using the selected variables, we initially applied Conditional Deduction Trees (CIT) methodology to elucidate the patterns and factors influencing voting behavior. CIT extends traditional decision tree techniques by incorporating a strict statistical framework, thereby enhancing interpretability and predictive accuracy. By employing CIT methodology, researchers can gain valuable insights into the complex interplay of variables influencing voting behavior, thereby contributing to a deeper understanding of electoral dynamics and decision-making processes.
Interpretation of a CIT, terminal node with a high proportion of voters indicates a subgroup of respondents who are more likely to vote. The path from the root node to a terminal node represents the decision-making process, showing which variables and thresholds are most influential in predicting voting behavior. By examining the terminal nodes and their associated characteristics, we can gain insights into the demographic and attitudinal factors that drive voting behavior within different subgroups of the population.
The CIT with all the variables in the selected variable list is illustrated in Figure 3.
In summary, the CIT decision tree provides a visual and interpretable representation of the complex relationships between predictor variables and voting behavior, allowing researchers to identify patterns and make predictions based on the characteristics of individual respondents.
The estimated model from GLM approach is based on the previous variable list.
Table 3 shows the results of the logistic regression analysis of the Cost/Benefit model of voting in the United States. The variables that were significant with a p-value less than 0.001 were education, Hispanic participants, votes counted fairly, and non-registered participants. These variables were very influential in determining whether an individual voted in the 2020 general election. The other variables that were significant with a p-value less than 0.05 were registered voters, social class, cost, monetary contributions, unemployment, Black participants, and party registration-Other. The variables that were not significant were marital status, part-time employment, Asian and Other participants, home ownership, Democrat and Republican party registration, voting choice, COVID-19, and Benefit.
The Cost/Benefit model showed that participants with a high school diploma were 2.656 times more likely to vote than a participant who did not graduate from high school after controlling for all other variables in the model (exp(0.977)=2.656). Additionally, participants with some college and a 4-year college degree or more were 3.152 and 4.221 times more likely than participants without a high school degree to vote in the 2020 general election. These findings show that as the level of education grows, participants are more likely to vote.
Discriminatory practices based on race has traditionally negatively impacted the ability of minorities to vote in national elections (Henley et al., 2024). The Cost/Benefit model demonstrates that if an individual is Black, their odds of voting is decreased 41% of the time compared to white individuals (exp(−0.513)=0.599),1−0.599=0.410). The outcome for Hispanic participants is worse. The odds of Hispanic participants voting decreases about 54.10% compared to White participants (exp(−0.779)=0.459),1−0.459=0.541). Surprisingly, the variables Asian and Others were not significant.
Social Class and voting integrity have a positive effect on voting in the 2020 general election. The odds of voting increases 1.419 if an individual’s social class increases one unit, if all other variables are constant (exp(0.350)=1.419). Similarly, the odds of voting increases 1.335 if the individual feels their vote will be counted fairly increases one unit with all other variables are constant (exp(0.289)=1.335). Baber et al. (2022) refer to this concept as political efficacy. Voter integrity allows citizens to see how government responds and addresses issues within the political system. Conversely, cost has a negative impact on voting. The odds of voting decreases 25.20% if an individual’s voting cost increases by one unit (exp(-0.116)=0.890, 1-0.890=0.11).
Table 4 displays results of the logistic regression analysis for the Duty model. The variables that are significant with a p-value of less than 0.001 are duty, some college education, and college degree or postgraduate degree. The variables that are significant with a p-value less than 0.05 are home-rent, high school graduate, Hispanic, and homeownership-Others.
Duty Model
The regression analysis shows that duty is very influential in determining voting behavior. The odds of voting are increased 2.656 if participants view voting as a duty compared to viewing voting a choice (exp(0. 977)=2.656). Education is also positively associated with voting. However, the level of significance is lower (.05 vs. 001) in this model for the variable some college education than the Cost/Benefit Model (Table 3). Another notable finding is the relationship between renting and voting. For participants that listed their homeownership status as rent, their odds of voting decreased 56.2% compared to participants that listed their homeownership status as inapplicable (exp(-0.826)=0.438),1−0.432=0.5622).
Table 5 provides the results of logistic regression analysis of the model Duty vs. Cost/Benefit. The table shows that the variables that are significant at a p-value less than .001 are duty, some college education, and 4-year college degree or postgraduate degree. The variables that are significant with a p-value of less than .05 are rent, high school graduate, Hispanic, and home ownership-Others.
Duty vs Cost/Benefit Model
The logistic regression analysis demonstrate that duty and education had a major impact on voting in the 2020 General Election. If an individual views voting as a duty, their odds of voting increases 2.604 times compared to individuals that view voting as a choice, conditional on all other variables fixed (exp(0. 957)=2.604). Education also positively affects voting. If an individual is a high school graduate, completed some college, or holds a bachelor or post graduate degree, then their odds of voting respectively increase 2.824 (exp(1.038)=2.824), 4.486 (exp(1.501)=4.486), and 4.473 (exp(1.498)=4.473) times compared to individuals with less than a high school degree.
Notably, the variables cost, benefit, social class, votes counted fairly, and Black were not significant. This finding suggests that the duty variable trumps factors that traditionally hinder voting. However, Hispanic participants are still negatively by obstacles that prevent them from voting. Their odds of voting are decreased 56.20% of the time compared to white participants (exp(−0.825)=0.438),1−0.438=0.562).
4.2. Discussion
The practical importance of the cost and benefit variables can be challenged in the model with the ANES data. The model in ANES data directly builds the probability of voting based on characteristics and features such as duty, race, education, etc. Another study demonstrates how correlations in election forecasts facilitate conditional outcome inferences through Bayesian inference and simulations (Gelman et al., 2010).
In this dataset from ANES, the voters’ behaviors are not linked to the cost and benefit calculation. They may provide limited contribution to the rational choice model of voting, but more can be done. In fact, data collection and future surveys could be considered to catch the link between voting and capturing factors that contribute to costs and benefits when voting. Additional future studies could examine the impact of emotions and feelings on voter turnout. Srinivason and Paat (2024) data mined tweets during the 2020 General Election expressing feelings and emotions such as joy, love, sadness, fear, anger, and disgust and suggest that public sentiment could serve as a proxy for voting. In this research, we have been engaged in understanding how rational choice impacts voting based on cost/benefit and duty. We have used economic theory as presented in Downs (1957) and Riker and Ordeshook (1968).
The variable ‘duty’ is more related to the decision and probability of voting than cost/benefit. To determine this, we used Boruta and the random forest models. One can propose other models, but the suggested models relax the Gaussian assumptions by considering the classification based on the subclasses. Under these methods, the data are divided into testing and validation. Using the testing, some features are selected. Within a class, say level of education, if a feature has no significant effect on the voting, that feature is not selected and found to be irrelevant. Abramovich and Pensky (2019) discussed the challenges in classification with a small number of classes and small sample size. Building a simulation study would be almost impossible, as the duty associated with voting is more complex to describe. The latter would require a rational of voting, a rational that Blais (2015, page 55) called: “In its simplest formulation, the calculus of voting model appears unsatisfactory. Should we conclude that the model is basically flawed and should be dismissed?” On page 63, the author suggested that besides the cost and benefit, “the term p is probably the most problematic.” We have proposed an attempt to rationalize the voting data.
There is a volatility in the reward recorded. This is to say that the subjectivity in the reward (or subjectivity in the benefit and cost) is highlighted here. Further exploration is needed to validate the benefit and cost. As mentioned in their research, the cost depends on many other factors that may be outside the scope of the ANES of course, and are spatio-temporal dependent. We were not surprised when the correlation between the cost and the average probability of voting was not significant. The same can be said between the benefit and the cost of voting.
Blais et al. (2019) stated that “little is known about the cost of voting” and the perception of voting, in five countries, USA not included. This is related to the probability of voting. In that paper, they described the cost of voting on a 0 to 1 scale, with 0 corresponding to maximally easy and 1 to maximally difficult, respectively. Perception of voting is related to turnout. However, they mention that the substantive impact of cost is fairly small. From Blais et al. (2019), “a huge majority of citizens do not think voting is costly,” hence the variable duty seems a valuable determinant in capturing the probability of voting. Individuals tend to vote more frequently in elections with significant repercussions, when the results are expected to have a large influence on policy (Hansen et al. 1987). Voter turnout is based on membership to a certain group and assumes that the possibility of that group becoming decisive is high enough (Harsanyi 1977). Conventional game-theoretic models struggle to explain high participation in major elections due to the perceived low influence of an individual vote. However, a unique model in which ethical agents interact based on perceived moral responsibilities modified by seeing others’ behaviors produces high turnout and is consistent with strategic behavior, a revealing light on participation dynamics (Feddersen et al. 2006). Barber et al. (2022) analyzed 400 million voting records, and revealed significant racial, age, and geographic disparities in U.S. voter turnout, with minorities, younger citizens, and Democrats being less likely to vote and more likely to live in low-turnout areas. These inequities undermine democratic representation and reinforce political power imbalances.
5. Conclusions
In conclusion, our study used a rigorous technique that included stepwise variable selection and the Boruta approach to uncover critical determinants impacting voting turnout. After examining a long list of variables and refining them, we developed a curated list of 21 variables, including demographics, attitudes, and socioeconomic characteristics, that significantly contribute to predicting voting behavior. Despite the initial list’s practical relevance constraints, more variables were included to strengthen the model based on relevant literature.
Utilizing data from the American National Election Studies (ANES), our analysis elucidated the complex interplay of variables shaping voting behavior. By employing Conditional Inference Trees (CIT) methodology and General Linear Models (GLM), we gained valuable insights into demographic and attitudinal factors impacting voting decisions. Our findings underscore the significance of factors such as education level, race, marital status, and homeownership in predicting voting probability.
While our study initially aimed to explore the role of voting costs and benefits, the ANES dataset did not encompass these variables. Our analysis, however, revealed that the perceived sense of duty towards voting emerged as a crucial determinant, overshadowing considerations of cost and benefit. The subjectivity inherent in assessing voting costs and benefits underscores the need for further research to validate and refine these variables.
In alignment with prior research, our study emphasizes the limited substantive impact of voting costs on voter turnout. Rather, the perception of voting as a duty emerges as a significant determinant of voting behavior. Future studies could delve deeper into understanding the complex interplay between individual perceptions, socio-economic factors, and voting decisions to inform more comprehensive models of voter behavior.
References
- Downs, Anthony. “An economic theory of democracy.” Harper and Row 28 (1957).
- Riker, William H., and Peter C. Ordeshook. “A Theory of the Calculus of Voting.” American political science review 62, no. 1 (1968): 25-42. [CrossRef]
- Learning Analytics Data Analysis Laboratory (LADAL) https://ladal.edu.au/index.html.
- Casella, George, and Roger L. Berger. “Statistical lnference.” Duxbury press (2002).
- Blais, André, and Filip Kostelka. “The decision to vote or abstain in the 2014 European elections.” Revue européenne des sciences sociales 53, no. 1 (2015): 79-94. [CrossRef]
- Schraufnagel, Scot, Michael J. Pomante II, and Quan Li. “Cost of voting in the American states: 2020.” Election Law Journal: Rules, Politics, and Policy 19, no. 4 (2020): 503-509. [CrossRef]
- Rockefeller Institute of Government, https://rockinst.org/issue-areas/fiscal-analysis/balance-of-payments-portal/.
- Keane, Michael P., and Kenneth I. Wolpin. “The solution and estimation of discrete choice dynamic programming models by simulation and interpolation: Monte Carlo evidence.” The review of economics and statistics (1994): 648-672. [CrossRef]
- Abramovich, Felix, and Marianna Pensky. “Classification with many classes: Challenges and pluses.” Journal of Multivariate Analysis 174 (2019): 104536. [CrossRef]
- Blais, André, Jean-François Daoust, Ruth Dassonneville, and Gabrielle Péloquin-Skulski. “What is the cost of voting?.” Electoral Studies 59 (2019): 145-157. [CrossRef]
- Gelman, A., Silver, N., & Edlin, A. (2012). What is the probability your vote will make a difference? Economic Inquiry 2012, 50, 321–326. [CrossRef]
- Blais, André, Carol Galais, and Danielle Mayer. “Is It a Duty to Vote and to be Informed?.” Political Studies Review 17, no. 4 (2019): 328-339. [CrossRef]
- Blais, André, and Jean-François Daoust. The motivation to vote: Explaining electoral participation. UBC Press, 2020.
- Alvarez, R. Michael, Delia Bailey, and Jonathan N. Katz. “An empirical Bayes approach to estimating ordinal treatment effects.” Political Analysis 19, no. 1 (2011): 20-31. [CrossRef]
- Baron, Jonathan. “The ‘culture of honor’in citizens’ concepts of their duty as voters.” Rationality and Society 24, no. 1 (2012): 37-72. [CrossRef]
- Brennan, Jason, and Freiman, Christopher. “Why swing-state voting is not effective altruism: The bad news about the good news about voting.” The Journal of Political Philosophy 31, no. 1 (2023): 60–79. [CrossRef]
- Choi, Hyeong In. “Lectures on Machine Learning (Fall 2017). Lecture 9: Classi cation and Regression Tree (CART)”.
- Feddersen, Timothy, and Alvaro Sandroni. “A theory of participation in elections.” American Economic Review 96, no. 4 (2006): 1271-1282. [CrossRef]
- Feddersen, Timothy, and Alvaro Sandroni. “The calculus of ethical voting.”. International Journal of Game Theory, 2006; 35, 1–25. [CrossRef]
- Edlin, Aaron S., Andrew Gelman, and Noah Kaplan. “Vote for charity’s sake.” The Economists’ Voice 5, no. 6 (2008). [CrossRef]
- Facchini, François, and Louis Jaeck. “Ideology and the rationality of non-voting.” Rationality and Society 31, no. 3 (2019): 265-286. [CrossRef]
- Faravelli, Marco, Kenan Kalayci, and Carlos Pimienta. “Costly voting: A large-scale real effort experiment.” Experimental economics 23, no. 2 (2020): 468-492. [CrossRef]
- Feddersen, Timothy J. “Rational choice theory and the paradox of not voting.” Journal of Economic perspectives 18, no. 1 (2004): 99-112. [CrossRef]
- Feddersen, Timothy, and Alvaro Sandroni. “Ethical voters and costly information acquisition.” Quarterly Journal of Political Science 1, no. 3 (2006): 287-312. [CrossRef]
- Galais, Carol, and André Blais. “Beyond rationalization: Voting out of duty or expressing duty after voting?” International Political Science Review 37, no. 2 (2016): 213-229. [CrossRef]
- Gelman, Andrew, and Nate Silver. “What Do We Know at 7 PM on Election Night?” Mathematics Magazine 83, no. 4 (2010): 258-266. [CrossRef]
- Goldfarb, Robert S., and Lee Sigelman. “Does ‘civic duty’‘solve’the rational choice voter turnout puzzle?” Journal of Theoretical Politics 22, no. 3 (2010): 275-300. [CrossRef]
- Hansen, Stephen, Thomas R. Palfrey, and Howard Rosenthal. “The Downsian model of electoral participation: Formal theory and empirical analysis of the constituency size effect.” Public Choice 52, no. 1 (1987): 15-33. [CrossRef]
- Harsanyi, John C. “Morality and the theory of rational behavior.” Social research (1977): 623-656. [CrossRef]
- Henley, T., Brown S., Diawara, N., Hossain M.I. & Rivera G. (2024) “ Contemporary Voters Suppression: Impact on the 2020 General Election,” Ralph Bunche Journal of Public Affairs: Vol. 7: Iss. 1, Article 4.
- Law, Wilson. “Decomposing political advertising effects on vote choices.” Public Choice 188, no. 3 (2021): 525-547. [CrossRef]
- Heckelman, Jac C., and Nicholas R. Miller. “Introduction: issues in social choice and voting.” In Handbook of Social Choice and Voting, pp. 1-12. Edward Elgar Publishing, 2015.
- Feddersen, Timothy, and Alvaro Sandroni. The foundations of warm-glow theory. working paper, 2009.
- Ong Whaley, Carah and Goldberg, Abraham. Voting Trends Among Young People, Encyclopedia of American Political Parties and Elections, 2021. (https://virginia.academia.edu/CarahOngWhaley/Papers).
- Hayes, Danny, and Jennifer L. Lawless. “As local news goes, so goes citizen engagement: Media, knowledge, and participation in US House Elections.” The Journal of Politics 77, no. 2 (2015): 447-462. [CrossRef]
- Wolfinger, Raymond E., and Steven J. Rosenstone. Who votes?. Yale University Press, 1980.
- Lee, Dwight R. “Ignoring the Electoral College: why public choice economists understate the probability of decisive voters.” Public Choice 187, no. 3 (2021): 439-454. [CrossRef]
- Addeo, F., Ammirato, L., Delli Paoli, A., Fruncillo, D., Maddaloni, D. (2024). Voter.
- turnout: Overtime and regional trends in Europe. Working paper no. 2.3. TRUEDEM: Trust in.
- European Democracies Project (www.truedem.eu).
- Holbein, John B., and Hans Hassell. “George Floyd’s Murder Prompted Thousands of Americans to Register to Vote.” (2023).
- Barber, Michael, and John B. Holbein. “400 million voting records show profound racial and geographic disparities in voter turnout in the United States.” Plos one 17, no. 6 (2022): e0268134. [CrossRef]
- Srinivasan SM, Paat Y-F. A Data-Centric Approach to Understanding the 2020 U.S. Presidential Election. Big Data and Cognitive Computing. 2024; 8(9):111. [CrossRef]
Figure 1.
Cost of Voting by State.
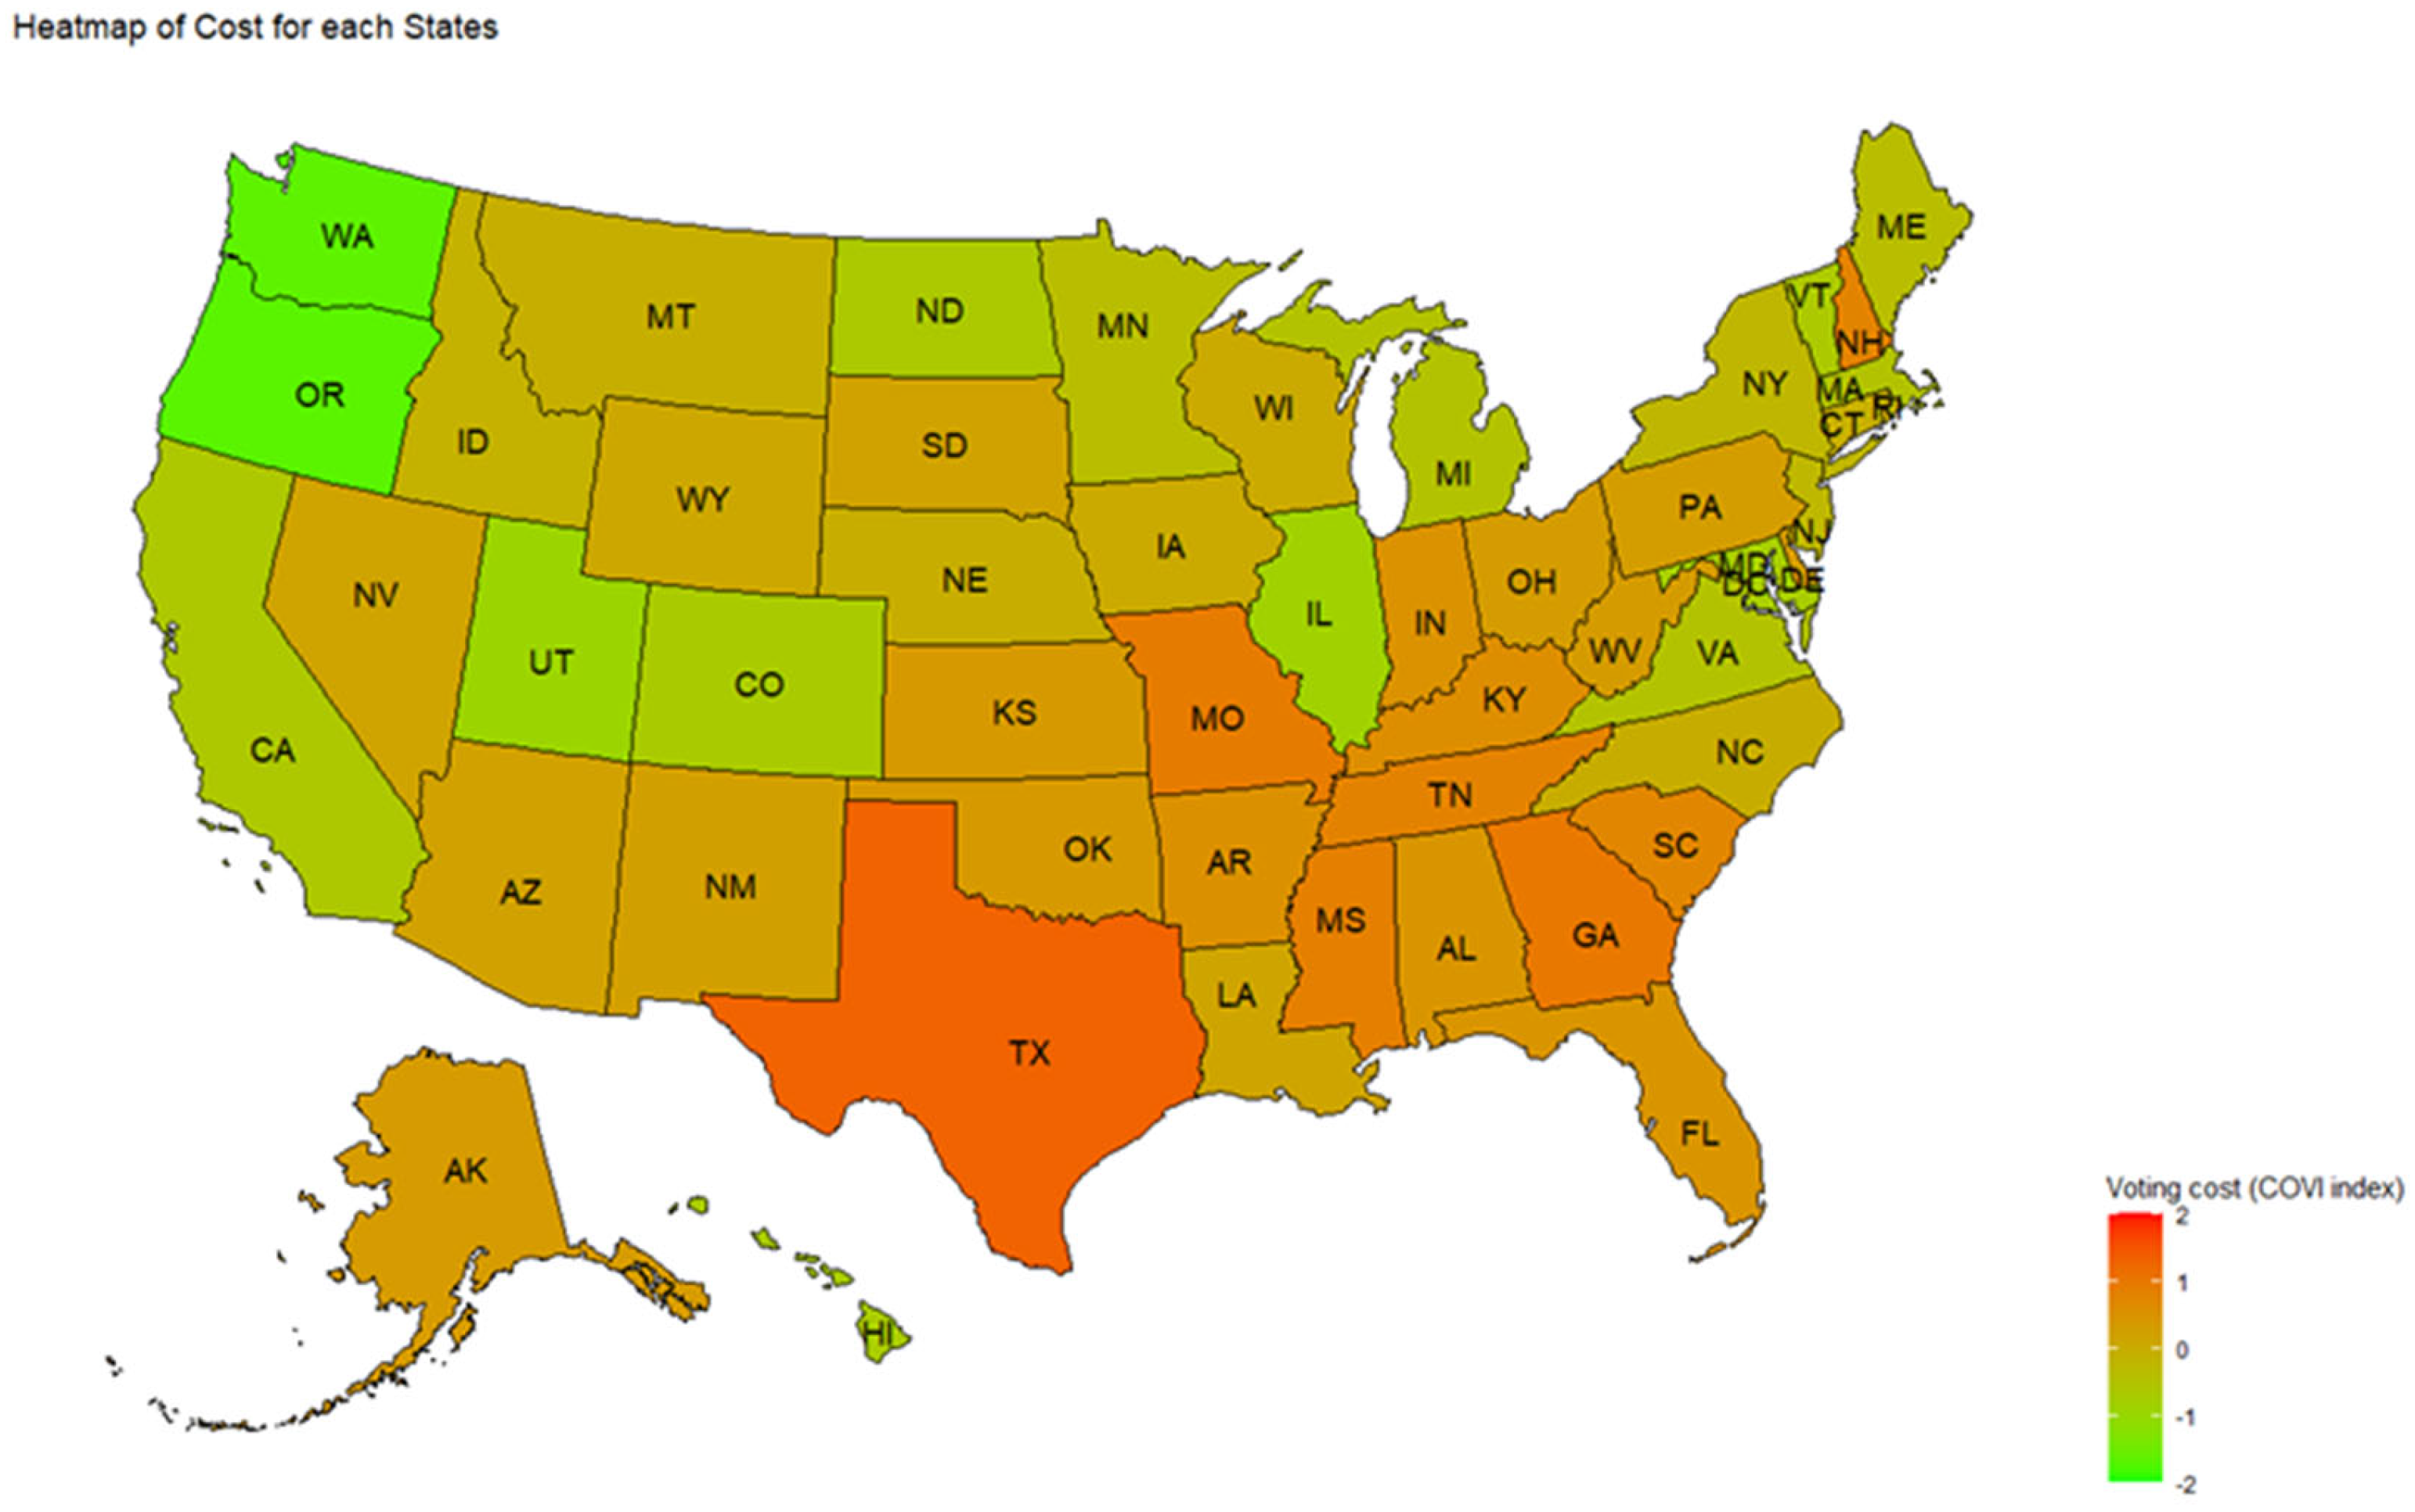
Figure 2.
Standardized Benefit by State.
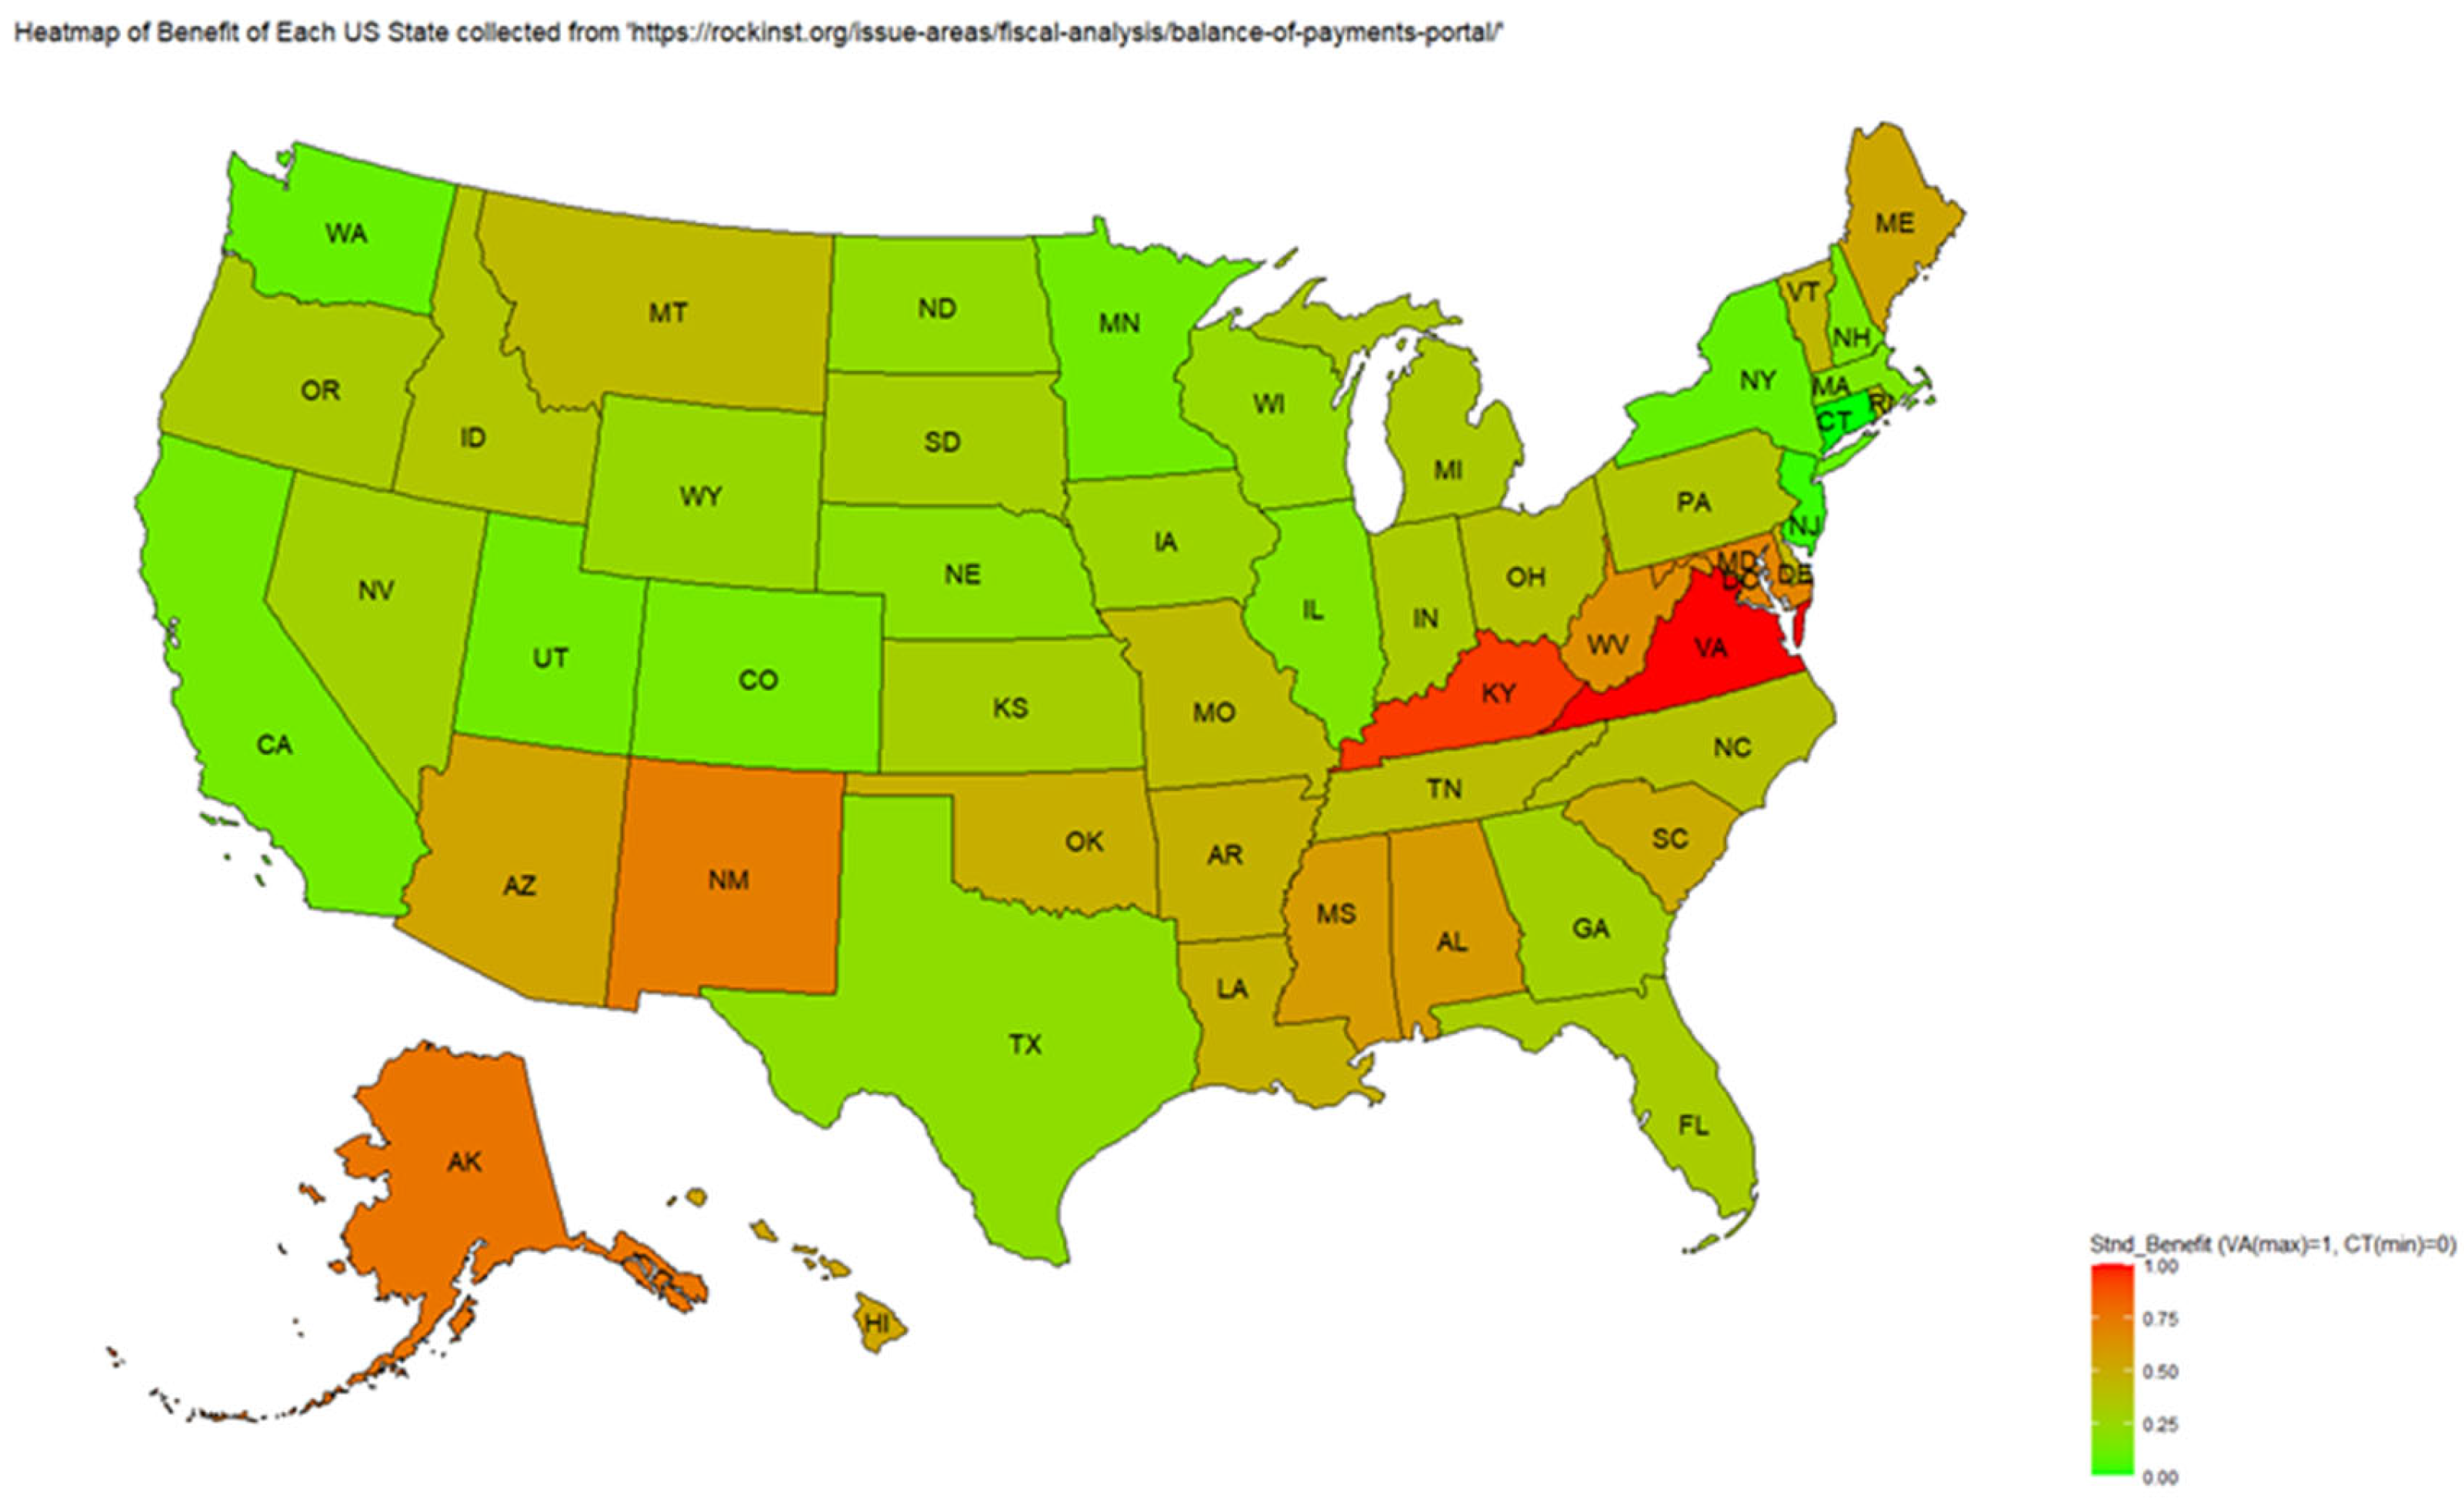
Figure 3.
CIT Variables.
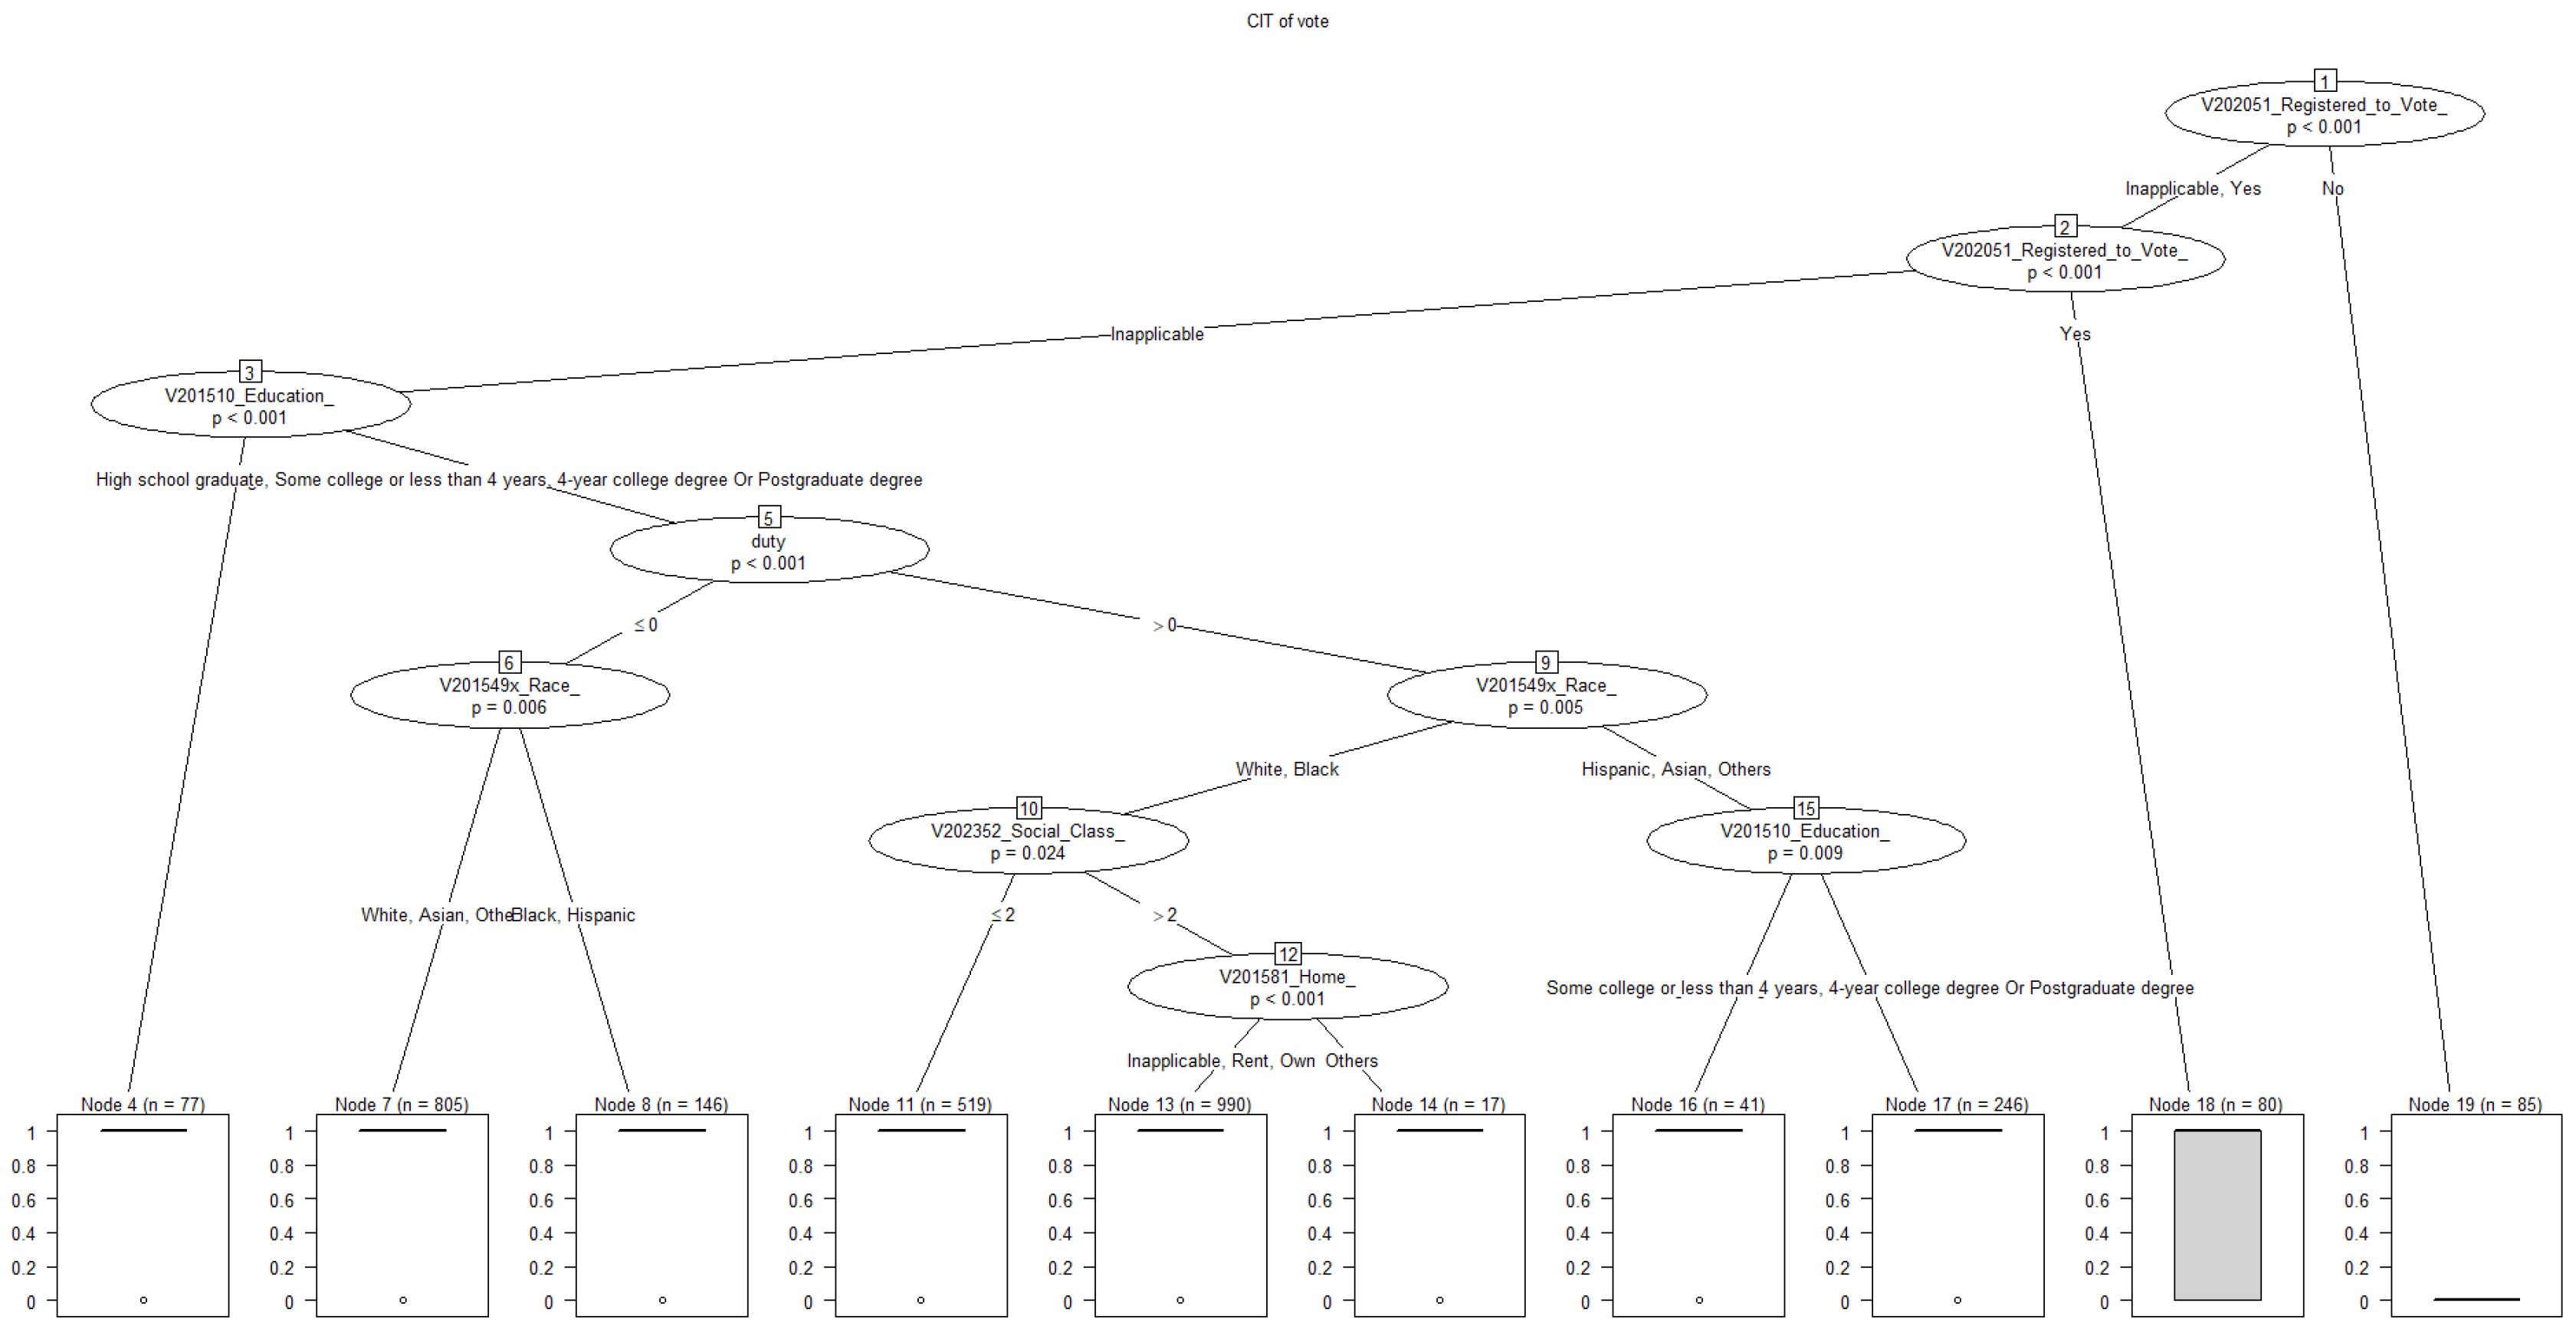

Table 1.
Demographics of Voter Turnout for the 2020 General Election.
| Variables | Not Voted | Voted | |
|---|---|---|---|
| Duty | Views voting as choice Views voting as duty |
154 (13.95%) (69.37%) 68 (3.58%)(30.63%) |
950 (86.05%) (34.12%) 1834 (96.42%) (65.88%) |
| Age | 18-34 35-49 50-64 65+ |
74 (12.80%) (33.33%) 71 (9.62%) (31.98%) 43 (5.26%) (19.36%) 34 (3.90%) (15.31%) |
504 (87.20%) (18.10%) 667 (90.38%) (23.95%) 775 (94.74%) (27.83%) 838 (96.10%) (30.10%) |
| Race | White Black Hispanic Asian Others |
136 (6.08%) (61.26%) 27 (10.00%) (12.16%) 40 (16.19%) (18.02%) 7 (6.86%) (3.13%) 12 (8.05%) (5.41%) |
2102 (93.92%) (75.50%) 243 (90.00%) (8.73%) 207 (83.81%) (7.44%) 958 (93.14%)) (3.41%) 137 (91.95%) (4.92%) |
| Gender | Male Female |
116 (8.54%) (52.49%) 105 (6.41%) (47.51%) |
1242 (91.46%) (44.79%) 1531 (93.59%) (55.21%) |
| Education | Less than high school High school graduate Some college or less than 4 years 4-year college degree Or Postgraduate degree |
30 (31.91%) (13.51%) 67 (15.22%) (30.18%) 72 (7.42%) (32.43%) 53 (3.53%) (23.87%) |
64 (68.09%) (2.3%) 373 (84.78%) (13.4%) 898 (92.58%) (32.26%) 1449 (96.26%) (52.05%) |
| Marital Status | Partnered Single |
90 (5.44%) (40.54%) 132 (9.78%) (59.46%) |
1565 (94.56%) (56.21%) 1219 (90.23%) (43.79%) |
| Occupation | Full Time Unemployed Part Time |
140 (7.46%) (63.06%) 73 (7.30%) (32.88%) 9 (6.92%) (4.05%) |
1736 (92.54%) (62.36%) 927 (92.7%) (33.3%) 121 (93.08%) (4.35%) |
| Home Ownership | Inapplicable Rent Own Others |
111 (7.06%) (50.00%) 49 (14.12%) (22.07%) 51 (5.07%) (22.97%) 11 (13.58%) (4.95%) |
1462 (92.94%) (52.51%) 298 (85.88%) (10.70%) 954 (94.93%) (34.27%) 70 (86.42%) (2.51%) |
Table 2.
Variables Contributing to Voter Turnout.
| Number | Variable | Values |
|---|---|---|
| V201510 | Education *** | 1 = Less than high school, 2 = High school graduate, 3 = Some college or less than 4 years, 4 = 4-year college degree Or Postgraduate degree |
| V201508 | Marital Status | 1 = Partnered, 2 = Single |
| V201533x | Occupation | 1= Full Time, 2 = Unemployed, 3 = Part Time, |
| V201549x | Race * | 1 = White, 2 = Black, 3 = Hispanic, 4 = Asian, 5 = Others |
| V201581 | Home ownership ** | 1 = Inapplicable, 2 = Rent, 3 = Own, 4 = Others |
| V202064 | Party Registration | 1 = Inapplicable, 2 = Democrate, 3 = Republican, 4 = Others |
| V202219 | Votes Counted Fairly | 1 = Never, 2 = Some of the time, 3 = About half of the time, 4 = Most of the time, 5 = All of the time |
| V202017 | Monetary Contribution | 1 = Yes, 0 = No |
| V202051 | Registered to Vote | 1 = Inapplicable, 2 =Yes, 3 = No |
| V202352 | Social Class | 1 = Lower class, 2 = Working class, 3 = Middle class, 4 = Upper class |
| V201244 | Party better handling theCOVID-19 (Voting Choice) | 1 = R. would do a much better job, 2 = R. would do a somewhat better job, 3 = Not much difference between them, 4 = D. would do a somewhat better job, 5 = D. would do a much better job |
| COVI Index | Cost | Scot Schraufnagel, Michael J. Pomante II, and Quan Li (2020) |
| V201221 | Duty*** | 1 = Mainly a duty, 0 = Mainly a choice |
| Benefit | https://rockinst.org/issue-areas/fiscal-analysis/balance-of-payments-portal/ | |
| V202066 | Vote | 1 = Voted, 0 = Did not vote |
Table 3.
Cost/Benefit Model.
| Variables | Estimate | Std. Error | Pr(>|z|) | ||
|---|---|---|---|---|---|
| (Intercept) | -0.07203 | 0.5336 | 0.892622 | ||
| Education | High school graduate | 0.9767 | 0.2796 | 0.000478 | *** |
| Some college or less than 4 years | 1.148 | 0.2602 | 0.000010 | *** | |
| 4-year college degree or postgraduate degree | 1.44 | 0.2793 | 0.000000 | *** | |
| Marital Status | Single | -0.2024 | 0.1561 | 0.194813 | |
| Occupation | Unemployed | 0.3973 | 0.1664 | 0.016923 | * |
| Part Time | 0.03135 | 0.3462 | 0.927853 | ||
| Race | Black | -0.5125 | 0.2366 | 0.030284 | * |
| Hispanic | -0.7793 | 0.2179 | 0.000349 | *** | |
| Asian | -0.08955 | 0.4873 | 0.854213 | ||
| Others | -0.3193 | 0.303 | 0.291884 | ||
| Home | Rent | -0.193 | 0.2001 | 0.334891 | |
| Own | 0.3093 | 0.1796 | 0.085134 | . | |
| Others | -0.1249 | 0.3647 | 0.731934 | ||
| Party Registration | Democrat | -1.01 | 0.7072 | 0.153407 | |
| Republican | 0.1378 | 0.6401 | 0.829524 | ||
| Others | -1.099 | 0.5572 | 0.048607 | * | |
| Votes Count Fairly | 0.2888 | 0.0641 | 0.000006 | *** | |
| Monitory Contribution | 0.514 | 0.2466 | 0.037137 | * | |
| Registered to Vote | Yes | -1.013 | 0.3594 | 0.004802 | ** |
| No | -7.116 | 0.7224 | < 0.000000 | *** | |
| Social Class | 0.3496 | 0.1103 | 0.001529 | ** | |
| Voting Choice | Inapplicable | 0.5941 | 0.3359 | 0.076978 | . |
| Moderately strongly | 0.1762 | 0.3691 | 0.633076 | ||
| Very strongly | -0.2437 | 0.3486 | 0.484605 | ||
| Covid | -0.01712 | 0.06174 | 0.781538 | ||
| Cost | -0.2896 | 0.1089 | 0.007839 | ** | |
| Benefit | -0.00003864 | 0.00002192 | 0.077959 | . |
p < 0.1, *p < .05, **p < .01, ***p < .001.
Table 4.
Duty Model.
| Variables | Estimate | Std. Error | Pr.(>|z|) | ||
| (Intercept) | 0.750286 | 0.692661 | 0.278722 | ||
| Duty | 0.977474 | 0.237736 | 3.93E-05 | *** | |
| Education | High school graduate | 1.03235 | 0.462034 | 0.02546 | * |
| Some college or less than 4 years | 1.516267 | 0.44844 | 0.000722 | *** | |
| 4-year college degree Or Postgraduate degree | 1.521595 | 0.450853 | 0.000738 | *** | |
| Marital Status | Single | -0.1522 | 0.250999 | 0.544267 | |
| Occupation | Unemployed | 0.145875 | 0.263636 | 0.580045 | |
| Part Time | -0.36271 | 0.504709 | 0.472361 | ||
| Race | Black | -0.32022 | 0.4019 | 0.425594 | |
| Hispanic | -0.81911 | 0.345101 | 0.017618 | * | |
| Asian | 0.117249 | 0.663521 | 0.859739 | ||
| Others | -0.23948 | 0.546181 | 0.661048 | ||
| Home | Rent | -0.82618 | 0.308191 | 0.007346 | ** |
| Own | 0.013546 | 0.285243 | 0.962123 | ||
| Others | -1.18811 | 0.521745 | 0.022776 | * | |
| Party Registration | Democrat | -1.7505 | 1.364323 | 0.199472 | |
| Republican | 0.680638 | 1.248893 | 0.585758 | ||
| Others | -1.50016 | 0.856503 | 0.079862 | . | |
| Votes Count Fairly | 0.194254 | 0.108764 | 0.074098 | . | |
| Monitory Contribution | 0.621206 | 0.39193 | 0.112968 | ||
| Registered to Vote | Yes | -0.91516 | 0.542745 | 0.091764 | . |
| No | -20.1501 | 532.3398 | 0.969806 | ||
| Social Class | -0.00698 | 0.177184 | 0.968593 | ||
| Covid | 0.044846 | 0.097712 | 0.646265 |
.p < 0.1,*p < .05, **p < .01, ***p < .001.
Table 5.
Duty versus Cost/Benefit Model.
| Variables | Estimate | Std. Error | Pr.(>|z|) | ||
| (Intercept) | 0.9565 | 0.7156 | 0.181377 | ||
| Duty | 0.995 | 0.2386 | 0.0000303 | *** | |
| Education | High school graduate | 1.038 | 0.4612 | 0.024375 | * |
| Some college or less than 4 years | 1.501 | 0.4471 | 0.000787 | *** | |
| 4-year college degree Or Postgraduate degree | 1.498 | 0.4495 | 0.000863 | *** | |
| Marital Status | Single | -0.1692 | 0.2517 | 0.501495 | |
| Occupation | Unemployed | 0.163 | 0.264 | 0.537112 | |
| Part Time | -0.356 | 0.5049 | 0.480769 | ||
| Race | Black | -0.2603 | 0.4048 | 0.520158 | |
| Hispanic | -0.8251 | 0.3521 | 0.019112 | * | |
| Asian | 0.0893 | 0.6727 | 0.894397 | ||
| Others | -0.2463 | 0.5451 | 0.651466 | ||
| Home | Rent | -0.8203 | 0.3086 | 0.007854 | ** |
| Own | 0.02517 | 0.2853 | 0.929716 | ||
| Others | -1.173 | 0.5249 | 0.025416 | * | |
| Party Registration | Democrat | -1.757 | 1.37 | 0.199749 | |
| Republican | 0.7439 | 1.255 | 0.553352 | ||
| Others | -1.526 | 0.8613 | 0.076419 | . | |
| Votes Count Fairly | 0.2077 | 0.1093 | 0.057385 | . | |
| Monitory Contribution | 0.61 | 0.3927 | 0.120267 | ||
| Registered to Vote | Yes | -0.9545 | 0.5471 | 0.081073 | . |
| No | -20.19 | 531.5 | 0.969697 | ||
| Social Class | -0.003236 | 0.1773 | 0.985443 | ||
| Covid | 0.02333 | 0.09928 | 0.814203 | ||
| Cost | -0.1157 | 0.1731 | 0.50382 | ||
| Benefit | -0.00004021 | 0.00003495 | 0.249965 |
.p < 0.1, *p < .05, **p < .01, ***p < .001.
Disclaimer/Publisher’s Note: The statements, opinions and data contained in all publications are solely those of the individual author(s) and contributor(s) and not of MDPI and/or the editor(s). MDPI and/or the editor(s) disclaim responsibility for any injury to people or property resulting from any ideas, methods, instructions or products referred to in the content. |
© 2024 by the authors. Licensee MDPI, Basel, Switzerland. This article is an open access article distributed under the terms and conditions of the Creative Commons Attribution (CC BY) license (http://creativecommons.org/licenses/by/4.0/).
Copyright: This open access article is published under a Creative Commons CC BY 4.0 license, which permit the free download, distribution, and reuse, provided that the author and preprint are cited in any reuse.


