
Submitted:
14 November 2024
Posted:
19 November 2024
You are already at the latest version
Abstract
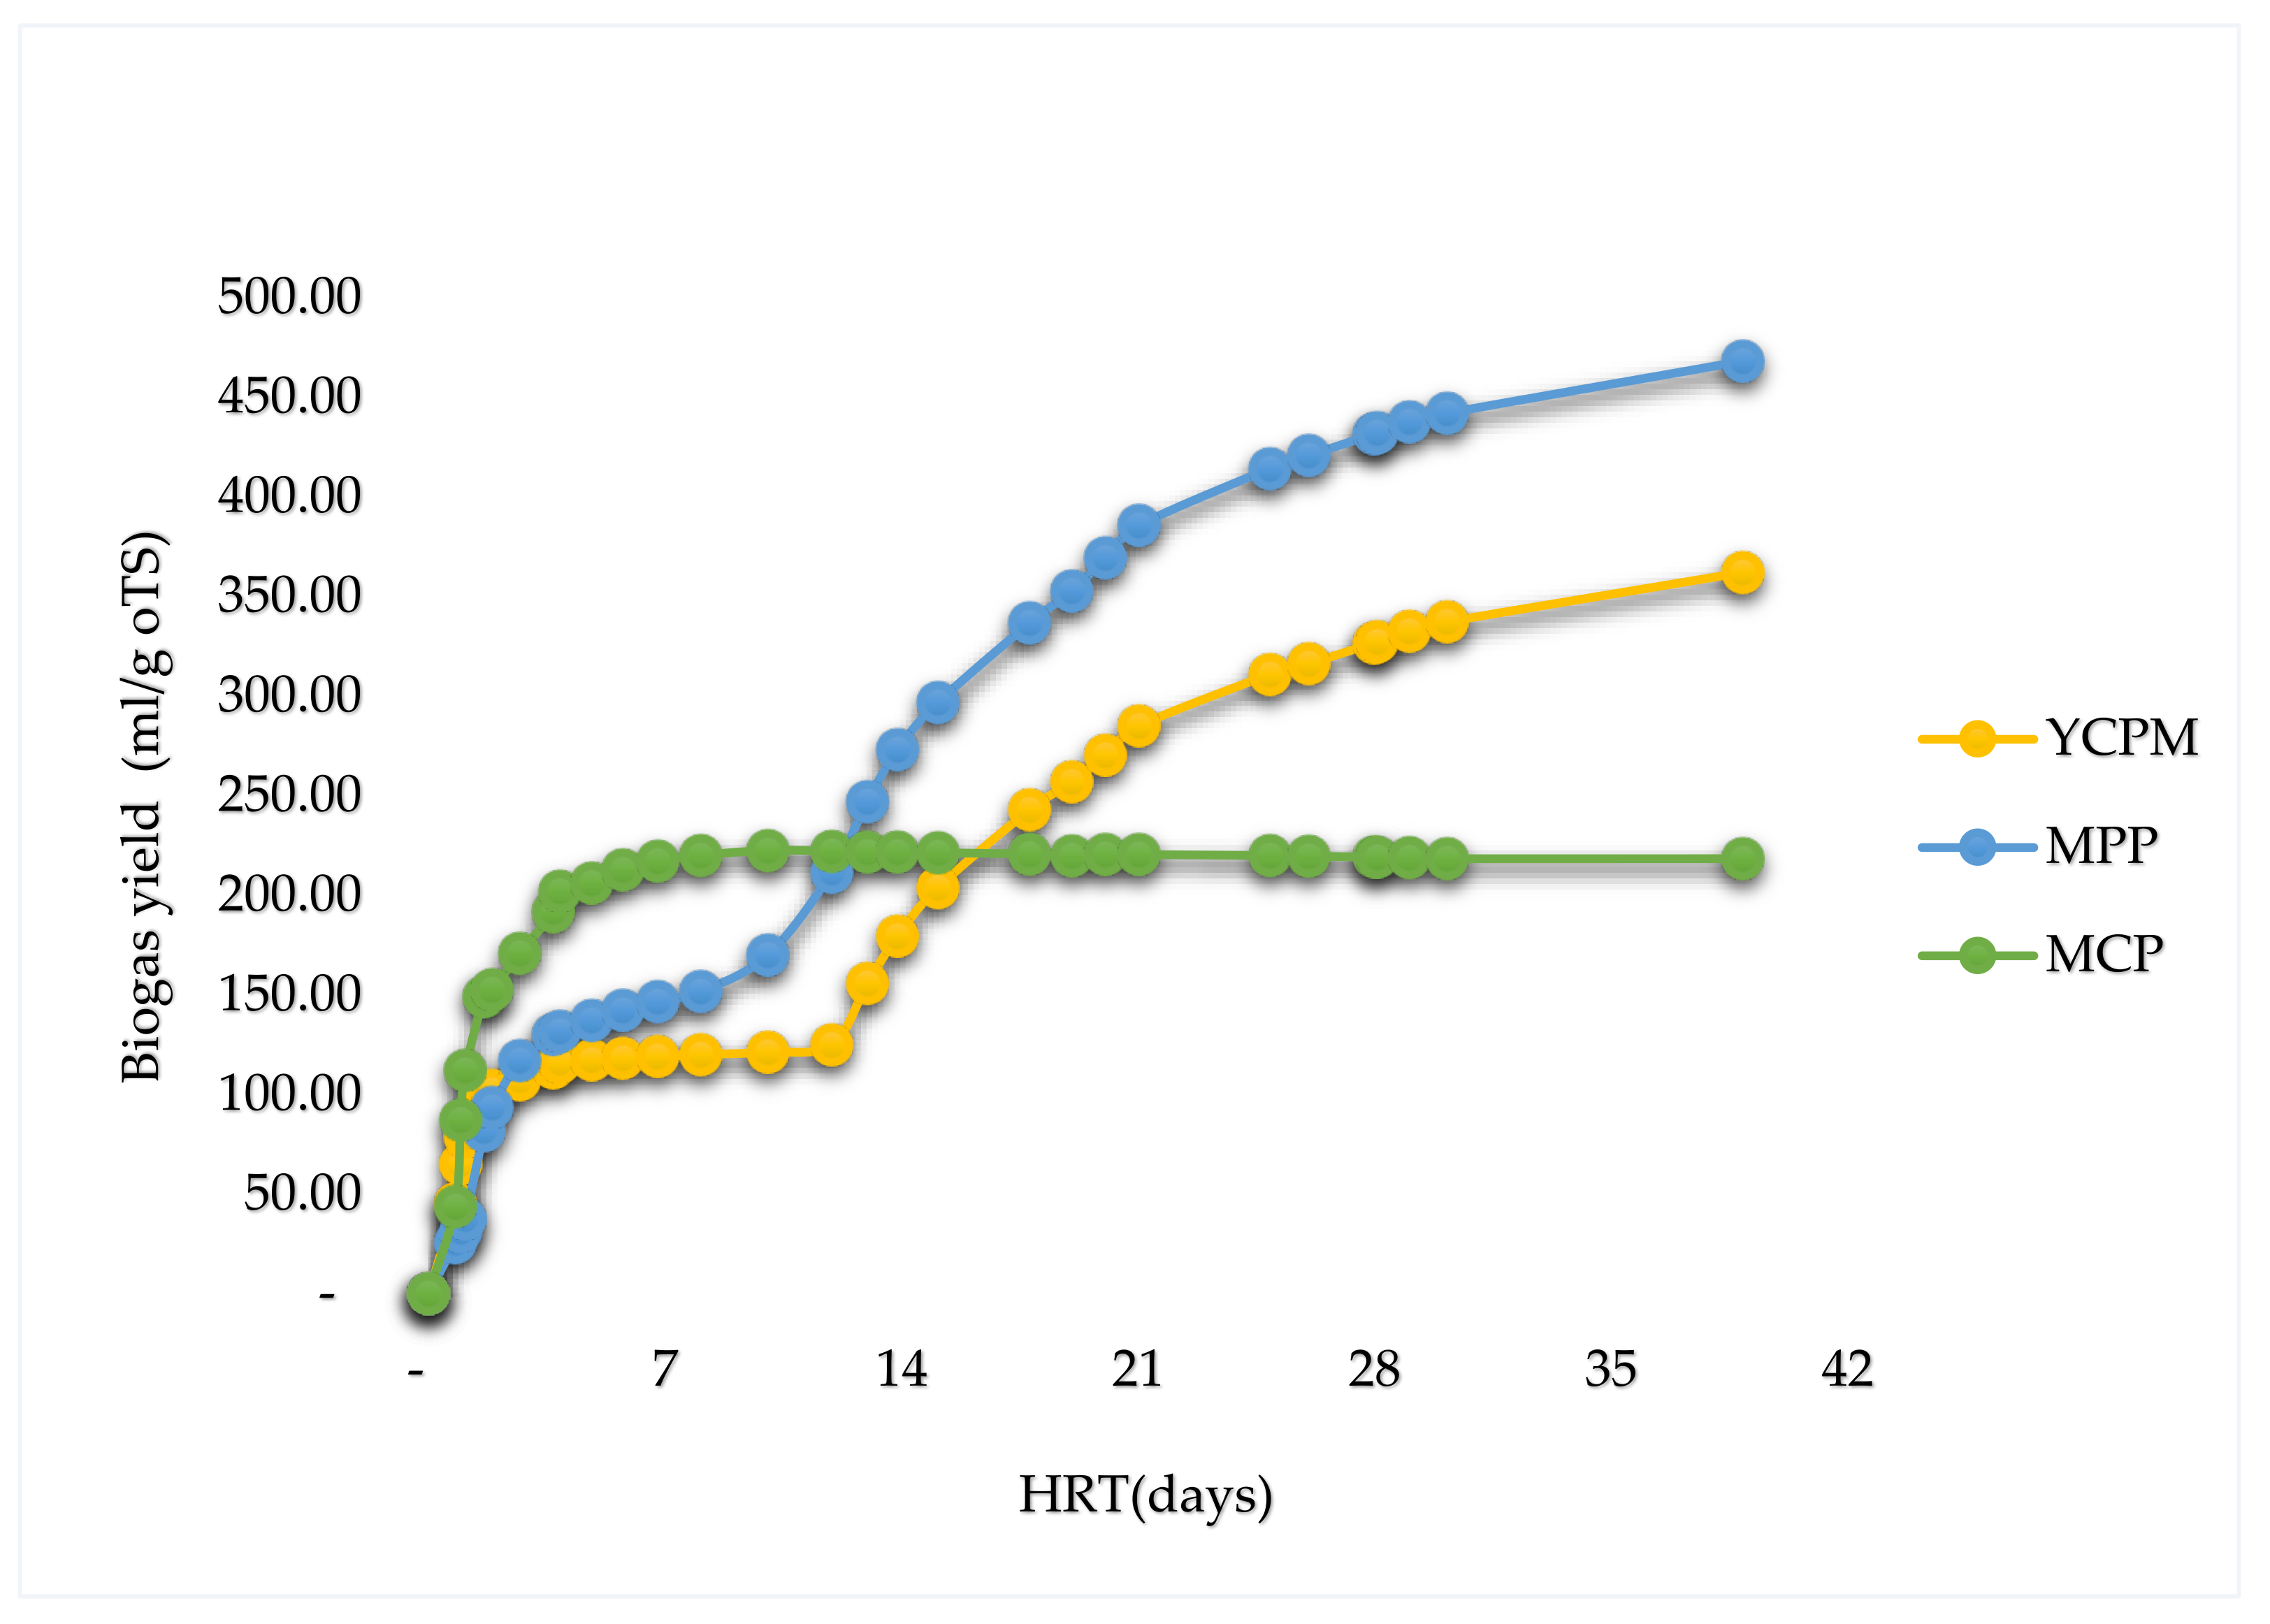
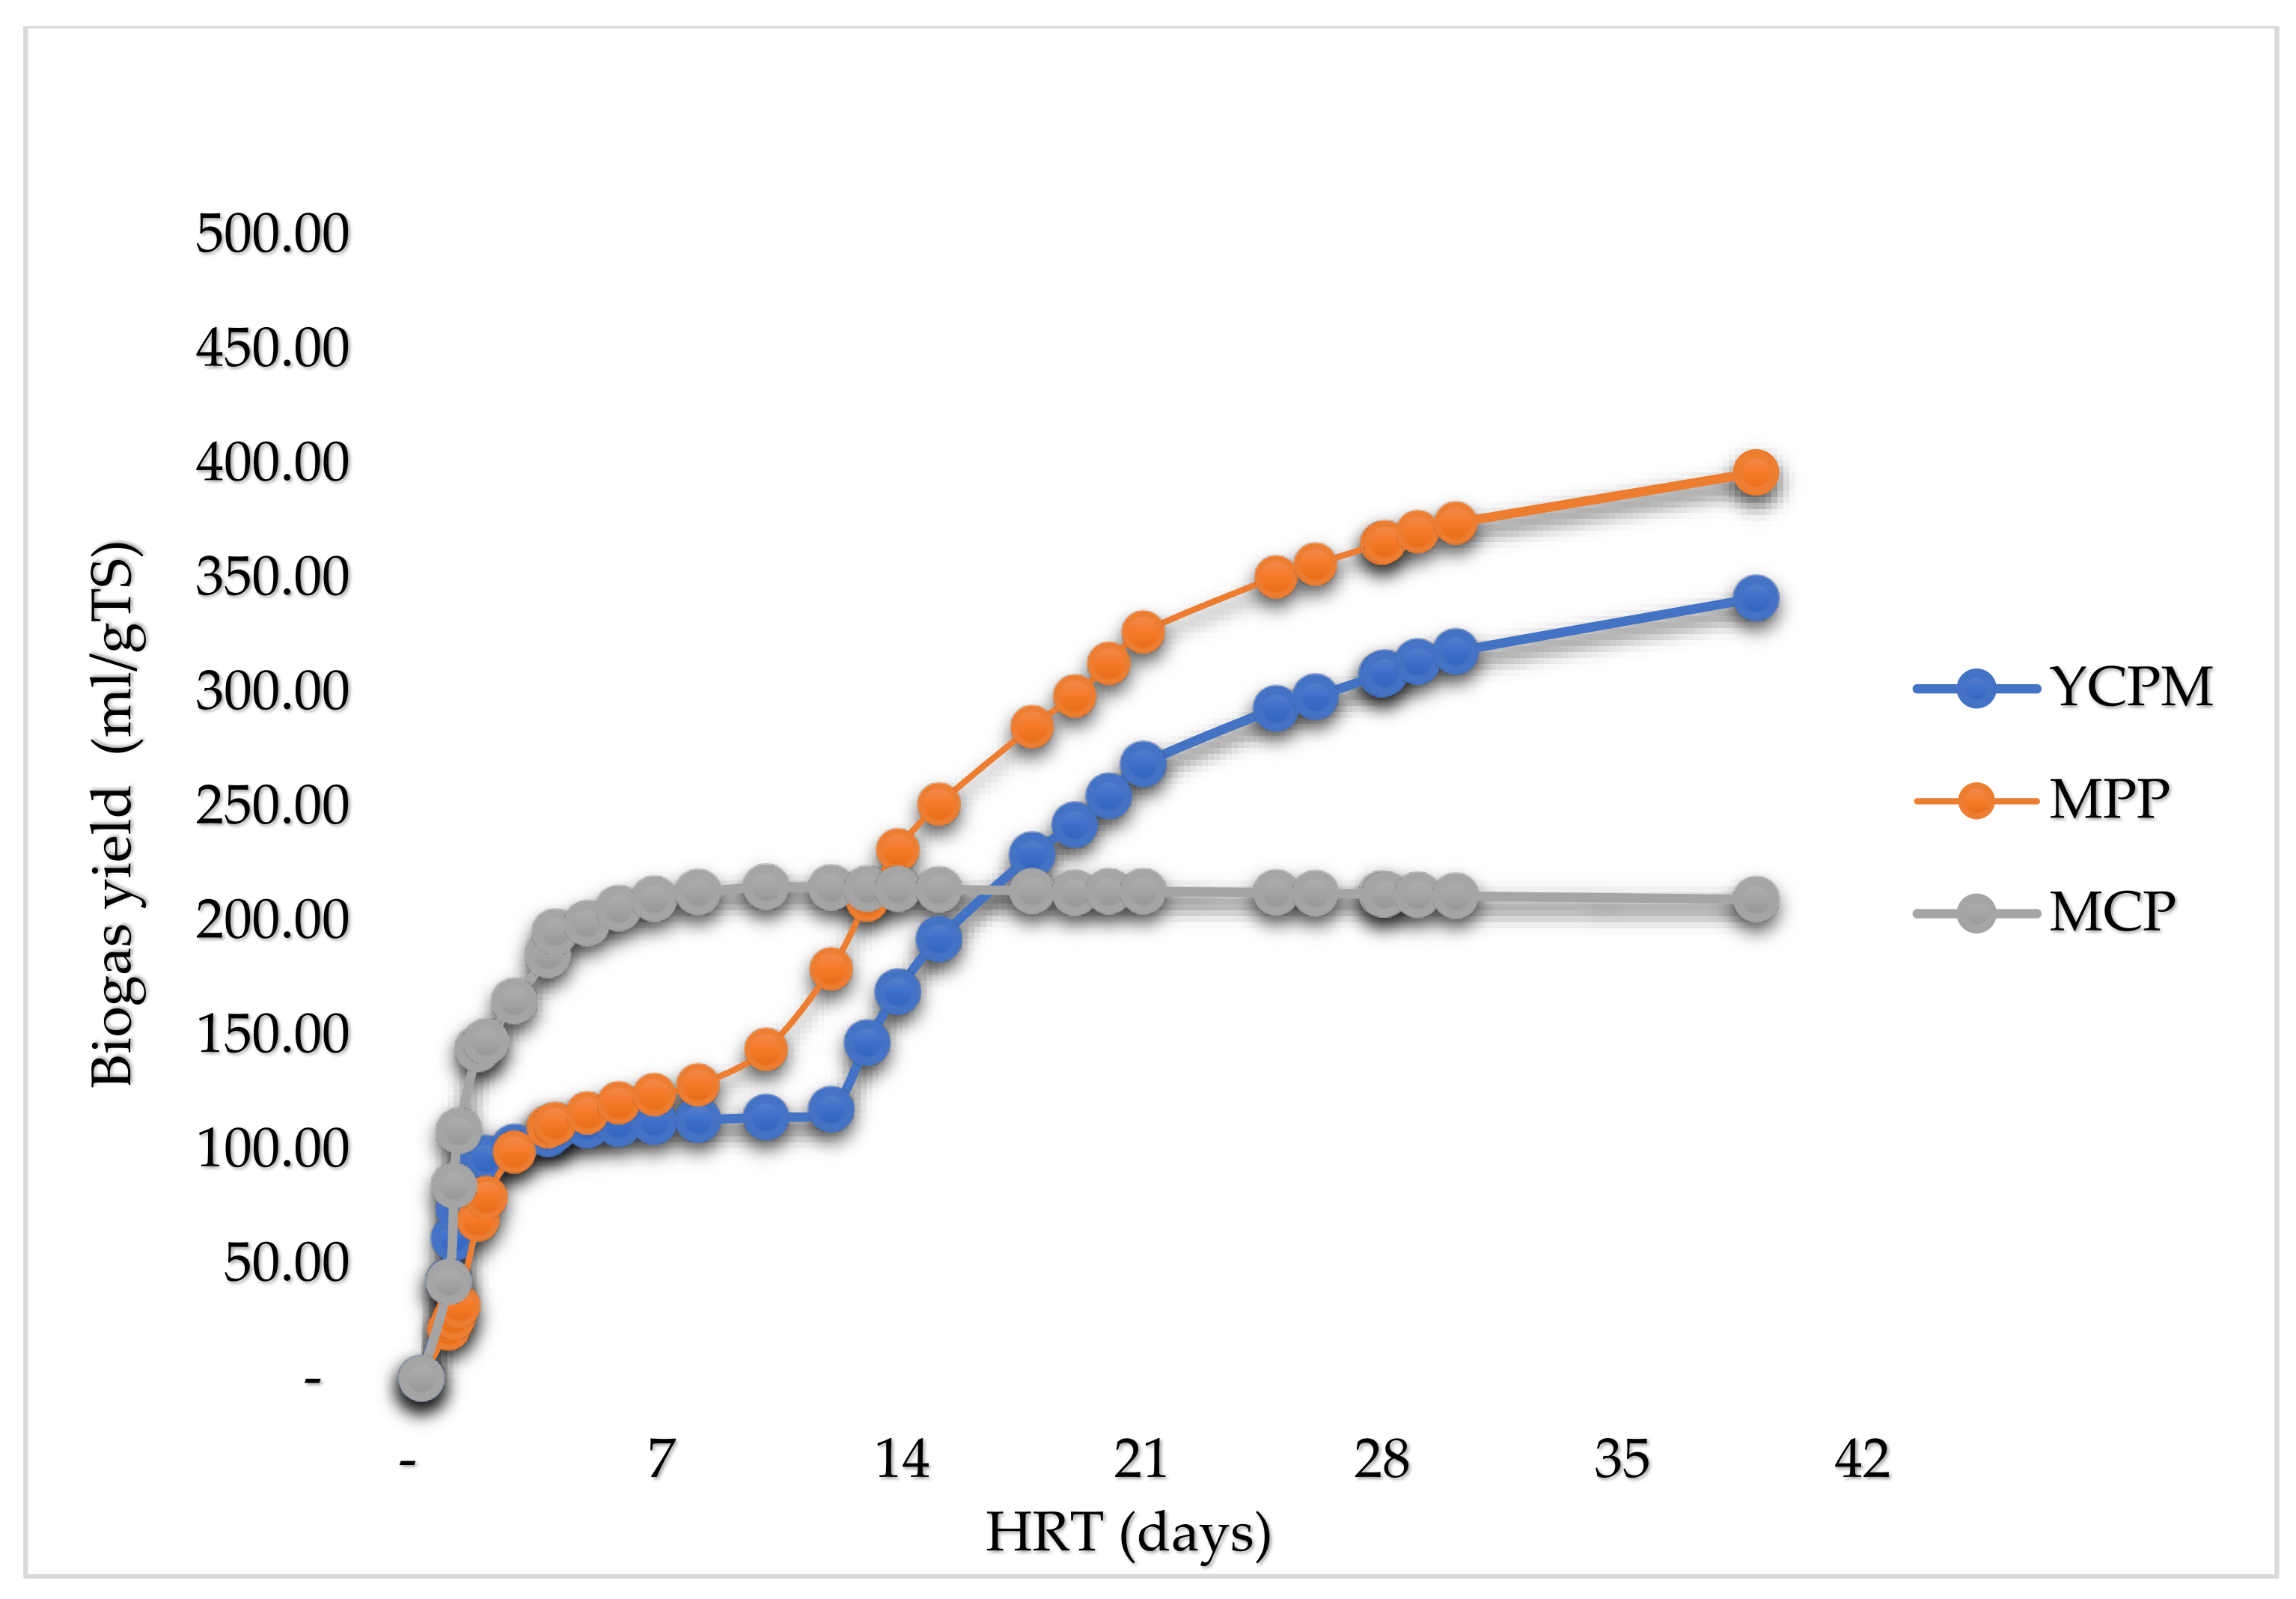
This research aimed to evaluate the comparative biogas yields of waste (peels) of selected relevant fibrous materials from the West African region: Cassava, plantain, a mixture of cassava, plantain and yam. Three models: The Boyle model, the Modified Boyle’s model, and the Buswell and Müller’s model were used to determine the theoretical maximum biomethane potentials (TMBP), while the Hohenheim biogas yield test (D-HBT) was used to undertake a batch test of anaerobic digestion. With an operating temperature of 37±0.5 ℃, the samples were co-digested with digested sewage sludge (DSS) for 39 days. Comparisons are drawn between the TBMPs and the experimental results, the experimental results of the different substrates and the experimental results and figures reported in literature. From the experimental results, plantain peels had the highest biogas yield (468±72 ml/g oTS), followed by a mixture of yam, cassava and plantain peels (362±31 ml/g oTS) and cassava peels obtained the least biogas yield (218±19 ml/g oTS). TMBPS of 204.04, 209.03 and 217.45 CH4 ml/g oTS were obtained for plantain peels, a mixture of yam, cassava and plantain peels and cassava peels respectively, evaluated using the Boyle’s model. For all the samples, the TMBPS (205.56, 209.03 and 218.45 CH4 ml/g oTS respectively) obtained using the Buswell and Mueller model were slightly higher than those obtained by both the Boyle and the modified Boyle’s model (163.23, 167.22 and 174.76 CH4 ml/g oTS respectively).
Keywords:
1. Introduction
2. Materials and Methods
2.1. Inoculum
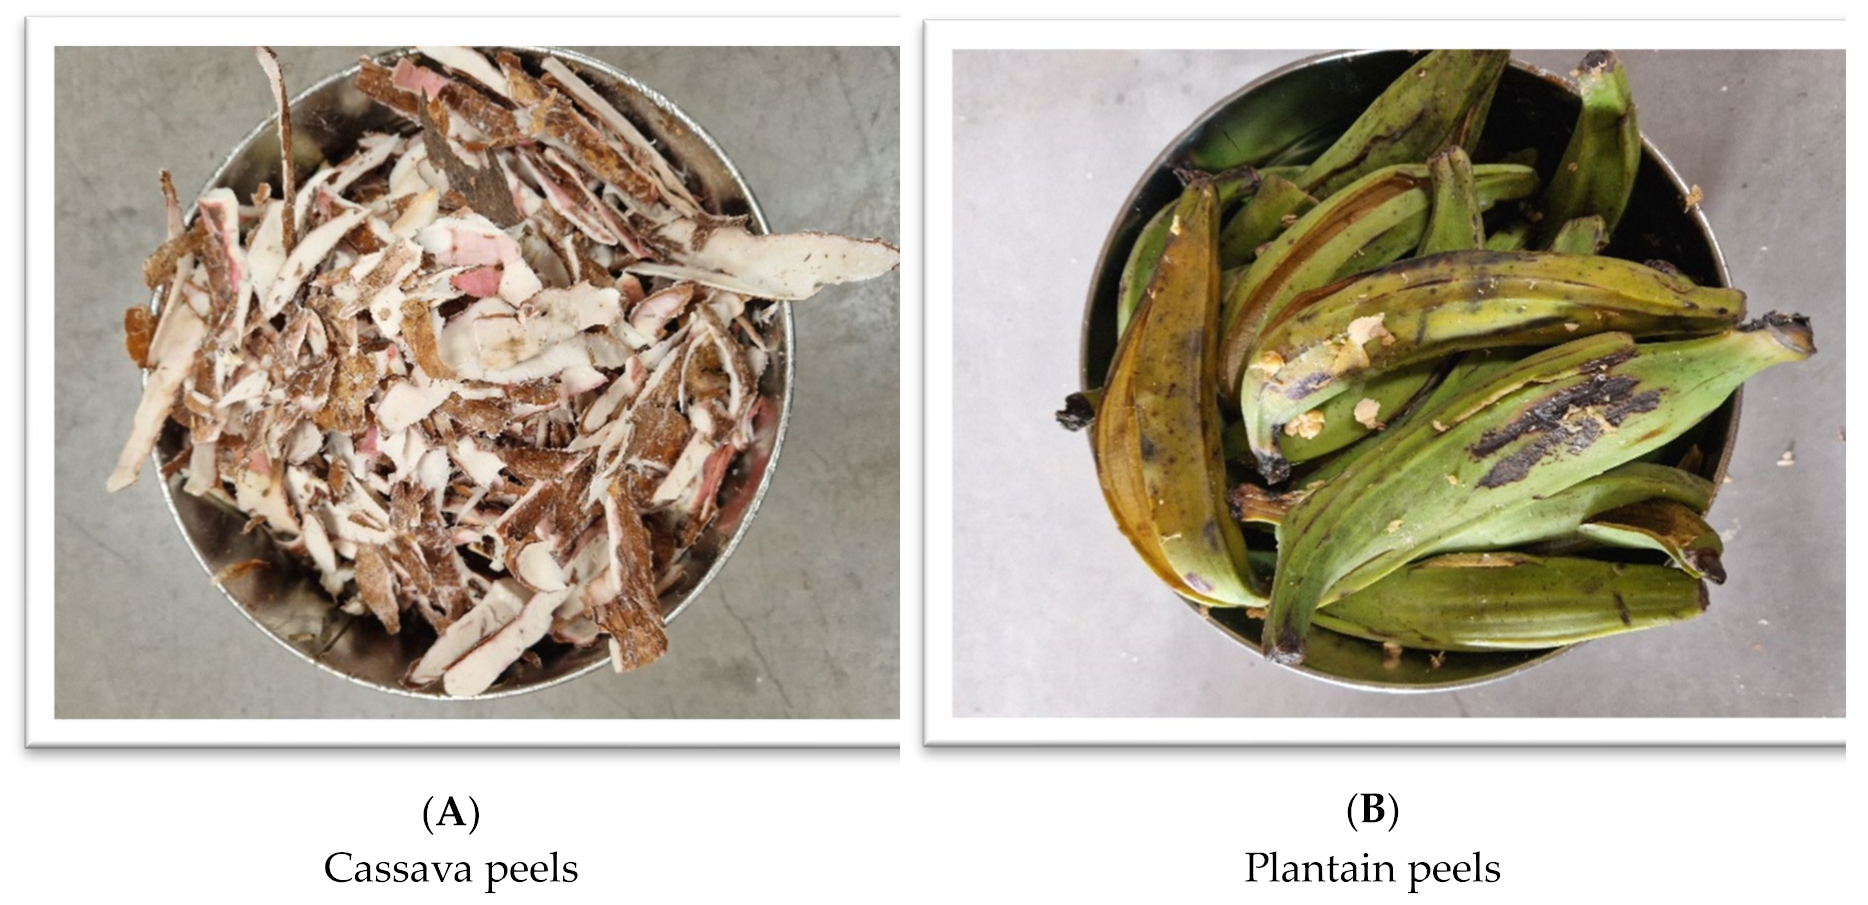
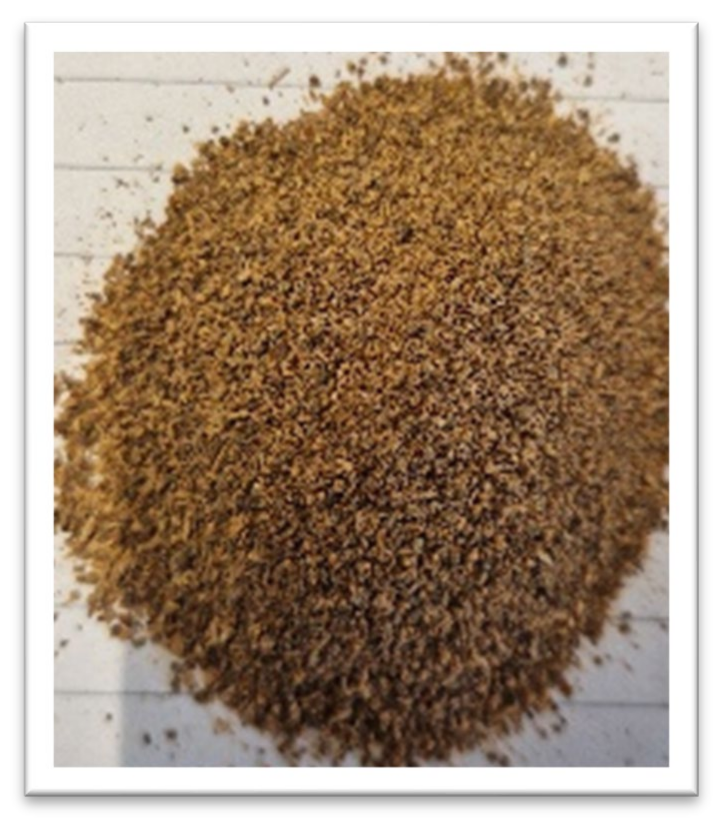
2.2. Samples
2.3. Analytical methods
3. Characterisation of Inoculum and Samples
TS and oTS Determination
4. Elemental Analysis (EA)\
5. Calorimetry & Ion Chromatography
6. Theoretical Determination of Biomethane Potentials
7. Anaerobic Digestion Trials
8. Results and Discussions
8.1. Characterisation
8.1.1. TS and oTS
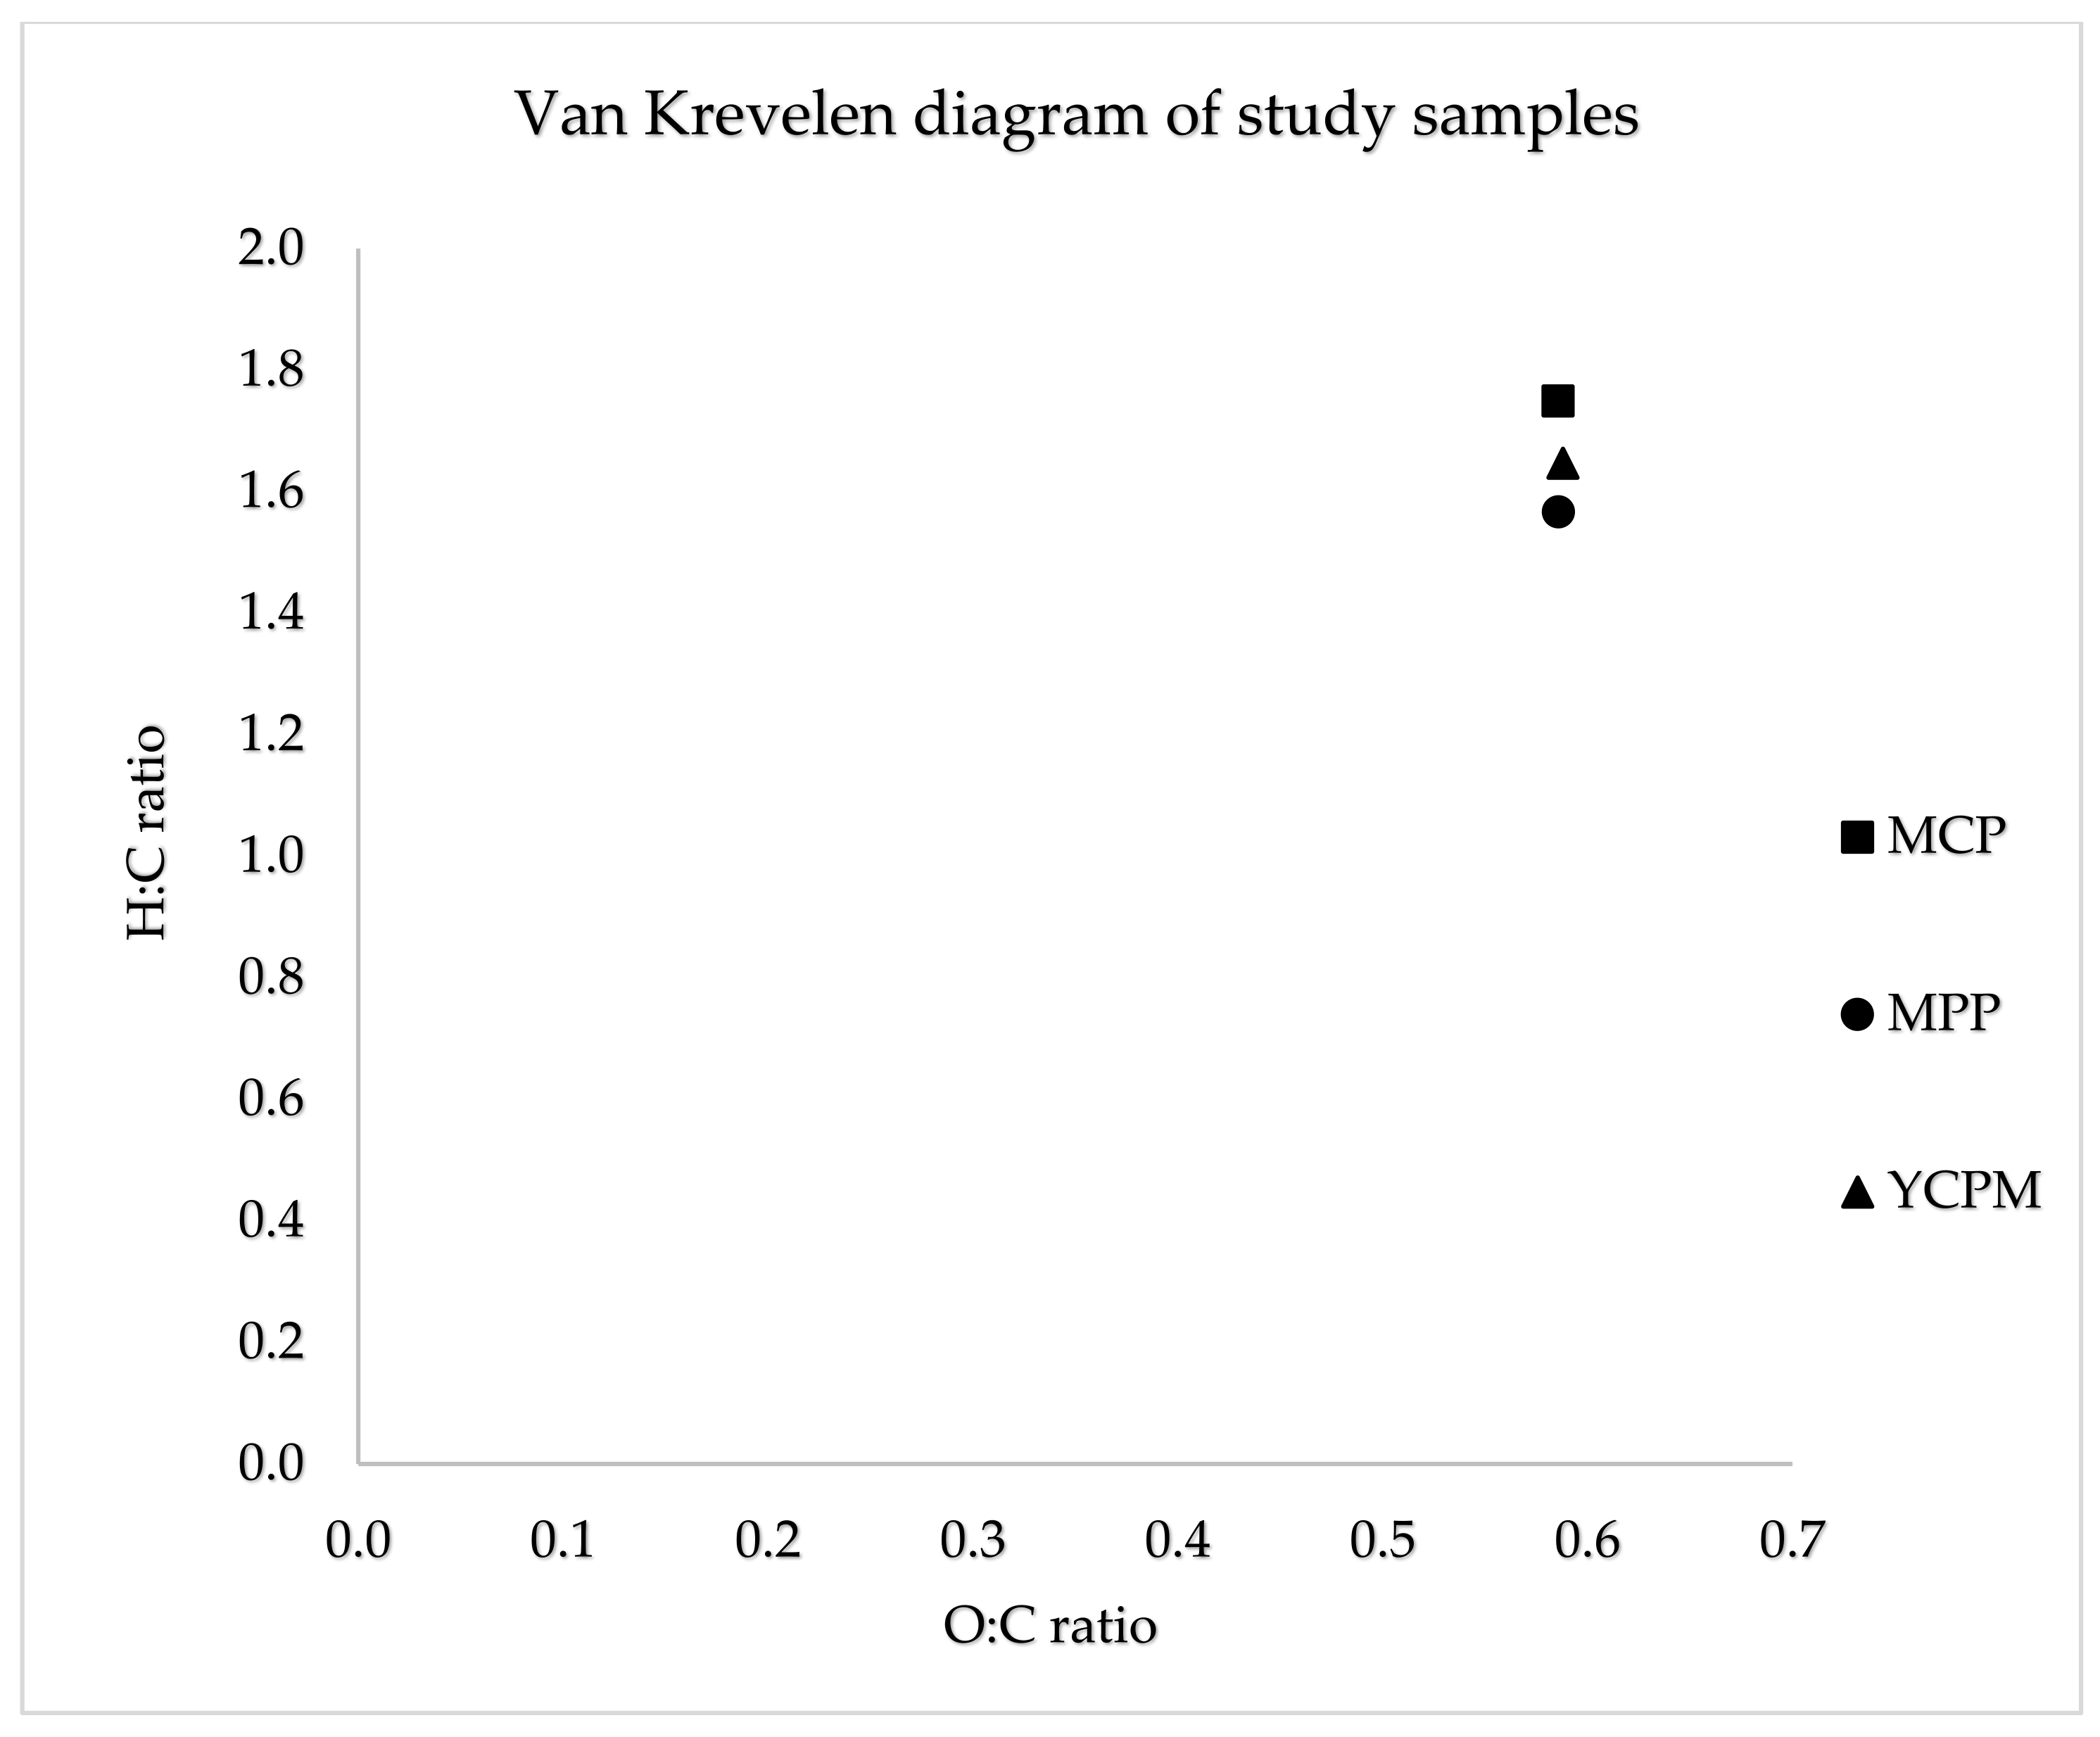
8.1.2. Elemental composition
8.1.3. Trace element concentration 8.1.4. Gross and net calorific values
8.2. Theoretical Biomethane Potentials (TMBP) and Experimental Biogas yields
9. Conclusions
Author Contributions
Funding
Data Availability Statement
Acknowledgments
Conflicts of Interest
References
- Mignogna, D.; Ceci, P.; Cafaro, C.; Corazzi, G.; Avino, P. Production of Biogas and Biomethane as Renewable Energy Sources: A Review. Applied Sciences 2023, 13, 10219. [Google Scholar] [CrossRef]
- Yang, R.; Wang, F.; Rao, Z.; Shen, C.; Li, D. Advancing Sustainable Energy Solutions: Innovations in Clean Energy Applications and Conventional Energy Efficiency Upgrade. Energies 2024, 17, 2441. [Google Scholar] [CrossRef]
- Paczkowski, S.; Sarquah, K.; Yankyera, J.; Sarfo Agyemang Derkyi, N.; Empl, F.; Jaeger, D.; Pelz, S. Hydrothermal treatment (HTT) improves the combustion properties of regional biomass waste to face the increasing sustainable energy demand in Africa. Fuel 2023, 351, 128928. [Google Scholar] [CrossRef]
- Djimtoingar, S.S.; Derkyi, N.S.A.; Kuranchie, F.A.; Yankyera, J.K. A review of response surface methodology for biogas process optimization. Cogent Engineering 2022, 9. [Google Scholar] [CrossRef]
- Deepanraj. Biogas generation through anaerobic digestion process – an overview. Res. J. Chem. Environ. 2014, 18, 80.
- Emebu, S.; Pecha, J.; Janáčová, D. Review on anaerobic digestion models: Model classification & elaboration of process phenomena. Renewable and Sustainable Energy Reviews 2022, 160, 112288. [Google Scholar] [CrossRef]
- Feiz, R.; Ammenberg, J. Assessment of feedstocks for biogas production, part I—A multi-criteria approach. Resources, Conservation and Recycling 2017, 122, 373–387. [Google Scholar] [CrossRef]
- Moriarty, P.; Honnery, D. What is the global potential for renewable energy? Renewable and Sustainable Energy Reviews 2012, 16, 244–252. [Google Scholar] [CrossRef]
- Sárvári Horváth, I.; Tabatabaei, M.; Karimi, K.; Kumar, R. Recent updates on biogas production - a review. BRJ 2016, 3, 394–402. [Google Scholar] [CrossRef]
- Sawyerr, N.; Trois, C.; Workneh, T.; Okudoh, V.I. An Overview of Biogas Production: Fundamentals, Applications and Future Research; EJ EconJournals, 2019. Available online: http://digitalknowledge.cput.ac.za/bitstream/11189/6944/1/Sawyerr_N_Trois_C_Workneh_T_Okudoh_V_AppSci_2019.pdf.
- Singh, A.; Prajapati, P.; Vyas, S.; Gaur, V.K.; Sindhu, R.; Binod, P.; Kumar, V.; Singhania, R.R.; Awasthi, M.K.; Zhang, Z.; et al. A Comprehensive Review of Feedstocks as Sustainable Substrates for Next-Generation Biofuels. Bioenerg. Res. 2023, 16, 105–122. [Google Scholar] [CrossRef]
- Yasim, Nurzulaifa Shaheera Erne Mohd; Buyong, F. Comparative of experimental and theoretical biochemical methane potential generated by municipal solid waste. Environmental Advances 2023, 11, 100345. [CrossRef]
- Angelidaki, I.; Alves, M.; Bolzonella, D.; Borzacconi, L.; Campos, J.L.; Guwy, A.J.; Kalyuzhnyi, S.; Jenicek, P.; van Lier, J.B. Defining the biomethane potential (BMP) of solid organic wastes and energy crops: a proposed protocol for batch assays. Water Sci. Technol. 2009, 59, 927–934. [Google Scholar] [CrossRef] [PubMed]
- Jingura, R.M.; Kamusoko, R. Methods for determination of biomethane potential of feedstocks: a review. Biofuel Res. J. 2017, 4, 573–586. [Google Scholar] [CrossRef]
- The future of anaerobic digestion and biogas utilization.
- Anaerobic Digestion - an overview | ScienceDirect Topics. Available online: https://www.sciencedirect.com/topics/earth-and-planetary-sciences/anaerobic-digestion (accessed on 8 July 2024).
- Yan, J.; Salman, C.A. Chapter 2 - Waste-to-energy (WtE): Current technologies and their future potential. In WASTE BIOREFINERIES: Advanced design concepts for integrated waste to energy processes; YAN, J.S.C.A., Ed.; ELSEVIER - HEALTH SCIENCE: S.l., 2022; pp 25–61. ISBN 978-0-323-91761-2.
- Uddin, M.M.; Wright, M.M. Anaerobic digestion fundamentals, challenges, and technological advances. Physical Sciences Reviews 2023, 8, 2819–2837. [Google Scholar] [CrossRef]
- Meegoda, J.N.; Li, B.; Patel, K.; Wang, L.B. A Review of the Processes, Parameters, and Optimization of Anaerobic Digestion. International Journal of Environmental Research and Public Health 2018, 15. [Google Scholar] [CrossRef]
- Nikolausz, M.; Kretzschmar, J. Anaerobic Digestion in the 21st Century. Bioengineering (Basel) 2020, 7. [Google Scholar] [CrossRef]
- El Asri, O. Handbook of Biodegradable Materials; Springer International Publishing, 2022. Available online: https://link.springer.com/content/pdf/10.1007/978-3-030-83783-9_4-1.pdf.
- El Asri, O. Handbook of Biodegradable Materials; Springer International Publishing, 2022. Available online: https://link.springer.com/content/pdf/10.1007/978-3-030-83783-9_4-1.pdf.
- Uddin, M.M.; Wright, M.M. Anaerobic digestion fundamentals, challenges, and technological advances. Physical Sciences Reviews 2023, 8, 2819–2837. [Google Scholar] [CrossRef]
- Balać, M.; Janković, B.; Manić, N. Theoretical Assessment of Agro-Waste for Biogas Production Based on Novel Methodology Related to Biochemical Potential. Processes 2024, 12, 2440. [Google Scholar] [CrossRef]
- Teghammar, A. Biogas production from lignocelluloses: Pretreatment, substrate characterization, co-digestion, and economic evaluation. Zugl.: Göteborg, Univ., Diss., 2013; Chalmers Univ. of Technology: Göteborg, 2013. ISBN 9789173858465.
- Kwietniewska, E.; Tys, J. Process characteristics, inhibition factors and methane yields of anaerobic digestion process, with particular focus on microalgal biomass fermentation. Renewable and Sustainable Energy Reviews 2014, 34, 491–500. [Google Scholar] [CrossRef]
- Náthia-Neves, G.; Berni, M.; Dragone, G.; Mussatto, S.I.; Forster-Carneiro, T. Anaerobic digestion process: technological aspects and recent developments. Int. J. Environ. Sci. Technol. 2018, 15, 2033–2046. [Google Scholar] [CrossRef]
- Ammenberg, J.; Feiz, R. Assessment of feedstocks for biogas production, part II—Results for strategic decision making. Resources, Conservation and Recycling 2017, 122, 388–404. [Google Scholar] [CrossRef]
- Mourshed, M.; Kamal, M.; Masuk, N.I.; Chowdhury, S.A.; Masud, M.H. Anaerobic Digestion Process of Biomass; Elsevier, 2023.
- Liebetrau, J.; Sträuber, H.; Kretzschmar, J.; Denysenko, V.; Nelles, M. Anaerobic Digestion. Adv. Biochem. Eng. Biotechnol. 2019, 166, 281–299. [Google Scholar] [CrossRef] [PubMed]
- Achi, C.G.; Hassanein, A.; Lansing, S. Enhanced Biogas Production of Cassava Wastewater Using Zeolite and Biochar Additives and Manure Co-Digestion. Energies 2020, 13, 491. [Google Scholar] [CrossRef]
- Achi, C.G.; Hassanein, A.; Lansing, S. Enhanced Biogas Production of Cassava Wastewater Using Zeolite and Biochar Additives and Manure Co-Digestion. Energies 2020, 13, 491. [Google Scholar] [CrossRef]
- Benish, P.M.R.; Mozhiarasi, V.; Nagabalaji, V.; Weichgrebe, D.; Srinivasan, S.V. Optimization of process parameters for enhanced methane production from banana peduncle by thermal pretreatment. Biomass Conv. Bioref. 2023, 13, 15251–15265. [Google Scholar] [CrossRef]
- Kasinath, A.; Fudala-Ksiazek, S.; Szopinska, M.; Bylinski, H.; Artichowicz, W.; Remiszewska-Skwarek, A.; Luczkiewicz, A. Biomass in biogas production: Pretreatment and codigestion. Renewable and Sustainable Energy Reviews 2021, 150, 111509. [Google Scholar] [CrossRef]
- Ibrahim, T.H.; Oyedele, J.O.; Betiku, E.; Solomon, B.O.; Dahunsi, S.O.; Gidado, R.S. Biomethane potential and physicochemical characterization of cassava vinasse from ethanol distillery. Current Research in Green and Sustainable Chemistry 2022, 5, 100338. [Google Scholar] [CrossRef]
- Makinde, O.; Odokuma, L. Comparative Study of the Biogas Potential of Plantain and Yam Peels. BJAST 2015, 9, 354–359. [Google Scholar] [CrossRef]
- Carlos. Lucas_2014.
- Future agriculture socio-ecological transitions and bio-cultural shifts: Tropentag 2017, International Research on Food Security, Natural Resource Management, and Rural Development book of abstracts; Tielkes, E., Ed.; Cuvillier Verlag: Göttingen, 2017. ISBN 9783736996120.
- OLOGUNDE, C.A.; OLADIPO, O.O. Biogas production using poultry wastes, yam and plantain peels. GSC Biol. and Pharm. Sci. 2022, 19, 288–296. [Google Scholar] [CrossRef]
- Sahi Louh, Theophile Roch Ori, Kamenan Blaise Koua, and Prosper Gbaha. Production of biogas with household peelings in households and estimation of energy potential in Côte d’Ivoire 2024, 42, 338–351.
- VDI 4630. Fermentation of Organic Materials—Characterisation of the Substrate, Sampling, Collection of Material Data, Fermentation Tests. 2016. Available online: https://www.scirp.org/(S(351jmbntv-nsjt1aadkposzje))/reference/referencespapers.aspx?referenceid=2950958 (accessed on 28 March 2023).
- Sailer, G.; Eichermüller, J.; Poetsch, J.; Paczkowski, S.; Pelz, S.; Oechsner, H.; Müller, J. Optimizing anaerobic digestion of organic fraction of municipal solid waste (OFMSW) by using biomass ashes as additives. Waste Manag. 2020, 109, 136–148. [Google Scholar] [CrossRef]
- Sailer, G.; Empl, F.; Kuptz, D.; Silberhorn, M.; Ludewig, D.; Lesche, S.; Pelz, S.; Müller, J. Characteristics and Anaerobic Co-Digestion of Press Water from Wood Fuel Preparation and Digested Sewage Sludge. Fermentation 2022, 8, 37. [Google Scholar] [CrossRef]
- 2008.
- Hensgen, F.; Bühle, L.; Donnison, I.; Heinsoo, K.; Wachendorf, M. Energetic conversion of European semi-natural grassland silages through the integrated generation of solid fuel and biogas from biomass: energy yields and the fate of organic compounds. Bioresource Technology 2014, 154, 192–200. [Google Scholar] [CrossRef] [PubMed]
- Shehab, M.; Stratulat, C.; Ozcan, K.; Boztepe, A.; Isleyen, A.; Zondervan, E.; Moshammer, K. A Comprehensive Analysis of the Risks Associated with the Determination of Biofuels’ Calorific Value by Bomb Calorimetry. Energies 2022, 15, 2771. [Google Scholar] [CrossRef]
- Balać, M.; Janković, B.; Manić, N. Theoretical Assessment of Agro-Waste for Biogas Production Based on Novel Methodology Related to Biochemical Potential. Processes 2024, 12, 2440. [Google Scholar] [CrossRef]
- Achinas, S.; Euverink, G.J.W. Theoretical analysis of biogas potential prediction from agricultural waste. Resource-Efficient Technologies 2016, 2, 143–147. [Google Scholar] [CrossRef]
- Rodrigues, R.P.; Rodrigues, D.P.; Klepacz-Smolka, A.; Martins, R.C.; Quina, M.J. Comparative analysis of methods and models for predicting biochemical methane potential of various organic substrates. Sci. Total Environ. 2019, 649, 1599–1608. [Google Scholar] [CrossRef]
- Pererva, Y.; Miller, C.D.; Sims, R.C. Existing Empirical Kinetic Models in Biochemical Methane Potential (BMP) Testing, Their Selection and Numerical Solution. Water 2020, 12, 1831. [Google Scholar] [CrossRef]
- Анжелика. Evaluationofbiogasproductionpotential-1.
- Hülsemann, B.; Zhou, L.; Merkle, W.; Hassa, J.; Müller, J.; Oechsner, H. Biomethane Potential Test: Influence of Inoculum and the Digestion System. Applied Sciences 2020, 10, 2589. [Google Scholar] [CrossRef]
- Longjan, G.G.; Dehouche, Z. Biogas production potential of co-digested food waste and water hyacinth common to the Niger Delta. Biofuels 2020, 11, 277–287. [Google Scholar] [CrossRef]
- Kouame, K.K.R.; Abolle, A.; Kouakou, A.R.; Gbangbo, K.R.; Ehouman, A.D.; Yao, B. Biogas Production from Plantain and Yam Peels: Modelling using Response Surface Methodology. 1 2023, 11, 105–119. [CrossRef]
- YOUNSSI, M. IJIAS-23-289-08.
- Zhou, Y.; Huang, K.; Jiao, X.; Stanisavljevic, N.; Li, L.; Vujovic, S.; Peng, X.; Wang, X. Anaerobic co-digestion of organic fractions of municipal solid waste: Synergy study of methane production and microbial community. Biomass and Bioenergy 2021, 151, 106137. [Google Scholar] [CrossRef]
- Tropentag 2017: Future Agriculture: Socio-ecological transitions and bio-cultural shifts; Tielkes, E., Ed., 1st ed.; Cuvillier Verlag: Göttingen, 2017. ISBN 9783736986121.
- Wobiwo, F.A.; Emaga, T.H.; Fokou, E.; Boda, M.; Gillet, S.; Deleu, M.; Richel, A.; Gerin, P.A. Comparative biochemical methane potential of some varieties of residual banana biomass and renewable energy potential. Biomass Conv. Bioref. 2017, 7, 167–177. [Google Scholar] [CrossRef]
- Jekayinfa, S.O.; Scholz, V. Laboratory Scale Preparation of Biogas from Cassava Tubers, Cassava Peels, and Palm Kernel Oil Residues. Energy Sources, Part A: Recovery, Utilization, and Environmental Effects 2013, 35, 2022–2032. [Google Scholar] [CrossRef]

| Substrate | Volume of inoculum (ml FM) | Mass of sample (g TS) | pH |
|---|---|---|---|
| DSS | 30.0 | - | |
| DSS | 30.0 | - | |
| DSS | 30.0 | - | |
| DSS + YCPM | 29.5 | 2.00 | 7.50 |
| DSS + YCPM | 28.5 | 2.00 | 7.45 |
| DSS + YCPM | 29.5 | 1.99 | 7.44 |
| DSS + YCPM | 29.5 | 2.00 | - |
| DSS + MPP | 28.0 | 1.99 | 7.44 |
| DSS + MPP | 29.0 | 1.99 | 7.46 |
| DSS + MPP | 29.5 | 2.00 | 7.46 |
| DSS + MCP | 31.5 | 2.01 | 7.62 |
| DSS + MCP | 31.5 | 2.01 | 7.66 |
| DSS + MCP | 30.0 | 2.00 | 7.63 |
| Sample | TS [%] | oTS [% TS] |
|---|---|---|
| DSS | 3.75±0.000 | 47.19±0.00 |
| YCP | 25.37±0.01 | 94.27±0.00 |
| CP | 31±0.01 | 97±0.00 |
| PP | 10±0.00 | 85±0.02 |
| Sample | C [% TS] | H [% TS] | N [% TS] | O [% TS] | S [% TS] | Cl [% TS] |
|---|---|---|---|---|---|---|
| YCP | 48.10±0.16 | 6.60±0.03 | 1.15±0.03 | 44.10 | ± | ± |
| CP | 49.73±0.23 | 7.25±0.04 | 0.70±0.02 | 38.83 | 0.50±0.03 | 0.54±0.16 |
| PP | 43.45± 0.15 | 5.67±0.02 | 1.53±0.01 | 33.94 | 0.40± 0.04 | 0.14±0.01 |
| Sample | AC [% TS] | C:N Ratio |
|---|---|---|
| DSS | 52.81 | n.d. |
| YCP | 5.73 | 41.92 |
| CP | 3.00 | 83.38 |
| PP | 15.00 | 33.08 |
| Sample | HHV (kJ/g TS) | HHV (kWh/kg TS) | LHV (kJ/kg TS) | LHV (kWh/kg TS) |
|---|---|---|---|---|
| YPCM | 19.77±71.01 | 5.49±71.01 | 18.41±71.01 | 5.11±71.01 |
| MCP | 22.02±47.56 | 6.12±47.56 | 20.53±47.56 | 5.70±47.56 |
| MPP | 19.70±41.96 | 5.47±41.96 | 18.53±41.96 | 5.15±41.96 |
| Substrate | Biogas Yield (ml/g oTS) | Biogas Yield (ml/g TS) | BMP (55%) | TBMP w.r.t Boyle model (ml/g oTS) | BDI (w.r.t Boyle) (%) | % error (w.r.t Boyle) | TBMP w.r.t Modified Boyle (ml/g oTS) | Buswell & Müller (ml/g oTS) | BDI (w.r.t Buswell & Müller) (%) | % error (w.r.t Buswell & Müller) |
|---|---|---|---|---|---|---|---|---|---|---|
| YCPM | 337.17±30.50 | 317.85±30.50 | 185.4435±30.50 | 209.03 | 88.72 | - 0.13 | 167.22 | 210.55 | 88.08 | - 0.12 |
| MPP | 467.82±71.65 | 374.03±71.65 | 257.30±71.65 | 204.04 | 126.10 | 0.21 | 163.23 | 205.56 | 125.17 | 0.25 |
| MCP | 218.30±18.75 | 210.93±18.75 | 120.07±18.75 | 218.45 | 54.96 | - 0.82 | 174.76 | 220.14 | 54.54 | - 0.45 |
Disclaimer/Publisher’s Note: The statements, opinions and data contained in all publications are solely those of the individual author(s) and contributor(s) and not of MDPI and/or the editor(s). MDPI and/or the editor(s) disclaim responsibility for any injury to people or property resulting from any ideas, methods, instructions or products referred to in the content. |
© 2024 by the authors. Licensee MDPI, Basel, Switzerland. This article is an open access article distributed under the terms and conditions of the Creative Commons Attribution (CC BY) license (http://creativecommons.org/licenses/by/4.0/).


