
Submitted:
12 November 2024
Posted:
12 November 2024
You are already at the latest version
Abstract
The core of the publication is the design of a system for evaluating the condition of production equipment and machines by monitoring selected parameters of the production process with an additional sensor subsystem. The main positive of the design is the processing of data from the sensor layer using Artificial Intelligence (AI) and Expert Systems (ES) with the use of Edge Computing (EC). Sensor information is processed directly at the sensor level on the monitored equipment, and the results of the individual subsystems are stored in the form of triggers in a database for use in the predictive maintenance process. The whole solution includes the design of suitable sensors and the design of the implementation of the sensor layer, the description of data processing algorithms, the design on the communication infrastructure for the whole system, and tests in the form of experimental operation on the device in laboratory conditions. The solution includes visualization of the production system status for the operator using an interactive online map.
Keywords:
edge computing
; sensors
; predictive maintenance
; monitoring
; system
1. Introduction
The last decade has been a challenging period for modern industrial enterprises, with the production process being significantly influenced by two key factors. The first is the implementation of new approaches in automation, which has led to the emergence of concepts such as Industry 4.0 and Industry 5.0 [1].
This method of production entails the active utilisation of contemporary technologies, including Machine Learning (ML), Big Data (BD), and Digital Twin (DT) technologies, in conjunction with novel modern communication methodologies, namely wireless communication and the Internet of Things (IoT). Enterprises that have been implemented in accordance with these concepts are referred to as Cyber-Physical Systems [2] (source 2). The prevailing trend is the introduction of novel approaches in line with Industry 5.0, such a human-centricity, personalisation, and sustainability.
The second factor is the increased pressure on production efficiency, which has the effect of reducing the energy intensity of the production process and lowering the price of the final product. It is evident that these trends are frequently in conflict with one another, and the desired outcome can only be achieved through a substantial transformation in the methodology employed in production. One area where there is a discernible shift in approach is in the maintenance of existing equipment. In an optimal scenario, this process entails the maximisation of the utilisation of production equipment, with a concomitant reduction in the frequency of breakdowns and periods of downtime due to malfunctions. The establishment of a continuous functional state of production equipment hinges upon the implementation of an effective maintenance mechanism.
The traditional methods of maintenance, which encompass both corrective and preventive maintenance, are insufficient for the effective minimisation of equipment downtime. Consequently, the prevailing trends offer companies a novel direction in the domain of maintenance, utilising a predictive methodology [1]. This is exemplified by Predictive Maintenance (PDM) and Condition-Based Maintenance (CBM) [3]. The PDM concept employs a variety of techniques to anticipate future failures. The available literature indicates that PDM technology can be broadly classified into two main categories [5]. Firstly, there are model-based methods for predictive maintenance that rely on stochastic processes, including Gaussian processes, Markov processes, Poisson processes, and Weibull distributions [6,7,8]. The second approach, which has gained greater popularity in recent times due to the advent of artificial intelligence, is data-driven predictive maintenance. This approach to PDM employs machine learning or deep learning methods to predict the health state and remaining useful life of a system's operation, negating the necessity for prior knowledge of the equipment's condition and its degradation process [5,6,7].
A second approach to predictive maintenance is the CBM. This concept is frequently employed in conjunction with Prognostics and Health Management (PHM) [9]. There are a number of international standards that pertain to CBM. The most widely recognised standard is the International Organization for Standardization (ISO) 13374. The most prominent implementation and functional specification of this standard is the Open System Architecture for Condition-Based Maintenance (OSA-CBM), which is held by Machinery Information Management Open System Alliance (MIMOSA) [10].
The resulting platform is a de facto standard that encompasses all functional requirements pertinent to this domain, including data collection and the recommendation of maintenance actions. The OSA-CBM architectural framework comprises seven layers, as outlined by MIMOSA [11], although the seventh layer is the application interface. The model is shown on Table 1.
The objective of this contribution is to develop a condition monitoring system for real-world production systems, which could potentially be integrated into a PDM system. The implementation comprises sensor phase selection, data transformation, and the creation of a data visualisation proposal with alert generation for the operator. In accordance with the presented OSA-CBM architecture, it can be categorised within layers one, two, three and seven.
The utilisation of Edge Computing technology enables the implementation of the entire process at the lowest possible level, namely at the stage of data collection from the monitored process. Consequently, the initial stages of the monitoring process, namely data collection, data processing and transformation, and data evaluation, are conducted practically directly at the sensor level. The principal advantage of this solution is the minimal load on the communication infrastructure and the low demands on the database server.
The remaining portion of the publication is organised as follows: The following section presents an overview of the most relevant concepts from the field of process condition monitoring. The third part of the publication presents a detailed account of the design of the system's overall architecture, including the creation of the sensor layer and a comprehensive description of the architectural modules associated with data collection and analysis. Section four provides a comprehensive description of the implementation environment for the proposed system and a detailed account of the interface implementation for the operator and, potentially, the PDM system, including outputs from experimental operation. Finally, the fifth part of the publication presents a comprehensive evaluation of the proposal and the achieved results in the conclusion.
2. Related Work
To prevent breakdowns in the production process, a variety of maintenance strategies are employed at different levels of complexity. These include breakdown or corrective maintenance (maintenance performed on equipment that has malfunctioned), time-based or preventive maintenance (maintenance performed on equipment based on a calendar schedule), and predictive maintenance strategies. In an optimal scenario, the zero-defects strategy can be achieved [12].
The PDM process is contingent upon the quantity and quality of information and data obtained from the production process, particularly in the context of data-driven predictive maintenance. One of the fundamental aspects of this technology is the monitoring of equipment and process anomalies, the diagnosis of degradation states and faults, and the prediction of the evolution of degradation to failure. This enables the estimation of the remaining useful life. This paradigm, designated Prognostic and Health Management (PHM) [13], is employed to facilitate both condition-based and predictive maintenance. The process of PHM itself is comprised of three principal tasks: fault detection (anomaly detection), fault diagnostics (degradation level assessment) and fault prognostics (remaining useful life prediction) [13]. It is evident that the entire process is inherently intricate. Consequently, the objective of this endeavour is to discern anomalies within the production process, specifically within the fault detection phase. This process can be disaggregated in accordance with the OSA-CBM model, comprising data collection, data processing and data evaluation phases, culminating in fault detection and alert generation.
The preliminary stage is the deployment of sensors, which results in the formation of a sensor layer over the monitored process. Modern systems are typically equipped with a number of sensors. An additive sensor layer for monitoring mechanical systems may comprise the monitoring of fundamental physical quantities, including the temperature of selected parts and components, the current consumption of electrical elements, and pressure.
The measurement of temperature in mechanical components offers two key advantages: firstly, the relative ease of measurement, and secondly, the importance of temperature data in the identification of faults. Accordingly, temperature is identified in numerous publications as a factor conducive to the identification of potential faults.
In the work of Bora et al. [14], a proposal for the detection of faults in reciprocating compressors is outlined, employing the integration of temperature data with machine learning algorithms. The findings of this study indicate that the proposed model is capable of anticipating the status of the device over a 10-day period, utilising solely temperature sensor data and an ARIMA learning module on a Raspberry Pi.
In their work, the authors Yang et al. [15] describe thermal-error-related signals of the spindle system together with motor current, and propose an intelligent monitoring system for the CNC machine. Similarly, the authors Krawczyk and Szuba [16] propose a predictive maintenance system that includes artificial intelligence, which is designed to predict the necessity of maintenance or repairs of switch gears by analysing temperature changes under varying current loads.
Muneeshwari et al. [17] employed temperature sensors on machinery, in conjunction with vibration, pressure, humidity, and accelerometer sensors, to develop an Internet of Things (IoT)-driven predictive maintenance model. Furthermore, temperature sensing is employed in extreme conditions to anticipate the deterioration in performance of a gas turbine, as illustrated in the work of Dai et al. [18]. They put forth a data-driven methodology to forecast equipment condition utilising an autoregressive neural network. This trend is similarly observed in other domains, such as agriculture [19].
The other physical value, which is relatively straightforward to discern, is pressure in technical media distributions. This is applicable in a multitude of settings, predominantly those involving the pressure of air (though not exclusively), where the pressure energy of compressed air is transformed into mechanical work in automation.
The issue of pressure sensing in gas is discussed in the publication by Yun et al. [20]. The authors conducted an analysis and comparison of various simulation-based prediction models for predicting the pressure in gas regulators, with notable outputs that are generally applicable for gas pressure monitoring. A collective of authors,
Kumar et al. [21], addresses a similar topic. The authors examine the potential of artificial neural networks when integrated with the finite element method and employed as predictive tools for anticipating the failure pressure of pipelines. From the perspective of automation and the focus of the article, the objective is to prevent the failure of air distribution systems, which are composed of valves, pipes and cylinders. This problem area is addressed in the core publication of authors Yuan et al. [22]. They propose a fault classification model based on convolutional neural networks (CNNs) for various types of air cylinders, which are widely used in industrial robotic hands in automation systems, from assembly lines to mechanical manufacturing lines.
Liang et al. [23] present a compressed air station pressure monitoring system based on the LoRa protocol. They propose a data monitoring platform that can monitor and evaluate the pressure information of hyperbaric equipment in real time through a wireless sensor network with alarm triggers.
More complex are the procedures of vibration analysis, oil analysis (including oil temperature, viscosity, and level), and, for rotational components, rotational parts parameters [24,25,26]. In the case of vibration analysis, the complications are a consequence of the more challenging measurement process. Mafla-Yépez et al. [27] present a number of strategies for the predictive maintenance of compression ignition engines based on the analysis of vibration data. In his work, he addresses the issue of the pre-established acquisition parameters, which include the sampling frequency, time interval between captures, and the number of samples. The same problem is described by Coelho et al. [28] in a different context. The article proposes a PDM system for industrial equipment using machine learning algorithms with a dataset based on the initial features, such as temperature, operating speed, vibration, and pressure.
A comparable methodology for the monitoring of production equipment parameters is a well-established approach that has been employed in a number of other works and industrial contexts, including the chemical industry [29,30], aviation systems [31,32], additive manufacturing [33,34], the energy industry [35], and even agriculture [36,37].
The subsequent phase, in alignment with the MIMO model (layers 2 and 3), entails a data manipulation process accompanied by preprocessing for analysis and data evaluation with alert generation. This stage of the solution represents the objective of this proposal in principle. The preparation of data for analysis is a relatively straightforward process, dependent on the type of sensor employed (analogue or digital) and the methodology employed for the interpretation of the measured value.
The process of identifying anomalies from data patterns is considerably more complex. Anomalies are defined as patterns in data that deviate from the expected norm. These patterns can manifest in a variety of forms, including point anomalies, contextual anomalies, and collective anomalies. It is often the case that anomalies represent the sole indication of performance deficiencies discernible within data sets [28]. Furthermore, the data collected can vary considerably in type and format, and may be highly correlated, large-scale, and characterised by a high level of noise. The generation of alerts, or error triggers, can therefore be a challenging process, requiring the use of advanced machine learning techniques, such as deep learning networks, convolutional networks, and other data manipulation and data identification processes, including those related to "big data" and "data mining" [38].
Mohammadi et al. [39] presented a comprehensive overview of the various deep learning architectures and algorithms employed in data analytics within the domain of sensing devices. The publication offers a valuable summary of the most commonly used DL models for sensor data processing, a review of practical DL approaches and use cases, and an identification of the challenges and future research directions in the field of DL for sensing systems. The work is limited by its status as an overview, lacking a concrete practical example.
Yang et al. [15] describes an intelligent sensing system for CNC spindles based on multi-source information, including spindle temperature, spindle thermal deformation, operating parameters, and motor current. In order to identify errors in the spindle (and thus generate error triggers), a radial basis function network is employed.
Krawczyk et al. [16] employ a range of machine learning algorithms, including Nearest Neighbours, Linear SVM, RBF SVM, Gaussian Process, Decision Tree, Random Forest, Neural Net, AdaBoost, Naive Bayes, QDA, and Linear Discriminant Analysis, to demonstrate the potential for power rails failure prediction based on temperature changes. However, a limitation of the study is that some of the presented algorithms were trained exclusively on synthetic data. A comparable approach to data evaluation and fault identification utilising AI is outlined in several other publications [17,21,22,24,26,30,40].
However, there are also solutions that do not employ such intricate mathematical models when generating fault triggers from the collected data. In such instances, it is more efficacious to utilise a condition tree or an Expert System (ES) [41]. The deployment of the ES in addressing the issue of anomaly identification and subsequent generation of alerts based on sensor data offers the fol-lowing advantages: cost reduction, lower equipment load, capacity to operate with incomplete and uncertain information, and simplicity of use
In a recent study, Liang and colleagues [23] investigated the efficacy of a wireless sensor system based on LoRa communication for predicting failures and abnormal functions in high-pressure equipment. They propose a real-time pressure monitoring and early warning wireless sensor system based on LoRa communication, with the objective of predicting failures and abnormal functions in high-pressure equipment. The proposal entails an analysis of data from the sensor layer, comprising pressure value, battery power, temperature, and the number of data transmissions at each monitoring point. This analysis is conducted in accordance with pre-established thresholds and rules, which then trigger the alarm mechanism.
In their study, authors H. Lu et al. [42] present an online fault diagnosis system based on an expert system. The proposed fault diagnosis system, which incorporates automated data processing and analysis, is capable of expeditiously identifying and localising faults, thereby reducing the time required for maintenance. Rojek et al. [43] describe an adaptive 3D printing system with an artificial intelligence model that can be customised using an expert database script. The hybrid model has the potential to markedly enhance the efficiency of the 3D printing process, reducing the necessity for trial and error, minimising material waste and optimising production time.
Wang et al. [44] put forth a methodology for the identification of underlying correlations amongst multiple sensors and the detection of data patterns from all correlated sensor data over time. This methodology is founded upon the integration of the autoregressive integrated moving average method and an expert knowledge system.
In their study, Zhang et al. [45] present a fault diagnosis approach based on ES for use in industrial process control systems, as applied to pneumatic actuators. This contribution introduces an algorithmic approach based on a modified expert system that incorporates particle swarm optimisation. It is evident that ES have a wide range of applications in the process of data evaluation in system monitoring and fault detection, as outlined in a comprehensive analysis of typical ES applications [46].
The previously described methods of data processing are distinguished by a high level of computational intensity. The current trend is towards processing unstructured data at lower levels. Edge Computing (EC) [47,48,49] appears to be an appropriate means of data processing at the initial stage, at the lower level. In conjunction with unsupervised neural networks technologies, such as convolutional networks [51,52], or analogous techniques, EC represents a promising avenue for data processing, even in the context of condition monitoring [54].
3. Materials and Methods
The design of the solution described in this paper is physically implemented in a laboratory environment on a model of a real production line. The line model is created from real components used in commercial industry. One advantage of this solution is that the testing phases of the proposed algorithms and procedures are not limited by production, as in a real environment. This method of implementation allows sufficient time for technology development. Furthermore, in the case of deployment of the developed system in practice, adaptation is quick and easy.
3.1. Technical Equipment Used
The apparatus employed for research purposes is located within the faculty laboratories. The picture (Figure 1) provides a visual representation of the modular hybrid automatic production system.
The system is composed of the following components:
- Production;
- Manipulation with seals;
- Packing line;
- Filling line;
- System of conveyors;
- Automatic shelf stacker/storage;
- Inputs/outputs.
Moreover, the system incorporates both procedural and factory automation. The device is capable of functioning as a unified complex entity, yet it can also be disassembled into discrete systems. The control system of the separate modules is currently comprised of an industrial PLC (Siemens S7) mounted on a bar, connected to regulated technology via IEEE 488/24 pin connectors, and to a visualisation through an external interface. Operator panels (HMI) are mounted on a plate with outsourced connectors for communication interfaces.
The final product of the production line is a pallet of bottles, the contents of which are mixed in a variable manner according to the recipe, combining granulate and liquid. The entire system (Figure 2) is managed by an MES (Manufacturing Execution System) based on the AVEVA Manufacturing Execution System [55]. The process is controlled by a programmable logic controller (PLC). The aforementioned MES is also equipped with the functionality to monitor the quality of both processes and products, including the automated execution of quality sample plans and the utilisation of statistical control methods. Nevertheless, the aforementioned elements are not yet fully operational.
The proposed system represents an initial step towards the implementation of PDM. In the initial phase, the objective is to establish the infrastructure for the sensor layer and implement the fundamental components for the intelligent assessment of data from the production line environment using EC.
For the purposes of this publication, the two modules of the production line have been selected for testing the suitability of the proposed hardware for the anticipated use. These are the workstations located at the inlet of the granulate into the system, specifically the "Conveyor FM" and the "Scale" (Figure 3).
Their selection is based on their suitability for the initial validation of procedures and ideas pertaining to the implementation of the sensor layer. This is due to their simplicity and the limited number of active elements.
The device used to evaluate the data from the sensor layer is the Revolution Pi (RevPi). It is an open, modular industrial PLC based on the Raspberry Pi, and is powered by an ARM Cortex-A7 processor. The base unit can be extended with other I/O modules (analog or digital) and numerous communication interfaces, including Profinet, Profibus, and RS-485. The platform, which is based on Linux, allows for the utilisation of technologies such as Node-RED, Python, and the C language, as well as the execution of applications that are supported by MQTT and OPC UA communication [56].
For the intended use, it was necessary to expand the base unit with an I/O module (RevPi MIO) to connect sensors (Figure 4). The mentioned device provides sufficient connectivity for the proposed sensors and computing power for processing information from the sensors of booth workstations within the EC.
3.2. Sensors Proposal
The design of sensors is based on a synthesis of literature sources, personal experience, and the physical nature of the devices being monitored. This approach allows for the capture of additional information about the state of the device, which is of particular importance when the sensed values are of a complex nature.
3.2.1. Sensor set for the Conveyor _FM monitoring
The device may be described as a vibration conveyor, which is responsible for the transportation of bulk materials between stations. The apparatus comprises a material storage tank and a Fluidic Muscle (FM), which serves as the primary source of power for the transfer of materials to the subsequent station. The conveyor is equipped with three sensors for monitoring the material status. Two of these are located in the input reservoir, while the third is situated at the outlet pipe to detect when it is full. The outlet pipe can be emptied using air pressure, which is controlled by the outlet in automatic or manual mode. The active components (air control valves) are controlled by PLC. Therefore, the entire device is simple yet functional. It should be noted that there is no information available regarding the status of the key elements for PM, including the condition of the driving element (FM), air pressure (intake valve status), and the condition of the conveyor itself (movement possibility). The detailed description is provided in Figure 5.
In order to gain additive data from the production process, three additive sensors were used in accordance with the controlled process and the simplicity of the testing purposes. An air pressure sensor was employed for the purpose of monitoring the status of the air within the system, while an accelerometer (vibration sensor) was utilised for the monitoring of the conveyor's state. Additionally, temperature monitoring was conducted. The aforementioned temperature sensor comprises two sensors, one measuring room temperature and the other measuring the internal temperature of the device. This sensor is employed solely for the purpose of monitoring CPU load in the RevPi device, which is used for data processing. The data obtained from the temperature sensor can be readily processed, whereas the other two require more complex techniques. In our proposal, the air pressure sensor is designed to measure not only the actual value of pressure in the system, but also the course of pressure in the system.
The SPTE-P10R-S4-V-2.5K air pressure sensor, produced by the FESTO company, will be utilised for this purpose (see Figure 5). The selected sensor [57] has an appropriate pressure range (0-1 MPa), an appropriate output range (0-10 V), and is compatible with the existing line equipment.
To measure vibrations, an accelerometer is employed, specifically the low-cost industrial grade IP67 sensor RS-WZ3/WZ1-*-1, which is based on MEMS technology. The main technical parameters, including vibration velocity accuracy (within ±1.5% of the full scale reading (@1 kHz, 10 mm/s)) and frequency range (10 Hz to 1600 Hz), are appropriate for the intended use. Figure 5 illustrates the placement of the sensor on the conveyor device.
3.2.2. Sensor Set for the Scale Monitoring
The device (Figure 6) has been designed with a similar configuration to that of previous workstation. The objective of the device is to quantify the volume of bulk material delivered to the process. The device comprises two principal components: a material storage tank and a scale with a screw conveyor, powered by a DC motor (BG65X25SI). As with the preceding model, the device is equipped with three sensors for monitoring the material level: two situated in the input reservoir and one for detecting the filling of the outlet pipe. The outlet pipe can also be emptied using air pressure, which is controlled by the outlet in automatic or manual mode. The active components, namely the air control valves, are controlled by a PLC.
The Supplementary Data for monitoring the system status can be classified into two categories in accordance with the particulars of the process. The driving force behind the transfer of the granulate at the inlet and outlet of the workstation is the pressure of the air. The primary component of the PDM is the conveyor drive, which comprises a DC motor and a gear mechanism. It is proposed that the following additional sensors be employed. In the case of sensing the condition of the electric motor, gearbox and bearings, based on literature sources [58], it is proposed that the following parameters be monitored:
- Air pressure;
- Vibrations;
- Gearbox temperature;
- Motor current load.
For the air pressure monitoring, the same sensor as in the previous case, the SPTE-P10R-S4-V-2.5K, is used.
The implementation of vibration sensing in the gear mechanism differs from that observed in the Conveyor FM workplace. A digital MEMS silicon-based microphone [59] that utilizes pulse-density modulation (PDM) signaling is employed as the sensor. This microphone is renowned for its high signal-to-noise ratio, high sensitivity (94 dB SPL @ 1 kHz, -22 dBFS), low power consumption (600 µA), resilience to RF interference, and smooth frequency response [59].
The temperature sensor for the conveyor drive, which is used to monitor the temperature of the gearbox, can be readily addressed through a cost-effective and straightforward approach. The PT100 sensor [60], which has a temperature range of 0°C to 150°C and a measurement precision of ±0.2% F.S., is an ideal solution. Its operational range and accuracy are sufficient for the intended application.
The final parameter to be monitored is the current load. The utilized motor, BG65X25SI [61], is a brushless direct-current (DC) motor with an integrated encoder, capable of transmitting 4096 signals for speed control. From the perspective of electrical consumption monitoring, the following parameters are of particular significance: rated voltage 24 V, maximum current 4 A. To measure current, the SKU086 [62] meter unit is employed. The rationale for selecting this sensor is based on its suitability for the specified current range, I2C bus communication, integrated I2C isolator (CA-IS3020S), and accuracy (0.1% FS, ±1 count) and resolution (0.3 mA).
The air pressure sensor and the temperature sensor are directly connected to the RevPi device on the analog input. The remaining sensors (MEMS microphone and current sensor) are connected due to the technical sensing process using the M5station operator station [63], which is multi-purpose industrial level programmable embedded controller with Espressif ESP32 SOC, integrated Wi-Fi solution, dual core low-power Xtensa® 32-bit LX6 microprocessor. The station runs a service program to capture data in set cycles and preprocess it for fault identification. Communication between the M5Station and RevPi is wireless. The wiring diagram of the sensors is shown in Figure 7.
The air pressure sensor and the temperature sensor are directly connected to the RevPi device on the analog input. The remaining sensors, namely the MEMS microphone and current sensor, are connected using the M5Station device from M5Stack [63], which is a multi-purpose industrial-level programmable embedded controller.
The M5station is equipped with an Espressif ESP32 system-on-chip (SoC), an integrated Wi-Fi solution, and a dual-core low-power Xtensa® 32-bit LX6 microprocessor. The station runs a service program to capture data at set intervals and preprocess it for the identification of faults. Communication between the M5Station and RevPi is wireless.
4. System Proposal
The fundamental tenets of data evaluation are as follows. The data is evaluated on the device in a suitable manner and the resulting processing output is stored on the server. The stored data is accessed by the visualisation subsystem in the initial phase for the purpose of visualising the status in a manner that is intelligible to the operator. Subsequently, in later phases, the data is accessed for the purpose of meeting the PDM needs. The specific form of processing employed is contingent upon the nature of the data being processed. It is acknowledged that the data will be processed in such a way that the output from the sensor EC layer for each parameter will be presented as information in the form of an alert, which will act as a trigger in the logic state. The logical “0” (FALSE) is used to indicate that no problem has been identified. Value logical “1” (TRUE) indicates the potential existence of an issue on a specific device.
The processing method is contingent upon the specific type of parameter being monitored. In light of the necessity to minimise the CPU power required to obtain fault state information from the measured values, the following assumption is made. The initial group comprises the values of , wherein the directly measured quantity is sufficient for the acquisition of fault information. Following transformation, the data is interpreted as an alert trigger directly, preferably without processing. The second group consists of those parameters where the fault can be identified by the EC. In this case, the fault information is processed using a set of rules. Finally, those parameters where the fault information can be identified from the time course of the measured values are processed using a suitable kind of neural network, with an output of logical “0” (FALSE) in case of a no fault detected or logical “1” (TRUE), meaning an identified fault.
All data are processed at the lowest layer in the form of EC using RevPi or, eventually, other smart sensors. The outputs of the individual processes are directly stored on the MQQT broker, which is located within the control server pool. The individual processes store the outputs as a publisher to a prescribed queue. The output visualization application (subscriber) accesses the data on the MQTT, while the visualization is implemented using the NODE-RED framework. A schematic representation of the whole system is shown in the Figure 8.
One advantage of this solution is that it allows for the reduction of the load on the communication infrastructure with respect to sensor data. The default cycle time of the utilized device (RevPi) is less than milliseconds, with a typical value of 8 milliseconds. The analog-to-digital converter (ADC) utilized for data acquisition from the analog input is of the 16-bit wide [56] . When continuous sensing of parameters (especially waveforms of values in the form of time-dependent curves) is employed, the volume of data at a sufficiently high sampling rate is considerable, particularly when one considers the fact that for the entire system dozens of sensors are utilized within the line.
The proposed architectural solution aims to minimise the data flow by processing the data at the sensor level. The processing results are stored exclusively in the form of triggers within the MQTT.
A visualization system implemented in the Node-RED environment [64] is used to display the detected errors. The application (Figure 9) is designed with a user-friendly interface for the operator. The basic screen presents a graphical representation of a simplified diagram of the entire production line. The input data for the application are alerts in the form of triggers stored within each topic on the MQTT server. These alerts are indicated by an alert icon within the basic screen interface.
The principal benefit of employing Node-RED is the straightforwardness with which it can be displayed across disparate devices, solely via a web browser. This obviates the necessity for installing an application on the device. Moreover, in the case of touch screens, the operator is able to directly control the communication interface through touch. Once a device with an identified alert has been selected (by clicking on the alert icon), the operator is then able to view detailed information for each device and analyse the alert in more detail based on which measurement it was generated from. Figure 10 illustrates the the control interface of the Conveyor_FM workplace. The operator can then activate direct control of the device, check the current process data, or open the alert history record. The process control is realised directly by communication on the specific PLC.
5. Practical Experiments
Although the project is implemented in a simplified environment in laboratory conditions, the implementation of the entire system for monitoring the condition of the production line is a highly complex matter with many different procedures. In the initial phase, only two workstations are implemented out of the total of 16 within the production line: Conveyor FM and Scale. This section provides examples of generating alerts based on the values measured by sensors at these parts.
In general, however, implementation practices can be classified into three principal categories. The initial category is the measurement of the temperature of selected elements, wherein the actual measured value or gradient is of primary importance. In this instance, the generation of triggers is conducted in a simplified manner during the initial phase of the project, based solely on the measured temperature of the equipment and the defined gradient. This is done with due consideration of the overall thermal conditions within the laboratory environment. Similarly, the evaluation of the motor load current measurement is addressed in the case of a screw conveyor.
A more complex approach has been taken to identify alerts in the case of air pressure monitoring in the system, whereby accelerometer data and vibration recorded by a MEMS microphone are processed.
In addition to the transportation of the granulate, the primary source of energy for movement in the case of fluidic muscle at the Conveyor FM workstation is air. In this case, the actual value of the measured pressure is not the sole indicator used to identify a fault (leak) in the compressed air piping; rather, a simple EC is implemented in the form of knowledge represented by a condition tree.
Figure 11 illustrates the air pressure waveforms during normal operation in the event of an air line fault associated with a reduced air supply volume in the distribution system. It is evident that with partial duct damage, the actual conveyor function process remains operational, and no errors are detected by the PLC. However, the graph clearly indicates a change in the operating parameters.
As the fluidic muscle operates in regular cycles, the error information is an output from the algorithm for processing pressure over time, rather than a mere measurement taken from the pressure sensor. The employed algorithm must be straightforward to reduce the computational complexity of assessing a potential error in the intake manifold. The following procedure is employed for the purpose of detecting the aforementioned fault.
The fundamental premise is that the air pressure within the pneumatic system, following a duty cycle in normal conditions, will stabilize at the same value as in the previous cycle. In the event of leakage, however, there will be a discrepancy in the values at which the pressure stabilizes. The program-controlled measurement is conducted upon the activation of the vibratory conveyor. Initially, the pressure value at which it stabilizes during the initial phase of the conveyor cycle is recorded, followed by the pressure value at which it stabilizes during the subsequent phase.
Upon activation of the switchboard, the current air pressure is promptly measured and duly recorded in the database. Upon deactivation of the switchboard, a subsequent measurement of the air pressure is conducted, and the recorded values are then subjected to a comparative analysis.
The evaluation process is as follows:
- If the measured air pressures differ from each other by more than 0.01 Mpa, then a fault attribute is stored in the database;
- The values of five consecutive work cycles of the air pressure are compared;
- If an event occurs that five consecutive cycle checks are evaluated as a failure condition, the error trigger on the pressure pipe is set to TRUE and trigger is stored to MQTT topic;
- The application will display "Air leak" error icon on the user interface.
The measured values are stored in the database in the RevPi device for only a brief period. Despite its simplicity, this system is capable of effectively detecting potential leaks in the distribution system.
To identify the appropriate function of the fluidic muscle, the movement of the conveyor is monitored using an accelerometer. The device utilized (Figure 5) measures values in three axes—X/Y/Z, as illustrated in Figure 12.
Given the manner in which the sensor is affixed to the conveyor body, the most significant measurement is that taken along the Y-axis. The data are collected and stored in the database in a synchronous manner with the conveyor duty cycles, undergoing subsequent processing. The objective is to utilize a neural network to ascertain whether the process is continuously operational and the values are within the specified tolerance limits, with an output of "TRUE" or "FALSE" (0/1). The process evaluation is conducted at regular intervals, and the data are separated into patterns that are suitable for processing using the proposed neural network.
Neural networks are widely used as classifiers for image recognition due to their inherent characteristics. There are numerous types of neural networks, and in this case, a multilayer perceptron neural network is employed. This is a feedforward artificial neural network with a backpropagation algorithm for training the network. Such neural networks are commonly utilized to address problems that necessitate supervised learning, as well as research in computational neuroscience and parallel distributed processing and man.
To facilitate the implementation process, the Matlab software was employed for the design and testing of the neural network (NN).
The advantage of this approach is that the computer platform utilized as the hardware is directly supported within the Matlab environment. Furthermore, the programs created and exported from Matlab for Raspberry Pi are fully compatible with used platform and can be directly run.
To minimize the computational demands on the EC, the neural network must be simple and effective. Accordingly, a three-layer neural network was constructed, as shown in Figure 13. The input layer comprises seven neurons, which correspond to patterns derived from the recorded data stream. The network contains one hidden layer of 10 neurons. The entire network is implemented as a two-class classifier, with an output layer comprising a single neuron. The identification of a successful FM stroke in the data pattern is represented by the logic value of the output neuron, which assumes the values "0" or "1".
Following a series of trials conducted within the Metalab environment, it was determined that the scaled conjugate gradient algorithm (TRAINSCG function) yielded the most optimal outcomes in this particular instance (Figure 14).
The technical solution within the EC is as follows: The application for communication with the sensor and data preparation for NN evaluation (splitting to patterns – Figure 15) is running in RevPi and has been written using the Python language. The process of the neural network is isolated, and the resulting output is stored in a MQTT topic and presented in the application as an alert icon, eventually with a green or red color message in a more detailed view.
The data gathering process at the other workplace, which employs a screw conveyor and scale, is analogous to the aforementioned process. It is designed to monitor four parameters: air pressure, temperature, current consumption, and gearbox vibrations.
In this instance, the crucial factor in anticipating potential malfunctions is the discernment of the vibrations captured by the MEMS microphone situated on the gear body. Prior to identifying a potential fault and triggering an alert, it is essential to implement a process whereby the microphone recording is subjected to spectral analysis using a Fourier transform, with the objective of determining the dominant frequencies of the signal. The program for the physical implementation of the measurement and frequency decomposition is implemented in Python and runs within the M5 Station at regular time intervals. It records samples with a duration of one second, a sampling rate of 16 kHz, and a data width of 16 bits. Subsequently, the frequency domains are identified, and the recorded audio is then compared to the stored inspection pattern.
The pattern is shown in Figure 16, located on the left side (Normal Functionality). In the event of the detection of a non-standard frequency within the recorded audio, an alert trigger is generated. It should be noted, however, that this functionality is not yet fully implemented and will be addressed in the subsequent phase of the project.
The remaining data on current consumption and gearbox temperature are merely supplementary in nature and serve only to facilitate the identification of a potential fault. The generation of alerts for these parameters is achieved through the recording of the current value at regular intervals, with subsequent comparison to historical values. As the frequency analysis of the recorded sound increases, so too does the importance of collecting these parameters and identifying anomalous values. It is assumed that the bearing failure identified by isolating the non-standard frequency in the sound recording is related to the increased resistance in the rotation of the mechanism, which in turn causes a rise in temperature and energy consumption in the mechanism.
6. Conclusions
The subject matter addressed in this article is particularly relevant in the current era, given the growing implementation of Industry 4.0 and 5.0 in technical practice. The detection of equipment and production system conditions represents a highly complex domain, largely due to the multitude of technologies employed for the collection and processing of data from production systems. The solution proposed in this paper represents the initial stage of a predictive maintenance system. However, the proposed hardware components and data collection methods for process diagnostics, as well as the principles of fault identification, are applicable not only within the model but also to other components of the production line on which the PDM system is implemented. The proposed methodologies, after adaptation, can be implemented in other systems in real conditions. It is acknowledged that such a solution would require a significant investment in financial and human resources in a real deployment.
The proposed fitness monitoring methods in the solution described in the paper employ current trends, such as machine learning and edge computing. The described algorithms facilitate the detection of an emerging fault. The proposed sensor scheme, data method evaluation in the form of trigger generation, and the MQTT system are applicable as an initial stage towards the implementation of a PDM system.
The objective of this thesis is to develop a system for machine condition monitoring based on edge computing technology. In this study, the fundamental physical variables that are essential for the identification of machine condition have been identified. Moreover, the hardware components necessary for the implementation of the sensor layer, as well as the method of communication between the elements, have been proposed. The primary components outlined in the publication encompass the formulation of a data transformation methodology and the delineation of multiple avenues for acquiring device state information. These are classified according to the type of physical quantity, the method of representation, and their relevance to the monitored process. In the final section, examples of critical state identification using ES and NN technologies are provided, including practical examples and outputs of the implemented experiments. The overall system design combines EC outputs based on sensor layer data, MQTT server, MES, and PDM system using trigger generation, including the creation of an application to visualize the obtained information for the operator.
In addition to the advantages of the proposal, the incorporation of edge computing technology into the implementation framework is a noteworthy benefit. The utilization of EC for data processing enables the direct processing of data at the lowest process level, while the supervisory system interacts with the final outputs of the EC and neural network subsystems. This approach, even with real-time data processing, markedly reduces the burden on the communication infrastructure, lowering the database performance requirements and the load on the PDM system.
It should be noted that this is the initial phase of the project. In subsequent stages, it will be necessary to implement a similar condition monitoring system for all components of the production line and to extend the current sensor and diagnostic system to include the capability of monitoring all parts of this line. The actual implementation process of the resulting PDM system will be the subject of further research in the future. However, it can be stated that the experimental solution described in the paper is able to identify an emerging fault on a device within the monitored system. The disadvantage is that it is designed directly for a specific device. The disadvantage is that it is designed directly for a specific device. However, this is understandable, as it is not feasible to implement a solution that is completely universal; however, the principles elaborated in the paper can be applied to other systems after a small modification.
Author Contributions
The conceptualization of work, I.H. and L.H.; methodology, P.T.; proposal validation, P.V. and P.T.; formal analysis, I.H.; investigation, I.H.; resources, I.H.; writing—original draft preparation, I.H and L.H.; writing—review and editing, I.H.; visualization, L.H.; supervision, P.V.; project administration and funding acquisition, I.H.. All authors have read and agreed to the published version of the manuscript.
Funding
This research was funded by the Scientific Grant Agency of the Ministry of Education, Science, Research and Sport of the Slovak Republic and the Slovak Academy of Sciences, grant number VEGA 1/0193/22, “Proposal of identification and monitoring of production equipment parameters for the needs of predictive maintenance in accordance with the concept of Industry 4.0 using Industrial IoT technologies.”.
Conflicts of Interest
The authors declare no conflicts of interest. The funders had no role in the design of the study; in the collection, analyses, or interpretation of data; in the writing of the manuscript; or in the decision to publish the results.
References
- Murtaza, A.A.; Saher, A.; Zafar, M.H.; Moosavi, S.K.R.; Aftab, M.F.; Sanfilippo, F. Paradigm shift for predictive maintenance and condition monitoring from Industry 4.0 to Industry 5.0: A systematic review, challenges and case study. Results Eng. 2024, 24, 102935. [Google Scholar] [CrossRef]
- Moosavi, S.; Farajzadeh-Zanjani, M.; Razavi-Far, R.; Palade, V.; Saif, M. Explainable AI in Manufacturing and Industrial Cyber–Physical Systems: A Survey. Electronics 2024, 13, 3497. [Google Scholar] [CrossRef]
- Levitt, J. Complete Guide to Preventive and Predictive Maintenance. In Complete Guide to Preventive and Predictive Maintenance, 2nd ed.; Industrial Press, 2012; ISBN 978-1-61344-573-0. [Google Scholar]
- Boyun, G.; Shanhong, S.; Ghalambor, A.; Tian, R.L. Offshore Pipelines - Design, Installation, and Maintenance, 2nd ed.; Elsevier, 2014; ISBN 978-0-12-398492-0. [Google Scholar]
- Wang, L.; Chen, Y.; Zhao, X.; Xiang, J. Predictive Maintenance Scheduling for Aircraft Engines Based On Remaining Useful Life Prediction. IEEE Internet Things J. 2024, 23020–23021. [Google Scholar] [CrossRef]
- Wang, Z.-Z.; Chen, Y.-X.; Cai, Z.-Y.; Xiang, H.-C.; Chang, Z. Equipment Maintenance Decision Model Based on Degradation Data and Failure Data. 2019 International Conference on Quality, Reliability, Risk, Maintenance, and Safety Engineering (QR2MSE), Zhangjiajie, China, 2019; pp. 237–242. [Google Scholar] [CrossRef]
- Francis, F.; Mohan, M. ARIMA Model based Real Time Trend Analysis for Predictive Maintenance. 2019 3rd International conference on Electronics, Communication and Aerospace Technology (ICECA), Coimbatore, India, 2019; pp. 735–739. [Google Scholar] [CrossRef]
- Ehrig, L.; Atzberger, D.; Hagedorn, B.; Klimke, J.; Dollner, J. Customizable Asymmetric Loss Functions for Machine Learning-based Predictive Maintenance. 2020 8th International Conference on Condition Monitoring and Diagnosis (CMD), Phuket, Thailand, 2020; pp. 250–253. [Google Scholar] [CrossRef]
- Cachada, A.; Moreira, P.M.; Romero, L.; Barbosa, J.; Leitno, P.; Gcraldcs, C.A.S.; Deusdado, L.; Costa, J.; Teixeira, C.; Teixeira, J.; et al. Maintenance 4.0: Intelligent and Predictive Maintenance System Architecture. 2018 IEEE 23rd International Conference on Emerging Technologies and Factory Automation (ETFA); 2018; pp. 139–146. [Google Scholar] [CrossRef]
- Campos, J.; Sharma, P.; Albano, M.; Ferreira, L.L.; Larrañaga, M. An Open Source Framework Approach to Support Condition Monitoring and Maintenance. Appl. Sci. 2020, 10, 6360. [Google Scholar] [CrossRef]
- MIMOSA OSA-CBM. Open System Architecture for Condition-Based Maintenance. Available online: www.mimosa.org/mimosa-osa-cbm/ (accessed on 10 October 2024).
- Bousdekis, A.; Apostolou, D.; Mentzas, G. Predictive Maintenance in the 4th Industrial Revolution: Benefits, Business Opportunities, and Managerial Implications. IEEE Eng. Manag. Rev. 2020, 48, 57–62. [Google Scholar] [CrossRef]
- Zio, E. Prognostics and Health Management (PHM): Where are we and where do we (need to) go in theory and practice. Reliab. Eng. Syst. Saf. 2022, 218, 108119. [Google Scholar] [CrossRef]
- Bora, D.; Singh, D.; Negi, B. Utilization of DS18B20 Temperature Sensor for Predictive Maintenance of Reciprocating Compressor. 2023 International Conference on Power Energy, Environment & Intelligent Control (PEEIC), Greater Noida, India, 2023; pp. 147–150. [Google Scholar] [CrossRef]
- Yang, Z.; Liu, B.; Zhang, Y.; Chen, Y.; Zhao, H.; Zhang, G.; Yi, W.; Zhang, Z. Intelligent Sensing of Thermal Error of CNC Machine Tool Spindle Based on Multi-Source Information Fusion. Sensors 2024, 24, 3614. [Google Scholar] [CrossRef]
- Krawczyk, S.; Szuba, M. Utilizing Simulation to Enhance Predictive Maintenance in Power Rails of Switch Gears by Analyzing Temperature Changes Under Varying Current Loads. 2023 Progress in Applied Electrical Engineering (PAEE), Koscielisko, Poland, 2023; pp. 1–4. [Google Scholar] [CrossRef]
- Muneeshwari, P.; Suguna, R.; Valantina, G.M.; Sasikala, M.; Lakshmi, D. IoT-Driven Predictive Maintenance in Industrial Settings through a Data Analytics Lens. 2024 International Conference on Trends in Quantum Computing and Emerging Business Technologies, Pune, India, 2024; pp. 1–5. [Google Scholar] [CrossRef]
- Dai, S.; Zhang, X.; Luo, M. A Novel Data-Driven Approach for Predicting the Performance Degradation of a Gas Turbine. Energies 2024, 17, 781. [Google Scholar] [CrossRef]
- Mujib, A.; Djatna, T. Ensemble Learning for Predictive Maintenance on Wafer Stick Machine Using IoT Sensor Data. 2020 International Conference on Computer Science and Its Application in Agriculture (ICOSICA), Bogor, Indonesia, 2020; pp. 1–5. [Google Scholar] [CrossRef]
- Yun, J.; Kim, S.; Kim, J. Digital Twin Technology in the Gas Industry: A Comparative Simulation Study. Sustainability 2024, 16, 5864. [Google Scholar] [CrossRef]
- Kumar, S.D.V.; Kai, M.L.Y.; Arumugam, T.; Karuppanan, S. A Review of Finite Element Analysis and Artificial Neural Networks as Failure Pressure Prediction Tools for Corroded Pipelines. Materials 2021, 14, 6135. [Google Scholar] [CrossRef]
- Yuan, M.; Zhang, S.; Yang, P.; Deng, Y. Deep Learning-Based Predictive Maintenance Model for Air Cylinder in Manufacturing Systems. 2023 5th International Conference on Robotics, Intelligent Control and Artificial Intelligence (RICAI), Hangzhou, China, 2023; pp. 625–629. [Google Scholar] [CrossRef]
- Liang, K.; Zhao, H.; Wang, F.; Fang, Y. Design and application of pressure monitoring system of compressed air station based on LoRa wireless networking technology. 2023 4th International Conference on Computer Engineering and Intelligent Control (ICCEIC), Guangzhou, China, 2023; pp. 550–554. [Google Scholar] [CrossRef]
- Ahmad, B.; Mishra, B.K.; Ghufran, M.; Pervez, Z.; Ramzan, N. Intelligent Predictive Maintenance Model for Rolling Components of a Machine based on Speed and Vibration. 2021 International Conference on Artificial Intelligence in Information and Communication (ICAIIC), Jeju Island, Korea (South), 2021; pp. 459–464. [Google Scholar] [CrossRef]
- Cakir, M.; Guvenc, M.A.; Mistikoglu, S. The experimental application of popular machine learning algorithms on predictive maintenance and the design of IIoT based condition monitoring system. Comput. Ind. Eng. 2021, 151, 106948. [Google Scholar] [CrossRef]
- Mohan, T.R.; Roselyn, J.P.; Uthra, R.A.; Devaraj, D.; Umachandran, K. Intelligent machine learning based total productive maintenance approach for achieving zero downtime in industrial machinery. Computers & Industrial Engineering 2021, 157, 107267. [Google Scholar] [CrossRef]
- Mafla-Yépez, C.; Castejon, C.; Rubio, H.; Morales, C. A Vibration Analysis for the Evaluation of Fuel Rail Pressure and Mass Air Flow Sensors on a Diesel Engine: Strategies for Predictive Maintenance. Sensors 2024, 24, 1551. [Google Scholar] [CrossRef] [PubMed]
- Coelho, D.; Costa, D.; Rocha, E.M.; Almeida, D.; Santos, J.P. Predictive maintenance on sensorized stamping presses by time series segmentation, anomaly detection, and classification algorithms. Procedia Comput. Sci. 2022, 200, 1184–1193. [Google Scholar] [CrossRef]
- Nappi, S.; Amendola, S.; Ramacciotti, M.; Zambonini, E.; D'Uva, N.; Camera, F.; Miozzi, C.; Occhiuzzi, C.; Marrocco, G. RFID based Predictive Maintenance System for Chemical Industry. 2021 IEEE International Workshop on Metrology for Industry 4.0 & IoT (MetroInd4.0&IoT), Rome, Italy, 2021; pp. 654–658. [Google Scholar] [CrossRef]
- Yang, G.; Tao, H.; Du, R.; Zhong, Y. Wear Prediction of Petrochemical Granulator Gearbox Using Multiscale Temporal Convolutional Network via Online Oil Monitoring. 2023 IEEE International Instrumentation and Measurement Technology Conference (I2MTC), Kuala Lumpur, Malaysia, 2023; pp. 1–6. [Google Scholar] [CrossRef]
- Crooks, K.; Plawecki, N. Novel Approach to CBM+ Implementation on Aviation Systems. 2021 Annual Reliability and Maintainability Symposium (RAMS), Orlando, FL, USA, 2021; pp. 1–6. [Google Scholar] [CrossRef]
- Lv, S.; Sun, W.; Wang, H. Aircraft Fault Diagnosis and Prediction Algorithm Based on Deep Learning and Markov Model. 2024 3rd International Conference on Artificial Intelligence and Autonomous Robot Systems (AIARS), Bristol, United Kingdom, 2024; pp. 427–432. [Google Scholar] [CrossRef]
- Vasileska, E.; Argilovski, A.; Tomov, M.; Jovanoski, B.; Gecevska, V. Implementation of Machine Learning for Enhancing Lean Manufacturing Practices for Metal Additive Manufacturing. IEEE Trans. Eng. Manag. 2024, 71, 14836–14845. [Google Scholar] [CrossRef]
- Sampedro, G.A.; Putra, M.A.P.; Lee, J.-M.; Kim, D.-S. Industrial Internet of Things-Based Fault Mitigation for Smart Additive Manufacturing Using Multi-Flow BiLSTM. IEEE Access 2023, 11, 99130–99142. [Google Scholar] [CrossRef]
- Shah, S.S.; Daoliang, T.; Kumar, S.C. RUL forecasting for wind turbine predictive maintenance based on deep learning. Heliyon 2024. [Google Scholar] [CrossRef]
- Grunwald, S.; Murad, M.O.F.; Farrington, S.; Wallace, W.; Rooney, D. Multi-Sensor Soil Probe and Machine Learning Modeling for Predicting Soil Properties. Sensors 2024, 24, 6855. [Google Scholar] [CrossRef]
- Ruiz-Gonzalez, A.; Kempson, H.; Haseloff, J. Development of a Low-Cost Sensor System for Accurate Soil Assessment and Biological Activity Profiling. Micromachines 2024, 15, 1293. [Google Scholar] [CrossRef]
- Sharma, K.L.S. Overview of Industrial Process Automation, 2nd ed.; Elsevier, 2017; ISBN 978-0-12-809303-0. [Google Scholar]
- Mohammadi, M.; Al-Fuqaha, A.; Sorour, S.; Guizani, M. Deep Learning for IoT Big Data and Streaming Analytics: A Survey. IEEE Commun. Surv. Tutorials 2018, 20, 2923–2960. [Google Scholar] [CrossRef]
- Kolokas, A.; Mallioris, P.; Koutsiantzis, M.; Bialas, C.; Bechtsis, D.; Diamantis, E. Effective Machine Learning Solution for State Classification and Productivity Identification: Case of Pneumatic Pressing Machine. Machines 2024, 12, 762. [Google Scholar] [CrossRef]
- Salvendy, G.; Karwowski, W. Handbook of Human Factors and Ergonomics, 6.4.2.2 Machine Learning-Based Decision Support, 5th ed.; John Wiley & Sons, 2021; p. 187. ISBN 978-1-5231-4349-8. [Google Scholar]
- Lu, H.; Cao, W.; Huang, Z.; Chen, S.; Shen, M.; Chen, L.; Sun, S. The Fault Diagnosis System for Constant Wind Speed Control Device based on Expert System. 2022 IEEE International Conference on Advances in Electrical Engineering and Computer Applications (AEECA), Dalian, China, 2022; pp. 1400–1404. [Google Scholar] [CrossRef]
- Rojek, I.; Kopowski, J.; Lewandowski, J.; Mikołajewski, D. Use of Machine Learning to Improve Additive Manufacturing Processes. Appl. Sci. 2024, 14, 6730. [Google Scholar] [CrossRef]
- Wang, D.; Al-Rubaie, A.; Stincic, S.; Davies, J.; Aljasmi, A. Data-Driven Anomaly Detection Based on Multi-Sensor Data Fusion. 2021 International Conference on Smart Applications, Communications and Networking (SmartNets), Glasgow, United Kingdom, 2021; pp. 1–8. [Google Scholar] [CrossRef]
- Zhang, D.; Hao, J.; Chen, L.; Zhou, L. Fault Diagnosis Approach for Pneumatic Control Valves Based on Modified Expert System. 2020 19th International Symposium on Distributed Computing and Applications for Business Engineering and Science (DCABES), Xuzhou, China, 2020; pp. 104–107. [Google Scholar] [CrossRef]
- Yang, X.; Zhu, C. Industrial Expert Systems Review: A Comprehensive Analysis of Typical Applications. IEEE Access 2024, 12, 88558–88584. [Google Scholar] [CrossRef]
- Vasavi, S.; Aswarth, K.; Pavan, T.S.D.; Gokhale, A.A. Predictive analytics as a service for vehicle health monitoring using edge computing and AK-NN algorithm. Mater. Today: Proc. 2021, 46, 8645–8654. [Google Scholar] [CrossRef]
- Hossain, D.; Sultana, T.; Akhter, S.; Hossain, I.; Thu, N.T.; Huynh, L.N.; Lee, G.-W.; Huh, E.-N. The role of microservice approach in edge computing: Opportunities, challenges, and research directions. ICT Express 2023, 9, 1162–1182. [Google Scholar] [CrossRef]
- Hu, P.; Chu, X.; Lv, L.; Zuo, K.; Ni, T.; Wang, T.; Shen, Z. An efficient and secure data collection scheme for predictive maintenance of vehicles. Ad Hoc Networks 2023, 146, 103157. [Google Scholar] [CrossRef]
- Oliveira, F.; Costa, D.G.; Assis, F.; Silva, I. Internet of Intelligent Things: A convergence of embedded systems, edge computing and machine learning. Internet of Things 2024, 26, 101153. [Google Scholar] [CrossRef]
- Wang, Y.; Wu, J.; Yu, Z.; Hu, J.; Zhou, Q. A structurally re-parameterized convolution neural network-based method for gearbox fault diagnosis in edge computing scenarios. Eng. Appl. Artif. Intell. 2023, 126, 107091. [Google Scholar] [CrossRef]
- Sok, R.; Jeyamoorthy, A.; Kusaka, J. Novel virtual sensors development based on machine learning combined with convolutional neural-network image processing-translation for feedback control systems of internal combustion engines. Appl. Energy 2024, 365, 123224. [Google Scholar] [CrossRef]
- Long, Q. Investigation on big data evaluation and visualization of internet of things based on edge computing. Meas. Sensors 2024, 33, 101177. [Google Scholar] [CrossRef]
- Xiao, H.; Hu, W.; Liu, G.; Zhou, H. Edge computing-based unified condition monitoring system for process manufacturing. Comput. Ind. Eng. 2023, 177, 109032. [Google Scholar] [CrossRef]
- AVEVA Group. Available online: https://www.aveva.com/en/products/manufacturing-execution-system (accessed on 10 August 2024).
- The Revolution Pi module documentation, Available online:. Available online: https://revolutionpi.com/wp-content/uploads/manuell/revolution-pi-booklet.pdf. (accessed on 21 April 2024).
- Festo SE & Co. KG, “Operating instructions SPTE-EN”. 2024. Available online: https://www.festo.com/assets/attachment/en /659713. (accessed on 21 October 2024).
- Khandelwal, V.; Ramtekkar, P.; Chauhan, M.; Bhute, Y.; Kouthekar, R. Sensor Based Vibration Analysis of Motor Using MATLAB Software. 2022 10th International Conference on Emerging Trends in Engineering and Technology - Signal and Information Processing (ICETET-SIP-22), Nagpur, India, 2022; pp. 1–4. [Google Scholar] [CrossRef]
- PDM unit SKU089. Available online: https://docs.m5stack.com/en/unit/pdm (accessed on 1 April 2024).
- Temperature sensor PT100 speciffication. Available online: https://www.radar-leveltransmitter.com/sale-18495373-blue-rtd-temperature-transmitter-sensor-pt100-polypropylene-0-5v-4-5v.html (accessed on 21 April 2024).
- BG65X25SI speciffication. Available online: https://www.dunkermotoren.com/en/knowledge/technical-information (accessed on 1 April 2024).
- M5STack SKU086 unit speciffication. Available online: https://docs.m5stack.com/en/unit/Ameter%20Unit (accessed on 1 October 2024).
- M5Stack Sation K-124B. Available online: https://docs.m5stack.com/en/core/station_bat (accessed on 1 October 2024).
- OpenJS Foundation & Contributors, “Node-RED documentation”. Available online: https://nodered.org/docs/user-guide (accessed on 1 October 2024).
Figure 1.
The production line in laboratory environment.
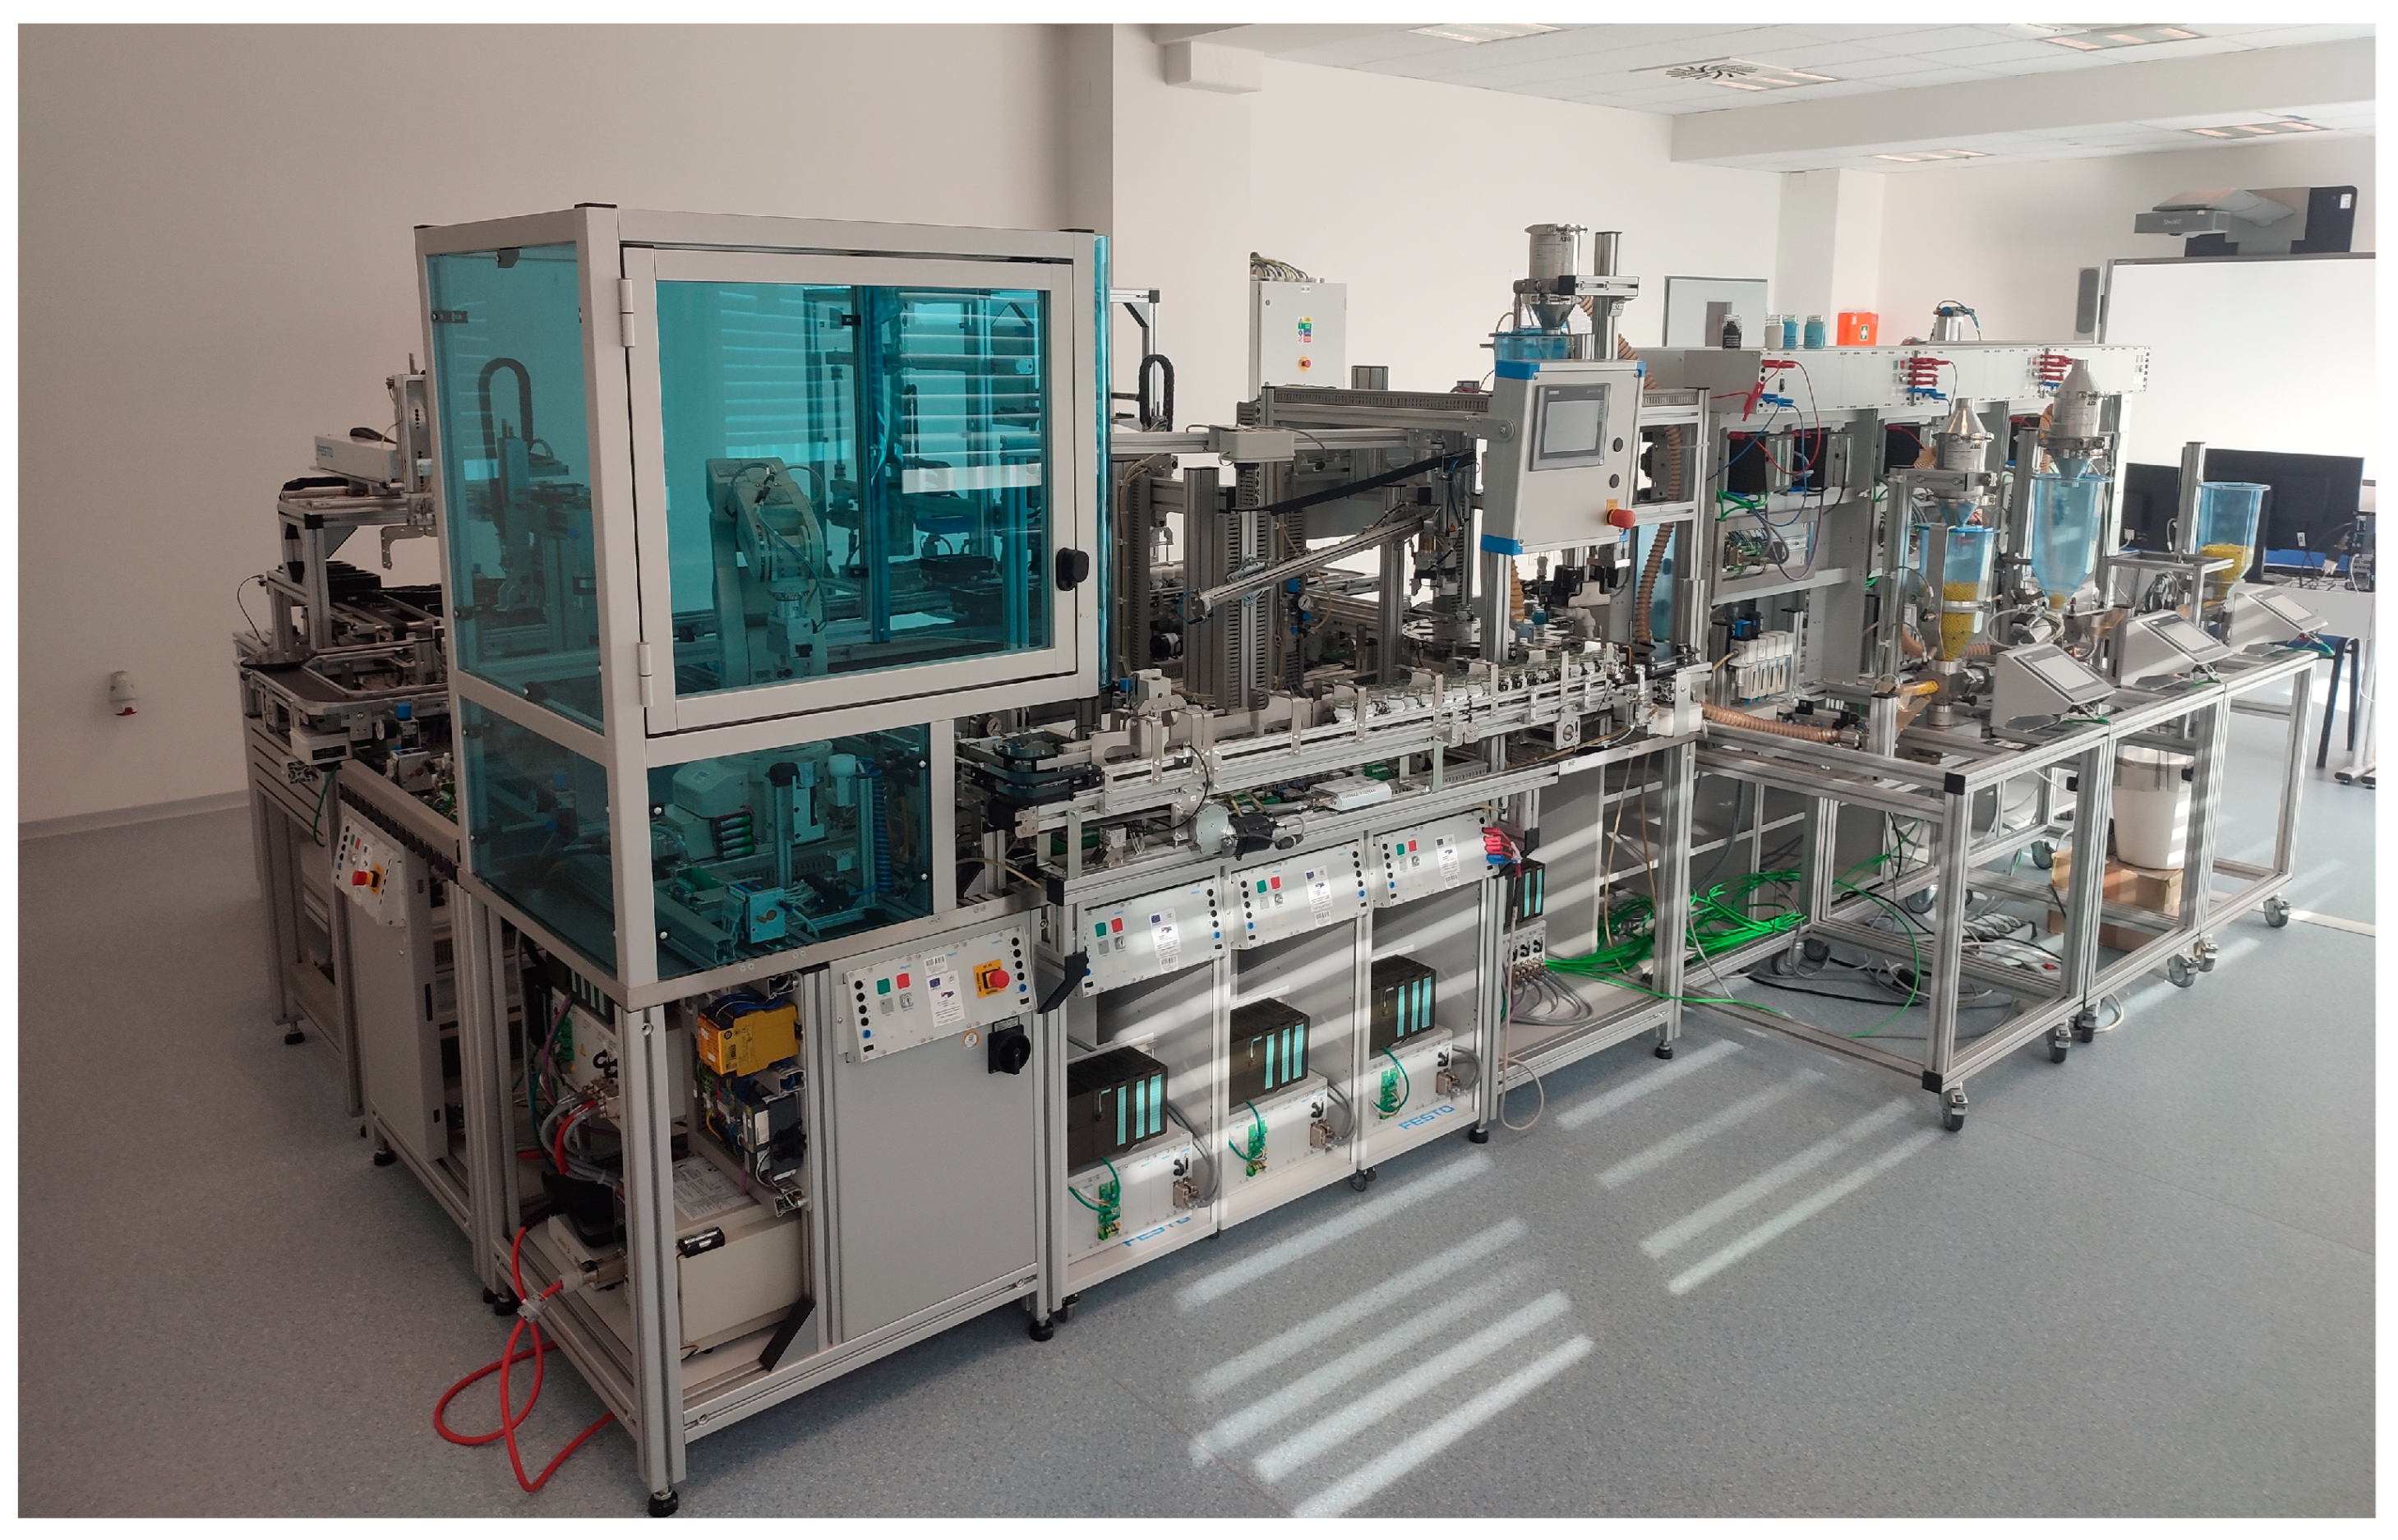
Figure 2.
Schematic representation of the production line.
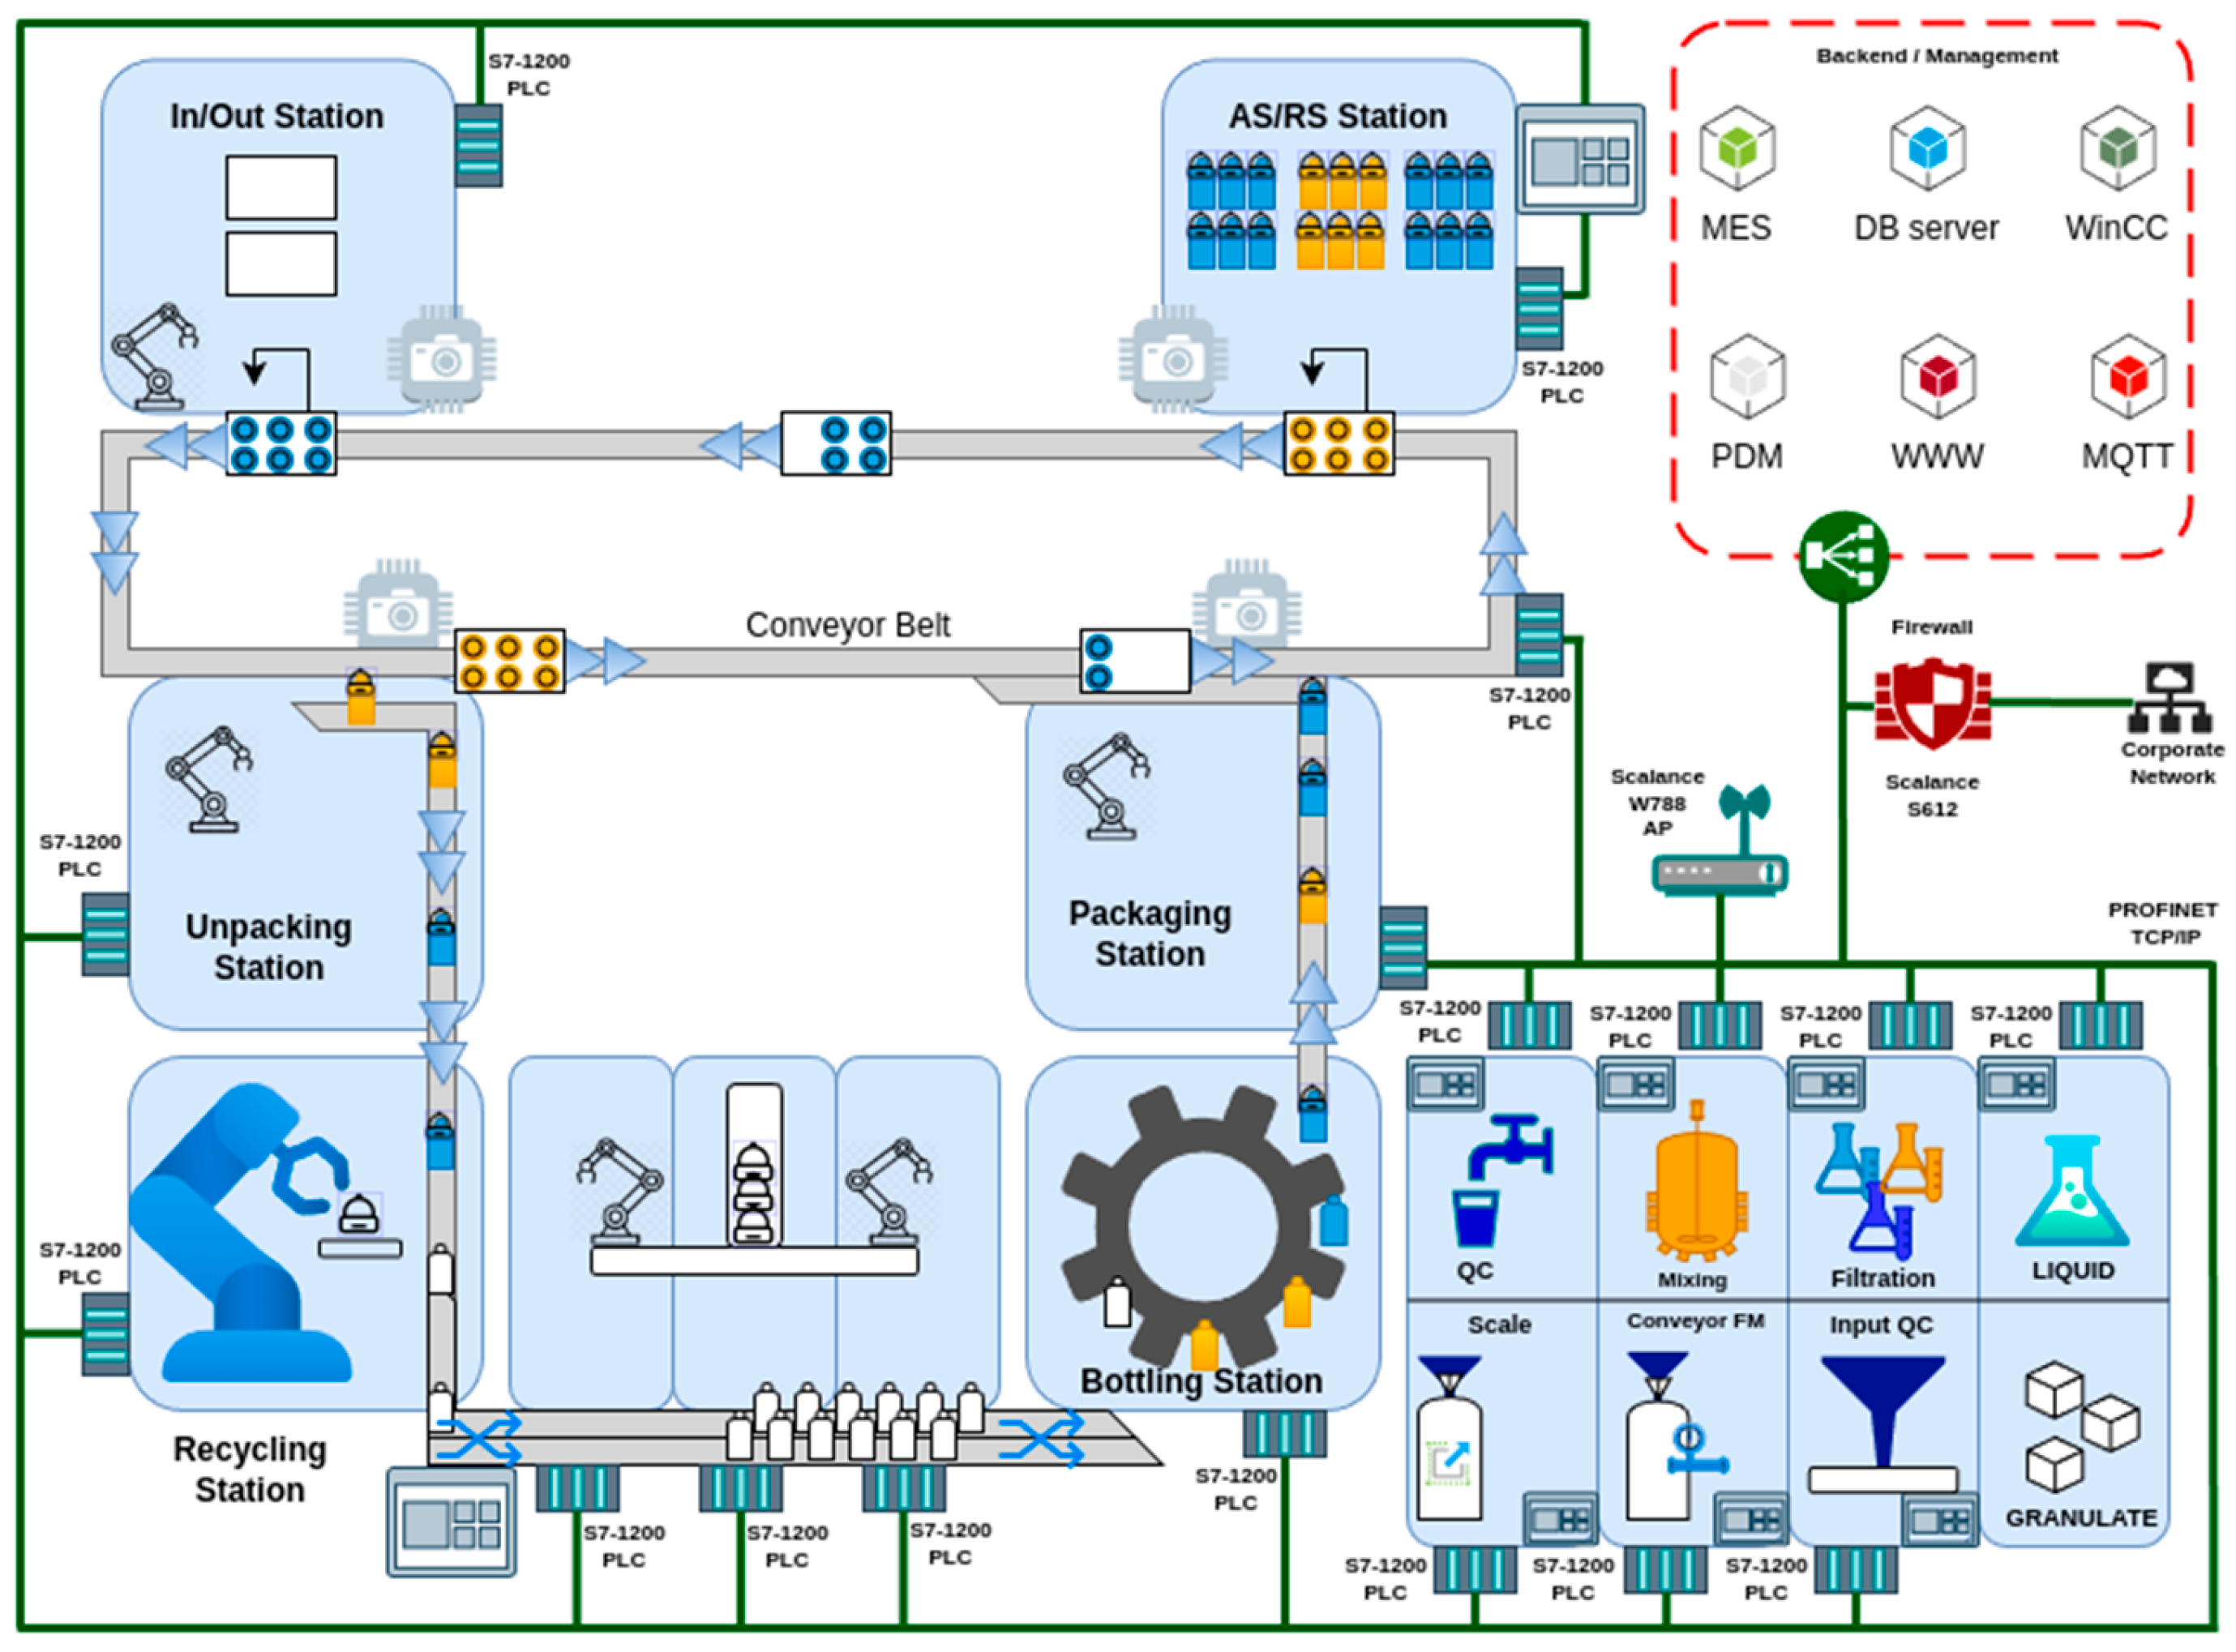
Figure 3.
Specification of the location of the equipment used.
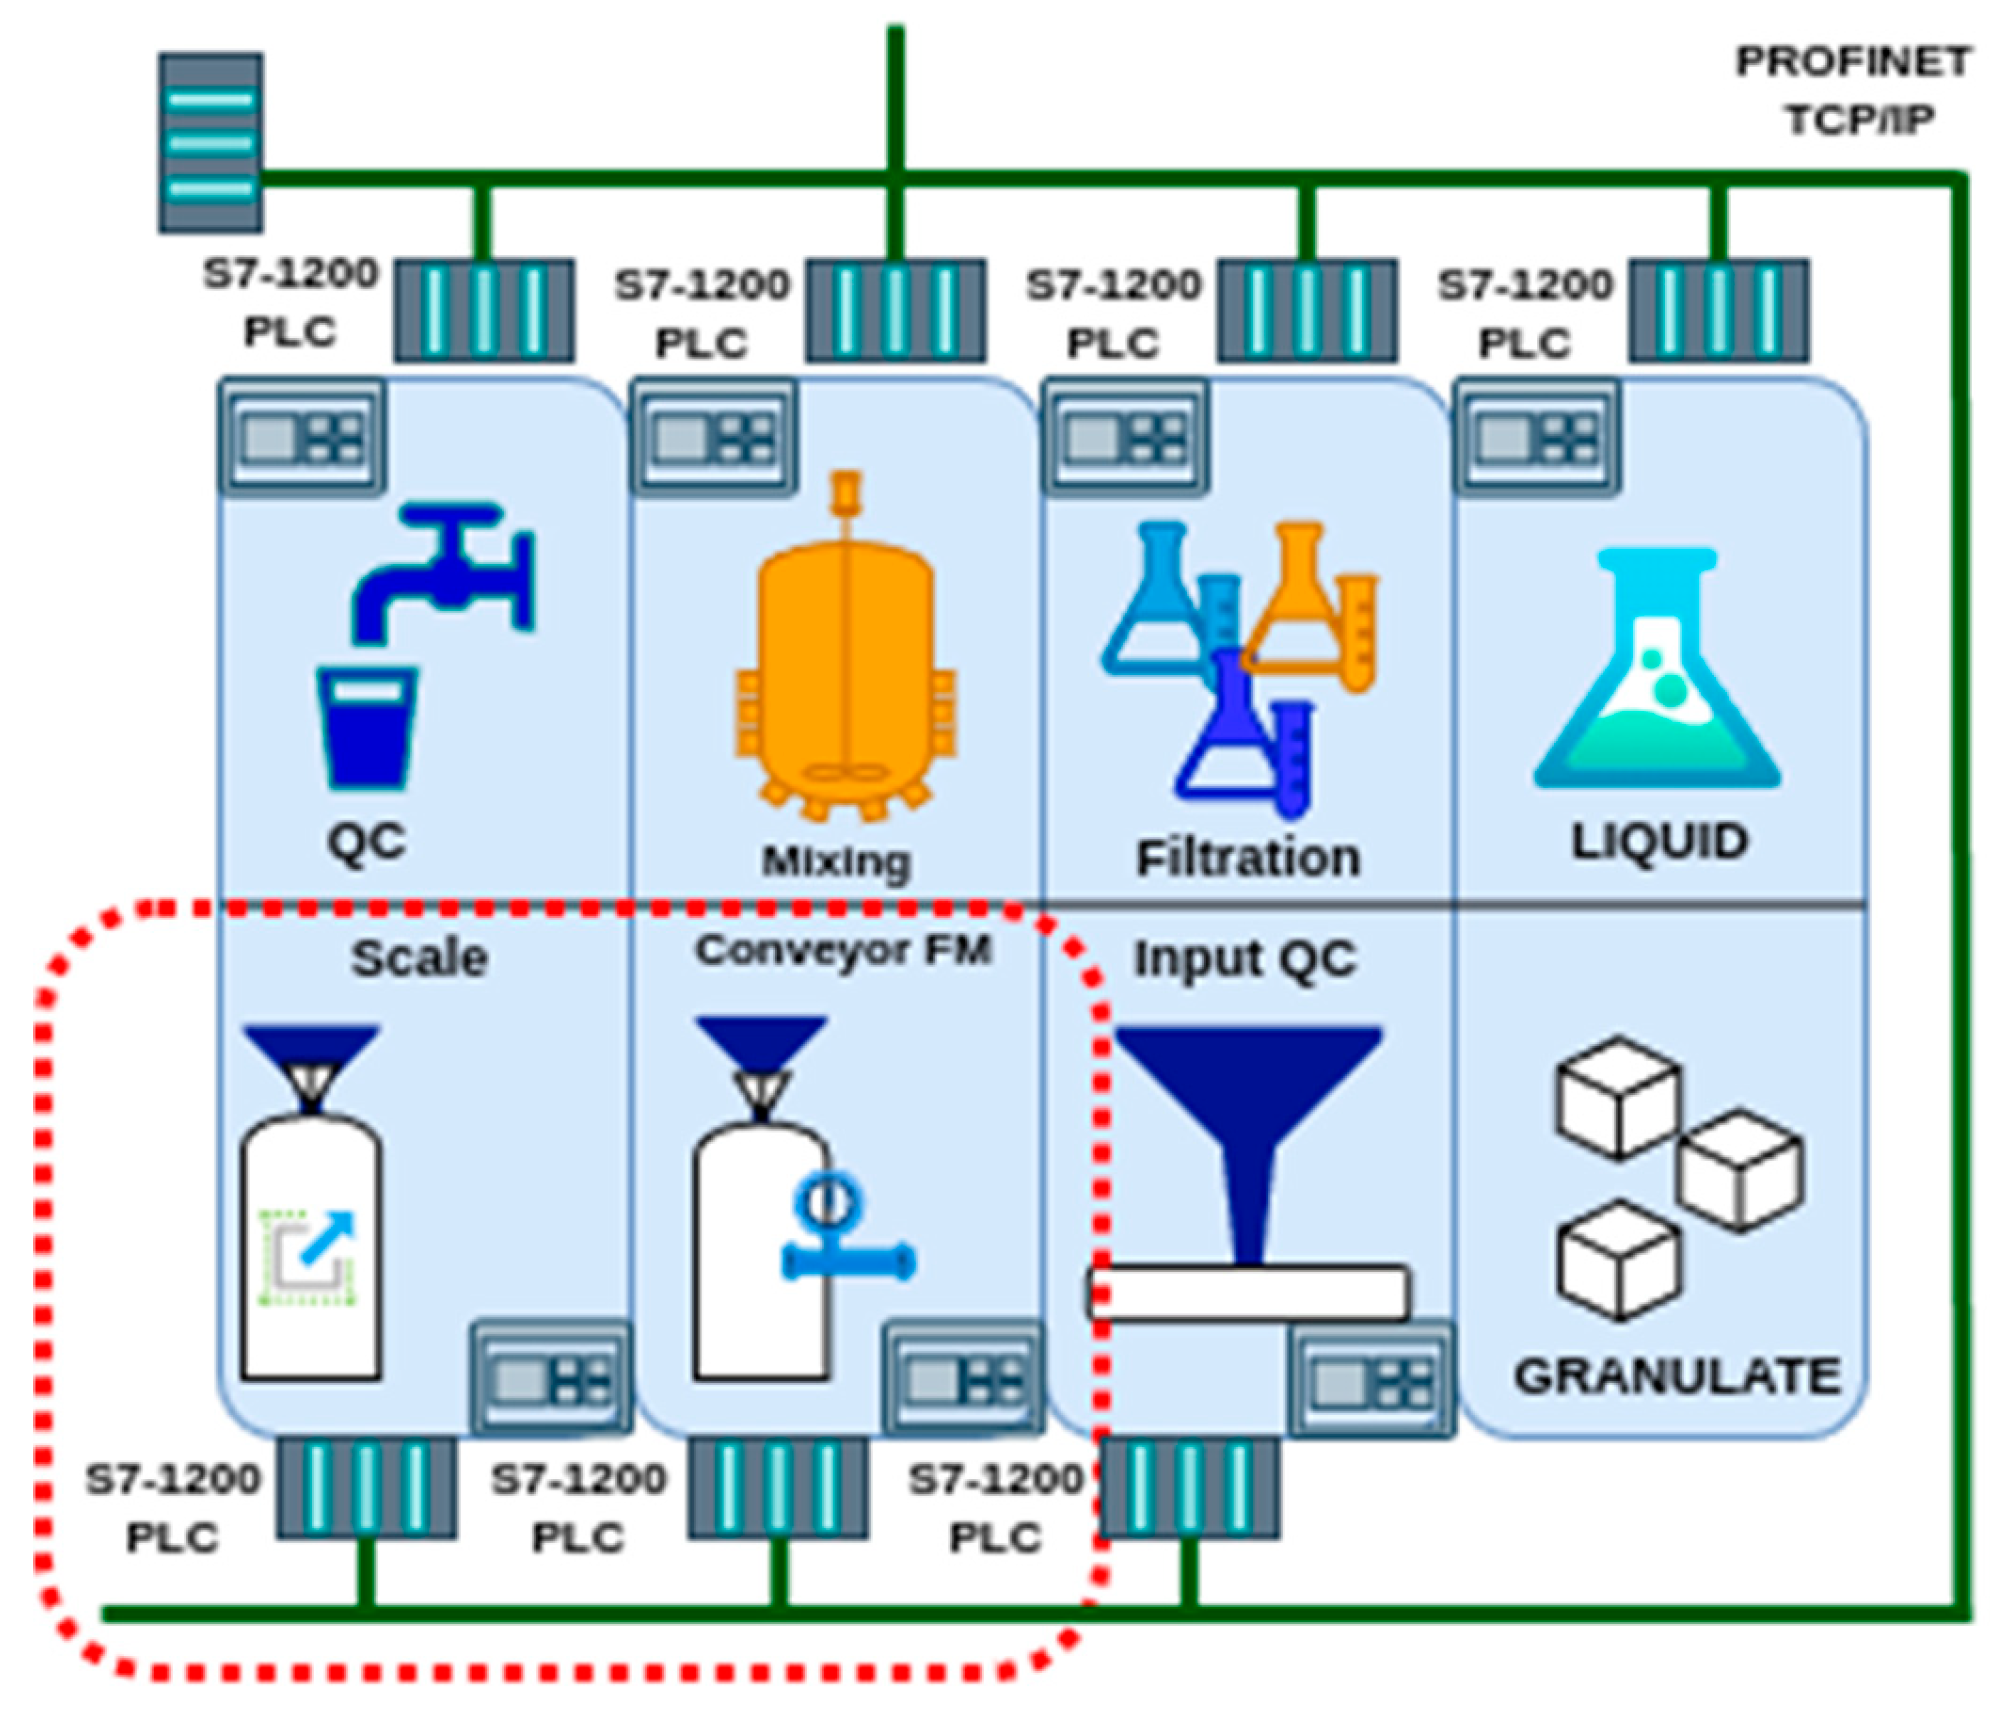
Figure 4.
Detail of the device used to control the collection of data.
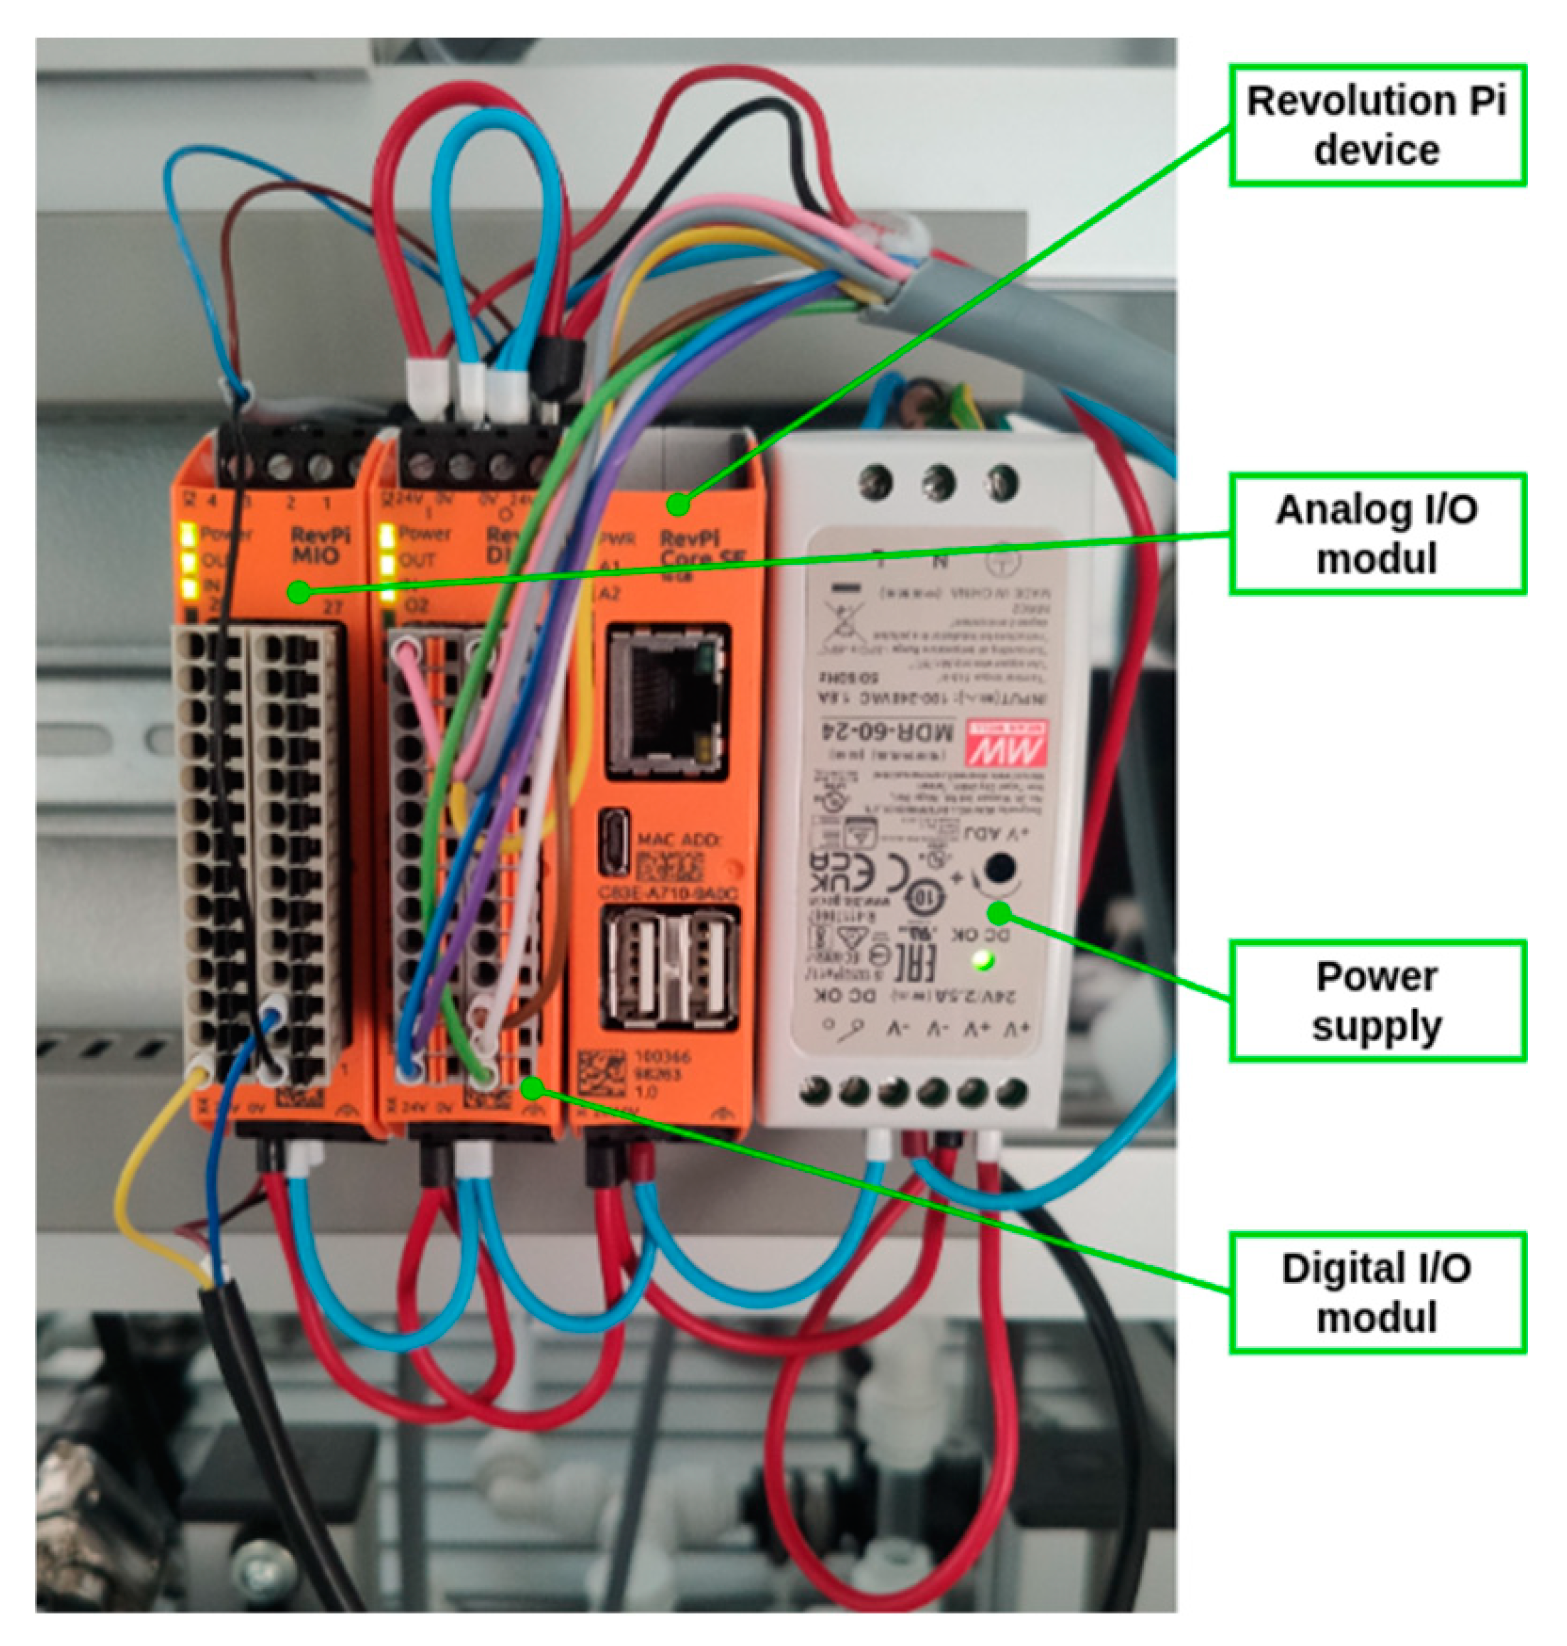
Figure 5.
Description of the Conveyor_FM workplace.
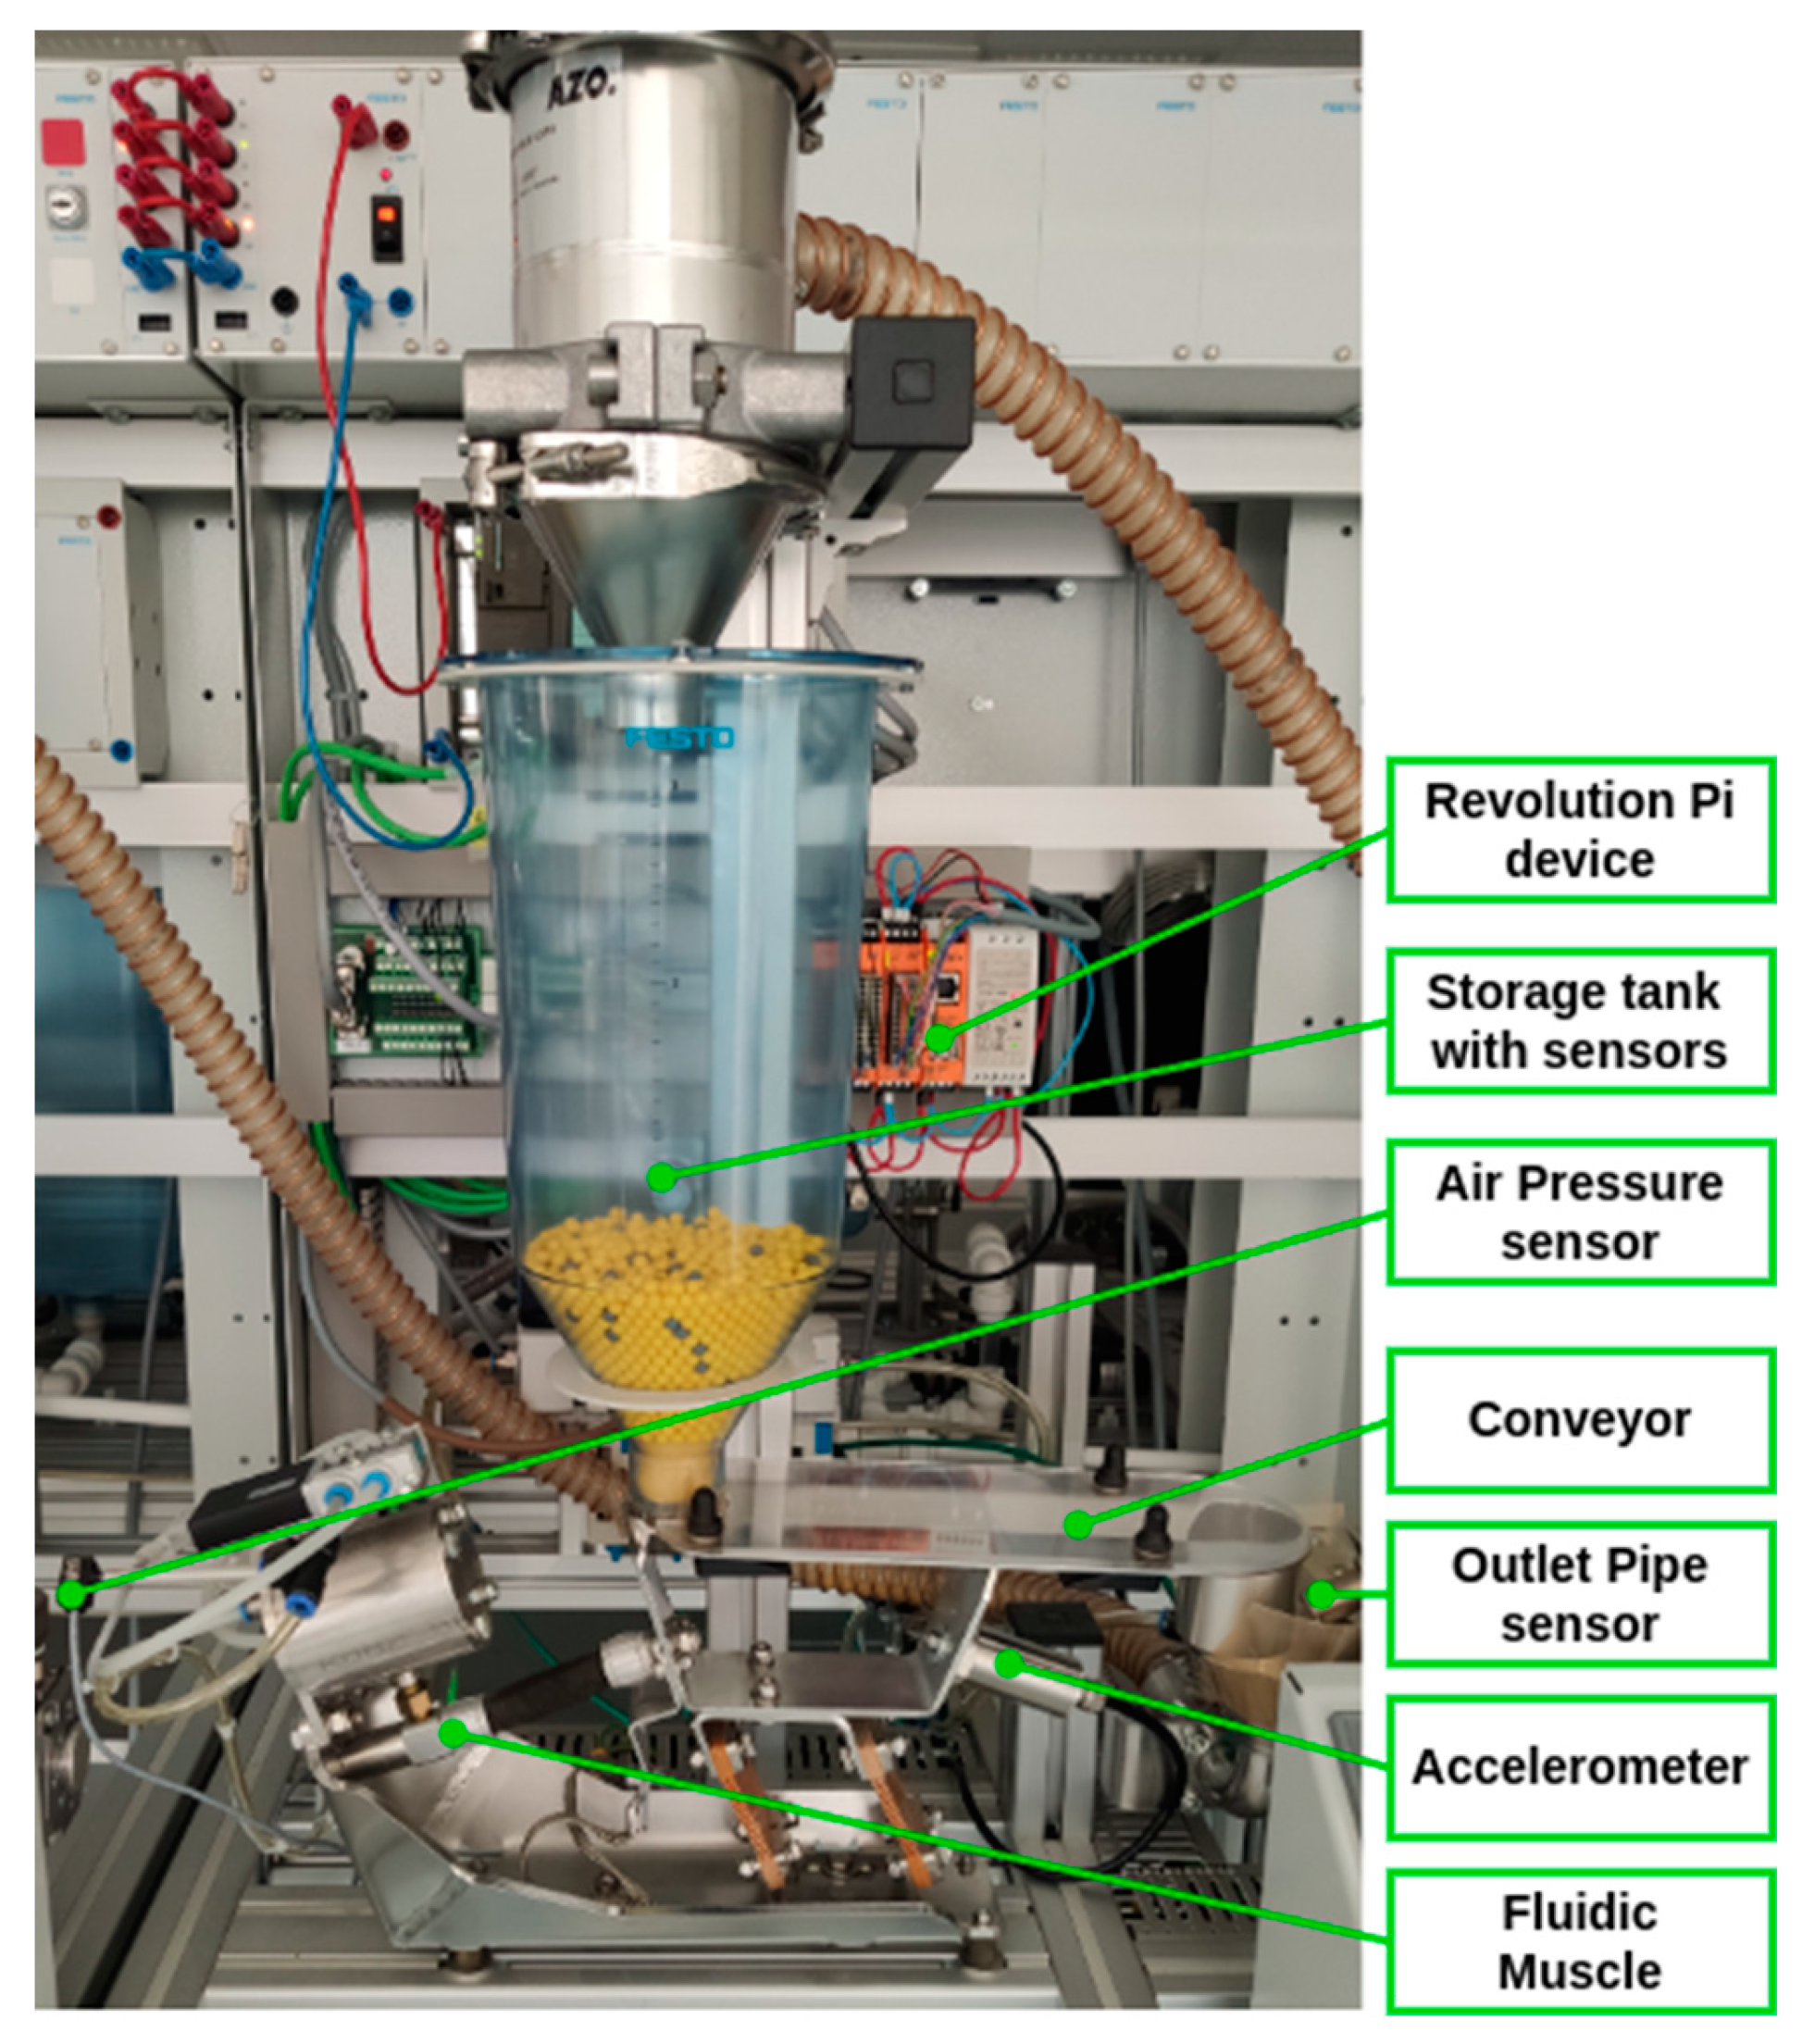
Figure 6.
Description of the Scale workplace.
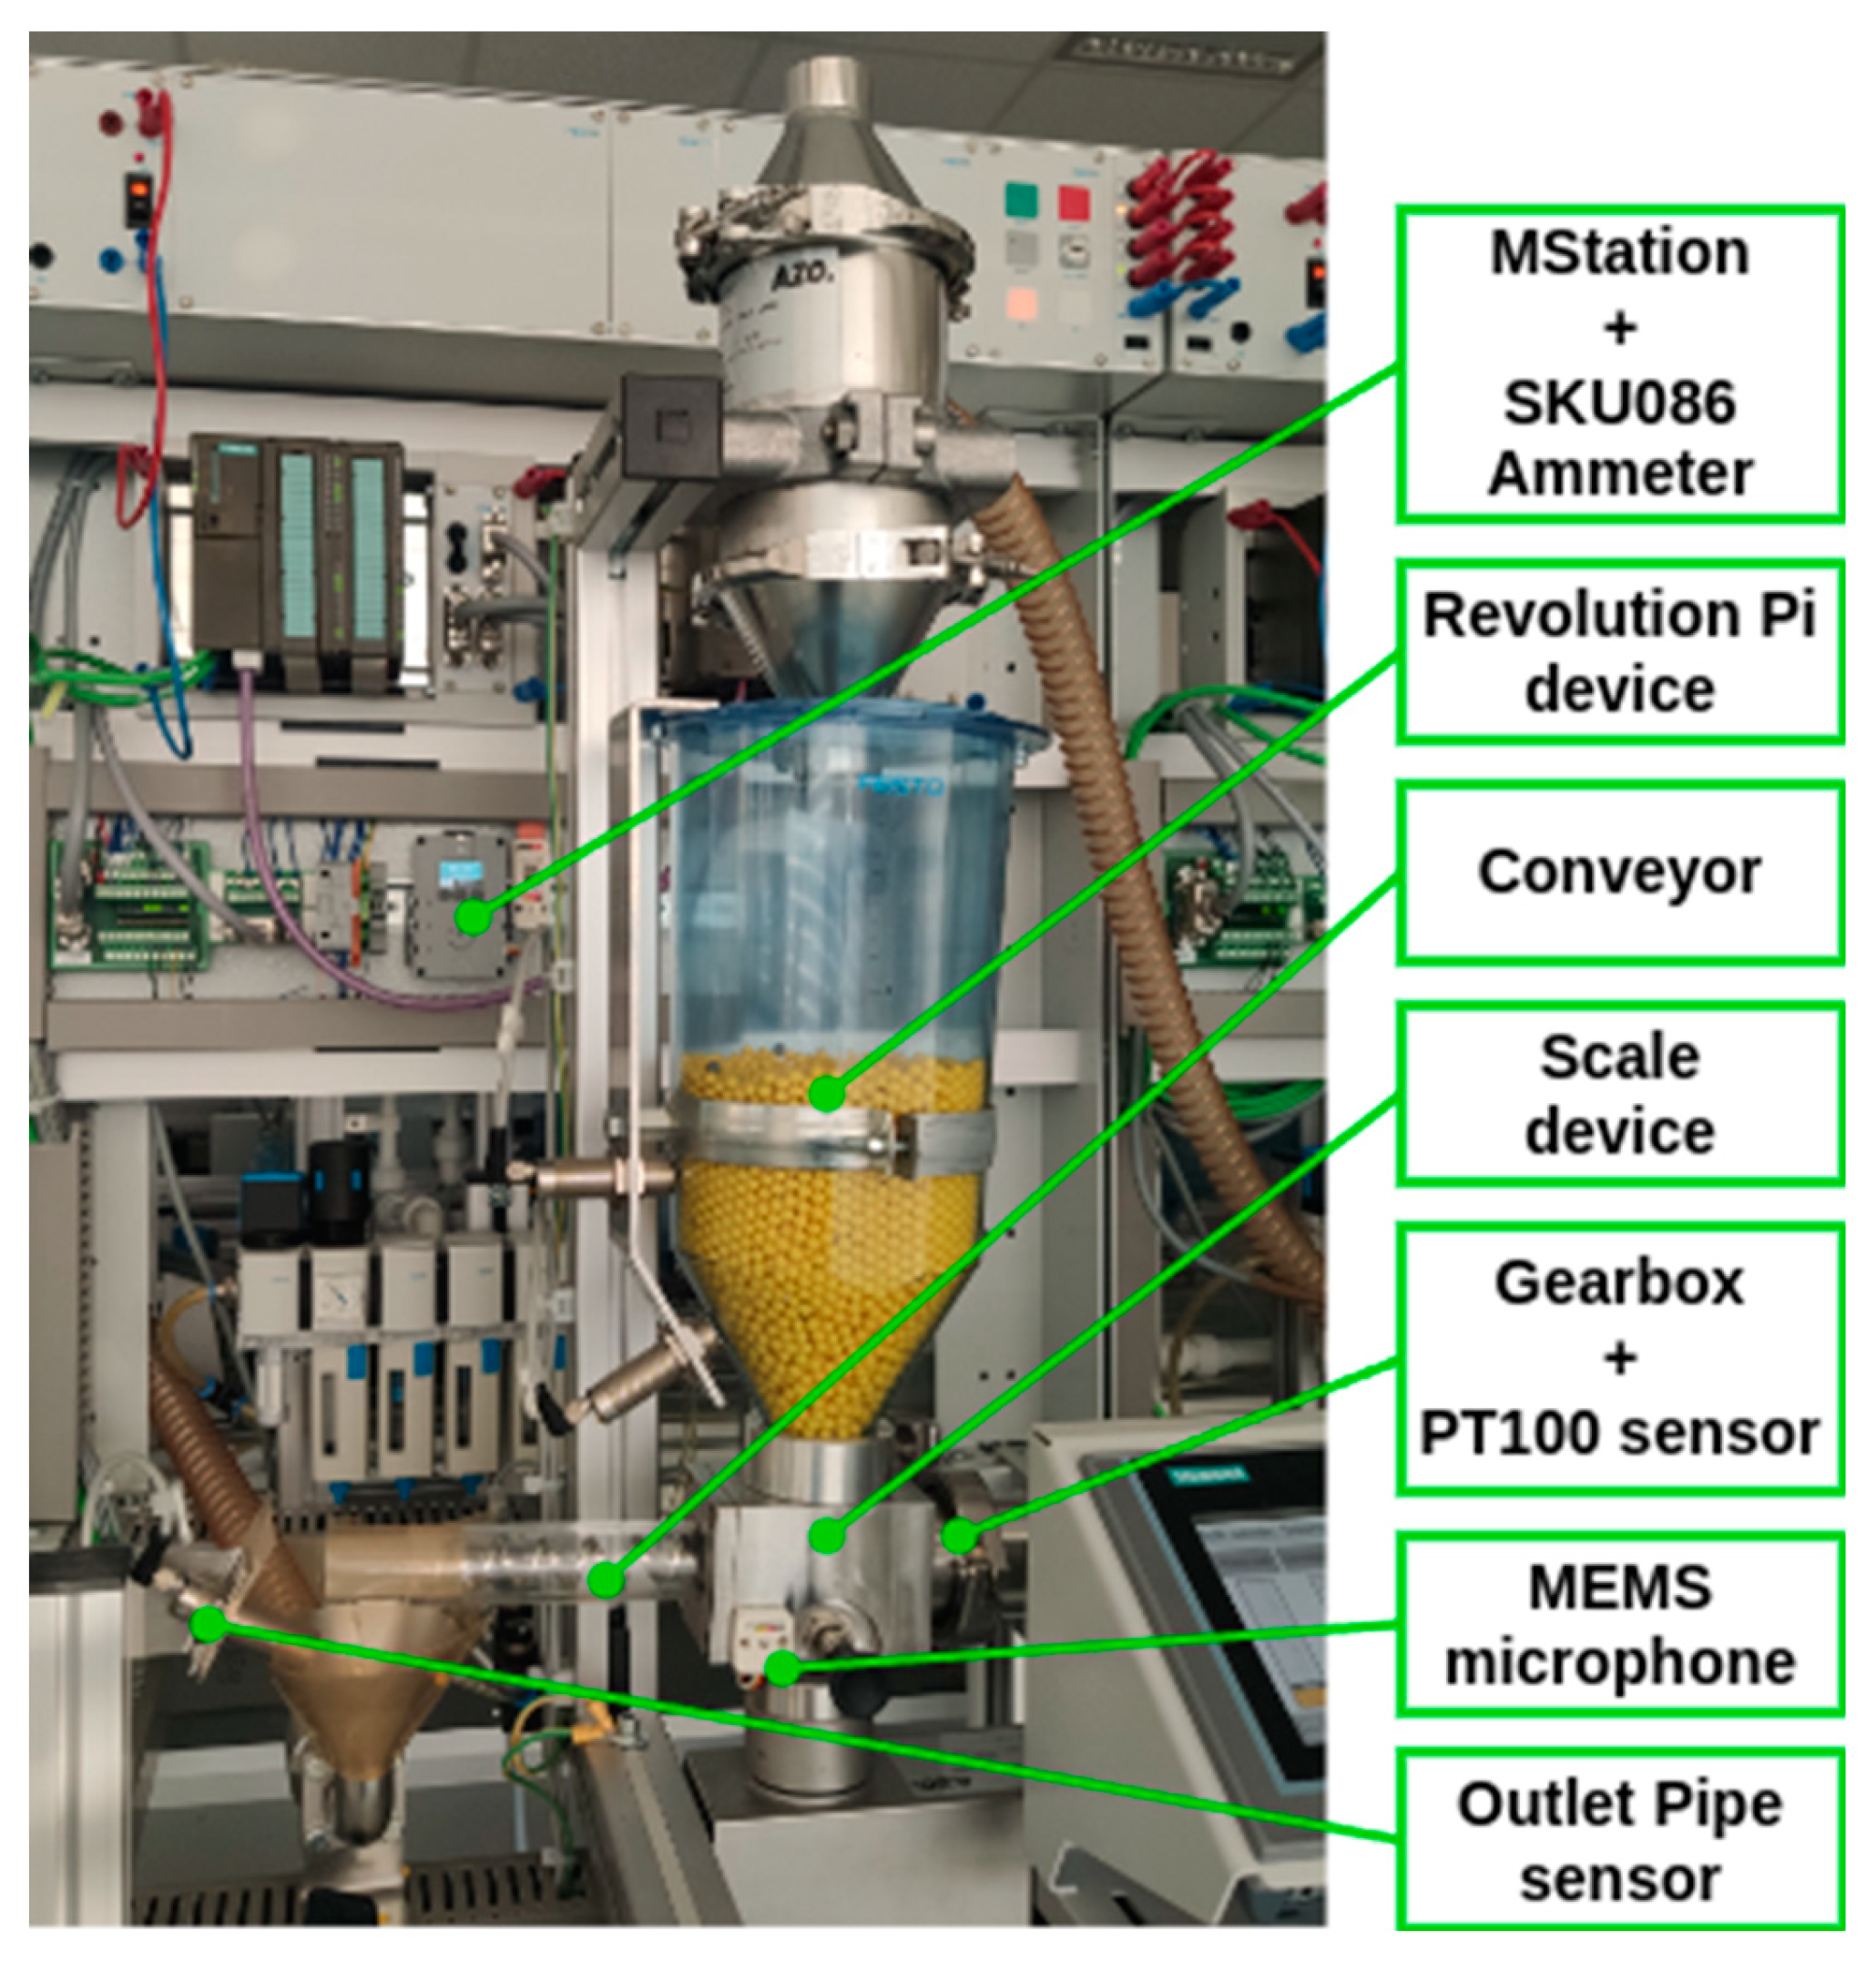
Figure 7.
Sensor connection scheme.
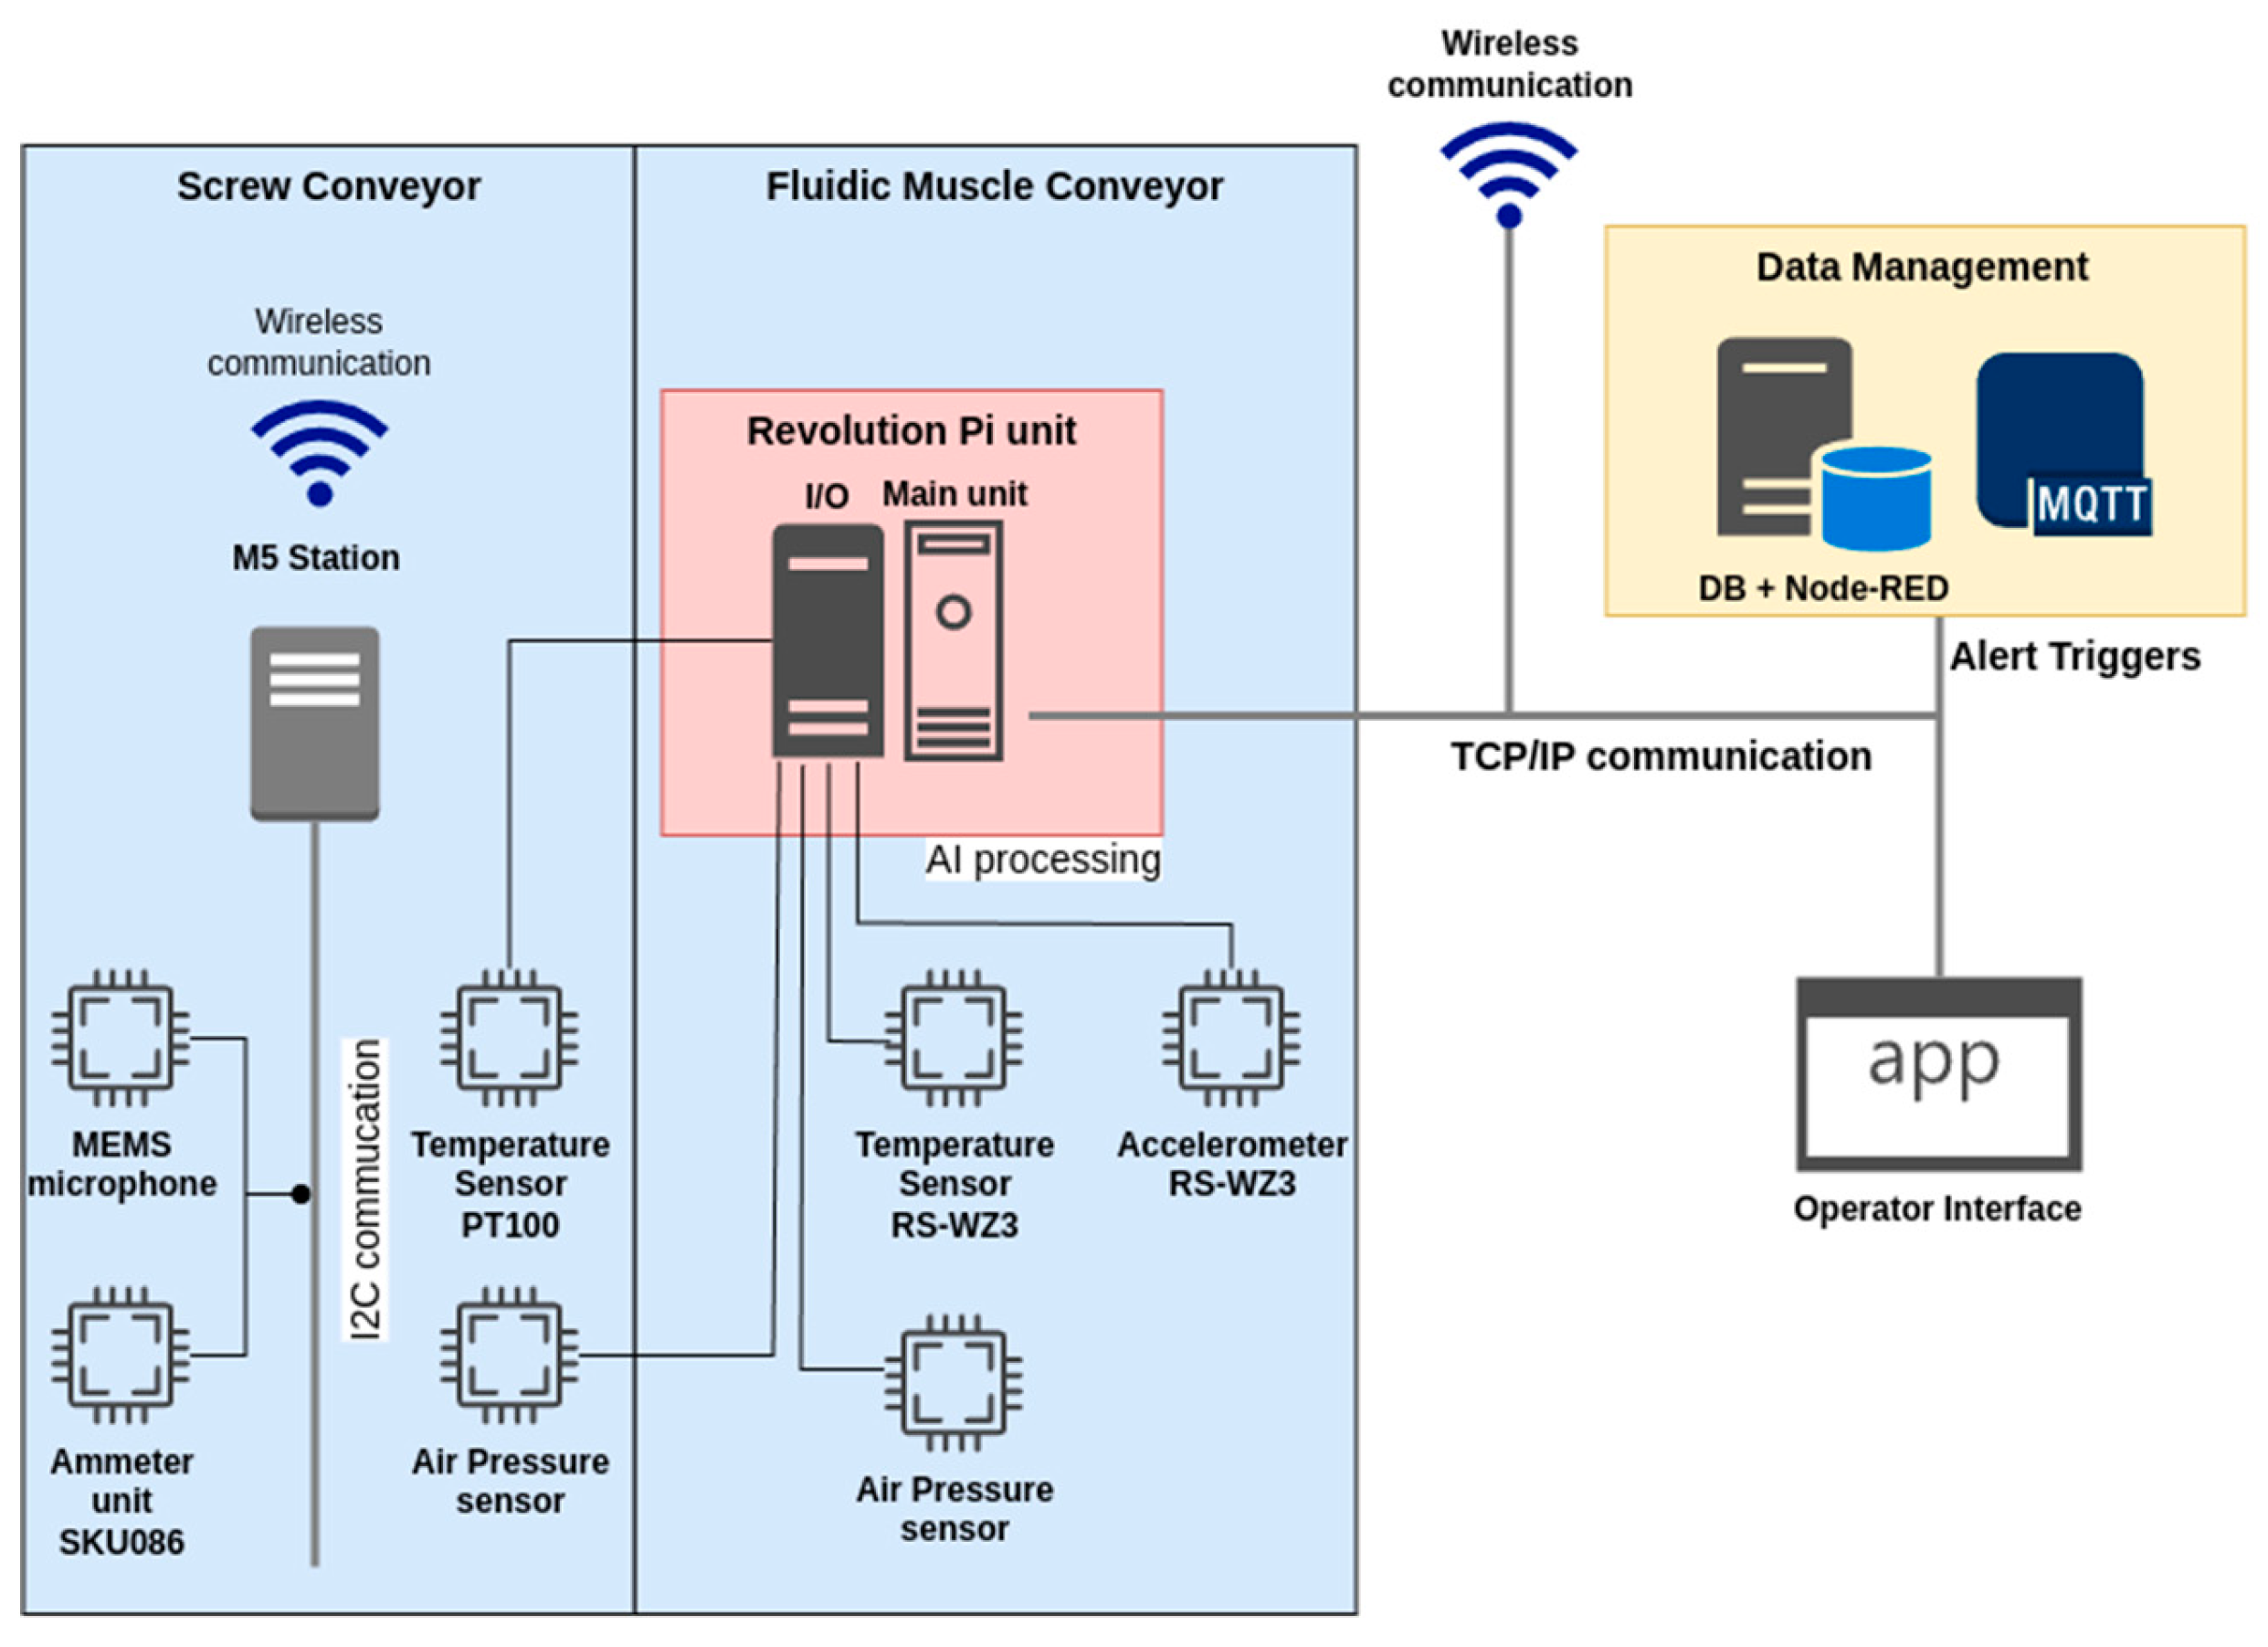
Figure 8.
Schematic representation of the proposed system with MQTT subsystem.
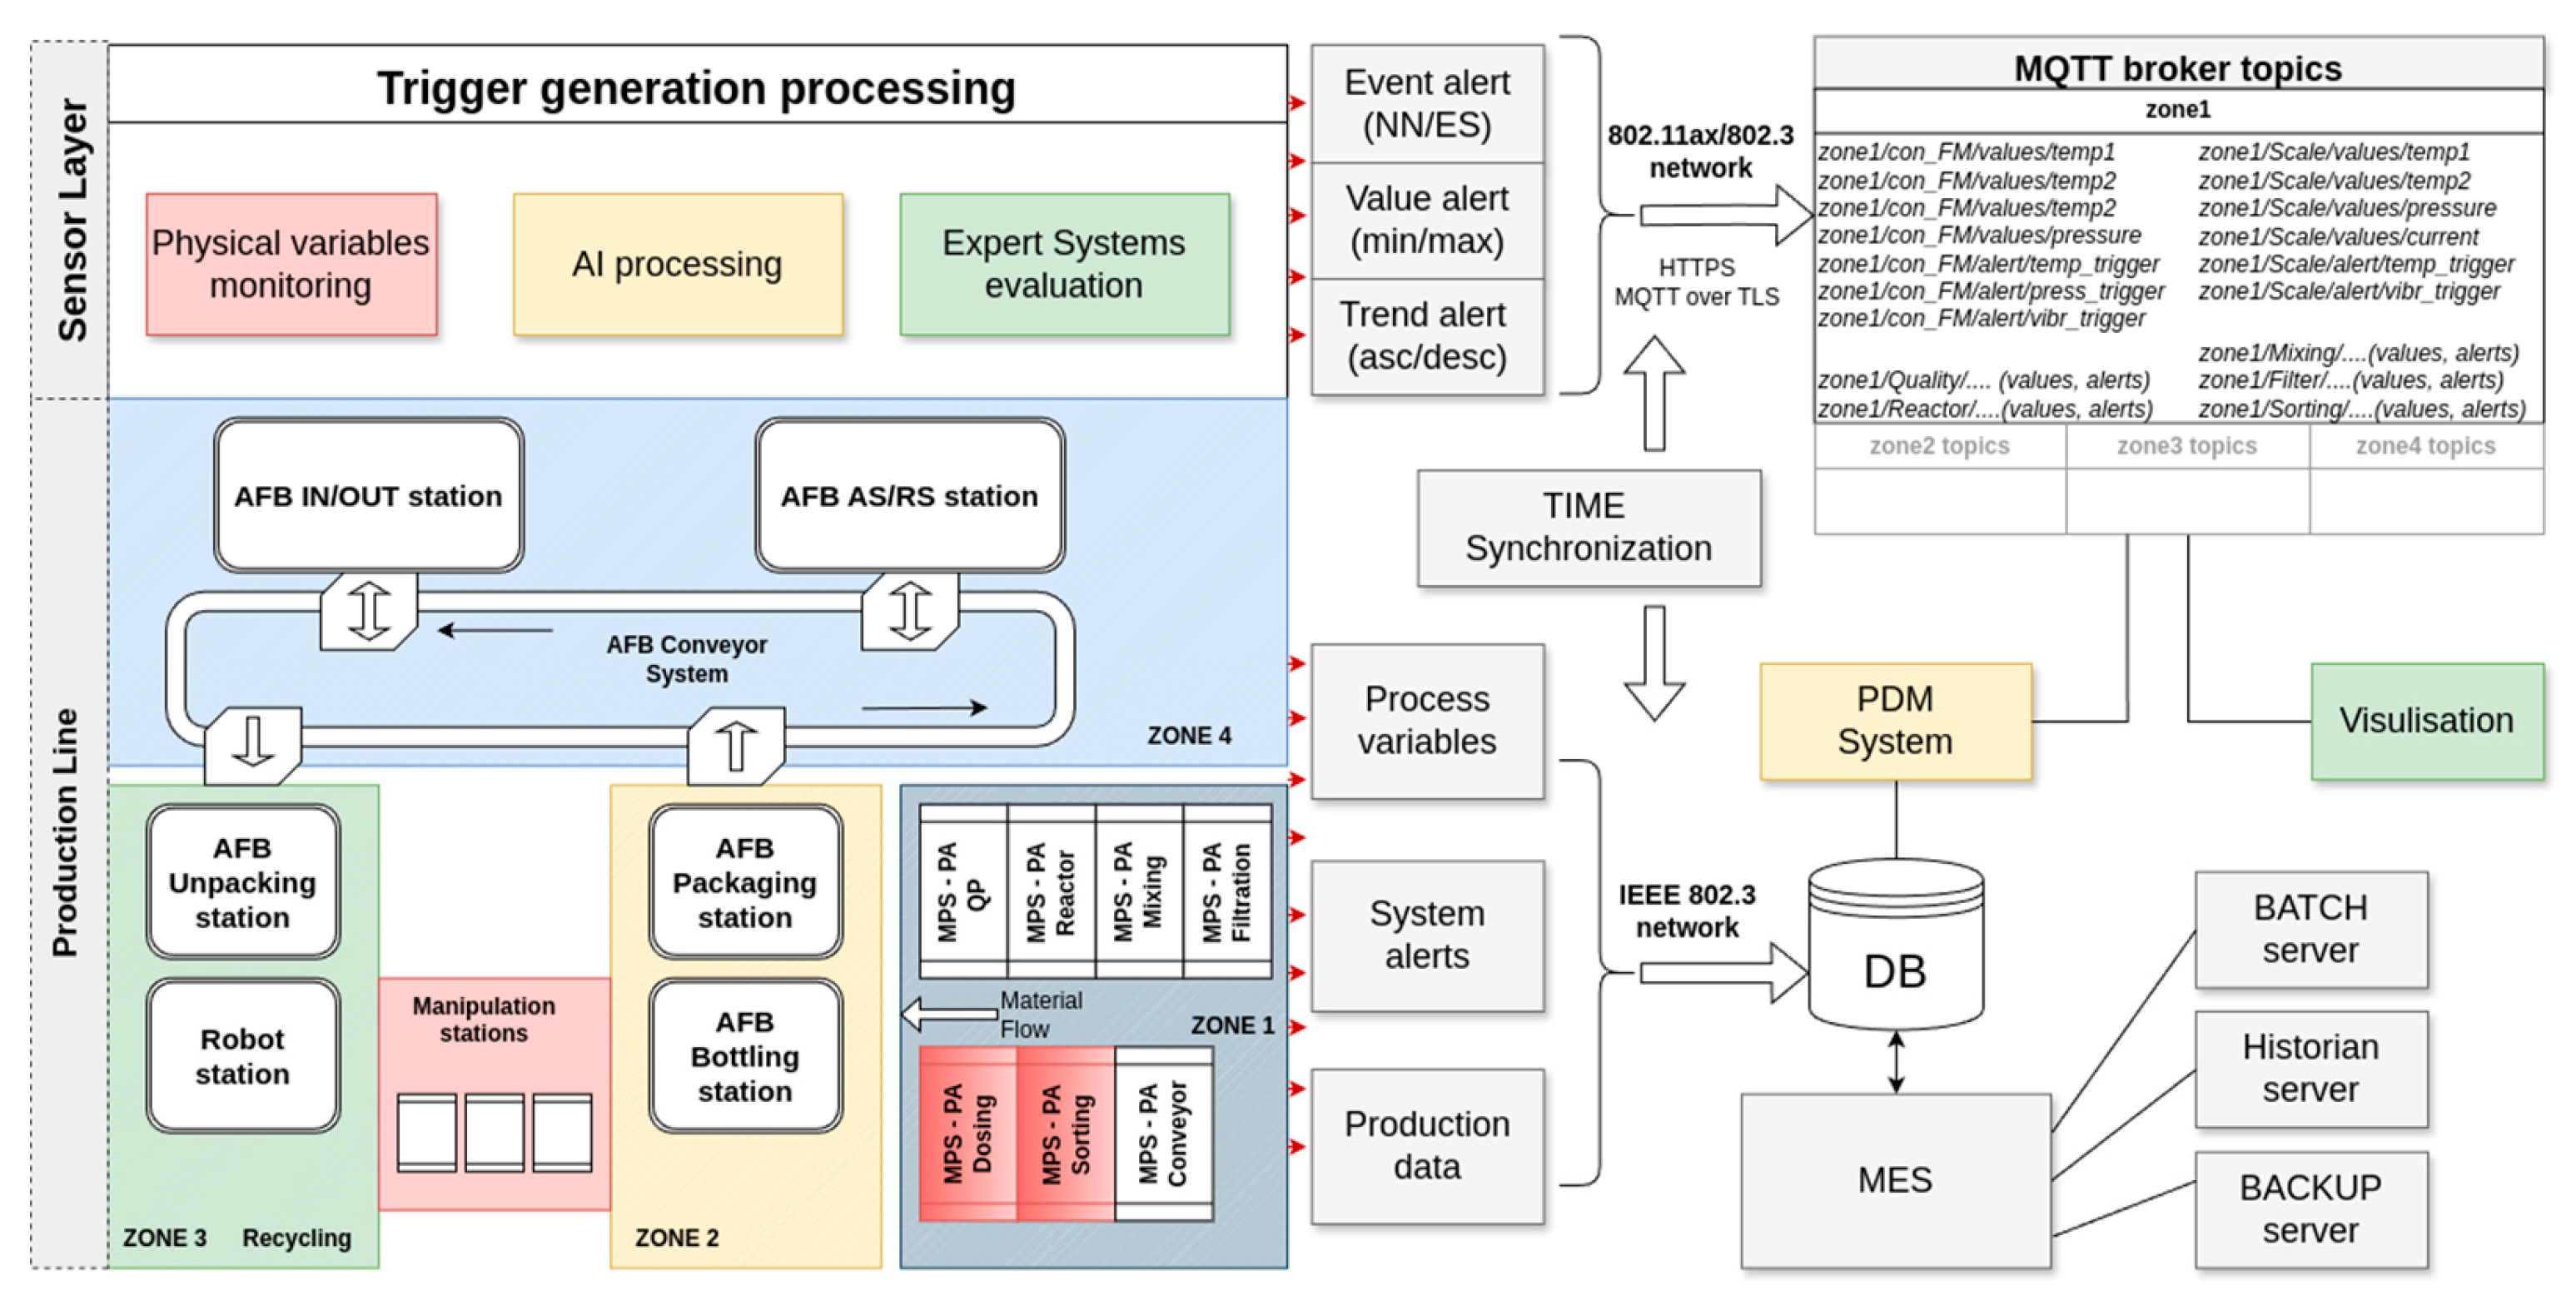
Figure 9.
Main screen of proposed application.
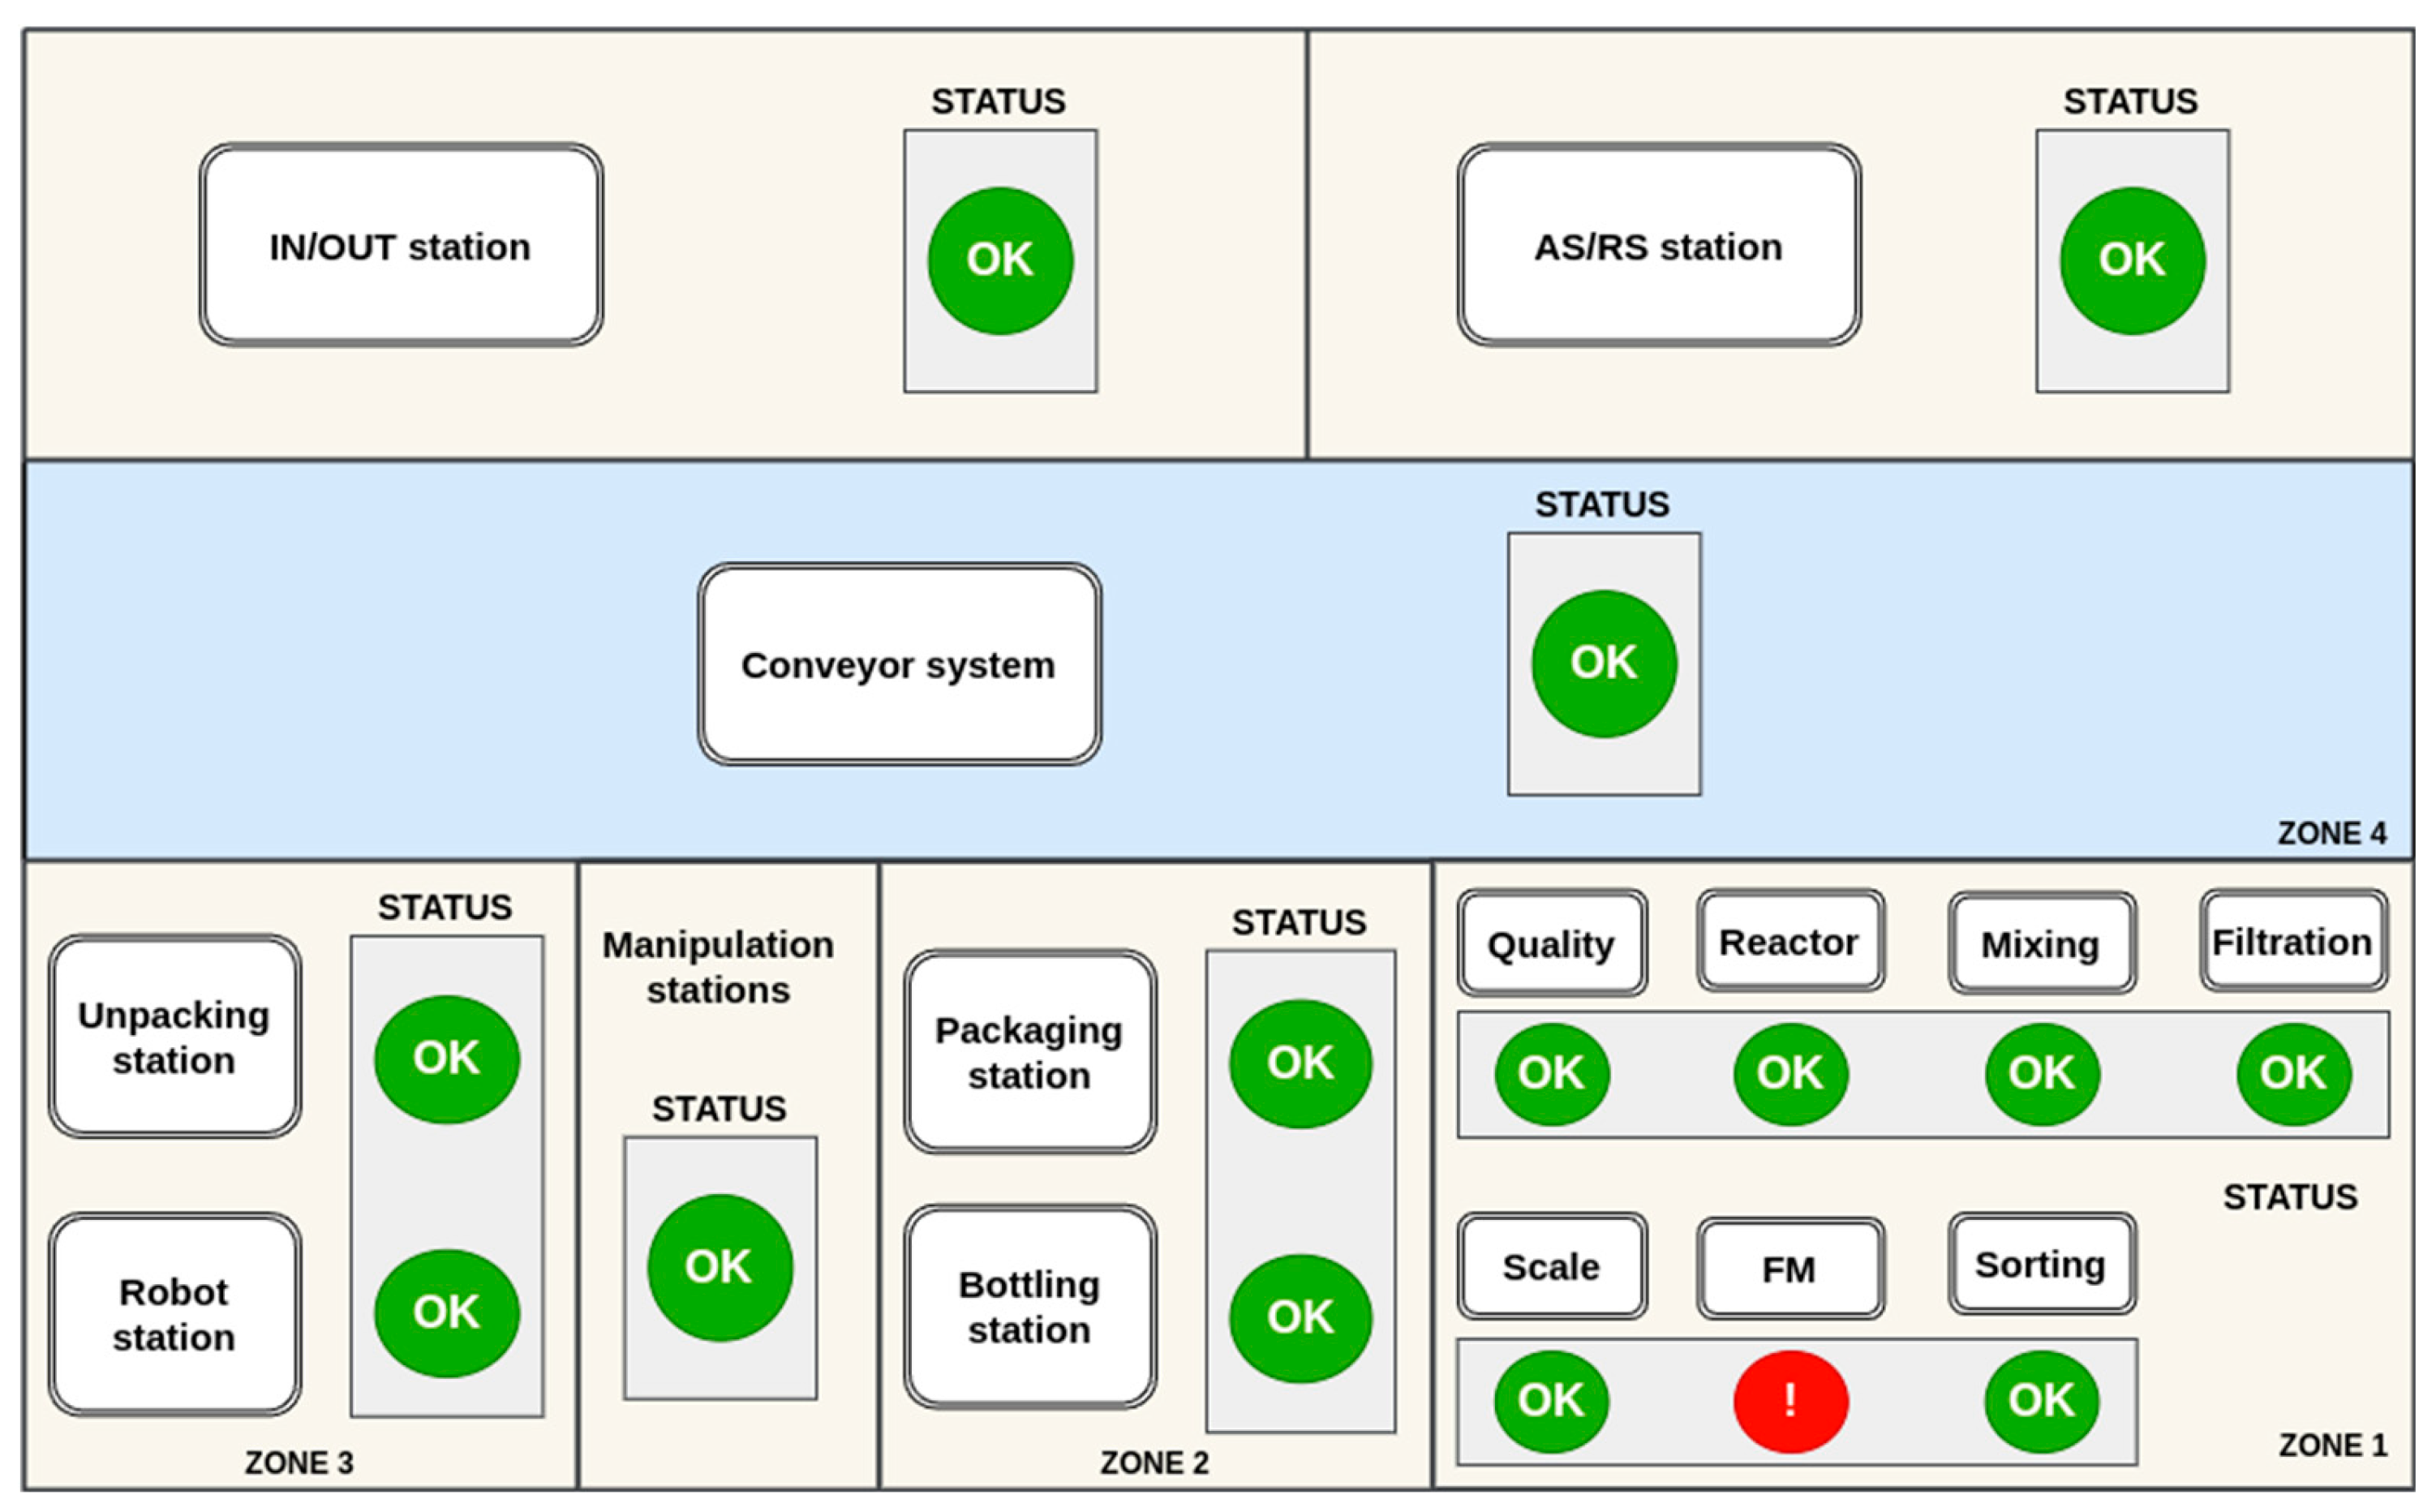
Figure 10.
Conveyor FM workstation management screen.
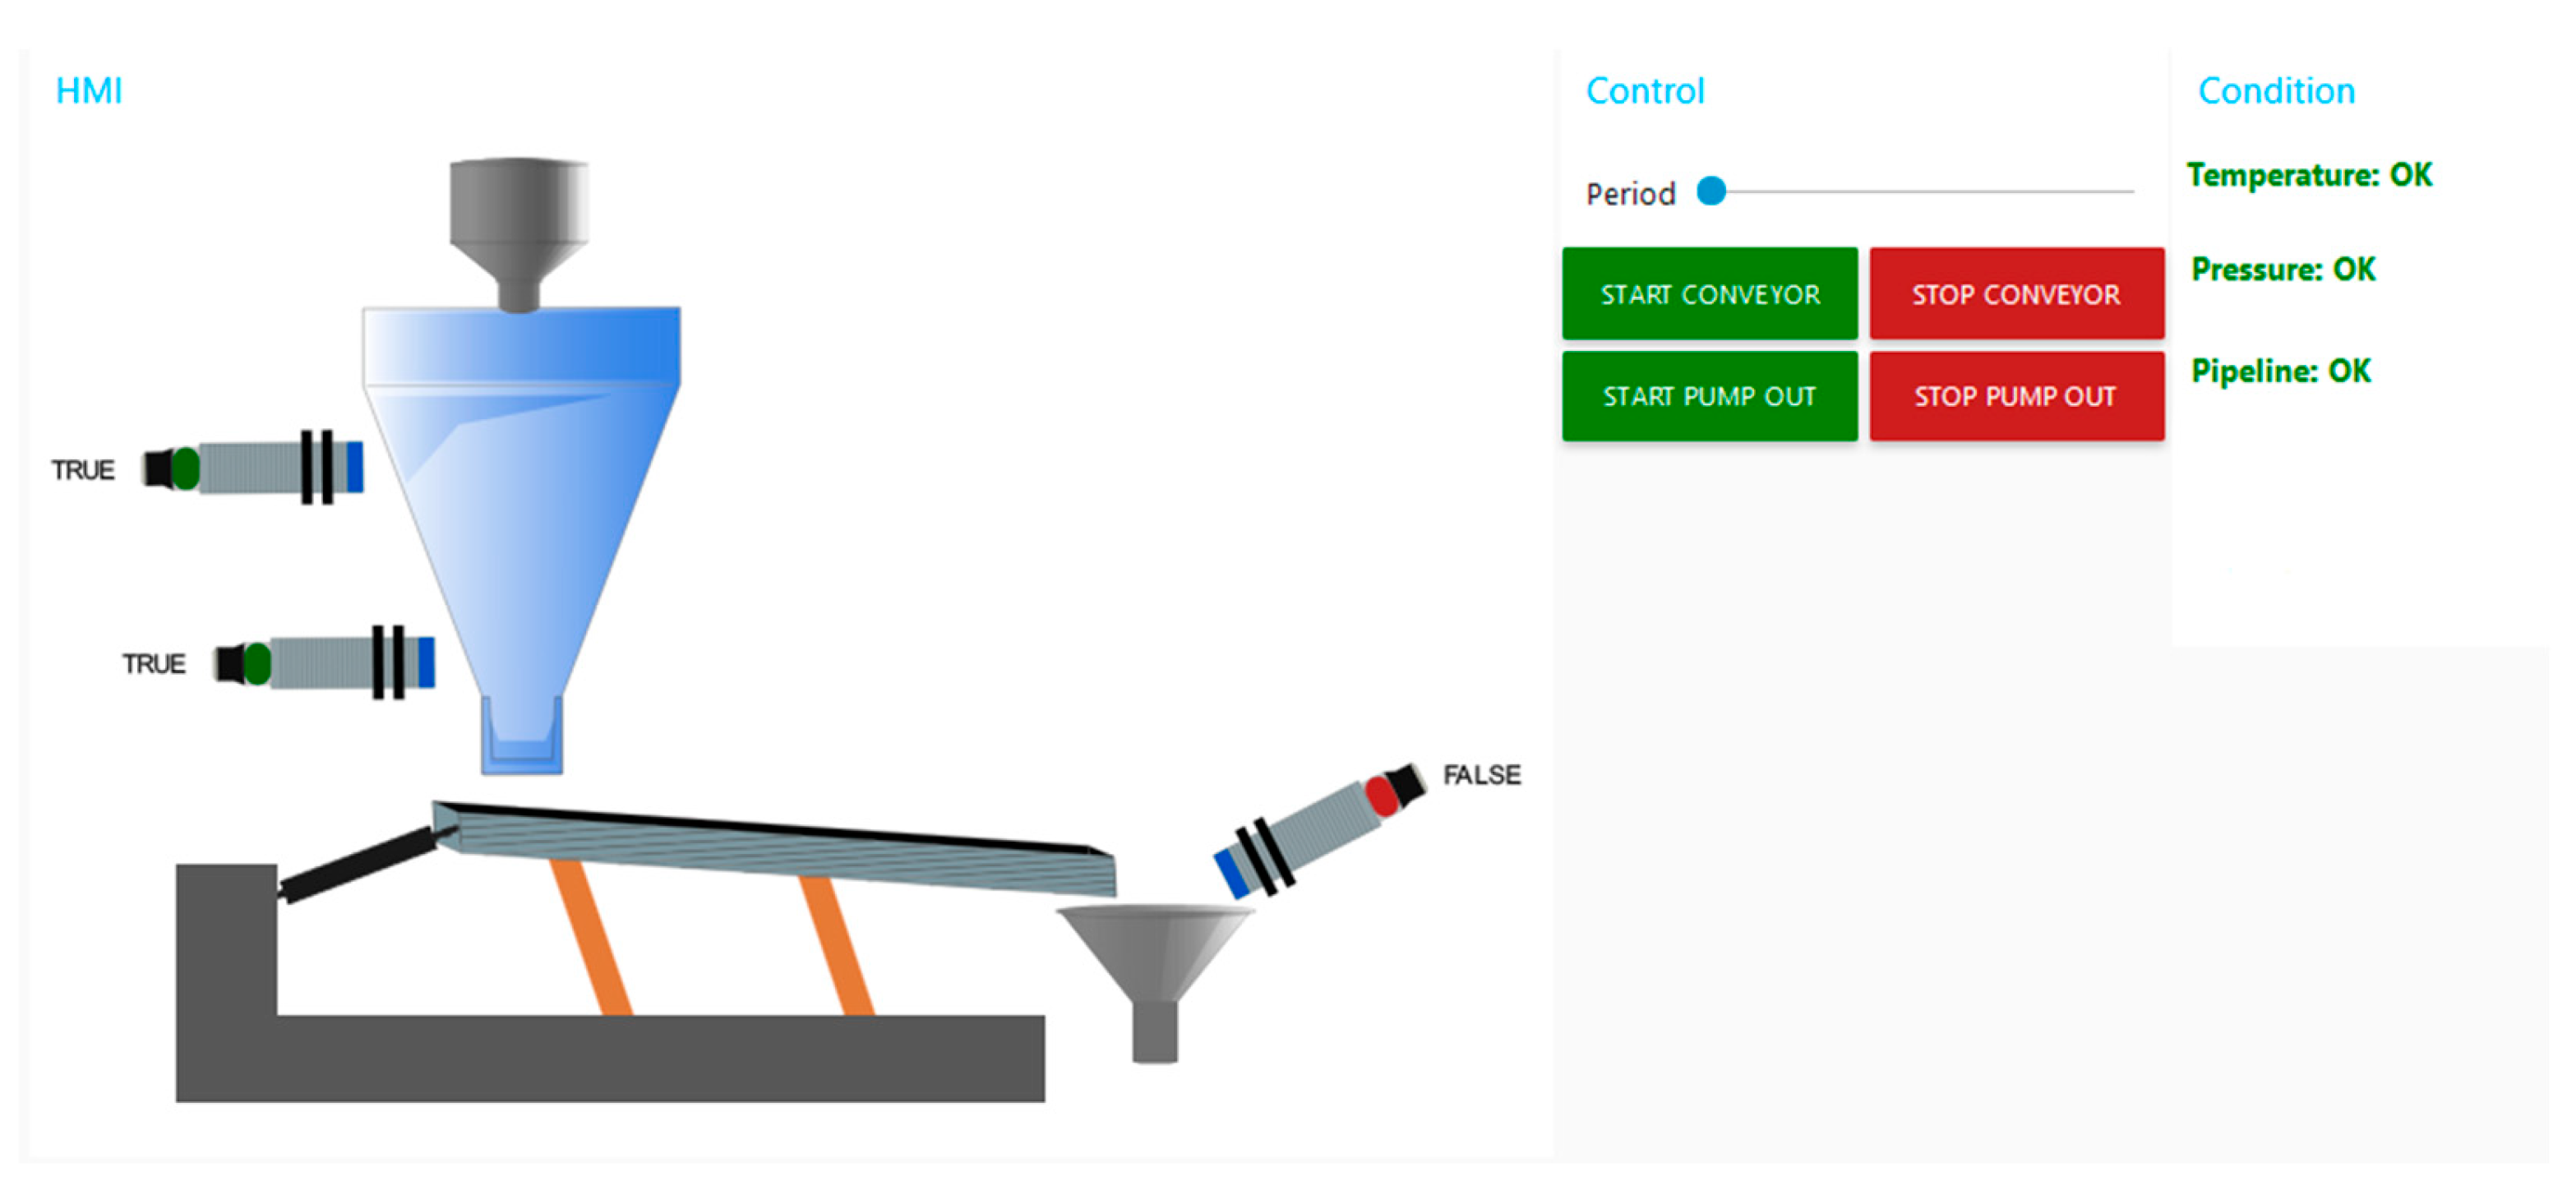
Figure 11.
Air pressure graphs example.
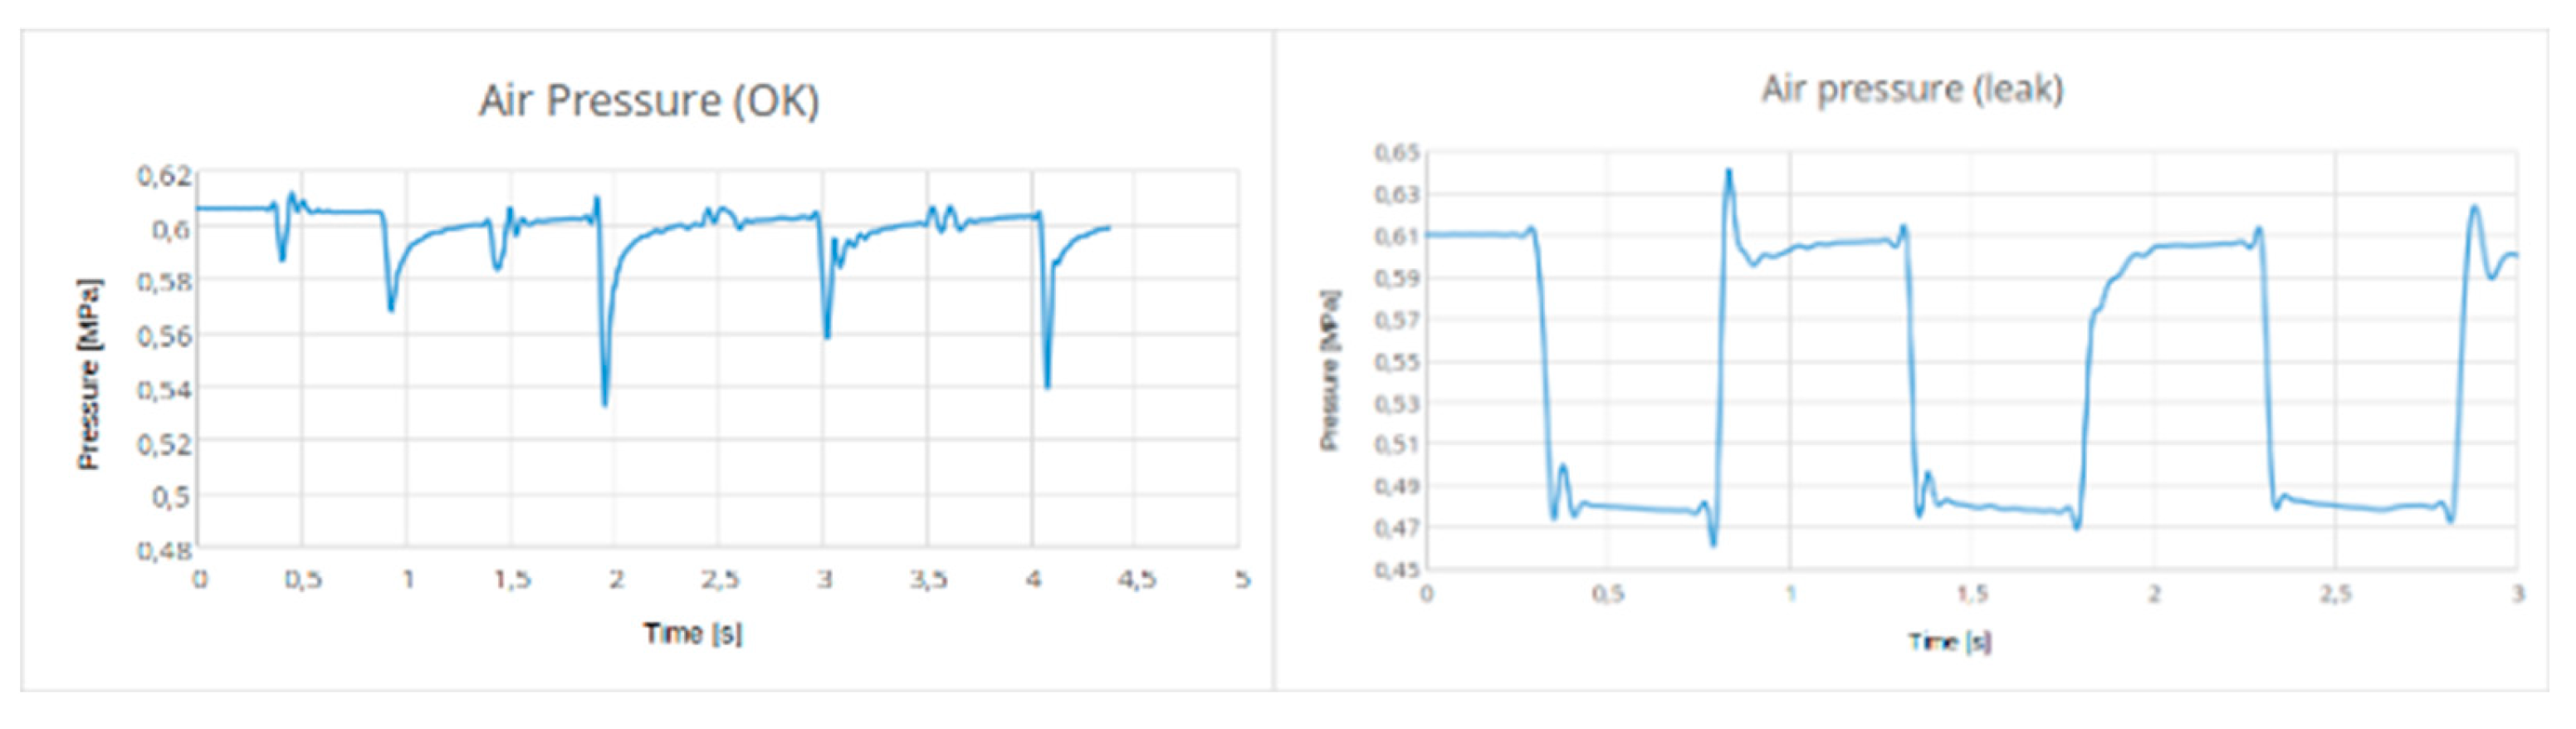
Figure 12.
Accelerometer data in three dimensions X/Y/Z.
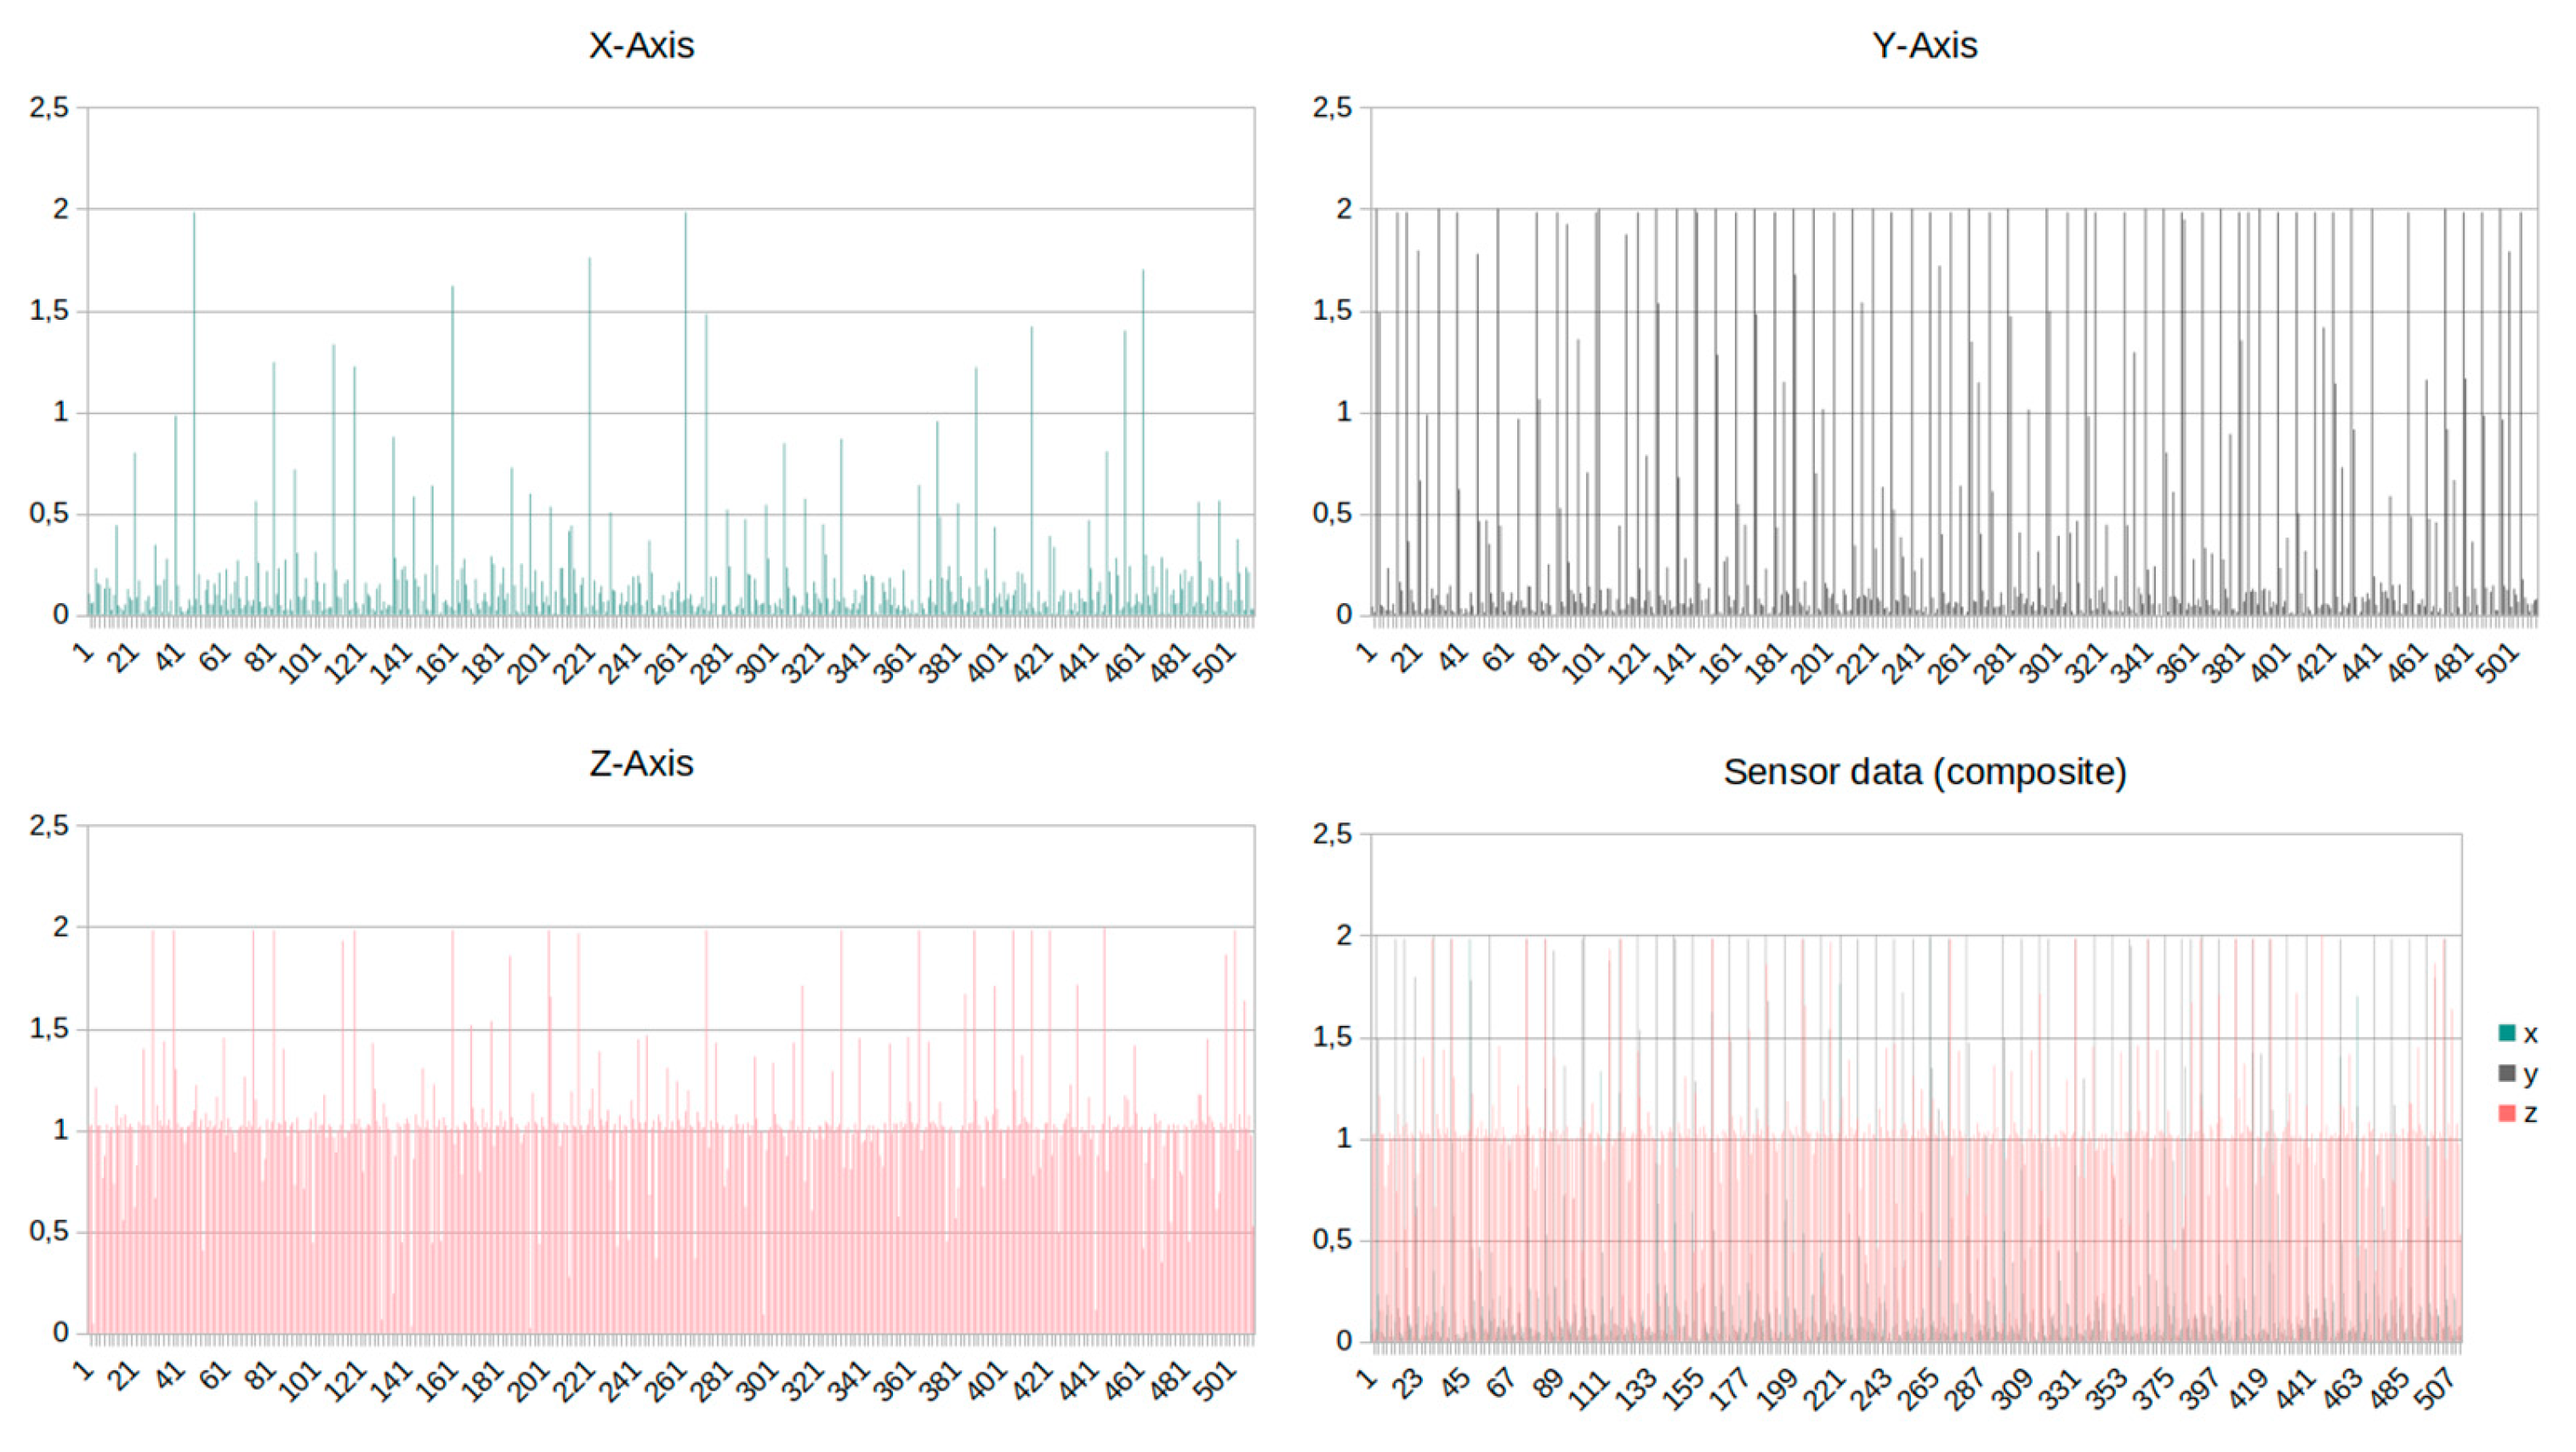
Figure 13.
The used NN architecture.
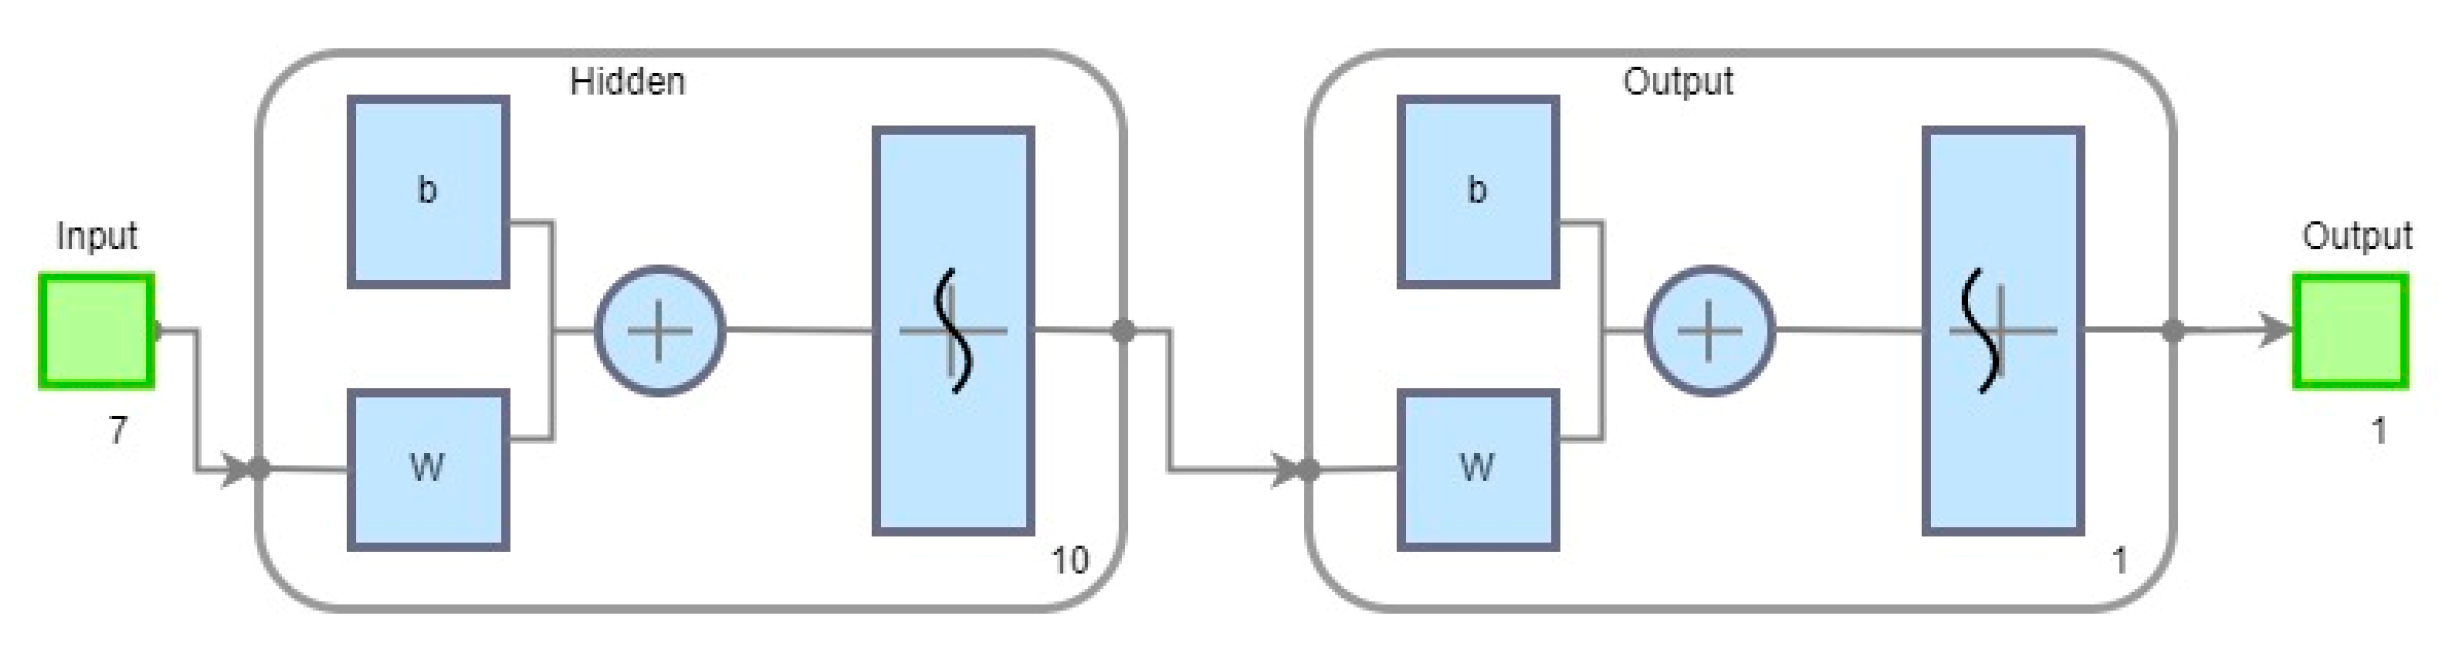
Figure 14.
Confusion matrix of the trained NN.
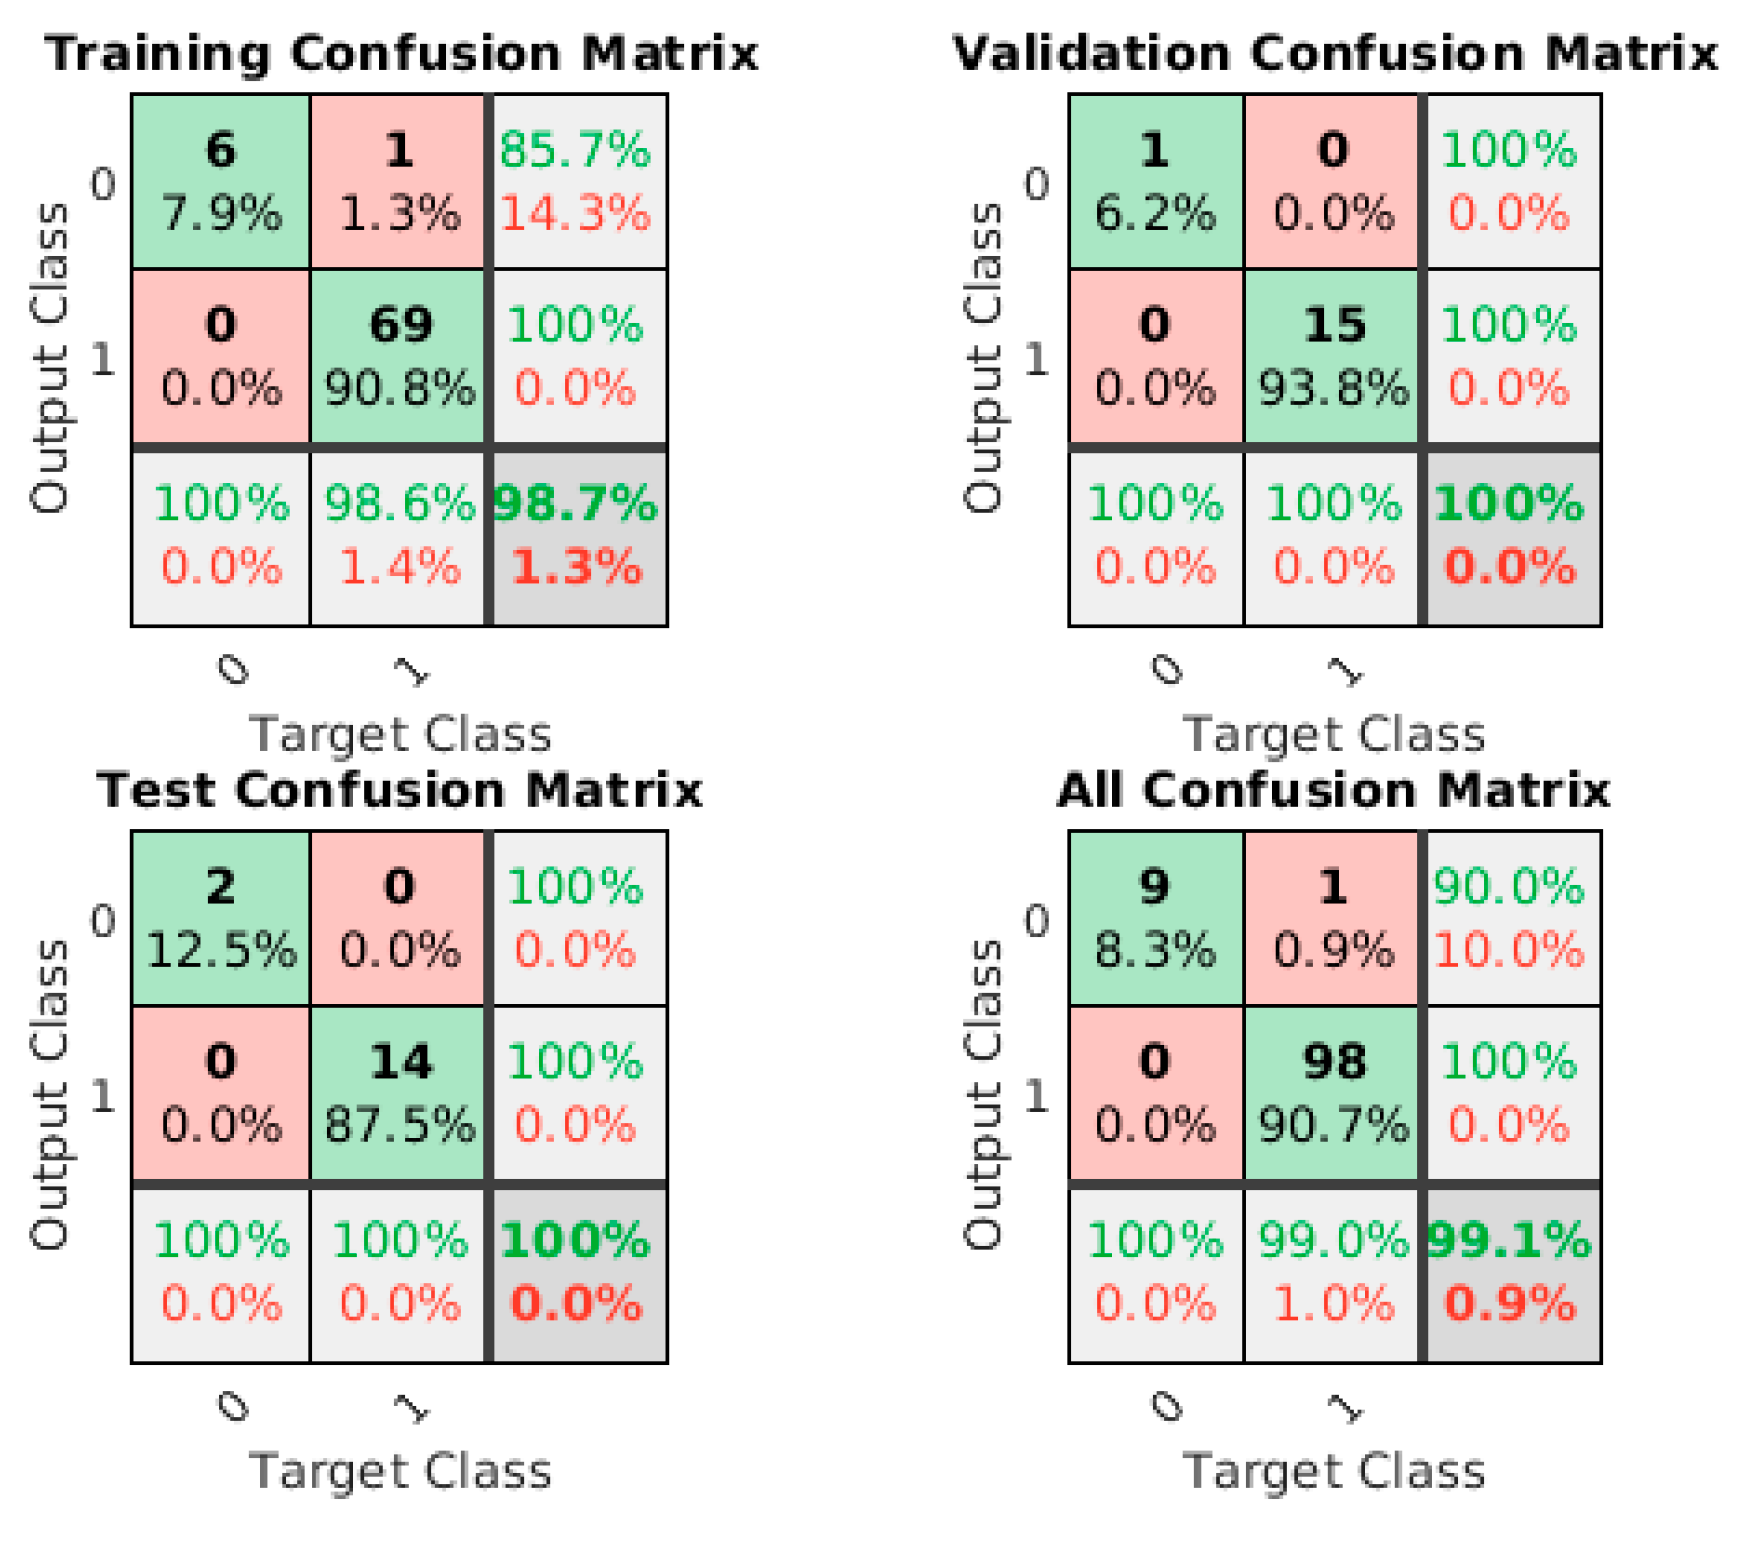
Figure 15.
Data patterns for evaluation by NN.
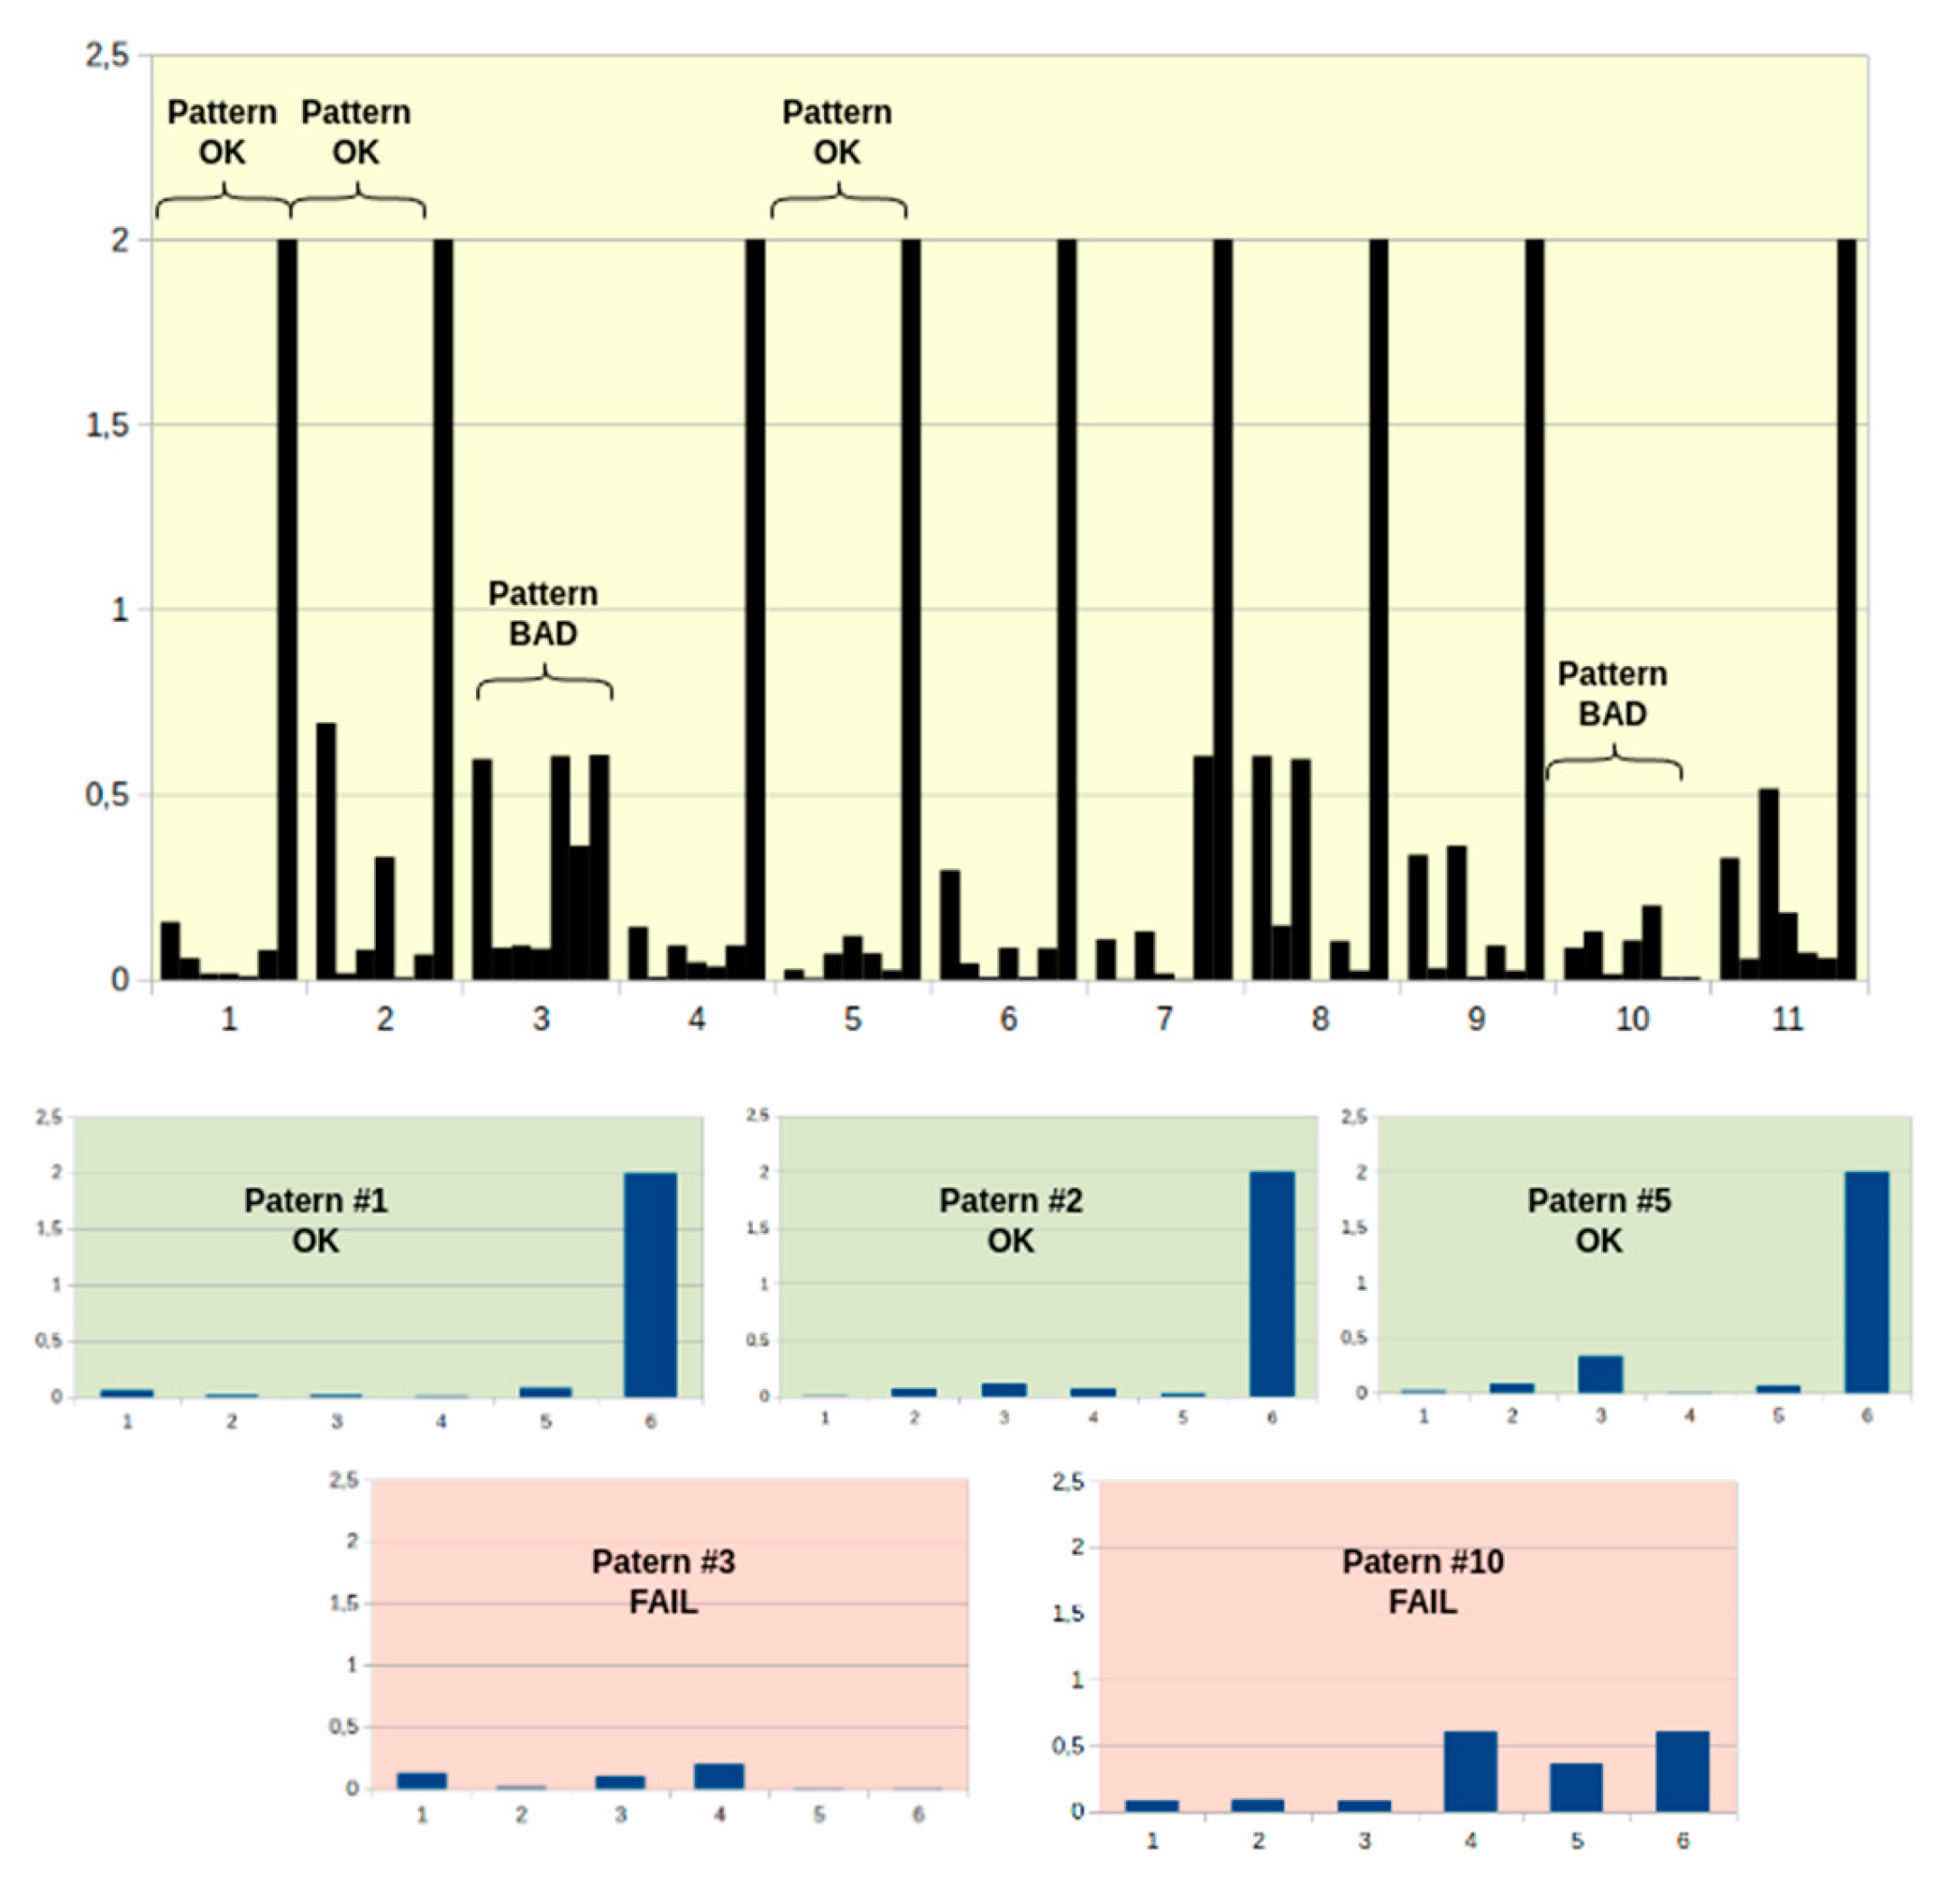
Figure 16.
Spectral analysis of MEMS microphone data from gearbox.
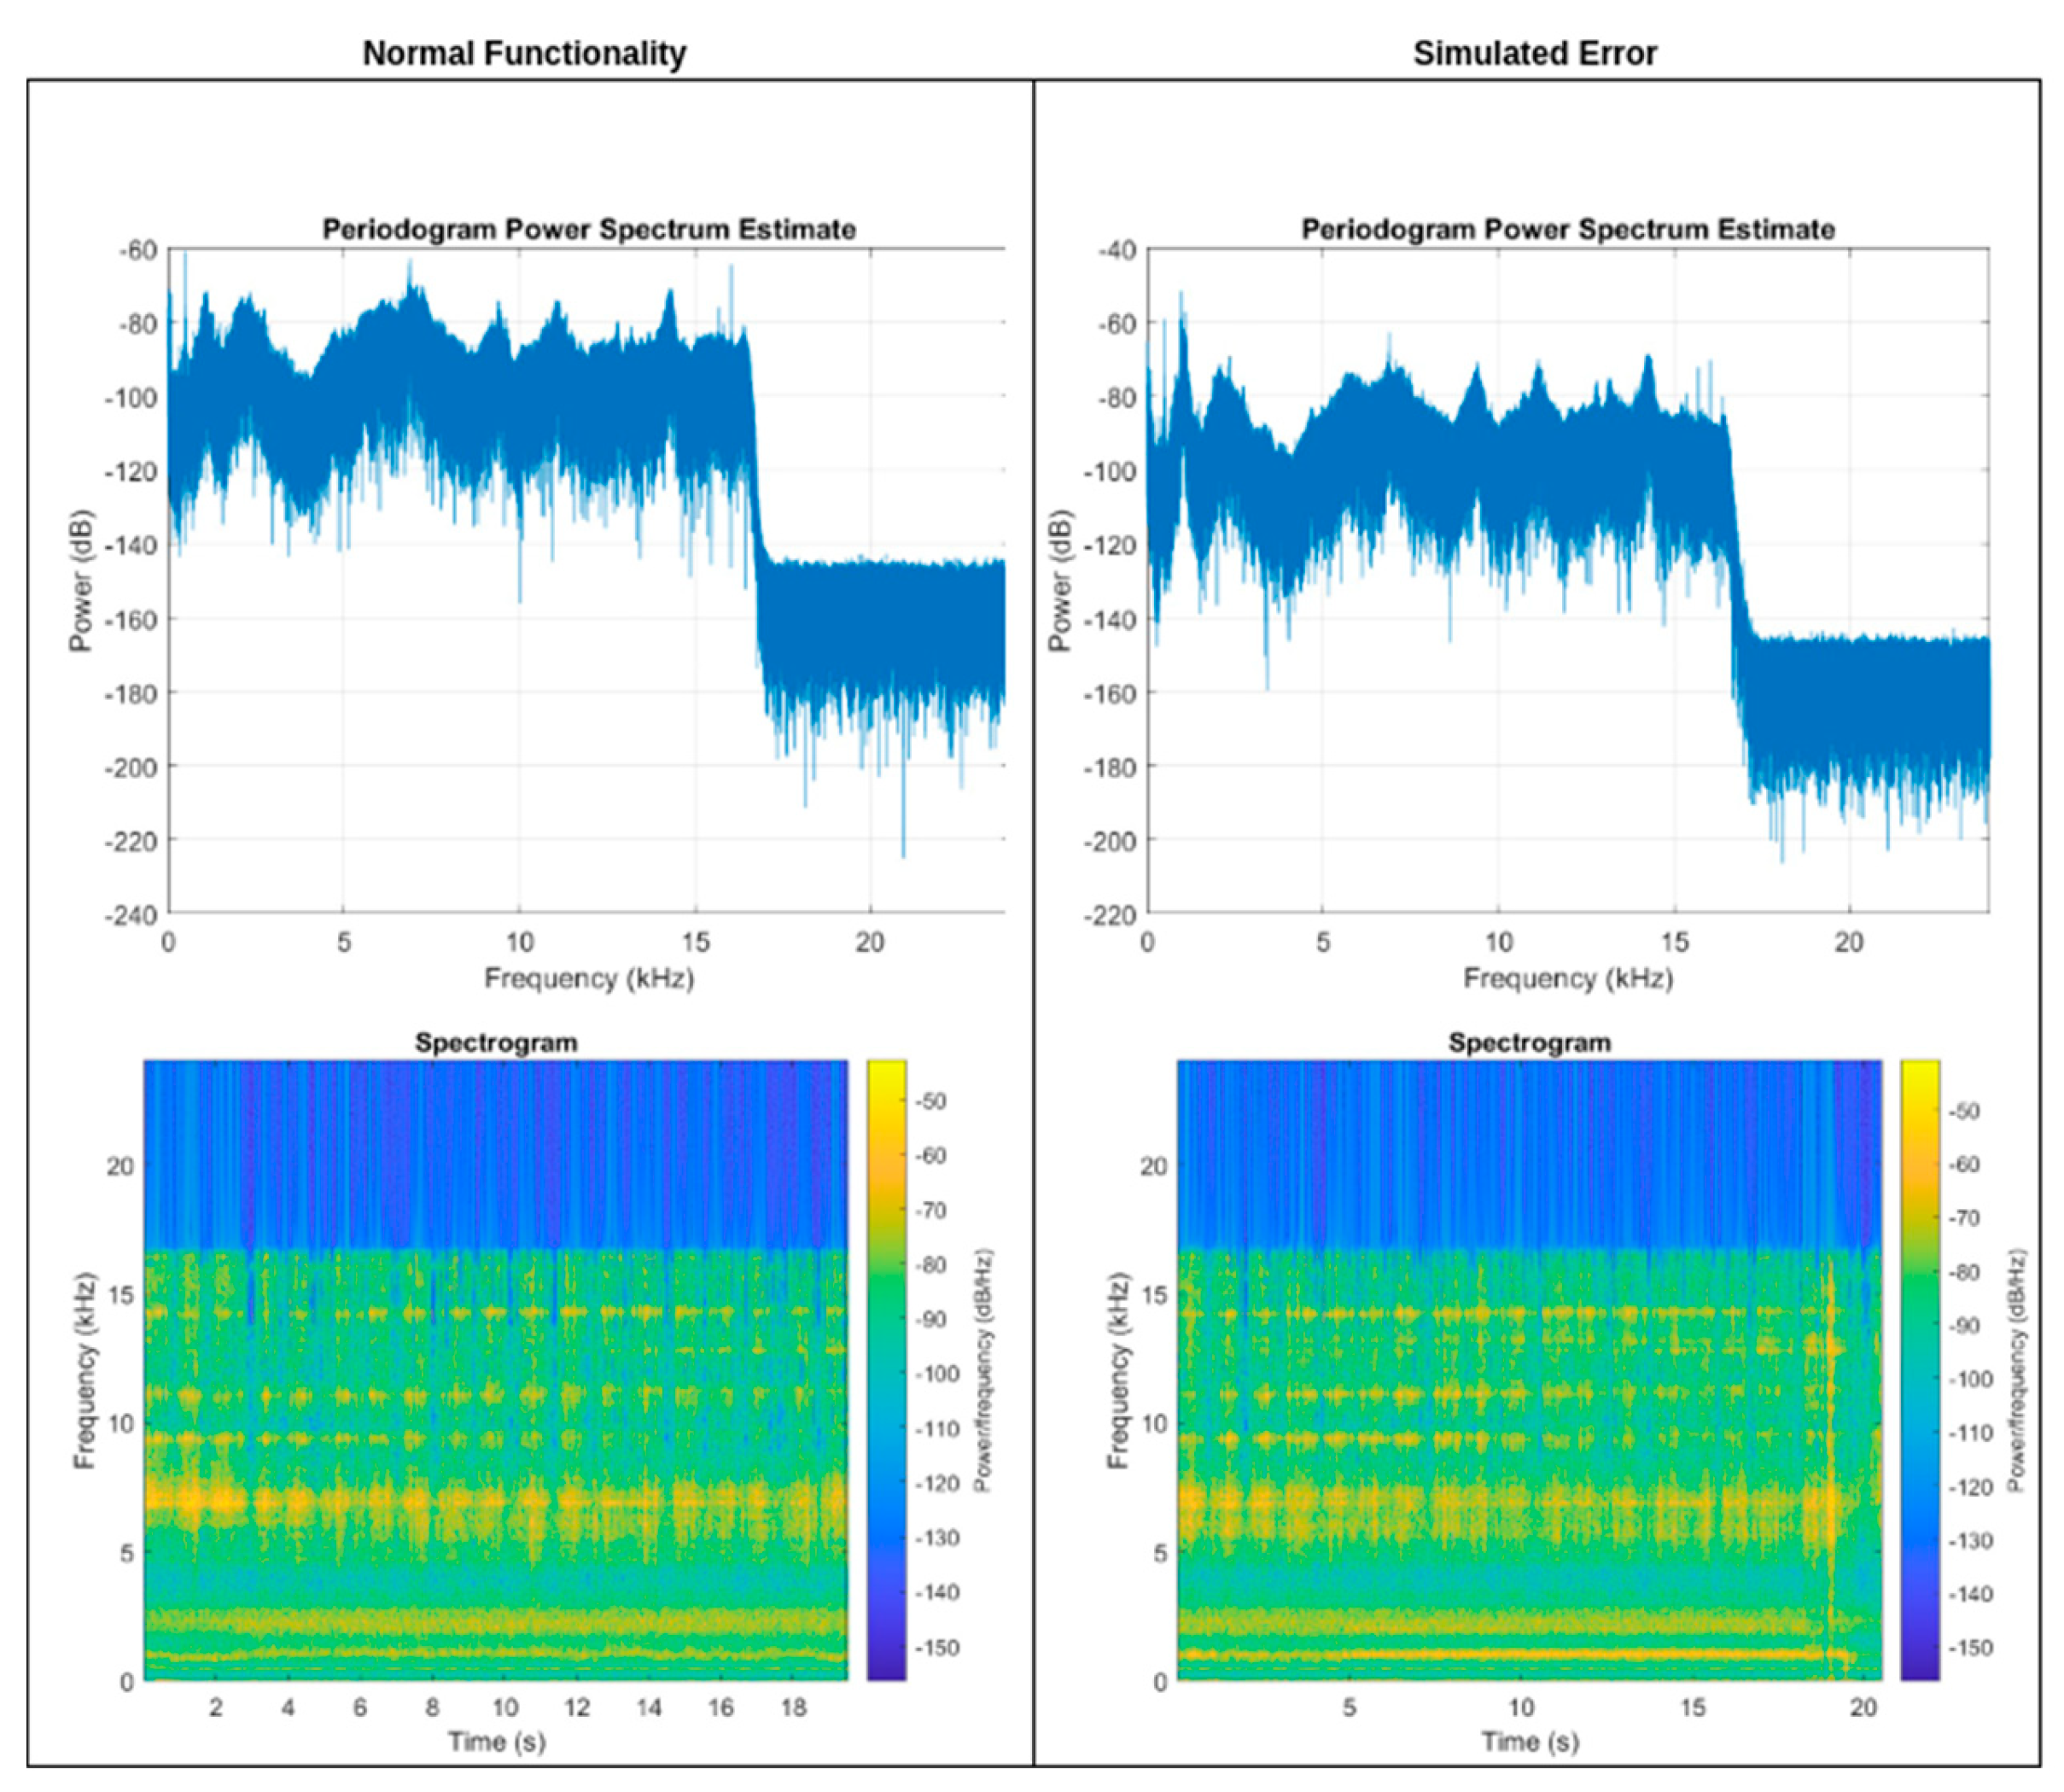

Table 1.
OSA-CBM architecture [11].
Table 1.
OSA-CBM architecture [11].
| Layer | Functional Block | Description |
|---|---|---|
| 1 | Data Acquisition (DA) | Access to physical sensor data. |
| 2 | Data Manipulation (DM) | Data manipulation and preprocessing for analysis. (signal transformations, data transformation,) |
| 3 | State Detection (SD) | Data comparision, alert generation.(data evaluation, set thresholds/operational limits) |
| 4 | Health Assessment (HA) | System's health computation. |
| 5 | Prognostics Assessment (PA) | Prediction of current health into the future.(processing of statistical data, historical and collected data) |
| 6 | Advisory Generation (AG) | The action suggestion.(alternatives, maintenance actions) |
| 7 | Human interface | Data presentation. |
Disclaimer/Publisher’s Note: The statements, opinions and data contained in all publications are solely those of the individual author(s) and contributor(s) and not of MDPI and/or the editor(s). MDPI and/or the editor(s) disclaim responsibility for any injury to people or property resulting from any ideas, methods, instructions or products referred to in the content. |
© 2024 by the authors. Licensee MDPI, Basel, Switzerland. This article is an open access article distributed under the terms and conditions of the Creative Commons Attribution (CC BY) license (http://creativecommons.org/licenses/by/4.0/).
Copyright: This open access article is published under a Creative Commons CC BY 4.0 license, which permit the free download, distribution, and reuse, provided that the author and preprint are cited in any reuse.


