Submitted:
09 November 2024
Posted:
12 November 2024
You are already at the latest version
Abstract
To investigate the influence of initial moisture content and confining pressure on the stress-strain characteristics of sand-silt mixtures (SSM), a series of consolidated drained triaxial shear experiments were conducted on reconstructed sand-silt mixtures with varying moisture contents (10%, 12%, 14% and 16%). The test results revealed the stress-strain relationship of SSM is primarily controlled by the applied confining pressure, exhibiting remarkable strain softening under low confining pressure and noticeable strain hardening under high confining pressure. Based on these experimental findings, a modified constitutive model (CPM) was proposed by integrating both classic hardening model and softening model. Additionally, a post-failure modulus was introduced to characterize transition phenomena, and its transformation mechanism was analyzed in detail. Furthermore, three illustrative cases were presented to validate and demonstrate the applicability of analytical results through comparison with experimental data.
Keywords:
Transition pattern
; Stress-strain constitutive relationship
; CPM model
; Post-failure modulus
1. Introduction
Check dam is widely recognized as one of the most crucial engineering measures for soil erosion control in the Loess Plateau. It plays a vital role in sediment trapping, floodwater detention and storage, improvement of cultivated land, and enhancement of productive conditions and ecological environments in loess areas [1,2]. However, due to relatively low initial design standards and inadequate maintenance practices being implemented, substantial amounts of sediments accumulate within the reservoir area [3], resulting in numerous hazards. Therefore, reinforcement is imperative to ensure their sustained functionality. The technique of siltation surface damming ahead of the main structure is extensively employed for reinforcing check dams (see Figure 1). As for the foundation, the mechanical properties of sediment are crucial for the stability of the new-filled dam constructed on the deposited alluvium in front of the dam. Numerous studies show that the sediment layers are characterized by different sand content, high water content, high water sensitivity and compressibility [4,5,6,7]. These properties vary from depth to depth, resulting in significant differences in soil behaviors. Thus, it becomes necessary to research how the variables affect the engineering properties of deposition.
Existing studies on dam decomposition primarily focus on the effects of varying sand content on mechanic properties [8,9], compressive response [10] and liquefaction resistance [11]. However, seldom findings have addressed the impact of moisture content on stress-strain behavior, which is a crucial aspect in comprehending the strength characteristics of sand-silt mixes. In literature reviews, there exist numerous sophisticated soil models that are developed based on elastoplastic and mathematical theory. For the strain hardening, model descriptions such as exponential function [12], nonlinear models such as Duncan-Chang hyperbolic model [13], composite exponential-hyperbolic model [14], Composite power-exponential model [15], composite tangent-exponent model [16], and power function based on fractional calculus theory [17]. As for strain softening, the full stress-strain curve is usually shown in the hump curve proposed by Nanjing Hydraulic Research Institute (NHRI) [18] and nonlinear model based on exponential decay law [19]. Undoubtly, these models possess strong theoretical foundations; however, they often require a challenging-to-measure parameters [20]. Particularly, in certain scenarios where the stress path is not excessively intricate or when there is insufficient data available to conduct an exploratory investigation into soil properties, simpler models like the Duncan-Chang model and hump curve are preferred due to their advantage of minimal parameters, precise physical meaning and straightforward formula [21]. In principle, the stress-strain relationship undergoes a transformation from softening to hardening when external conditions change, rather than remaining constant. The identification of this phenomenon can be achieved through the analysis of stress-strain curves for Dashihe tailing sand with varying porosity [22], undisturbed loess under different confining pressures [23], Hangzhou soft clay under different pre-consolidated pressures [24], reconstituted calcareous sand samples at different initial densities and confining stresses [25], and strss-strain curve of clinker ash with different particle size and shape [26]. Although precise transitions may exist, specific pattern transition models are rarely provided. Thus, the utilization of either an individual strain softening model or a strain hardening model alone is insufficient to describe the stress-strain transition relationship. Instead, it is imperative to employ a unified stress-strain model.
The aim and objective of this study is to elucidate the strength behavior of sediment deposition in the upstream of check dam under varying moisture contents through conventional triaxial tests. Based on experiment results, a modified constitutive model incorporating a transition factor and post-failure modulus was proposed to accurately capture both hardening and softening behaviors. The validity of the modified model and transition prediction method was verified using three practical case studies. Subsequently, a comprehensive explanation of the underlying transition mechanism is provided.
2. Test Scheme
2.1. Materials and Methods
The remolded test samples were collected at the Zhu JiaGou check dam at depth of 0.5m to 2m in southern NingXia, China, as depicted in Figure 2. The basic physical property indexes of the tested sample are presented in Table 1 and Figure 3. According to ASTM D2487-11 [27], the soil was classified as a sand-silt mixture (SSM). Cylindrical samples with a diameter of 50 mm and a height of 100 mm were prepared indoors for testing purposes. Conventional consolidated drained triaxial tests were conducted on saturated samples under various moisture contents (10%, 12%, 14%, and 16%) and confining pressures (50 kPa, 100 kPa, 150 kPa, and 200 kPa). The test apparatus used in this study is an automatic stress-strain path triaxial apparatus (GSY-SYL-100), as illustrated in Figure 4, with a controlled shear rate of 0.005 mm/s.
The soil samples were subjected to a series of consolidated drained (CD) tests in three steps: (1) The degree of saturation was increased to >95% using the vacuum method. (2) Saturated conditions were achieved by applying cycles of cell pressure and backpressure, ensuring a B-value of ≥ 0.98 before conducting triaxial tests. (3) Drained shearing was performed on the soil specimens at a strain rate of 0.005 mm/s. During the shearing process, four soil samples with different moisture content were configured for test, until an axial strain of 25% was reached. Each test was repeated twice to ensure the consistency and repeatability of the results.
2.2. Stress-Strain Response
The stress-strain curves of SSM samples with a dry density of under different water content are depicted in Figure 5. Analyzing the shape characteristics of the curve in the figures, we observe that stress-strain curves under 50 kPa and 100 kPa confining pressures corresponding to soil sample moisture content of 10%,12 and 14% exhibit a stress softening behavior at this specific dry density. Beyond the peak point of the curve, stress decreases with increasing strain and gradually approaches a certain value; however, both the form and magnitude of softening are influenced by the confining pressure. Lower confining pressures result in more pronounced stress softening and larger amplitudes, while higher confining pressures lead to reduced amplitude and delayed onset of softening stage. Conversely, for soil samples with a moisture content of 16%, the corresponding stress-strain curve demonstrates a stress hardening pattern where stress increases with strain and tends towards linearity. Notably, higher confining pressures accentuate this phenomenon.
Besides, it can be observed that for stress-strain curves exhibiting a peak point, an augmentation in confining pressure results in a corresponding increment in the failure devirtor stress based on the analysis of stress variation characteristics illustrated in Figure 1. In instances where no peak exists on the stress-strain curve, higher levels of confining pressure lead to amplified deviatoric stresses at equivalent strains. This phenomenon can be attributed to the robust resistance against deformation demonstrated by particle structures within elevated confinement pressures, consequently influencing both strength and deformability properties of soils. Henceforth, it becomes evident that confining pressure plays a pivotal role as a determinant factor affecting various mechanical properties associated with soils.
2.3. Peak Deviator Stress
The influence of water content on the magnitude of partial stress suggests that, under the sepcific confining pressure, its strength exhibits a consistent variation pattern (see Figure 6). With increasing water content, the peak strength gradually diminishes. The failure diavirtor stress at a water content of w = 10% is approximately 1.2-1.5 times higher than the maximum partial stress observed at a water content of w = 16%. This phenomenon illustrates that soil sample saturation often leads to a significant reduction in soil sample strength and a decrease in the initial tangential modulus. In the case of SSM, a decrease in moisture content corresponds to an increase in peak deviator stress, indicating an inverse relationship between these two parameters. To accurately represent this association, a power function (Equation (1)) can be utilized.
where m and n are the dimensionless parameters that are independent of the confining pressures. By fitting the curve, the dimensionless parameter varies significantly and can be written as follows:
Combined with Equations (1) and (2), the relationship between peak deviatoric stress and moisture content with confining pressure can be obtained.
3. Model Benchmark
3.1. Description of CPM Model
The strain hardening phenomena can commonly be simulated using the Duncan-Chang model (Pattern I), while the NHRI model (Pattern II) can simulate the strain hardening phenomenon. However, it has been observed that the former reasonably describes the strain hardening curve of SSM but fails to accurately reflect its strain softening phenome-non. On the other hand, although the latter effectively describes the strain-softening curve of SSM under confining pressure less than 150kPa, it cannot adequately represent the strain-hardening curve when fitting test data. To address these limitations and consider both strain transition and practical applicability for both hardening and softening curves, a new composited model (CPM) is proposed by combining Pattern I with Pattern II. This new model, referred to as pattern III hereinafter, allows for further analysis of parameter relationships.
where q is stress difference; denote the axial strain and deviatoric stress respectively; a, b and c are fitting parameters. g denotes the transition factor.
By differentiating Equation (1), the following equation can be obtained:
is an increasing function when ; while is a decreasing function when . Hence, strain-softening behavior can be characterized using Equation (3). When c=0, Equation (3) is the mathematical expression of the Duncan-Chang model used to approximate the strain-hardening stress-strain curves.
3.1.1. Parameter g
In Equation (1), the transformation factor represents a function of the confining pressure , which can be defined by Equation (3).
In which is initial state index related to confining pressure; is jump function, if In particular, , Equation (1) can be further deduced to Duncan-Chang model.
3.1.2. Parameters a, b and c
For strain hardening curve (Pattern I):
For strain softening curve (Pattern II):
where is the initial tangent modulus; and are the peak deviatoric stress and residual stress, respectively; is peak strain corresponding to peak stress.
3.2. Post-Failure Modulus
To conduct a comprehensive analysis of the SSM stress-strain curve transition, we have referenced the post-failure modulus in this study. The definition of is illustrated in Figure 9 and is defined as follows [28]:
where and denote the failure strain and corresponding strength; and denote the strain and corresponding strength after damage, as displayed in Figure 8.
In principle, determination of SSM’s failure strain and strength should adhere to soil testing method standards by considering stress and strain characteristics. Within pattern I (strain hardening), ranges from 2% to 3%, indicating its associated stress . On the other hand, within pattern II (strain softening), signifies peak stress while represents corresponding strains. Actual post-failure value is derived from observed strain-strain curves which indicate an approximate increase of 1% to 5% beyond failure strains along with their respective strains denoted as .
Besides, the stress-strain relationship can be characterized by the sign of , where a positive value indicates strain hardening and a negative value indicates strain softening (Figure 8). It is evident that is dependent on the confining pressure [28,29].
Based on the definition of post-failure modulus, the quantitative investigation of stress-strain relationship transition can be conducted by analyzing the variation of with respect to . In particular, represents the point of intersection between f () and the horizontal axis, which serves as a critical point indicating the transition in stress-strain relationship. The confining pressure corresponding to is considered as the critical confining pressure for this transition.
3.3. Application of Post-Failure Modulus in Tests
To demonstrate the availability of , Table 3 lists the values of parameters (,) in Equation (9), while Figure 9 presents different critical confining pressures calculated based on the experimental data shown in Figure 5. It should be noted that since parameter values depend on the coordinates of stress-strain curve plotted in Figure 5, there may exist a certain error between measured and tested values. However, this discrepancy has minimal impact on predicting the trend of stress-strain relationship.
3.4. Application of CPM Model in Tests
As illustrated in Figure 10, the stress-strain curve of SSM can be accurately described by Equation (1). The CPM model exhibits high accuracy in depicting stress-strain curves with varying degrees of hardening and softening, as depicted. The determination coefficient R2 consistently exceeds 0.9 for confining pressures of 50 kPa and 100 kPa, indicating the precise depiction of the stress-strain curve by the model, which adequately satisfies engineering applications. Furthermore, it is observed that when , the curves represented by the CPM model exhibit softening behavior; conversely, when , they demonstrate hardening characteristics.
4. Model Verifications
The CPM model not only accurately characterizes the stress-strain behavior observed in the test, but also enables prediction of the critical confining pressure, which serves as a rough indicator for determining stress-strain classification. The validity of this model in describing stress-strain relationships has been verified through measured data from SSM experiments. To further demonstrate its broad applicability to other soils or materials, three cases were examined to validate the suitability of the CPM model and simultaneously predict the critical confining pressure
4.1. Verification on Loess
The consolidated undrained triaxial tests on undisturbed loess samples were conducted by Wang et al [23], with an initial dry density of and water content of . The test results indicate that the stress-strain relationship of the samples exhibits both softening and hardening behaviors. Subsequently, the CPM model was employed to describe the stress-strain relationship under different confining pressures (100, 200, 300, and 400kPa), enabling a comparison with experimental data and prediction of the critical confining pressure as shown in Figure 11. It is evident that >0.92 for all tested confining pressures (100, 200, 300, and 400kPa), indicating excellent agreement between the described results and measured stress-strain curves. Furthermore, based on the definition of post-failure modulus in the CPM model, a value =191kPa (Figure 12) can be obtained which closely matches the calculated value =217kPa using linear interpolation method in CPE model.
4.2. Verification on Municipal Solid Waste Incineration Bottom Ash (MSWIBA)
The stress-strain behavior of MSWIBA was investigated by Xiang et al. [29] through a series of standard consolidated drained triaxial tests, considering different curing ages (3-28 days) and confining pressures (50-400 kPa). Taking a curing time of 28 days as an example, Figure 13 illustrates the variation of stress difference with axial strain in these tests, revealing noticeable softening and hardening relationships. Additionally, Figure 14 presents the stress-strain curves described by the CPM model. Remarkably, the CPM model exhibits complete consistency with experimental data and accurately describes the stress-strain relationship. Notably, a critical confining pressure = 133 kPa is determined (Figure 14), surpassing classical models in terms of accuracy.
4.3. Verification on Lime Reinforced Silt
To enhance the performance of silt, a specific amount of lime was incorporated into the soil sample to rectify the reflection of soil strength and water stability in the mixture [30]. Taking a 5% mixing ratio as an example, the stress-strain curves of lime-improved silt under different confining pressures exhibit similarities to those depicted in Figure 5. When the lime inclusion ratio is 5%, at high confining pressures (200kPa, 300kPa), there is an increase in principal stress difference with axial strain; however, this increase gradually diminishes with further axial strain. The latter half of the curve demonstrates approximate flatness, indicating strain hardening. Conversely, when incorporating 5% lime and subjecting it to test confining pressures of 50kPa and 100kPa, distinct decreases are observed after reaching peak values on the curves, demonstrating strain softening. Similarly, we employed CPM model here to validate its suitability (see Figure 15), from which a transition critical confining pressure =113kPa was deduced (Figure 16). Both results exhibit high precision when compared with experimental data.
5. Transition Mechanism Discussion
Under the same confining pressure, the stress-strain relationship of remolded SSM with different initial water content is not consistent with the development of axial strain. This transformation with varying water content is mianly attributed to the inherent characteristics of silt, which contains a high proportion of fine particles with uniform size and lacks clay particles. Even after compaction reaches maximum dry density, the soil still retains numerous pores due to insufficient clay filling between the pores formed by accumulation of fine particles [31]. These pores provide storage space for water infiltration into soil particles. When the water content is low, the intergranular bonding force in SSM samples is strong. However, as the water content increases, some smaller particles detach and aggregate into larger particles due to weaker bonding forces between particles. This leads to a decrease in mechanical interaction among larger particles and an increase in porosity, resulting in reduced intergranular bonding force and internal friction angle [32]. Consequently, both strength and elastic modulus of the samples decline. As a result, specimens exhibit lower resistance to deviational stress during shear tests, which affects the shape of their stress-strain curve. In particular, there will exist a critical water content point between stress softening and hardening under certian confining pressure.
Also, the stress-strain transition influenced by confining pressure can be described as follows. When the confining pressure is relatively low, the particles continue to undergo compression under axial load, resulting in a decrease in pore volume between the particles and a gradual increase in deviational stress of the sample. Once the deviating stress reaches its peak, the pore volume between particles is minimized and the particle matrix begins to fail. However, this failure process of particle skeleton occurs slowly, leading to a gradual decrease in deviational stress of SSM sample with strain. In other words, the stress-strain curve exhibits strain softening behavior. During triaxial shear testing at relatively high confining pressures, pores within SSM samples are continuously compressed as bias stress gradually increases before reaching its peak value. As soon as pore volume is minimized to its maximum extent, particle skeleton fracture should occur; however, due to high confining pressure acting on it, axial bearing capacity of particle skeleton increases and prevents its failure [33,34]. Thus, partial stresses within particle skeleton increase but do so slowly with increasing strain until they eventually stabilize, demonstrating strain hardening behavior.
6. Conclusions
The stress-strain relationship of soil plays a crucial role in determining the accuracy and reliability of numerical calculations in geotechnical engineering. It is of utmost importance to accurately describe and predict the stress-strain behavior of materials under various stress conditions. In this study, we employ the CPM model to precisely characterize and forecast the stress-strain relationship of SSM subjected to different confining pressures. The key findings are summarized as follows:
By introducing a transition factor, the CPM model is formulated to comprehensively depict both strain softening and hardening curves. This unified nonlinear equation combines the Duncan-Chang model with the NHRI model, effectively elucidating the phenomena of softening and hardening.
Through the definition of the post-failure modulus, the CPM model not only characterizes the stress-strain relationship but also quantitatively determines the critical confining pressure. This critical confining pressure can be utilized to discern the strain type under specific confining pressures and predict the stress-strain curve under various confining pressures.
To enhance the applicability of the CPM model, test results and another three practical cases are presented to validate its suitability in dam decomposition, loess, municipal solid waste incineration bottom ash (MSWIBA), as well as lime reinforced silt soil. It offers a straightforward approach for preliminary strain prediction and facilitates the identification of stress-strain transitions.
Transition mechsnism of stress-strian curves under different water content and confining pressure are maily attributed to inherent characteristics of silt in SSM and the hysteresis of soil skeleton deformation, respectively. A threshold confining pressure and moisture content do exist to tranfrom from strain softening to hardening.
Overall, this study contributes to the understanding of stress-strain transitions in different types of soils and provide valuable information for geotechnical engineering practices. Future research should focus on expanding the understanding of stress-strain transitions in diverse operation condition. This includes exploring the effects of temperature and rate of loading on stress-strain relationships. Additionally, incorporating advanced computational methods to simulate stress-strain transitions could provide deeper insights. Furthermore, the development of new constitutive models that can accurately predict stress-strain transitions under complex loading conditions is crucial.
Author Contributions
Ya Wang: Conceptualization, Methodology, Writing original draft; Liucheng Chang; Numerical analysis, Validation. Hongyu Wang: Writing review& editing, Resource. Jinghui Wang: Rescources.
Funding
This research was funded by the Outstanding Youth Project of Education Department of Ningxia Hui Autonomous Region (Grant No: NGY2022002) and the Natural Science Foundation of Ningxia (Grant No:2023AAC03387).
Informed Consent Statement
Not applicable.
Data Availability Statement
Data will be made available on request.
Acknowledgments
The authors would like to acknowledge all these sources of financial support and express the sincerest gratitude. In addition, the authors greatly appreciated the reviewers for their valuable comments and suggestions and the professionals for polishing the language for improving this paper.
Conflicts of Interest
The authors declare that they have no known competing financial interest or personal relationships that could have appeared to influence the work reported in this paper.
References
- Ran D, Luo Q, Zhou Z, Wang G, Zhang X. Sediment retention by check dams in the Hekouzhen-Longmen Section of the Yellow River. Int J Sediment Res. 2008;23(2):159-66.
- Hou K, Qian H, Zhang Yuting, Zhang Qiying, Qu Wengang. New insights into loess formation on the southern margin of the Chinese Loess Plateau. CATENA, 2021, Volume 204, 105444.
- Quiñonero-Rubio JM, Nadeu E, Boix-Fayos C, De Vente J. Evaluation of the effectiveness of forest restoration and check-dams to reduce catchment sediment yield. Land Degrad Dev. 2016;27(4):1018-31.
- Zhao, J., Luo, X., Ma, Y., Shao, T., and Yue, Y., Soil characteristics and new formation model of loess on the Chinese Loess Plateau. 2017, Geosciences.
- Samad, N., Chauhdry, M. H., Ashraf, M., Saleem, M., Hamid, Q., Babar, U., Tariq, H., and Farid, M. S., Sediment yield assessment and identification of check dam sites for Rawal Dam catchment: Arabian Journal of Geosciences. 2016.
- Dong H, Song Y, Chen L, Liu H, Fu X, Xie M. Soil erosion and human activities over the last 60 years revealed by magnetism, particle size and minerals of check dams sediments on the Chinese Loess Plateau. Environmental earth sciences. 2022;81(5):1-15.
- Wang, Y; Wang, HY and Guo, LP, Microstructural Analysis on Shear Behavior of New-fill and Silt Interface in Check Dam. Journal of soils and sediment,2024:24 (9), pp.3223-3237.
- Chang, LC; Wang, Y and Wang, HY. Influence of sand content on mechanical properties of sand-silt mixtures from check dam deposits in the Loess Hilly of Ningxia, China.Plos one. 2023; 18 (11).
- Pongpipat, A., Phimmawat, I., and Victor, N. K., Three-dimensional stress–strain and strength behavior of silt–clay transition soils.Canadian Geotechnical Journal. 2023.
- Monkul MM, Ozden G. Compressional behavior of clayey sand and transition fines content. Eng Geol. 2007;89(3-4):195-205.
- Xenaki VC, Athanasopoulos GA. Liquefaction resistance of sand–silt mixtures: an experimental investigation of the effect of fines. Soil Dyn Earthq Eng. 2003;23(3):1-12.
- Sadrekarimi, A. Influence of fines content on liquefied strength of silty sands. Soil Dyn Earthq Eng. 2013;55:108-19.
- Duncan, J M, and Chang, C Y, Nonlinear analysis of stress and strain in soils. Journal of the Soil Mechanics and Foundations Division, ASCE, 1970,96(5), 1629-1653.
- Wang, W., Song, X.J., Ling, H., Lu, T.H., Zhou, G.W.. Composite exponential-hyperbolic model for stress-strain curve of seashore soft soil. China Journal of Geotechnical. Engineering. 2010 b,32(9):1455-1459.
- Wang L Q, Lu Z G and Shao S J, Composite power-exponential nonlinear model of rock and soil mass. Chinese Journal of Rock Mechanics and Engineering, 2017,36(5), 10.
- Wang W, Ling H, Xu S D, et al.Composite Tangent-Exponent Model for Skeleton Stress-Strain Curve of Soft Soil under Dynamic Loading.Advanced Materials Research, 2010, 108-111:1092-1096.
- Yin D.S.,Ren J.J., He C.L. Stress-stain relation of soft soil based on fractional calculus operators theory. Chinese Journal of Rock Mechanics and Engineering,2009,28(Supp.1): 2973-2979.
- Sheng Z J.a nonlinear dilatant stress-strain model for soils and rock materials. Hydro-Science and engineering,1986.4:3-16.
- Al-Shayea, N., Abduljauwad, S., Bashir, R., Al-Ghamedy, H., and Asi, I. Determination of parameters for a hyperbolic model of soils. Geotechnical Engineering, 2003,156(GE2),105-117.
- Liu X, Liu J, Tian Y, Chang D, Hu T. Influence of the freeze-thaw effect on the Duncan Chang model parameter for lean clay. Transp Geotech. 2019(21):1-9.
- Jia P, Khoshghalb A, Chen C, Zhao W, Dong M, Esgandani GA. Modified Duncan-Chang constitutive model for modeling supported excavations in granular soils. International journal of geomechanics. 2020;20(11):1-13.
- Wang Y Q, Xin. H. B., Stable deformation characteristics of Dashihe tailing, Journal of Hydraulic Engineering, 1995, 11:56-62.
- Wang L, Li K, Wang Z, Description and prediction of stress-strain curve of loess. Engineering Geology, 2022.
- Huang B, Xu R Q, Wang J C, Soil stress-strain relationship transition curve and parameter study. Cryogenic architectural technology, 2006(1):3.
- Y Wu, N Li XZ Wang, Cui et al., Experimental investigation on mechanical behavior and particle crushing of calcareous sand retrieved from South China Sea. Engineering Geology,2021 (280),105932.
- Wu Y, Cui J, Huang et al. Correlation of Critical State Strength Properties with Particle Shape and Surface Fractal Dimension of Clinker Ash, International Journal of Geomechanics, 2021:(21) 6.
- ASTM. 2006.Standard practice for classification of soils for engineering purposes (unified soil classification system).ASTM D2487-11. West Conshohocken, PA:ASTM.
- Wang CH, Li GX. 2001. Analysis of problem of pattern transition in stress-strain relations of soils. Rock & Soil Mechanics. 25(8):1185–1190. (In Chinese).
- Xiang G. S, Song D.Q. and Zhuo C. Investigated stress-strain relationships of municipal solid waste incineration bottom ash, Natural Hazards and Risk,2020,11:1,2431-2448.
- Hao J.B., Wei X.M., Yao J., et al. Strength characteristics and microstructure analysis of wheat straw reinforced soil. Journal of Tongji University (Natural Science), 2018, 47(06).
- Gitau A N, Gumbe L O, Biamah E K.Influence of soil water on stress-strain behaviour of a compacting soil in semi-arid Kenya.Soil & Tillage Research, 2006, 89(2):144-154.
- Maziyar A, Erfan C, and Mohammad M, Behavior of unsaturated sand-silt mixture through equivalent intergranular void ratio concept. Journal of GeoEngineering, 2020: 15(3):109-121.
- Pongpipat A, Jerry A. Y., Victor N. K, Stress-Strain and Strength Characteristics of Silt-Clay Transition Soils, Journal of Geotechnical and Geoenvironmental Engineering, 2012,138(10).
- Li Q, Xu X, Hu J, et al.Investigation of unsaturated frozen soil behavior: Phase transformation state, post-peak strength, and dilatancy.Soils and foundations, 2018, 58(4):928-940.
Figure 1.
Upstream sediment heightening fill method diagram (Revised from [7]).
Figure 1.
Upstream sediment heightening fill method diagram (Revised from [7]).
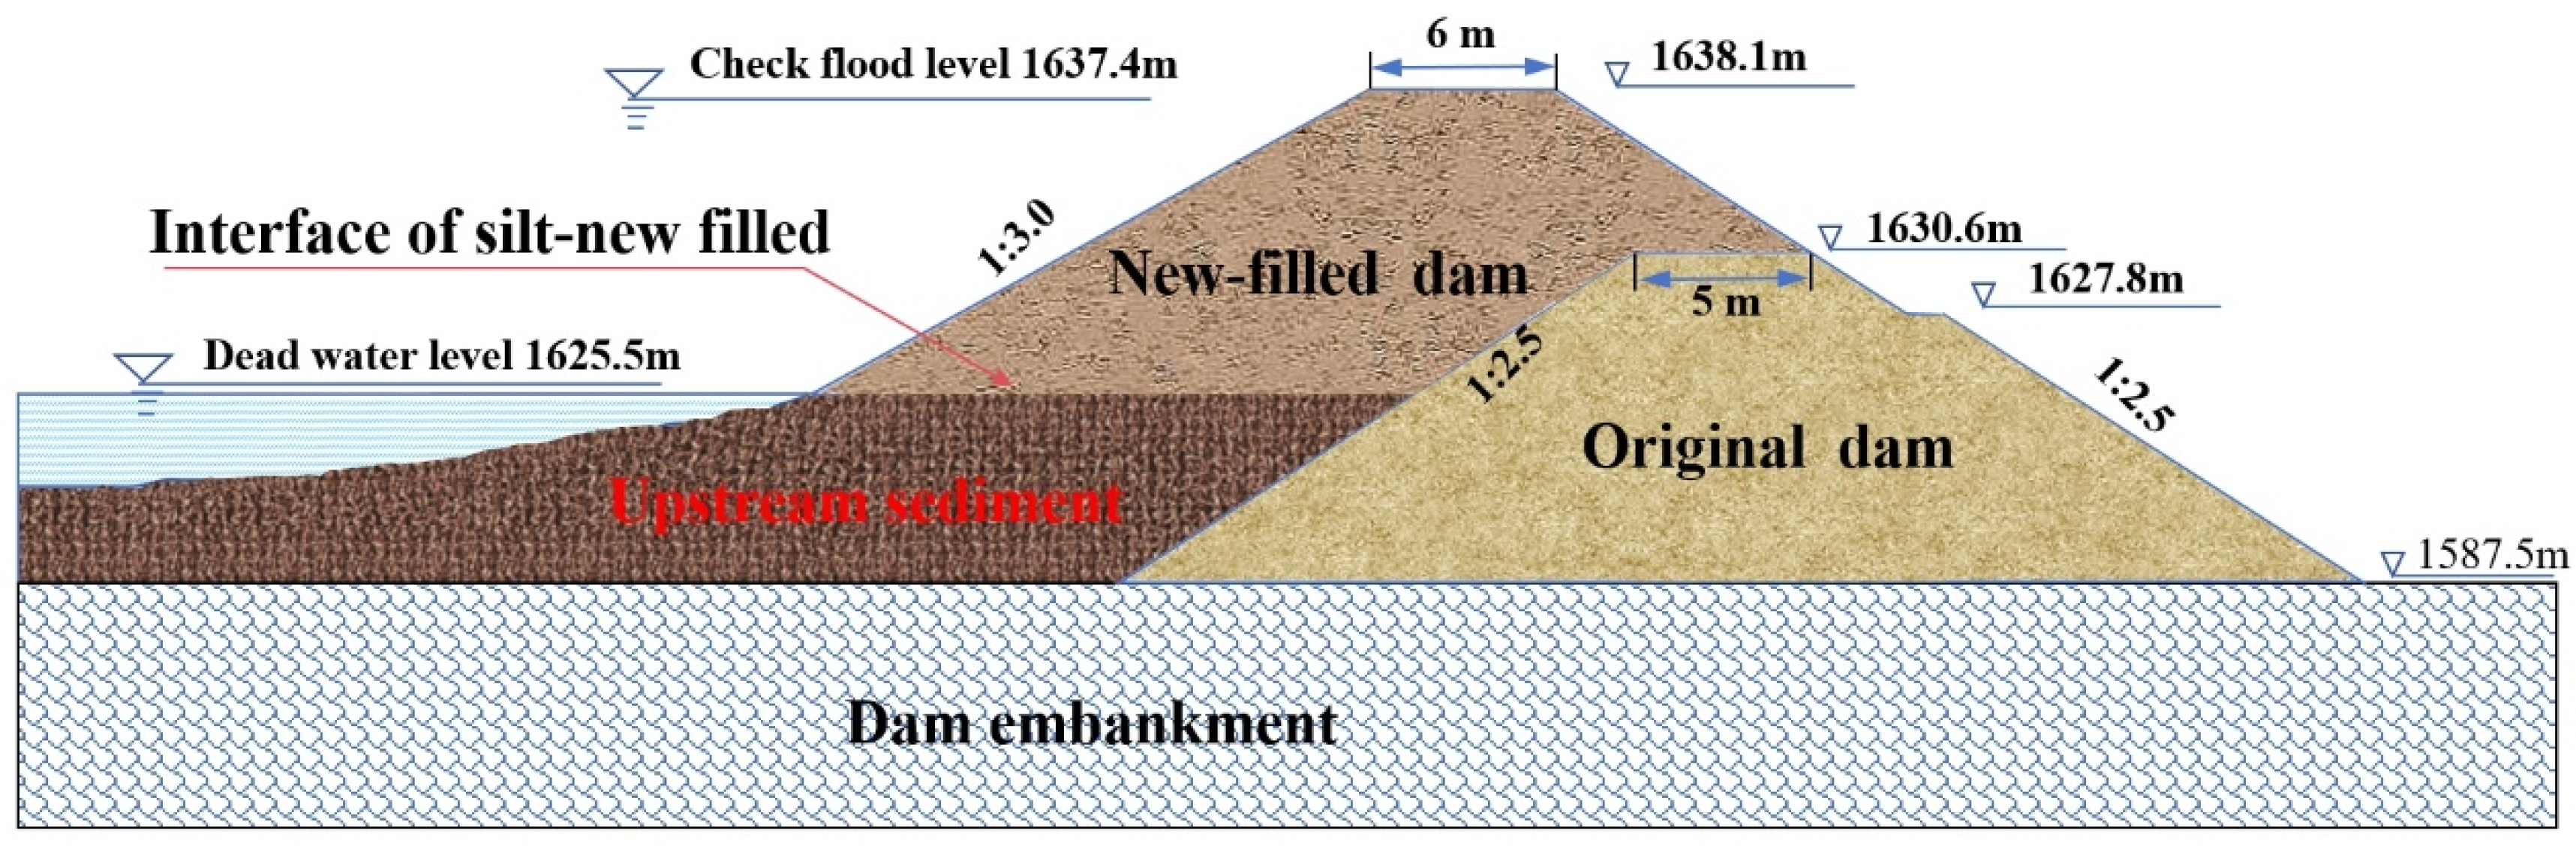
Figure 2.
Location of loess site and loess for test.
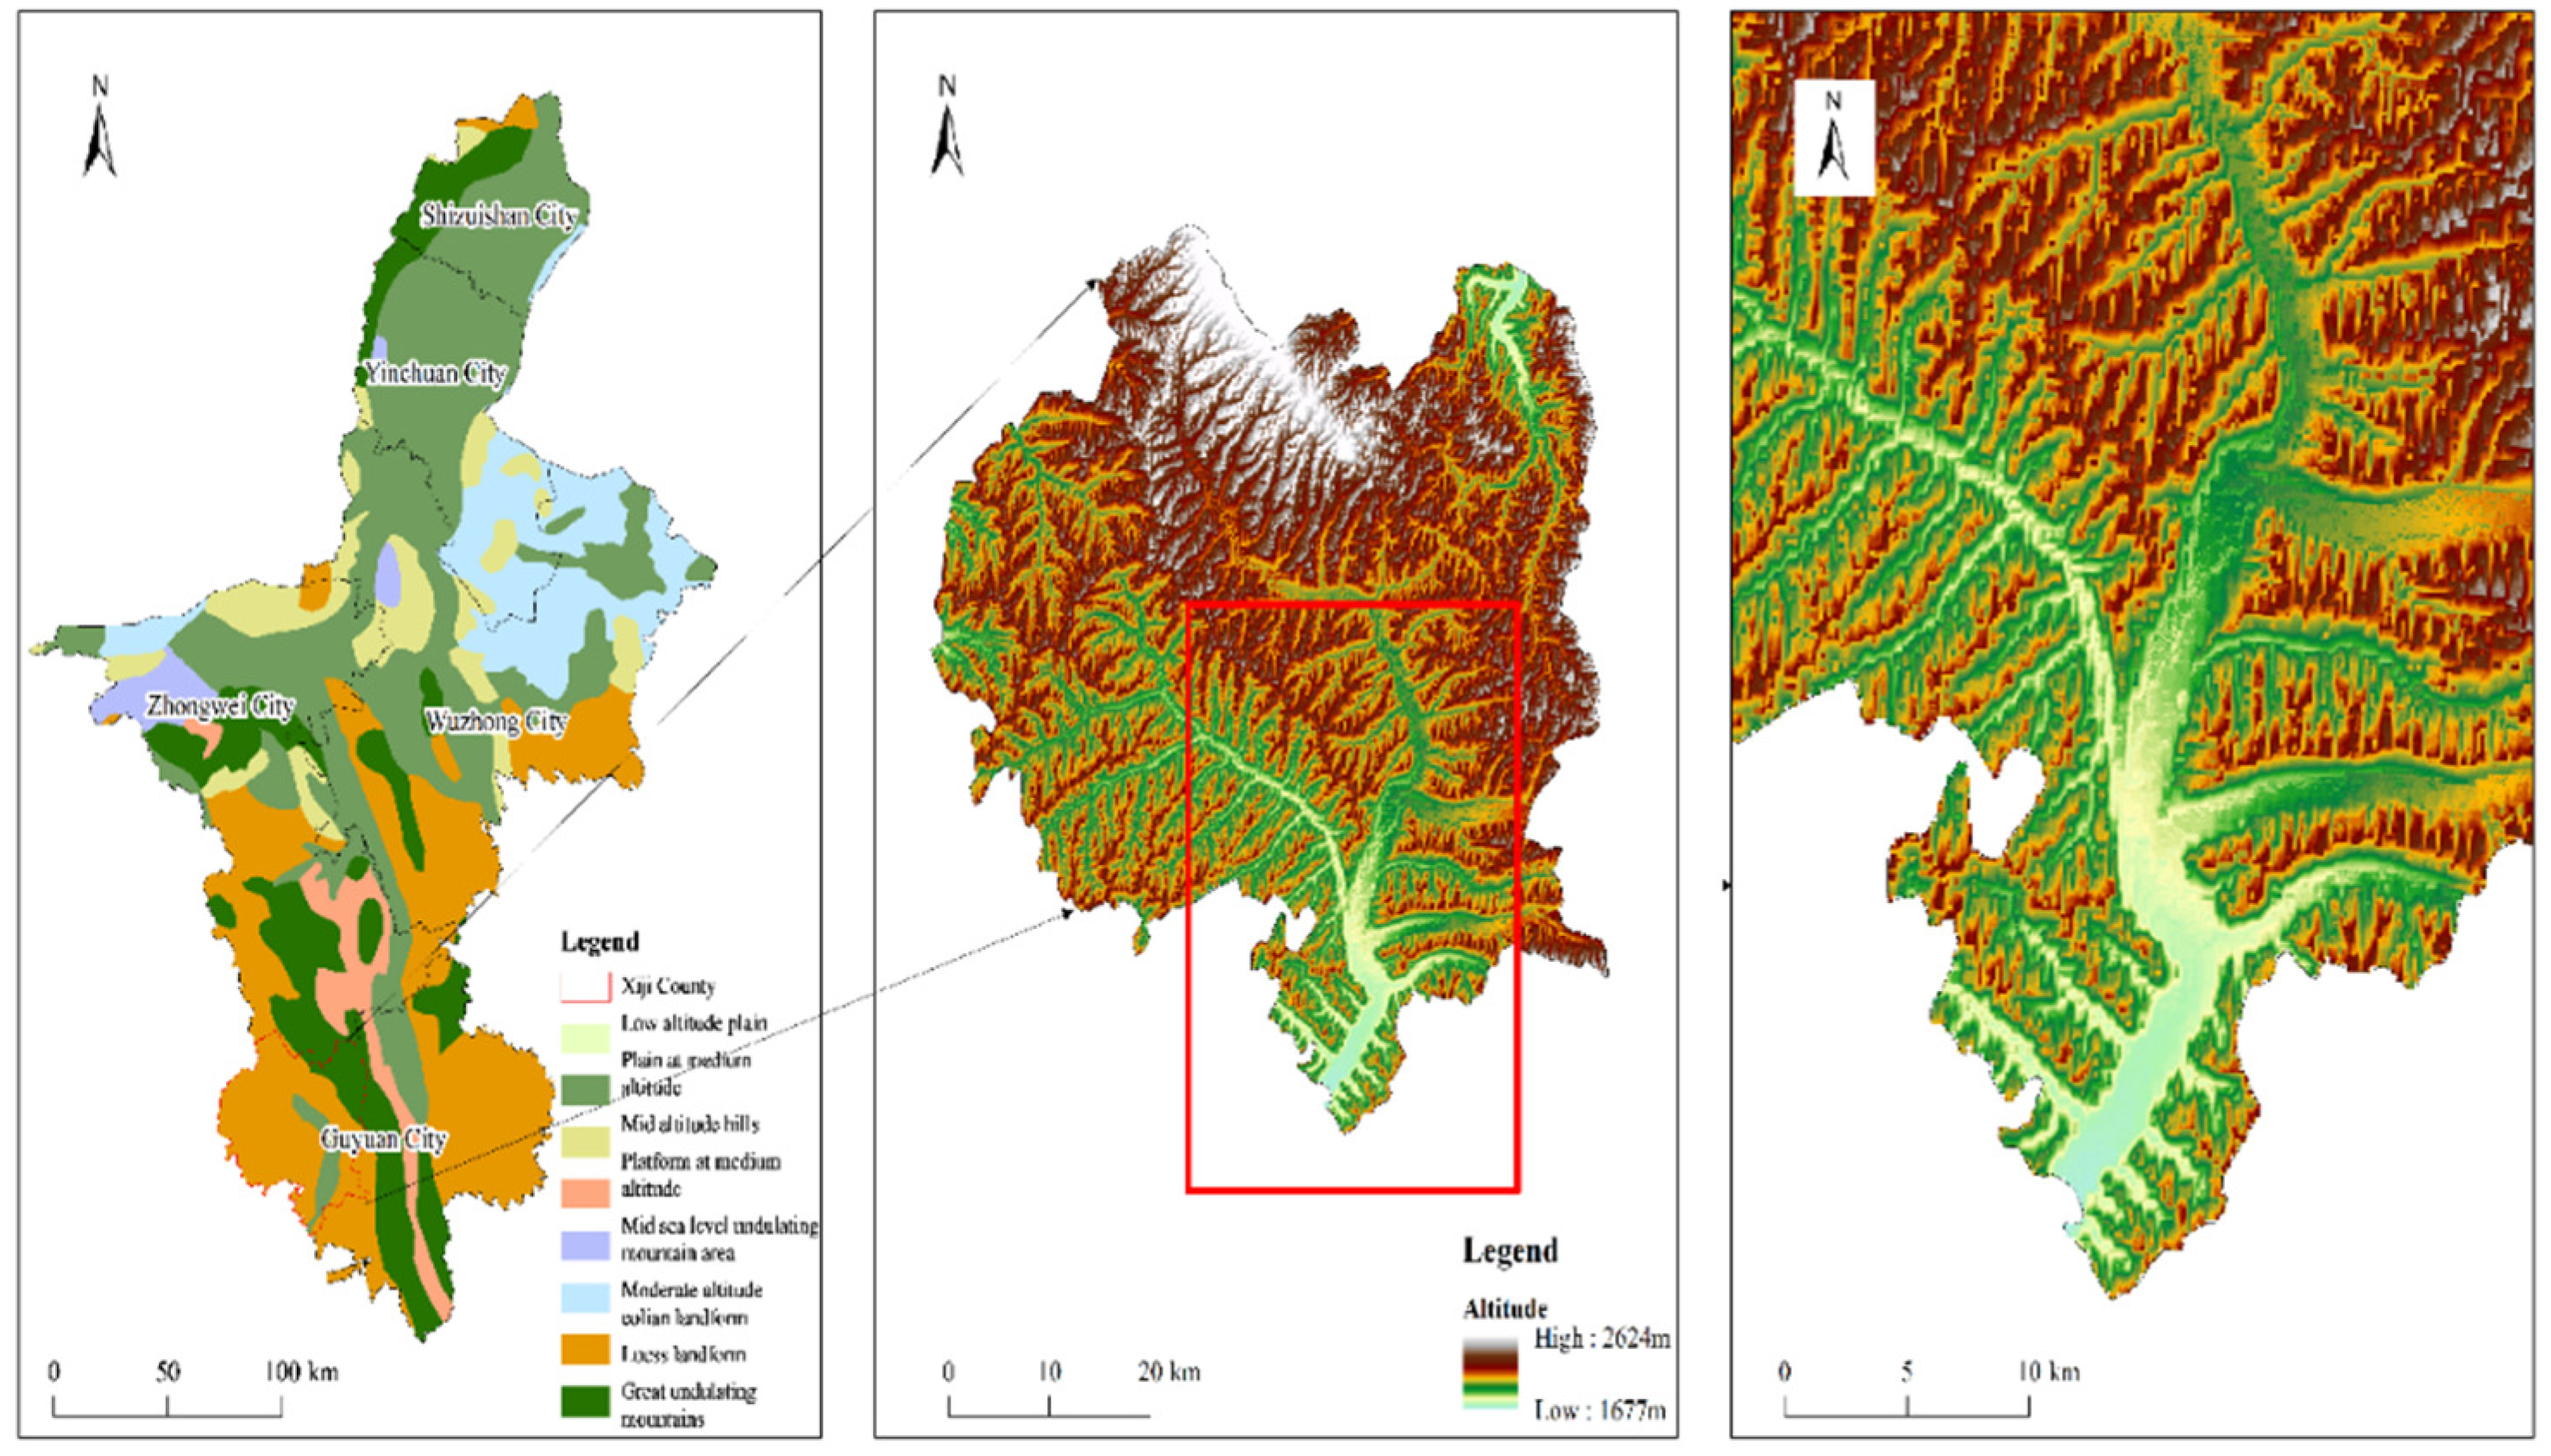
Figure 3.
Particle size distribution curve of SSM.
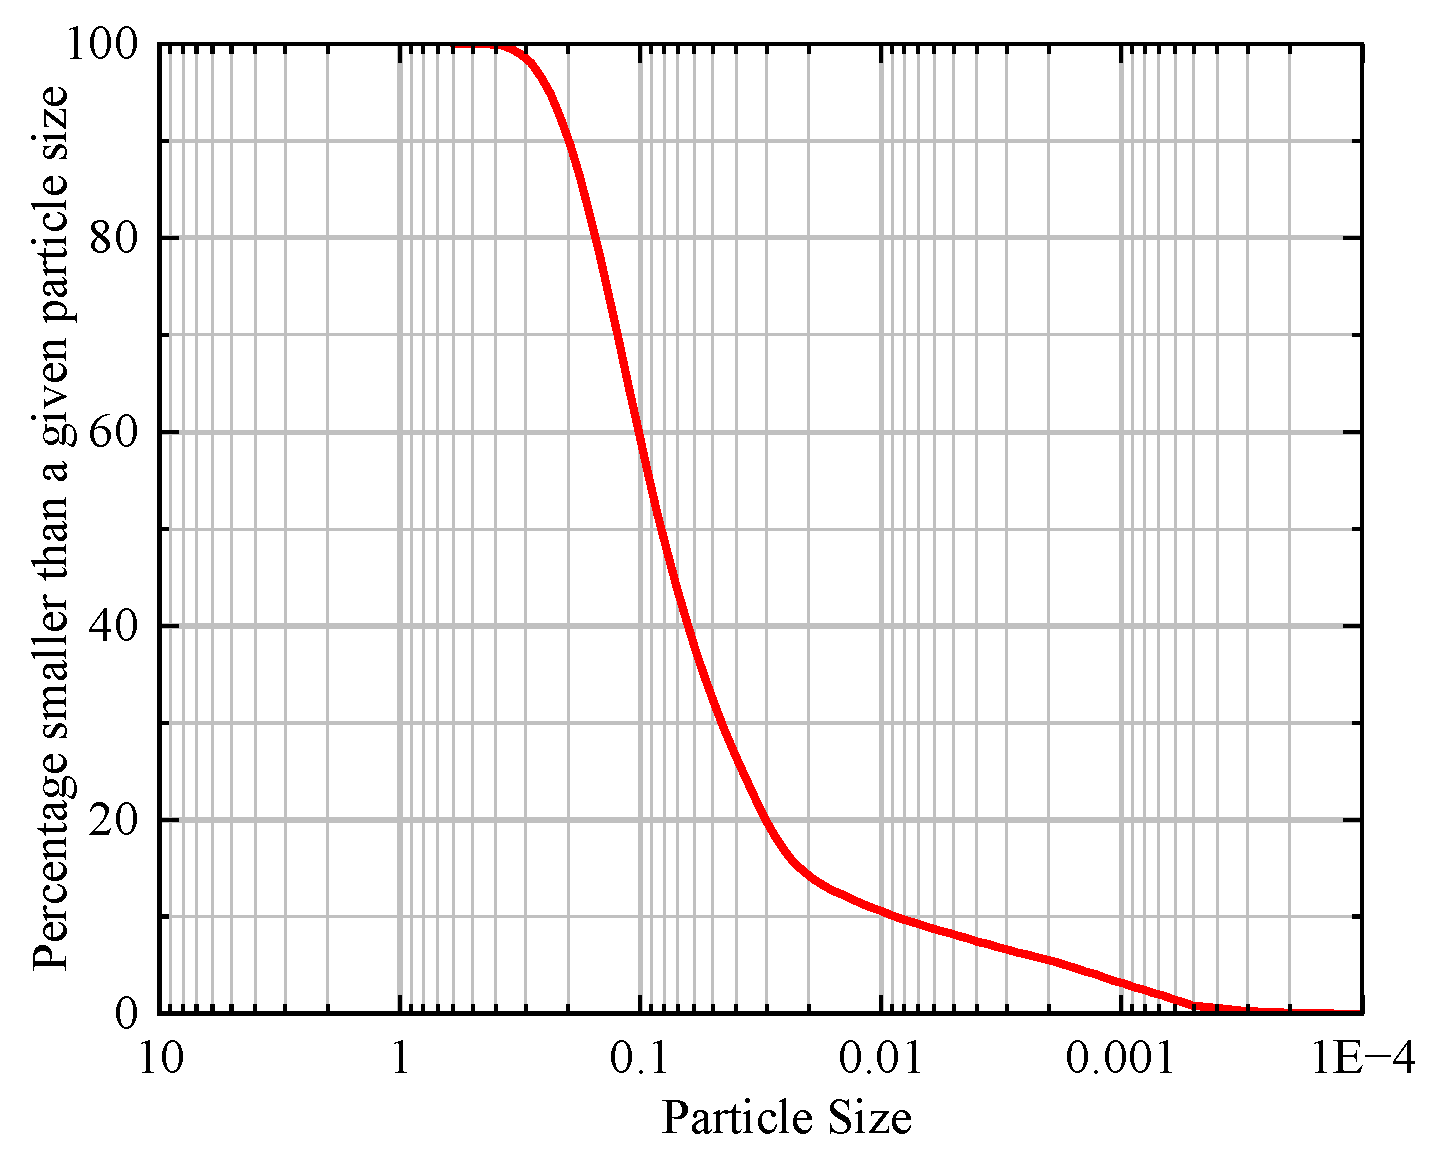
Figure 4.
The schematic diagram of stress-strain triaxial apparatus (GSY-SYL-100) 1 - Lifting table; 2 - Pore pressure sensor; 3 - Pressure gauge; 4 - Piston ejector rod; 5 - Pressure sensor; 6 - Displacement meter; 7 - Testing machine; 8 - Osmotic actuator; 9 - Confining pressure actuator; 10 - Data acquisition box; 11- Computer.
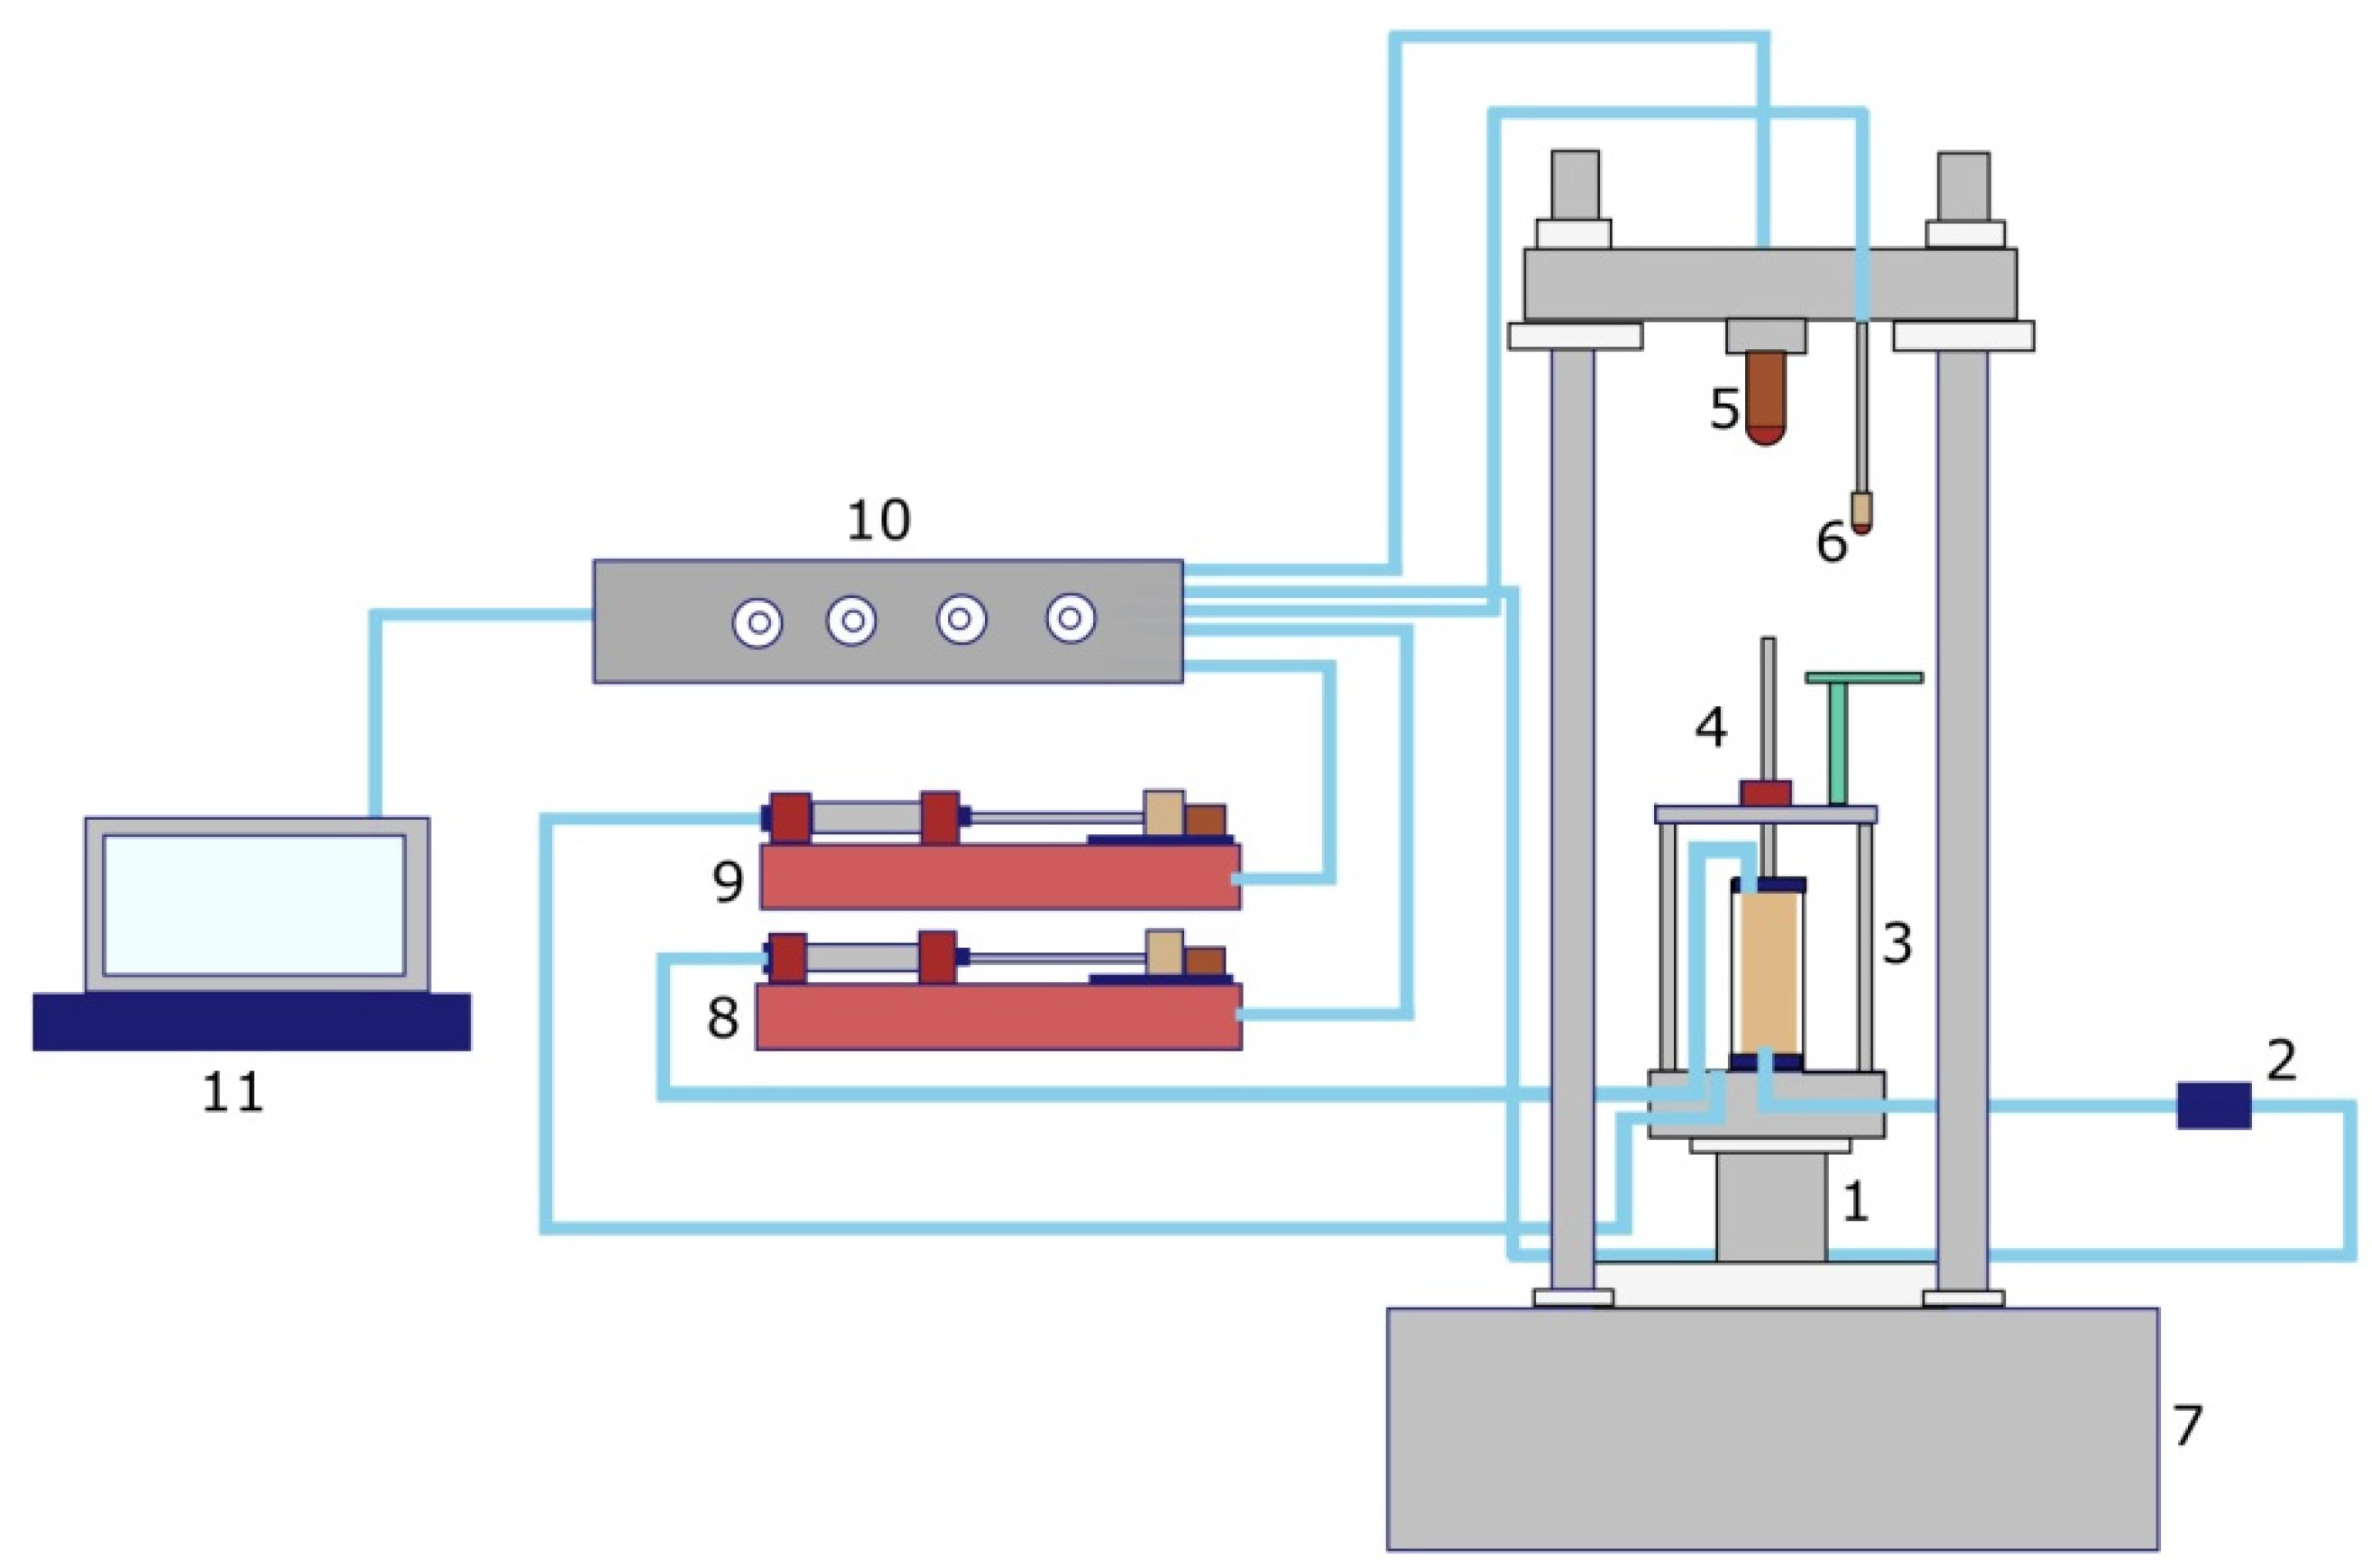
Figure 5.
The stress-strain curves of are SSM under different water content.
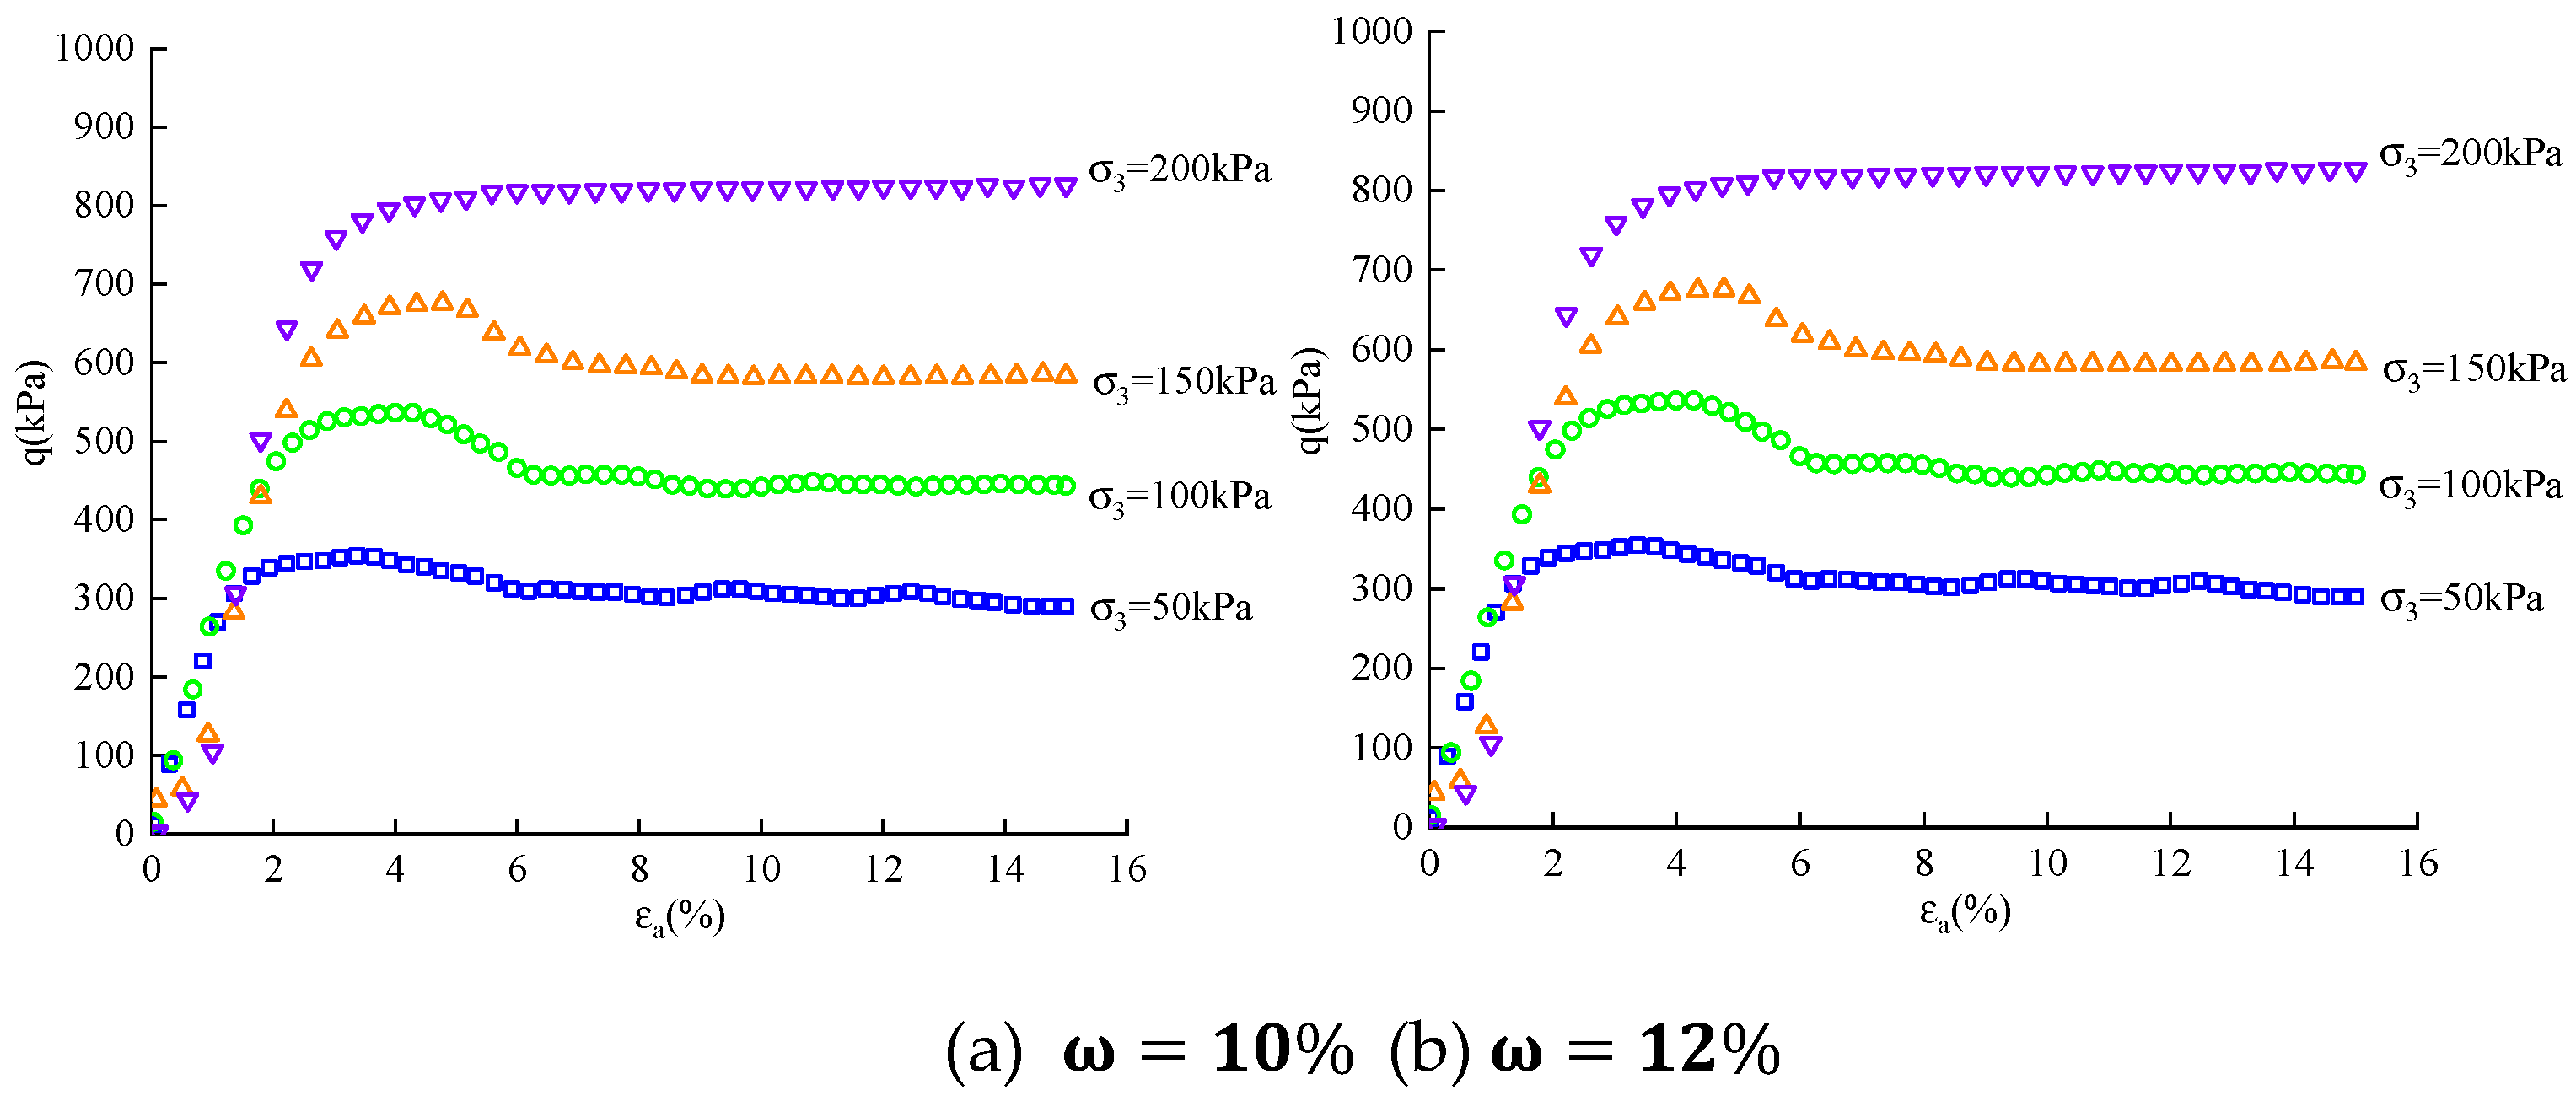
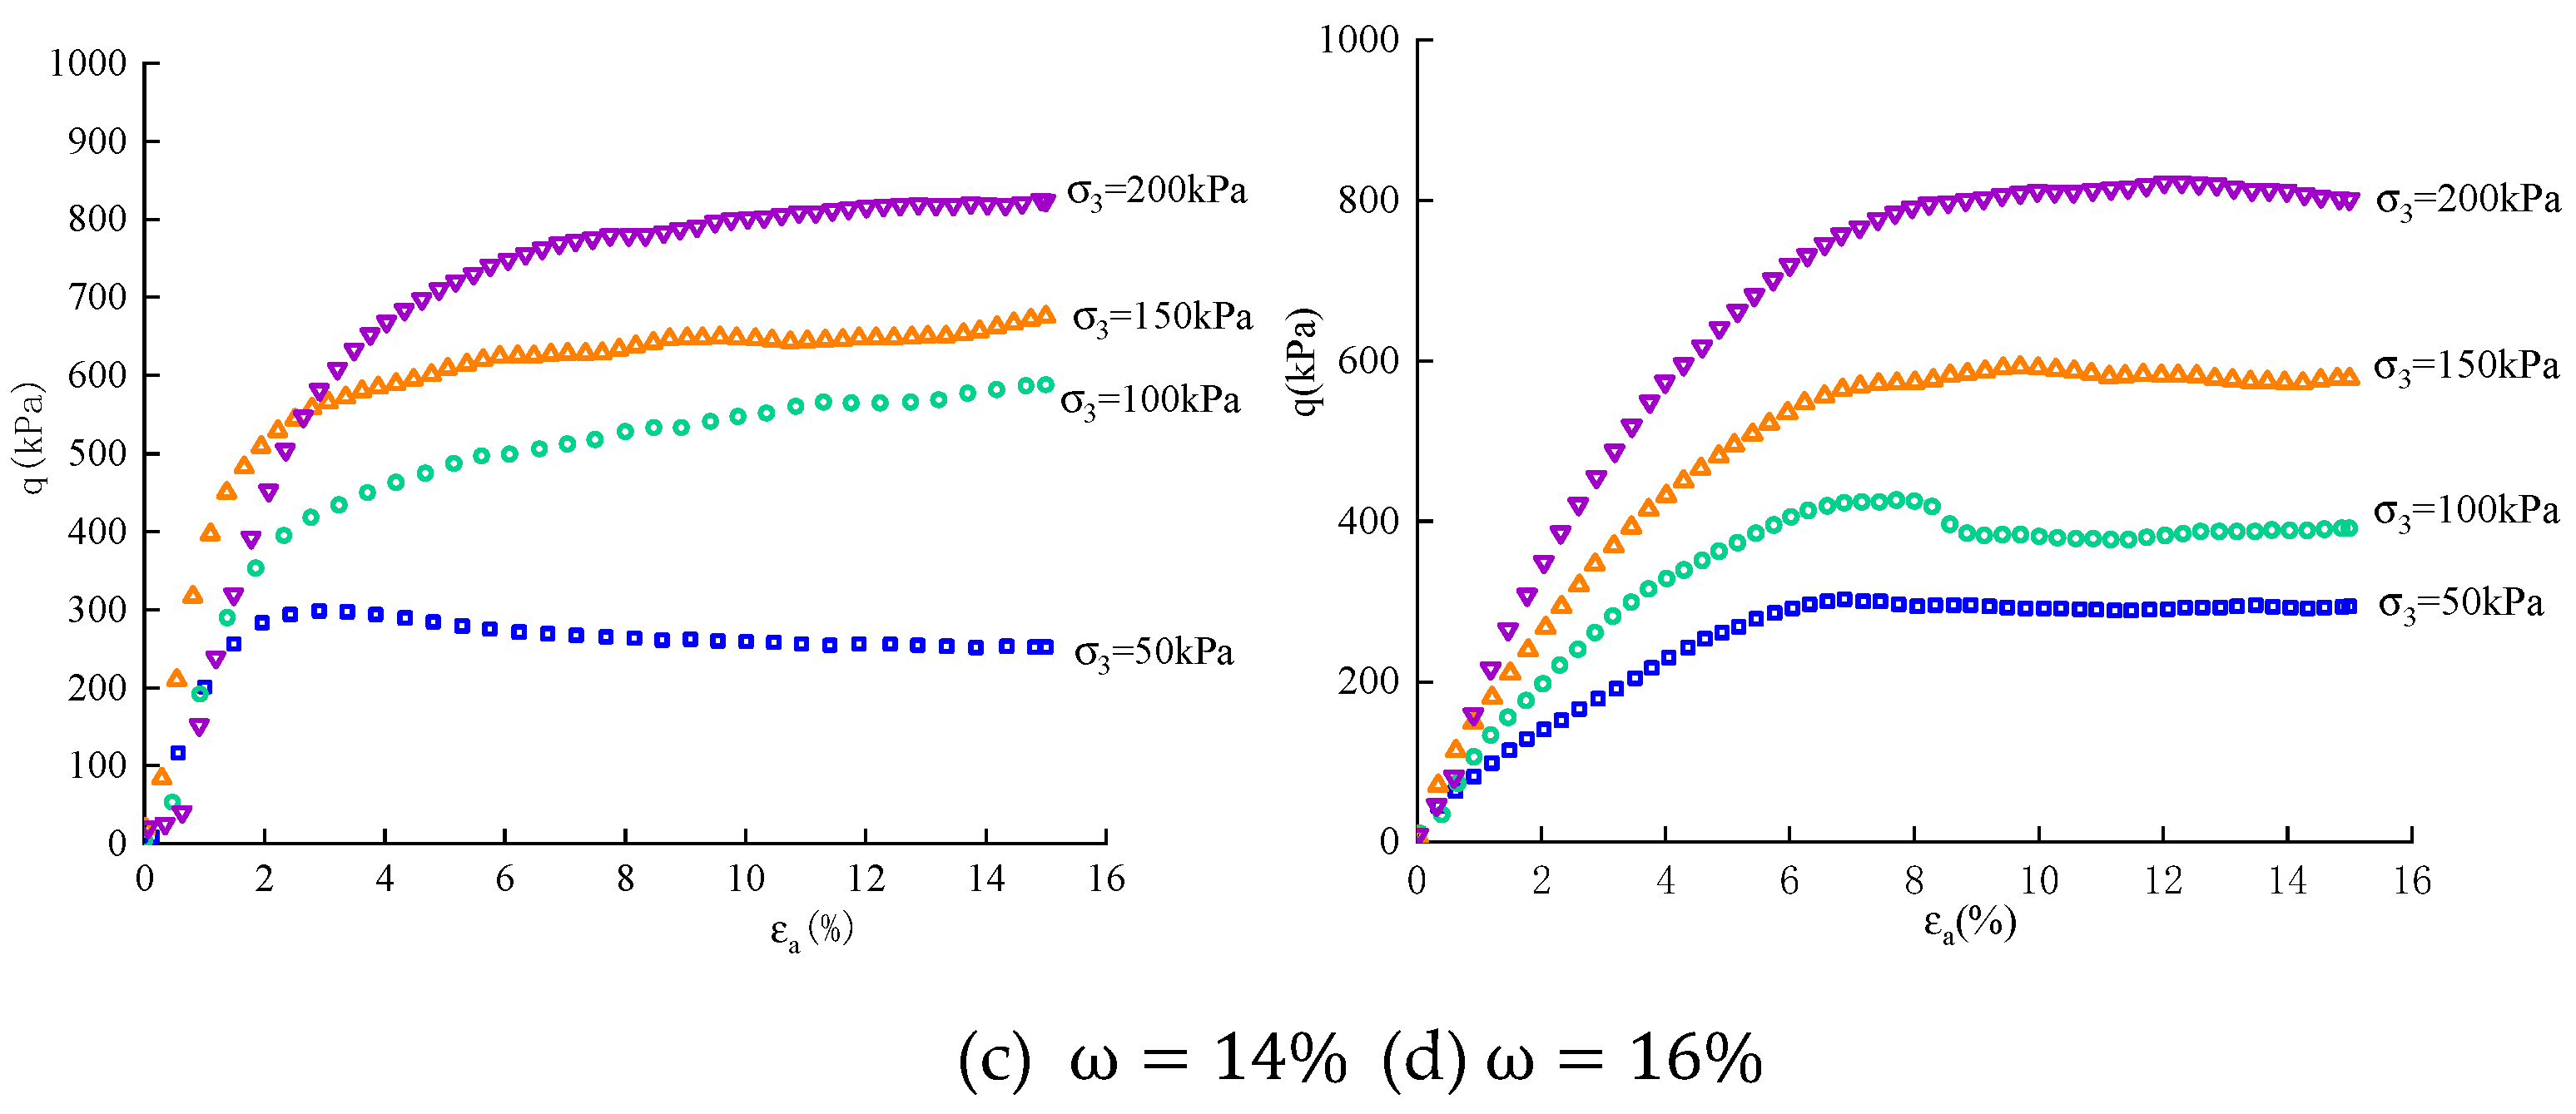
Figure 6.
The relationship between peak deviator stress and moisture content.
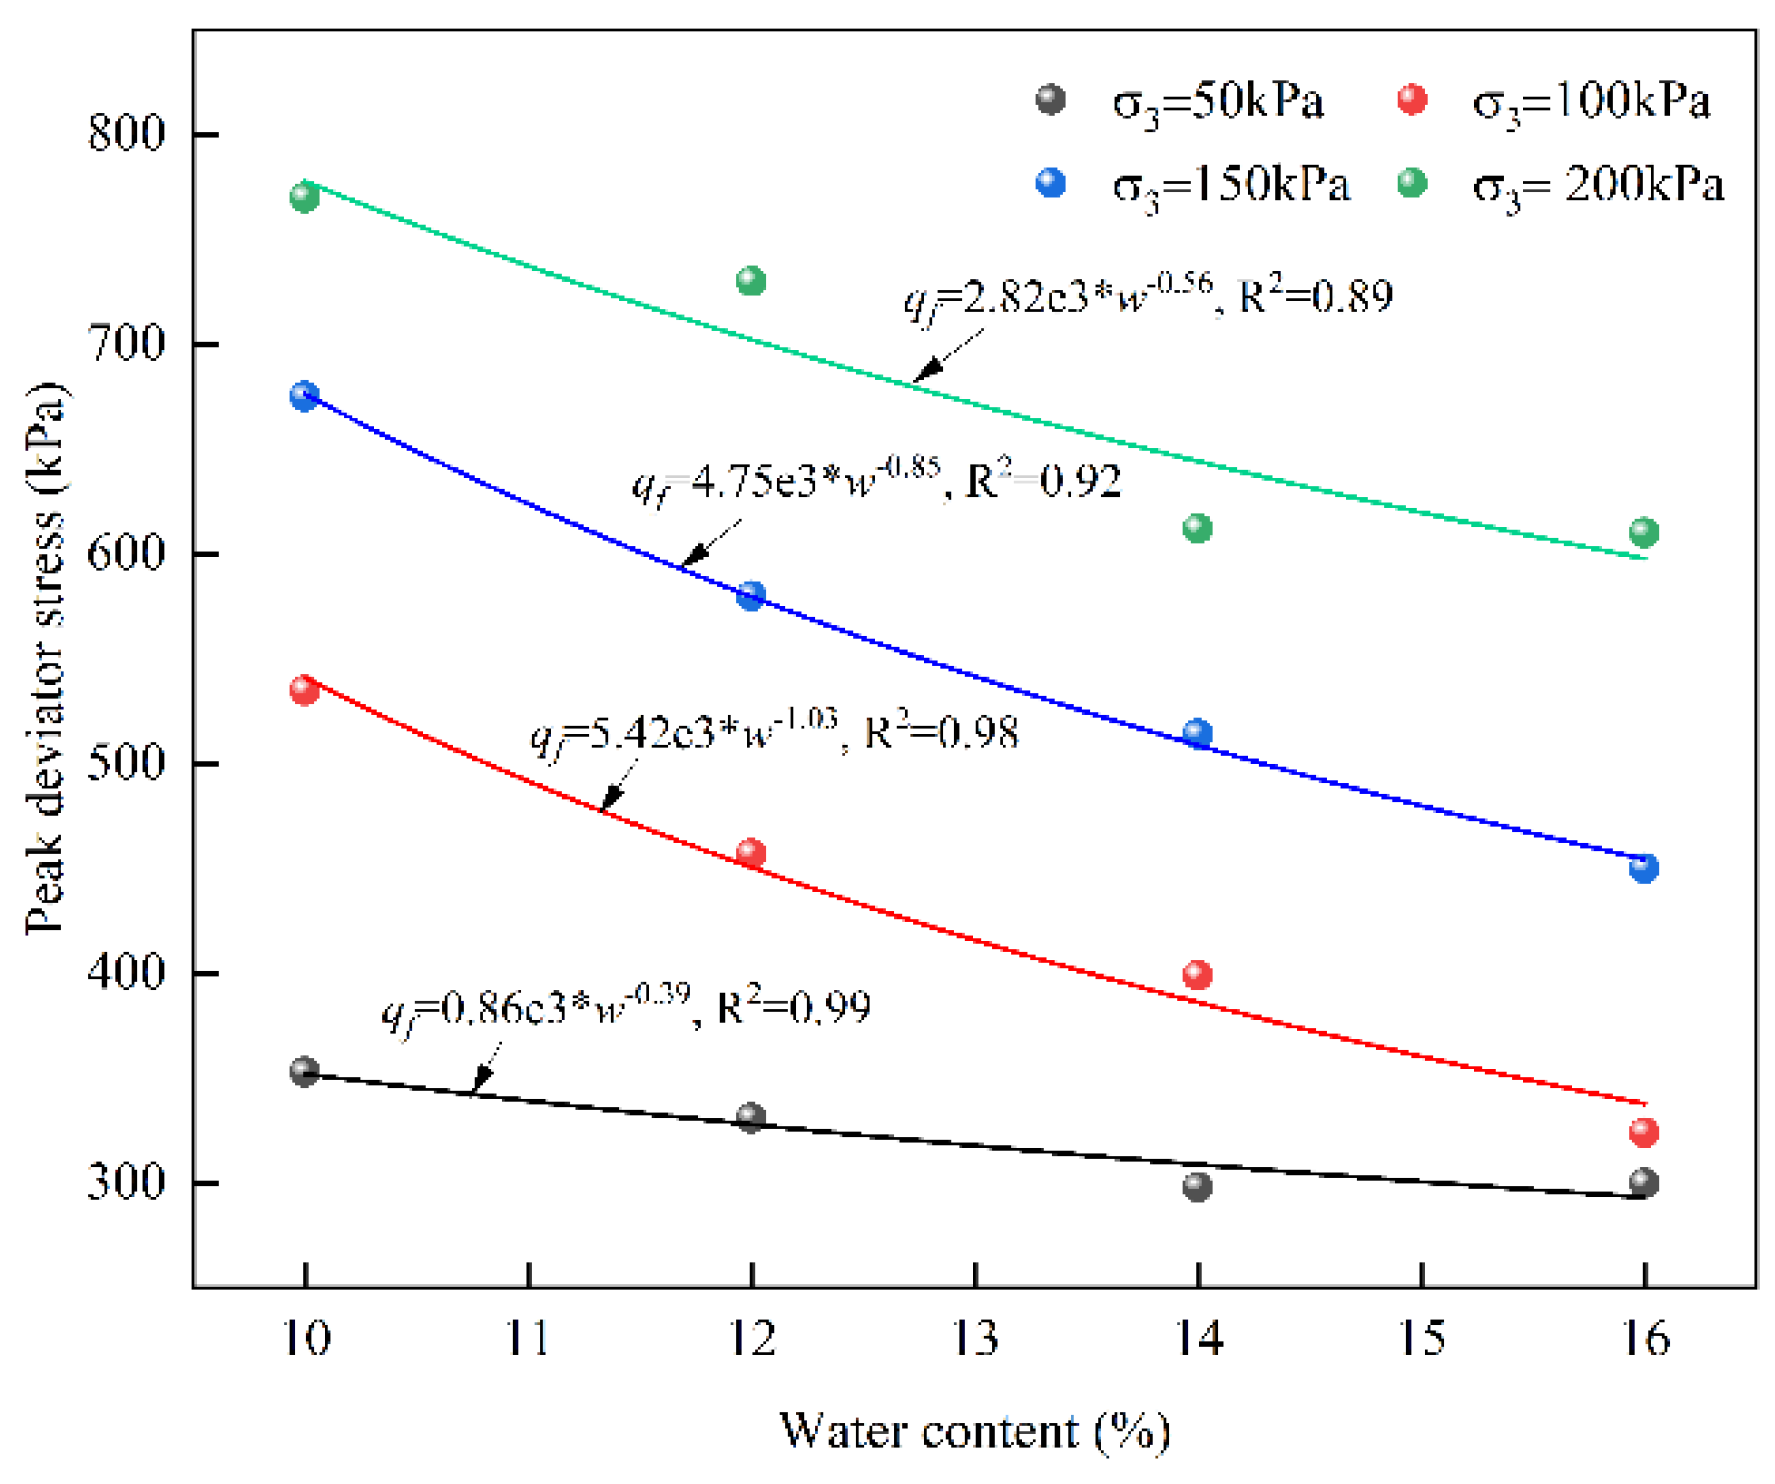
Figure 7.
The physical meaning of model Parameters.
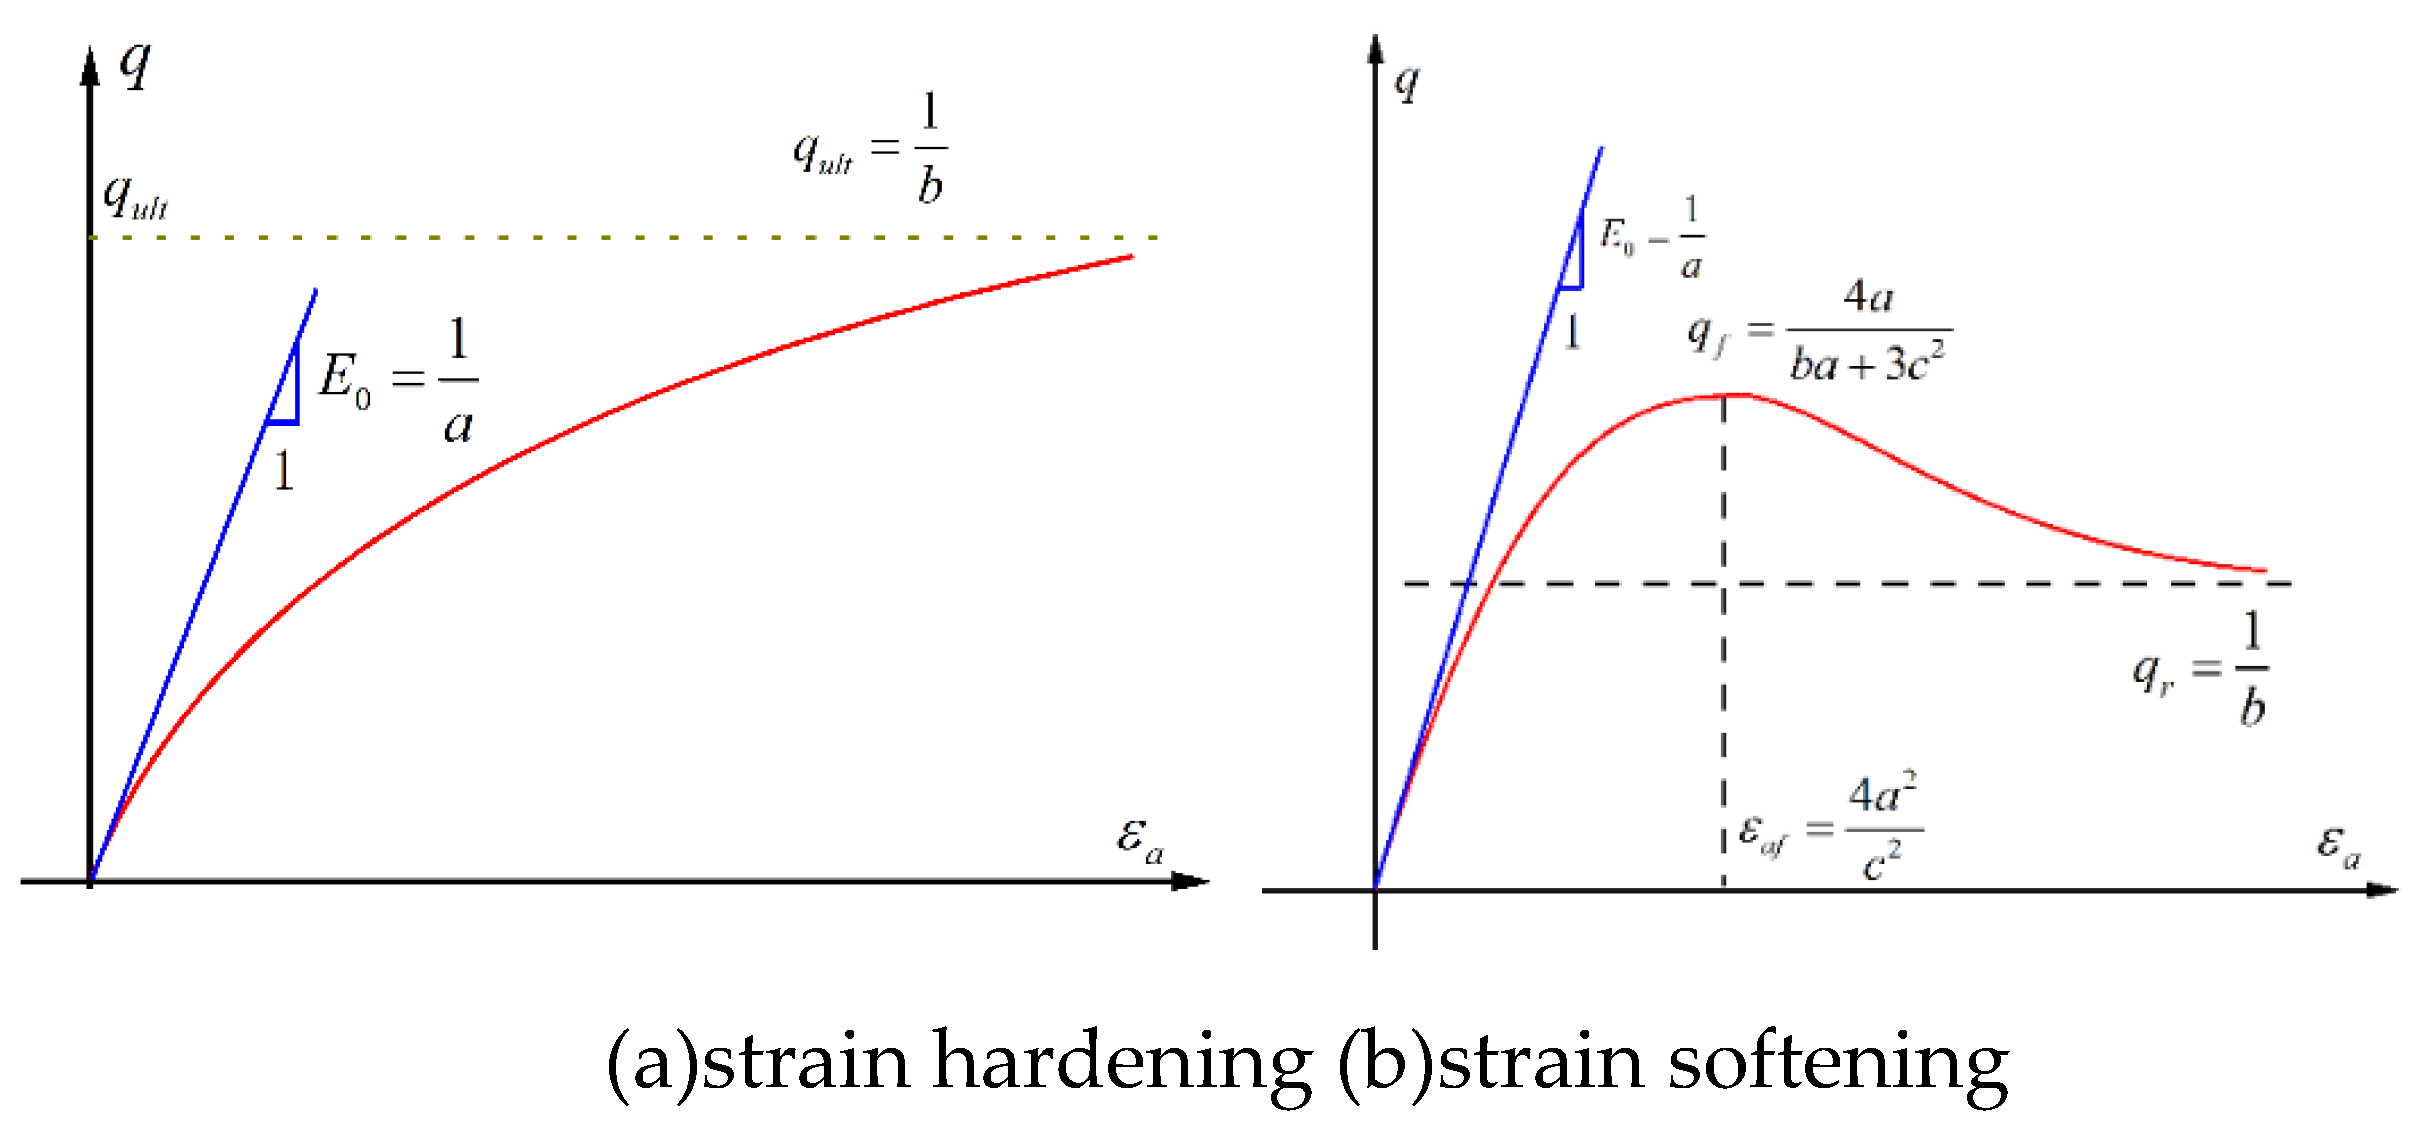
Figure 8.
The definition of post-failure modulus [29].
Figure 8.
The definition of post-failure modulus [29].
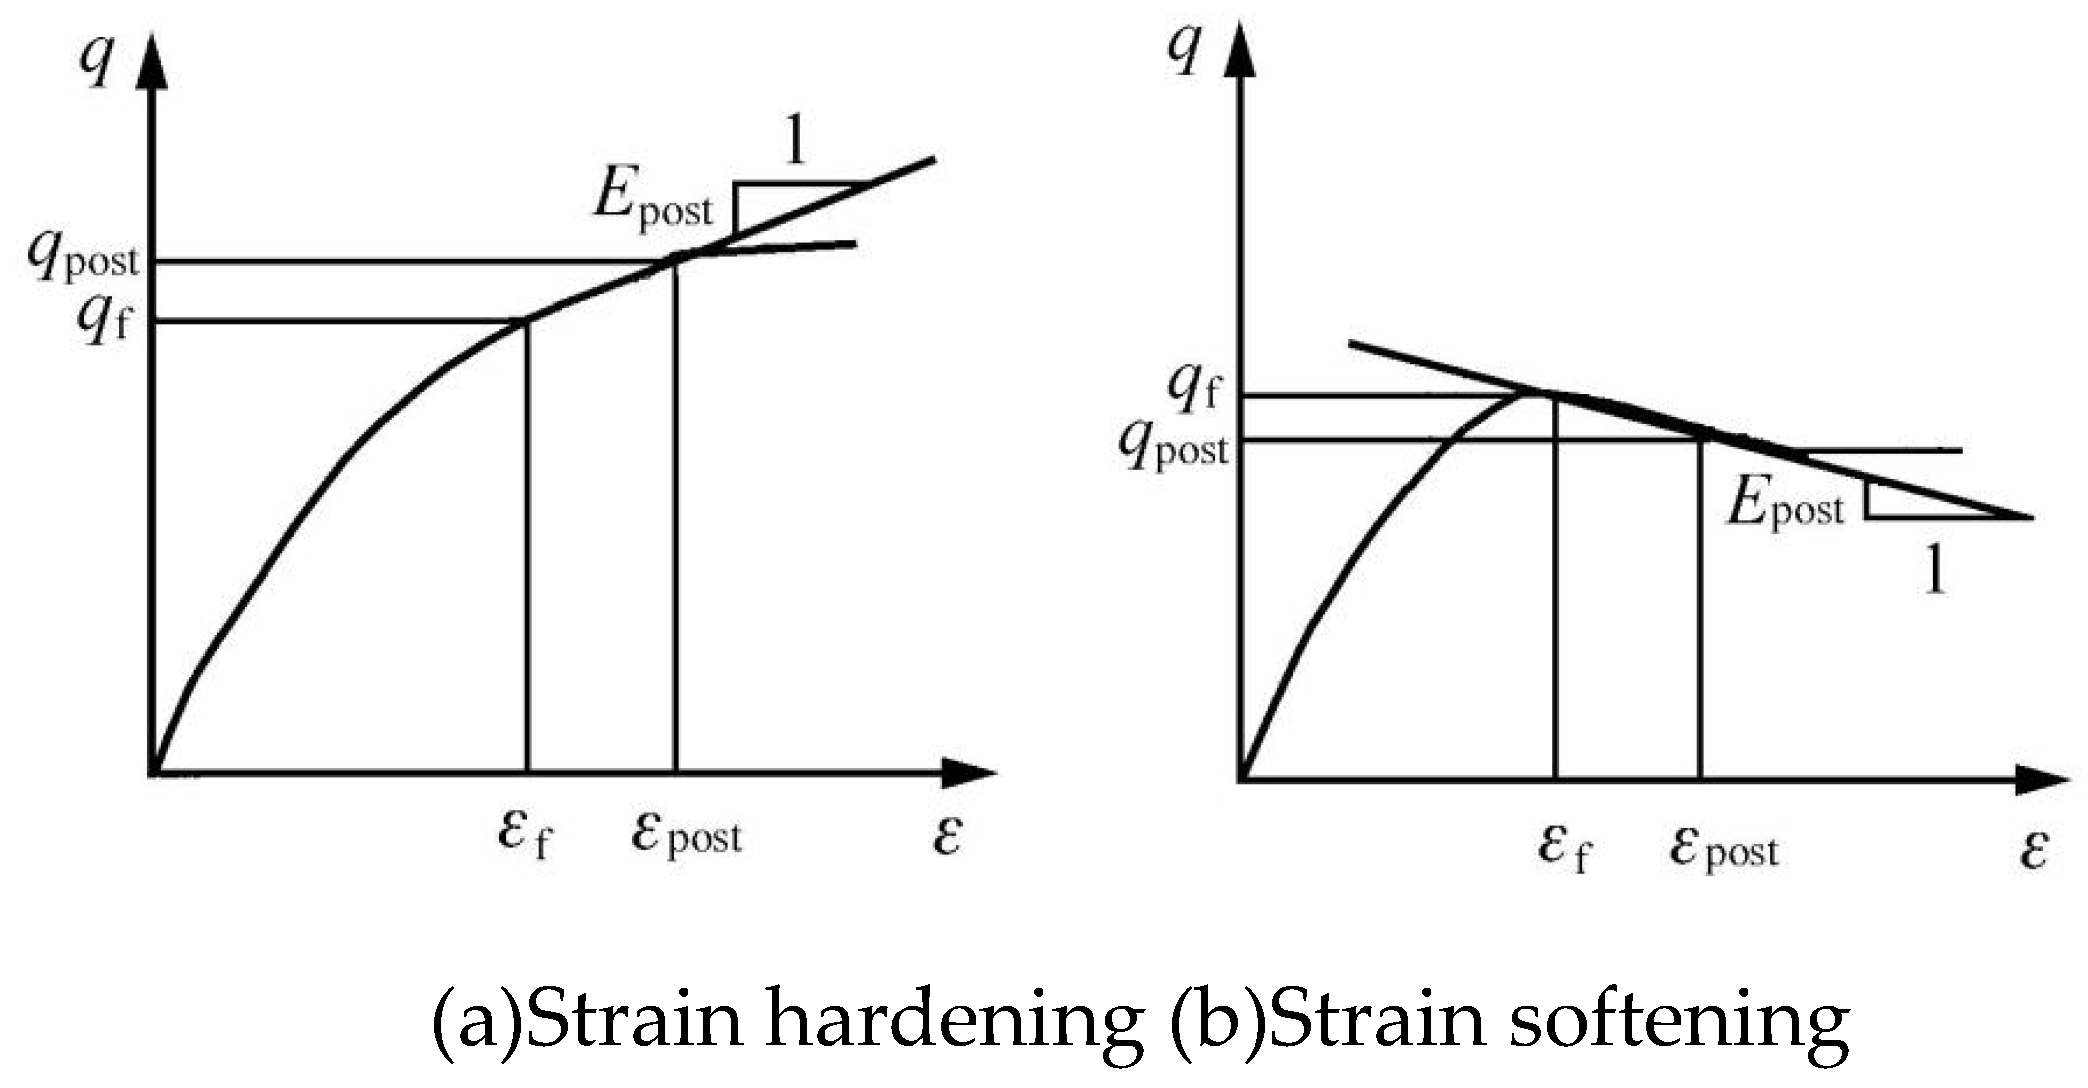
Figure 9.
The critical confining pressure under different moisture content for SSM.
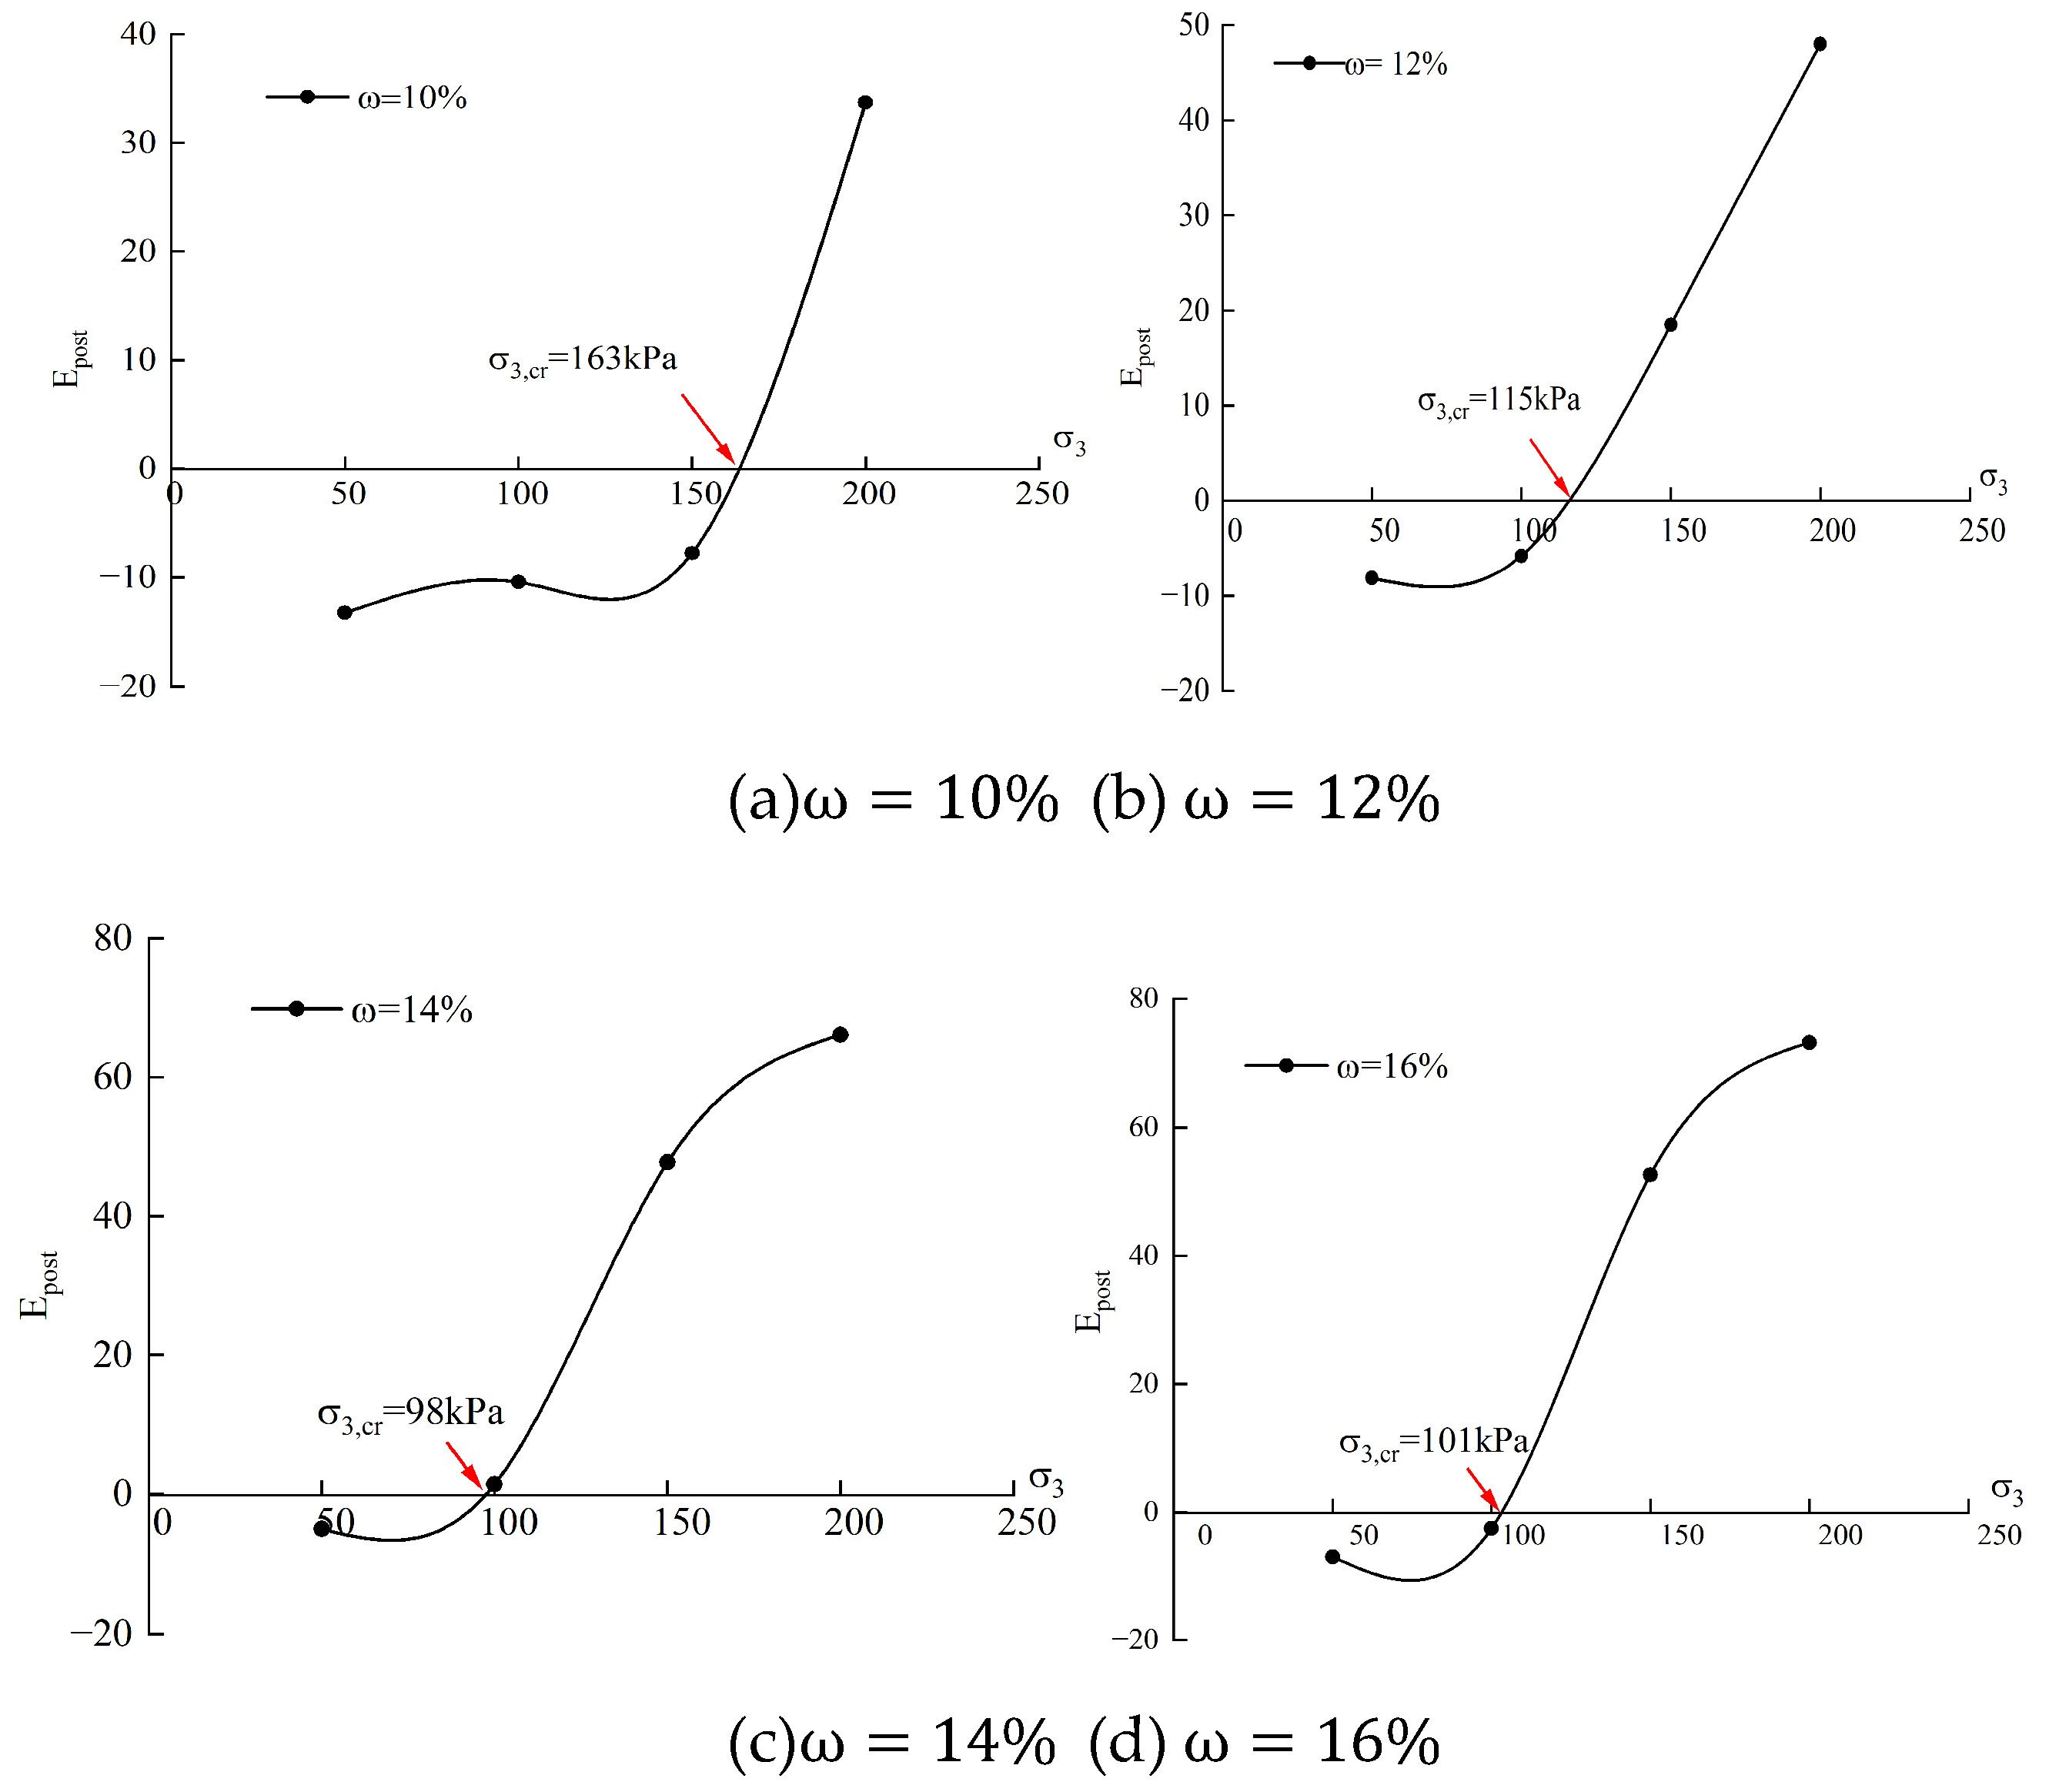
Figure 10.
Stress-strain curves described by the CPM model.
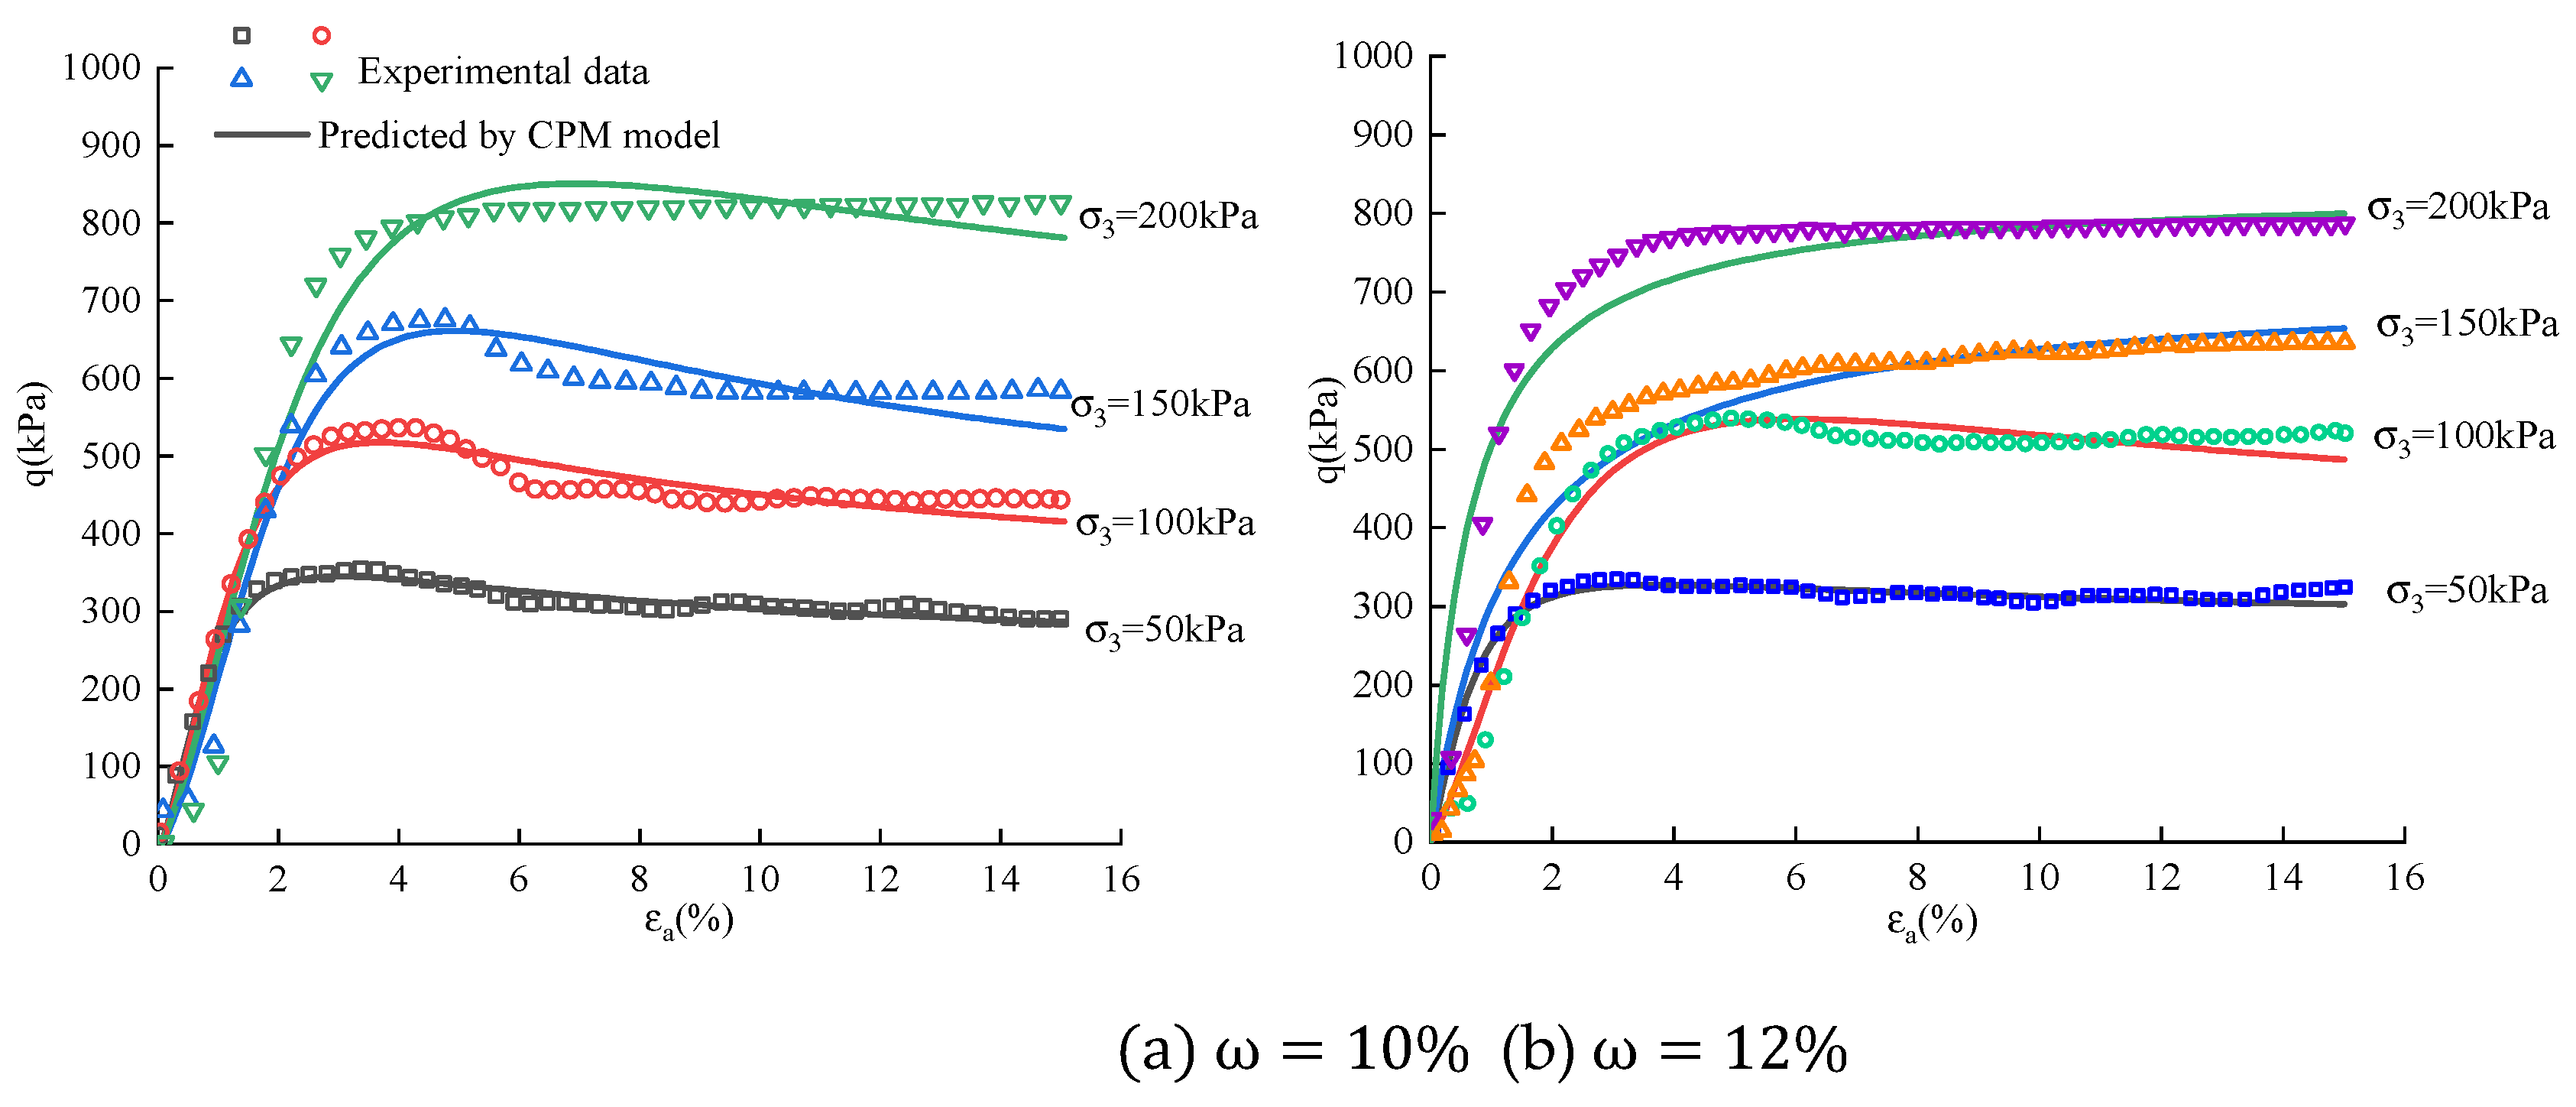
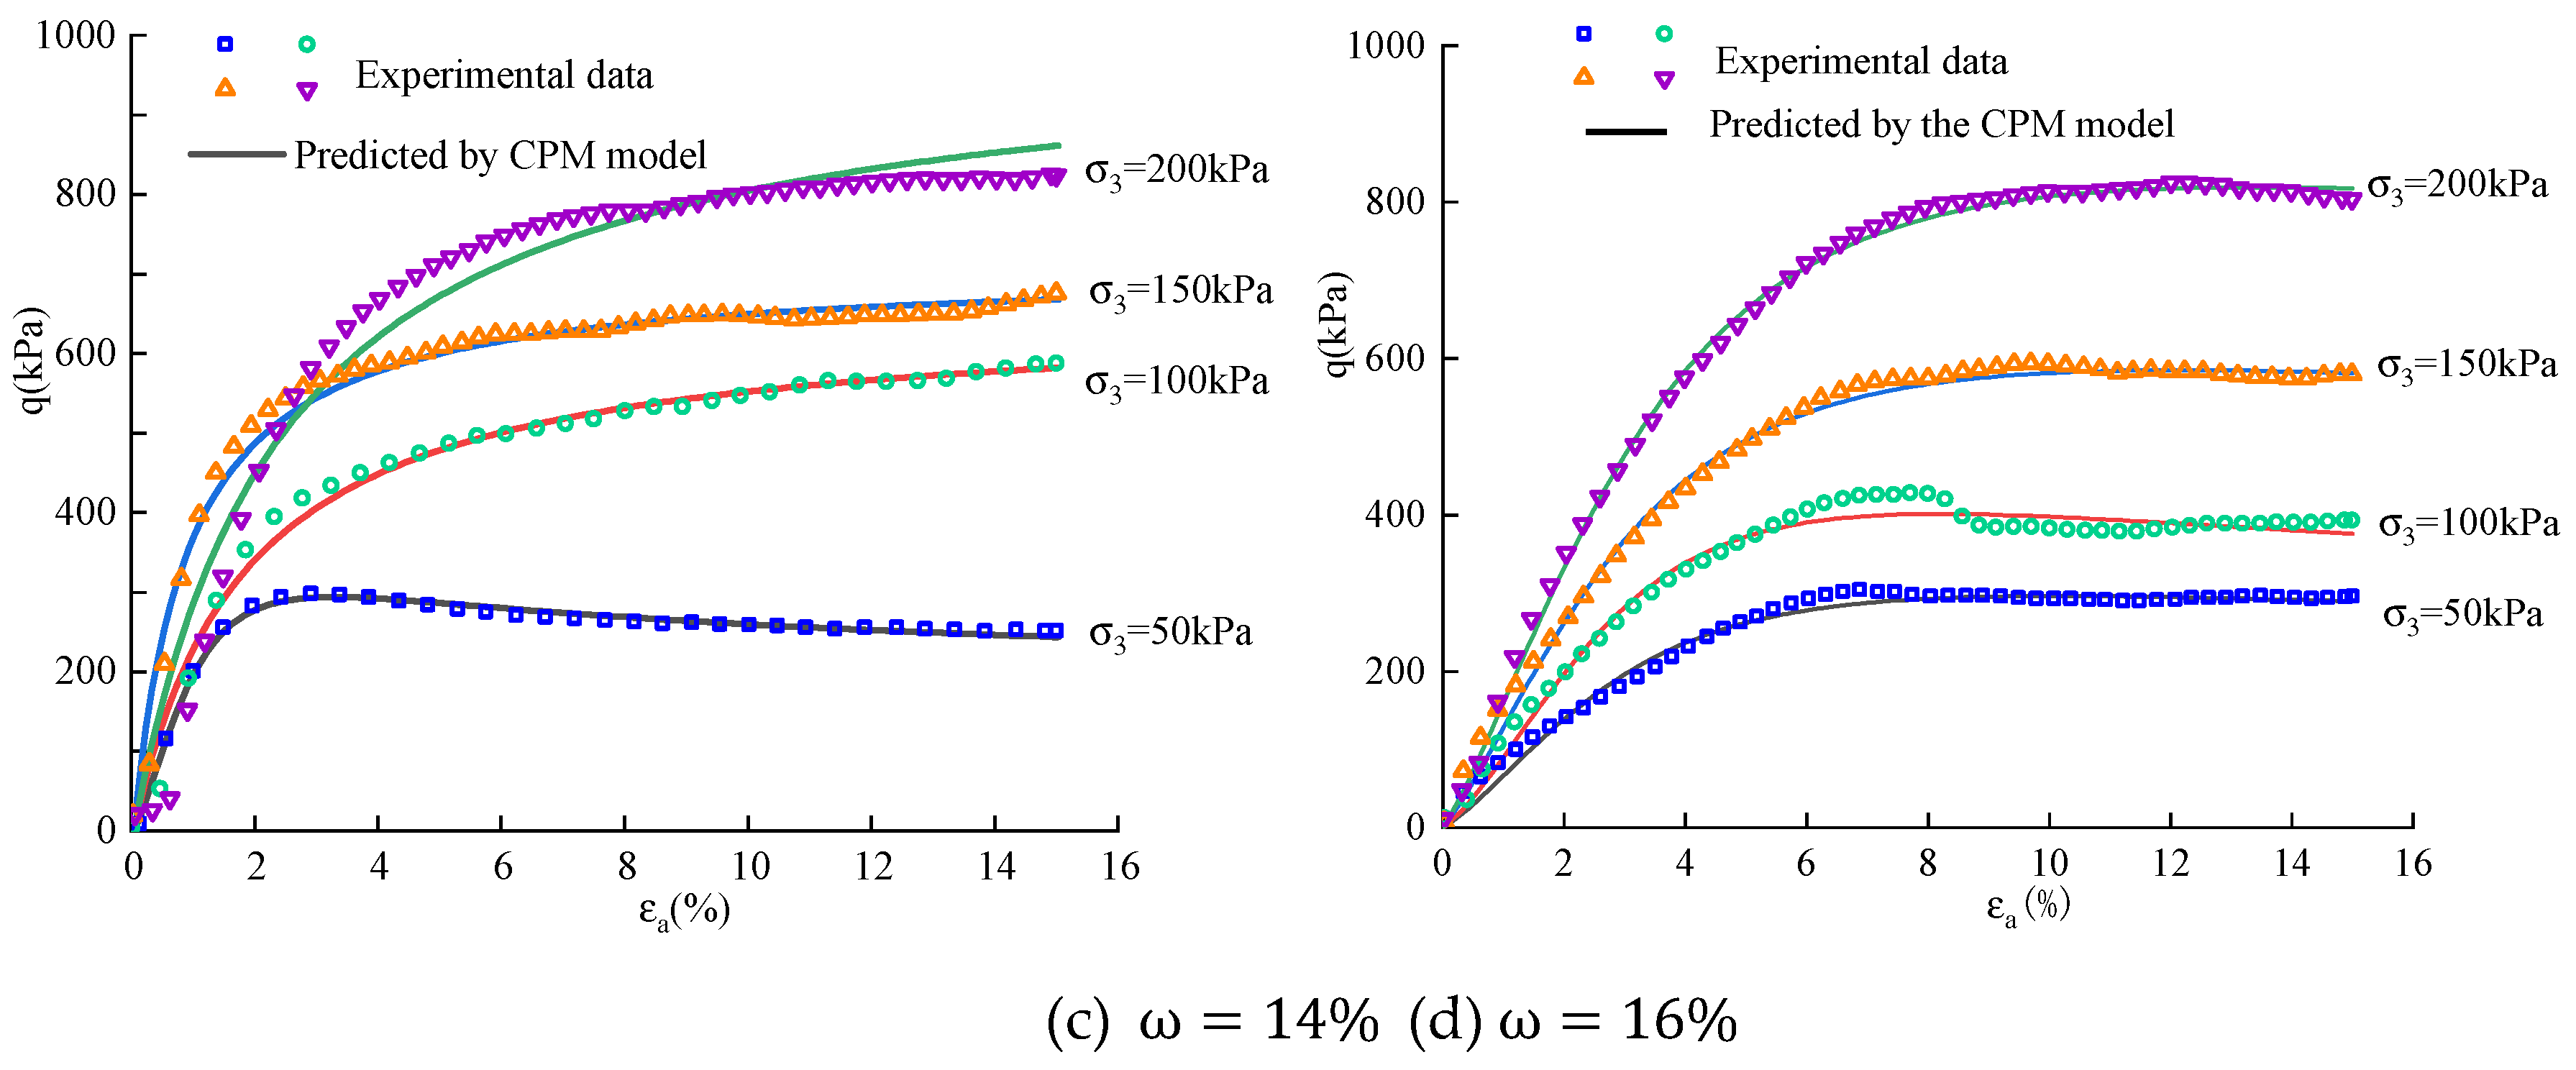
Figure 11.
Comparison between CPM model and experimental data in Loess.
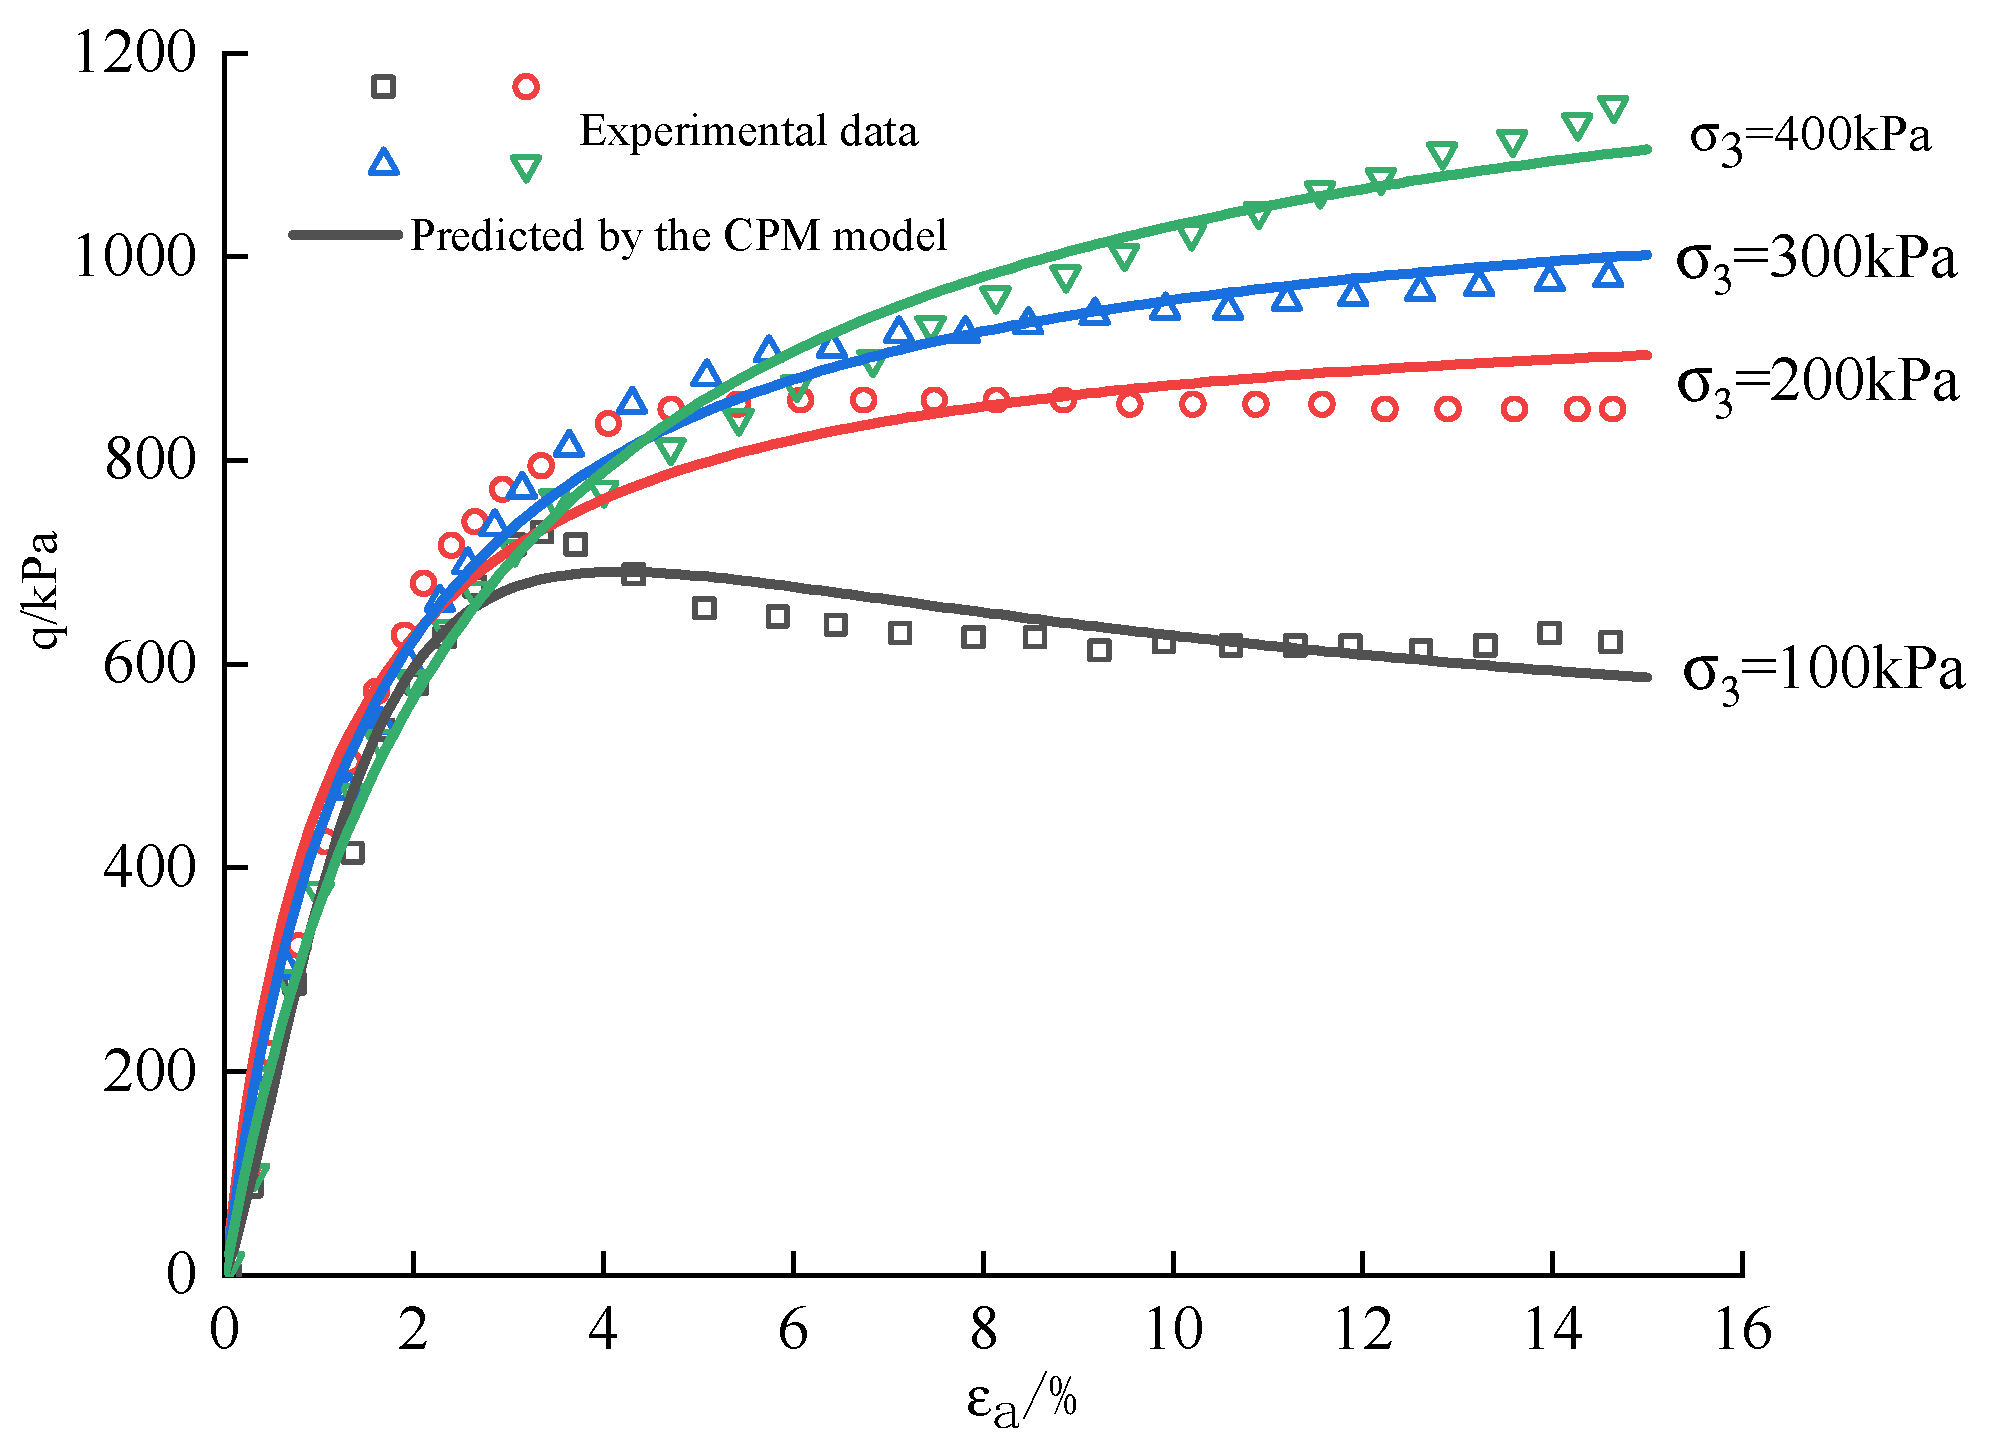
Figure 12.
relation in Loess sample.
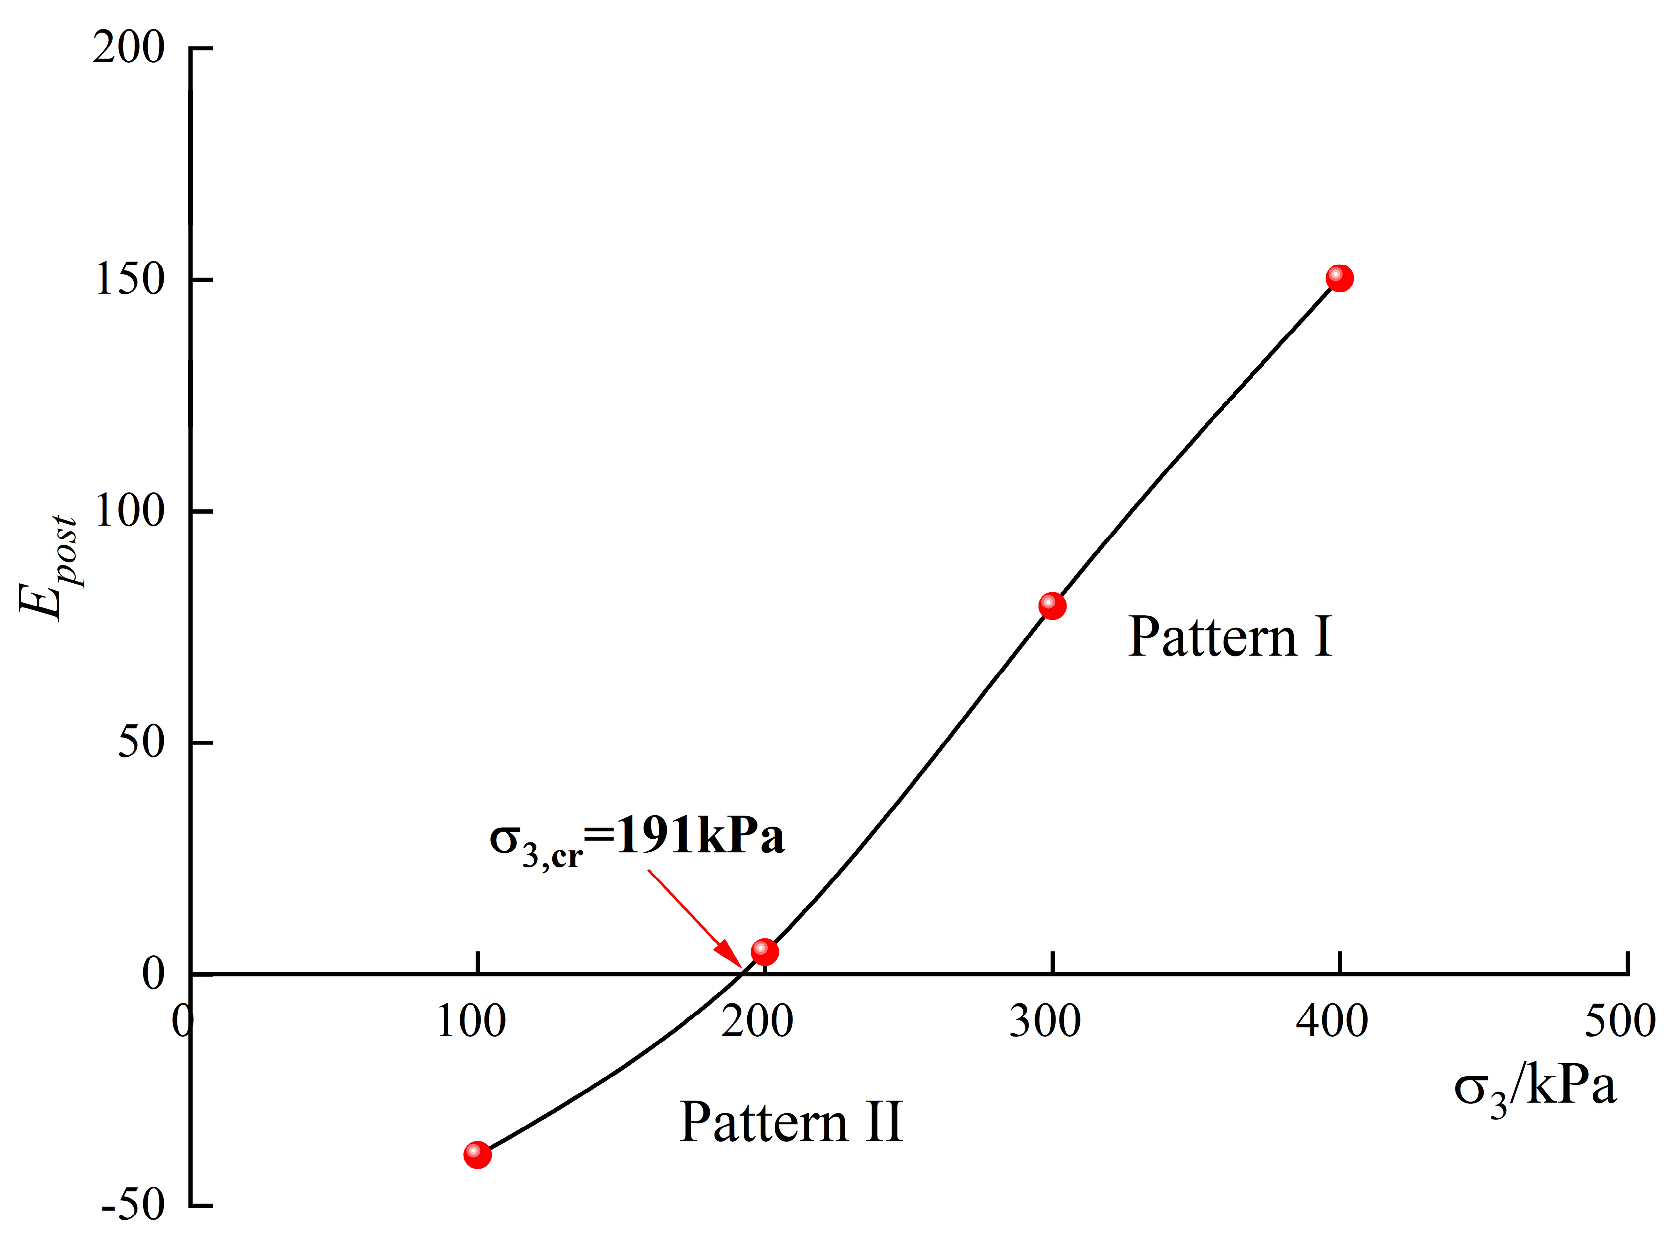
Figure 13.
Comparison between CPM model and experimental data in MSWIBA.
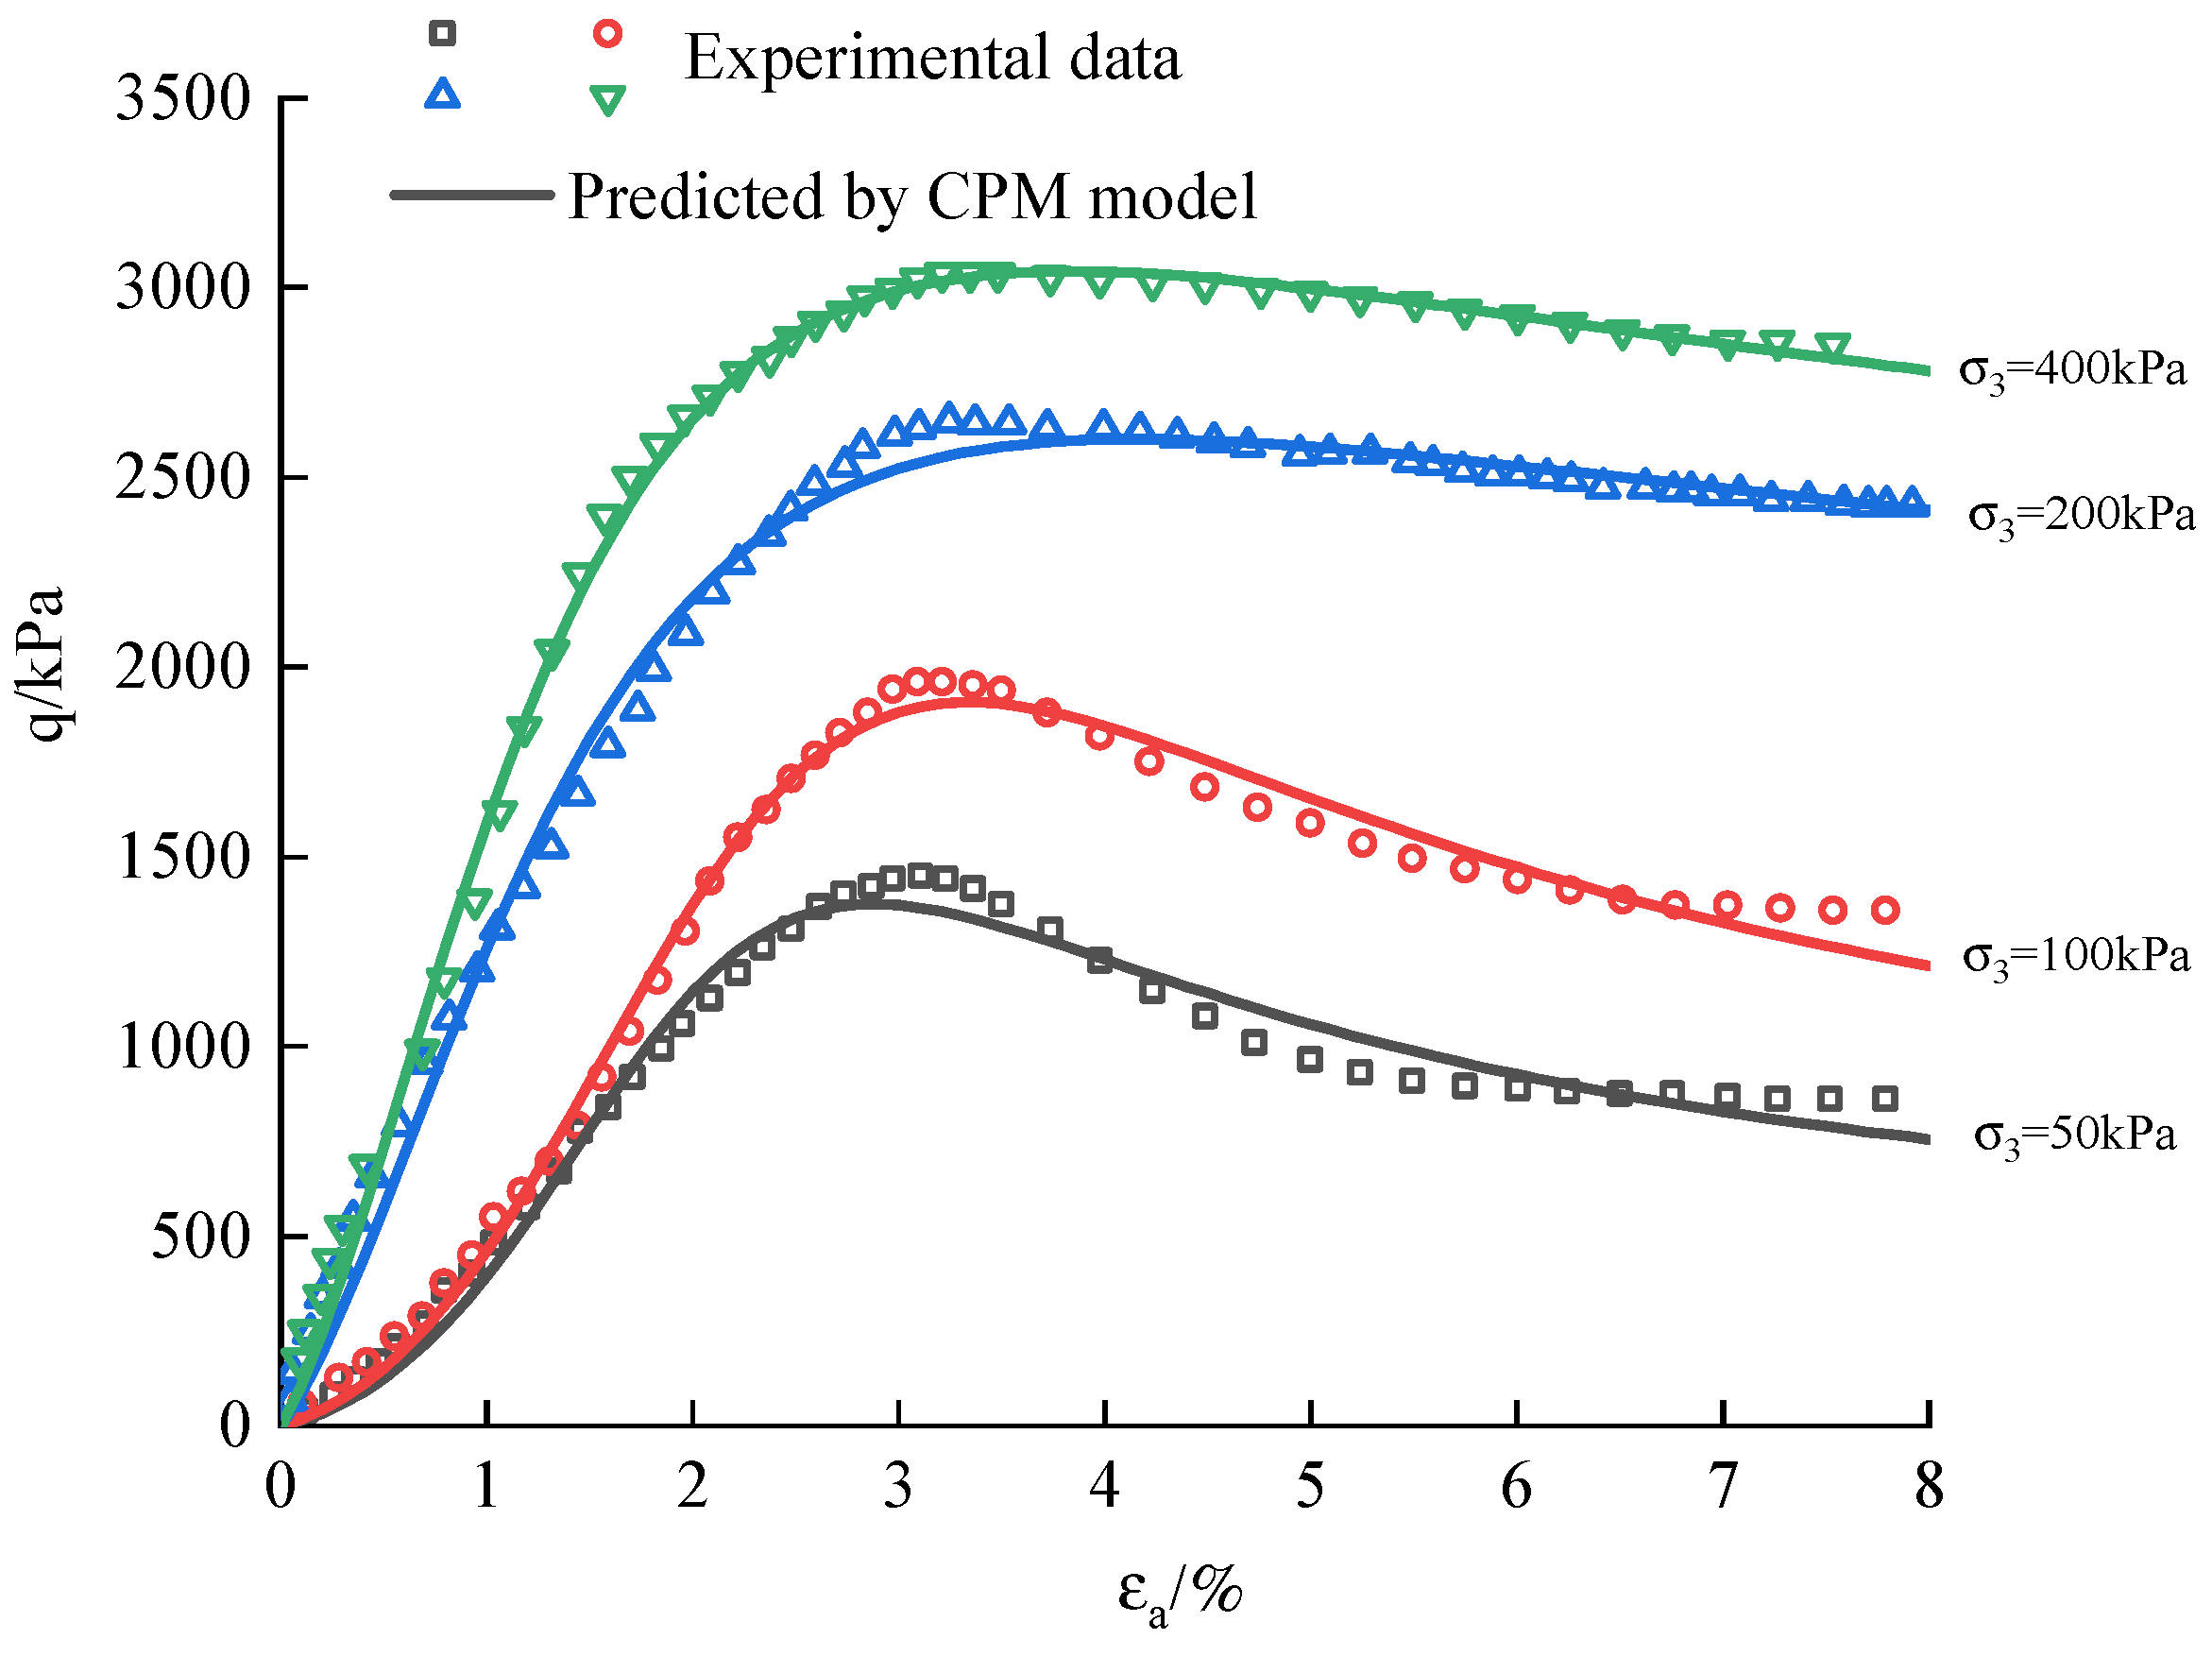
Figure 14.
relation in MSWIBA (Curing time=28days).
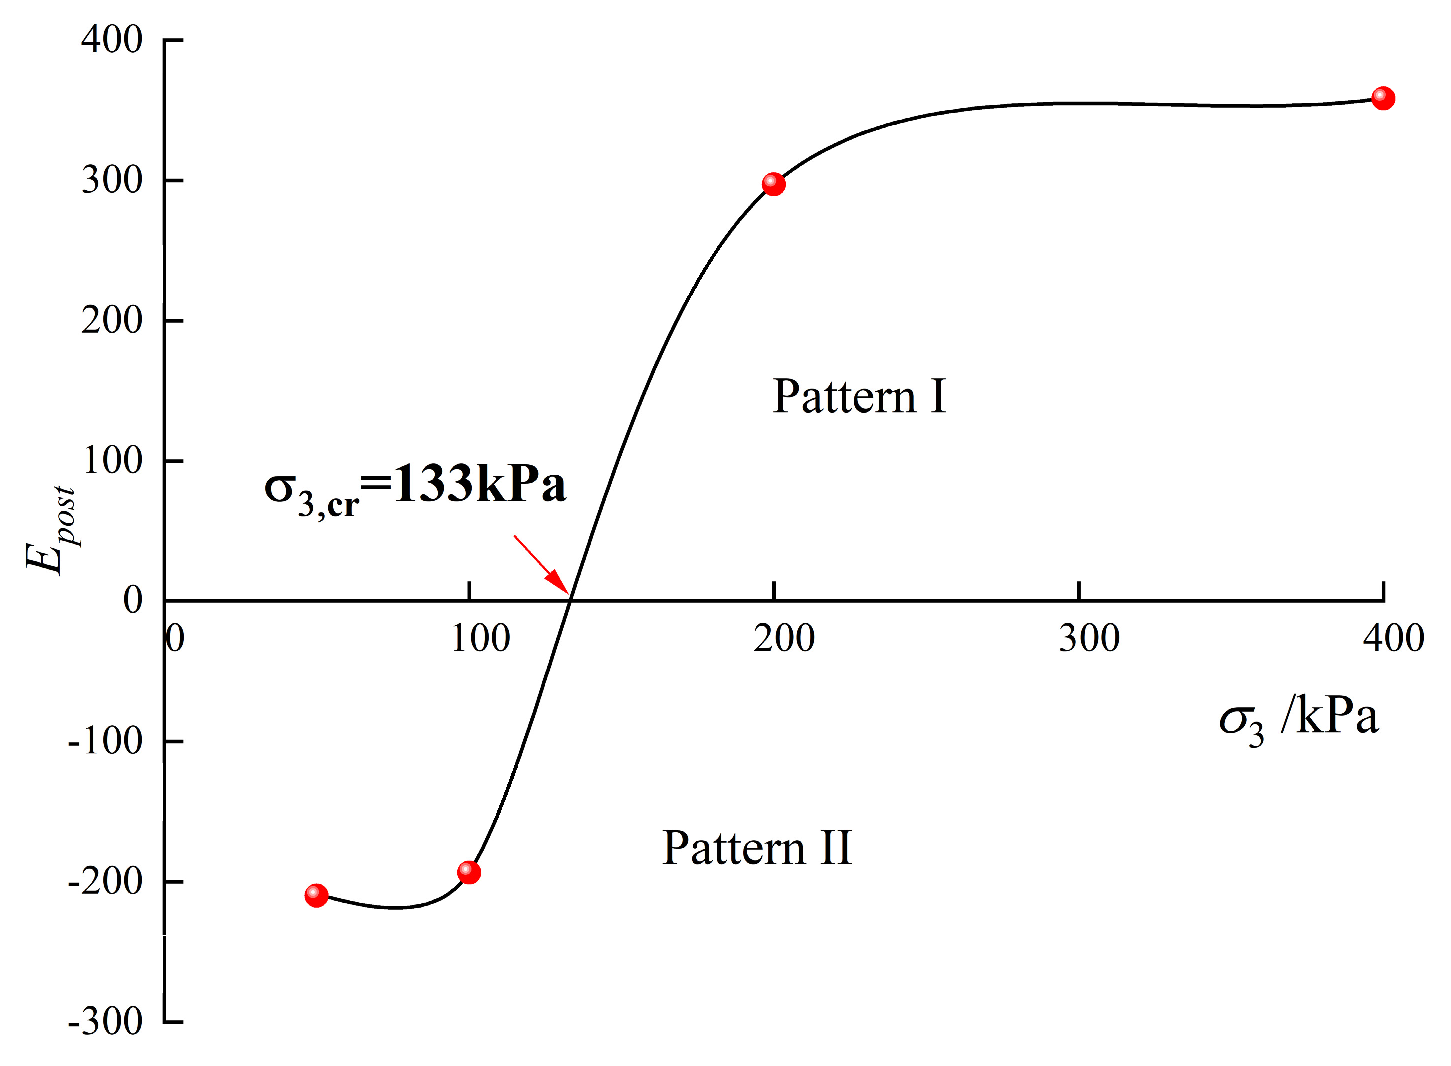
Figure 15.
Comparison between CPM model and experimental data in lime reinforced silt.
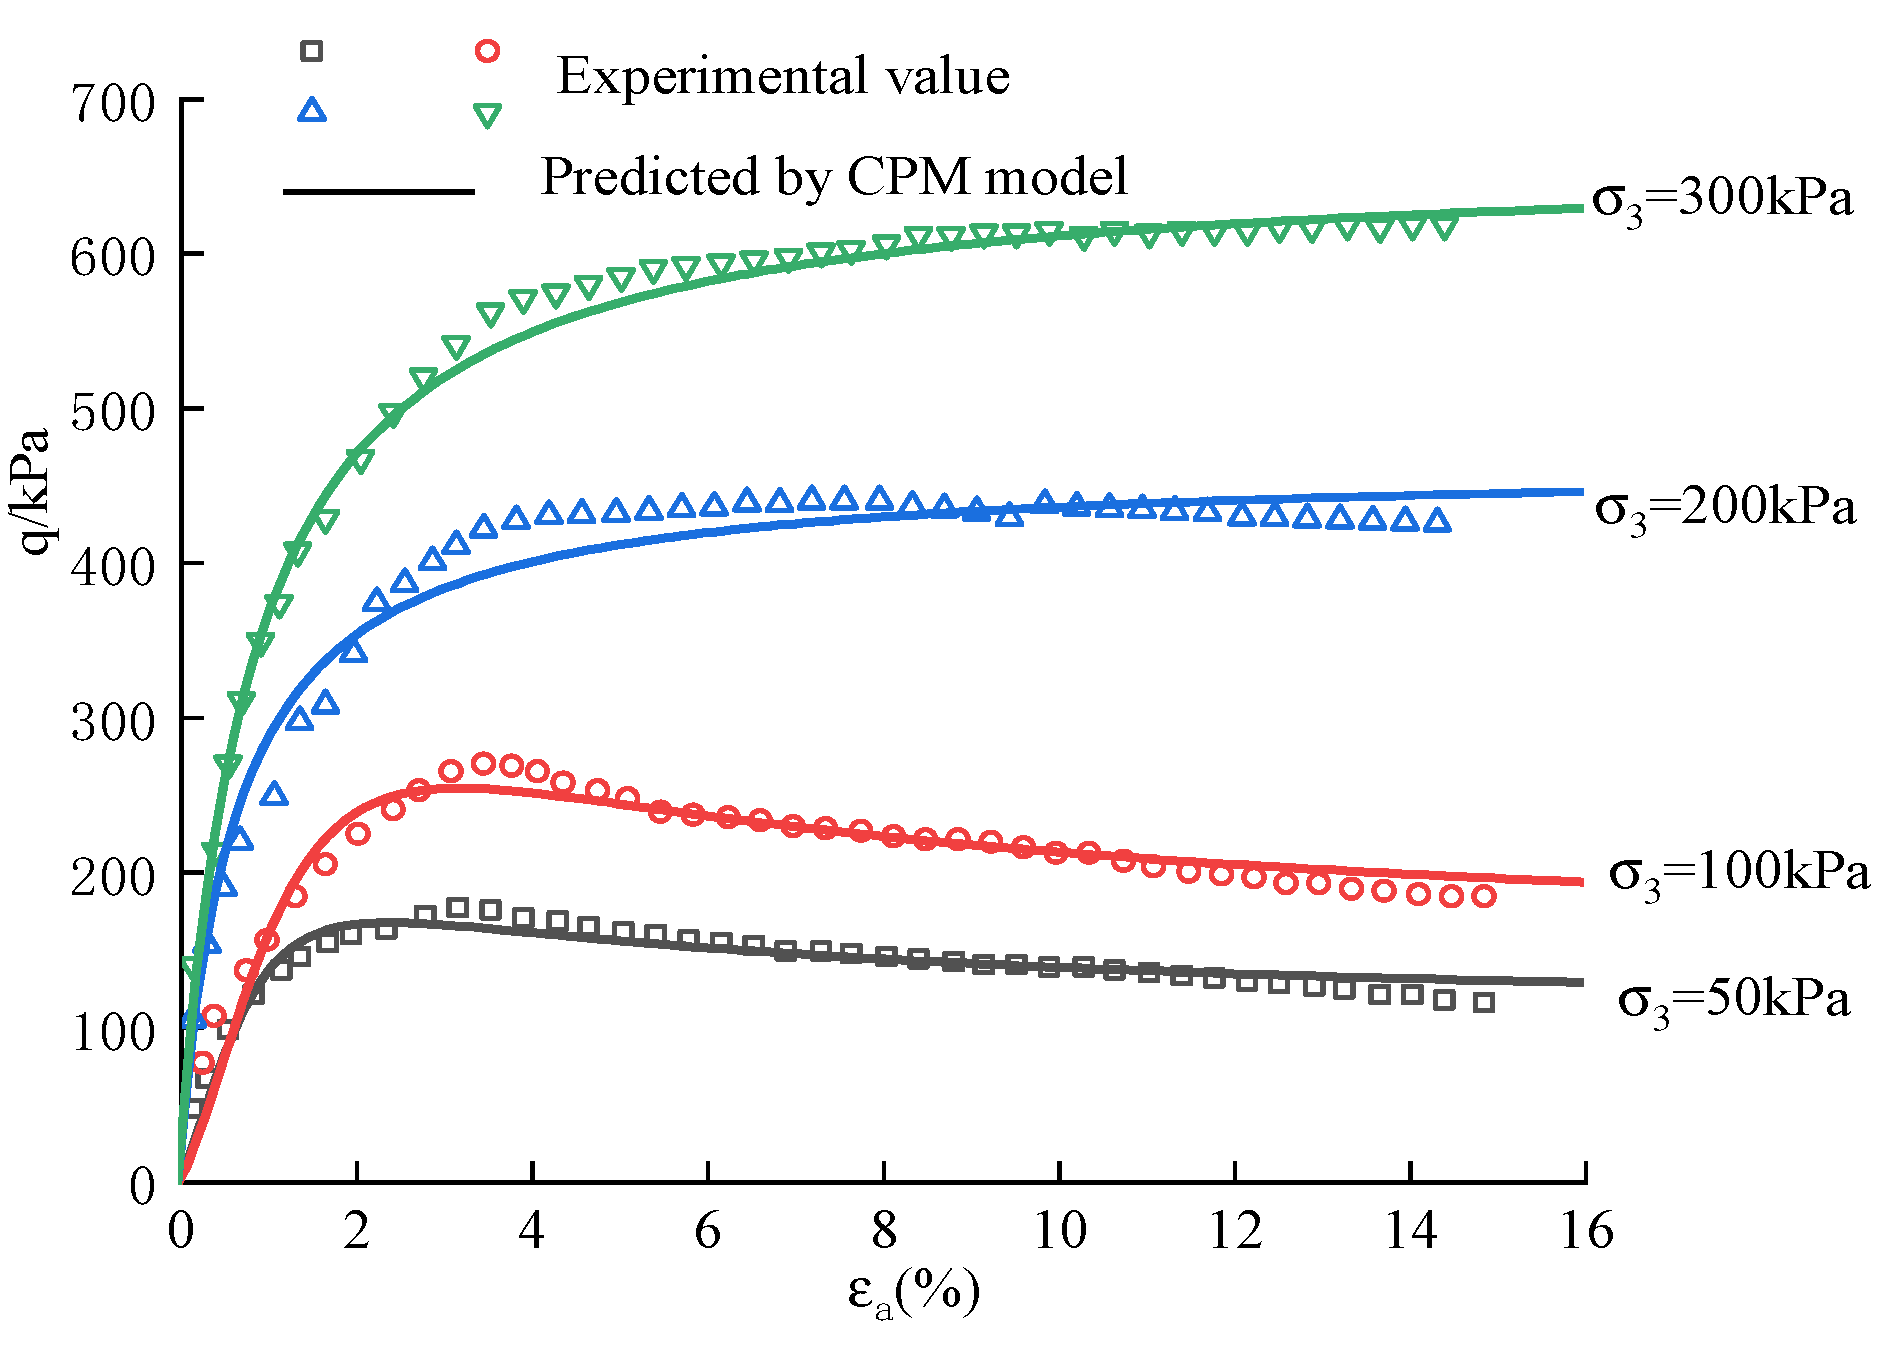
Figure 16.
relation in lime reinforced silt (mixing ratio =5%).
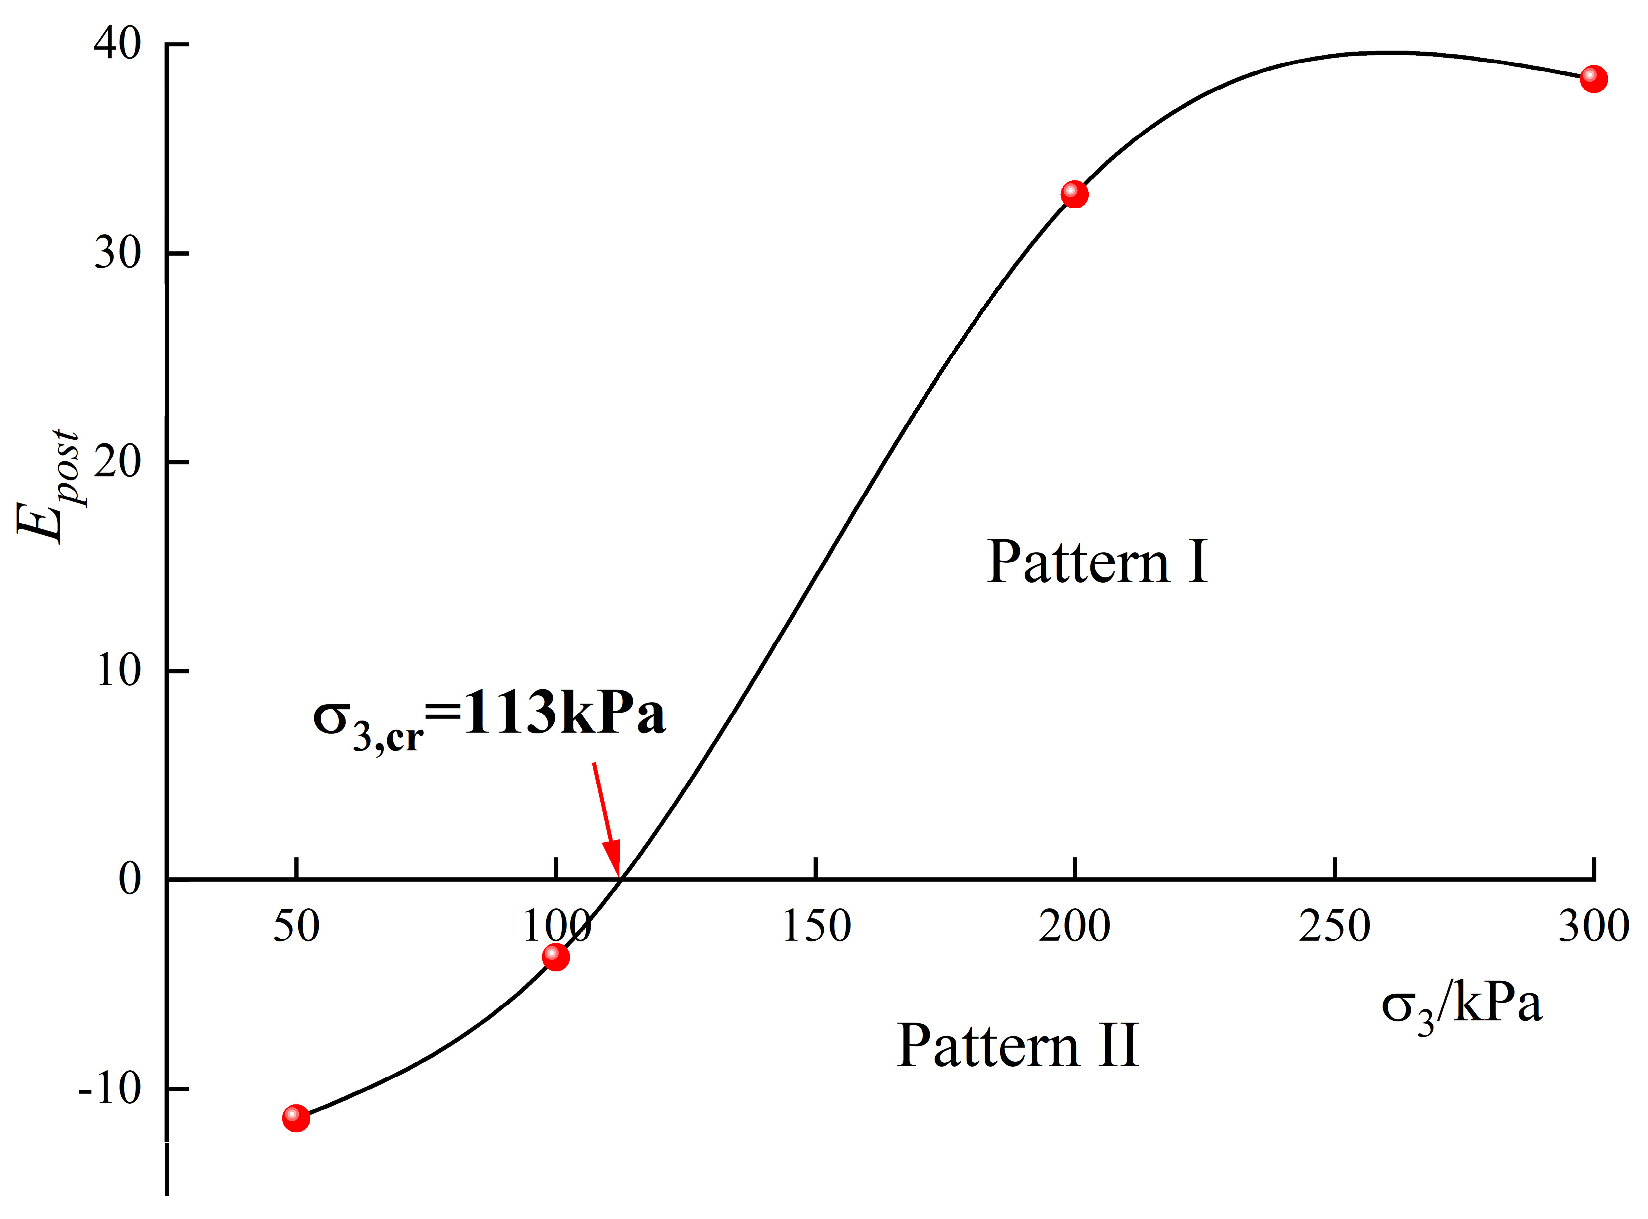

Table 1.
The basic physical indexes of tested SSM samples.
| Initial void ratio |
Specific gravity of soil particles |
Dry density |
Optional moisture content |
Liquid Limit /% |
Plastic limit /% |
Plasticity index |
| 2.05 | 2.67 | 1.66 | 14.8% | 20.3 | 16.7 | 3.6 |
Table 3.
The parameters values (, ) of SSM samples.
| Moisture content/% | Confining pressure/kPa | /% | /kPa | /% | /kPa | Pattern type | |
| 10% | 50 | 3.09 | 353 | 4.07 | 340 | -13.27 | Softening |
| 100 | 3.95 | 535 | 4.62 | 528 | -10.45 | Softening | |
| 150 | 4.27 | 675 | 5.04 | 669 | -7.79 | Softening | |
| 200 | 3.22 | 770 | 4.11 | 800 | 33.71 | Hardening | |
| 12% | 50 | 2.82 | 331 | 3.68 | 324 | -8.14 | Softening |
| 100 | 4.99 | 457 | 5.85 | 532 | -5.81 | Softening | |
| 150 | 2.75 | 580 | 3.29 | 550 | 18.52 | Hardening | |
| 200 | 2.74 | 730 | 3.49 | 766 | 48.00 | Hardening | |
| 14% | 50 | 2.82 | 298 | 4.01 | 292 | -5.04 | Softening |
| 100 | 2.12 | 399 | 3 | 418 | 44.32 | Hardening | |
| 150 | 2.01 | 514 | 3.12 | 567 | 47.75 | Hardening | |
| 200 | 3.25 | 612 | 4.43 | 690 | 66.10 | Hardening | |
| 16% | 50 | 6.53 | 300 | 7.25 | 295 | -6.94 | Softening |
| 100 | 7.11 | 424 | 8.34 | 416 | -6.50 | Softening | |
| 150 | 4.29 | 450 | 5.62 | 520 | 52.63 | Hardening | |
| 200 | 4.46 | 610 | 5.28 | 670 | 73.17 | Hardening |
Disclaimer/Publisher’s Note: The statements, opinions and data contained in all publications are solely those of the individual author(s) and contributor(s) and not of MDPI and/or the editor(s). MDPI and/or the editor(s) disclaim responsibility for any injury to people or property resulting from any ideas, methods, instructions or products referred to in the content. |
© 2024 by the authors. Licensee MDPI, Basel, Switzerland. This article is an open access article distributed under the terms and conditions of the Creative Commons Attribution (CC BY) license (https://creativecommons.org/licenses/by/4.0/).
Copyright: This open access article is published under a Creative Commons CC BY 4.0 license, which permit the free download, distribution, and reuse, provided that the author and preprint are cited in any reuse.


