
Submitted:
09 November 2024
Posted:
12 November 2024
You are already at the latest version
Abstract
Methane (CH4) emissions from the waste industry in U.S.A. and the European Union (EU) have decreased by over 38% from 1990 to 2021. The success in CH4 emission reduction in U.S.A. is attributable to two main reasons. Firstly, the increase of the recycling and composting share to 32% of the managed waste, thus removing decomposable material from landfills, and secondly the implementation of methane capture and utilization programs, which have reduced by over 60% the CH4 released in the atmosphere from 1990 to 2022. The EU had reduced by 2022, landfilling to 23% of the total waste, with waste-to-energy and composting more than double of their U.S. counterparts, and recycling alone attaining a share of 30%. EU’s success has been the result of aggressive European legislation requiring biodegradable MSW going to landfills be reduced by 2035 to 10 % of that in 1995, and 65% of the packaging waste be retrieved and recycled by 2025. In terms of N2O emissions, in EU there is a decrease from wastewater processes from 1990 to 2021, but an overall increase due to waste-to-energy operations, whereas in U.S.A. both wastewater treatment and solid waste incineration appear to contribute to N2O emissions.
Keywords:
Decarbonization
; methane emissions
; nitrous oxide emissions
; landfill gas capture and utilization
; MSW management in U.S.A.
; MSW management in EU
; landfill GHG emissions
; wastewater GHG emissions
1. Introduction
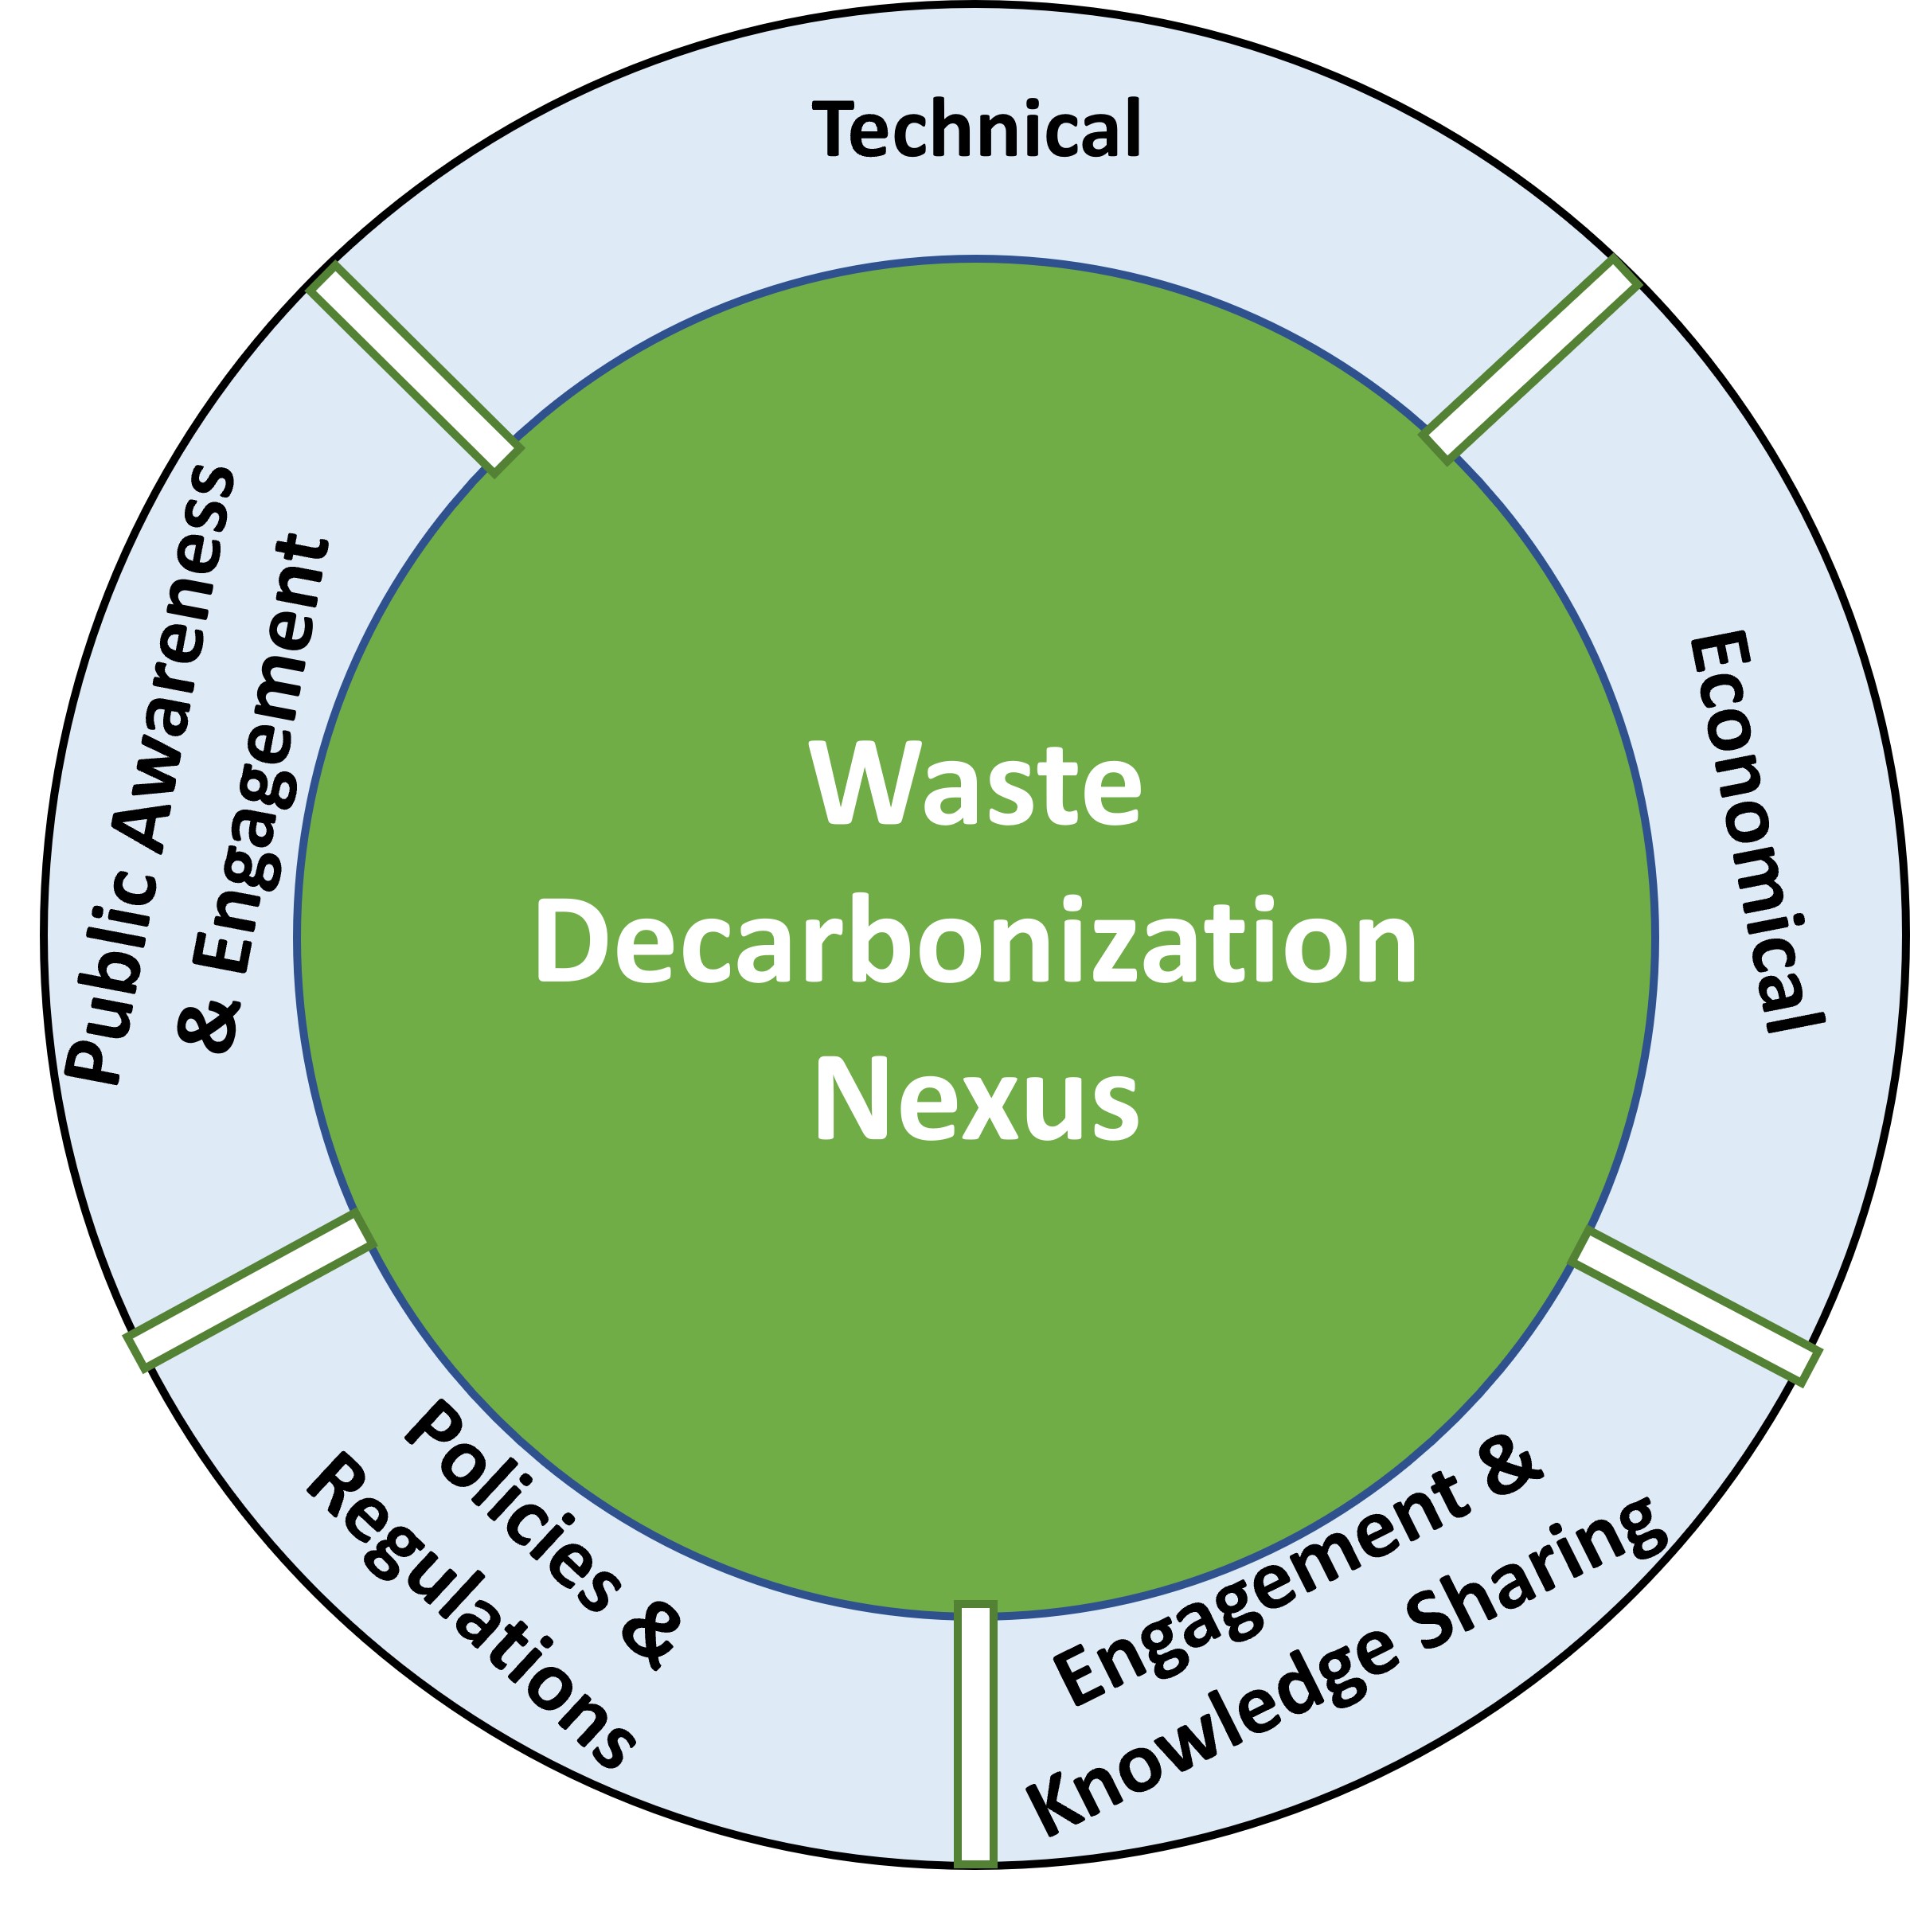
Decarbonization of waste management systems is critical in addressing the goal of reducing greenhouse gas (GHG) emissions and combating climate change. These sectors are traditionally energy-intensive and contribute significantly to GHG emissions. To facilitate the decarbonization of the waste industry, it is imperative to adopt a holistic approach that encompasses innovative technologies and operations, supportive legislation and policies that balance between sustainability goals and economic feasibility, as well as stakeholder and public engagement and awareness.
USA and China as the two largest economies have been responsible for about 41% of the world's total GHG emissions in 2023, with a 11.3% share from the United States and 30.10% from China [50]. The top countries in GHG emissions (in MMT CO2e/yr) and their percentage contribution in the global GHG inventory in 2023 are plotted in Figure 1 [1]. The six countries shown in this figure total 62.73% of the global GHG emissions in 2023.
The data from the European Commission [1] indicate that China had quadrupled by 2023 the GHG that it emitted in 1990, India had tripled them, and Brazil had doubled them during the same period. In contrast, the United States has reduced them by about 4%, Russia’s emissions had declined by 13%, and the EU-27 (European Union-27 member states) had achieved an impressive reduction of about 34% in CO2e emissions from 1990 to 2023.
At the same time, the United States and China are also the largest producers of municipal solid waste (MSW) [4, 5, 8]. In U.S.A., the solid and liquid waste industries contribute pre-dominantly in the generation of methane (CH4) and nitrous oxide (N2O) greenhouse gases. Based on the United Nations IPCC (Intergovernmental Panel on Climate Change) Fifth Assessment Report (AR5), CH4 is 28 times, and N2O is 265 times more effective than CO2 in trapping heat in the atmosphere over a 100-year period [7]. In 2022, U.S. waste activities generated emissions of 166.9 MMT CO2e, which represented 2.6% of the total U.S. GHG emissions [3] (Table 7.1). This quantity does not include emissions from waste-to-energy plants, which were reported by the U.S. EPA (Environmental Protection Agency) [3] under the category of energy emissions and is referred to in the next section of this article. Landfills were the third largest anthropogenic CH4 emission source in U.S.A., and the top GHG emitter of the waste sector with a 71.8% share in 2022 [3] (Chapter 7. Waste). Wastewater management was third in overall N2O emissions in U.S.A., behind agricultural and stationary combustion sources, accounting for 5.6% of total N2O emissions in U.S.A., and perhaps more significantly showing an increase of 48.2% since 1990 [3].
In China, net emissions from landfilling, incineration, composting, and dumping were estimated to have increased from 67 ± 12 million metric tons (MMT) of CO2e in 2000 to 130 ± 25 MMT of CO2e in 2018 [9]. Other sources [10] estimated that China emitted 165 MMT CO2e in 2020 from landfills. The total GHG emissions in China from the wastewater treatment industry were estimated to be 67.07 MMT CO2e in 2017, with approximately 57% from on-site emissions [11].
In India [53], domestic wastewater GHG emissions increased from 43.8 MMT CO2e in 2005 to 63.8 MMT CO2e in 2018 with about 61% of these emissions originating from rural areas and the remaining from urban areas. GHG emissions from industrial wastewater had remained stable during these years at about 37.4 MMT CO2e. Finally, GHG emissions from solid waste disposal had risen from about 7 MMT CO2e in 2005 to 13.3 MMT CO2e in 2018. Total GHG emissions from all waste sector sources were given to be 114.5 MMT CO2e in 2018. It should be noted that these estimates from India [53] were based on the Global Warming Potential (GWP) of gases as these were defined in the IPCC Second Assessment Report (SAR) that gave CH4 being 21 times, and N2O being 310 times more effective than CO2 in trapping heat in the atmosphere over a 100-year period [7]. Official data from China and India are not reported in the UNFCC (United Nations Framework Convention on Climate Change) inventory of data from various countries [28] and this does not allow a detailed analysis of the practices in these countries.
Finally, the European Union (EU) decreased total net GHG emissions in 2023 by 37% below 1990 levels [12], whereas the waste sector in EU reached a 42% decrease in GHG emissions from 1995 to 2017 [54].
The current article aims to analyze the municipal solid waste and wastewater treatment industries’ efforts for decarbonization in the United States and the European Union and based on existing successful practices, regulatory initiatives, and stakeholder engagement to provide suggestions for improvements toward the goal of reducing GHG emissions from the solid waste and wastewater treatment industries.
2. Research Methodology
This study employs data from public domain sources, such as those reported in databases by UNFCC’s inventory of GHG emission data, the U.S. EPA, the European Environment Agency (EEA), the European Commission (EC), and European countries’ government sources. These data are used to conduct analyses and produce figures and table entries that aim to identify the practices and drivers in the United States and the European Union (EU) to curb GHG emissions from the waste industry. Best case waste management technologies and practices in U.S.A. and the EU are highlighted together with the drivers that helped these countries attain a reduction in GHG emissions by the waste industry. Hence, the aim is to provide recommendations on measures and actions to countries lagging behind in the reduction of the carbon footprint in the solid waste and liquid waste industries.
3. Decarbonization Advances in the Solid Waste Industry
3.1. Advances in the MSW Management in United States
Section 3.1 and 3.2 detail the practices in United States and the EU, which have accomplished a significant reduction over 35% in CH4 emissions in the solid waste industry from 1970 to 2023. The two countries use a different mixture of solid waste management methods in order to achieve this reduction, and both their management methods and technical aspects for CH4 capture can be used by other countries to reduce their waste emissions.
In U.S.A. in 2018, the MSW management sector distribution was as follows: approximately 50% of the MSW were deposited in landfills, 11.8% were incinerated by waste-to-energy plants, and 32.1% of the MSW was recycled or composted [13].
Figure 2 [based on data from [13], presented in Table 1) indicate the evolution of MSW management practices in U.S.A. from 1970 to 2018. Thus, in 1970, 93% of the MSW was landfilled, 6.6% was recycled, and about 0.4% was handled by waste-to-energy. In contrast, in 2018, landfilling had dropped to about 50%, recycling had reached 23.63%, waste-to-energy 11.81%, and composting 8.51% (other food management methods comprised the remaining approximate 6% of the waste) [13]. It is evident from these data that despite the increase of about 141% in the total amount of MSW generated from 1970 to 2018, the quantities of waste that ended up in landfills remained relatively stable from 1980 to 2018, recycling had increased by 375% during the same period, and composting and waste-to-energy that constituted only 1.82% of the waste stream in 1980 had reached 20.33% of the MSW management scheme in 2018.
Thus, at first level, the success of the U.S. MSW management system in reducing methane emissions by 34% in the last fifty years, is attributable to the control of the quantities of waste ending up in landfills, given that landfills are the major source of CH4 emissions in the solid waste industry. Concurrently, removal from the landfilled stream of paper and cardboard [55, 56], yard trimmings, and food scraps, among others, which are recycled or composted, has modified the composition of the landfill waste by reducing the decomposable material that would have contributed to GH4 landfill emissions.
Table 1 shows the quantities of MSW handled by various management practices in the United States from 1970 to 2018, as well as in the European Union (EU) from 1995 to 2022. It should be noted that the European Union did not consist of the same number of member states during the period of 1995 to 2022. Thus, in 1995, the EU expanded to include 15 nations, in 2004 it consisted of 28 member states, and on February 1, 2020, the United Kingdom withdrew from the EU, resulting in the EU-27. The population of the EU and U.S.A. in Table 1 are derived from World Bank data [19]. The table shows data from 1970 to 1990 only for U.S.A. and from 1995 onward for which Eurostat [20] provides data, both countries’ quantities are tabulated with the EU numbers shown in parentheses. Finally, the U.S. EPA data [13] are reported in U.S. short tons, and they are converted in Table 1 in million metric tons (MMT) (1 metric ton equals 0.90718 U.S. short tons).
Some conclusions that can be drawn from this table are as follows. Given the population difference the per capita MSW generation in the United States is higher than the EU’s. Thus, for the year of 2018, the per capita MSW generation in the EU was on average 494.4kg (1.35kg/capita/day), whereas in the United States this was 811.6kg (2.22kg/capita/day). Secondly, despite a population increase in the EU of about 4.7% between 2000-2022 the total MSW generated in the EU had remained relatively stable between 220-229 MMT/yr. In contrast, during the same period the population in U.S.A. increased by 15.8% and MSW increased by 20.1% to about 265 MMT/yr. Thirdly, the amount of MSW recycled in the EU and the U.S.A. is approximately the same after 2010, but composting in 2018 is about 65% higher in the EU than in U.S.A. Interestingly, if one were to add landfilling and incineration, one would find that although the amount of MSW handled by these two methods, during the years of 1995 and 2000, was almost similar in U.S.A. and the EU, after that, and during 2005 and 2010, an about 20 MMT, and by 2018 a 40-50 MMT difference in the amount of MSW handled by these two methods would distinguish U.S.A. and EU.
In terms of emissions from the MSW industry, EPA [3] provides the following numbers that are tabulated in Table 2 (in MMT CO2e).
In order to comprehend the measures taken in U.S.A. for the control of CH4 emissions at MSW landfills [6], Table 3 provides additional details of the CH4 generated, recovered and oxidized at MSW landfills to arrive at the net values of the MSW landfill methane emissions (presented in the previous table) and to calculate the per capita per year CH4 emissions from landfills.
It is apparent from Table 3 that, apart from limiting the amount of MSW ending at landfills, and promoting recycling, composting, and waste-to-energy schemes, major technological innovations were implemented at landfill sites to capture and utilize CH4 on and off site. Thus, Table 3 shows that from 1990 to 2022 the amount of CH4 released in the atmosphere dropped significantly. While 80.7% of the CH4 generated in 1990 was released in the atmosphere, in 2022 this amount was reduced to about 30% of the methane generated. The last row of Table 3 indicates that the per capita per year emitted CH4 (in tons CO2e) had been cut by 2022 to one-third of the 1990 value.
The success of the landfill methane reduction in U.S.A. is the result of EPA’s Landfill Methane Outreach Program (LMOP) [14]. This is a voluntary program that partners communities, landfill operators, utilities, and waste officials, where landfill gas (LFG) captured by horizontal collectors and vertical wellheads, which are emplaced in a landfill, is collected in a collection system, which removes moisture, adjusts the pressure to extract and convey the gas, and flares the part of it that is not utilized in an enclosed space. Depending on site-specific characteristics and the commercial application that the gas will be put in use, additional treatment of the LFG may be required to remove excess moisture and impurities and to compress the LFG [14].
Approximately 63% of the LFG projects in United States generate electricity through reciprocating internal combustion engines or gas turbines [15, 16]. About 17% of the LFG is transferred, as medium-Btu, by pipes to nearby customers, where it is used to replace coal, gas, or fuel oil in combustion equipment. Upgrading LFG by increasing its methane content and reducing its CO2, N2, and O2 contents can transform it into renewable natural gas (RNG) that can be used on-site or delivered off-site for thermal applications, electricity generation, or as vehicles fuel. About 20 percent of currently operating LFG energy projects are creating RNG [14].
In U.S.A., as of September 2024 there exist 542 operational LFG energy projects and an additional 444 landfills are projected to be added to the list of LFG projects. This means that of the 2,642 landfills (active or closed) in U.S.A., approximately 21% of them have already implemented methane reduction practices [14]. A list with information on the status of each landfill in U.S.A. can be found in the files provided at EPA’s LMOP Landfill and Project Database site [17]. Figure 3 based on these files [17] shows the number of landfills that had opened, each year in U.S.A., from 1900 to 2024. Of those, 1347 are already closed, 1263 are still open, and for 32 the status is unknown.
3.2. Advances in the MSW Management in European Union
Figure 4, which is based on the data shown in Table 1, depicts the evolution in the mix of MSW management methods in the EU from 1995 to 2022 that led to the landfilled MSW having dropped from 121 MMT in 1995 to 53 MMT in 2022, or a 56 % drop during this period. Landfilling that constituted 61% of the MSW disposal methods in 1995 had been reduced to about 23% of the total MSW in 2022. Recycling had more than doubled, composting had tripled, and waste-to-energy had increased by 1.5 times during this reference period. Thus, in 2022, the EU MSW management mix was as follows. Landfills accepted 23% of the total waste, about 26% of the MSW were handled by waste-to-energy facilities, 19% by composting, and approximately 30% of the total MSW had been recycled. The dominance of recycling, followed by incineration as the preferred MSW management method in the EU becomes apparent in Figure 4 past the year 2015.
The success of the EU in curbing GHG emissions from MSW waste has been the result of aggressive European legislation on waste. Thus, the European Directive 31/1999 [21] “on the landfill of waste” (referred to as the “Landfill Directive”) required that biodegradable MSW going to landfills (with the baseline set to the amount of biodegradable MSW produced in 1995) should be reduced to 75 % by July 2006, to 50 % by 16 July 2009, to 35 % by July 2016, and to 10 % until 2035. The European Directive 62/1994 [22] “on packaging and packaging waste” required that 50% of the packaging waste must be retrieved and recycled by 2001, a target that was increased to 60 % by the end of 2008, and further increased to 65% by the end of 2025.
Thus, while in U.S.A., reduction of GHG emissions from the MSW industry was to a large extent the result of EPA’s Landfill Methane Outreach Program (LMOP), a voluntary program that involved all stakeholders, from waste officials, landfill operators, utilities, to communities, the European Union relied on a top-down approach, where member states had to attain specific targets by certain dates set in European directives. In U.S.A., the regulations governing non-hazardous solid waste are contained in Title 40 of the CFR (Code of Federal Regulations) parts 239 through 259, with part 258 providing the criteria for MSW landfills [23]. In terms of the generated methane, what applies is paragraph §258.23 on the control of explosive gases and §258.24 on air criteria.
However, although the European Directive 31/1999 [21] calls for the landfill gas to be collected from all landfills and either to be treated and used, or if it cannot be used for energy production, to be flared, the EU has stayed behind in this. According to the European Environment Agency (EEA), 60% of the landfill gas in the EU is released in the atmosphere, a percentage that is almost double of that that corresponds to U.S. atmospheric CH4 emissions. The number of landfills in Europe is estimated to exceed 500,000 and most of them, over 90%, to be non-sanitary landfills [24]. The EU’s “Strategy to Reduce Methane Emissions” [25] notes that GHG emission reduction has been accomplished through the diversion of waste from MSW landfills, but little progress has been done regarding the utilization of methane from landfills. This document states that in its 2024 review of the Landfill Directive, actions related to landfill gas management will be included. These actions “may include aeration of landfill mass to inhibit the generation of methane, increasing the use of landfill gas to generate energy, or when neither option is possible, the use of techniques that effectively oxidise the methane such as bio-oxidation or flaring” [25, 26]. Some European countries, such as Denmark, have advanced in this by implementing technologies that remove CO2, hydrogen sulfide (H2S), and other trace gases from biogas plants that receive household food waste, agriculture waste, and industrial waste, to produce pure methane. This methane is fed into the natural gas grid system and constitutes about one-third of the grid’s gas, with the remaining being natural gas [27].
The UNFCC (United Nations Framework Convention on Climate Change) provides an inventory of data for GHG emissions from different sources and for each GHG from all reporting countries [28]. Table 4 was created by obtaining data from the above database with entry in the category that of solid waste disposal; with entry for gas, methane; as countries for comparison, U.S.A. and the EU, and as baseline year that of 1990. The table tabulates the methane emissions for solid waste disposal from 1900 to 2021 (the last reporting year to UNFCC) in EU and the U.S.A.
Table 4 demonstrates that significant methane emissions reductions have been attained in both countries by 2021 relative to the base year of 1990. The percentage reduction in CH4 emissions from managed waste disposal sites is almost the same for EU and U.S.A., whereas the slightly higher total percentage reduction in the EU has resulted from better control of the unmanaged and uncategorized waste disposal sites of which the USA had none. Methane emissions in EU in the whole waste sector, which totaled 101 MMT CO2e in 2021, were about 80% due to solid waste disposal, 4% to the biological treatment of solid waste, and 15% due to domestic and industrial wastewater treatment and discharge [29]. One can notice that the entries for U.S.A. for a particular year that are presented in Table 4 correspond to the sum of the values for CH4 given for the same year in the first two rows of Table 2.
4. Decarbonization in the Municipal Wastewater Treatment Industry
Table 5 tabulates the methane and nitrous oxides emissions from wastewater treatment in U.S.A. from 1990 to 2022. This table shows that although CH4 emissions had been reduced in U.S.A. by about 8% over this time period, N2O emissions had not been adequately addressed having increased by almost 48%.
UNFCC provides an inventory of data on GHG emissions from all reporting countries based on source and gas [28]. Figure 5 was created by obtaining data from the above database with entry in the category that of wastewater treatment and discharge (WTD); as gas, N2O; as countries for comparison, U.S.A. and the EU, and as baseline year that of 1990. The table tabulates the N2O emissions from wastewater treatment and discharge in EU and the U.S.A from 1990 to 2021 (the last reporting year to UNFCC). One should note that the UNFCC database in the total N2O emissions from WTD has included emissions from domestic wastewater, industrial wastewater, and other wastewater sources. Figure 5 plots for both countries and for each year the total NO2 emissions, as well as those from domestic wastewater only.
One should note that there exist slight differences in the data entries for U.S.A., from 2019 onward, between the N2O emission data reported by UNFCC [28] plotted in Figure 5 and EPA’s data [2] given in Table 5. These have resulted by minor adjustments in the calculations and by considering different sources in the two databases. The N2O emissions that are shown in Table 5 and are related to domestic treatment include the following sources: septic systems; centralized treatment aerobic systems, including aerobic systems; centralized anaerobic systems; and centralized wastewater treatment effluent. Thus, for example for the year 2022, from the 17 MMT CO2e in N2O emissions attributed to domestic treatment, 0.8 MMT CO2e were the result of septic systems, and the remaining about 16.2 MMT CO2e were coming from centrally treated aerobic systems, except constructed wetlands [2] (Table 7-27).
Figure 5 indicates that N2O emissions from domestic wastewater treatment plants in EU, which were less than half of those in U.S.A. in 1990 kept on declining over the reported 21-year period, reaching about 29.5% of the equivalent U.S. N2O emissions by 2021. In contrast, in U.S.A., N2O emissions increased over the years, reaching an almost 42% increase in 2021 relative to 1990.
Figure 5 also shows that N2O emissions in the EU from all sources of wastewater treatment and discharge declined by 15.4% between 1990 to 2021, from 7.38 MT CO2e to 6.24 MT CO2e [28]. Given that data from the European Commission [1, 2] show an increase in N2O emissions in the EU, from both solid and liquid waste, of approximate 37% between 1990 to 2021, from 8.4 MT CO2e to 11.54 MT CO2e, the difference in N2O emissions from these two sources must be the result of the incineration and biological treatment of solid waste [51, 52]. Thus, in the EU it appears that the increase in N2O emissions is attributable to the expansion of waste-to-energy operations to treat solid waste, whereas in the United States both wastewater treatment and solid waste incineration contribute to N2O emissions.
In the European Union wastewater is regulated by the European Directive 91/271/EEC on urban waste-water treatment [30] and Directive 86/278/EEC on the use of sewage sludge in agriculture [31]. The former is concerned with the release of treated wastewater in water bodies without making reference to GHG emissions from wastewater treatment plants, and the latter with the soil’s protection from sludge used in agriculture. Both Directives are currently being reviewed, and a draft proposal had been finalized after public consultation and feedback to the European Commission by March 2023 [32]. Article 11 of the draft proposal sets the obligation to Member States to achieve energy neutrality by 31 December 2040 at the national level in all wastewater treatment facilities, by ensuring “that the total annual renewable energy produced at national level by all urban wastewater treatment plants is equivalent to the total annual energy used by all such urban wastewater treatment plants.” The same article sets the requirement for energy audits of urban wastewater treatment plants “with particular focus to identify and utilize the potential for biogas production, while reducing methane emissions” [32].
In U.S.A., wastewater treatment and discharge is regulated under the Clean Water Act (CWA). In 2009, EPA issued rule 74 FR 56260 for the mandatory reporting of greenhouse gases from all economic sectors. This rule “does not require control of greenhouse gases, rather it requires only that sources above certain threshold levels monitor and report emissions” [33]. The 74 FR 56260 rule set the threshold of 25,000 metric tons of CO2e per calendar year for monitoring and mandatory reporting. Preamble-Section II-Part E of this rule, which explains the above threshold, is referred to by EPA to public questions and comments by operators of centralized municipal wastewater treatment plants [34]. In U.S.A., there exist more than 16,000 centralized wastewater treatment plants [35]. In terms of wastewater GHG emissions, EPA considers primarily industrial wastewater facilities, and in terms of wastewater treatment (that includes both municipal and industrial facilities) it has communicated that 118 facilities reported emissions above the threshold in 2023 [18].
Nitrous oxide, apart from being a potent GHG, is also predicted to be the most harmful ozone- depleting gas in the coming years [36]. Nitrogen in wastewater primarily exists in the form of complex amino sugars, sugar molecules where a hydroxyl group has been replaced by an amine group with the general formula R-NH2. The latter are functional groups and compounds containing a nitrogen atom and a lone pair. Important amines are the amino acids, of which the α-amino acids with the generic formula H2NCHRCOOH are protein-building. These organic nitrogen compounds are degraded to ammonia (NH4) by microbes in the sewerage system and the bioreactor. NH4 is converted to NO2- and NO3- by microbial nitrification in zones or compartments of the bioreactor where aerobic conditions are established. The nitrite (NO2-) and the nitrate (NO3-) ions are reduced to N2 during denitrification, which takes place under anoxic conditions in other zones of the bioreactor. Nitrous oxide can be generated in both these processes. During denitrification, NO2- is reduced to NO, N2, and N2O by autotrophic ammonia-oxidizing bacteria (AOB). Heterotrophic denitrification can also produce N2O as an intermediate step of the NO3- reduction to N2 [37]. Several laboratory studies have shown that AOB contribute to the generation of N2O also under aerobic conditions and this outcome is pH-dependent [38] or is influenced by the transition to aerobic conditions after a period of anoxia [39].
Proposed mitigation strategies to reduce N2O emissions from wastewater treatment plants, which have been tested at the laboratory scale, include the following: avoidance of transient pH changes during aerobic conditions by slow feeding rather than pulse feeding [38]; applying solids retention times greater than 5 days, and Dissolved Oxygen (DO) content higher than 0.5 mg O2 l−1 in order to increase AOB biomass concentration [40, 41], and sequential aeration in a membrane-aerated biofilm reactor [42].
At the full-scale wastewater treatment plant level, Foley et al. [43] reported that plants that were designed and operated with high recycling rates, large bioreactor volumes, long solids’ retention time, and which balanced influent flow achieved both low effluent total nitrogen and low N2O emissions. Song et al. [44] analyzed the published results from monitoring campaigns at about two hundred water resource recovery facilities (WRRFs) and concluded that “…some technologies such as sequencing batch reactor (SBR) and membrane bioreactor (MBR) have 2–4 times more emissions compared with other processes such as anaerobic/anoxic/oxic (A2O) and modified Ludzack–Ettinger (MLE).” Reasons that caused high emissions included, among others, low chemical oxygen demand (COD)/N ratio, combined higher salinity and low DO concentration, and the increase in nitrogen load.
At the same time several authors have warned that traditional N2O measurement techniques used in wastewater treatment plants may be under- or over-estimating N2O emissions [37]. Song et al. [44] proposed a tool to recalibrate wastewater N2O emissions estimates, based on a much larger database than those relying on the uniform emission factor (EF) proposed by the IPCC [49]. Based on their method, these authors estimated that wastewater N2O emissions in the U.S.A. were “11.6 MMT CO2e, about 75% of the N2O emissions of 15.4 (8.7–41.1) MMT CO2e from wastewater treatment plants reported by EPA in 2021”.
It appears therefore that until now both the EU and the United States have not put in place specific regulations for GHG emissions from municipal wastewater treatment facilities, despite the fact that improvements could be accomplished with relatively moderate technical and operational enhancements.
5. Stakeholder Engagement in Waste Policy Development in U.S.A. and the EU
Recycling of waste material has been the central pilar in the efforts of U.S.A. and the EU to reduce the amounts of waste ending in landfills and incineration facilities, conserve resources, and reduce GHG emissions, not only from the waste industry, but also from the mining and processing operations of new raw material [48]. In 2001, EPA established the U.S. Recycling Economic Information (REI) project with the collaboration of several states and regions. The 2020 REI report found that recycling had resulted in 526 MMT of recycled goods, had generated 681,000 jobs, $37.8 billion in wages, and $5.5 billion in tax revenues [47].
In U.S.A., a number of initiatives and national strategies have been announced as part of the country’s “Circular Economy Strategy”. These included the “National Recycling Strategy” [45], and The White House’s "National Strategy for Reducing Food Loss and Waste and Recycling Organics" [46].
These documents reflect the active engagement of every stakeholder in the development of national strategies and legislation in the MSW and wastewater treatment industries that characterizes policy development in the United States. Thus, the list includes input from: federal offices, among others, the U.S. Department of Energy (DOE), the U.S. Department of Commerce (DOC), the U.S. Department of Defense (DOD), the U.S. Department of State (DOS), the U.S. Department of Agriculture (USDA); agencies, such as the National Science Foundation (NSF), the National Oceanic and Atmospheric Administration (NOAA), and the National Institute of Standards and Technology (NIST); tribal and state entities, such as the U.S. Conference of Mayors, the National Tribal Caucus, the Environmental Council of the States (ECOS), and other; recycling professional and industry associations and private companies, such as the Institute of Scrap Recycling Industries (ISRI), the National Waste and Recycling Association (NWRA), the Solid Waste Association of North America (SWANA), and Waste Management (WM); non-profit organizations, such as the GreenBlue Institute, Keep America Beautiful (KAB), the National Recycling Coalition, etc.; and private citizens, state, tribal and local governments, academia, non-governmental organizations, industry associations, and private companies [45].
Similarly in the European Union, legislation, such as for example regarding the EU rules on urban wastewater treatment [32], was preceded by an one-and-a-half month in 2020 initial feedback, where input was received by several European countries’ authorities (for example, the national association of Dutch water companies, and Dutch Water Authorities; EurEau (representing nearly all wastewater operators in Europe); Aqua Publica Europea (the European Association of Public Water Operators); the Chamber of Commerce of Austria; the Danish Water and Wastewater Association; the Spanish Steel Association, UNESID; BIBM, the Federation of the European Precast Concrete Industry, etc. Subsequently, from April to July 2021 public consultation was sought via questionnaires to related to the proposed legislation EU Member States’ public authorities at national, regional and local level, “…industrial/economic actors, such as associations and companies (including small and medium sized enterprises), water associations at European, national and regional level, international organizations, NGOs, consumer organizations, academia, research and innovation organizations and institutes...” Finally, the EU Commission adoption feedback period was conducted from the end of October 2022 to middle of March 2023, where the final feedback for the proposed directive was received [32].
Thus, both the United States and the European Union are characterized by extensive consultation and inclusion of all stakeholders’ concerns and inputs in the process of developing legislation on waste.
6. Conclusions
Methane (CH4) emissions from the waste industry in U.S.A. and the European Union (EU) have decreased by about 34% from 1970 to 2023. This trend has not been followed by the nitrous oxides (N2O) emissions, which is the result, primarily, of wastewater treatment and discharge operations, with U.S.A. having a 120%, and the EU a 67% increase in N2O emissions, during the same period.
The success in CH4 emission reduction in U.S.A. can be attributed to two main reasons. The change in the municipal solid waste (MSW) mix of management methods in U.S.A., which by 2018 had reached 50% landfilling, 24% recycling, 12% waste-to-energy, and 9% composting. Thus, from 1970 to 2018, landfilling had been reduced from 93% to 50%; recycling had increased from 6.6% to 23.6%; and waste-to-energy and composting had reached by 2018 a combined approximate 21% of the MSW handled, from only 0.4% in 1970. The second major reason was the implementation of methane capture and utilization programs at about 21% of the existing landfills that led net CH4 landfill emissions in 2022 to correspond to about half of those released in the atmosphere in 1990.
In contrast in the EU, in 2022, recycling held the top place as a MSW management method, receiving 30% of the total MSW, and followed by waste-to-energy with 26%. Landfilling held the third-place handling 23% of the MSW, followed closely by composting with a 19% share in the waste stream, and expected to surpass landfilling given the targets set in European Directives. The success of the EU has been the result of aggressive European legislation on waste. Two critical European Directives have been the Landfill Directive 31/1999 “on the landfill of waste” and the European Directive 62/1994 “on packaging and packaging waste,” The former required that biodegradable MSW going to landfills should be reduced, incrementally, by 2035 to 10 % of that in 1995. The latter required that 65% of the packaging waste must be retrieved and recycled by the end of 2025. The intense recycling in both countries, apart from reducing waste quantities from the MSW landfilled, removes in particular biodegradable material, such as paper and paperboard, yard trimmings, and food scraps, which would have contributed significantly to the generation of greenhouse gases.
In terms of N2O emissions from wastewater treatment plants, those from the EU, which were about half of those in U.S.A. in 1990, reached less than one-third of the equivalent U.S N2O emissions in 2021. Given that N2O emissions in the EU from all sources of wastewater treatment and discharge declined by 15.4% between 1990 to 2021, but those from the overall management of solid and liquid waste had increased by approximate 37% during the same period, this must be the result of the extensive incineration and biological treatment of solid waste taking place in the EU. In U.S.A., N2O emissions from wastewater increased over the years, reaching an almost 42% increase in 2021 relative to 1990. Thus, in the EU it appears that the increase in N2O emissions is attributable to the expansion of waste-to-energy operations to treat solid waste, whereas in the United States both wastewater treatment and solid waste incineration contribute to N2O emissions.
Author Contributions
Conceptualization, Evan K. Paleologos and Abdel-Mohsen O. Mohamed; Methodology, Evan K. Paleologos; Formal Analysis, Evan K. Paleologos; Investigation, Evan K. Paleologos and Abdel-Mohsen O. Mohamed; Resources, Evan K. Paleologos and Dina Mohamed; Data Curation, Evan K. Paleologos and Dina Mohamed; Writing – Original Draft Preparation, Evan K. Paleologos and Abdel-Mohsen O. Mohamed; Writing – Review & Editing, Abdel-Mohsen O. Mohamed and Devendra Singh; Visualization, Evan K. Paleologos and Abdel-Mohsen O. Mohamed; Funding Acquisition, Moza T. Al Nahyan and Sherine Farouk.
References
- European Commission (2024a). EDGAR-Emissions Database for Global Atmospheric Research. GHG Emissions of all World Countries. 2024 Report. Available online: https://edgar.jrc.ec.europa.eu/report_2024 (accessed on day month year).
- European Commission (2024b). EDGAR_2024_GHG_Booklet_2024. Available online: https://edgar.jrc.ec.europa.eu/report_2024 Data Download: EDGAR GHG emissions English (accessed on day month year).
- EPA (2024a). Inventory of U.S. Greenhouse Gas Emissions and Sinks: 1990-2022. U.S. Environmental Protection Agency, EPA 430-R-24-004. https://www.epa. 1990.
- Chai, X.; Tonjes, D.J.; Mahajan, D. Methane emissions as energy reservoir: Context, scope, causes and mitigation strategies. Progress in Energy and Combustion Science, 2016, 56, 33–70. [Google Scholar] [CrossRef]
- Mohamed, A.M.O. , and Paleologos, E.K. Fundamentals of Geoenvironmental Engineering. 9: Elsevier, 2018, 688p., ISBN, 2018. [Google Scholar]
- ATSDR (U.S. Agency for Toxic Substances and Disease Registry) (01). Landfill Gas Primer: An Overview for Environmental Health Professionals. ATSDR, 74pp. and 5 Appendices. 20 November.
- Greenhouse Gas Protocol (2024). Global Warming Potential Values. Available Online : https://ghgprotocol.org/sites/default/files/Global-Warming-Potential-Values%20%28Feb%2016%202016%29_1.pdf (accessed , 2024). 11 September.
- United Nations Environment Programme (2024). Global Waste Management Outlook 2024: Beyond an age of waste – Turning rubbish into a resource. Nairobi. https://wedocs.unep.org/20.500. 1182.
- Zhang, J.; Du, H.; Wang, T.; et al. Tracking the carbon flows in municipal waste management in China. Sci Rep, 2024, 14, 1471. [Google Scholar] [CrossRef] [PubMed]
- Guo, H.; Xu, H.; Liu, J. , et al. Greenhouse gas emissions in the process of landfill disposal in China. Energies, 2022, 15, 6711. [Google Scholar] [CrossRef]
- Guo, D.; Li, B.; Yu, W. , et al. Revisiting China's domestic greenhouse gas emission from wastewater treatment: A quantitative process life-cycle assessment. Science of The Total Environment, 2023, 876, 162597. [Google Scholar] [CrossRef] [PubMed]
- EEA (2024). Trends and Projections in Europe 2024. European Environment Agency (EEA) report 11/2024, 66pp., Copenhagen, Denmark. [CrossRef]
- EPA (2024c). National Overview: Facts and Figures on Materials, Wastes and Recycling. Available online: https://www.epa.gov/facts-and-figures-about-materials-waste-and-recycling/national-overview-facts-and-figures-materials#:~:text=The%20total%20generation%20of%20municipal,25%20million%20tons%20were%20composted (accessed on day month year).
- EPA (2024d). Landfill Methane Outreach Program (LMOP). Available online: https://www.epa.gov/lmop/basic-information-about-landfill-gas (accessed on day month year).
- EPA, Office of Air and Radiation (June 2011). Available and Emerging Technologies for Reducing Greenhouse Gas Emissions from Municipal Solid Waste Landfills. Available online: www.epa.gov/sites/default/files/2015-12/documents/landfills.pdf (accessed on day month year).
- EPA-CHP (Combined Heat and Power Partnership) (September 2017). Catalog of CHP Technologies. Available online: https://www.epa.gov/sites/default/files/2015-07/documents/catalog_of_chp_technologies.pdf (accessed on day month year).
- EPA (2024e). LMOP Landfill Technical Data. Landfill Data Files [September 2024]. Available online: https://www.epa.gov/lmop/landfill-technical-data (accessed on day month year).
- EPA (2024f). GHGRP Waste. Available online: https://www.epa.gov/ghgreporting/ghgrp-waste#emissions-table (accessed on day month year).
- World Bank Group (2024). Population, total – European Union Available online:. Available online: https://data.worldbank.org/indicator/SP.POP.TOTL?locations=EU (accessed on day month year).
- Eurostat (February 2024a). Municipal waste statistics. Available online: https://ec.europa.eu/eurostat/statistics-explained/index.php?title=Municipal_waste_statistics#Municipal_waste_treatment (accessed on day month year).
- EUR-LEX (1999). European Directive 1999/31/EC (1999). Council Directive 1999/31/EC of 26 April 1999 on the landfill of waste. Available online: https://eur-lex.europa.eu/legal-content/EN/TXT/?uri=celex%3A31999L0031 (accessed on day month year).
- EUR-LEX (1994). European Directive 94/62. European Parliament and Council Directive 94/62/EC of 20 December 1994 on packaging and packaging waste. Available online: https://eur-lex.europa.eu/legal-content/EN/TXT/?uri=celex%3A31994L0062 (accessed on day month year).
- CFR (Code of Federal Regulations) (up to date as of 10/22/2024). Title 40. Part 258. Criteria for Municipal Solid Waste Landfills. Available online: https://www.ecfr.gov/current/title-40/chapter-I/subchapter-I/part-258 (accessed on day month year).
- Cocoon Interreg Europe, European Union, European Regional Development Fund (2024). Consortium for a Coherent European Landfill Management Strategy. Available online: https://projects2014-2020.interregeurope.eu/cocoon/ (accessed on day month year).
- European Commission (2020). Communication from the Commission to the European Parliament, the Council, the European Economic and Social Committee and the Committee of the Regions on an EU strategy to reduce methane emissions. Available online: https://eur-lex.europa.eu/legal-content/EN/TXT/?uri=CELEX%3A52020DC0663 (accessed on day month year).
- LIFE Project RE MIDA (2018). Innovative Methods for Residual Landfill Gas Emissions Mitigation in Mediterranean Regions LIFE14 CCM/IT/000464. Final Report Covering the project activities from 01/01/2016 to 31/12/2018. Available online: https://webgate.ec.europa.eu/life/publicWebsite/project/LIFE14-CCM-IT-000464/innovative-methods-for-residual-landfill-gas-emissions-mitigation-in-mediterranean-regions (accessed on day month year).
- Kjeldsen, P.; Scheutz, C.; Hansen, S.F.; (2024). We urgently need to improve landfill gas management in EU. DTU Sustain, Technical University of Denmark report. Available online: https://sustain.dtu.dk/-/media/institutter/sustain_newdesign/nyheder/we-urgently-need-to-improved-landfill-gas-management-in-eu-final-flyer-6-pages.pdf (accessed on day month year).
- UNFCC (United Nations Framework Convention on Climate Change) (2024). Greenhouse Gas Inventory Data - Comparison by Category. Available online: https://di.unfccc.int/comparison_by_category?_gl=1*1iql32j*_ga*NTcwNjExMjA1LjE3Mjk2NjI5MjA.*_ga_7ZZWT14N79*MTcyOTY2MjkyMS4xLjEuMTcyOTY2Mjk3Mi4wLjAuMA. (accessed on day month year).
- European Environment Agency (EEA) (2023). Methane Emissions in the EU: The Key to Immediate Action on Climate Change. Available online: https://www.eea.europa.eu/publications/methane-emissions-in-the-eu#:~:text=Methane%20in%20the%20waste%20sector%20in%20the%20EU&text=These%20three%20sources%20represented%20almost,1990%20in%20the%20waste%20sector. (accessed on day month year).
- EUR-LEX (Current consolidated version 01/01/2024). European Directive 91/271/EEC. Council Directive 91/271/EEC of 21 May 1991 concerning urban waste-water treatment. Available online: https://eur-lex.europa.eu/legal-content/EN/TXT/PDF/?uri=CELEX:31991L0271 (accessed on day month year).
- EUR-LEX (Current consolidated version 01/01/2022). Council Directive 86/278/EEC of 12 June 1986 on the protection of the environment, and in particular of the soil, when sewage sludge is used in agriculture. Available online: https://eur-lex.europa.eu/legal-content/EN/TXT/PDF/?uri=CELEX:31986L0278 (accessed on day month year).
- European Commission (2023). Proposal for a Directive of the European Parliament and of the Council Concerning Urban Wastewater Treatment (recast). Available online: https://ec.europa.eu/info/law/better-regulation/have-your-say/initiatives/12405-Water-pollution-EU-rules-on-urban-wastewater-treatment-update-_en (accessed on day month year).
- Federal Register (2009). 56260 Federal Register/Volume 74, Number 209/Friday, October 9, 2009/Rules and Regulations. Mandatory Reporting of Greenhouse Gases. Available online: https://www.govinfo.gov/content/pkg/FR-2009-10-30/pdf/E9-23315.pdf (accessed on day month year).
- EPA (June 2010). Mandatory Greenhouse Gas Reporting Rule: EPA's Response to Public Comments Volume No.:46 Subpart II—Industrial Wastewater Treatment. U. S. Environmental Protection Agency. Office of Atmosphere Programs. Climate Change Division Washington, D.C., pp. EPA (10). Mandatory Greenhouse Gas Reporting Rule: EPA's Response to Public Comments Volume No.:46 Subpart II—Industrial Wastewater Treatment. U. S. Environmental Protection Agency. Office of Atmosphere Programs. Climate Change Division Washington, D.C., pp. 61. 20 June.
- CISA (Cybersecurity & Infrastructure Security Agency) (2024). Water and Wastewater Systems. Available online: https://www.cisa.gov/topics/critical-infrastructure-security-and-resilience/critical-infrastructure-sectors/water-and-wastewater-sector (accessed on day month year).
- Ravishankara A., R. , Daniel J. S., Portmann R. W.. Nitrous oxide (N2O): the dominant ozone-depleting substance emitted in the 21st century. Science, 2009, 326, 123–125. [Google Scholar] [CrossRef] [PubMed]
- Law, Y.; Ye, L.; Pan, Y.; Yuan, Z. Nitrous oxide emissions from wastewater treatment processes. Philos Trans R Soc Lond B Biol Sci., 1: 367(1593), 5 May 1593. [Google Scholar] [CrossRef]
- Law, Y.; Lant, P.; Yuan, Z. The effect of pH on N2O production under aerobic conditions in a partial nitritation system. Water Research, 5944. [Google Scholar] [CrossRef]
- Yu, R.; Kampschreur, M.J.; Loosdrecht, M.C.M.V.; Chandran, K. Molecular mechanisms and specific directionality of autotrophic nitrous oxide and nitric oxide generation during transient anoxia. Environ. Sci. Technol., 2010, 44, 1313–1319. [Google Scholar] [CrossRef] [PubMed]
- Zheng, H.; Hanaki, K.; Matsuo, T. Production of nitrous oxide gas during nitrification of wastewater. Water Sci. Technol., 1994. 30(6). [CrossRef]
- Chuang, H.-P.; Ohashi, A.; Imachi, H.; Tandukar, M.; Harada, H. Effective partial nitrification to nitrite by down-flow hanging sponge reactor under limited oxygen condition. Water Res., 2007, 41, 295–302. [Google Scholar] [CrossRef] [PubMed]
- Pellicer-Nàcher, C.; Sun, S.; Lackner, S.; Terada, A.; Schreiber, F.; Zhou, Q.; Smets, B. F. Sequential aeration of membrane-aerated biofilm reactors for high-rate autotrophic nitrogen removal: experimental demonstration. Environ. Sci. Technol., 2010, 44, 7628–7634. [Google Scholar] [CrossRef] [PubMed]
- Foley, J.; de Haas, D.; Yuan, Z.; Lant, P. Nitrous oxide generation in full-scale biological nutrient removal wastewater treatment plants. Water Res, 44. [CrossRef]
- Song, C.; Zhu, JJ.; Willis, J.L.; et al. Oversimplification and misestimation of nitrous oxide emissions from wastewater treatment plants. Nat Sustain, 1348; 7. [Google Scholar] [CrossRef]
- EPA (November 15, 2021. Available online: www.epa.gov/system/files/documents/2021-11/final-national-recycling-strategy.pdf (accessed on day month year).
- The White House (June 2024). National Strategy for Reducing Food Loss and Waste and Recycling Organics. The White House, Washington D.C., pp. 42. Available online: www.whitehouse.gov/wp-content/uploads/2024/06/NATIONAL-STRATEGY-FOR-REDUCING-FOOD-LOSS-AND-WASTE-AND-RECYCLING-ORGANICS_6.11.24.pdf (accessed on day month year).
- EPA (2020). Recycling Economic Information (REI) Report November 2020. EPA report, 12pp. Available online: https://www.epa.gov/sites/default/files/2020-11/documents/rei_report_508_compliant.pdf (accessed on day month year).
- Paleologos, E.K.; Mohamed, A.M.O.; Mohamed, D. , et al. Decarbonization Advances and Challenges in the Waste Industry and Soil Remediation. Environmental Geotechnics,.
- IPCC (2022). Climate Change 2022: Mitigation of Climate Change. Contribution of Working Group III to the Sixth Assessment Report of the Intergovernmental Panel on Climate Change [P.R. Shukla: J. Skea; R. Slade: A. Al Khourdajie; R. van Diemen; D. McCollum; M. Pathak; S. Some; P. Vyas; R. Fradera; M. Belkacemi; A. Hasija; G. Lisboa; S. Luz; J. Malley; (eds.)]. Publisher: Cambridge University Press, Cambridge, UK and New York, NY, USA. [CrossRef]
- Crippa, M.; Guizzardi, D.; Pagani, F.; Banja, M.; Muntean, M.; Schaaf, E.; Monforti-Ferrario, F.; Becker, W.E.; Quadrelli, R.; Risquez Martin, A.; Taghavi-Moharamli, P.; Köykkä, J.; Grassi, G.; Rossi, S.; Melo, J.; Oom, D.; Branco, A.; San-Miguel, J.; Manca, G.; Pisoni, E.; Vignati, E.; Pekar, F. 2024. [CrossRef]
- Johnke, B.; (2000). Emissions from waste incineration. In IPCC Good Practice Guidance and Uncertainty Management in National Greenhouse Gas Inventories. Chapter 5 Waste Incineration. pp. 455-468. Available online: https://www.ipcc-nggip.iges.or.jp/public/gp/bgp/5_3_Waste_Incineration.pdf (accessed on day month year).
- IPPC (2024). 2019 Refinement to the 2006 IPCC Guidelines for National Greenhouse Gas Inventories. Volume 5 Waste. Chapter 5: Incineration and Open Burning of Waste. Available online: https://www.ipcc-nggip.iges.or.jp/public/2019rf/vol5.html (accessed on day month year).
- GHG Platform India (2018). Emissions Estimates. Waste Sector. Waste Emissions 2018. Available online: https://www.ghgplatform-india.org/waste-sector/ (accessed on day month year).
- Eurostat (2024b). Greenhouse gas emissions from waste. Available online: https://ec.europa.eu/eurostat/web/products-eurostat-news/-/ddn-20200123-1#:~:text=Greenhouse%20gas%20emissions%20from%20waste% (accessed on day month year).
- Consumer Ecology (2024). Carbon footprint of a cardboard box. Available online: https://consumerecology.com/carbon-footprint-of-a-cardboard-box/ (accessed on day month year).
- EPA (2024). Paper and Paperboard: Material-Specific Data. Available online: https://www.epa.gov/facts-and-figures-about-materials-waste-and-recycling/paper-and-paperboard-material-specific-data (accessed on day month year).
Figure 1.
Top countries in GHG emissions from 1990 to 2023 (based on data from [1]).
Figure 1.
Top countries in GHG emissions from 1990 to 2023 (based on data from [1]).
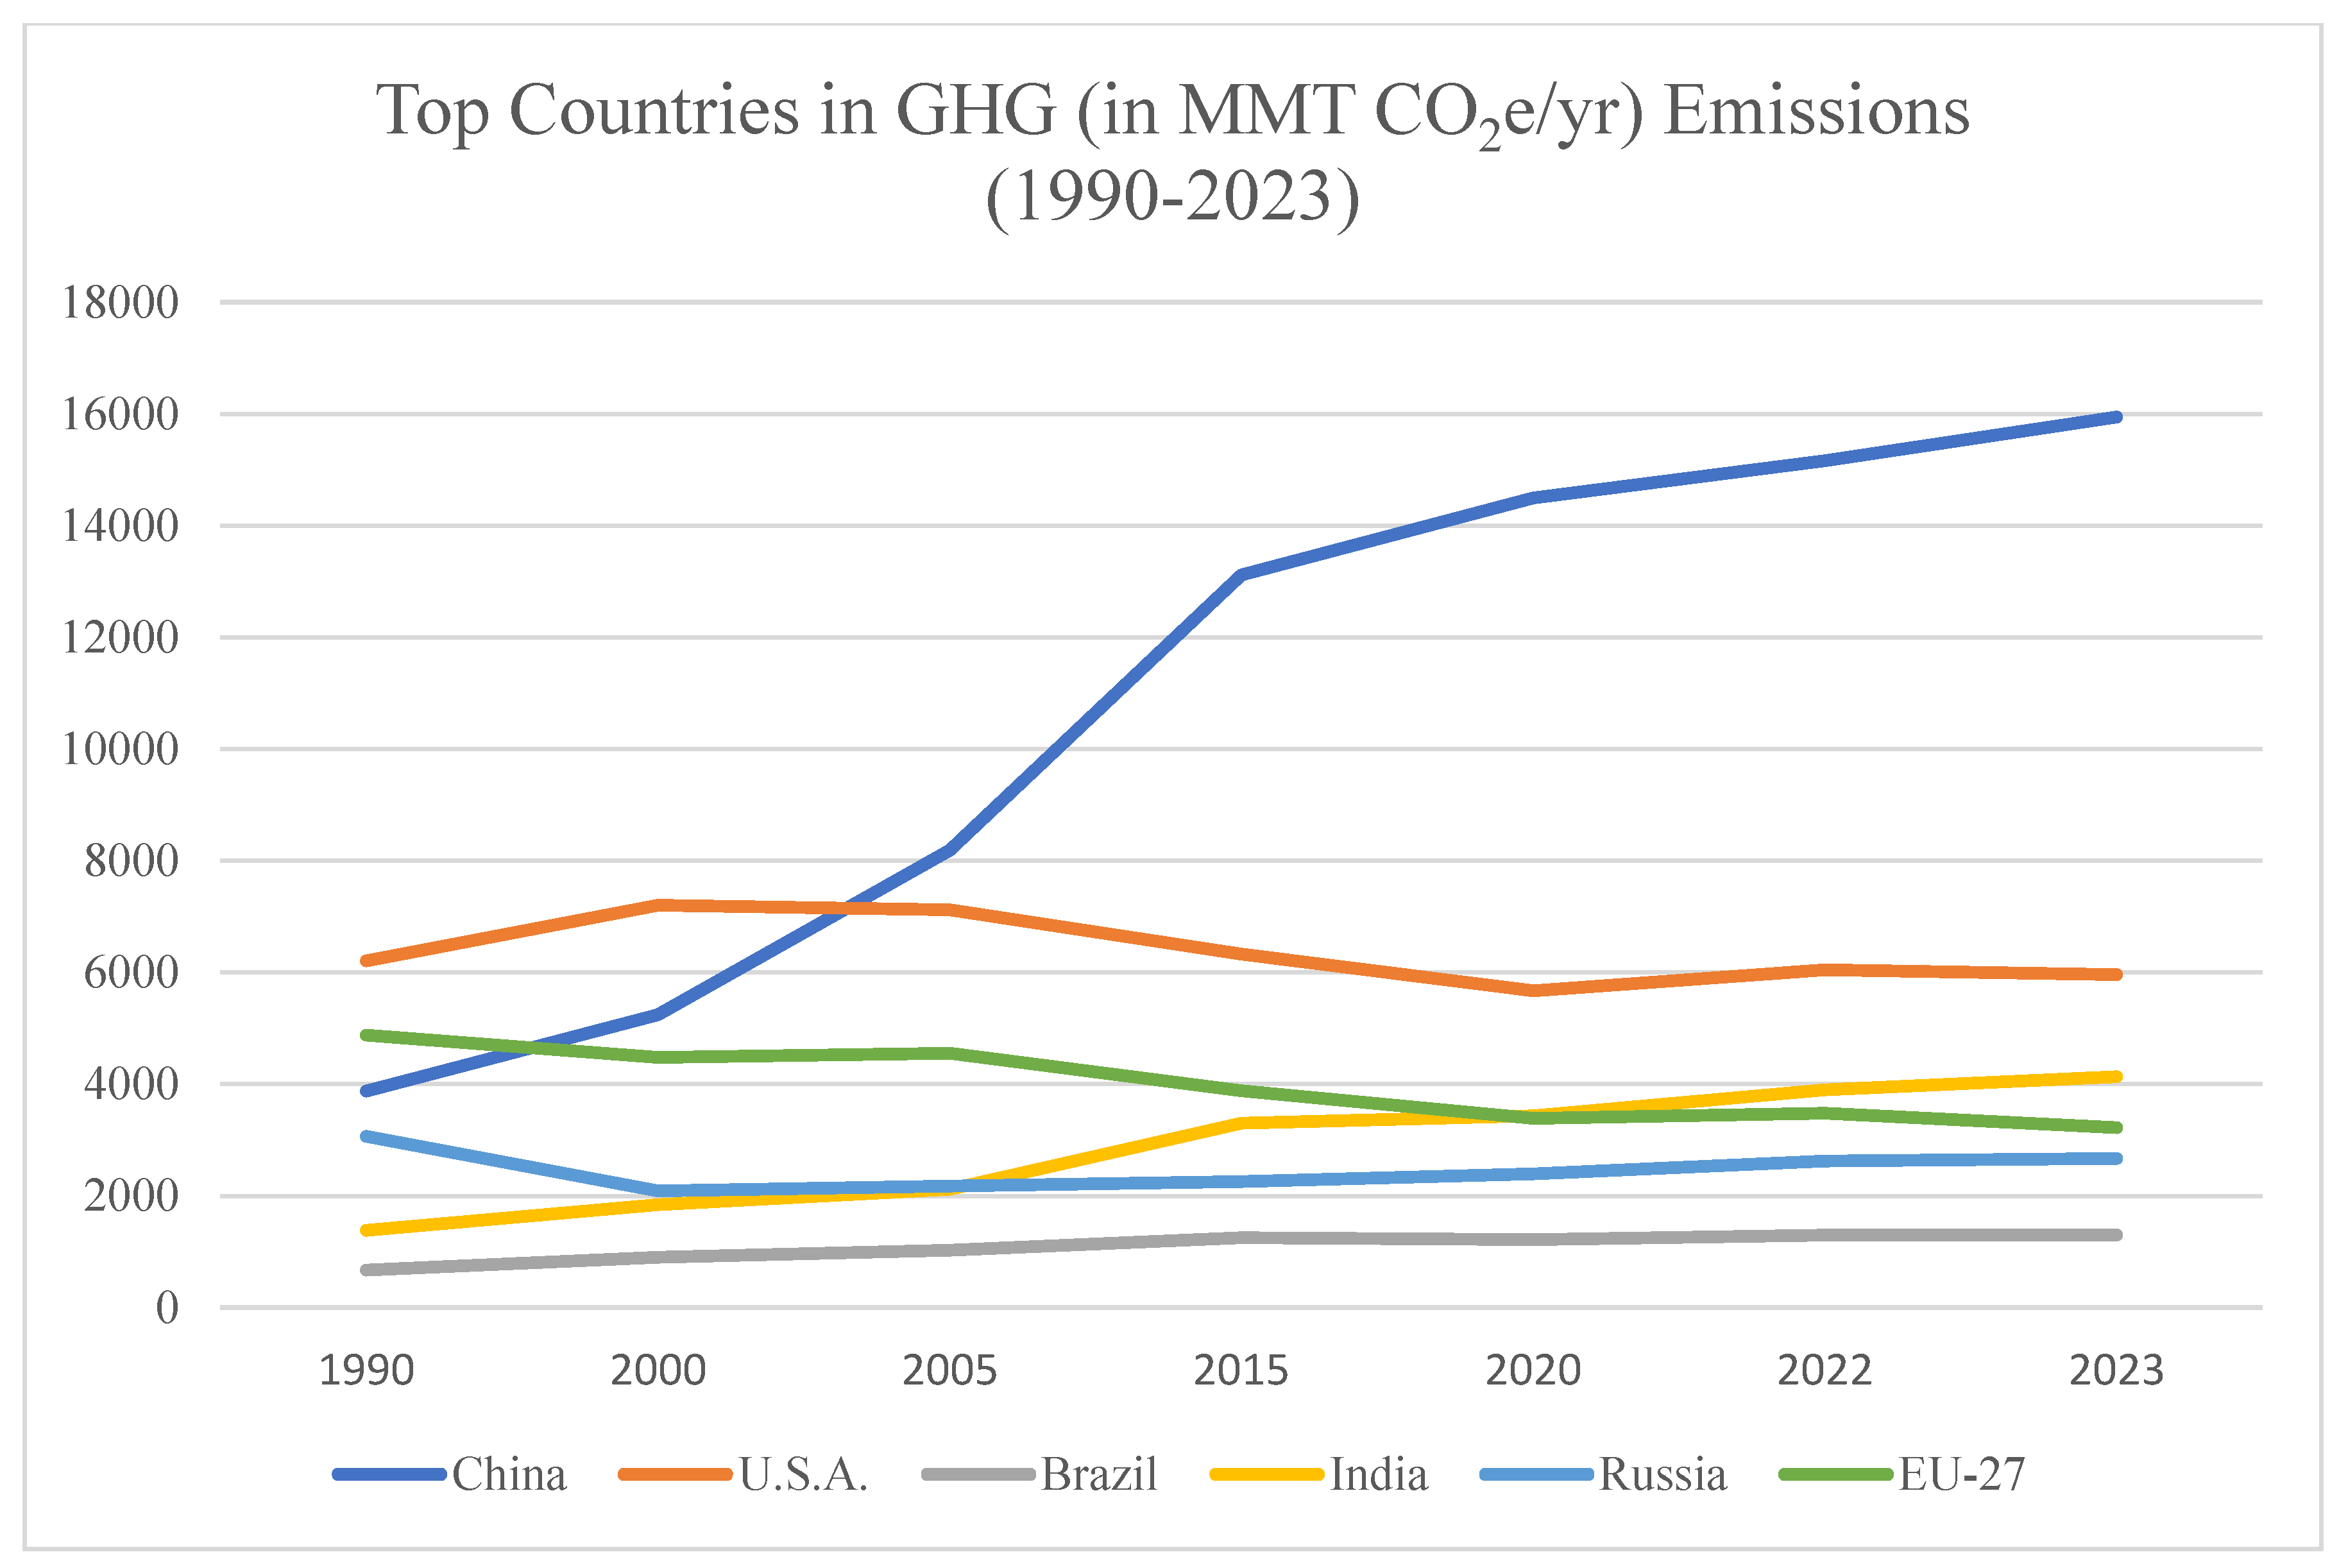
Figure 2.
MSW management methods in U.S.A. from 1970 to 2018 (based on data from [13]).
Figure 2.
MSW management methods in U.S.A. from 1970 to 2018 (based on data from [13]).
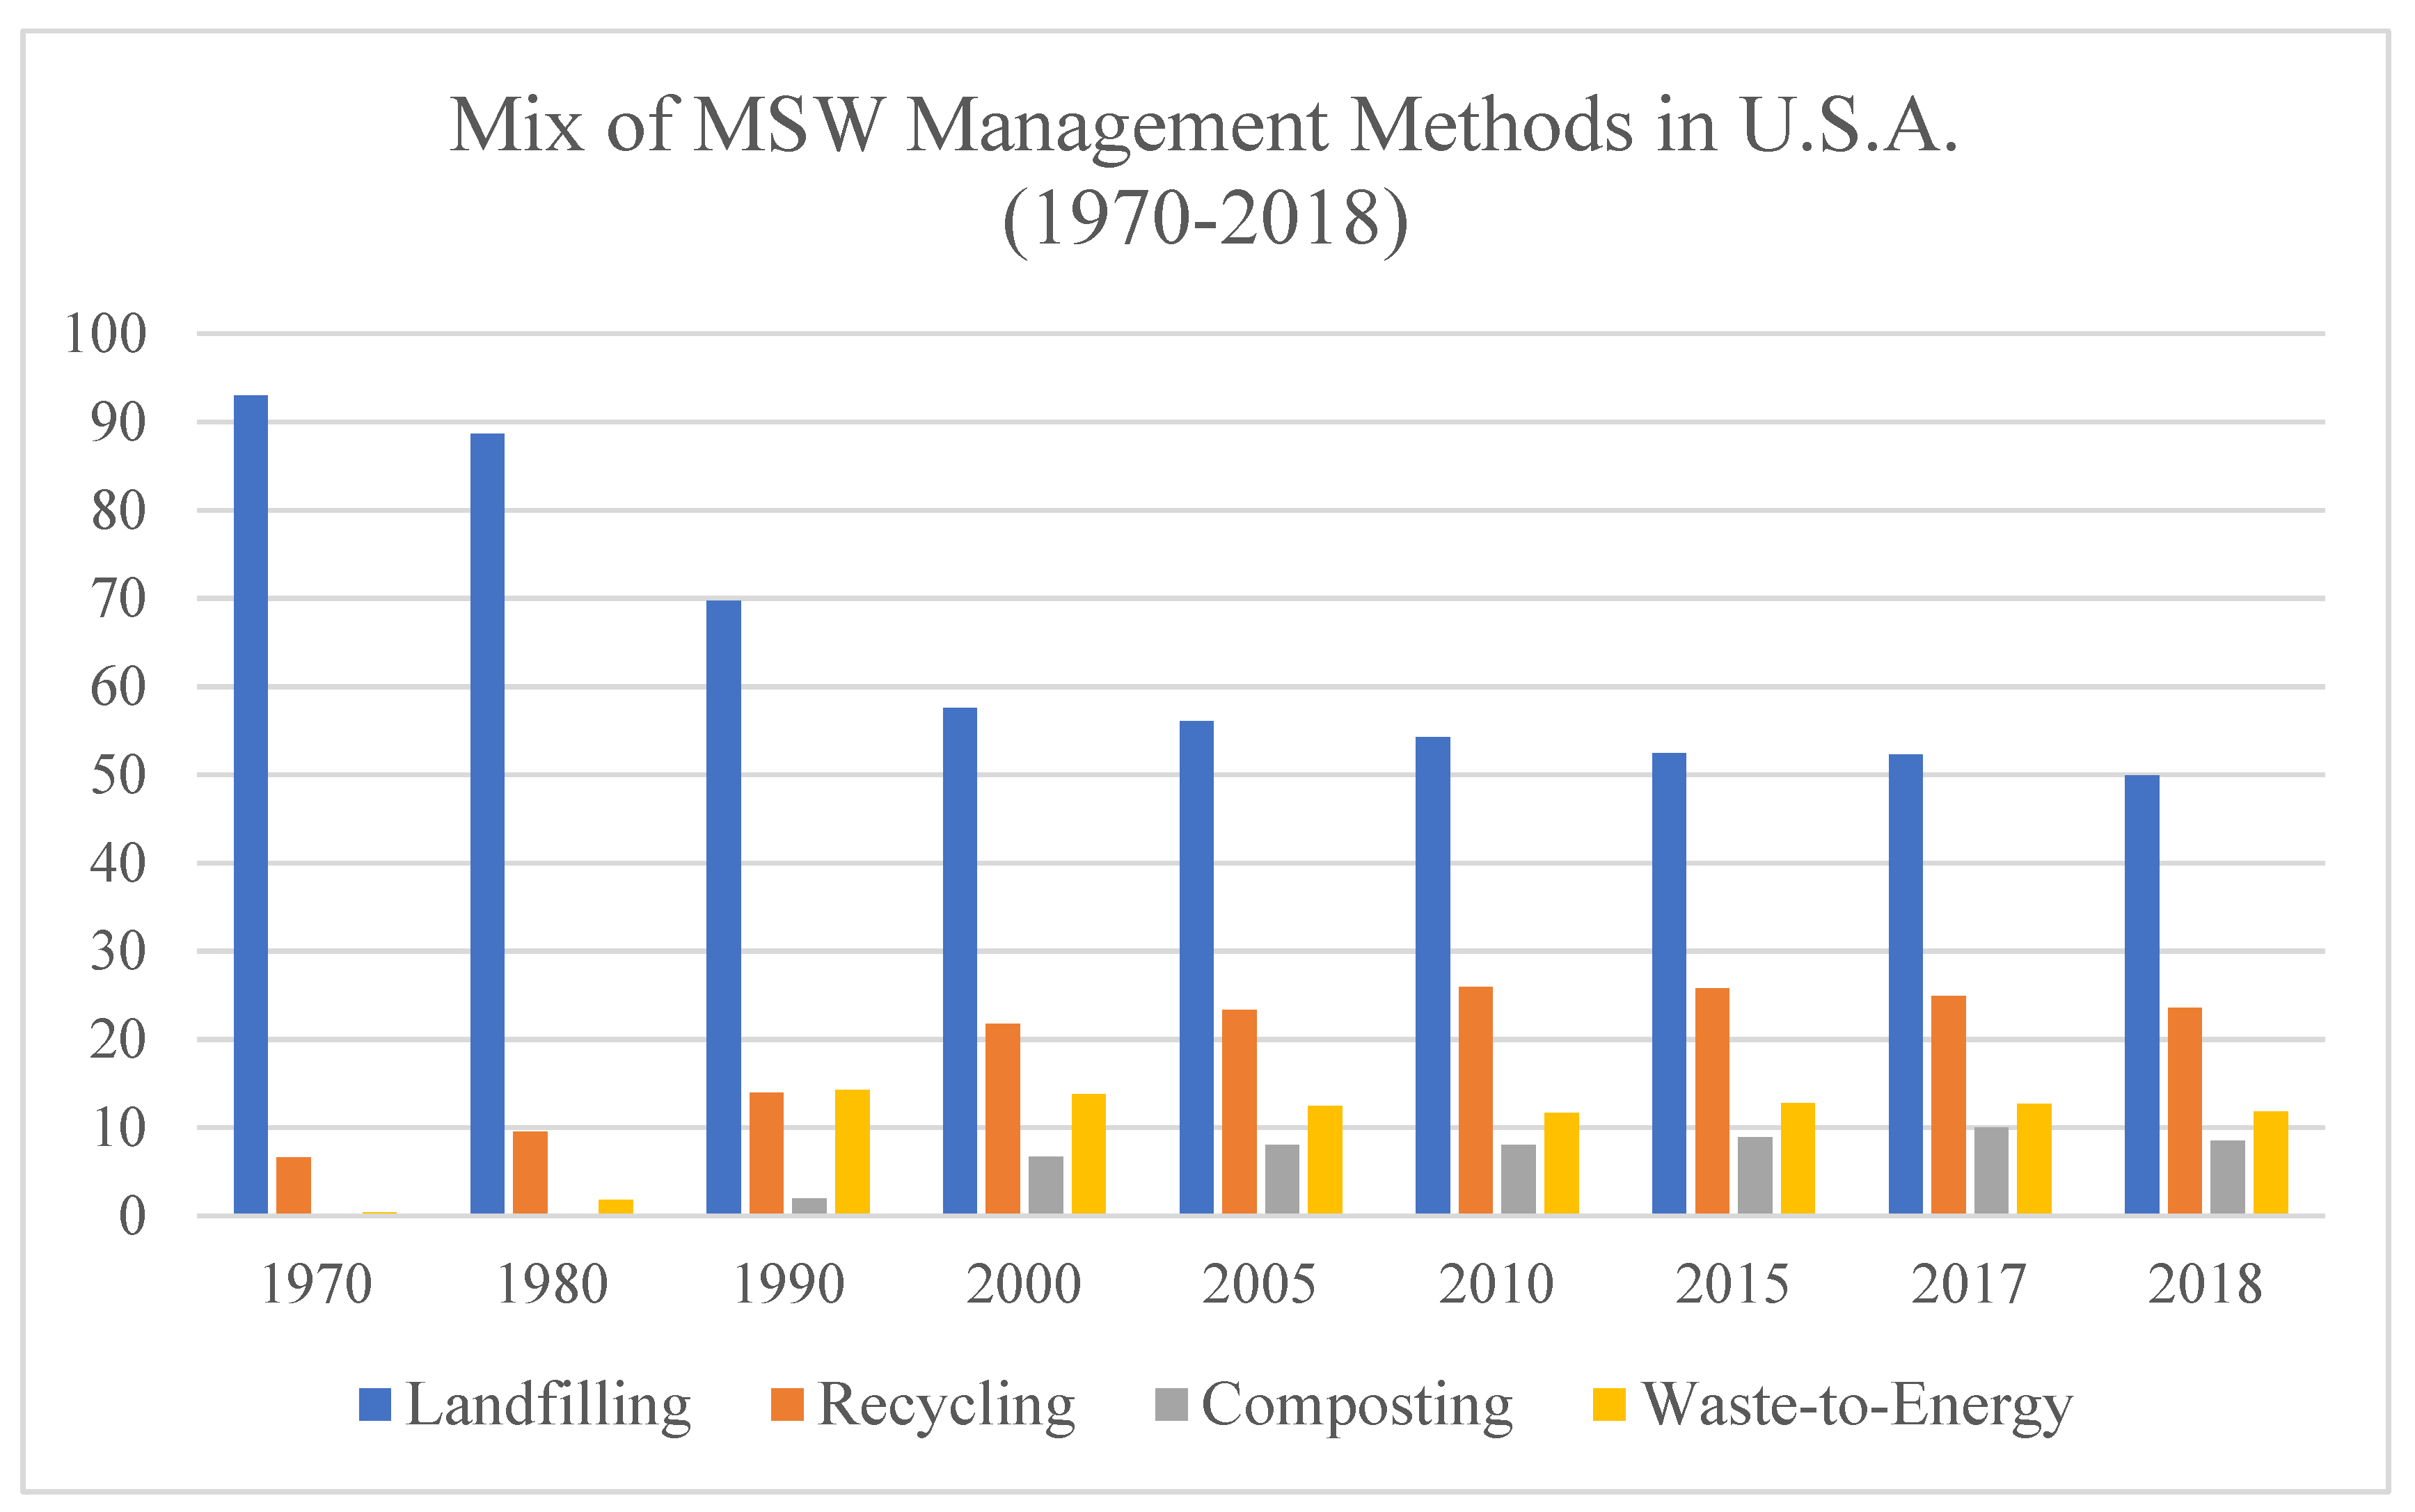
Figure 3.
Number of landfills opened per year in U.S.A. from 1990-2024 (based on data from [17]).
Figure 3.
Number of landfills opened per year in U.S.A. from 1990-2024 (based on data from [17]).
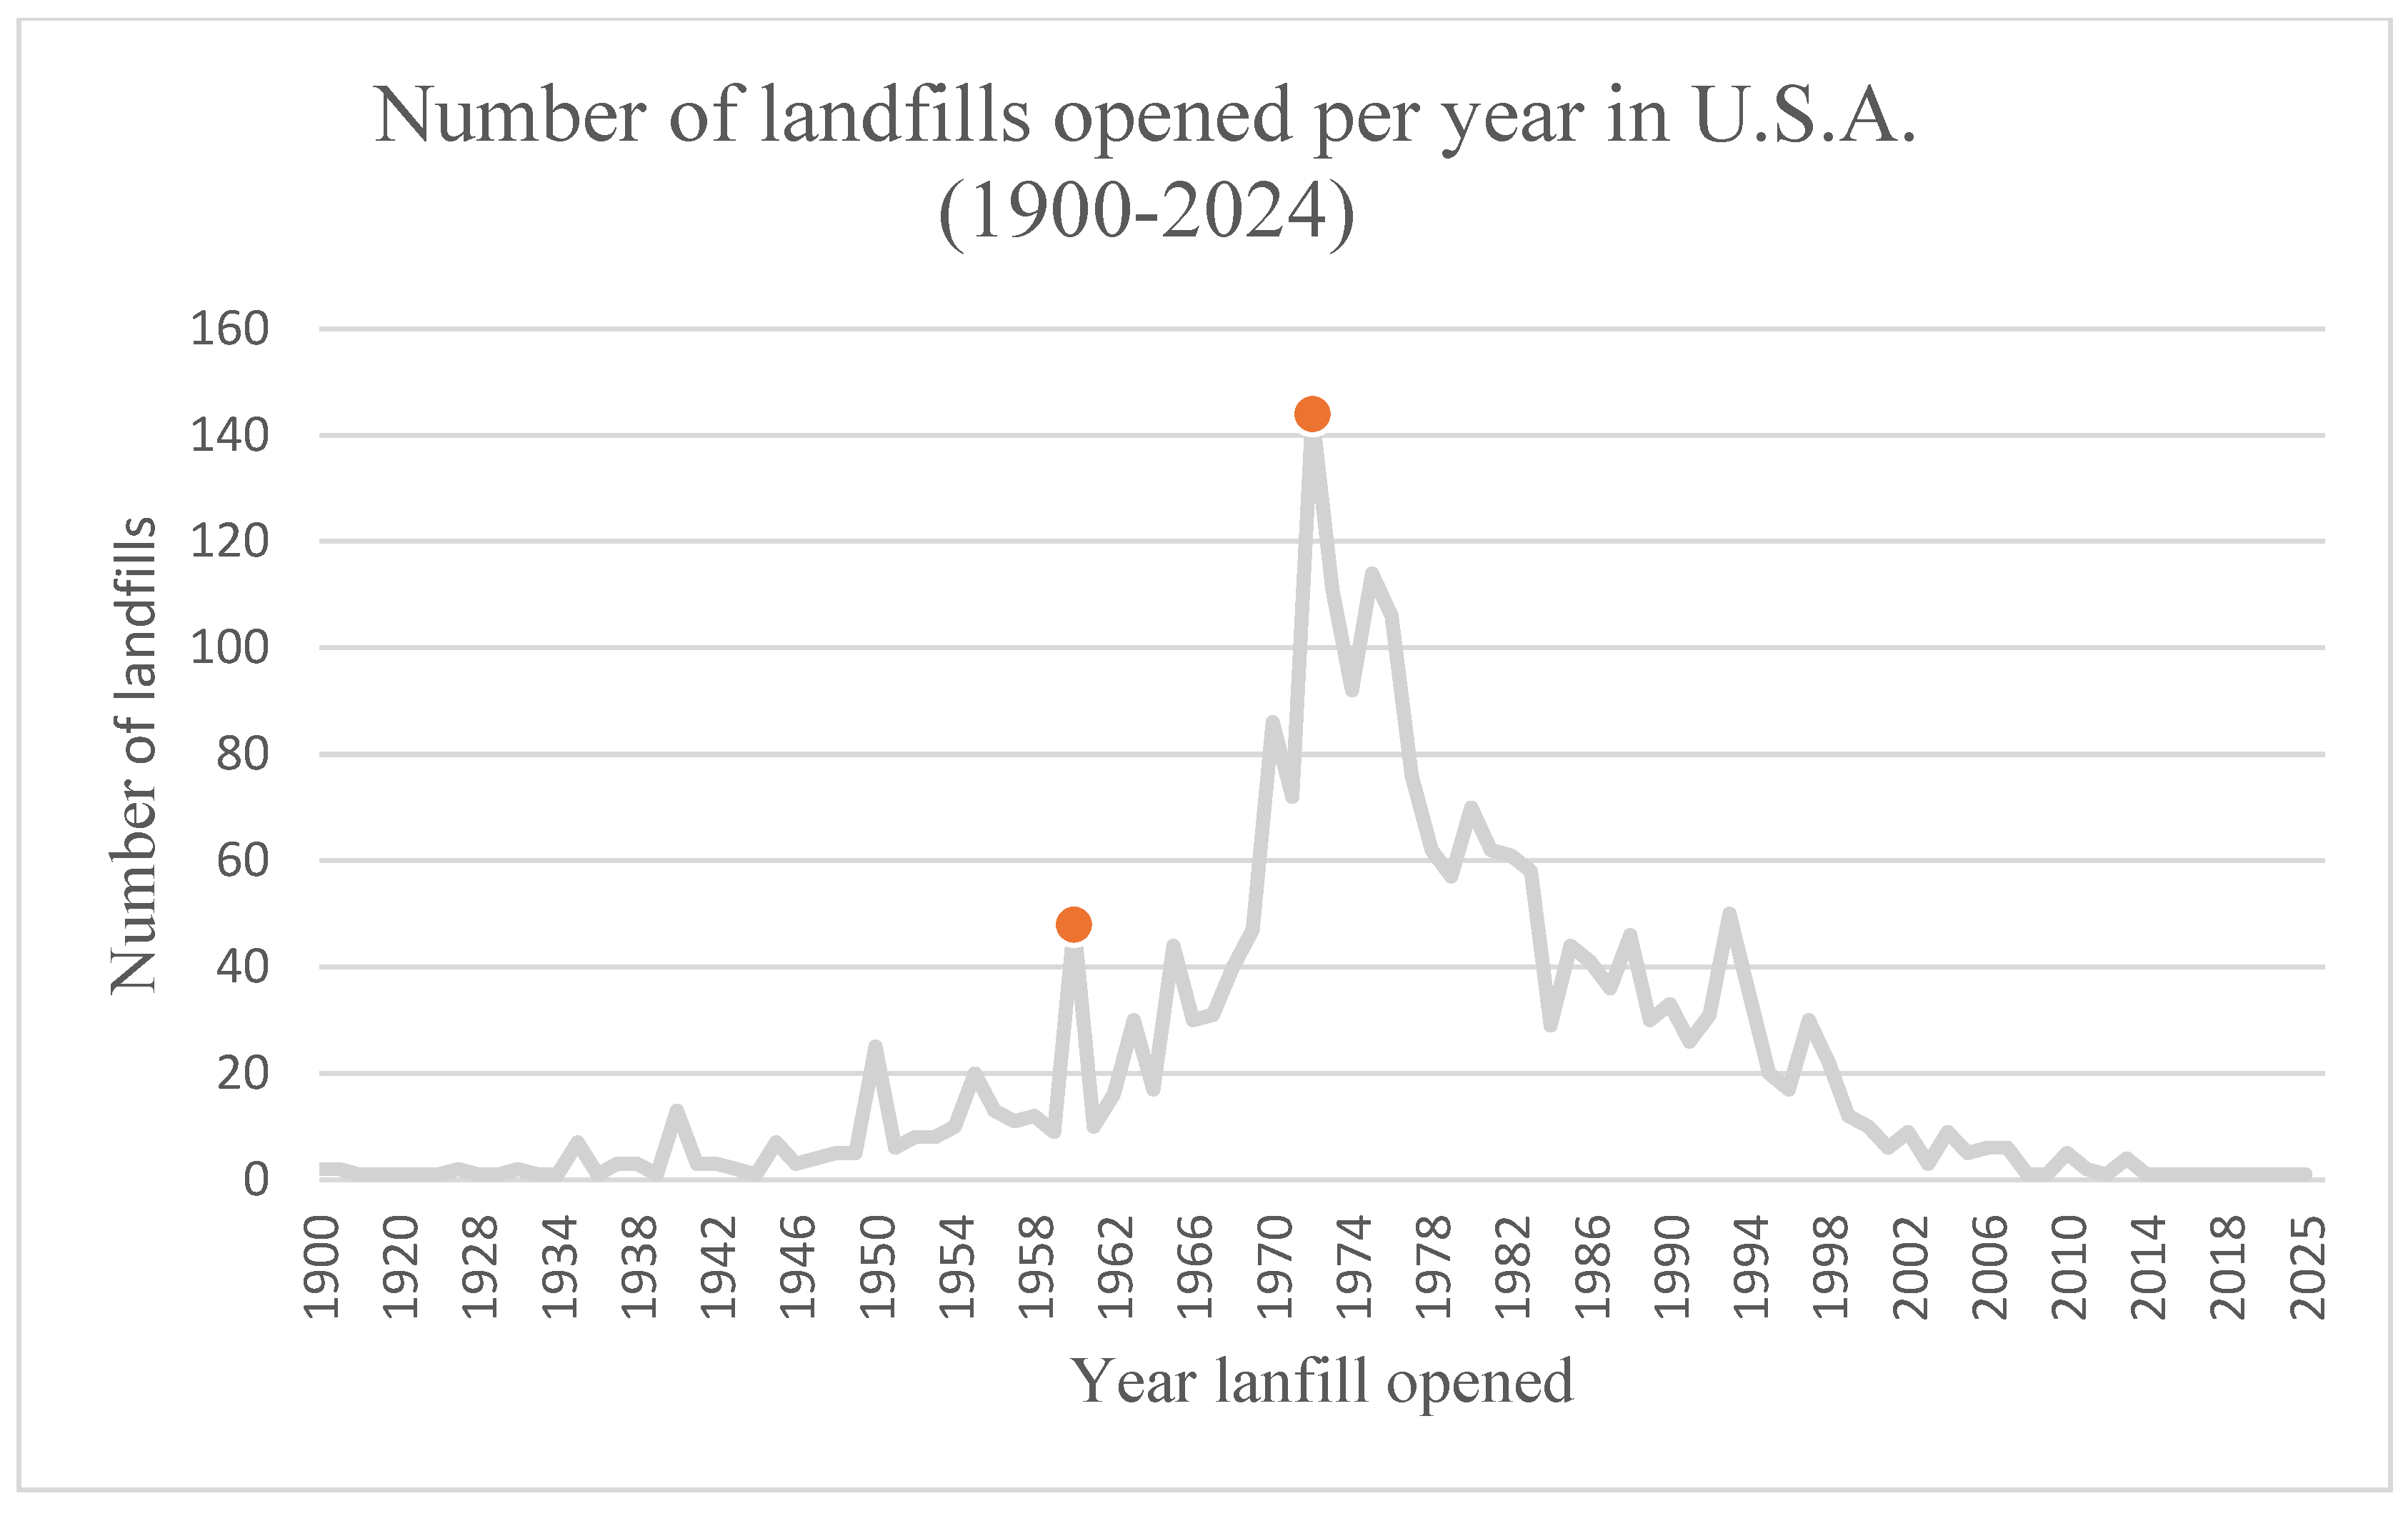
Figure 4.
MSW management methods in the European Union from 1995 to 2022 (based on data from the Eurostat [20]).
Figure 4.
MSW management methods in the European Union from 1995 to 2022 (based on data from the Eurostat [20]).
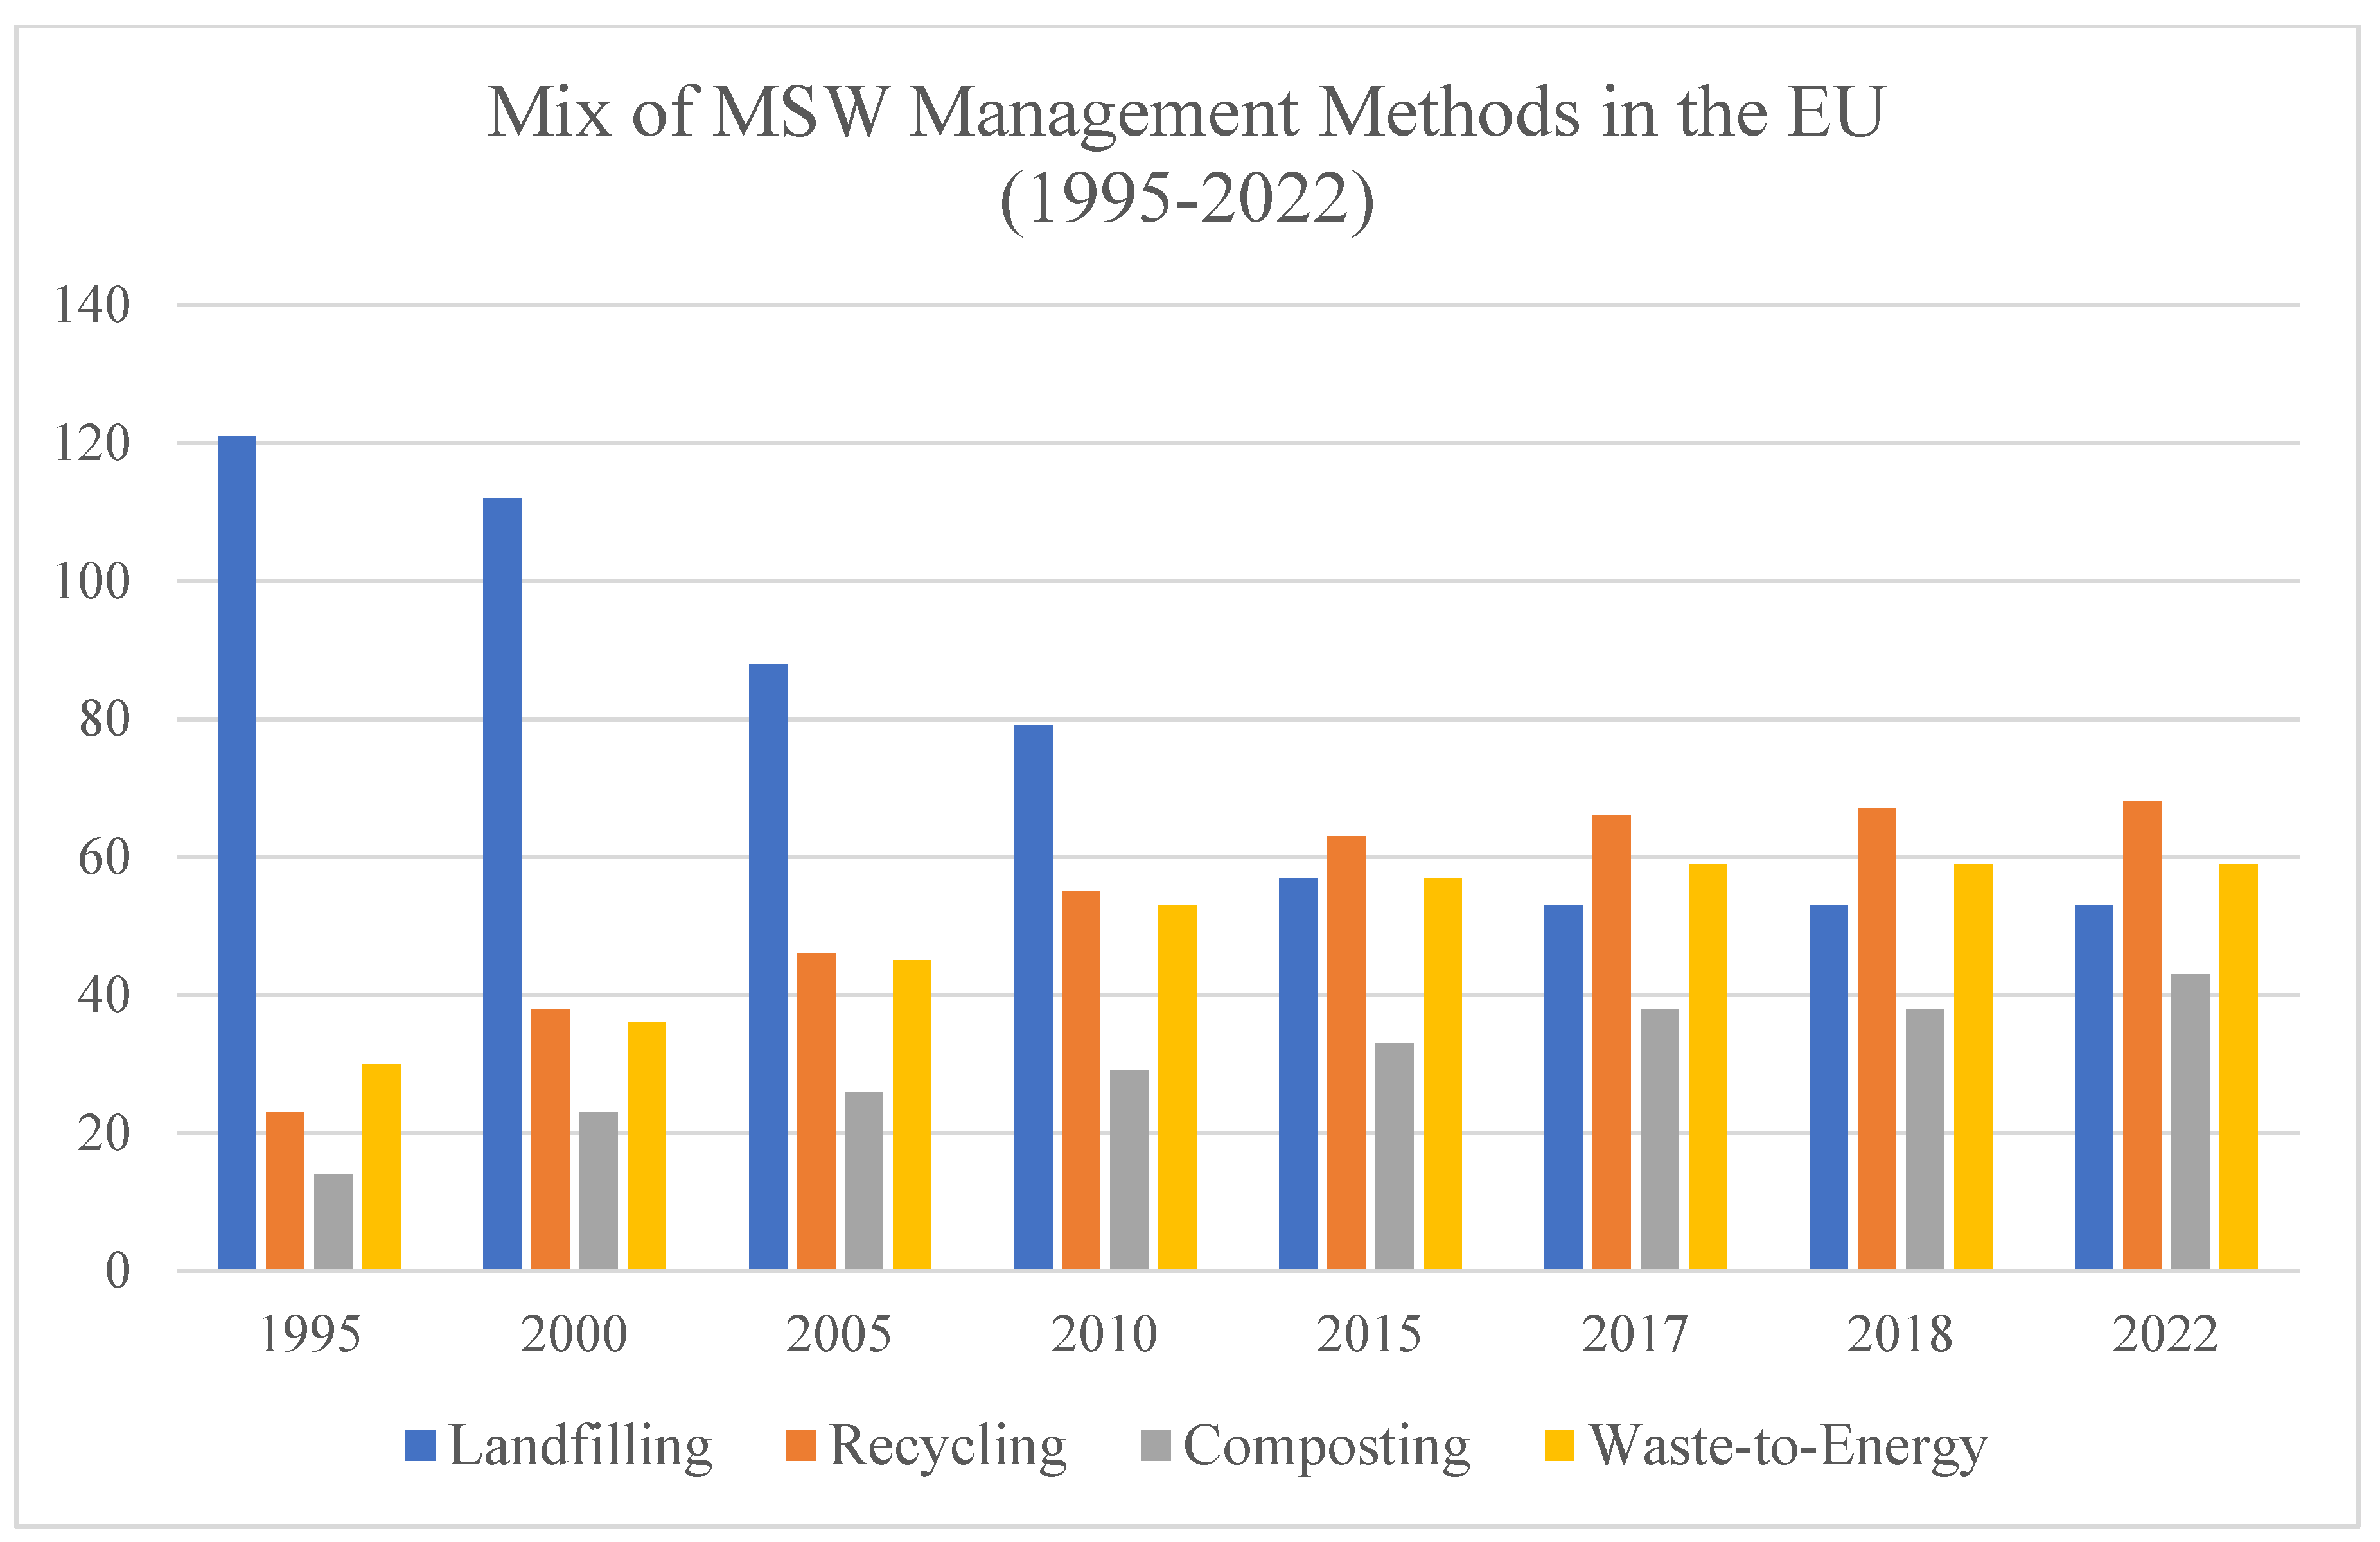
Figure 5.
NO2 emissions (in MMT CO2e) from wastewater treatment and discharge (WTD) in EU and U.S.A. (1990-2021) (based on data from UNFCC [28]).
Figure 5.
NO2 emissions (in MMT CO2e) from wastewater treatment and discharge (WTD) in EU and U.S.A. (1990-2021) (based on data from UNFCC [28]).
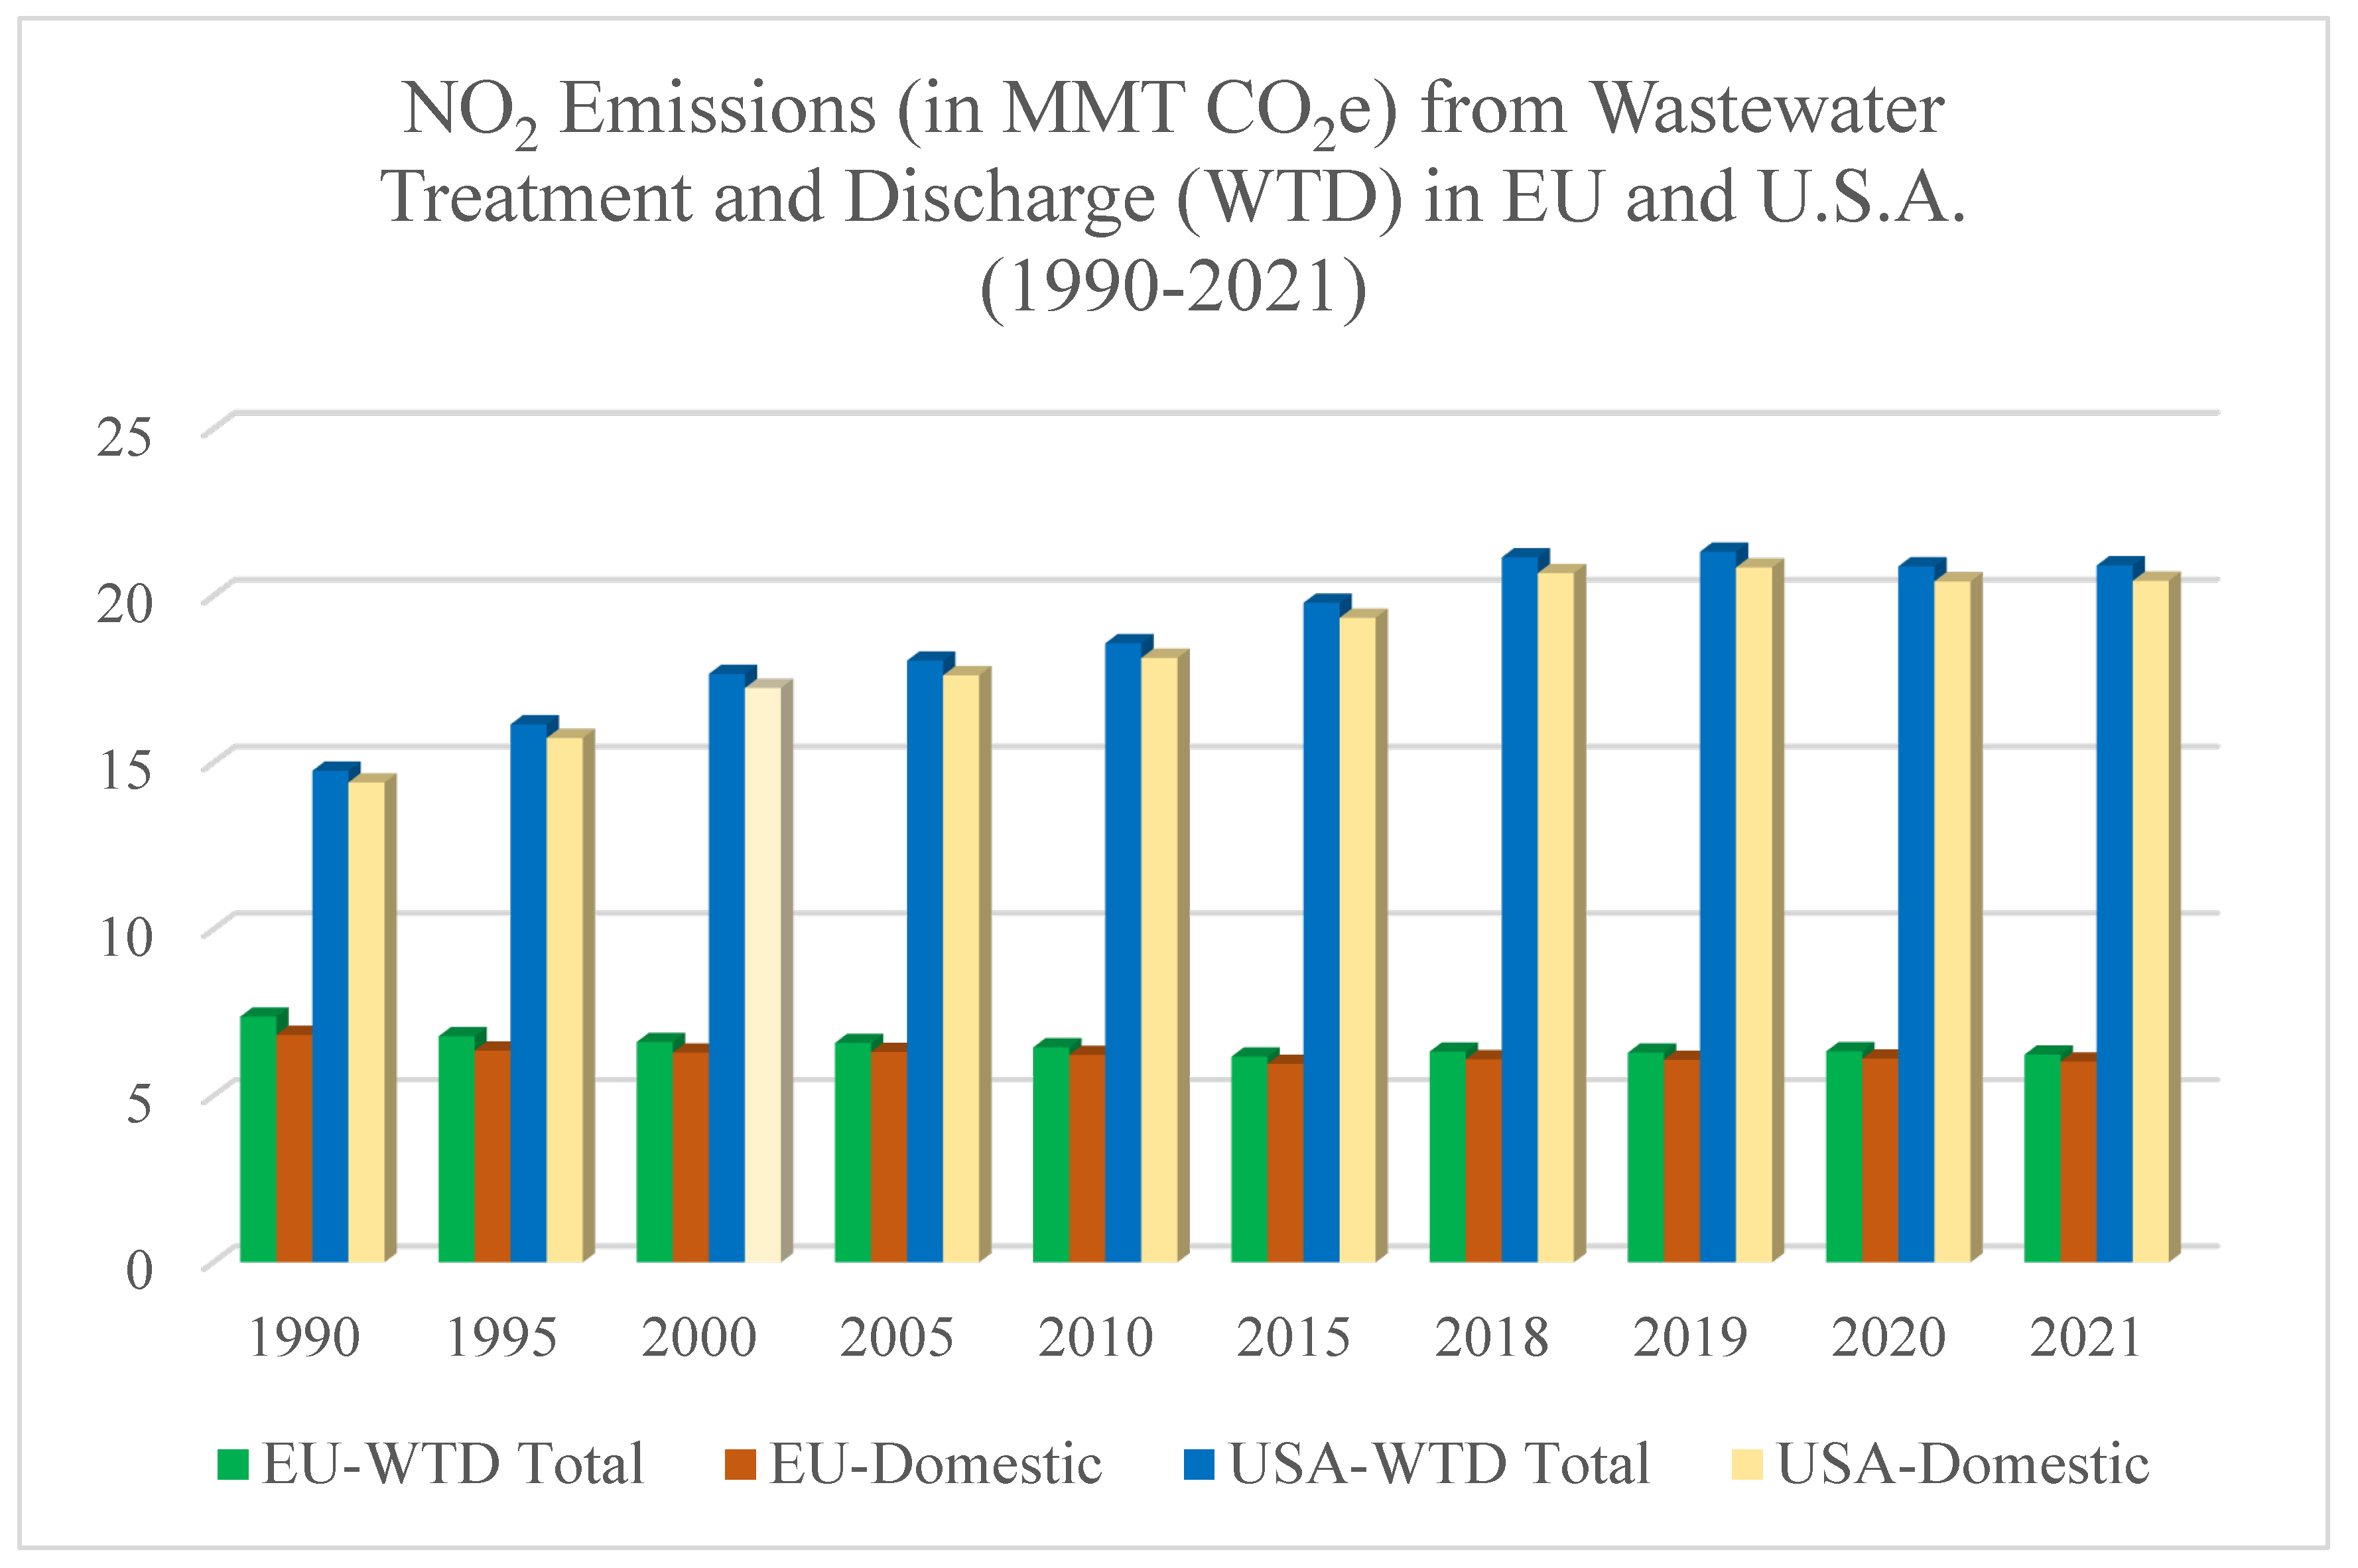

Table 1.
MSW quantities (in MMT) per management method for the United States, based on data from EPA [13] given from 1970 until 2018, and the European Union (given in parentheses) from 1995 to 2022, based on data from Eurostat [20].
| MSW management method (in MMT) | USA (EU) population(million) | Landfill | Recycling | Composting | Combustion with energy recovery | Total |
| 1970 | 203.4 | 102.1 | 7.28 | 0 | 0.408 | 109.83 |
| 1980 | 226.5 | 121.9 | 13.17 | 0 | 2.504 | 137.56 |
| 1990 | 250.1 | 131.8 | 26.3 | 3.8 | 27 | 189 |
| 1995 | 266.6 (426.2) | 129 (121) | 37 (30) | 9.4 (14) | 29 (23) | 205 (198) |
| 2000 | 282.2 (429.3) | 127 (112) | 48 (38) | 15 (23) | 31 (36) | 221 (220) |
| 2005 | 295.5 (435.6) | 129 (88) | 54 (46) | 19 (26) | 29 (45) | 230 (221) |
| 2010 | 309.3 (441.5) | 124 (79) | 59 (55) | 18 (29) | 27 (53) | 228 (222) |
| 2015 | 320.7 (444.6) | 125 (57) | 61 (63) | 21 (33) | 30 (57) | 238 (214) |
| 2017 | 325.1 (446.2) | 127 (53) | 61 (66) | 25 (38) | 31 (59) | 244 (220) |
| 2018 | 326.8 (447) | 133 (53) | 63 (67) | 23 (38) | 31 (59) | 265 (221) |
| 2022 | (449.5) | (53) | (68) | (43) | (59) | (229) |
Table 2.
Emissions (in MMT CO2e) from solid waste management methods in USA from 1990 to 2022 based on AR5 CO2 equivalent values [3] (Table 7.1, 7.3, and 3.1).
Table 2.
Emissions (in MMT CO2e) from solid waste management methods in USA from 1990 to 2022 based on AR5 CO2 equivalent values [3] (Table 7.1, 7.3, and 3.1).
| Gas/Year | 1990 | 2005 | 2018 | 2019 | 2020 | 2021 | 2022 |
| CH4 | |||||||
| MSW landfill | 185.5 | 131.6 | 107.7 | 109.9 | 105.2 | 103.1 | 100.9 |
| Indus. landfill | 12.2 | 16.1 | 18.7 | 18.8 | 18.9 | 18.9 | 18.9 |
| Composting | 0.4 | 2.1 | 2.5 | 2.5 | 2.6 | 2.6 | 2.6 |
| Incineration of Waste | For all years emissions do not exceed 0.05 MMT CO2e | ||||||
| N2O | |||||||
| Composting | 0.3 | 1.5 | 1.8 | 1.8 | 1.8 | 1.8 | 1.8 |
| Incineration of Waste | 0.4 | 0.3 | 0.4 | 0.4 | 0.3 | 0.4 | 0.3 |
| CO2 | |||||||
| Incineration of Waste | 12.9 | 13.3 | 13.3 | 12.9 | 12.9 | 12.5 | 12.4 |
*The values for CH4 emissions from MSW landfills represent net emissions after CH4 recovered and oxidized has been subtracted.
Table 3.
CH4 emissions (in MMT CO2e) from MSW landfills in USA from 1990 to 2022 based on AR5 CO2 equivalent values [3] (Table 7.3).
Table 3.
CH4 emissions (in MMT CO2e) from MSW landfills in USA from 1990 to 2022 based on AR5 CO2 equivalent values [3] (Table 7.3).
| MSW landfills | 1990 | 2005 | 2018 | 2019 | 2020 | 2021 | 2022 |
| CH4 generated | 230.0 | 303.7 | 332.0 | 340.9 | 340.9 | 335.9 | 331.4 |
| CH4 recovered | (23.8) | (148.4) | (195.2) | (201.4) | (206.3) | (203.3) | (199.8) |
| CH4 oxidized | (20.6) | (23.6) | (29.2) | (29.6) | (29.4) | (29.5) | (30.7) |
| Net CH4 emissions | 185.5 | 131.6 | 107.7 | 109.9 | 105.2 | 103.1 | 100.9 |
| Percent CH4 Recovered and Oxidized | 19.3% | 56.6% | 67.6% | 67.8% | 69.1% | 69.3% | 69.55% |
| Net CH4 per capita/year (t CO2e) | 0.91 | 0.44 | 0.33 | 0.33 | 0.32 | 0.31 | 0.30 |
Table 4.
CH4 Emissions (in MT CO2e) from: Managed waste disposal sites (MWDS), Unmanaged waste disposal sites (UMWDS), and Uncategorized waste disposal sites (UWDS) in the EU and U.S.A. [28].
Table 4.
CH4 Emissions (in MT CO2e) from: Managed waste disposal sites (MWDS), Unmanaged waste disposal sites (UMWDS), and Uncategorized waste disposal sites (UWDS) in the EU and U.S.A. [28].
| CH4/Year | 1990 | 2000 | 2005 | 2010 | 2015 | |||||||||||||||
| MSW disposal method | EU | USA | EU | USA | EU | USA | EU | USA | EU | USA | ||||||||||
| MWDS | 107.94 | 197.75 | 106.47 | 156.42 | 92.64 | 147.71 | 80.8 | 139 | 70.03 | 125.81 | ||||||||||
| UMWDS | 27.74 | No | 27.24 | No | 23.34 | No | 18.99 | No | 13.54 | No | ||||||||||
| UWDS | 1.39 | No | 0.89 | No | 0.68 | No | 0.47 | No | 0.35 | No | ||||||||||
| Total | 137.07 | 197.75 | 134.6 | 156.42 | 116.66 | 147.71 | 100.26 | 139 | 83.92 | 125.81 | ||||||||||
| CH4/Year | 2018 | 2019 | 2020 | 2021 | % change from 1990 | |||||||||||||||
| MSW disposal method | EU | USA | EU | USA | EU | USA | EU | USA | EU | USA | ||||||||||
| MWDS | 67.48 | 126.69 | 67.24 | 129 | 67.17 | 124.77 | 65.62 | 122.61 | -39 | -38 | ||||||||||
| UMWDS | 11.24 | No | 10.68 | No | 10.08 | No | 9.59 | No | -65 | No | ||||||||||
| UWDS | 0.29 | No | 0.27 | No | 0.26 | No | 0.24 | No | -83 | No | ||||||||||
| Total | 79.01 | 126.69 | 78.19 | 129 | 77.51 | 124.77 | 75.45 | 122.61 | -45 | -38 | ||||||||||
Table 5.
Emissions (in MMT CO2e) from wastewater treatment in U.S.A. from 1990 to 2022 based on AR5 CO2 equivalent values [2] (Table 7.7).
Table 5.
Emissions (in MMT CO2e) from wastewater treatment in U.S.A. from 1990 to 2022 based on AR5 CO2 equivalent values [2] (Table 7.7).
| Gas/Year | 1990 | 2005 | 2018 | 2019 | 2020 | 2021 | 2022 |
| CH4 | |||||||
| Domestic treatment | 15.1 | 14.6 | 12.3 | 11.9 | 11.7 | 11.4 | 11.6 |
| Domestic effluent | 1.4 | 1.4 | 2.0 | 2.0 | 2.1 | 2.1 | 2.0 |
| Industrial treatment | 5.5 | 6.1 | 6.5 | 6.6 | 6.6 | 6.7 | 6.7 |
| Industrial effluent | 0.7 | 0.6 | 0.6 | 0.5 | 0.5 | 0.5 | 0.5 |
| Total wastewaterTreatment | 22.7 | 22.7 | 21.4 | 21.1 | 21.0 | 20.7 | 20.8 |
| N2O | |||||||
| Domestic treatment | 10.5 | 13.7 | 16.2 | 16.6 | 17.2 | 17.1 | 17.0 |
| Domestic effluent | 3.9 | 3.9 | 4.5 | 4.5 | 4.6 | 4.5 | 4.4 |
| Industrial treatment | 0.3 | 0.4 | 0.4 | 0.4 | 0.4 | 0.4 | 0.4 |
| Industrial effluent | 0.1 | 0.1 | 0.1 | 0.1 | 0.1 | 0.1 | 0.1 |
| Total wastewatertreatment | 14.8 | 18.1 | 21.2 | 21.6 | 22.3 | 22.1 | 21.9 |
Disclaimer/Publisher’s Note: The statements, opinions and data contained in all publications are solely those of the individual author(s) and contributor(s) and not of MDPI and/or the editor(s). MDPI and/or the editor(s) disclaim responsibility for any injury to people or property resulting from any ideas, methods, instructions or products referred to in the content. |
© 2024 by the authors. Licensee MDPI, Basel, Switzerland. This article is an open access article distributed under the terms and conditions of the Creative Commons Attribution (CC BY) license (http://creativecommons.org/licenses/by/4.0/).
Copyright: This open access article is published under a Creative Commons CC BY 4.0 license, which permit the free download, distribution, and reuse, provided that the author and preprint are cited in any reuse.


