Preprint
Article

This version is not peer-reviewed.

Italian Sustainable Living – Survey About Sustainable Knowledge, Attitudes, and Behaviours Among the Italian Population

A peer-reviewed article of this preprint also exists.

Submitted:

08 November 2024

Posted:

12 November 2024

You are already at the latest version

Abstract

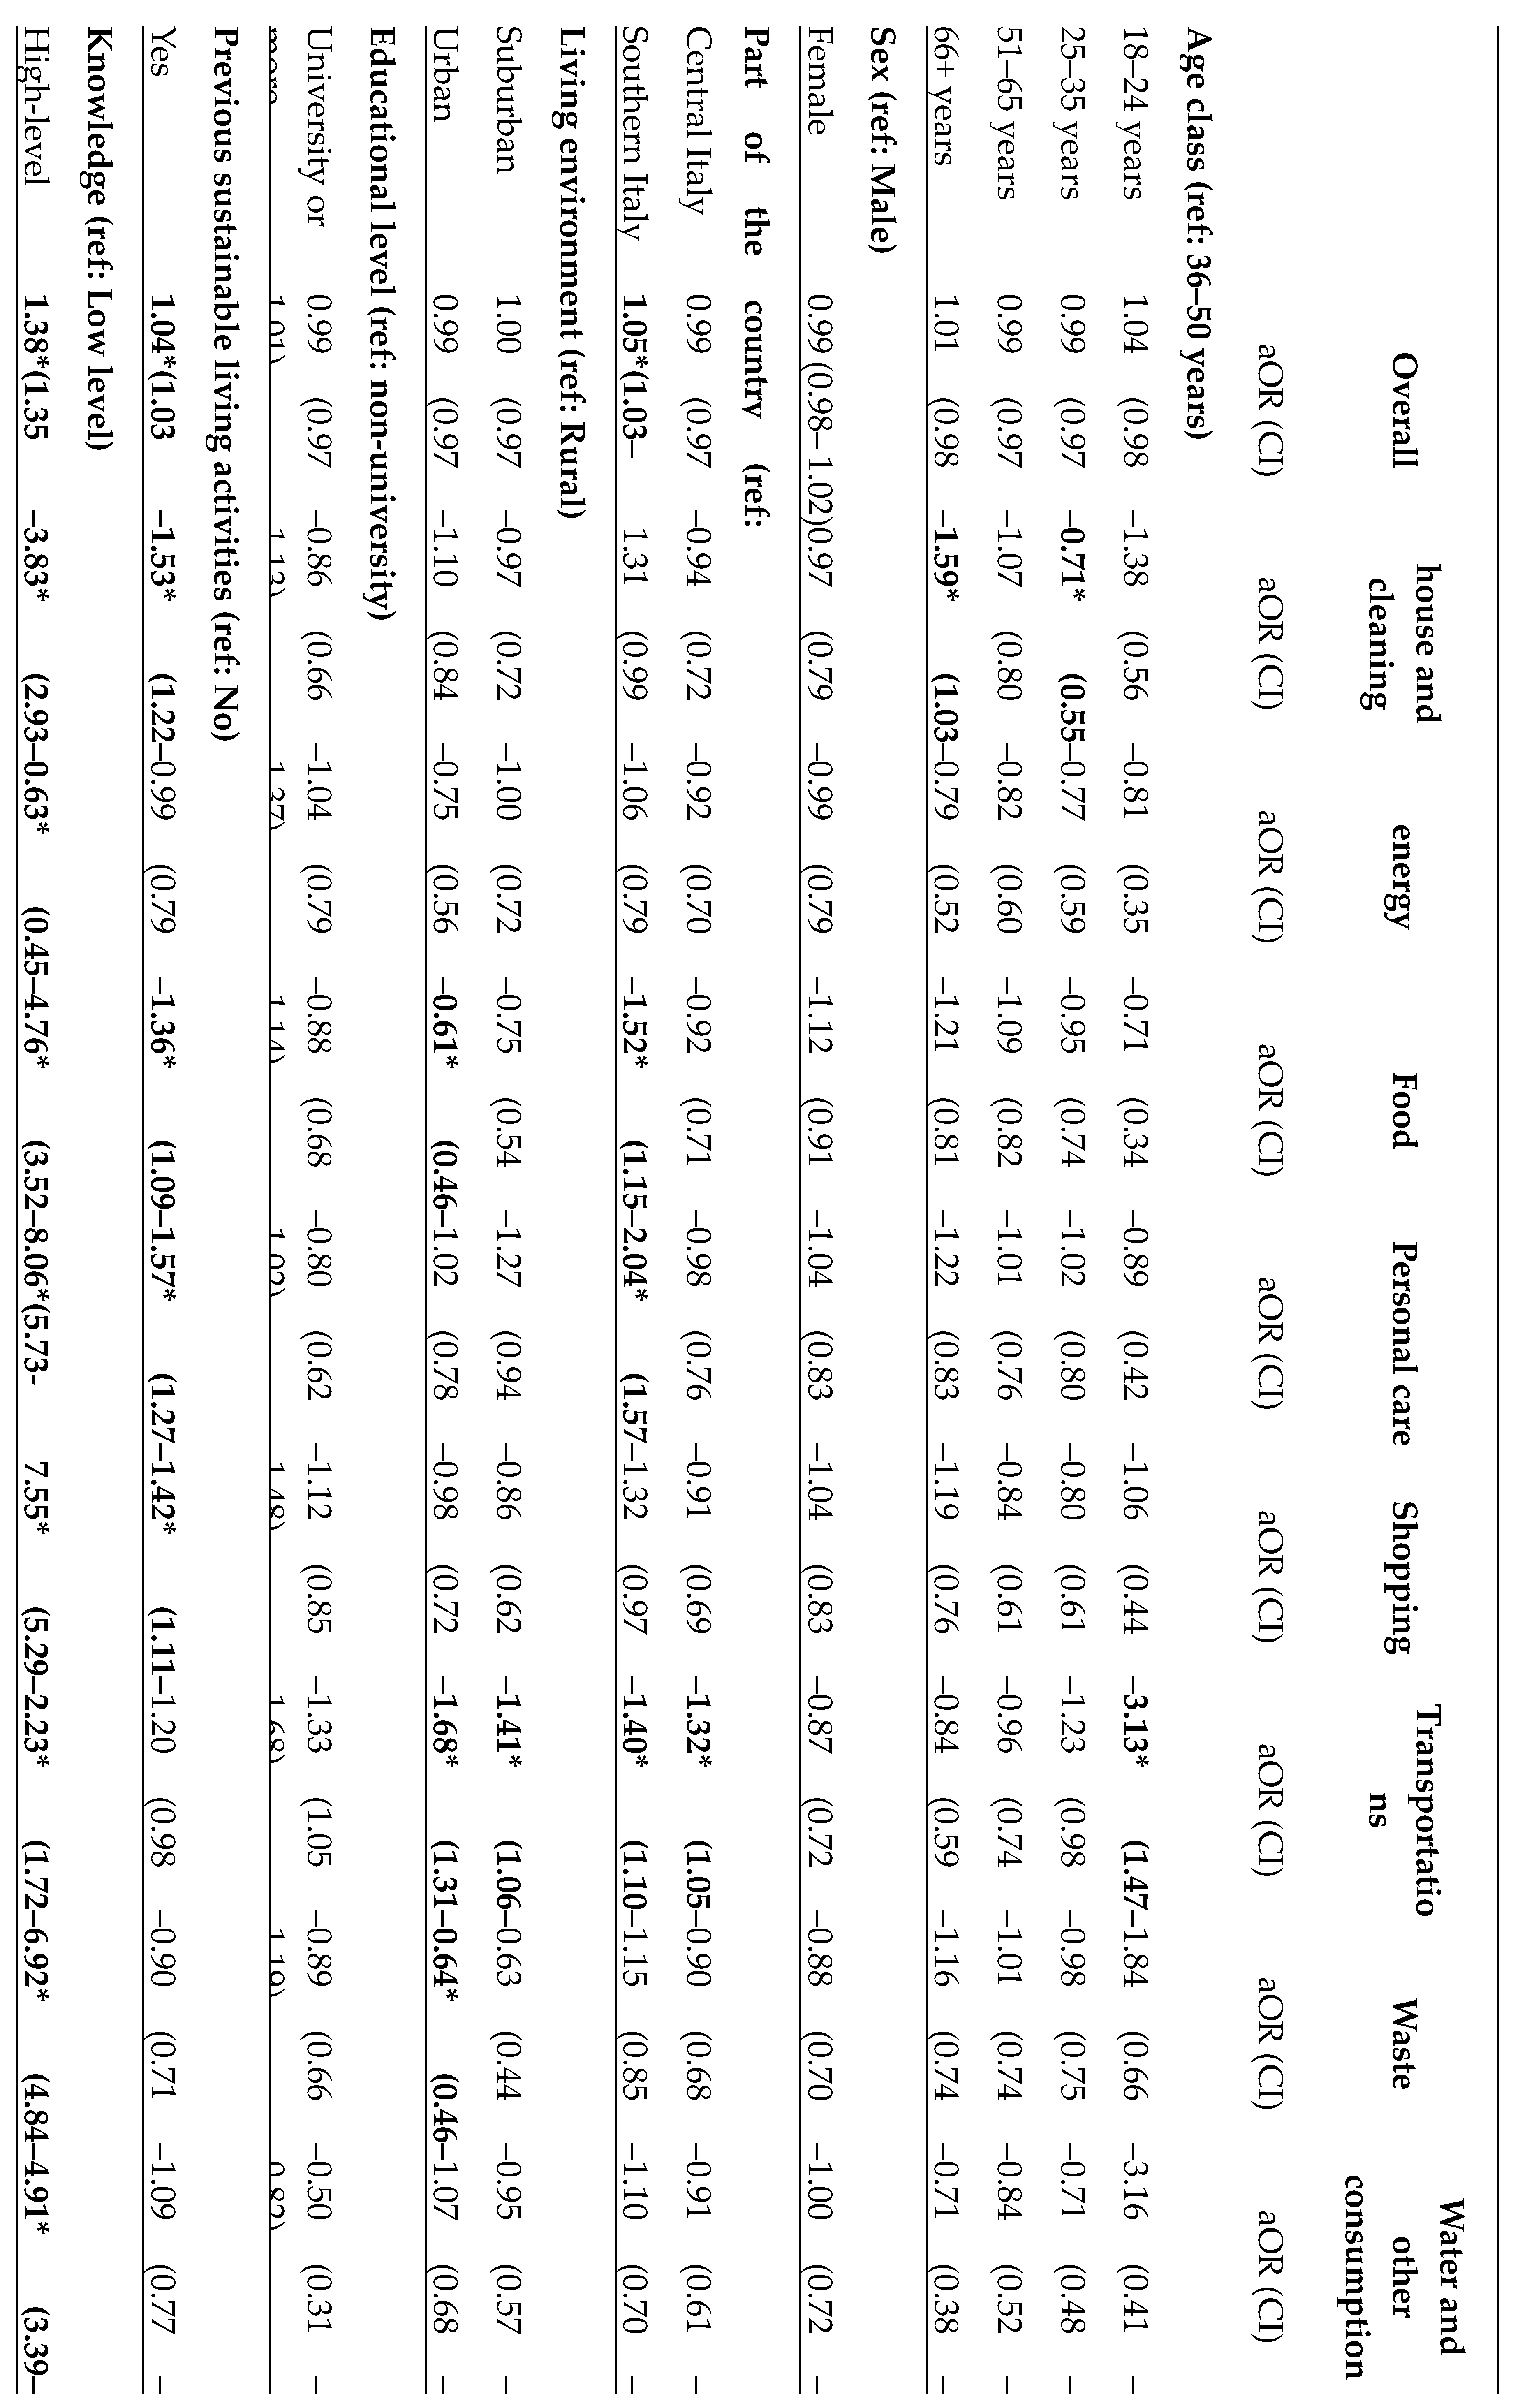
Education and knowledge are essential for fostering sustainable living, that will help protect our planet, promote health and socio-economic development. This study investigated sustainable living knowledge and behaviours among the Italian general population. A 40-item questionnaire was created to assess knowledge, awareness and attitudes in 8 domains: house, energy, food, personal care, shopping, transportation, waste, water and other consumption. The questionnaire was distributed online between January and June 2023. A multiple logistic regression model was performed to assess the relationship between all the variables surveyed. Among the 420 people participated (66% female, median age of 39 years), 76% had a higher-level education degree, and 72% had never participated in a sustainability initiative. Knowledge about sustainability was lower in the domains of shopping (70.6%) and transportation (85.0%). The fewest behaviours acted/products used were found in the domains of personal care (31.3%) and transportation (47.8%). Positive associations were found between the use/adoption of sustainable items and knowledge about sustainability (aOR: 1.38, CI: 1.35–1.41), and previous inherent educational activities (aOR: 1.04, CI: 1.03–1.06). Age, region of residence and urbanization context were factors that discontinuously influenced the implementation of the considered items for transportation and food. Improvements are needed to close the gap between knowledge and action, especially in the domain of personal care. A better understanding of the factors that play a role in non-use of transportation will help to develop measures to promote sustainability and societal wellbeing.

Keywords: 
;  ;  ;  ;  ;  

1. Introduction

The relationship between knowledge, attitude, and behaviour is an integral part of individual and social change [1]. The basic concept is that knowledge is a prerogative of action because it is a tool through which attitudes can be realized, and consequently behaviours can be changed. According to the theory of planned behaviour [2], human behaviour is influenced by three main factors: knowledge and beliefs about the specific outcome, normative and social pressures, and confidence and control in performing that behaviour. In this sense, knowledge and awareness about a specific issue can create a positive attitude towards it and consequently be reflected in daily practice. However, social, cultural and psychological barriers can hinder the translation of knowledge into action, giving education a central role in this process [3].
In this sense, education is not only a tool for the dissemination of knowledge, but also has the potential role of transmitting values and habits that can promote the adoption of the planned practices. More specifically, education is also considered an important building block for achieving sustainable development, so much so that it is itself a Sustainable Development Goal (SDG No. 4 – Quality Education; i.e., Target 4.7 – Education for sustainable development and global citizenship) and an essential tool for achieving all the other goals of the 2030 Agenda. The literature refers to the concept of Education for Sustainable Development (ESD), which is defined as education that provides knowledge and skills and promotes the habits and values necessary to create a more sustainable and equitable society for all [4,5].
Given the central role of education in spreading a culture of sustainability among the population, we as a research team investigated the level of knowledge and awareness of the content of the 2030 Agenda between 2019 and 2021, among first-year university students and teachers in compulsory schools. Overall, several gaps in knowledge regarding the SDGs were identified among both students and teachers, particularly in relation to social and economic aspects, as well as a lack of educational activities related to teaching sustainability and best practices [6,7]. Furthermore, a comprehensive analysis of the current situation of sustainability integration in education at national level revealed that many university students have never participated in a didactic activity or an educational initiative specifically related to the SDGs or sustainable development. Furthermore, knowledge at higher level was predominantly related to environmental topics, such as the greenhouse effect or the ecological footprint, and was mainly acquired through online resources. These results lead to reflections on the need to integrate sustainability into educational programmes and to promote awareness as a human trait, which is the next challenge for the future [8]. Education for sustainable development must not be limited to childhood or the classroom, but should be aimed at the entire population of all ages, through institutions committed to developing tools that enable people to live more sustainably. The term ‘lifelong learning’ indicates that learning takes place throughout life and in a range of situations, potentially impacting on all aspects of society, strongly encouraging citizens to be up-to-date, proactive, and constantly improve their knowledge and skills. Lifelong learning is essential for the dissemination of skills, knowledge, and models for sustainable living, and encompasses a wide range of activities with varying degrees of structure (formal, non-formal or informal) [8].
Another essential element in the implementation of the SDGs is so-called sustainable living: the translation of the principles of sustainable development into everyday practice, including everyday actions, dynamics and attitudes that enable responsible development. In a way, the 2030 Agenda recognises sustainable living as one of its goals (i.e., Goal No. 12 – Ensure sustainable patterns of production and consumption) and affirms the need to equip all people in the world with the information and awareness needed to live sustainably in harmony with nature. This is because the choices people make as consumers have a direct impact on their consumption of resources and are crucial for the future of our planet [9]. For this reason, action is needed to realign the decision-making processes that underpin people's lifestyles and consumption choices [10,11]. The historical moment is favourable for a general lifestyle change, as the effects of climate change are evident and people's concern is increasing [11,12].
In this context, we decided to explore the educational needs of the Italian population regarding a sustainable living and to investigate their behaviours and difficulties in implementing sustainable choices in everyday life in order to raise awareness about sustainability and reach more undecided people. The primary aim of this study was to investigate the level of knowledge of the Italian population regarding the main areas of a sustainable living that influence a person’s environmental footprint. The secondary aim was to investigate the level of awareness and attitudes, compare knowledge about sustainability, and determine how sustainable attitudes are put into practice.

2. Materials and Methods

2.1. The Questionnaire

Based on the literature, and previous experiences of research on knowledge, attitude and practices on sustainability with different target groups, such as the research conducted among first-year students from nine Italian universities on knowledge about sustainable development and some related relevant documents/agreements/models and their learning attitude in 2019, [6], and the investigation of knowledge, attitude and commitment to integrate sustainability in educational activities among Italian teachers in 2021, [7], the research group of the Department of Medicine of the University of Udine (Italy) developed a questionnaire to investigate the awareness, knowledge and attitudes towards sustainable living in the Italian population. In the selection of items and the structure of the questionnaire, the research team was strongly inspired by the concepts and models of the Sustainable Living Guide created by Johns Hopkins University, which helps to lead an environmentally conscious lifestyle in the areas of cleaning, energy, food and diet, personal care, shopping, supplies, transportation, waste diversion, waste reduction and water [13]. The areas covered in the guide were documented and referenced with several technical resources, so the research group culturally adapted and translated the elements for the purposes of the study. Based on this guide, the research group prepared a 40-item questionnaire in Italian consisting of nine sections: 1) house and cleaning (5 items), 2) energy (5 items), 3) food (5 items), 4) personal care products (6 items), 5) shopping (4 items), 6) transportation (5 items), 7) waste (5 items), 8) water and other consumption (5 items), 9) personal information. For each item in sections 1 to 8, there were two multiple-choice questions: to assess knowledge about the importance of using a particular sustainable device or behaviour (e.g., “How much do you think the use of ecological detergents affects sustainability?”), a unipolar 5-point question was designed on a Likert scale (0 – none; 1 – limited; 2 – moderate; 3 – good; 4 – very good) ; the second question explored attitudes towards the same specific device or behaviour by asking whether the respondent performs that specific action. If the answer was negative, the system asked an additional question that explored the reason or difficulty in adopting that behaviour or using that device. The possible answers were: “I have little confidence in the quality”; “Difficult to find or make”; “The cost is too high”; “There are practical complications in using it in daily life”; “I did not know there was such a thing”, or a free text section for “other” answers. At the end of each section (1 to 8), respondents were asked about the sources of information they had used to acquire knowledge about sustainability in that particular area (multiple answers were possible under: “None”; “Family/friends”, “Work colleagues/workplace”, “Television”; “Social network”; “Internet”; “Books and magazines”; a free text section was available for “other” sources).
In the last section, general and biographical data of the respondents were collected, including age, gender, educational attainment (primary, secondary school, high school diploma, non-university higher education degree, university degree, post-graduate qualification), living environment (rural, suburban, or urban), and place of residence, categorized according to the first level of the Nomenclature of Territorial Units for Statistics (NUTS) as follows: Northern Italy (north-western and north-eastern Italy), Central Italy, Southern Italy (southern Italy and islands) [14].
A pilot study was conducted with a convenience sample representative of the Italian general population to assess the comprehensibility and ease of completing the questionnaire, followed by an adaptation of those aspects that were unclear (e.g., terms that needed clarification or definition) to facilitate completion. The full questionnaire, translated into English, can be found in Supplementary Material S1.

2.2. Data Collection

This observational study was conducted between January 6, 2023, and June 15, 2023, using an online survey. The online survey was made available on the EU survey platform, which is free and easy to use and guarantees the anonymity of participants [15]. The time required to complete the survey was estimated at 10 minutes. The target population of the study was the Italian population living in Italy, over 18 years old, and who voluntarily decided to participate. Several strategies were used to reach different the social groups. An invitation to participate in the survey was formally sent by email to all Italian associations registered in the national database of the Italian Association for Social Promotion, updated until March 2022 and managed by the Ministry of Labour and Social Policies [16]. The associations were asked to disseminate the survey among their members. The invitation was accompanied by a description of the reasons for the survey and its objectives. To maximise the response rate, the researchers also disseminated the link to the survey via social media, using the snowball method. Before the end of the survey, reminders were sent out using the same mechanisms. Participation in the survey was completely free of charge. People who voluntarily participated in the study by completing the questionnaire gave their consent to the anonymous use of the data collected. At the end of the questionnaire, respondents received links to websites and resources where they can find more information about the SDGs and sustainable living.
All responses were deleted from the platform at the end of the survey validity period and the data collected was only used in aggregated form. All data was processed in full compliance with European data protection legislation (EU-GDPR No. 2016/679) and Regulation (EU) 2018/1725 on the protection of personal data. Considering the Italian population aged 18 years or older on January 1, 2022 (49 783 836 inhabitants), a confidence level of 95 % and a margin of error of 5 %, and assuming a high perception of sustainability of the items studied in the Italian population with a hypothetical prevalence of 50 %, the minimum sample size required was 384 individuals. The study was approved by the Institutional Review Board of the University of Udine, Italy (reference number 179/2022).

2.3. Data Analysis

Only fully completed questionnaires were included in the analysis. Due to the small sample size compared to the number of parameters included in the questionnaire, some analyses were performed for descriptive statistics only. Each individual item was classified as either a device (D) or a behaviour (B), depending on whether the item under study referred to a sustainable product or behaviour (the classification is given for each item, in Supplementary Material S1). Numerical variables were described as mean and standard deviation (SD) or median and interquartile range (IQR), and categorical variables were described as relative (number fraction, f (%)) and absolute frequency (absolute number, N). For the analysis of use/attitude, only female respondents were included for item 4.5 (washable/reusable or biodegradable/compostable period products), while for item 4.6 (washable nappies for infants), all respondents who answered the question "If you do not use it, for what reason" by stating that they did not have children or grandchildren of the appropriate age were excluded. For the analysis of the sources of information, the answers to the multiple-choice questions that did not allow a clear interpretation (e.g., “None” and “Internet” at the same time) were excluded. The answers to the Likert scale questions relating to knowledge about the impact of using certain sustainable devices/behaviours were dichotomized, with the answers “none” and “limited” being assigned to “low sustainability perception”, and the answers “moderate”, “good” and “very good” being assigned to “high sustainability perception”. The average reasons for non-use/non-implementation of each section were calculated based on the sum of all items in the respective section. Respondents with non-binary gender were not included in the inferential statistics due to the small sample size (N = 2). T-tests and chi-square tests were performed to determine differences between the characteristics of the participants. A multivariable logistic regression model was created to assess the relationship between the variables studied. Given the limited number of variables and the purpose of the study, all variables collected were included in the regression model. Only questionnaires that could be analyzed for all sections were considered for this analysis. For each statistical test applied, a relationship was considered statistically significant if the p-value (p) was < 0.05, with a change expressed as a number fraction, f (%) or adjusted odd ratio (aOR) and the corresponding 95 % confidence interval (CI). The data analyses were performed using the software R, version 4.3.1. [R Core Team (2023). R: A language and environment for statistical computing. R Foundation for Statistical Computing, Vienna, Austria. URL https://www.R-project.org/].

3. Results

3.1. Socio-Demographic Characteristics of the Respondents

A total of 420 questionnaires were collected, and the median age of the respondents was 39. The age distribution of respondents was as follows: 2 % (7) were between 18 and 24 years old, 39 % (162) were between 25 and 35 years old, 25 % (107) were between 36 and 50 years old, 26 % (108) were between 51 and 65 years old, and 9 % (36) were over 65 years old. The 66 % (279) of respondents described themselves as female, 33 % (139) as male, and less than 1% (2) as non-binary. 61% (256) of respondents said they lived in northern Italy, 21 % (87) in central Italy, and 18 % (77) in southern Italy, with a breakdown of living environment as follows: 58 % (242) in urban areas, 24 % (100) in suburban areas and 19 % (78) in rural areas. Overall, 76 % (321) of respondents reported having a higher degree, with 37 % (156) having a university degree and 39 % (165) having a post-graduate degree. The remaining 24 % (99) stated that they had obtained a lower qualification, which was distributed as follows: less than 1 % (2) a elementary school degree, 2 % (10) a secondary school degree, 19 % (81) a high school diploma, 1 % (6) a non-university higher education degree. In terms of previous experience with sustainable living, 28 % (119) had taken part in training or information events on sustainable consumption and production. The distribution of respondents by professional field is as follows: 45 % (190) health, 12 % (52) services – third sector, 8 % (34) public administration, 7 % (31) industry, 6 % (27) teaching, 4 % (15) economy, 4 % (15) commerce, 4 % (15) unemployed – unemployable, 3 % (13) students, 2 % (8) telecommunications – media, 1 % (6) crafts, 1 % (6) law, 1 % (5) agriculture, less than 1 % (2) politics, less than 1 % (1) armed forces. Table 1 shows the socio-demographic characteristics of the survey participants.

3.2. Knowledge About a Sustainable Living /Sustainability Perception

The responses indicating a high perception of sustainability in relation to the items surveyed amounted to 86.8 % (14 581/16 800) and were distributed across the individual sections as follows: 92.9 % (1 951) for waste, 92.4 % (1 941) for personal care, 90.4 % (1 897) for water and other consumption, 89.6 % (1 882) for food, 86.8 % (1 823) for house and cleaning, 86.7 % (1 820) for energy, 85.0 % (1 784) for transportation, and 70.6 % (1 483) for shopping. The number fraction of respondents with a high perception of sustainability for each item is shown in Table 2. For 30 out of 40 items, more than 85 % of respondents indicated that they had a high perception of sustainability, while for the remaining 10 items, this high perception of sustainability was not as pronounced. The least used items were: microplastic-free cosmetics (80.5 %, N = 338), cleaning towels made with natural ingredients (79.8 %, N = 335), reusable or biodegradable baking and food storage paper (79.3 %, N = 333), second-hand clothing (79.3 %, N = 333), bars of soap, shampoo, conditioner, shower gel (70.0 %, N = 294), toothpaste and mouthwash in powder or tablet form (51.7 %, N = 217), multiple plugs (50.2 %, N = 211). The least adopted behaviours were reducing the consumption of meat and dairy products (82.9 %, N = 348), growing their own food and herbs (81.0 %, N = 340) and donating a carbon tax to offset carbon emissions from air travel when buying a flight ticket (50.2 %, N = 211).

3.3. Use/attitude Towards Sustainable Living

Overall, 66.5 % (N = 10 952) of devices or behaviours were reported as adopted, distributed as follows: 91.4 % (1 919) for water and other consumption, 78.7 % (1 653) for waste, 77.3 % (1 624) for energy, 71.5 % (1 502) for house and cleaning, 70.3 % (1 476) for food, 64.8 % (1 089) for shopping, 47.8 % (1 003) for transportation, and 31.3 % (686) for personal care. Table 2 shows the number fraction of respondents who used or adopted each item. Overall, only 16 of 40 items were adopted by more than 85 % of respondents, while 10 items had between 50 % and 85 % of respondents engaging in sustainable behaviours or using sustainable devices, and 14 items were used or adopted by less than 50 % of respondents. All personal care items were used or adopted by less than 50 % of respondents, in particular: powder/tablets for toothpaste and mouthwash (11.7 %, N = 49) and washable nappies for infants (15.5 %, N = 36). Transportation was the second domain where the fewest items were used or adopted. Four out of five items were used by less than 50% of respondents, with car sharing/car pooling being the least used (21.2 %, N = 89). In the other sections, photovoltaic panels (17.1 %, N = 72), growing your own food and herbs (27.4 %, N = 115), second - hand clothing (40.7 %, N = 171), buying/selling reconditioned electronic devices (46.0 %, N = 193), cleaning towels made with natural ingredients (51.0 %, N = 214), and using mixers to regulate water flow (85.7 %, N = 360) were the least used.
The items with the greatest discrepancy between knowledge (good knowledge; ≥ 85 %) and use (little use; < 50 %) were photovoltaic panels, biodegradable cotton balls, cotton swabs, toothbrushes, razors, reusable or biodegradable period products, washable nappies for infants, public transportation, telecommuting and telemeeting platforms to reduce trips, carsharing/carpooling, purchase/sale of reconditioned electronic equipment. The only item with low-level knowledge (50.2 %) but high usage (89.3 %) was multi-plug adapters. The relationship between knowledge and use/adoption of each item is illustrated by trend lines in Figure 1.
Figure 1. Perception of the impact of products and behaviours on sustainability and corresponding usage and actions.
Preprints 138999 g001
Figure 1.2. Items stratified by type: products and behaviours.
Preprints 138999 g002

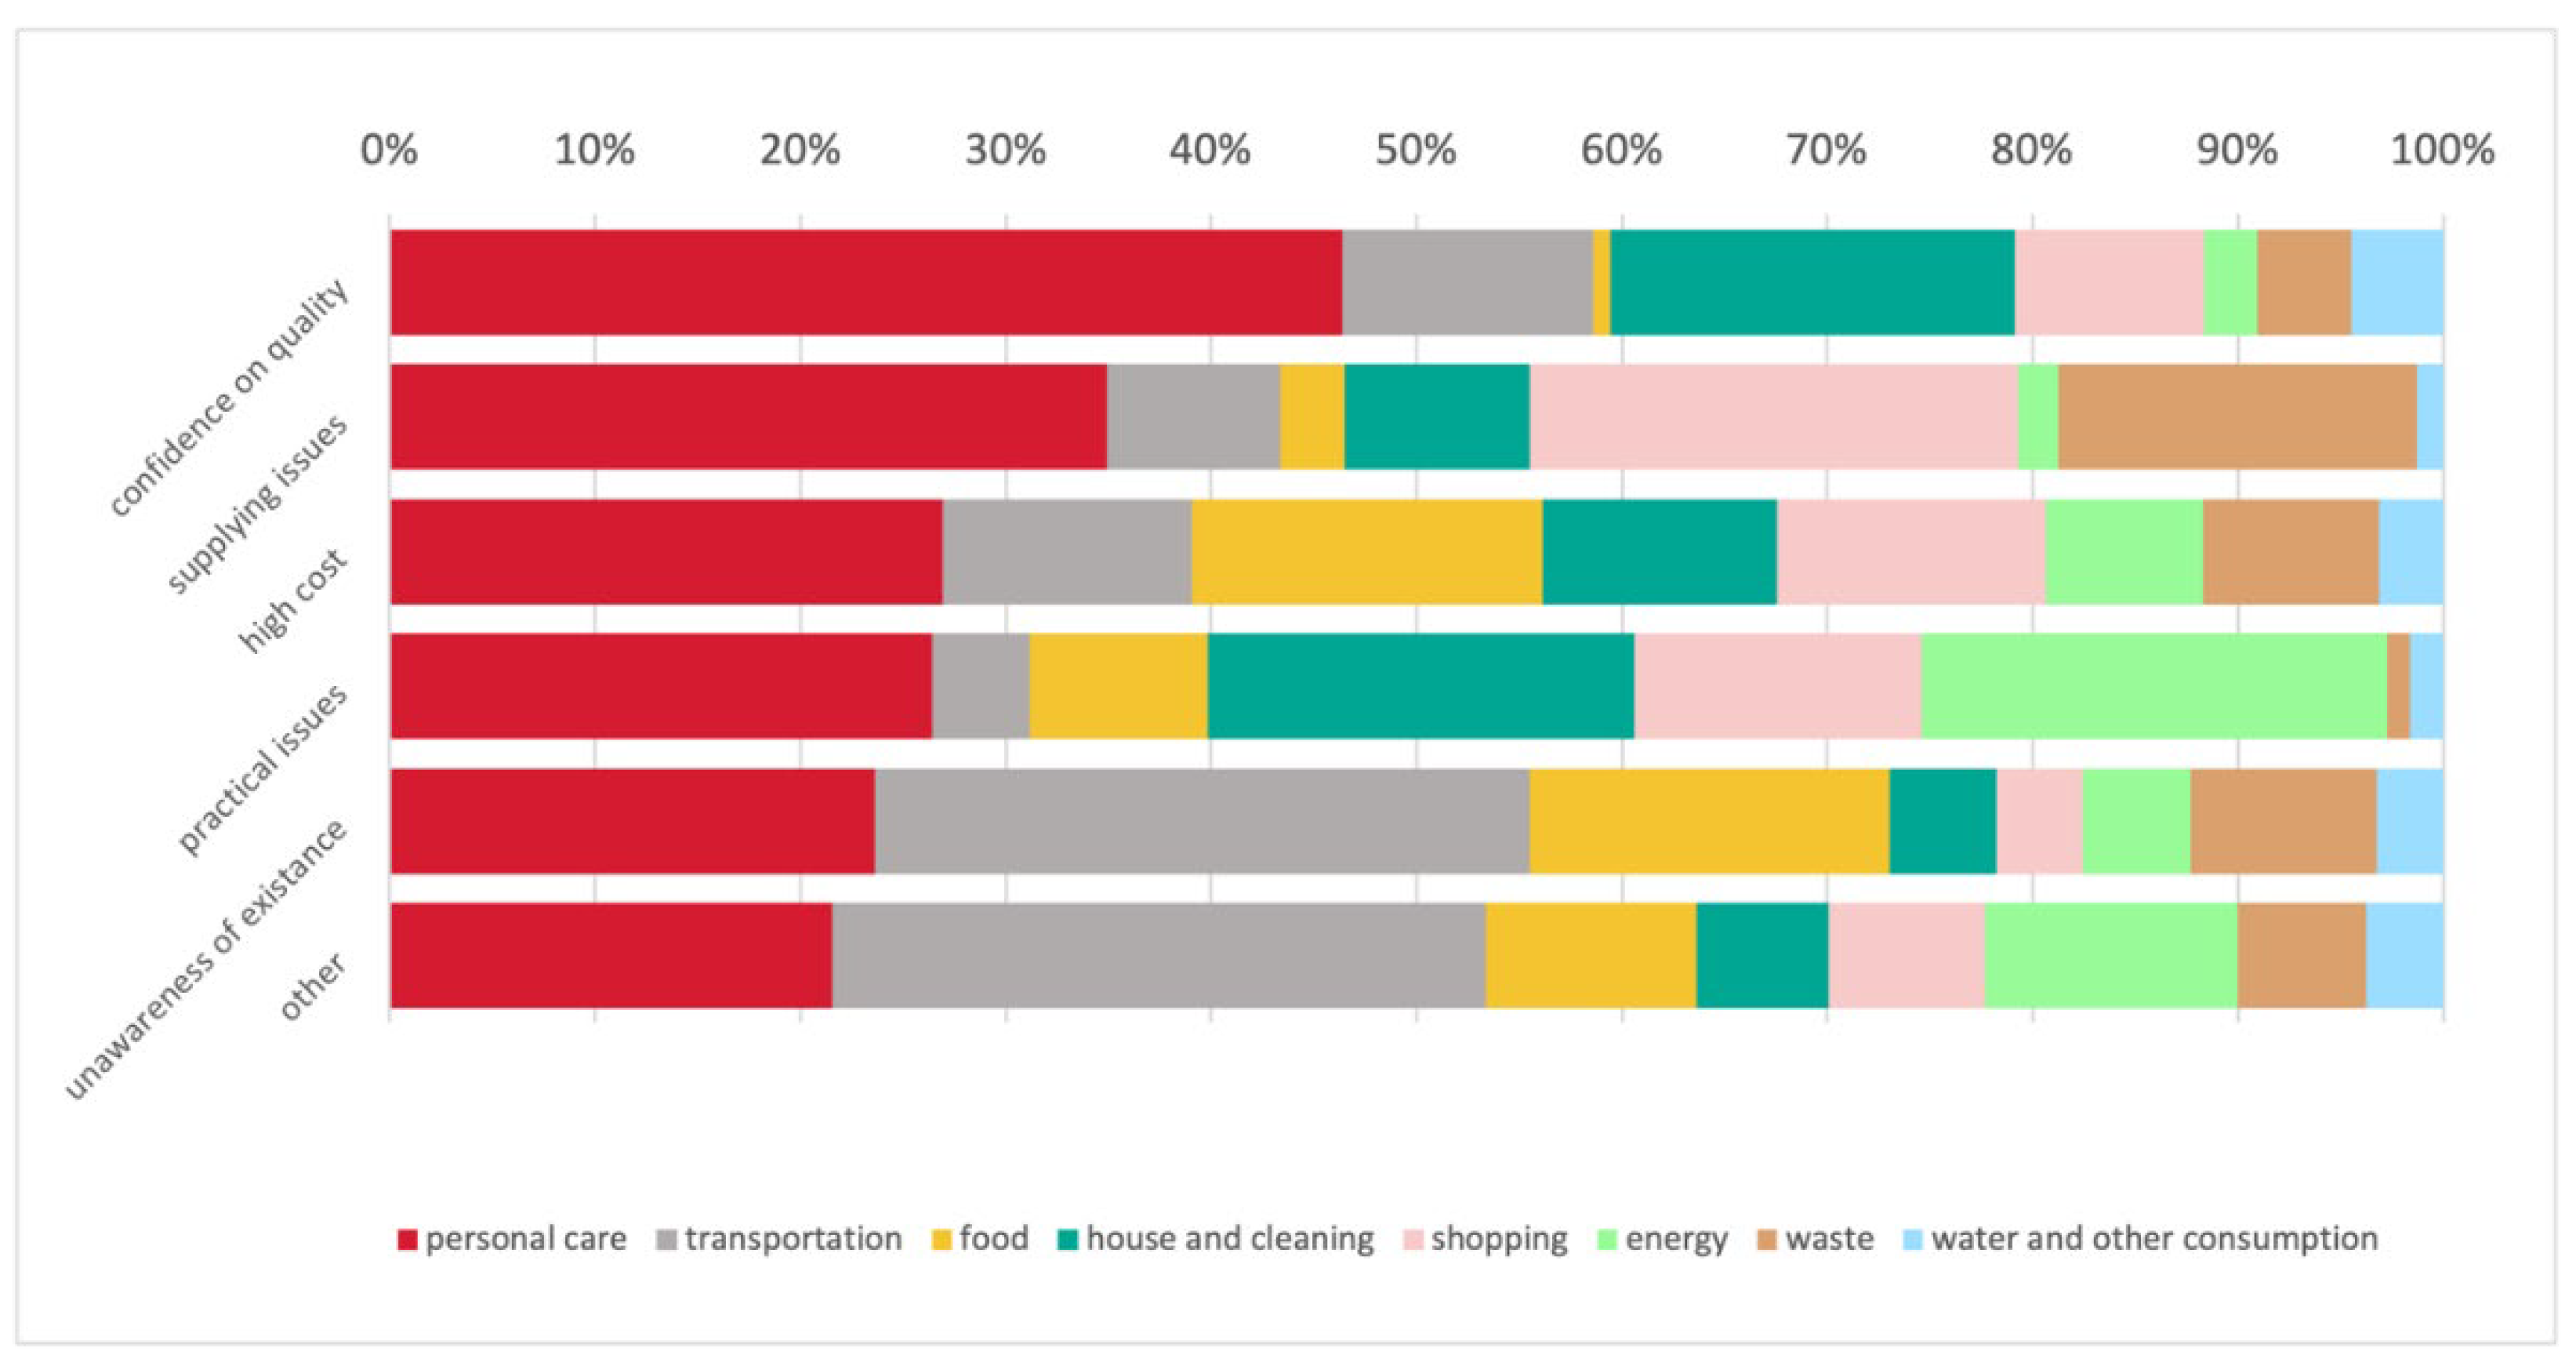
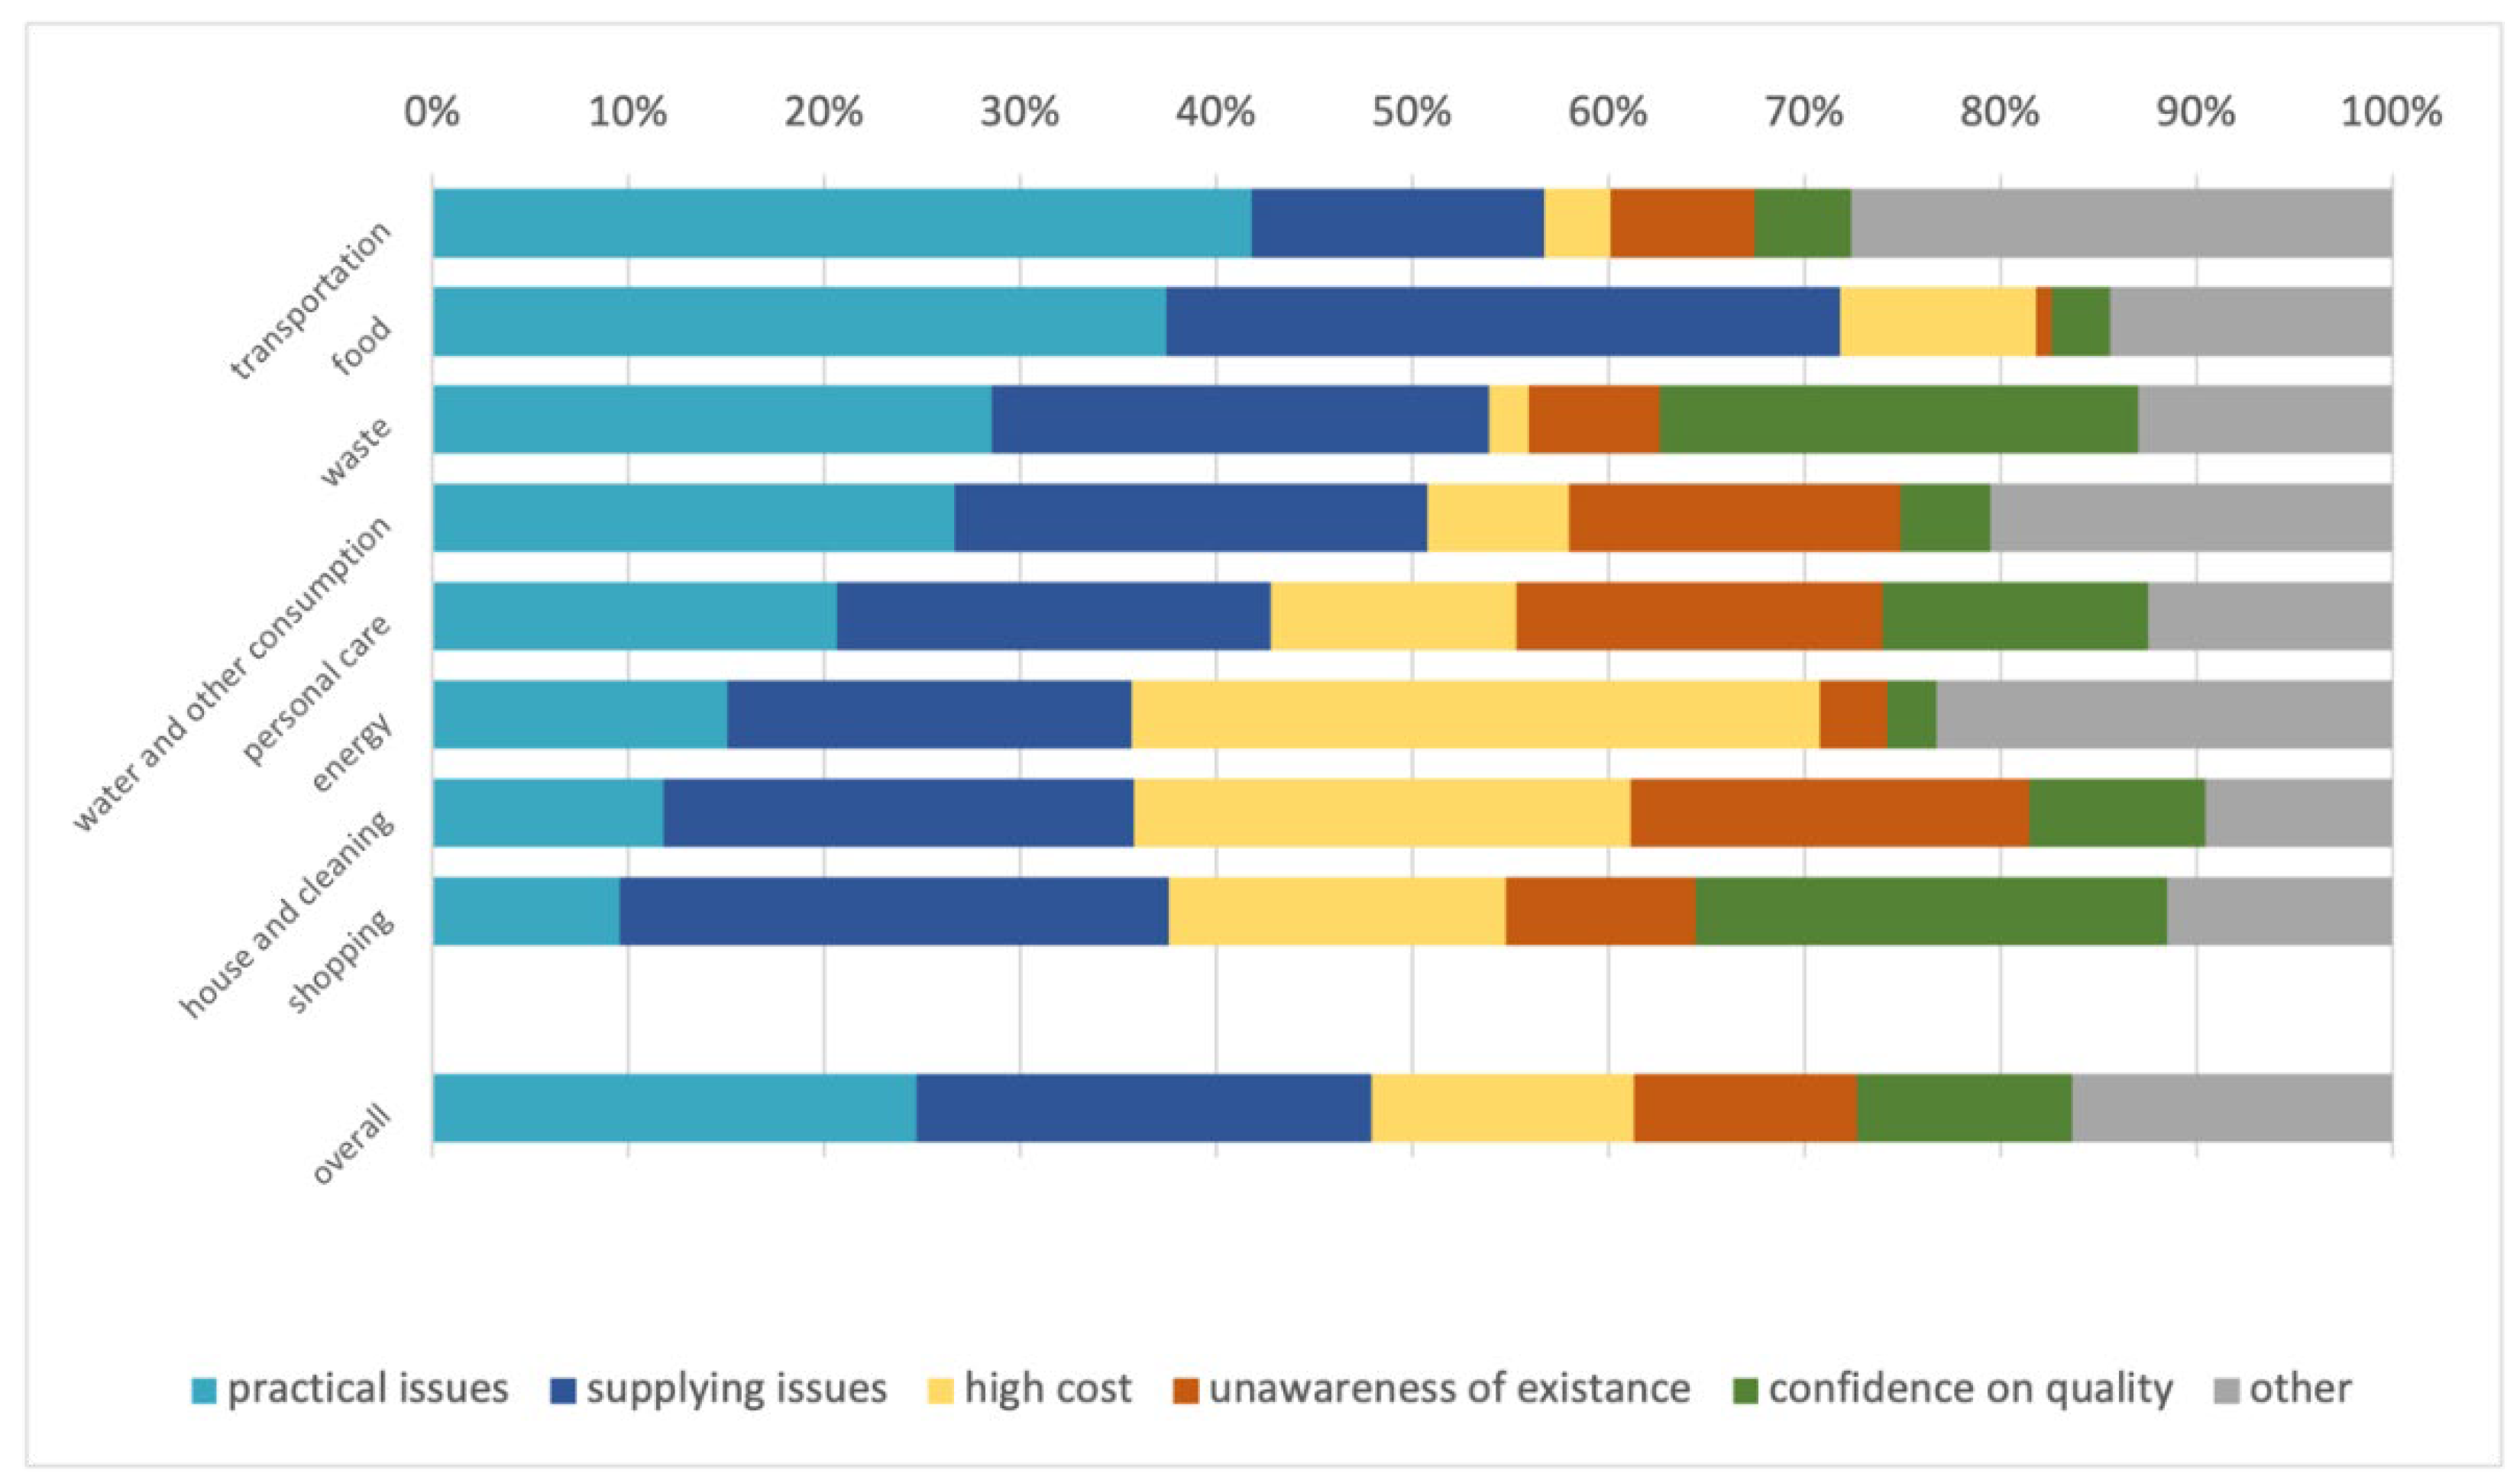
3.4. Reasons for Non-Use or Non-Adoption

Overall, the main reasons for not using or not adopting the items/behaviours studied were practical complications in daily use (24.7 %), the difficulty of finding or making them (23.3 %), and their cost (13.4 %), as shown in Figure 2. The main reason for not using sustainable items was practical complications with transportation (41.8 %), food (37.4 %), waste (28.5 %) and water and other consumption (26.7 %). For shopping (28.0 %) and personal care (22.1 %), the main reason for not using sustainable items was the difficulty of finding or producing them. In the domains of energy (35.1 %) and house and cleanings (25.3 %), the main reason for not using sustainable items was that the costs were too high. For toothpaste and mouthwash in powder or tablet form and microplastic-free cosmetics, ignorance of their existence was the main reason for not using them, as was for not offsetting carbon emissions from air travel through a donated carbon tax. For reusable or compostable period products and washable nappies, the main reason for non -use was that there are practical complications with daily use. Low confidence in second-hand clothing and reconditioned electronic devices was the main reason for non-purchase.
Figure 2. Reasons for not using/adopting sustainable items.
Preprints 138999 g003
Figure 2.1. Domains impact on each single reason for not using/adopting sustainable items/behaviours.
Preprints 138999 g004

3.5. Sources of Information for a Sustainable Living

Overall, the most frequently used sources of information for sustainable items/behaviours were the Internet (27.8 %, N = 2 189), family or friends (18.0 %, N = 1 419), books and magazines (15.2 %, N = 1 199), and social networks (14.3 %, N = 1 126). Only 1.4 % (112) mentioned other sources, and 2.7 % (212) none of these. There were no differences in the distribution of information sources between the sections.

3.6. Relationship Between Attitudes Towards Sustainable Devices, Behaviours, and Participant Characteristics

The logistic model identified the full list of differences in the likelihood of using or adopting a sustainable product/behaviour compared to the reference class (Table 3).
In general, respondents with a higher-level of knowledge were more likely to use or adopt a sustainable product/behaviour (aOR 1.38, CI 1.35 – 1.41, p < 0.001). This correlation was also confirmed specifically for all domains, with the exception of energy, for which a higher level of knowledge was a negative factor. Participation in special training or information events on sustainable consumption and production was also a protective factor for sustainability (aOR 1.04, CI 1.03 – 1.06, p < 0.001), and this was also confirmed specifically for the domains of house and cleaning, food, personal care and shopping. In addition, having a university education or a post-graduate degree were found to be a protective factor for transportation. Living in Southern Italy was a protective factor for using or adopting a sustainable product/behaviour (aOR 1.05, CI 1.03 – 1.07, p < 0.001), and this result was also confirmed specifically for food, personal care, and transportation. For transportation, living in central Italy also proved to be a protective factor. Living in suburban and urban areas was a protective factor for sustainability in the transportation domain, but a risk factor for the waste domain. Moreover, living in an urban area was a risk factor for food. Depending on age, respondents in the 25–35 age group were less likely to use or adopt a sustainable product/behaviour in the house and cleaning domain, while respondents in the 66+ age group were more sustainable in this domain. Finally, respondents in the 18–25 age group were more likely to adopt sustainable behaviours/products in the domain of transportation.

4. Discussion

This study investigated the level of knowledge and educational needs of the Italian population in relation to sustainable living, as well as the behaviours and difficulties people encounter in implementing sustainable choices in their daily lives. In general, it seemed easier to use a new product than change attitudes or adopt new behaviours, but differences were found depending on the domain and characteristics of the respondents (i.e. age, North/Central/South Italy, living environment, level of knowledge).

4.1. Barriers to the Use of Products or Adoption of Sustainable Behaviours

As shown in Figure 2, the most frequently cited barriers to using or adopting sustainable items/behaviours were practical complications and difficulties in sourcing or producing them, while cost and low trust also played a role, but generally less than expected. In fact, GlobeScan conducts an annual research programme called “Healthy & Sustainable Living”, and found back in 2019 [17] that nearly half of consumers are open to adopting a healthier and more sustainable lifestyle but are not yet sufficiently motivated, with cost (too expensive), leadership (not enough government support) and information (not enough business support) cited as key barriers. Similar results were found in more recent editions of the same programme, adding increasing concern about the cost of living crisis, concern about climate change among children under 18, and the need to make sustainable living seem inevitable [18]. On the one hand, a major problem is that many sustainable products are still hard to find in wholesale, which often requires a certain mindset and digital literacy to buy them online. Some examples of hard-to-find products are cleaning towels made from natural ingredients that do not need to be replaced often because they last a long time (around six months), toothpaste and mouthwash in powder or tablet form, or reusable or biodegradable baking and food storage paper. The latter two products may have only been used to a small extent in this study as they were grouped together in the same question and it is possible that respondents were only aware of one and not the other. On the other hand, practical complications can be the sum of individual elements that are difficult to overcome together. Even if an employee lives close to their workplace and is willing and able to cycle, it may be that the workplace does not have sufficient cycle parking or a high level of security, which indirectly encourages driving to work, or that there are road safety issues on the way to work. Other examples of this issue include growing your own vegetable garden, which is not always possible, due to lack of space, especially in cities, or using bars of soap, shampoo, conditioner and shower gel, which are often unfamiliar products that you have never tried before or can cause difficulties in certain situations, such as carrying a bar of soap with you when backpacking. To achieve a more sustainable outcome, sustainable management of all different types of commuting (e.g. to school, to public offices and services, to health services, to work) should become a priority for both investors and policy makers, and all current barriers should be carefully considered to improve the use of alternative solutions to the personal car. Another observation concerns multi-plug adapters, which received a low sustainability score despite their widespread use. This could be due to the fact that questionnaire did not specify whether the plug contains a power switch, which is the only feature that makes the plug sustainable, as it allows many devices to be switched off at the same time and prevents them from remaining in standby mode for long periods of time.

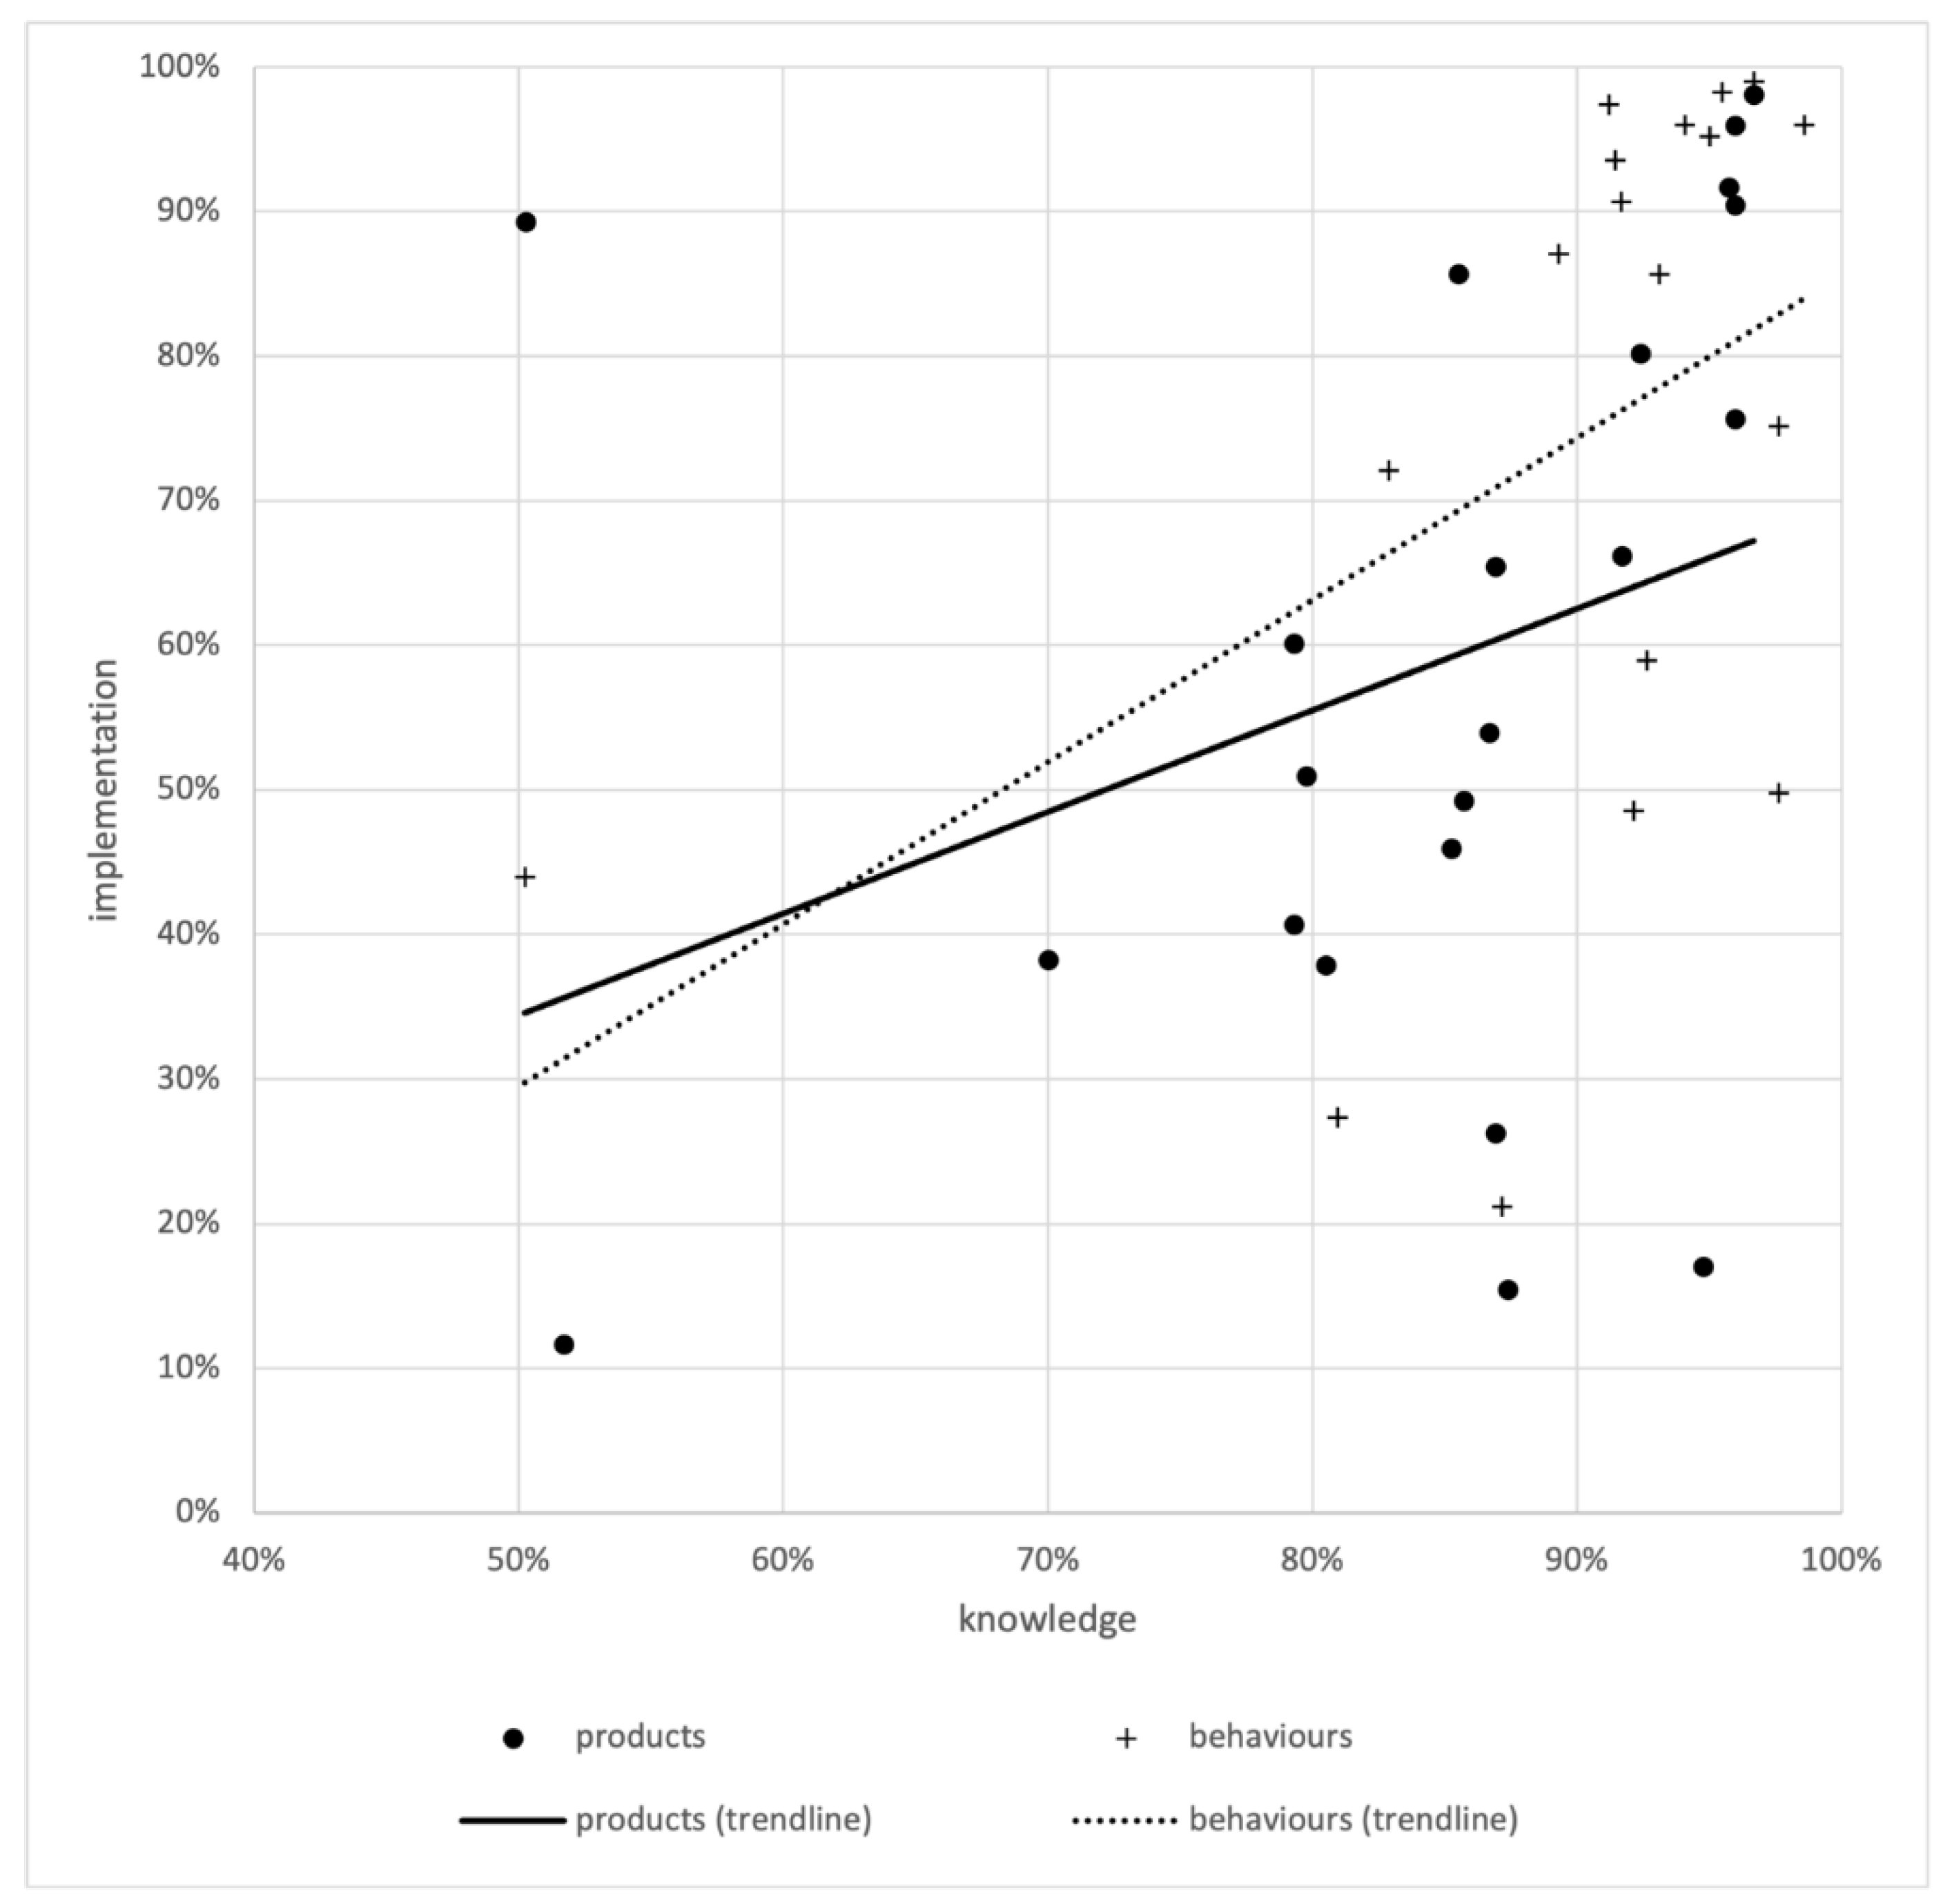
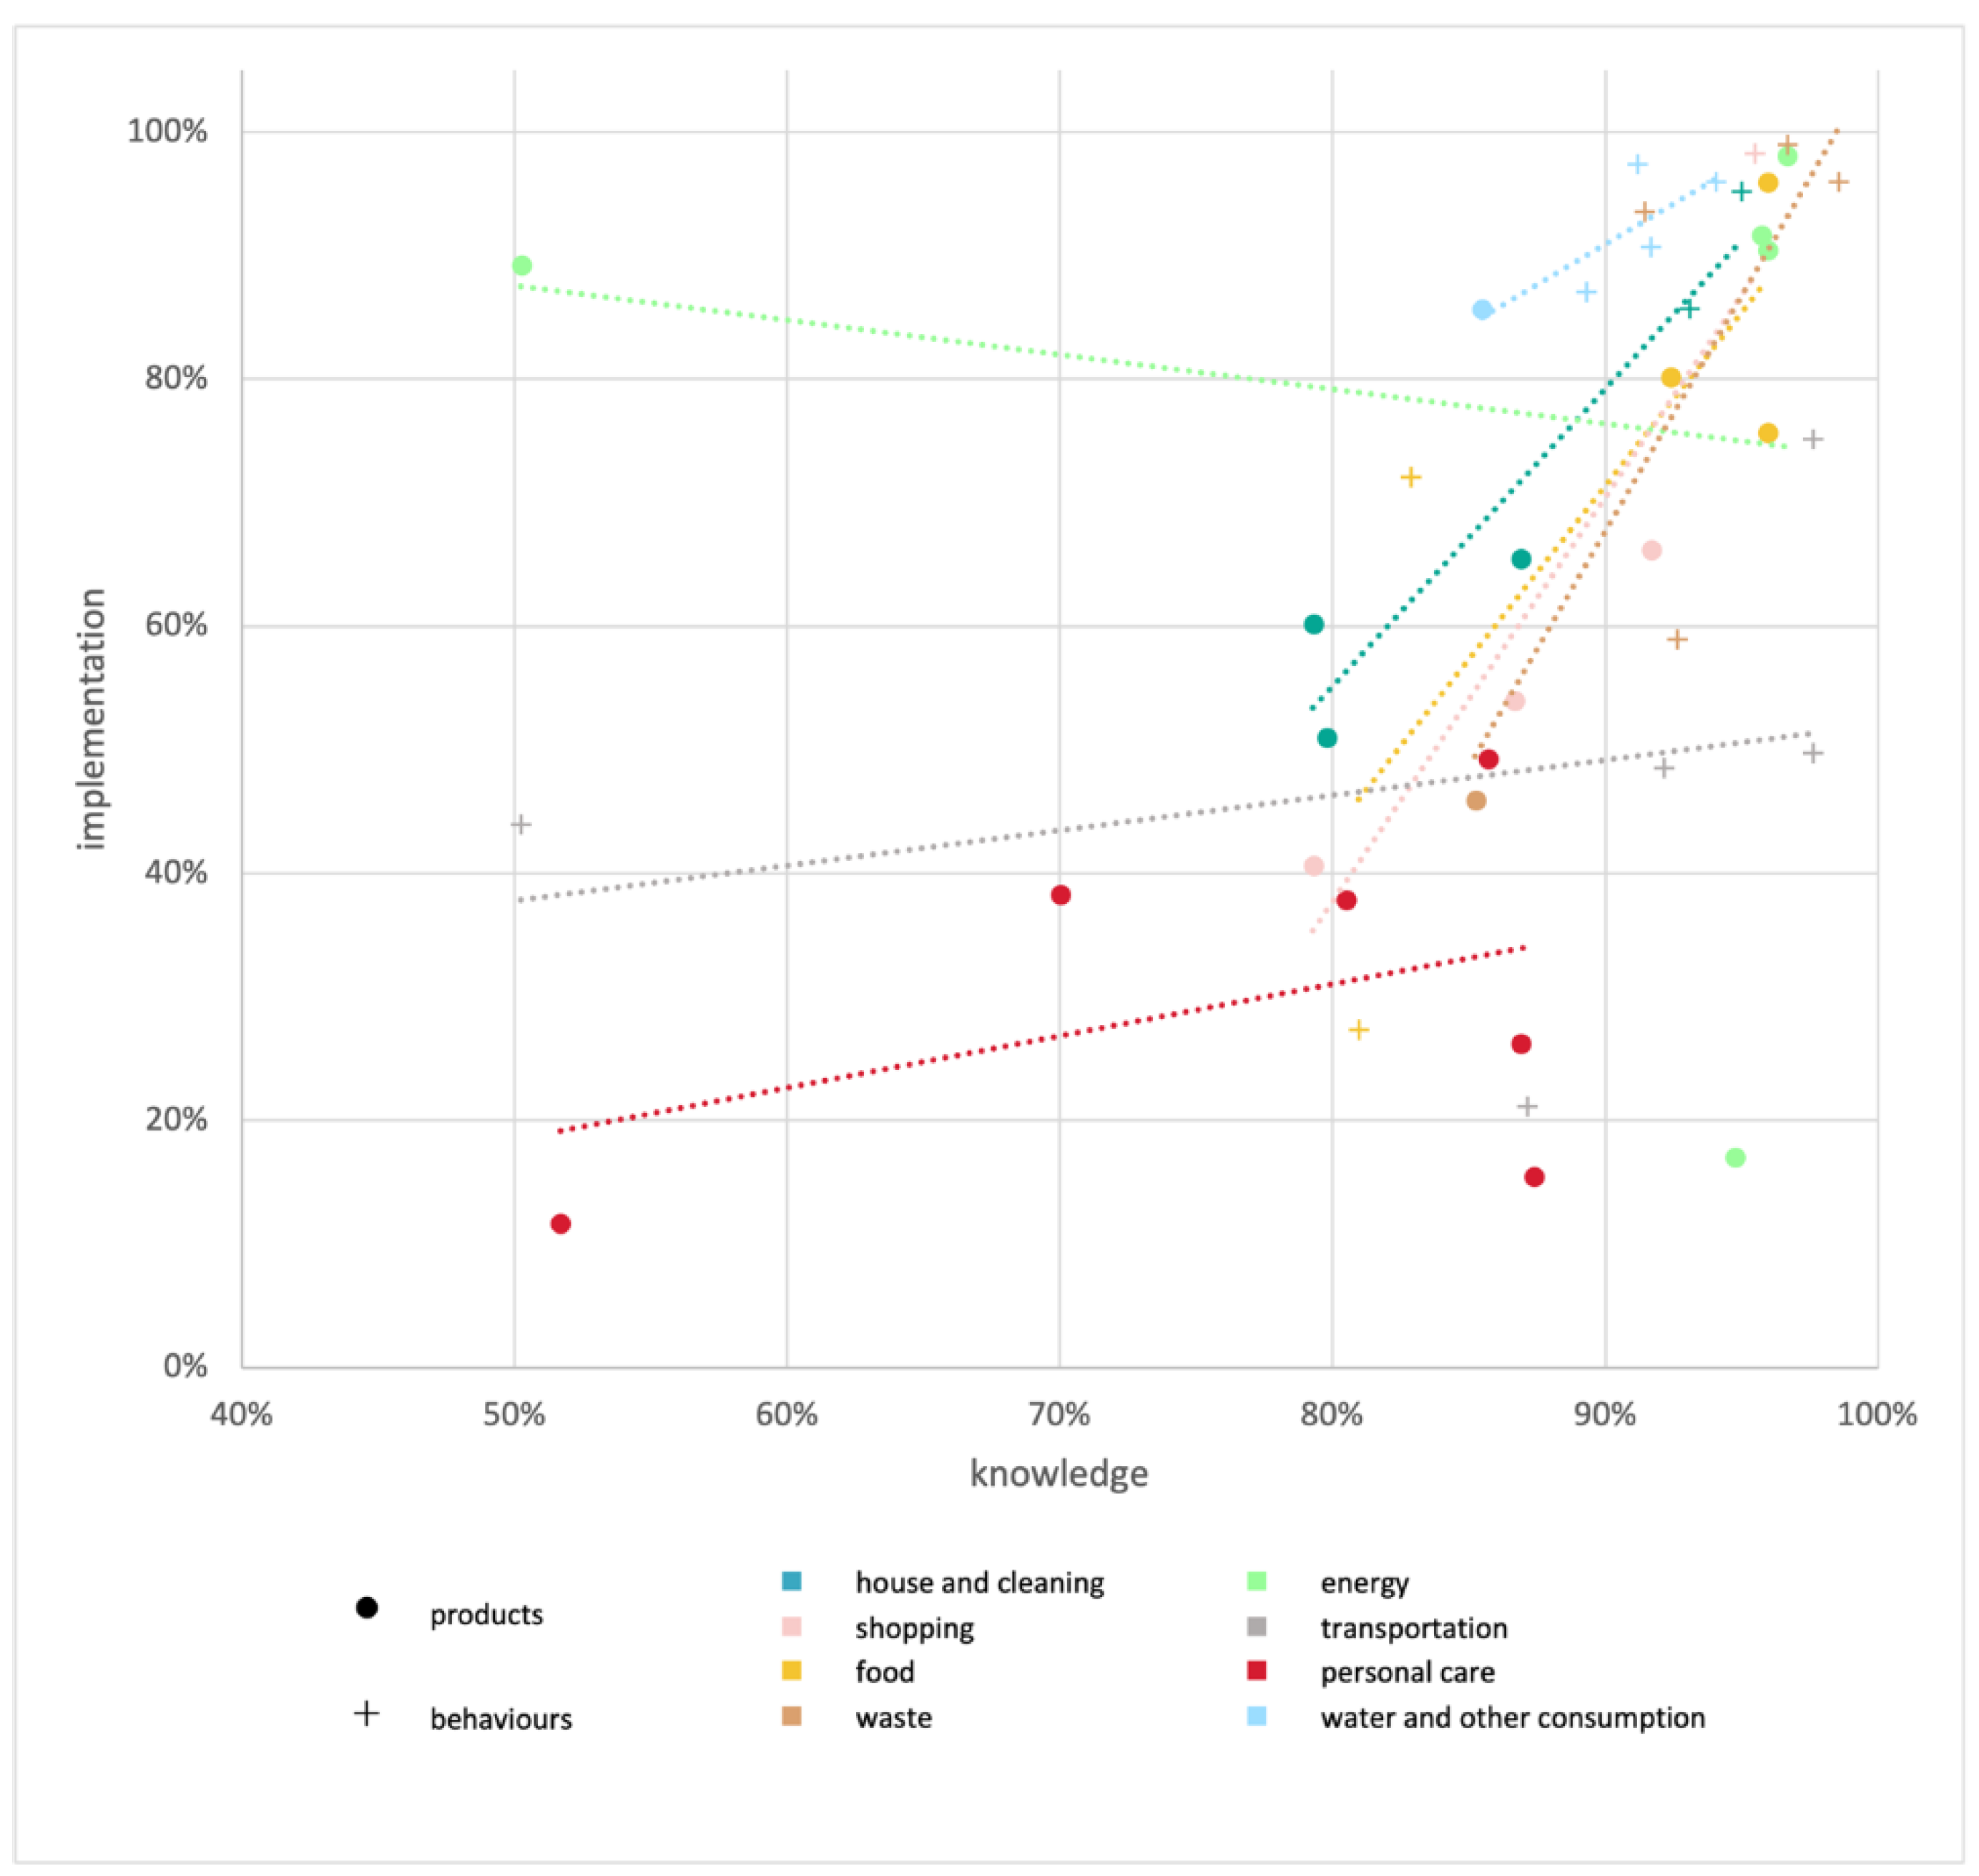
4.2. Gaps Between Knowledge and Use

When comparing the categories of respondents in terms of their use or adoption of sustainable products/behaviors, some interesting aspects emerge from the analysis (Table 3). For example, there is a large discrepancy in the likelihood of using or adopting sustainable transportation solutions when comparing the 18–24 age group (aOR 3.13) with the 66 + age group (aOR 0.84), suggesting that young adults are much more positive about these solutions than their parents or grandparents. This could be due to the fact that older people are more influenced by the perception of car ownership as a social status norm, that they are used to going everywhere by car and may therefore be reluctant to change their habit. In terms of living environment, people living in both urban (aOR 1.68) and suburban areas (aOR 1.41) appear to prefer sustainable modes of transport, suggesting that in these areas the wider adoption of cycle lanes, pedestrian areas and effective bus/tram/train services may have a greater impact on improving sustainable behaviour than in other residential areas. Finally, with regard to the carbon tax, this option is not often promoted by airlines and the proportion of Italian citizens taking one air trip per year is much lower than for other daily activities.
Looking at the items with the greatest discrepancy between knowledge and use, such as photovoltaic installations, sustainable products, or public transportation, it is evident that there is probably more room for improvement on these items to close the gap between perception and implementation, as the latter is more complicated for various reasons. For example, the installation of photovoltaic systems could be made easier if they were managed by whole dwellings or energy communities rather than individuals or families, as reported by the European Commission’s Rural Energy Community Advisory Hub (RECAH) [19]. However, even though government subsidies are currently available, this solution is still quite expensive. Low trust proved to be one of the main barriers only for some items where this type of doubt is more likely, such as second-hand clothing and reconditioned electronic devices. The reason for this is that the customer expects hygiene standards when buying second-hand clothing or renting for certain occasions, which cannot always be guaranteed by second-hand stores. Other limiting factors may include not knowing the previous owner personally when shopping in physical stores, or in online stores where the seller's profile is available, but the buyer can only see the product in photos. The use of second-hand clothing could be encouraged by exchanging garments between people who know each other as family or friends, which has been common practice for a long time. In terms of buying/selling reconditioned electronic devices, our data may be overestimated as respondents only reported small devices. While there are stores that sell reconditioned cell phones or small appliances, there are currently few stores in Italy that sell reconditioned large electronic devices, which could pose a particular difficulty. Another interesting trend that should be considered for improving the sustainability of large electronic device, is the possibility of renting these devices, which is mentioned as a good practice in the European Circular Economy Stakeholder Platform [20] and in line with the European Commission’s communications to various European institutions [21].
When discussing and interpreting these results, it should be noted that they may reflect a part of the Italian scenario that is objectively different from that of other European countries. Indeed, Italy is mainly made up of small to medium-sized municipalities, as 70 % of Italian municipalities have less than 5000 inhabitants, where 16 % of the population lives, and 25 % have between 5 000 and 20 000 inhabitants, where 35 % of the population lives [22] (data from January 1, 2023). This type of population dispersion can lead to complications, as local decisions to invest in sustainable solutions largely depend on these individual municipalities. In terms of policy recommendations related to work, following the declaration of the end of the COVID-19 pandemic May 2023, remote work opportunities and benefits were gradually reduced, indicating a general orientation towards a return to in-person work rather than the continuation of remote work solutions, which are currently regulated by 26 national collective agreements and 177 company agreements [23]. With regards to sustainable homes and building technology, another problem could be the aging of the Italian real estate stock, which leads to low energy efficiency in existing buildings. It is estimated that more than 50 % of the Italian building stock is older than 45 years, 60 % has a low energy rating (G or F) [24,25], and more than 50 % is in need of renovation as it was built before Law 373/1976, which was the first mandatory national regulation on building characteristics for energy saving [26]. Another persistent problem that is difficult to solve at the national level could be the generally low level of literacy of the population [27], which can affect the understanding of the impact of human activities and the practice of sustainable lifestyles, especially with regard to the power of each individual consumer who influences markets and production with every purchase decision, as well as the role of citizens in promoting sustainability through lifestyle, habits and consumption choices. Without this foundation, it will be difficult to influence markets through bottom-up actions and to create a social environment that favours actions to protect our planet. It is therefore important to quantify educational requirements alongside economic and political ones. But, the marketing industry has also gradually become aware of this need and its own role in shifting consumers towards sustainable behaviour. In a 2019 article, White et al. [28] describe a number of psychological factors that are essential for marketing in targeting more sustainable consumption, including social influence, habit formation, individual self, emotion and cognition, and tangibility, addressing what they refer to as the ‘attitude – behaviours gap’. An example of this is the use of mixers to regulate water flow: nowadays, the market itself drives the purchase of mixers, which in this sense can be seen as a facilitating rather than a nudging intervention, as the possibility of finding separate taps is more difficult, forcing the consumer to make an extra effort and choose the less sustainable option. Among other observations, the colleagues emphasise the potential of the sharing economy, which replaces previous models that focused on product ownership with a more sustainable mindset where consumers access existing products and services: marketing and ‘collaborative consumption’ have a role to play in changing the nature of consumption and lifestyle choices in terms of housing, possessions and experiences to avoid the current situation where many resources that are owned remain unused or underutilised, leading to more costs and more waste, as already shown by other authors [29]. Furthermore, sustainability perceptions and skills should be seen as a resource and a long-term goal for stronger, sounder societies and businesses. Recent findings from other European countries show that even in Mediterranean countries there is still a long way to go, example.g. in Greece where < 30 % of consumers were classified as sustainability aware, 57.6 % are in a transition phase and 13 % are not yet aware. However, 80.5 % of respondents stated that they are willing to change towards sustainability and 49.1 % would be willing to replace their habits with more sustainable ones if there was an award for it [30].

4.3. Our Results in a Broader Scenario

To broaden views on sustainable living, the Autonomous Region of Friuli Venezia Giulia, Italy, conducted a public consultation in 2020 using online questionnaires to assess the level of knowledge and awareness of the population of the content of the 2030 Agenda and to develop a sustainable development strategy that responds to the citizens’ interests and needs [31,32]. The opinions and views of citizens, local governments, social service providers and regional businesses were examined in several areas: environment, regional economy, climate change, waste, health, education, services, sustainable and safe cities, fair, inclusive, and equal society. Citizens was found to prioritize environmental sustainability issues over economic aspects, which was confirmed both at our regional level and in a systematic review [8,33]. The topics suggested by the participants to be included in the conversation on sustainability were more sustainable production and consumption policies, better protection of the regional territory and the environment in general [31,32], topics related to the areas of prosperity and planet of the 2030 Agenda. Moreover, several international surveys seem to confirm that people's awareness is increasing. For example, a survey of students at Mendel University in Brno (Czech Republic) found that almost all respondents (90.6 %) were aware of the urgency of taking action against climate change and planned to change their lifestyles in this direction [34]. Another questionnaire presented to a sample of 500 university graduates in Greece to investigate the extent to which they pay attention to sustainability in their daily purchases and consumption behaviour also confirmed a positive attitude of the majority (87 %) of respondents towards these issues [30]. The fourth edition of the European Investment Bank's climate survey shows that 66 % of Europeans surveyed believe that climate change will remain a serious problem for many years to come. Nevertheless, most Europeans are confident that the climate policy measures to be implemented will improve their quality of life and create more jobs than they destroy [35]. Sustainability has also become popular in Italy, as shown by data from the seventh edition of LifeGate's National Sustainable Lifestyle Observatory in 2021. In fact, 75 % of Italians stated that they feel engaged on these issues and 90 % showed a proactive attitude towards plastic consumption and the use of sustainable packaging [12]. The 2020 report by the Italian Centre for Lifelong Learning on the 'From zero to hero' programme funded by the European Union and Erasmus+ showed that young Italians' knowledge of climate change and environmental issues, especially renewable energy sources, is insufficient. They reported that 18 % of respondents said they felt insecure about environmental sustainability and admitted that they needed more information [36]. According to the United Nations, people change their behaviour according to their needs and desires. Thus, to change lifestyles, it is not enough to show data, statistics and negative future forecasts – which remain an important basis – but sustainable options must be made more attractive in terms of accessibility, price and trend [10]. In line with this vision, which sees consumers as the main drivers of sustainability [11], Globe Scan's Healthy&Sustainable programme has been conducting annual global surveys since 2019 to explore consumer attitudes and preferences towards sustainability and wellness, with the aim of supporting major brands’ offerings to meet consumer demand, including a sustainability perspective. The recent 2023 report shows that despite record-breaking global concern about climate change and environmental issues, there is still a large gap between the strong desire for change and the actual action taken [37,38]. Therefore, there is a need to increase the dissemination of information on behaviour related to more sustainable and healthy lifestyle. In recent years, information materials on sustainable living culture have been made available with attractive graphics and content that are easy to use and applicable in everyday life, such as the materials of the One Planet Network, a global community of professionals, experts, political and civil society actors, scientists and international organisations promoted by the United Nations [39]. The guide ‘Sustainable Lifestyles - Options & Opportunities’ published in 2018, is a collection of practical measures, resources and ideas to inspire initiatives to apply sustainability in six areas of daily life: Food, Transport, Consumption, Housing, Entertainment and Lifestyles in general, in resource-limited contexts [40]. In addition to international organisations and economic actors, the academic world also plays a central role in spreading the culture of sustainability. In 2011, Oregon State University published the 'Sustainable Living Handbook - A Citizen's Guide to Thoughtful Action', a sustainable living handbook designed to guide citizens towards a lifestyle that is “deeply satisfying, fulfilling and engaging because it is socially, environmentally, and economically responsible” [41]. This resource includes activities to help readers identify their personal values, as well as food for thought and suggestions for additional reading to integrate sustainability into everyday life choices. In 2020, Johns Hopkins University in Baltimore developed a handbook called the 'Sustainable Living Guide' to guide the university community towards a more sustainable lifestyle. The guide provides specific tips and recommendations for reducing an individual's environmental footprint and identifies local organisations and businesses that offer sustainable products and services. The guide covers the areas that have the greatest impact on an individual's environmental footprint: Cleaning, Energy, Food and Diet, Personal Care, Shopping, Supplies, Transport, Waste Sorting, Waste Reduction and Water [13]. On the other hand, the literature describes that there is still a part of the population that seems to be resistant to sustainability issues. In a recent study of the general population in the Netherlands, it was found that 20 % of respondents do not want to change their lifestyle and are not interested in sustainability issues, while 29 % of respondents consider sustainability to be an overrated issue, despite engaging in certain behaviours defined as sustainable, such as using public transport [42].

4.4. Limitations

This study has several limitations that must be taken into account when interpreting the results. First, on the sampling: the decision to conduct an online survey, so people with limited digital literacy may not have been able to participate, which risks overestimating the knowledge of sustainable living in the current national scenario, as the lack of information and technology skills remains a barrier that prevents people from fully exploiting the potentials of digitalization, such as inclusion, equal access to knowledge, decent work and entrepreneurship, as stated in SDG target 4.4 [43]. Another aspect of the recruitment is the size of the sample and the fact that it was conducted on a voluntary basis through snowballing, potentially leading to selection bias (e.g., our sample has a higher level of education than the general Italian population, more healthcare workers, more women), which supports the hypothesis that the data on knowledge and practices might be overestimated. Secondly, on the questionnaire: the list of sustainable products and behaviours to be used should not be exhaustive, and many other products or behaviours used and implemented by the general population might not have been captured in our survey. Another limitation is that the questions designed to assess the impact of each item on sustainability may be understood by respondents more as indicators of their personal knowledge of the topic. Nevertheless, to our knowledge, this is one of the first studies to analyze knowledge, awareness and attitudes towards sustainable living and to try to find a link between these dimensions and the socio-demographic characteristics of the Italian population.

5. Conclusions

The discrepancy found in this survey between knowledge and use of sustainable products/behaviors suggests room for improvement, especially in the area of personal care. In the area of transportation, other reasons for non-use could be explored, as age plays a role in the adoption of sustainable behaviours, especially in this area. Regional differences and urbanization patterns appear to influence the adoption of sustainable behaviors, suggesting the need for tailored interventions to promote more sustainable behaviours, which in turn will help protect our planet and ensure global prosperity, healthy living and socio-economic development.

6. Patents

Supplementary Materials

The following supporting information can be downloaded at the website of this paper posted on Preprints.org, Supplementary Material S1: “Survey”.

Author Contributions

Conceptualization, B.F., C.S., A.S., and L.B.; methodology, E.M, B.F., C.S, and L.B.; software, E.M.; formal analysis, E.M.; investigation, E.M., B.F. C.S., S.C., M.F.F., L.P., G.A., G.V., and L.B.; resources, E.M.; data curation, E.M, and B.F.; writing—original draft preparation, E.M., B.F., C.S., and L.B.; writing—review and editing, E.M., B.F., C.S., A.S., S.C., M.F.F., L.P., G.A., G.V., M.P., and L.B.; visualization, E.M., and B.F.; supervision, M.P., and L.B.; project administration, L.B. . All authors have read and agreed to the published version of the manuscript.

Funding

This research received no external funding.

Institutional Review Board Statement

The study was conducted in accordance with the Declaration of Helsinki, and approved by the Institutional Review Board of Department of Medicine of University of Udine (protocol code 179/2022, approved on December 15th 2022).

Informed Consent Statement

Informed consent was obtained from all subjects involved in the study.

Data Availability Statement

The original contributions presented in this study are included in the article/supplementary material. Further inquiries can be directed to the corresponding author.

Acknowledgments

The authors would like to thank Dr. Andrea Barbara, Dino D’Agati and Elena Zanardini for their help in distributing the invitation to participate in the survey.

Conflicts of Interest

The authors declare no conflicts of interest.

References

  1. Fishbein, M.; Ajzen, I. Belief, Attitude, Intention, and Behavior: An Introduction to Theory and Research [Internet]. Addison Wesley Publishing Company. 1975. Available from: https://people.umass.edu/aizen/f&a1975.html.
  2. Ajzen, I. The Theory of Planned Behaviour. Organ Behav Hum Decis Process [Internet]. 1991, 50, 179–211. Available from: https://www.sciencedirect.com/science/article/abs/pii/074959789190020T?via%3Dihub. [CrossRef]
  3. Bosnjak, M.; Ajzen, I.; Schmidt, P. The theory of planned behavior: Selected recent advances and applications. Eur J Psychol. 2020, 16, 352–6. [Google Scholar] [CrossRef] [PubMed]
  4. UNESCO What you need to know about education for sustainable development [Internet]. 2023. Available from: https://www.unesco.org/en/education/sustainable-development/need-know.
  5. United Nations. Department of Economic and Social Affairs. 2015. Goal 4 - Ensure inclusive and equitable quality education and promote lifelong learning opportunities for all. Available from: https://sdgs.un.org/goals/goal4.
  6. Smaniotto, C.; Battistella, C.; Brunelli, L.; Ruscio, E.; Agodi, A.; Auxilia, F.; et al. Sustainable development goals and 2030 agenda: Awareness, knowledge and attitudes in nine Italian universities, 2019. Int J Environ Res Public Health. 2020, 17, 1–18. [Google Scholar] [CrossRef] [PubMed]
  7. Smaniotto, C.; Brunelli, L.; Miotto, E.; Del Pin, M.; Ruscio, E.; Parpinel, M. Sustainable Development Goals and 2030 Agenda—Survey on Awareness, Knowledge and Attitudes of Italian Teachers of Public Mandatory Schools, 2021. Sustain. 2022, 14. [Google Scholar] [CrossRef]
  8. Smaniotto, C.; Saramin, A.; Brunelli, L.; Parpinel, M. Insights and Next Challenges for the Italian Educational System to Teach Sustainability in a Global Context. Sustain. 2023, 15. [Google Scholar] [CrossRef]
  9. United Nations Environment Programme. Sustainable lifestyles [Internet]. 2021. Available from: https://www.unep.org/explore-topics/resource-efficiency/what-we-do/sustainable-lifestyles.
  10. United Nations Environment Programme. Why Sustainable lifestyles matter [Internet]. 2021. Available from: https://www.unep.org/explore-topics/resource-efficiency/what-we-do/sustainable-lifestyles/why-sustainable-lifestyles.
  11. Enel Green Power. Consumo sostenibile: le persone scelgono l’ambiente [Internet]. 2021. Available from: https://www.enelgreenpower.com/it/learning-hub/transizione-energetica/trend-consumo-sostenibile.
  12. Lifegate. Come l’innovazione ci aiuta a costruire un futuro sostenibile [Internet]. 2021. Available from: https://www.lifegate.it/trend/osservatorio-2021.
  13. Johns Hopkins University. Sustainable Living Guide [Internet]. 2021. Available from: https://hub.jhu.edu/2021/01/08/sustainable-living-guide.
  14. EUROSTAT. NUTS - NOMENCLATURE OF TERRITORIAL UNITS FOR STATISTICS [Internet]. 2021. Available from: https://ec.europa.eu/eurostat/web/nuts/background.
  15. EUSURVEY - privacy statement [Internet]. 2018. Available from: https://ec.europa.eu/eusurvey/home/privacystatement.
  16. Ministero del Lavoro e delle Politiche Sociali. Registro Nazionale delle Associazioni di Promozione Sociale [Internet]. 2022. Available from: https://www.lavoro.gov.it/temi-e-priorita/Terzo-settore-e-responsabilita-sociale-imprese/focus-on/Associazionismo-sociale/Pagine/Registro-nazionale-delle-associazioni-di-promozione-sociale.aspx.
  17. Globescan. Healthy & Sustainable Living - a global consumer insight project - Highlights Report 2019 [Internet]. 2019. Available from: https://globescan.com/wp-content/uploads/2019/09/Healthy_Sustainable_Living_2019_GlobeScan_Highlights.pdf.
  18. GlobeScan. Healthy & Sustainable Living - 2022 Highlights Report. 2022. Available from: https://globescan.com/wp-content/uploads/2022/11/GlobeScan_Healthy_and_Sustainable_Living_Highlights_Report_2022.pdf.
  19. Rural Energy Community Advisory Hub. Empowering Municipalities to Develop and Support Rural Energy Communities [Internet]. 2023. Available from: https://rural-energy-community-hub.ec.europa.eu/system/files/2023-11/Empowering Municipalities to Develop and Support Rural ECs.pdf.
  20. European Union. Grover: Reducing e-waste by renting out electronic devices [Internet]. 2021. Available from: https://circulareconomy.europa.eu/platform/en/good-practices/grover-reducing-e-waste-renting-out-electronic-devices.
  21. European Commission. A new Circular Economy Action Plan For a cleaner and more competitive Europe [Internet]. Brussels, 11.3.2020 COM(2020) 98 Final. 2020. Available from: https://eur-lex.europa.eu/resource.html?uri=cellar:9903b325-6388-11ea-b735-01aa75ed71a1.0017.02/DOC_1&format=PDF.
  22. Italian National Institute of Statistics. demo - demografia in cifre (ISTAT) [Internet]. 2023. Available from: https://demo.istat.it/app/?i=POS&l=it.
  23. UNIMPRESA - Unione Nazionale di Imprese LAVORO: UNIMPRESA, SMART WORKING IN 26 CONTRATTI NAZIONALI E 177 ACCORDI AZIENDALI. Osservatorio lavoro agile al Ministero del Lavoro [Internet]. 2023. Available from: https://www.unimpresa.it/lavoro-unimpresa-smart-working-in-26-contratti-nazionali-e-177-accordi-aziendali/53074.
  24. European Parliament. Consolidated text: Directive 2010/31/EU of the European Parliament and of the Council of 19 May 2010 on the energy performance of buildings (recast) [Internet]. 2021. Available from: http://data.europa.eu/eli/dir/2010/31/2021-01-01.
  25. Ministero dello sviluppo economico. Decreto interministeriale 26 giugno 2015 - Applicazione delle metodologie di calcolo delle prestazioni energetiche e definizione delle prescrizioni e dei requisiti minimi degli edifici [Internet]. 2015. Available from: https://www.mimit.gov.it/index.php/it/normativa/decreti-interministeriali/decreto-interministeriale-26-giugno-2015-applicazione-delle-metodologie-di-calcolo-delle-prestazioni-energetiche-e-definizione-delle-prescrizioni-e-dei-requisiti-minimi-degli-edific.
  26. Impreseedili. Survey Ufficio Studi Gabetti e Abaco Team. 2021. Edilizia residenziale: Gabetti analizza lo stato del patrimonio italiano. Available from: https://www.impresedilinews.it/gabetti-abaco-team-survey-patrimonio-edilizio-residenziale/.
  27. Istituto nazionale per l’analisi delle politiche pubbliche. Indagine PIACC - Le competenze dei 16-65enni: il gap Italia nel confronto internazionale. 2023. Available from: https://www.inapp.gov.it/piaac/dati-e-risultati/highlights-ciclo-i/le-competenze-dei-16-65enni-il-gap-italia-nel-confronto-internazionale#:~:text=Gli adulti italiani (16-65,performance (Livello 1 o inferiore.
  28. White, K.; Habib, R.; Hardisty, D.J. How to SHIFT consumer behaviors to be more sustainable: A literature review and guiding framework. J Mark. 2019, 83, 22–49. [Google Scholar] [CrossRef]
  29. Cohen, S. Understanding the Sustainable Lifestyle. J Consum Res [Internet]. 2010, 36, 715–34. Available from: https://academiccommons.columbia.edu/doi/10.7916/D8475T9J.
  30. Triantafyllidou, E.; Zabaniotou, A. From Theory to Praxis: ‘Go Sustainable Living’ Survey for Exploring Individuals Consciousness Level of Decision-Making and Action-Taking in Daily Life Towards a Green Citizenship. Circ Econ Sustain. 2022, 2, 113–39. [Google Scholar] [CrossRef] [PubMed]
  31. Cmyk, P.; Nero, B. Progettiamo insieme la Strategia Regionale per lo Sviluppo Sostenibile del Friuli Venezia Giulia REPORT FINALI DELLE CONSULTAZIONI PUBBLICHE [Internet]. 2021. Available from: https://www.regione.fvg.it/rafvg/export/sites/default/RAFVG/ambiente-territorio/tutela-ambiente-gestione-risorse-naturali/FOGLIA208/allegati/Report_finali_consultazione_pubblica.pdf.
  32. Regione Autonoma Friuli Venezia Giulia. Strategia Regionale per lo Sviluppo Sostenibile - Questionario [Internet]. 2023. Available from: https://agenda2030.fvg.it/questionario.
  33. Salas-Zapata, W.A.; Ríos-Osorio, L.A.; Cardona-Arias, J.A. Knowledge, Attitudes and Practices of Sustainability: Systematic Review 1990-2016. Vol. 20, Journal of Teacher Education for Sustainability. De Gruyter Open Ltd; 2018. p. 46–63.
  34. United Nations General Assembly. Transforming our world: the 2030 Agenda for Sustainable Development [Internet]. 2015. Available from: https://www.un.org/en/development/desa/population/migration/generalassembly/docs/globalcompact/A_RES_70_1_E.pdf.
  35. European Investment Bank. The EIB Climate Survey - CITIZENS CALL FOR GREEN RECOVERY, Fourth edition 2021-2022 [Internet]. 2022. 82 p. Available from: https://www.eib.org/en/publications/the-eib-climate-survey-2021-2022.
  36. Centro Italiano per l’Apprendimento Permanente. FROM ZERO TO HERO: Wise Energy Use Volunteering Scheme for Youngster [Internet]. 2019. Available from: https://www.ciape.it/ciape/en/2019/03/06/from-zero-to-hero-refuse-reuse-reduce-2.
  37. GlobeScan. Healthy & Sustainable Living - Global Consumer Insights - 2021 Highlights Report. 2021. Available from: https://globescan.wpenginepowered.com/wp-content/uploads/2021/10/GlobeScan-HSL-Highlights-Report-2021.pdf.
  38. GlobeScan. CONSUMERS WILL NOT SAVE THE WORLD: WHY NOW IS THE TIME FOR A RESET, GlobeScan Healthy & Sustainable Living Report 2023 [Internet]. 2023. Available from: https://globescan.wpenginepowered.com/wp-content/uploads/2023/10/GlobeScan_Healthy_and_Sustainable_Living_Highlights_Report_2023.pdf.
  39. United Nations Environment Programme. The One Planet Network. 2018. Available from: https://www.oneplanetnetwork.org.
  40. SUSTAINABLE LIFESTYLES options & opportunities Take actions together to minimize footprints and maximize impacts. 2018.
  41. Apel M, Elliott C, Glenn E, Prichard J, Rashash D, Simon D, et al. Sustainable Living Handbook : A Citizen’s Guide to Thoughtful Action [Internet]. Oregon. 2011. Available from: https://ir.library.oregonstate.edu/concern/technical_reports/s7526c86z?locale=en.
  42. Haan, M.; Konijn, E.A.; Burgers, C.; Eden, A.; Brugman, B.C.; Verheggen, P.P. Identifying Sustainable Population Segments Using a Multi-Domain Questionnaire: A Five Factor Sustainability Scale. Soc Mar Q. 2018, 24, 264–80. [Google Scholar] [CrossRef] [PubMed]
  43. European Commission. Digital Education Action Plan 2021-2027 Resetting education and training for the digital age [Internet]. Vol. 2, COM(2020) 624 final. Brussels. 2020. Available from: https://eur-lex.europa.eu/legal-content/EN/TXT/PDF/?uri=CELEX:52020DC0624.
Table 1. Socio-demographic characteristics of the survey participants.
Variable Modality % (N)
Age Class 18–24 2 % (7)
Class 25–35 39 % (162)
Class 36–50 25 % (107)
Class 51–65 26 % (108)
Class 66 + 9 % (36)
Sex Male 33 % (139)
Female 66 % (279)
Non-binary < 1 % (2)
Place of
Residence
Northern Italy 61 % (256)
Central Italy 21 % (87)
Southern Italy 18 % (77)
Living
environment
Rural 19 % (78)
Suburban 24 % (100)
Urban 58 % (242)
Education Elementary school < 1 % (2)
Secondary school 2 % (10)
High school diploma 19 % (81)
Non-university higher education degree 1 % (6)
University degree 37 % (156)
Post-graduate qualification 39 % (165)
Previous SL No 72 % (301)
activities Yes 28 % (119)
Profession Health 45 % (190)
Services – Third sector 12 % (52)
Public administration 8 % (34)
Industry 7 % (31)
Teaching 6 % (27)
Economy 4 % (15)
Commerce 4 % (15)
Unemployed – Unemployable 4 % (15)
Student 3 % (13)
Telecommunications – Media 2 % (8)
Crafts 1 % (6)
Law 1 % (6)
Agriculture 1 % (5)
Politics < 1 % (2)
Armed forces < 1 % (1)
Table 2. Number fraction f (%) of respondents with a high perception of sustainability and respondents who use sustainable devices or behave sustainably.
Item % respondents with high sustainability perception (N) % respondents who used device/adopted behaviour (N)
N = 16 800 N = 16 473
House and cleaning
ecological detergents and cleaners 86.9 % (365) 65.5 % (275)
cleaning towels made with natural ingredients 79.8 % (335) 51.0 % (214)
hang wet laundry to dry instead of using a dryer 93.1 % (391) 85.7 % (360)
wash only full loads of laundry and use cold water 95.0 % (399) 95.2 % (400)
baking and food storage paper reusable or biodegradable 79.3 % (333) 60.2 % (253)
Energy
LED light bulbs 96.7 % (406) 98.1 % (412)
photovoltaic panels 94.8 % (398) 17.1 % (72)
multi-plug adapters 50.2 % (211) 89.3 % (375)
changeable thermostat settings 95.7 % (402) 91.7 % (385)
more energy-efficient household appliances 96.0 % (403) 90.5 % (380)
Food
grow your own food and herbs 81.0 % (340) 27.4 % (115)
reduce your consumption of meat and dairy products (substituting with white meat, fish, vegetable proteins) 82.9 % (348) 72.1 % (303)
buy organic and locally produced food 92.4 % (388) 80.2 % (337)
prefer seasonal products 96.0 % (403) 96.0 % (403)
use reusable, package-free or bulk-packaged products 96.0 % (403) 75.7 % (318)
Personal care
biodegradable cotton balls, cotton swabs,
toothbrushes, razors
85.7 % (360) 49.3 % (207)
bars of soap, shampoo, conditioner, shower gel 70.0 % (294) 38.3 % (161)
powder/tablets of toothpaste and mouthwash 51.7 % (217) 11.7 % (49)
microplastic-free cosmetics 80.5 % (338) 37.9 % (159)
washable/reusable or biodegradable/compostable period products 86.9 % (365) 26.3 % (74)
washable nappies for infants 87.4 % (367) 15.5 % (36)
Shopping
second hand clothes 79.3 % (333) 40.7 % (171)
durable clothing and ethically and transparently made products 91.7 % (385) 66.2 % (278)
garments made from organic or rapidly renewable textiles 86.7% (364) 54.0 % (227)
reusable shopping and grocery bags 95.5 % (401) 98.3 % (413)
Transportation
public transportation 97.6 % (410) 49.8 % (209)
telecommuting and telemeeting platforms to reduce trips 92.1 % (387) 48.6 % (204)
bicycle or walk trips 97.6 % (410) 75.2 % (316)
carsharing/carpooling 87.1 % (366) 21.2 % (89)
offset carbon emissions from air travel with a donated carbon tax 50.2 % (211) 44.0 % (185)
Waste
donation/sale of clothing and items instead of disposing them 91.4 % (384) 93.6 % (393)
separate waste collection according to the regulations of your municipality 96.7 % (406) 99.0 % (416)
production of compost for wet waste 92.6 % (389) 59.0 % (248)
disposing of hazardous waste at authorised collection points (ecological islands/waste collection points/containers for expired drugs and used batteries) 98.6 % (414) 96.0 % (403)
purchase/sale of reconditioned electronic equipment 85.2 % (358) 46.0 % (193)
Water and other consumption
turn off the tap when you wash your hands and face, brush your teeth and shave 94.0 % (395) 96.0 % (403)
use the shower instead of taking a bath in the tub 91.2 % (383) 97.4 % (409)
use of mixers to regulate the flow of water 85.5 % (359) 85.7 % (360)
internal design to use natural sunlight during the day instead of lamps and overhead lighting 91.7 % (385) 90.7 % (381)
solutions/measures to turn off lights and LED appliances when not in use or not needed 89.3 % (375) 87.1 % (366)
Table 3. Probability of using or adopting a sustainable product/behaviour compared to the reference (ref) class, expressed with aOR and CI (bold* if p < 0.05).
Preprints 138999 i001
Disclaimer/Publisher’s Note: The statements, opinions and data contained in all publications are solely those of the individual author(s) and contributor(s) and not of MDPI and/or the editor(s). MDPI and/or the editor(s) disclaim responsibility for any injury to people or property resulting from any ideas, methods, instructions or products referred to in the content.
Copyright: This open access article is published under a Creative Commons CC BY 4.0 license, which permit the free download, distribution, and reuse, provided that the author and preprint are cited in any reuse.
Prerpints.org logo

Preprints.org is a free preprint server supported by MDPI in Basel, Switzerland.

Subscribe

Disclaimer

Terms of Use

Privacy Policy

Privacy Settings

© 2025 MDPI (Basel, Switzerland) unless otherwise stated