1. Introduction
Several studies, some of which with a cross-sectional design, explored the relationship between aortic stiffness and Chronic Kidney Disease (CKD), with conflicting results. In some of these studies, this relationship is clear even in the earliest stages of renal function impairment.[
1]
The oscillometric method gives the opportunity to estimate aortic stiffness in a very simple way, by recording pressure oscillations at the brachial artery level.
The Arteriograph® is a computerized device that uses an oscillometric method to simultaneously determine brachial blood pressure (BP) and aortic pulse wave velocity (aPWV), the speed at which the pulse wave travels through the aortic wall. It relates to the elastic properties of the aortic wall. The stiffer the aortic wall, the higher the PaWVao is. It is currently considered the gold standard for arterial stiffness measurement. There is an extensive and highly consistent body of evidence indicating that aPWV is a powerful independent predictor of cardiovascular (CV) morbidity and mortality.
The Arteriograph® has been validated against Complior® and SphygmoCor® in the general population and in hypertensive patients. Moreover, aPWV estimated with this oscillometric method has shown a very close correlation with values measured by invasive methods, even closer than those obtained with other non-invasive methods. In comparative terms, the Arteriograph® is easier to use and less critically dependent on the positioning of sensors above the carotid and femoral and radial artery.
The aim of our study was to analyze the potential relationship between increased aortic stiffness and the rate of kidney function decline in a group of hypertensive patients with CKD. To the best of our knowledge, this is the first study to investigate these relationships using an oscillometric device for PWV determination.
2. Materials and Methods
The study population of this retrospective investigation was selected from 425 subjects with CKD attending our Nephrology and Hypertension outpatient clinic between January 2011 and December 2020.
Exclusion criteria were:
Age < 18 years
Atrial fibrillation*
Other tachyarrhythmias*
Very frequent ventricular or supraventricular ectopic beats or bigeminy or trigeminy)*
Severe tremor (e.g. Parkinson disease)*.
Coagulation disorders**
Skin disorders or wounds existing on both arms***
* Because was not possible to obtain an aortic PWV measurement of good quality.
** Because the compression of the arm by the cuffs used for BP and aPWV measurements may cause soffusion.
*** Because the compression of the arm by the cuffs used for BP and aPWV measurements may determine further damage.
Twenty-five patients with the exclusion criteria listed above were not enrolled. Hence, the final statistical analysis involved 395 individuals.
The study was conducted in accordance with the ethical standards of the Helsinki Declaration and all the subjects gave their written informed consent before being subjected to the exams planned in the study.
2.1. Study Design and Measurements
In all patients careful clinical history and physical examination were performed.
Body weight and height were measured without shoes and with light clothing. Body mass index (BMI) was calculated as weight (kg) to height (m) squared.
Blood samples were taken in the morning, after a fasting of at least 12 hours, to perform the, following biochemical tests: complete blood count, serum triglycerides, serum total cholesterol, HDL (High-density lipoprotein), and LDL (Low-density lipoprotein) cholesterol, serum calcium, serum phosphorus, serum potassium, serum sodium and serum creatinine. Moreover, urinalysis was carried out for proteinuria evaluation. Routine biochemical parameters were measured using standard techniques with an autoanalyzer, and serum creatinine with a standardized enzymatic method (Creatinine Plus; Roche Diagnostiscs, Basel, Switzerland). Glomerular filtration rate (GFR) was estimated (eGFR) using CKD-EPI equation.
On the same day, clinic blood pressure (BP), heart rate (HR) and aortic stiffness were recorded.
At the first evaluation clinic BP and HR were measured simultaneously in both arms, using appropriate cuff size, by two automatic oscillometric sphygmomanometer Omron® M6 (OMRON Healthcare Co., Kyoto, Japan), that are clinically validated. If an interarm systolic BP (SBP) difference was detected, the arm with the highest SBP was used for all subsequent measurements, including those needed to assess aortic stiffness.
All the recordings were performed in the morning, in a quiet temperature-controlled room, after 5 minutes of rest, in a seated position, legs uncrossed and feet flat on floor with mid-arm at heart level. Caffeine and alcohol intake and smoking were not permitted 10 h prior to BP evaluation. The patients were not allowed to speak or move during BP and aPWV measurements. Three consecutive BP readings were obtained at 1-min intervals and averaged. These values were collected at baseline and at each subsequent in-patient follow-up.
In the same room in which clinic BP was recorded, after a further rest of ten minutes, aortic stiffness was assessed with the computer assisted oscillometric device Arteriograph®, 1.10.1.1 software version (TensioMed, Budapest, Hungary).
The examination was conducted by a single trained operator (G.M.)
An upper arm cuff of appropriated size was applied to the patient and after a first simple BP measurement, the cuff was over-inflated with 35– 40 mm Hg beyond the systolic BP. During systole, the blood volume having been ejected into the aorta generates pulse wave (early systolic peak). This pulse wave runs down and reflects from the bifurcation of aorta, creating a second wave (late systolic peak). Both early and late systolic peak were obtained and recorded on the computer as pulse waves. Aortic PWV was derived from the ratio between the distance, measured manually with a tape, from the jugulum to the symphysis, distance assumed as corresponding to the aortic path, and the time elapsed between the onset of the incident wave and the onset of the reflected wave, defined as return time (RWTT). The aPWV was expressed in m/s. Finally, the return time was divided by 2 since the pulse wave travels the same path in both antegrade and retrograde directions.
According to the manufacturer’s instructions, if the standard deviation (SD) of aortic PWV values, calculated using the pulse waves analyzable by the algorithm of the software, is < 0.7 m/sec the examination may be considered of good quality. If SD of PWV is greater than 0.7 m/sec, but lower than 1 m/sec the measurement is considered of borderline quality and the examination needs to be repeated as well as if SD of PWV is > 1 m/sec or when the quality control system does not provide any value. When a sub-optimal value of SD of PWV is obtained, even after a further attempt, the patient is excluded from the study.
Aortic PVW was recorded only at baseline evaluation.
Patients with CKD were classified into five stages according to the 2012 KDIGO guidelines on chronic kidney disease. Information regarding CKD progression and stage of CKD were systematically recorded at each follow-up visit. Patients were classified as progressors and fast progressors. We estimated a progression factor as an annual decline in eGFR greater than 3 ml/min/1.73m² and further identified fast progressors using a cut-off value of an annual decline in eGFR greater than 5 ml/min/1.73m².[
2]
2.2. Statistical Analysis
Statistical analysis was conducted using Medcalc® version 15 and IBM-SPSS® version 26 software packages. The distribution of variables was analyzed using Kolmogorov-Smirnov test. Continuous variables were given as mean ± standard deviation, while categorical variables were expressed as percentages. Associations between variables were tested using simple linear regression analysis and calculation of Pearson correlation coefficients. Proteinuria and serum triglycerides, showing a non-Gaussian distribution, were logarithmically transformed before statistical analyses and presented as median and interquartile range.
Patients were divided into two groups based on an aortic PWV cutoff of 10 m/s, considered according to guidelines from various international scientific societies, as the threshold value that best identifies patients at higher cardiovascular risk. Differences between groups at baseline were analyzed using chi-square (χ2) test for categorical variables and unpaired T-test for continuous data.
Survival curves were built using the Kaplan-Meier method to evaluate free events survival time. Comparison between curves was performed using the Log Rank Test.
The independence from potential confounding factors of the relationship between Pulse Wave Velocity and our endpoints was tested using Cox proportional hazard regression analysis.
Furthermore, in order to identify the aPWV value better predicting the achievement of study endpoints, ROC curves were created with calculation of the Youden index. The null hypothesis was rejected in all two-tailed tests for p < 0.05.
3. Results
The main demographic and clinical characteristics of the 395 enrolled patients are illustrated in
Table 1.
The two subgroups into which the population was divided differed at baseline, as reported in
Table 1, in the following characteristics: age, pulse pressure, and serum uric acid , which were higher in the group with PWV>10 m/s. Furthermore, glomerular filtration rate at baseline was lower in the same group of patients.
From
Table 2, it can be observed that aortic pulse wave velocity (PWV) exhibits a statistically significant positive correlation with age, pulse pressure, and systolic blood pressure. Conversely, aortic PWV shows a significant negative correlation with estimated glomerular filtration rate (eGFR), hematocrit, height, hemoglobin levels, heart rate, and the annual decline in eGFR.
Table 3 presents the distribution of antihypertensive and other cardiovascular medications used by the overall study population. The comparison between the two patient groups revealed significant differences in the use of diuretics and β-blockers, which were more commonly prescribed to individuals with a pulse wave velocity (PWV) >10 m/s. Additionally, there was a noticeable trend towards increased use of sartans and central antiadrenergic agents in this group, although these differences did not reach statistical significance.
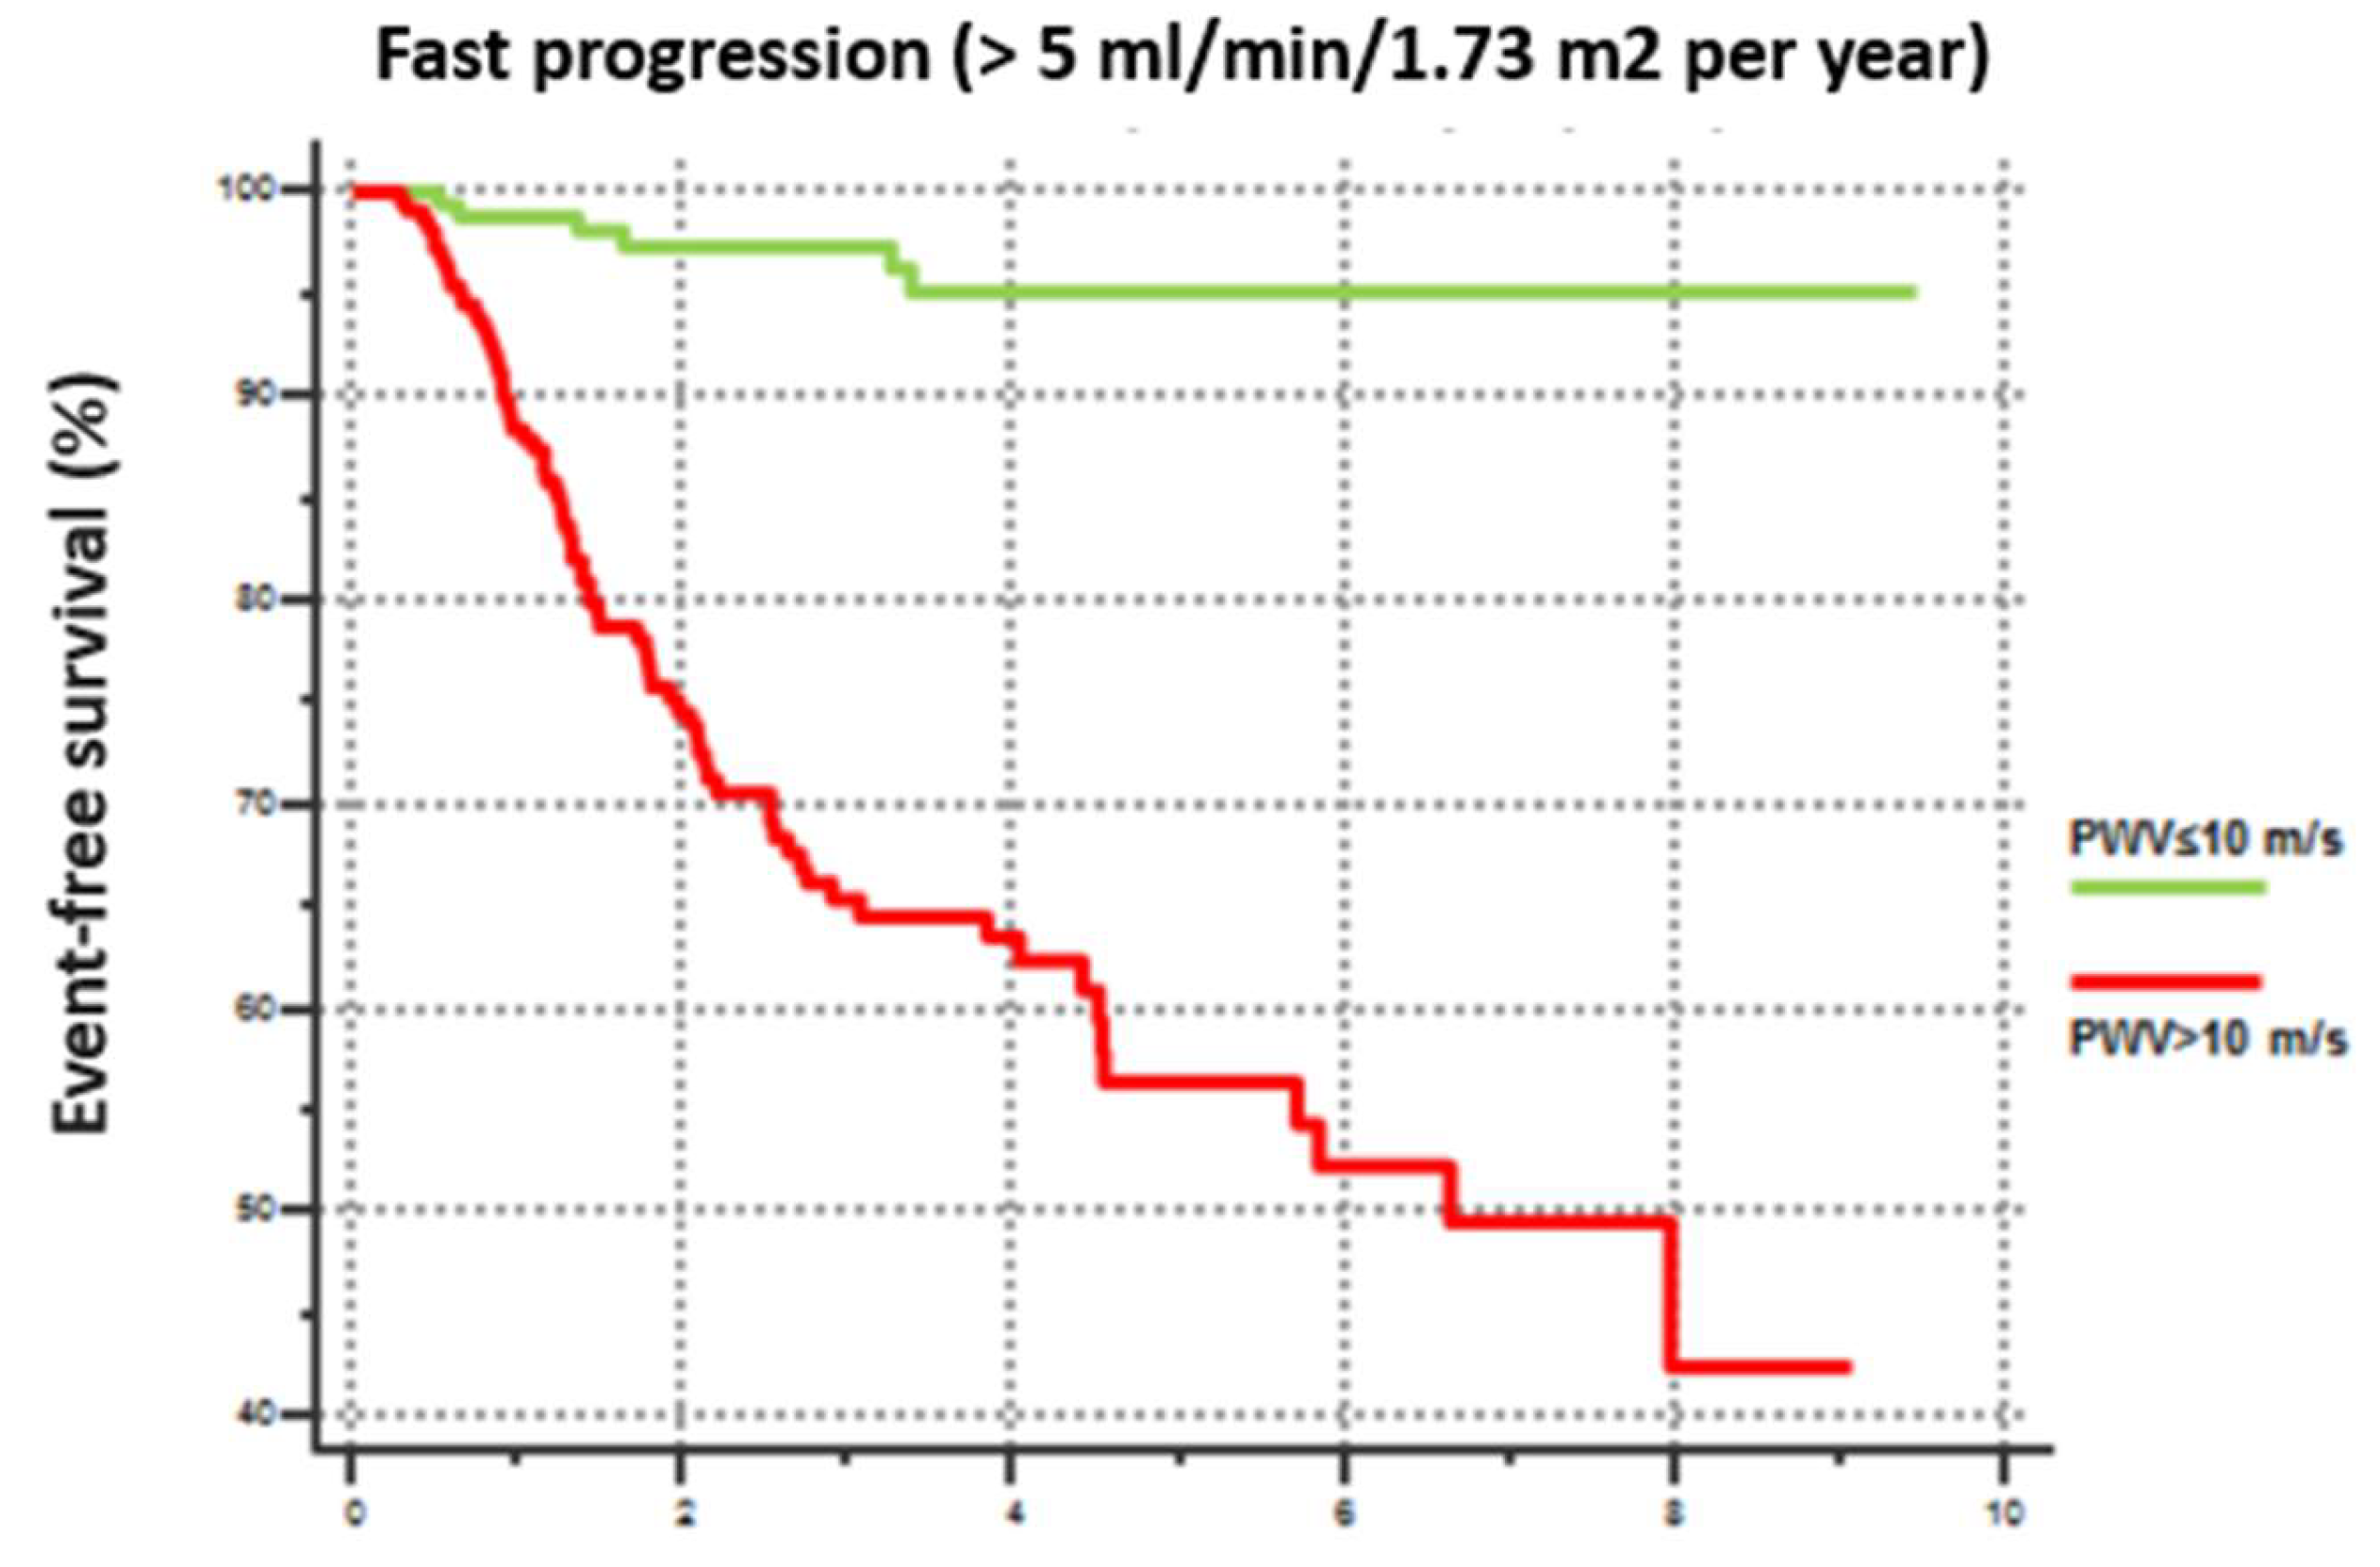
Furthermore, Kaplan-Meier curve analysis, revealed that patients with PWV>10 m/s exhibited a more rapid CKD progression defined as an annual GFR decline rate exceeding 5 mL/min/year (
Figure 1).
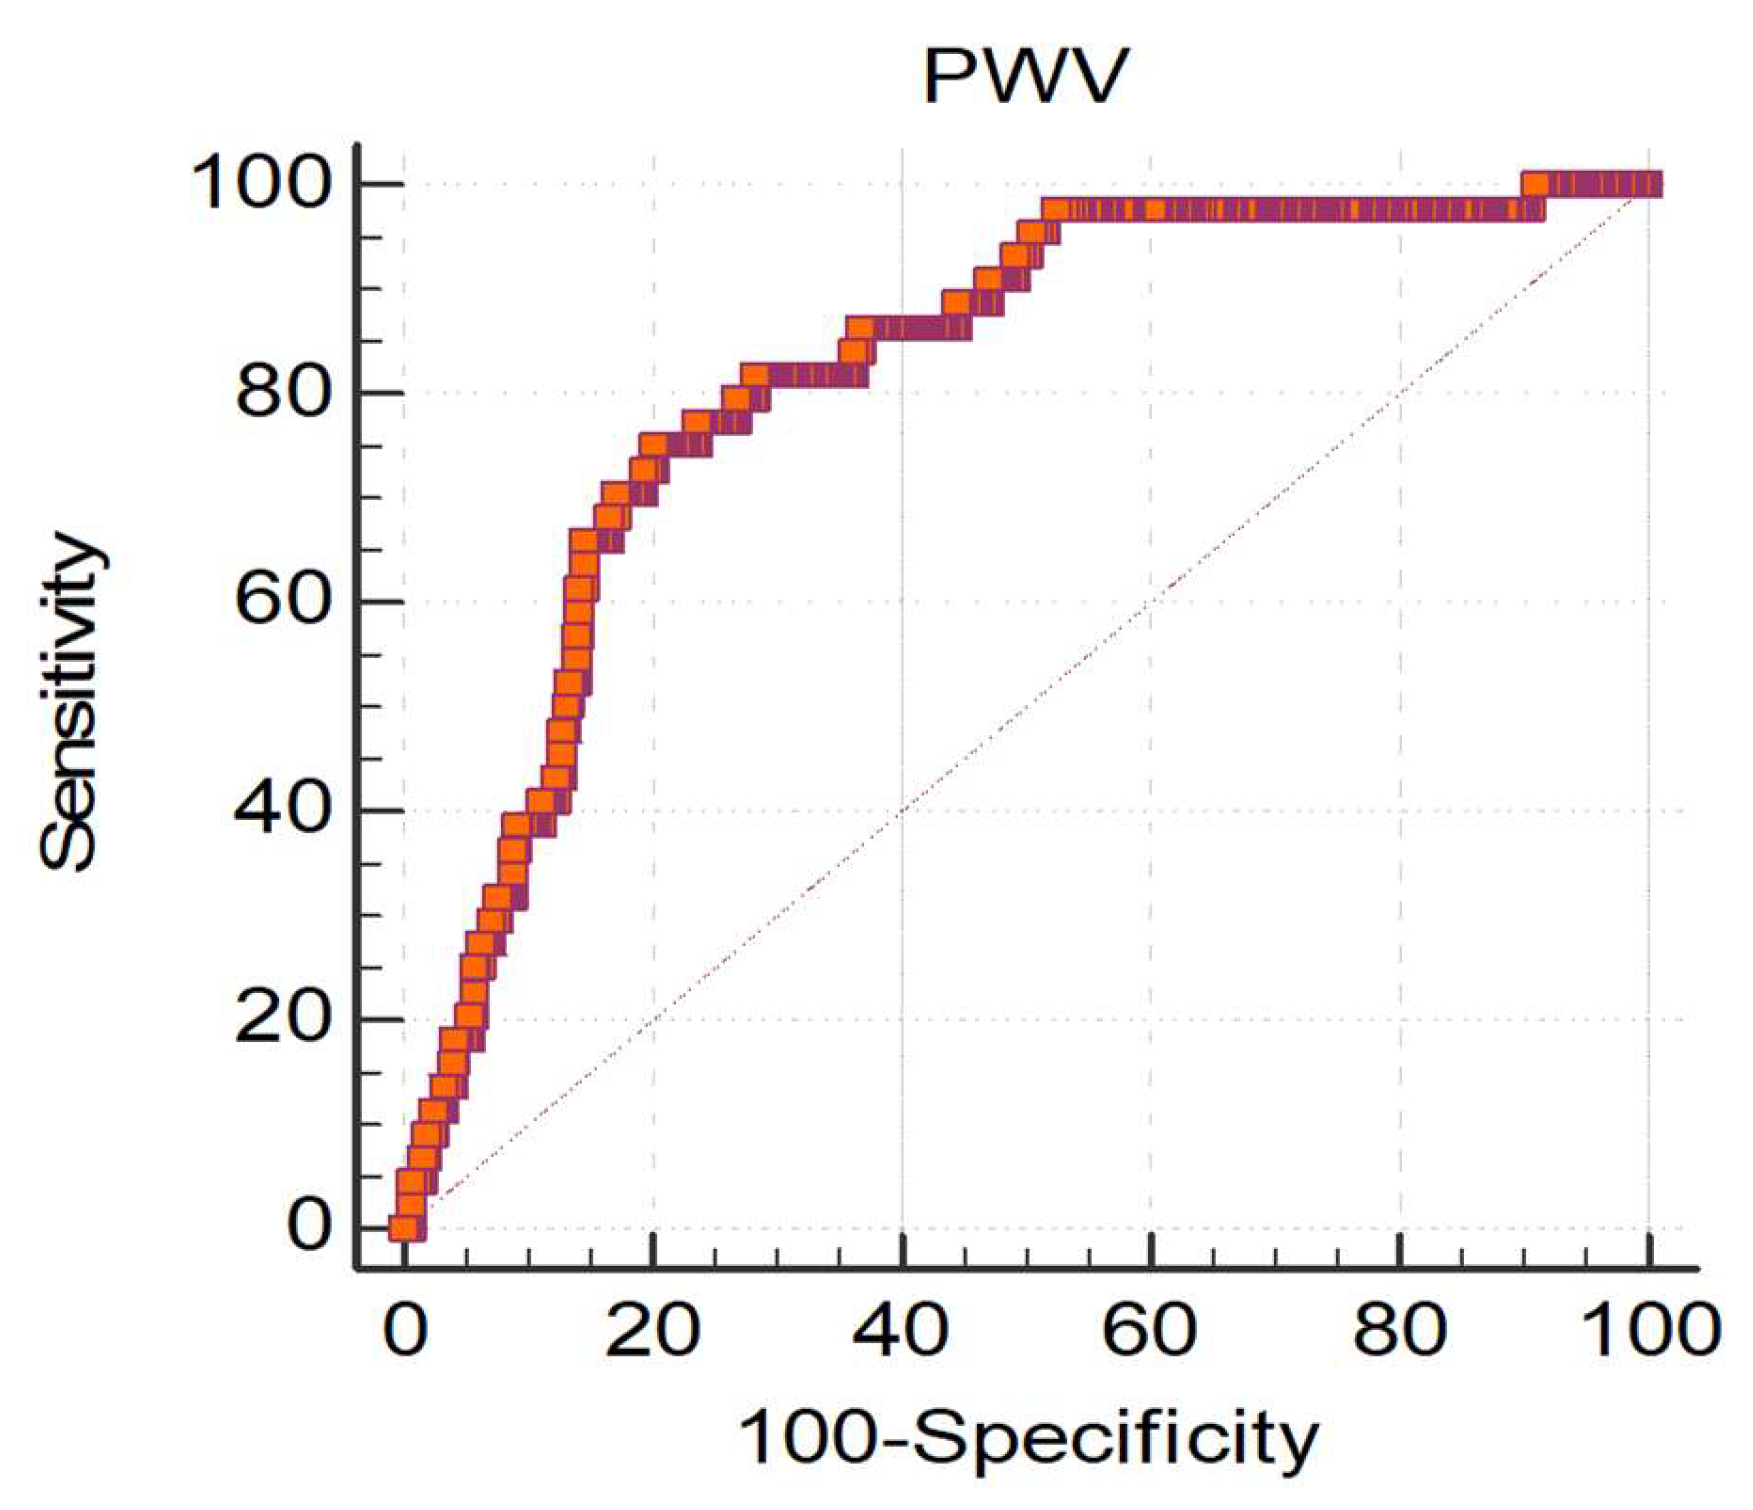
In order to assess the PWV value associated with the greatest risk of CKD progression, we conducted ROC curve analysis, which not only confirmed the strong association between PWV and CKD progression, but also identified 9.99 m/s as the aortic PWV value with the highest discriminatory capacity between Progressors and Non-Progressors (
Figure 2).
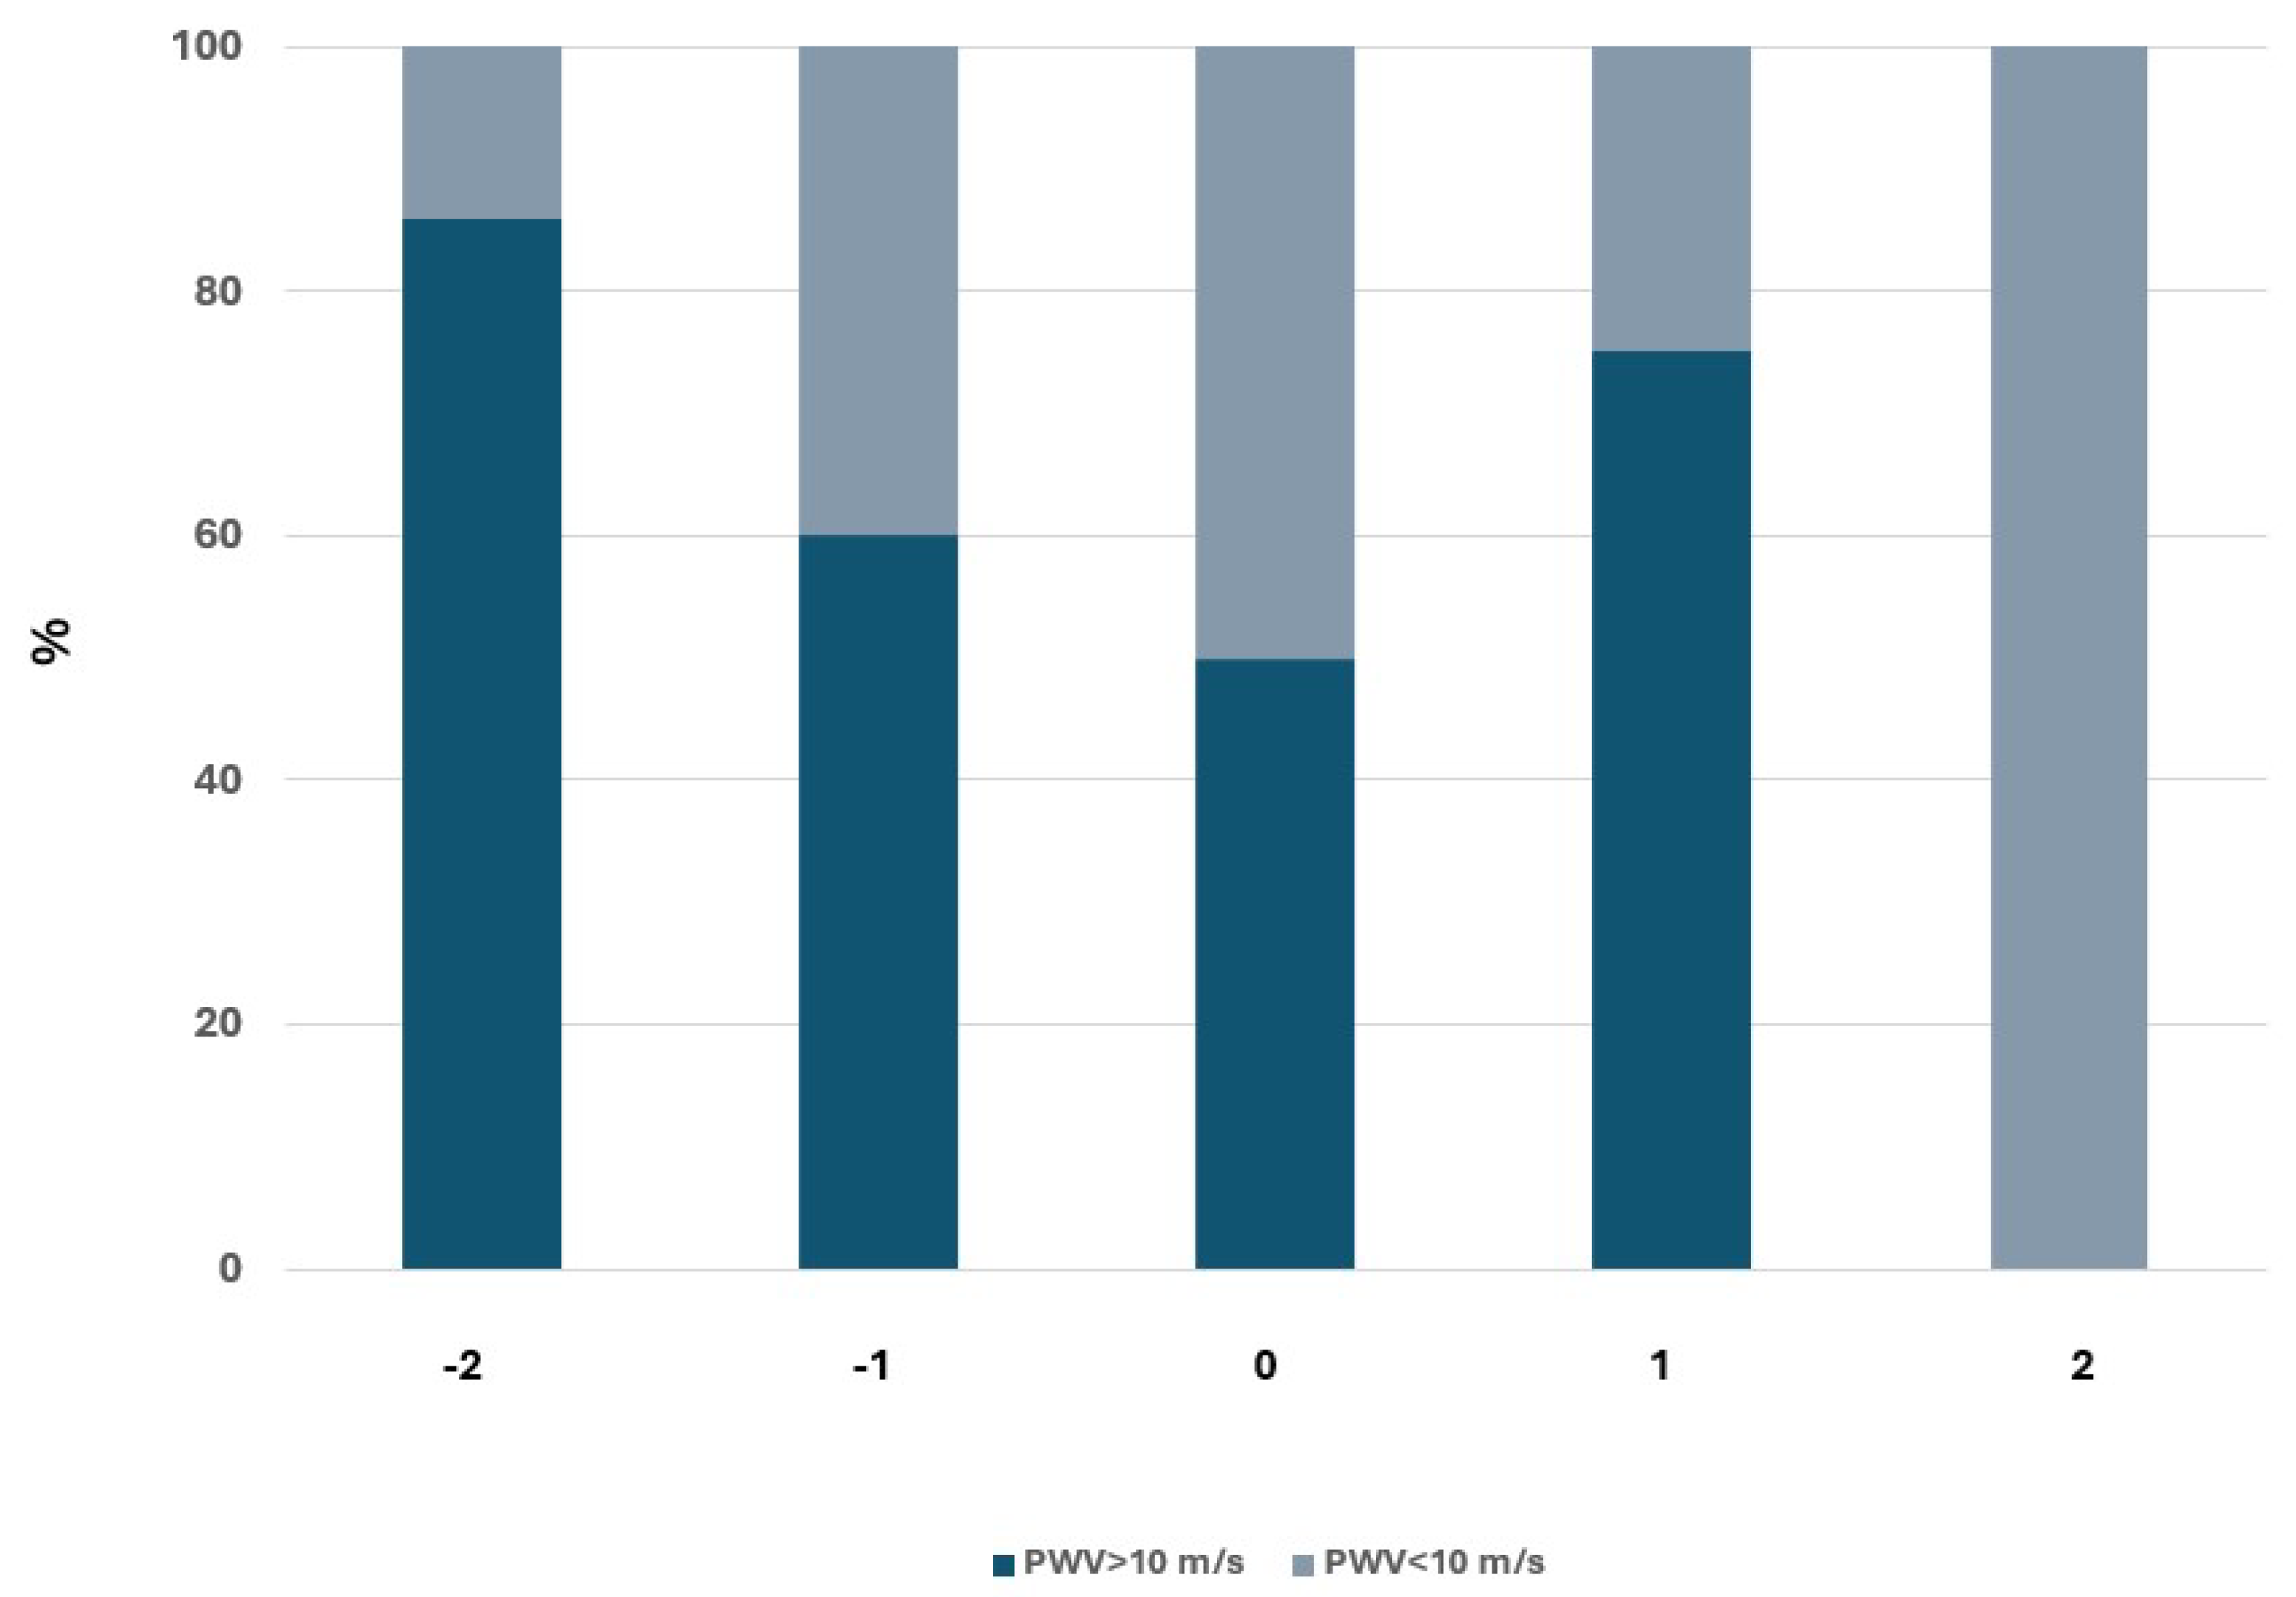
Finally, we evaluated the impact of PWV on renal function by analyzing the relationship between PWV at baseline and the probability of changing CKD stage according to KDIGO guidelines. The results obtained are described in
Figure 3.
This analysis also confirmed the relationship between PWV and renal function worsening, as it documented that a higher percentage of subjects with PWV>10 m/s tend to progress from a stage of lower severity to a stage of greater severity.
Cox proportional hazards regression analysis confirmed that PWV predicts a rapid progression of renal function decline, independently of eGFR value, age at the beginning of observation, BP values, smoking status, sex and pharmacological treatment with diuretics and β-blockers, with a Hazard Ratio (HR) of 1.784; 95% Confidence Interval (CI) : 1.164-2.734; p=0.0082). For each increase of 1 m/s in PWW, the risk of CKD fast progression increases by 78%. The only other variable considered in this multivariate model and thus associated with a faster eGFR decline is diastolic BP with a small protective effect (HR: 0.031; 95 % CI: 0.867-0.992; p=0.0308).
4. Discussion
Our study demonstrated that, in hypertensive patients with chronic kidney disease (CKD), an increase in aortic stiffness is associated with a more rapid decline in renal function. While this relationship has been previously observed, the novelty of our findings lies in the use of a single-site oscillometric method to assess large artery elasticity. To the best of our knowledge, this is the first study to establish the prognostic value of the gold-standard index of arterial stiffness, aortic pulse wave velocity (PWV), when measured at a single site using an oscillometric device.
Since their introduction, these devices sparked a debate in the literature regarding their accuracy, compared to invasive and other non invasive methods of stiffness measurement[
3,
4,
5,
6]. In particular the principle underlying aPWV determination with the Arteriograph® has been questioned in a study based on a computer model and in other studies that underline the need to establish specific reference measures and a standardization of measurement procedures[
7]; this need was recently confirmed by a methodological review[
8].
On the other hand, it has been favorably compared with invasive methods to assess arterial stiffness.
Horvath et colleagues[
9], were among the first to demonstrate a strong correlation and agreement of aortic PWV values obtained by Arteriograph® with those determined by invasive methods.
Recently Del Giorno et al.[
10], conducted a comparison between the PWV obtained using an oscillometric device and that obtained using carotid-femoral tonometric measurements (cf-PWV), considered the gold standard for the non-invasive assessment of aortic stiffness in the general population. The results show a satisfactory agreement of the measurements, especially in subjects without cardiovascular risk factors or documented vascular damage. Although the authors recognize a tendency of oscillometric method to underestimate in younger subjects and to overestimate in older subjects, the magnitude of the differences seems not to be significant in clinical practice.
Finally a systematic review of 11 studies designed to investigate the reliability of the Arteriograph® compared to other non-invasive methods, confirms a good agreement especially in patients with PWV>12 m/s. According to this review, the measurements obtained by this device have good reproducibility and low variability[
8].
Various cross-sectional studies have demonstrated a very close relationship between stiffness of large arteries of large arteries and renal failure. In some of these studies, the relationship is detectable even in the earliest stages of renal function impairment[
1]. However, the cross-sectional design of these studies has not allowed to establish a causal link between the two phenomena, nor the direction of any potential causality.
Various mechanisms are documented through which CKD can lead to an increase in aortic stiffness. It is well known that CKD is associated with an increase in advanced glycation end products even in non-diabetic subjects, as well as inappropriate activation of the renin-angiotensin-aldosterone and the endothelin systems. It is also demonstrated that CKD can be considered a state of subclinical chronic inflammation accompanied by an increase in oxidative stress. These processes, together with the dysregulation of calcium-phosphorus metabolism that notoriously characterizes patients with CKD, lay the foundations for the development of vascular calcifications, which obviously lead to a marked increase in arterial stiffness. Endothelial dysfunction also contributes to the latter, namely, ultimately, the reduced bioavailability of nitric oxide, which is a well-known regulator of arterial elasticity.
In our study, however, it was not possible to determine whether renal functional impairment was responsible for the reduction in arterial elasticity or vice versa. It is also not possible to exclude that this relationship is bidirectional.
Several studies have assessed the relationship between arterial stiffness and the development of nephropathy in subjects with normal renal function at baseline[
11,
12,
13,
14,
15,
16]. However, only two out of these studies did not observe a correlation between increased vascular stiffness and the onset of kidney disease[
11,
15]. Particularly in the Framingham study, conducted on 1765 participants with a 7-10 year follow-up period, aortic PWV was not found to predict the incidence of CKD. However, an association was observed between aortic stiffness and progression from normoalbuminuria to microalbuminuria. Similar conclusions were reached by Kim et al. in their study involving 913 patients with a mean GFR of 84 ml/min/year[
15]. In studies examining the ability of high arterial stiffness to promote the progression of pre-existing kidney disease, an independent relationship between increased arterial stiffness and nephropathy progression was found, although vascular stiffness indices that were not always considered gold standard were used[
17].
The kidney, like the brain, unlike most organs, has remarkably low systemic vascular resistance. As a result, the pulse wave acts more vigorously in the renal microcirculation; therefore, the delicate glomerular circulation is at risk when the afferent arteriole fails to function. This appears to be particularly relevant for systolic pressure, as demonstrated by Loutzenhiser et al.[
18], Bidani et al.[
19], and Griffin[
20]. Their collective research indicates that the afferent arteriole responds very quickly with constriction to changes that increase systolic pressure, virtually without any response if only diastolic pressure is increased.
In our study, diastolic blood pressure was found to be independently associated with CKD progression, with a modest protective effect.
In a study conducted by Liu et al. on 102 patients with diabetic kidney disease, among the three hemodynamic parameters related to arterial stiffness, only PWV was independently associated with CKD progression[
21].
In one of the largest studies available, from the Chronic Renal Insufficiency Cohort (CRIC) the hazard ratio of end-stage renal disease or a 50% decline in eGFR was 1.25 when PWV was in the highest quartile for patients in stages 2–4 of CKD disease[
22].
Some recent studies have not reached the same conclusions; a study conducted in 2023 by Carlsen and colleagues[
23] on 101 Norwegian patients with CKD stage 3-5 does not support widespread implementation of carotid-femoral PWV measurements as the results do not confirm a predictive role of PWV regarding CKD progression or a composite endpoint of renal and cardiovascular events.
Also Azukaitis and colleagues[
24], in a study conducted on 667 children aged 5-17 years with CKD, observed an increase in Pulse Wave Velocity but found no relationship between this and either eGFR or CKD progression.
5. Conclusions
Our study, the first to utilize an oscillometric device for estimating arterial stiffness, supports existing literature that associates increased arterial stiffness with the progression of chronic kidney disease (CKD).
Our findings confirm that a pulse wave velocity (PWV) value of 10 m/s serves as an optimal cutoff for identifying hypertensive patients at higher risk for CKD progression. We observed that an increase in PWV is independently associated with a decline in glomerular filtration rate (GFR) of more than 5 mL/min/year, suggesting a rapid progression of CKD. Furthermore, elevated PWV was linked to the transition from less severe to more advanced stages of CKD. Specifically, higher PWV values were correlated with more severe stages of CKD, and this relationship became more evident in the later stages of the disease (stages 3 and 4).
Regarding the prognostic role of aortic stiffness as a marker of CKD progression, our findings suggest that PWV, when measured using an oscillometric device, could serve as a valuable tool for risk stratification in renal disease, helping to identify patients at higher risk for rapid deterioration of renal function.
Author Contributions
Conceptualization, G.M and C.C.; Data curation, G.M., G.G., A.S. L.A .; Formal analysis, G.M. and A.S.; Methodology, G.M., C.C. G.G.; Project administration, C.C.; Resources, G.M., C.C.; Supervision, G.M. and C.C.; Validation, G.M. C.C A.S.. G.G.; Visualization,G.G. L.A.; Writing—original draft, G.M., C.C; A.S. G.G..; Writing—review & editing, G.M. and C.C.
Funding
This research received no external funding.
Institutional Review Board Statement
The study was conducted according to the guidelines of the Declaration of Helsinki. Ethical review and approval were waived due to the type of the study, which is an anonymous observational survey on a dataset.
Informed Consent Statement
Patients gave consent through compilation of medical record.
Data Availability Statement
The datasets generated during and/or analysed during the current study are available from the corresponding author on reasonable request.
Conflicts of Interest
The authors declare no conflicts of interest.
References
- Mulè, G.; Cottone, S.; Vadalà, A.; et al. Relationship between albumin excretion rate and aortic stiffness in untreated essential hypertensive patients. J Intern Med. 2004, 256, 22–29. [Google Scholar] [CrossRef]
- Levin, A.; Stevens, P.E.; Bilous, R.W.; et al. Kidney disease: Improving global outcomes (KDIGO) CKD work group. KDIGO 2012 clinical practice guideline for the evaluation and management of chronic kidney disease. Kidney International Supplements. 2013, 3, 1–150. [Google Scholar] [CrossRef]
- Davies, J.M.; Bailey, M.A.; Griffin, K.J.; Scott, D.J.A. Pulse wave velocity and the non-invasive methods used to assess it: Complior, SphygmoCor, Arteriograph and Vicorder. Vascular. 2012, 20, 342–349. [Google Scholar] [CrossRef] [PubMed]
- Nemcsik, J.; Egresits, J.; El Hadj Othmane, T.; et al. Validation of Arteriograph – A New Oscillometric Device to Measure Arterial Stiffness in Patients on Maintenance Hemodialysis. Kidney and Blood Pressure Research. 2009, 32, 223–229. [Google Scholar] [CrossRef]
- Salvi, P.; Scalise, F.; Rovina, M.; et al. Noninvasive Estimation of Aortic Stiffness Through Different Approaches. Hypertension. 2019, 74, 117–129. [Google Scholar] [CrossRef]
- Rezai, M.R.; Cowan, B.R.; Sherratt, N.; Finn, J.D.; Wu, F.C.W.; Cruickshank, J.K. A magnetic resonance perspective of the pulse wave transit time by the Arteriograph device and potential for improving aortic length estimation for central pulse wave velocity. Blood Press Monit. 2013, 18, 111–118. [Google Scholar] [CrossRef] [PubMed]
- Fiori, G.; Fuiano, F.; Scorza, A.; Conforto, S.; Sciuto, S.A. Non-Invasive Methods for PWV Measurement in Blood Vessel Stiffness Assessment. IEEE Rev Biomed Eng 2022, 15, 169–183. [Google Scholar] [CrossRef]
- Solomon, A.S.; Cipăian, C.R.; Beca, M.C.; Mihăilă, G. NON-INVASIVE MEASUREMENT OF THE ARTERIAL STIFFNESS - IS THE ARTERIOGRAPH A RELIABLE METHOD? CLINICAL ASPECTS.
- Horváth, I.G.; Németh, A.; Lenkey, Z.; et al. Invasive validation of a new oscillometric device (Arteriograph) for measuring augmentation index, central blood pressure and aortic pulse wave velocity. J Hypertens. 2010, 28, 2068–2075. [Google Scholar] [CrossRef]
- Del Giorno, R.; Troiani, C.; Gabutti, S.; Stefanelli, K.; Gabutti, L. Comparing oscillometric and tonometric methods to assess pulse wave velocity: a population-based study. Annals of Medicine. 2021, 53, 1–16. [Google Scholar] [CrossRef]
- Upadhyay, A.; Hwang, S.J.; Mitchell, G.F.; et al. Arterial Stiffness in Mild-to-Moderate CKD. J Am Soc Nephrol. 2009, 20, 2044–2053. [Google Scholar] [CrossRef] [PubMed]
- Madero, M.; Peralta, C.; Katz, R.; et al. Association of Arterial Rigidity with Incident Kidney Disease and Kidney Function Decline: The Health ABC Study. Clin J Am Soc Nephrol. 2013, 8, 424–433. [Google Scholar] [CrossRef] [PubMed]
- Bouchi, R.; Babazono, T.; Mugishima, M.; et al. Arterial Stiffness Is Associated With Incident Albuminuria and Decreased Glomerular Filtration Rate in Type 2 Diabetic Patients. Diabetes Care. 2011, 34, 2570–2575. [Google Scholar] [CrossRef] [PubMed]
- Sheen, Y.J.; Lin, J.L.; Li, T.C.; Bau, C.T.; Sheu, W.H.H. Peripheral Arterial Stiffness Is Independently Associated with a Rapid Decline in Estimated Glomerular Filtration Rate in Patients with Type 2 Diabetes. Biomed Res Int 2013, 2013, 309294. [Google Scholar] [CrossRef]
- Association of Pulse Wave Velocity and Pulse Pressure With Decline in Kidney Function - Kim - 2014 - The Journal of Clinical Hypertension - Wiley Online Library. 1230. https://onlinelibrary.wiley.com/doi/10.1111/jch Accessed May 31, 2024.
- Tomiyama, H.; Tanaka, H.; Hashimoto, H.; et al. Arterial stiffness and declines in individuals with normal renal function/early chronic kidney disease. Atherosclerosis. 2010, 212, 345–350. [Google Scholar] [CrossRef]
- Georgianos, P.I.; Sarafidis, P.A.; Lasaridis, A.N. Arterial Stiffness: A Novel Cardiovascular Risk Factor in Kidney Disease Patients. Current Vascular Pharmacology. 2015, 13, 229–238. [Google Scholar] [CrossRef]
- Systolic pressure and the myogenic response of the renal afferent arteriole - Loutzenhiser - 2004 - Acta Physiologica Scandinavica - Wiley Online Library. https://onlinelibrary.wiley.com/doi/abs/10.1111/j.1365-201X.2004.01312.x Accessed May 31, 2024.
- Protective Importance of the Myogenic Response in the Renal Circulation | Hypertension. https://www.ahajournals.org/doi/full/10.1161/HYPERTENSIONAHA.109.133777 Accessed May 31, 2024.
- Hypertension and Kidney Damage - Griffin - 2006 - The Journal of Clinical Hypertension - Wiley Online Library. https://onlinelibrary.wiley.com/doi/full/10.1111/j.1524-6175.2005.05111.x Accessed May 31, 2024.
- Liu, J.J.; Liu, S.; Lee, J.; et al. Aortic pulse wave velocity, central pulse pressure, augmentation index and chronic kidney disease progression in individuals with type 2 diabetes: a 3- year prospective study. BMC Nephrol 2020, 21, 359. [Google Scholar] [CrossRef]
- Townsend, R.R.; Wimmer, N.J.; Chirinos, J.A.; et al. Aortic PWV in chronic kidney disease: a CRIC ancillary study. Am J Hypertens. 2010, 23, 282–289. [Google Scholar] [CrossRef]
- Carlsen, R.K.; Khatir, D.S.; Jensen, D.; Birn, H.; Buus, N.H. Prediction of CKD Progression and Cardiovascular Events Using Albuminuria and Pulse Wave Velocity. Kidney Blood Press Res. 2023, 48, 468–475. [Google Scholar] [CrossRef]
- Azukaitis, K.; Kirchner, M.; Doyon, A.; et al. Arterial Stiffness and Chronic Kidney Disease Progression in Children. Clin J Am Soc Nephrol. 2022, 17, 1467–1476. [Google Scholar] [CrossRef] [PubMed]
|
Disclaimer/Publisher’s Note: The statements, opinions and data contained in all publications are solely those of the individual author(s) and contributor(s) and not of MDPI and/or the editor(s). MDPI and/or the editor(s) disclaim responsibility for any injury to people or property resulting from any ideas, methods, instructions or products referred to in the content. |
© 2024 by the authors. Licensee MDPI, Basel, Switzerland. This article is an open access article distributed under the terms and conditions of the Creative Commons Attribution (CC BY) license (http://creativecommons.org/licenses/by/4.0/).