
Submitted:
11 November 2024
Posted:
12 November 2024
You are already at the latest version
Abstract
The inability of geophysical methods to directly detect gold ore bodies remains a hot topic in the realm of gold geophysical exploration. Through the analysis of high-precision magnetic method, resistivity and induced polarization methods with the gradient arrays, electrical resistance tomography , and well logging, combined with the discovery of gold mineralization in exploration trenches and boreholes, it has been found that gold mineralization in the andesite distributed area can be classified into two types: terminal and channel. The terminal-type gold mineralization is marked by a buried depth of less than 30m, accompanied by varying degrees of silicification and pyritization. In contrast, the channel-type of gold mineralization is buried deeper than 30m and occurs within structural fractures or volcanic breccia mineralized alteration zones. The resistivity difference constitutes a significant geophysical indicator differentiating these two types of gold mineralization. Both types of gold mineralization are located adjacent to high-polarization anomaly areas, potentially suggesting characteristics of low-sulfur gold mineralization. These research results provide geophysical technical support for breakthroughs in the exploration of low-sulfide epithermal gold deposits and represent a valuable exploration in the field of directly detecting such gold deposits using geophysical methods.
Keywords:
Epithermal gold deposit
; Low sulfide type
; Integrated geophysical exploration
; Well logging
; Hydrothermal alteration
; Geophysical characteristics of gold ore bodies
1. Introduction
The epithermal gold deposits generally have a metallogenic depth of less than 1 - 2 km and a metallogenic temperature typically lower than 300 °C. Genetically, they are related to shallow and ultra - shallow intrusive activities as well as terrestrial volcanic and sub - volcanic activities. They often develop around multi - stage intruded intermediate and acidic rock masses [1] and can be part of the porphyry metallogenic system [2]. Epithermal gold deposits can be categorized into low - sulfidation, intermediate - sulfidation, and high - sulfidation types. The low - sulfidation type pertains to the near - neutral metallogenic fluid, in contrast to the relatively acidic high - sulfidation type. Globally, epithermal gold deposits are mainly located in the three giant metallogenic domains, namely the Circum - Pacific Metallogenic Belt, the Tethys Metallogenic Belt, and the Laurussia Metallogenic Belt, and possess significant research and economic value [3,4,5].
The genesis of epithermal gold deposits is described as follows: The ore-forming fluids dissolved from porphyry bodies migrate upward along faults or rocks with good permeability, mix with meteoric water, and are replaced and filled in suitable underground metallogenic spaces to form gold deposits. The alteration characteristics include porous silicification, sericite-illite-montmorillonitization, etc., as well as alterations such as alunite and kaolinite [6,7,8,9]. The industrial cut-off grade of gold orebodies is typically within the range of 0.3 to 0.6 g/t [10]. Due to the extremely low gold content, the variance in gold element content does not induce physical parameters differences in rocks and ores, nor is it sufficient to generate conspicuous geophysical anomalies. Hence, direct geophysical exploration of gold orebodies is not feasible. The mineralization process of gold orebodies is significantly controlled by specific geological conditions and the physical and chemical alterations that gold-bearing hydrothermal fluids exert on geological bodies during their migration. This constitutes the main entry point for geophysical exploration of such deposits. The hydrothermal alteration caused by low-temperature epithermal fluids leads to a reduction in the magnetic susceptibility of rocks. Silicification can notably increase the density and resistivity of porous volcanic rocks. Argillization can decrease the resistivity of most volcanic rocks by one to two orders of magnitude. Sulfides (predominantly pyrite) feature low resistivity and high polarizability. Therefore, geophysical responses related to mineralization, such as surrounding rocks, faults, alterations, and associated minerals, can be investigated [11,12,13,14,15,16,17]. The electrical resistance tomography(ERT) method has certain effects in detecting shallow gold mineralization bodies, ore-controlling and ore-hosting structures [18,19]. Currently, certain information regarding epithermal gold deposits can be obtained through geophysical methods to support the optimization of target areas and the deployment of well locations [14,20,21,22]. However, systematic studies from surface geophysics to in-well geophysics have rarely been published, and the geophysical characteristics of low-sulfidation epithermal gold orebodies have not been reported.
The Alinghe Mine Area is located on the south bank of the Heilong River in Heilongjiang province, China, and lies within the Duobaoshan-Heihe Cu-Mo-Au-Fe-Zn metallogenic belt. The main types of deposits within the metallogenic belt are porphyry copper deposits and epithermal gold deposits, making it an excellent area for studying epithermal polymetallic deposits [23,24,25,26]. The study area has undergone a systematic ground geophysical exploration, and the trenches and verification drill holes, one of which performed logging work at a steep angle, have discovered multiple gold mineralization bodies, providing comprehensive data on the geophysical characteristics of low-sulfide epithermal gold deposits. This study is the first to divide low-sulfide epithermal gold mineralization bodies into two types based on the combination of polarization, resistivity, and magnetization anomalies and their geological features, and conducts an analysis of the geophysical and geological characteristics of the surrounding rocks, alteration zones, and gold mineralization bodies, providing useful exploration for directly using geophysical methods to detect such gold deposits.
2. Geological and Geophysical Characteristics of Alinghe Mining Area
2.1. Geological Features
The Alinghe mining area is located on the south bank of Heilong River in China, also known as the Amur River in Russia. It’s tectonic location is in the eastern part of the Xingmeng-Tianshan orogenic system. The Nen River-Balihan fault, which is the separation fault of the Songliao Basin or the west-margin basin control fault, and the Hegenshan-Heihe suture Belt (HHS), which is the convergence belt of the Xing ‘an Block (XB) and Songnen-Xilinhot Block (SXB), meet in the northwest of the study area (Figure 1) [27,28]. The Duobaoshan-Heihe metallogenic belt is an area with long metallogenic span and complex mineralization processes, forming the largest porphyry Cu-Mo-Au metallogenic system in Northeast China [29]. In the Alinghe mining area, the Lower Cretaceous is mainly composed of the Longjiang Formation (K1l) andesite and andesitic volcanic breccia, and the Lower Cretaceous Guanghua Formation (K1gn) rhyolite and rhyitic volcanic breccia. As a part of the Duobaoshan-Heihe metallogenic belt, mineralization belongs to the Late Jura-Early Cretaceous volcanic-intrusive magmatic hydrothermal Au-Ag metallogenic series [30].
2.2. Geophysical Characteristics of Rock
In terms of physical parameters work, this study collected previous research results on magnetic susceptibility and electrical resistivity [31,32,33], and conducted tests on the magnetic susceptibility, electrical resistivity, and polarization of some rock and mineral samples. The magnetic susceptibility measurement was conducted using the KT-10 v2 magnetic susceptibility meter designed and produced by Terraplus Canada and Georadis S.R.O. of the Czech Republic. The KT-10 v2 can measure the magnetic susceptibility of uneven rock surfaces and has the advantages of high precision and easy operation. The measurement range of the instrument is 1×10⁻⁶SI to 999×10-3SI, and the working frequency is 10kHz. The electrical measurement was conducted using the SCIP rock electrical parameter measurement instrument produced by GDD Canada. The voltage measurement resolution of the instrument is 1μV, with an accuracy of 0.2%; the current measurement resolution is 1nA, with an accuracy of 0.2%; and the polarization measurement resolution is 1µV/V, with an accuracy of 0.38%. The measurement results were statistically analyzed, and the geometric mean and arithmetic mean were calculated according to the standard requirements and are shown in Table 1.
In the above table, the order of rock magnetism from large to small is andesite basalt > intact andesite > broken andesite > andesite volcanic breccia > rhyolite. This result shows that the magnetic susceptibility is roughly positively correlated with the content of dark minerals. In terms of resistivity, the order from large to small is andesite > intact andesite > rhyolite > andesite volcanic breccia > broken andesite, which shows that the resistivity is affected by lithology and production state (degree of fragmentation, porosity, etc.). The results of rock physical parameters test show that there is a positive correlation between polarizability and magnetic susceptibility in the study area.
Hydrothermal mineralization has a certain effect on physical properties. In terms of magnetism, the magnetic susceptibility of altered andesite and andesite volcanic breccia is significantly lower than that of unaltered andesite and andesite volcanic breccia, which indicates that ore-forming hydrothermal fluid has demagnetized the rocks. In terms of electrical resistivity, the resistivity of silicified andesite is significantly increased compared with that of primary rock. In terms of polarizability, the study area is of low vulcanization type, and the polarizability of the mineralized rocks has increased compared with the original rocks, but it is not significant.
3. Geophysical Methods
Comprehensive geophysical exploration work has been carried out around the existing geochemical gold anomalies in the study area, including the high-precision magnetic method, the resistivity and induced polarization(IP) method with the gradient arrays, and electrical resistance tomography (ERT) with a pole distance of 10m. According to the comprehensive geological and geophysical research results, exploratory trench(ET) and the drilling verification work was carried out, among which the borehole BH-1 with the largest dip angle was carried out multi-parameter logging work. The other boreholes could not be logged because of their small dip angle and the accident of stuck probe pipe caused during the trial logging. It should be noted that due to different measurement methods, the apparent amplitude frequency (Fs) and apparent charge rate respectively measured by IP and ERT reflect the strength of the induced polarization effect of geological bodies, and their physical nature is the same as that of the apparent polarization [34,35,36].
3.1. High-Precision Magnetic Method
Magnetic exploration is a geophysical method to analyze and study the distribution form of geologic bodies and orebodies by observing the magnetic field value of rocks at ground height, which is widely used in the field of geological mineral investigation and gold exploration [20,37]. The magnetic method was measured by 6 sets of GSM-19T proton magnetometers produced by GEM of Canada. The measuring accuracy of the instrument reaches 0.1nT, the absolute accuracy reaches 0.2nT, and the final measuring accuracy less than 5nT meets the specification requirements of high-precision magnetic measurement. The measuring line direction is 90°, and the measuring network is 50×20m. A total of 14,263 observation points were completed.
Data processing mainly includes the steps of daily variation correction, base point correction, height correction, latitude correction, etc.
3.2. IP Method with the Gradient Arrays
The IP method is one of the conventional electrical methods, and two parameters of apparent resistivity (ρs, Ω·m) and apparent polarizability (ηs, %) can be obtained. The gradient arrays is a commonly used observation system for scanning surfaces by IP method. In this method, the two power supply electrodes are fixed, and the measurement electrode moves in the middle range of AB, usually 1/2~1/3AB distance. In this survey, SQ-5 dual-channel instrument produced by Geosun Hi-technology Co., Ltd. was used for field measurement. The instrument is a frequency domain measurement and has been applied well in gold exploration [38]. The measurement parameters are high frequency potential difference ΔUG (mV), low frequency potential difference ΔUD (mV), power supply current IAB (mA), and apparent amplitude frequency rate(Fs, %). After the test, the frequency of the instrument selected for this measurement is 2 with working frequency is 2Hz and 3/13Hz, the network is 50m×10m (line distance × point distance), the power supply distance AB is 800m, and the measurement distance MN is 20m. A total of 1020 measuring points were completed.
Apparent amplitude frequency rate can be measured directly. Apparent resistivity is calculated from the potential difference, current and device parameters measured directly in the field. Other data processing mainly includes eliminating abrupt points and drawing contour map.
3.3. ERT
The principle of electrical resistance tomography (ERT) is the same as that of traditional DC/IP sounding method, and two parameters of apparent resistivity and apparent charge rate can be obtained. Its characteristic is that dozens to hundreds of electrodes can be deployed at the same time, and the data can be automatically collected, so the information is large and the work efficiency is high. The reliability of the inversion results for the characterization of underground electrical property and polarizability in a certain depth is much higher than that of the traditional electrical measurement. Its disadvantage is that the detection depth is relatively shallow compared with other electrical methods, usually within 100m of the depth. The detection depth meets the requirements of the gold deposits, so this method can be used. The instrument used in this ERT field work is the SuperSting-R8 automatic resistivity and IP system produced by AGI Company of the United States. After the test, the preset power supply time of this measurement was 2 s, repeated measurement twice, repeated measurement error < 2%, Wenner device, electrode distance 10m.
Data processing includes appropriate processing of the mutation points and repeated observation error points. The data are processed and reversed by EarthImager2D software. The 2-D inversion algorithm uses Occam inversion, also known as Smooth model inversion. In the inversion process, the forward method is finite element method, the forward solver is Cholesky decomposition, and the boundary conditions are Dirichlet. The initial resistivity inversion model uses a pseudo-cross-section with a maximum mean square error of 3%. Linear induction polarization inversion method is used for apparent charge rate inversion, and both the slippery coefficient and damping coefficient are 10.
3.4. Well Logging
Well logging is the key technology of communication between surface geophysical exploration and geological drilling, and provides the basis for the division of underground rock and mineralized layer. The JHQ-PSK-2 logging system produced by Shangkuang (Hebei) Technology Co., LTD was used in this logging. Logging items mainly include a variety of logging parameters such as borehole diameter, well fluid resistivity, SP, natural gamma, dual lateral resistivity, polarisability, magnetic susceptibility logging, etc. The parameters related to this study are as follows:
Dual lateral resistivity logging: two apparent resistivity curves, deep and shallow, can be provided, in which the deep resistivity curve mainly reflects the resistivity of the original rock formation, and the shallow resistivity curve mainly reflects the formation resistivity of the well fluid intrusion zone, as well as the different width, location and occurrence of fractures in the rock formation [39]. Deep resistivity curves are used in this analysis.
Polarizability logging: Measuring this polarizability electromotive force by feeding an current field to the rock formation is polarizability logging. The magnitude and variation of polarizability are related to the chemical composition of the constituent rock ore, the mineral structure and the properties of the solution deep in it. In the rocks rich in pyrite, there will be high polarizability anomalies.
Magnetic susceptibility logging: the solenoid with iron core in the probe tube forms a closed magnetic flux loop with the rock formation in the drilling hole. The change of magnetic susceptibility of rock formation will cause the change of self-inductance, so as to measure the change of magnetic susceptibility of rock formation.
The processing of logging data mainly includes depth correction, outlier removal, data smoothing, and interpretation based on curve and crossplot.
4. Geophysical Characteristics of Gold Mineralized Bodies
4.1. Gold Mineralized Bodies Discovered in Exploratory Trench and Borehole
The discovered gold mineralized bodies include those exposed by exploratory trench and boreholes (see Figure 1b for locations). The rock and ore samples were tested by the laboratory of Harbin Center for Integrated Natural Resources Survey, China Geological Survey. In general, the highest grade of gold is 21.3g/t, the sulfide content is low (<0.5%), and it is a low sulfide type.
The borehole BH-1 was drilled at 320° azimuth and 80° inclination. The actual drilling lithology is mainly andesite, andesitic volcanic breccia, with fracture zone developed, partial silicification, pyrite phenomenon. Six gold mineralized bodies were delineated within the depth of 100m. The location and grade of the gold ore bodies are shown in Figure 6. A small amount of pyrite is disseminated and a small amount of quartz veins are distributed in the altered Andesitic volcanic breccia.
The borehole BH-2 was drilled at 320° azimuth and 70° inclination. The actual drilling lithology is mainly andesite, andesitic volcanic breccia, containing a small amount of tuff, the ore body found silicified quartz veins, stellate pyrite. One ore body was drilled from 44.8-48.85m, and the gold grade reached 21.30×10⁻⁶, which is the highest grade gold ore body found in this survey.
The borehole BH-3 was drilled at 320° azimuth and 70° inclination. The actual drilling lithology is andesite, which can be metamorphosed and veined silicification, carbonated and pyrite altered. From 31.35 to 76.25m, four gold mineralized bodies were discovered, with gold grades ranging from 0.14 to 1.5×10⁻⁶.
The borehole BH-4 revealed rock assemblages similar to BH03, mainly andesite-dominated andesitic volcanic breccia with a small amount of tuff. It was revealed that the primary rocks of many fracture zones are andesite, in the form of fragments, mud, silicified quartz veins, and stellate pyritization. Five gold mineralized bodies were found from 22.2m to 92.4m, with gold grades ranging from 0.1-4.54×10⁻⁶.
Through exploratory trench, it was revealed that the average gold grade of the ET-1 sample in the RI-2 area was 4.89 × 10⁻⁶, and the NE-trending gold mineralization alteration zone has been delineated.
4.2. Magnetic Field Characteristics of the Mining Area
First of all, the overall variation characteristics of magnetic field △T in the study area (Figure 2) are gentle changes mixed with complex fluctuations, which reflects the distribution of different lithologies. According to the characteristics of the magnetic field distribution in the study area, it can be divided into three anomaly regions: medium-high anomaly region, gentle low anomaly region and local superimposed anomaly region.
- Medium-high magnetic anomaly region: It is mainly distributed in the north of the study area, and the field values basically vary within 0~800nT, with low anomaly segmentation mostly in the south and west, and high anomaly segmentation mostly in the north and east. Geological data show that the andesite of Longjiang Formation(K1lα) is mainly distributed in this area, which is the main reason for the middle-high anomaly area in this area.
- Gentle low magnetic anomaly area: mainly distributed in the southern part of the study area, the field value basically changed within -200~600nT, the magnetic field changes were relatively gentle in general, and there were local high and low anomaly areas. Geological data show that the acidic rhyolite of Guanghua Formation(K1gn) is mainly distributed in this area, which is the main reason for the gentle low magnetic anomaly in this area.
- Local superimposed anomaly area: Within the above two major magnetic anomaly areas, the scattered high-value area is the Ganhe Formation basalt(K1g), which is mainly distributed in the northern part of the working area. There are some differences between this type of magnetic anomaly and the mapping unit. It is speculated that due to the limited outcrop in the coverage area, the reliability of the magnetic anomaly should be greater than that of the mapping results dependent on rotating stone. The conglomerate rocks of Sunwu Formation(N1-2S) are mainly distributed in the north and relatively in the low-value area.
In the connecting area of the two major magnetic anomalies, the high and low anomalies appear alternately. The corresponding geological map is the junction of andesite and rhyolite, where all the existing soil gold anomalies are located. Boreholes BH-1 and BH-2 where gold ore bodies were found have the most obvious strip-high and low magnetic anomalies, while the magnetic anomalies at boreholes BH-3 and BH-4 are relatively low, and ET-1 where gold ore bodies have been found is the lowest. In the analysis of binding properties, the low magnetic anomalies may be hydrothermal alteration zones [11]. The highest magnetic field value is 1124nT, the lowest is -430nT, and the difference is 1554nT, indicating that the demagnetization of the hydrothermal solution can reach 1000nT. This is consistent with the research results of magnetic anomalies in the Gaosongshan gold deposit, which belongs to the Duobaoshan-Heihe metallogenic belt and the surrounding rock is also andesite and belongs to the low-sulfide epithermal gold deposits [40]. The low position of the ore body was found to be lower in the southeast direction, which may indicate that the regional hydrothermal activity is stronger in the southeast direction.
4.3. Electrical Characteristic in the Plane of the Mining Area
The results of apparent resistivity and apparent amplitude frequency measured by IP method in the study area, as well as geological, physical and magnetic measurements show that the study area has the following characteristics:
- ERT-1 region: The overall trend of the apparent resistivity anomaly is consistent with the overall trend of the magnetic anomaly, both of which are high-low phase distribution in the northeast direction. The trend and distribution range of the low apparent resistivity region R1 (Figure 3a) and the magnetic low anomaly region (Figure 2) are basically consistent. The high resistivity anomaly area outside R1 is basically the same as the high magnetic anomaly area. Considering that the lithology in this area is andesite, and the resistivity of the low-resistance area is less than 200Ω·m, it is presumed to be a magmatic hydrothermal channel, which has weathered into a water-bearing fracture zone near the surface. The abnormal area P1(Figure 3b) with high apparent amplitude frequency ranges from 2% to 2.9%, the abnormal width is about 100m, and the length basically runs through the test area without sealing. The anomaly area with high polarizability is located in the southeast side of the andesite fracture zone and is relatively dispersed. The two boreholes where gold mineralized bodies were found are located in the relatively high polarizability distribution area on the southeast side of the andesite fracture zone, among which the gold ore body discovered by the Borehole BH-2 with a grade of 21.30×10⁻⁶ is the highest gold grade in this study and is located at the edge of the highly polarized body.
- ERT-2 region: This region is different from ERT-1 in that there are high resistance R2 (Figure 3c) and high polarizability anomaly P2 in the northest-trending surface (Figure 3d). The exploratory trench (see Figure 1b and Figure 3 for the location) revealed that it is gold-bearing silicized andesite with an average grade of 4.89×10⁻⁶ (Figure 4). On the south side of R2 and P2, there is a polarizability anomaly in P3, but its resistivity is relatively low, suggesting that P3 has a different origin from P2. The subsequent boreholes BH-3 and BH-4 found gold ore bodies of industrial grade.
The above results show that the combination of geophysical anomalies in the gold ore body in this area is complicated, but it has certain rules, and further surface sounding and logging work should be carried out to identify the genesis and geophysical characteristics of different types of ore bodies.
4.4. Electrical Characteristic in the Vertical Section
In order to determine the vertical distribution pattern of the aforementioned plane geophysical characteristics, we carried out two ERT’s lines which positions are shown in Figure 1b. The 2-D inversion results obtained from ERT-1 survey line indicate that the apparent resistivity within a depth of 30m in the shallow section of the profile is consistent with the apparent resistivity diagram observed on the IP method (Figure 3 and Figure 5). This outcome suggests that the apparent resistivity observed on the IP method primarily reflects a comprehensive representation of a depth up to 30m within our study area. Along this line, between distances of 500~300m, there exists an inclined low resistance zone towards southeast direction. By integrating geological mapping data, it can be inferred that this low resistance zone corresponds to water-rich broken andesite (Figure 5a). Furthermore, this low resistance band aligns with regions exhibiting lower magnetic anomaly values. The extension of this low resistance band downwards tends to distribute towards southeast at depths ranging from 20 to 90m, where local anomalies indicating higher charge rates are relatively steep (Figure 5b). Consequently, it is further deduced that there exists a hydrothermal alteration channel beneath the water-fractured andesite region in southeastern side which also supports gold mineralization discoveries made in surface alteration zones located on its southeastern side as well. Therefore, based on abnormal combination characterized by low magnetism, low resistance and high charge rate anomalies; it can be inferred that these areas represent favorable mineralization zones - an inference which is also substantiated by the borehole BH-1 findings (See also in Section 4.1 of this paper, Figure 6).
The strike of the ERT-2 line which position shown in Figure 1b is consistent with the strike of the resistivity anomaly R2 which position shown in Figure 3c. The inversion results show that the depth influence range of resistivity anomaly R2 is not more than 20m. Trough probe ET-1 indicates that the lithology of the abnormal combination of high resistivity and high polarization or charge rate within 20m of the surface layer is silicified andesite (Figure 4 and Figure 5c,d). The boreholes BH-3 and BH-4 see also in section 4.1 of this paper shows that the low electricity-low polarizability combination and the medium electricity-high polarizability combination below the shallow high resistivity and high polarizability combination are also gold mineralized bodies with different grades. The above results indicate that there are abundant gold resources in this area. However, for some reasons, the ERT’s line that has been drilled and is in the same direction as the drilling hole cannot be implemented, as well as the necessary logging work. The specific spatial distribution characteristics of gold mineralized bodies in this area need to be further ascertained.
4.5. Well Logging Data Analysis
Previous studies on well logging data in gold deposits mainly focused on the medium-high sulfur type consistent with the distribution of gold ore bodies and pyrite bodies [41,42,43], however, the well logging response of low-sulfur epithermal gold deposits and its comparison with the surface electrical inversion profile have not been published publicly. In this study, depth correction and abrupt change processing of log curves are carried out first, and then the log response characteristics of various lithology, alteration and ore-bearing horizon are analyzed with reference to the data of core recording and experimental testing, so as to guide the surface geophysical prospecting work.
4.5.1. Basic Characteristics of Borehole BH-1 Drilling Lithology and Logging Curve
Because too small dip Angle of borehole will cause logging pipe stuck, only the borehole BH-1 with large dip Angle is well logged in this survey. First of all, according to the lithology catalog results, the lithology encountered by the borehole BH-1 is relatively simple, which can be divided into the following 6 sections (Figure 6):
- From 0 to 5.23 m is surface soil, no logging curve.
- From 5.23 to 17.75 m, the andesites are gray-black and gray-green, with magnetic susceptibility values of 1300 to 1500×10-4SI, with an average value of 1330×10-4SI. The resistivity ranges from 310 to 490Ω·m, with an average value of 435Ω·m. The polarizability was 0.1%~0.6%, with an average value of 0.35%. It is characterized by a combination of high susceptibility, high resistivity and low polarizability.
- From 17.75 to 81.45 m is gray and gray-green andesitic breccia. The origin of breccia may be volcanic or tectonic. The magnetic susceptibility ranges from 1150 to 1500×10-4SI, with an average value of 1200×10-4SI. The resistivity ranges from 100 to 500Ω·m, with an average value of 190Ω·m. Polarizability values ranged from 0.74 to 3.7%, with an average value of 2.05%. Although the lithology of this section is single, the magnetic susceptibility, resistivity and polarizability vary according to different laws in depth, which is presumed to be caused by different degrees of fractures, alteration and pyritization. The gold mineralized bodies drilled are located in this lithologic section, and are also the key analysis positions in the crossplot of logging curves below.
- From 81.45 to 95.27 m is light grayish green andesite with a magnetic susceptibility of 1200~1400×10-4SI with an average value of 1320×10-4SI and a resistivity of 130~220Ω·m with an average value of 182Ω·m. Polarizability values range from 2.12 to 4.5%, with an average of 3.5%. Compared with section 2, they have the same lithology and similar magnetic susceptibility, but the resistivity of this section is relatively low, which is presumed to be caused by different silicification degrees.
- From 95.27 to 102.51 m is a mud-like structural fracture zone, the original rock is andesite, the magnetic susceptibility value is 1150~1300×10-4SI, the mean is 1190×10-4SI. The resistivity ranges from 100 to 170Ω·m, with an average value of 122Ω·m. Polarizability values ranged from 1.2 to 1.7%, with an average value of 1.5%. This section presents a typical combination of low susceptibility, low resistivity and low polarizability.
- From 102.51 to 110 m is grain-green andesite with magnetic susceptibility of 1300~1500×10-4SI, with an average value of 1400×10-4SI. The resistivity ranges from 350 to 850Ω·m, with an average value of 680Ω·m. Polarizability values ranged from 1.4 to 2.2%, with an average value of 1.8%. It is a typical combination of high susceptibility, high resistivity and low polarization. Compared with section 4, although the lithology is the same, the physical parameters combination characteristics of this section indicate that the degree of mineralization and alteration in this section is the least in the borehole.
Figure 6.
Main logging curves and results of the borehole BH-1.
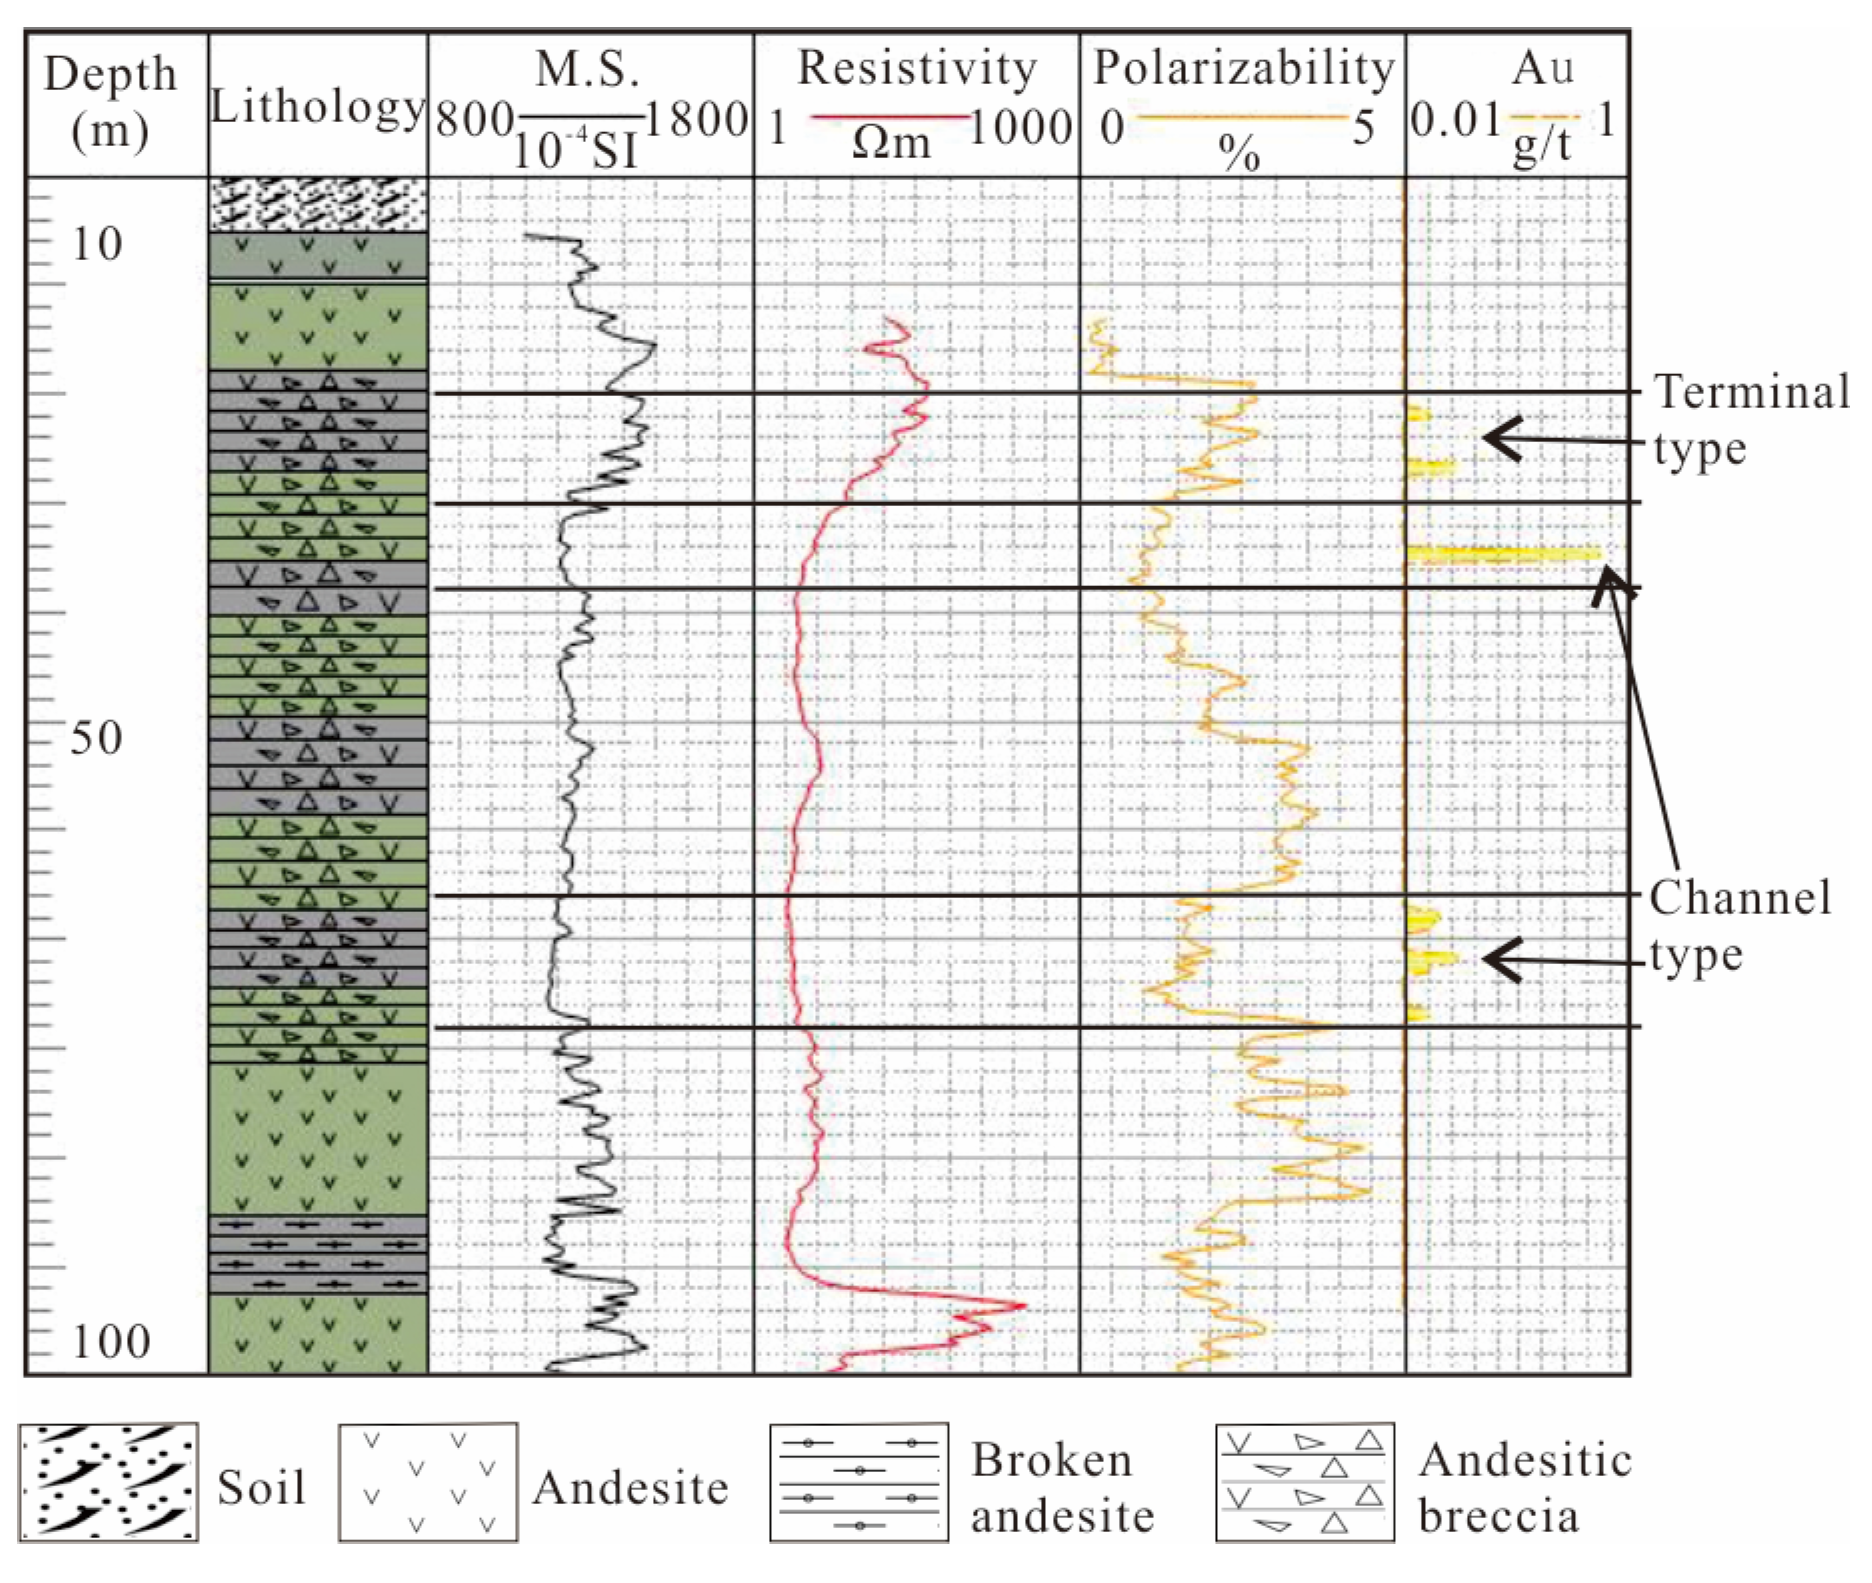
Crossplot analysis of the borehole BH-1’s log values further reveals the geological-geophysical characteristics of the drilled rock and ore layer.
4.5.2. Geophysical Characteristics of Surrounding Rock
From the resistivity and magnetic susceptibility cross plot of the main lithology sections of surrounding rock (Figure 7a), it can be seen that there are three main lithology types corresponding to three logging parameter combinations:
- Andesite: The log curve is characterized by high resistivity and high magnetic susceptibility, indicating that it is less affected by hydrothermal.
- Broken andesite: The log curve is characterized by low resistivity and low magnetic susceptibility, indicating that the broken andesite has low resistance after containing water and has been demagnetized after being affected by hydrothermal.
- Andesitic volcanic breccia: The logging curves are characterized by low resistivity and medium magnetic susceptibility, but the overall value and distribution range are slightly higher than the andesite fracture zone. The results show that the different structure, lithology and hydrothermal activity state of andesite have certain regularity.
4.5.3. Geophysical Characteristics of Andesitic Volcanic Breccia
Further analysis of the andesitic volcanic breccia (Figure 7b) shows that the resistivity and magnetic susceptibility are both decreased compared with the unaltered ones. This indicates that the degree of silicification in the drilling alteration zone is weak and the resistivity has not been significantly increased.
4.5.4. Geophysical Characteristics of Gold Mineralized Bodies
It can be seen from the cross plot of resistivity - polarizability - magnetic susceptibility (Figure. 7c) of the borehole BH-1’s gold section that the intact andesite without altered mineralization is characterized by a combination of high resistivity, low - medium polarizability and high magnetic susceptibility. The modified andesitic volcanic breccia is rich in pyrite and contains gold ore bodies, which is characterized by the combination of high polarizability, low resistivity and low magnetic susceptibility.
The geophysical characteristics of gold ore bodies are clearly divided into two types (Figure 6 and Figure 7c). The relatively shallow (less than 30m) gold-bearing parts showed a median resistivity distribution (300-500 Ω·m), a median polarizability distribution (0.3-0.6%), and a low-median magnetic susceptibility distribution (1300-1500×10-4SI). The overall combined characteristics were medium resistivity, medium polarizability, and low-medium polarizability. This type of gold ore body is located under the shallow intact andesite (Figure 5a and Figure 6), which is presumed to be caused by the gold-bearing hydrothermal solution encountering the relatively intact andesite or groundwater mixing in the upper part, so it is divided into hydrothermal terminal-type gold mineralization body. A significant feature of hydrothermal terminal gold mineralized bodies in this borehole is that there are obvious anomalous combinations of high resistivity and high magnetic susceptibility above the ore body, and gradient variation zones below the anomalous combinations (Figure 5a and Figure 6). This reflects the gradual change of physical properties of surrounding rock caused by hydrothermal solution. The gold ore bodies of silicified andesite type in the RI-2 area have a similar variation trend compared with the channel-type due to their spatial location and geophysical combination characteristics, so the gold ore bodies of silicified andesite type in this paper will be classified as the terminal-type. The gold ore bodies of silicified andesite type in the RI-2 area were formed in the open space by the gold and silicon hydrothermal fluid overflowing from the underground passage, which was not denuded in the later period. Compared with the gold ore body discovered by the borehole BH-1, the silicified andesite type gold ore body has stronger silicification and pyritization, so the corresponding resistivity and polarizability are also higher.
Therefore, the terminal-type can be subdivided into two cases, the gradual mineralization of surrounding rock in a closed space, such as exposed gold ore body in the borehole BH-1. And open space on the surface, such as gold ore bodies were uncovered in exploratory trench.
Therefore, the terminal-type can be further subdivided into two cases. The first is the gradual mineralization of the surrounding rock in a closed space, such as the two gold mineralized bodies revealed by the borehole BH-1 (Figure 6). The second type is the gold mineralized body formed in the open space of the surface, such as the high-grade gold mineralized body revealed in the RI-2 area trough exploration trench (Figure 5a,c).
For the relatively deep gold-bearing parts larger than 30m buried depth, the resistivity distribution is low (100-180 Ω·m), the polarizability distribution is low-median (0.6-2%), and the magnetic susceptibility distribution is low-median (1200-1400×10-4SI). The overall combined characteristics are low resistivity, low - medium polarizability and low - medium magnetic susceptibility. Because they are located in the hydrothermal alteration zone (Figure 6), they are classified as hydrothermal channel type gold mineralized bodies. Compared with the terminal-type, its geophysical characteristics mainly lie in its significantly low resistivity, and the low and medium polarizability of the gold ore body is distributed in the high polarizability anomaly side.
In this study, the andesitic volcanic breccia with the highest polarizability is relatively rich in pyrite but has no gold ore body. It is indicated that the gold ore body is located outside the high polarizability anomaly, although the high polarizability anomaly can not directly indicate the gold ore body, it also has important prospecting significance.
5. Discussion
At present, it is not possible to directly explore for gold ore bodies with geophysical methods, but it is possible to indirectly search for gold by utilizing various geological factors related to gold deposit formation and containing, such as mineralization alteration, surrounding rock, fracture, etc., resulting in changes in magnetic field, resistivity and polarizability. The geophysical exploration methods of hydrothermal gold deposits are mainly associated with gold ore body and pyrite, which results in high polarizability. However, the low-sulfide epithermal gold deposits does not have the characteristics of higher polarizability compared with non-ore bodies. Alinghe mining area is an excellent area for the low-sulfide epithermal gold deposits by geophysical methods: The relatively single lithology, structural conditions and relatively abundant alteration and mineralization revealed by the surface and borehole in the study area provide a relatively simple geological background and a relatively clear conclusion for the study of the occurrence conditions of epithermal gold ore bodies in this paper, so provide a reference for the study of other areas with complex geological conditions.
The banded low magnetic anomalies in the andesite distribution area reflect the demagnetization of hydrothermal alteration and indicate the existence of alteration area. Therefore, the exploration of this type of gold deposit should first focus on the area with the same lithology but significantly lower magnetic susceptibility in the geological mapping area to find out whether it is caused by hydrothermal alteration. For the low anomalies caused by the demagnetization of the altered zone detected by magnetic method, the resistivity characteristics can be further identified by using the IP method with the gradient arrays, and the distribution of the altered zone can be judged from the plane with multiple parameters, thus narrowing the gold exploration target area. Although the planar distribution of low resistivity anomaly and low magnetic anomaly is basically the same, the cause is different geophysical response during the same hydrothermal activity. Because the detection depth of magnetic method and IP method is limited and it is difficult to separate vertical anomaly superposition, it can be significantly detected only when the alteration zone has been denuded to the near surface.
The andesite hydrothermal alteration zone where the channel-type gold mineralized bodies are located has the characteristics of banded low magnetic and low resistivity combined anomalies, and their distribution is basically consistent. The low magnetic anomaly reflects the demagnetization caused by hydrothermal alteration. The decrease of magnetic susceptibility of andesite surrounding rock caused by hydrothermal temperature can reach 1000nt. Therefore, the exploration of gold deposits in this area should first pay attention to the areas with the same lithology but obviously low magnetic susceptibility and accompanied by the same low resistivity on the geological map to find out whether it is caused by hydrothermal alteration.
It can be seen from the ERT lines in different directions that the distribution of gold mineralized bodies has obvious spatial distribution differences, and it is recommended to implement geophysical survey lines that have been drilled and strike in the same direction as the borehole. And to further carry out detailed three-dimensional geophysical exploration, to study the relationship between resistivity, polarizability and orebody distribution in three-dimensional space, is conducive to the next exploration and discovery of mining area.
The gold mineralized bodies found in this study are inconsistent with the high polarizability region. This may be related to the evolution of pyrite and gold with the decrease of temperature and other physical and chemical conditions of ore-forming fluid [44]. The further study of this scientific problem cannot be solved by geophysical method itself, and it is necessary to carry out rock geochemical research to clarify the relationship between pyrite and gold ore body, so as to enhance the guiding significance of using polarizability anomaly to find gold ore body. The spatial distribution difference between the gold mineralized bodies and pyrite may be the geophysical characteristics of the low-sulfur epithermal gold deposits, indicating that such gold mineralized bodies are located at the end of the porphyry-epithermal metallogenic system [4], and have great prospecting potential in the deep part of the study area.
6. Conclusions
As far as the current research level is concerned, the following research conclusions have been formed:
- There is no specific combination of geophysical anomalies in the low-sulfide epithermal gold ore body itself, but firstly, it is formed in the underground channel of specific structure and lithology, and produces demagnetization on the magnetic substances contained in the surrounding rock. Secondly, the silicified and pyritized substances produced when gold elements are precipitated from the hydrothermal solution, thus having certain geological and geophysical laws. It is necessary to comprehensively analyze the geophysical characteristics of gold ore body based on the type of gold ore body, the properties of surrounding rock and its spatial relationship with alteration zone and mineralization zone, so as to realize the success of spatial distribution prediction and exploration of gold mineralization body.
- The results of this study indicate that the epithermal gold mineralized bodies can be divided into channel-type and terminal-type due to their different spatial distribution positions and geophysical characteristics. The terminal-type gold mineralized bodies in the study area are buried less than 30m, located under the shallow intact andesite that is not affected by hydrothermal solution, or overflow from the surface, and have the characteristics of geophysical combination anomalies with medium resistivity, medium polarizability and low - medium polarizability. The buried depth of the channel-type is generally greater than 30m, located in the andesite volcanic breccia or structural fracture andesite alteration channel, with low resistivity, low - medium polarizability and low - medium magnetic susceptibility geophysical combination anomaly characteristics. The low and medium polarizability of the gold ore body is distributed on the side of the high polarizability anomaly.
Author Contributions
Conceptualization, Q.Y. and K.W.; methodology, Q.Y. and K.W.; software, Q.Y. and T.S.; validation, T.S., G.T. and Y.J.; formal analysis, Q.Y., H.Y. and K.W; investigation, K.W., H.C., Y.S., and Q.L.; resources, T.S., Y.J., and H.Y.; data curation, Q.Y. and T.S.; writing—original draft preparation, Q.Y.; writing—review and editing, G.T.; visualization, T.S.; supervision, K.W.; project administration, Q.Y.; funding acquisition, Q.Y. All authors have read and agreed to the published version of the manuscript.”.
Funding
This research was funded by the funding project of Northeast Geological S&T Innovation Center of China Geological Survey (NO.QCJJ2022-3) and Geological survey project of China Geological Survey (No.DD20230395).
Data Availability Statement
The data that support the findings of this study are available from the corresponding author upon reasonable request.
Conflicts of Interest
The authors declare no conflicts of interest.
References
- Hedenquist, J.W.; Lowenstern, J.B. The role of magmas in the formation of hydrothermal ore deposits. Nature 1994, 370, 519–527. [Google Scholar] [CrossRef]
- Rui, Z.; Huang, C.; QI, G. Chinese porphyry copper deposits. Geology Press: Beijing, China, 1984; pp. 254–260. (In Chinese with English Abstract).
- Sillitoe, R.H. Characteristics and controls of the largest porphyry copper-gold and epithermal gold deposits in the circum-Pacific region. Australian Journal of Earth Sciences 1997, 44, 373–388. [Google Scholar] [CrossRef]
- Sillitoe, R.H. Porphyry Copper Systems. ECONOMIC GEOLOGY 2010, 105, 3–41. [Google Scholar] [CrossRef]
- Lipson, R. The Promise and Perils of Porphyry Deposits in the Future of Gold Production. SEG Discovery 2014, 1–21. [Google Scholar] [CrossRef]
- Lindgren, W. A suggestion for the terminology of certain mineral deposits. ECONOMIC GEOLOGY 1922, 17, 292–294. [Google Scholar] [CrossRef]
- Henley, R.W. Epithermal gold deposits in volcanic terranes. Gold Metallogeny and Exploration 1993, 133–164. [Google Scholar]
- Hedenquist, J.W.; Arribas, A.; Gonzalez-Urien, E. Exploration for epithermal gold deposits. Reviews in Economic Geology 2000, 13, 245–277. [Google Scholar]
- Sillitoe, R.H.; Hedenquist, J.W. Linkages between volcanotectonic settings, ore-fluid compositions, and epithermal precious metal deposits. Society of Economic Geologists Special Publication 2005, 10, 315–343. [Google Scholar]
- Li, Y. Determination method of cut off grade and its applications in mineral exploration. Natural Resource Economics of China 2022, 35, 4–15. [Google Scholar]
- Allis, R.G. Geophysical anomalies over epithermal systems. Journal of Geochemical Exploration 1990, 36, 339–374. [Google Scholar] [CrossRef]
- Doyle, H.A. Geophysical exploration for gold - a review. Exploration Geophysics 1986, 17, 169–180. [Google Scholar] [CrossRef]
- Fatehi, M.; Haroni, H.A. Geophysical signatures of the gold rich porphyry copper deposits: A case study at the Dalli Cu-Au porphyry deposit. Journal of Economic Geology 2018, 10, 639–675. [Google Scholar]
- Hoschke, T.; Sexton, M. Geophysical exploration for epithermal gold deposits at Pajingo, North Queensland, Australia. Exploration Geophysics 2005, 36, 401–406. [Google Scholar] [CrossRef]
- Seigel, H.O.; Johnson, I.; Hennessey, J. Different methodology: Geophysical aids to gold exploration. The Leading Edge 1984, 3, 32–35. [Google Scholar] [CrossRef]
- Wan, F. Characteristics, genesis and prospecting criteria of the mesozoic epithermal gold deposits in Yanbian area. Master’s Thesis, Jilin University, Changchun, China, 2013. (In Chinese with English Abstract). [Google Scholar]
- Yin, Q.; Wang, Y.; Zhou, D.; Zhang, L.; Sun, T. Application of complex resistivity method to shale gas exploration in the Nanling Basin, Anhui Province. Geophysical and Geochemical Exploration 2022, 46, 668–677, (In Chinese with English Abstract). [Google Scholar]
- Ma, D.; Yu, A.; Ge, L.; Fan, J.; Zhang, X.; Wang, C. Application of multi-electrode electrical method in Gold ore prospecting. Geology and Prospecting 2008, 44, 65–69, (In Chinese with English Abstract). [Google Scholar]
- Sun, Z.; Wei, W. Application of the high density resistivity method in gold exploration work. Oil Geophysical Prospecting 2004, A1, 118–122, (In Chinese with English Abstract). [Google Scholar]
- Liu, S.; Li, W.; Sun, G.; Ao, D.; Du, M.; Wang, C.; Yu, H. Applications of high-precision magnetic measurement in checking Kelidai gold deposit, Inner Mongolia. Global Geology 2011, 30, 666–670, (In Chinese with English Abstract). [Google Scholar]
- Richarte, D.; Correa-Otto, S.; Klinger, F.L.; Giménez, M. Geophysical characterization of a low sulfidation epithermal gold and silver deposit, Mendoza, Argentina. Journal of South American Earth Sciences 2023, 123, 1–10. [Google Scholar] [CrossRef]
- Wu, G. High accuracy magnetic prospecting on earth surface in gold mine exploration—Take the shisangongli exploring area out of Wulaga gold deposit in Heilongjiang province as an example. Progress in Geophysics 2007, 22, 1637–1641. [Google Scholar]
- Hao, y. Mineralization and Metallogenic Regularity of Duobaoshan Ore Concentration Area in Heilongjiang Province, Northeast China. Ph. D. Thesis, Jilin University, Changchun, China, 2015. (In Chinese with English Abstract).
- Sun, J.; Liu, Y.; Xu, Z.; Xu, Z.; Chu, X.; Gu, A. Large-Scale Epithermal Mineralization of Late Mesozoic and the Constraints of Deep Geological Processes on Mineralization in the Continental Margin of NE China. Journal of Jilin University (Earth Science Edition) 2023, 53, 651–692, (In Chinese with English Abstract). [Google Scholar]
- Chen, L. Ore genesis of the Sandaowanzi Telluride-Gold Deposit in Heilongjiang Province. Doctor, Changchun, 2017. (In Chinese with English Abstract).
- Zhao, Z.; Qu, H.; Guo, Y.; Li, C.; Wang, Z.; Zhang, J. Metallogenic rules and prospecting orientation of gold deposit in the Duobaoshan area, Heilongjiang Province. Geology and Resources 2011, 20, 89–95, (In Chinese with English Abstract). [Google Scholar]
- Pan, G.; Xiao, Q.; Lu, S.; Deng, J.; Feng, Y.; zhang, K.; Zhang, Z.; Hao, G.; Feng, Y. Subdivision of tectonic units in China. Geology in China 2009, 36, 1–28, (In Chinese with English Abstract). [Google Scholar]
- Liu, Y.; Feng, Z.; Jiang, L.; Jin, W.; Li, W.; Guan, Q.; Wen, Q.; Liang, C. Ophiolite in the eastern Central Asian Orogenic Belt, NE China. Acta Petrologica Sinica 2019, 35, 3017–3047, (In Chinese with English Abstract). [Google Scholar]
- Meng, F. The study of lithospheric electrical structure and metallogenic setting in the northern section of the Heihe-Hegenshan suture. Ph. D. Thesis, Jilin University, Changchun, China, 2023. (In Chinese with English Abstract).
- Li, D.; Zhu, C.; Lv, J.; Cui, G. Structural-magmatic mineralization of Sankuanggou-Duobaoshan metallogenic belt, Heilongjiang. China Mining Magazine 2010, 19, 142–146, (In Chinese with English Abstract). [Google Scholar]
- Shi, D.; Zhang, K.; Zhang, Y.; Gao, Y.; Tang, W.; Lv, M. Geophysical and Geochemical Characteristics and Prospecting Criteria of Shallow Overburden Area in Heilongjiang Province: A Case Study of 340 Highland Gold Mineralization in Heihe City. Journal of Jilin University (Earth Science Edition) 2021, 51, 1042–1053, (In Chinese with English Abstract). [Google Scholar]
- Zhao, L.; Li, X.; Li, C.; Zhao, J.; Bao, Y.; Chen, Z.; Liu, H.; Liang, J.; Wang, P. Recognition of concealed porphyry body and deep prospecting practice in Duobaoshan ore concentration area based on gravity, magnetic and electromagnetic surveys. Minerals Deposits 2022, 41, 1217–1231, (In Chinese with English Abstract). [Google Scholar]
- Zhao, Z.; Cui, X.; Sun, J.; Chen, J.; Qiao, K.; Liang, S.; Jslopin, M.A. Deep Metallogenic Prediction Based on 3D Geological-Geophysical Model: A Case Study of Yongxin Gold Deposit in Heihe Area. Journal of Jilin University (Earth Science Edition) 2024, 54, 498–515, (In Chinese with English Abstract). [Google Scholar]
- He, J. Dual frequency induced polarization method. Higher Education Press: Beijing, 2024; pp. 466.
- Wang, H.; Li, T. The application of dual frequency IP method to the exploration of mineral resources in Western Australia. Geophysical and Geochemical Exploration 2016, 40, 923–928, (In Chinese with English Abstract). [Google Scholar]
- Cui, F. Analysis of relations of apparent charging rate and chargeability. Jiangsu Geloogy 1990, 3, 51–53, (In Chinese with English Abstract). [Google Scholar]
- Hao, T.; Liu, Y.; Duan, C. Approaching fault system of the east China and adjacent area from gravity and magnetic data. Acta Geophysica Sinica 1996, 36, 141–149, (In Chinese with English Abstract). [Google Scholar]
- Xun, F.; Liu, J.; Liu, C.; Guo, Z. Application of Induced Polarization Method in a Gold Mining Area in Guangxi Province. Gold Science and Technology 2019, 27, 339–349, (In Chinese with English Abstract). [Google Scholar]
- Ge, X.; Fan, Y.; Li, J.; Tan, B.; Wang, L.; Wu, Z.; Wang, X. Experimental studies and investigations on the dual lateral log response of near borehole fractures. Chinese J.Geophys 2019, 62, 354–360, (In Chinese with English Abstract). [Google Scholar]
- Zhu, L. Synthetic Metallogenic Prognosis of Au Deposit on Dong’an-Tangwanghe Region, Heilongjiang Province. Ph. D. Thesis, China University of Geosciences (Beijing), Beijing, China, 2014. (In Chinese with English Abstract).
- Xiong, Y.; Yu, X.; Chi, N.; Yang, D.; Wang, X. e. Geophysical logging and Primary Analysis of Scientific Research Deep Drilling at the Depth of 3000m in Jiaojia Gold Belt. Shandong Land and Resources 2018, 34, 66–73, (In Chinese with English Abstract). [Google Scholar]
- Huang, K.; Xie, G.; Duan, L.; An, W. Identification of Paodaoling large intermediate-sulfidation epithermal gold deposit in Middle-Lower Yangtze River Valley metallogenic belt and its implication for mineral exploration. Mineral Deposits 2022, 41, 440–448. [Google Scholar]
- Li, S.; Ni, P.; Bao, T.; Li, C.; Xiang, H.; Wang, G.; Huang, B.; Chi, Z.; Dai, B.; Ding, J. Geology, fluid inclusion, and stable isotope systematics of the Dongyang epithermal gold deposit, Fujian Province, southeast China: Implications for ore genesis and mineral exploration. Journal for Geochemical Exploration 2018, 195, 16–30. [Google Scholar] [CrossRef]
- Robert, L.B.; Kevin, F. The Waihi Epithermal Gold-Silver-Base Metal Sulfide-Quartz Vein System, New Zealand: Temperature and Salinity Controls on Electrum and Sulfide Deposition. ECONOMIC GEOLOGY 2002, 97, 269–290. [Google Scholar]
Figure 1.
(a) The structural location map of Alinghe mining area (according to Pan et al., 2009[27]) and (b) the Geological map. 1- Nen River-Balihan fault; 2-Northwest boundary fault of Songnen basin; 3- Yilan-Yitong fault; EB: Erguna block; XB: Xing’an Block; SXB: Songnen-XilinHot block; XXS: Xinlin-Xigutu suture zone; HHS: Hegan Mountain - Heihe suture zone.
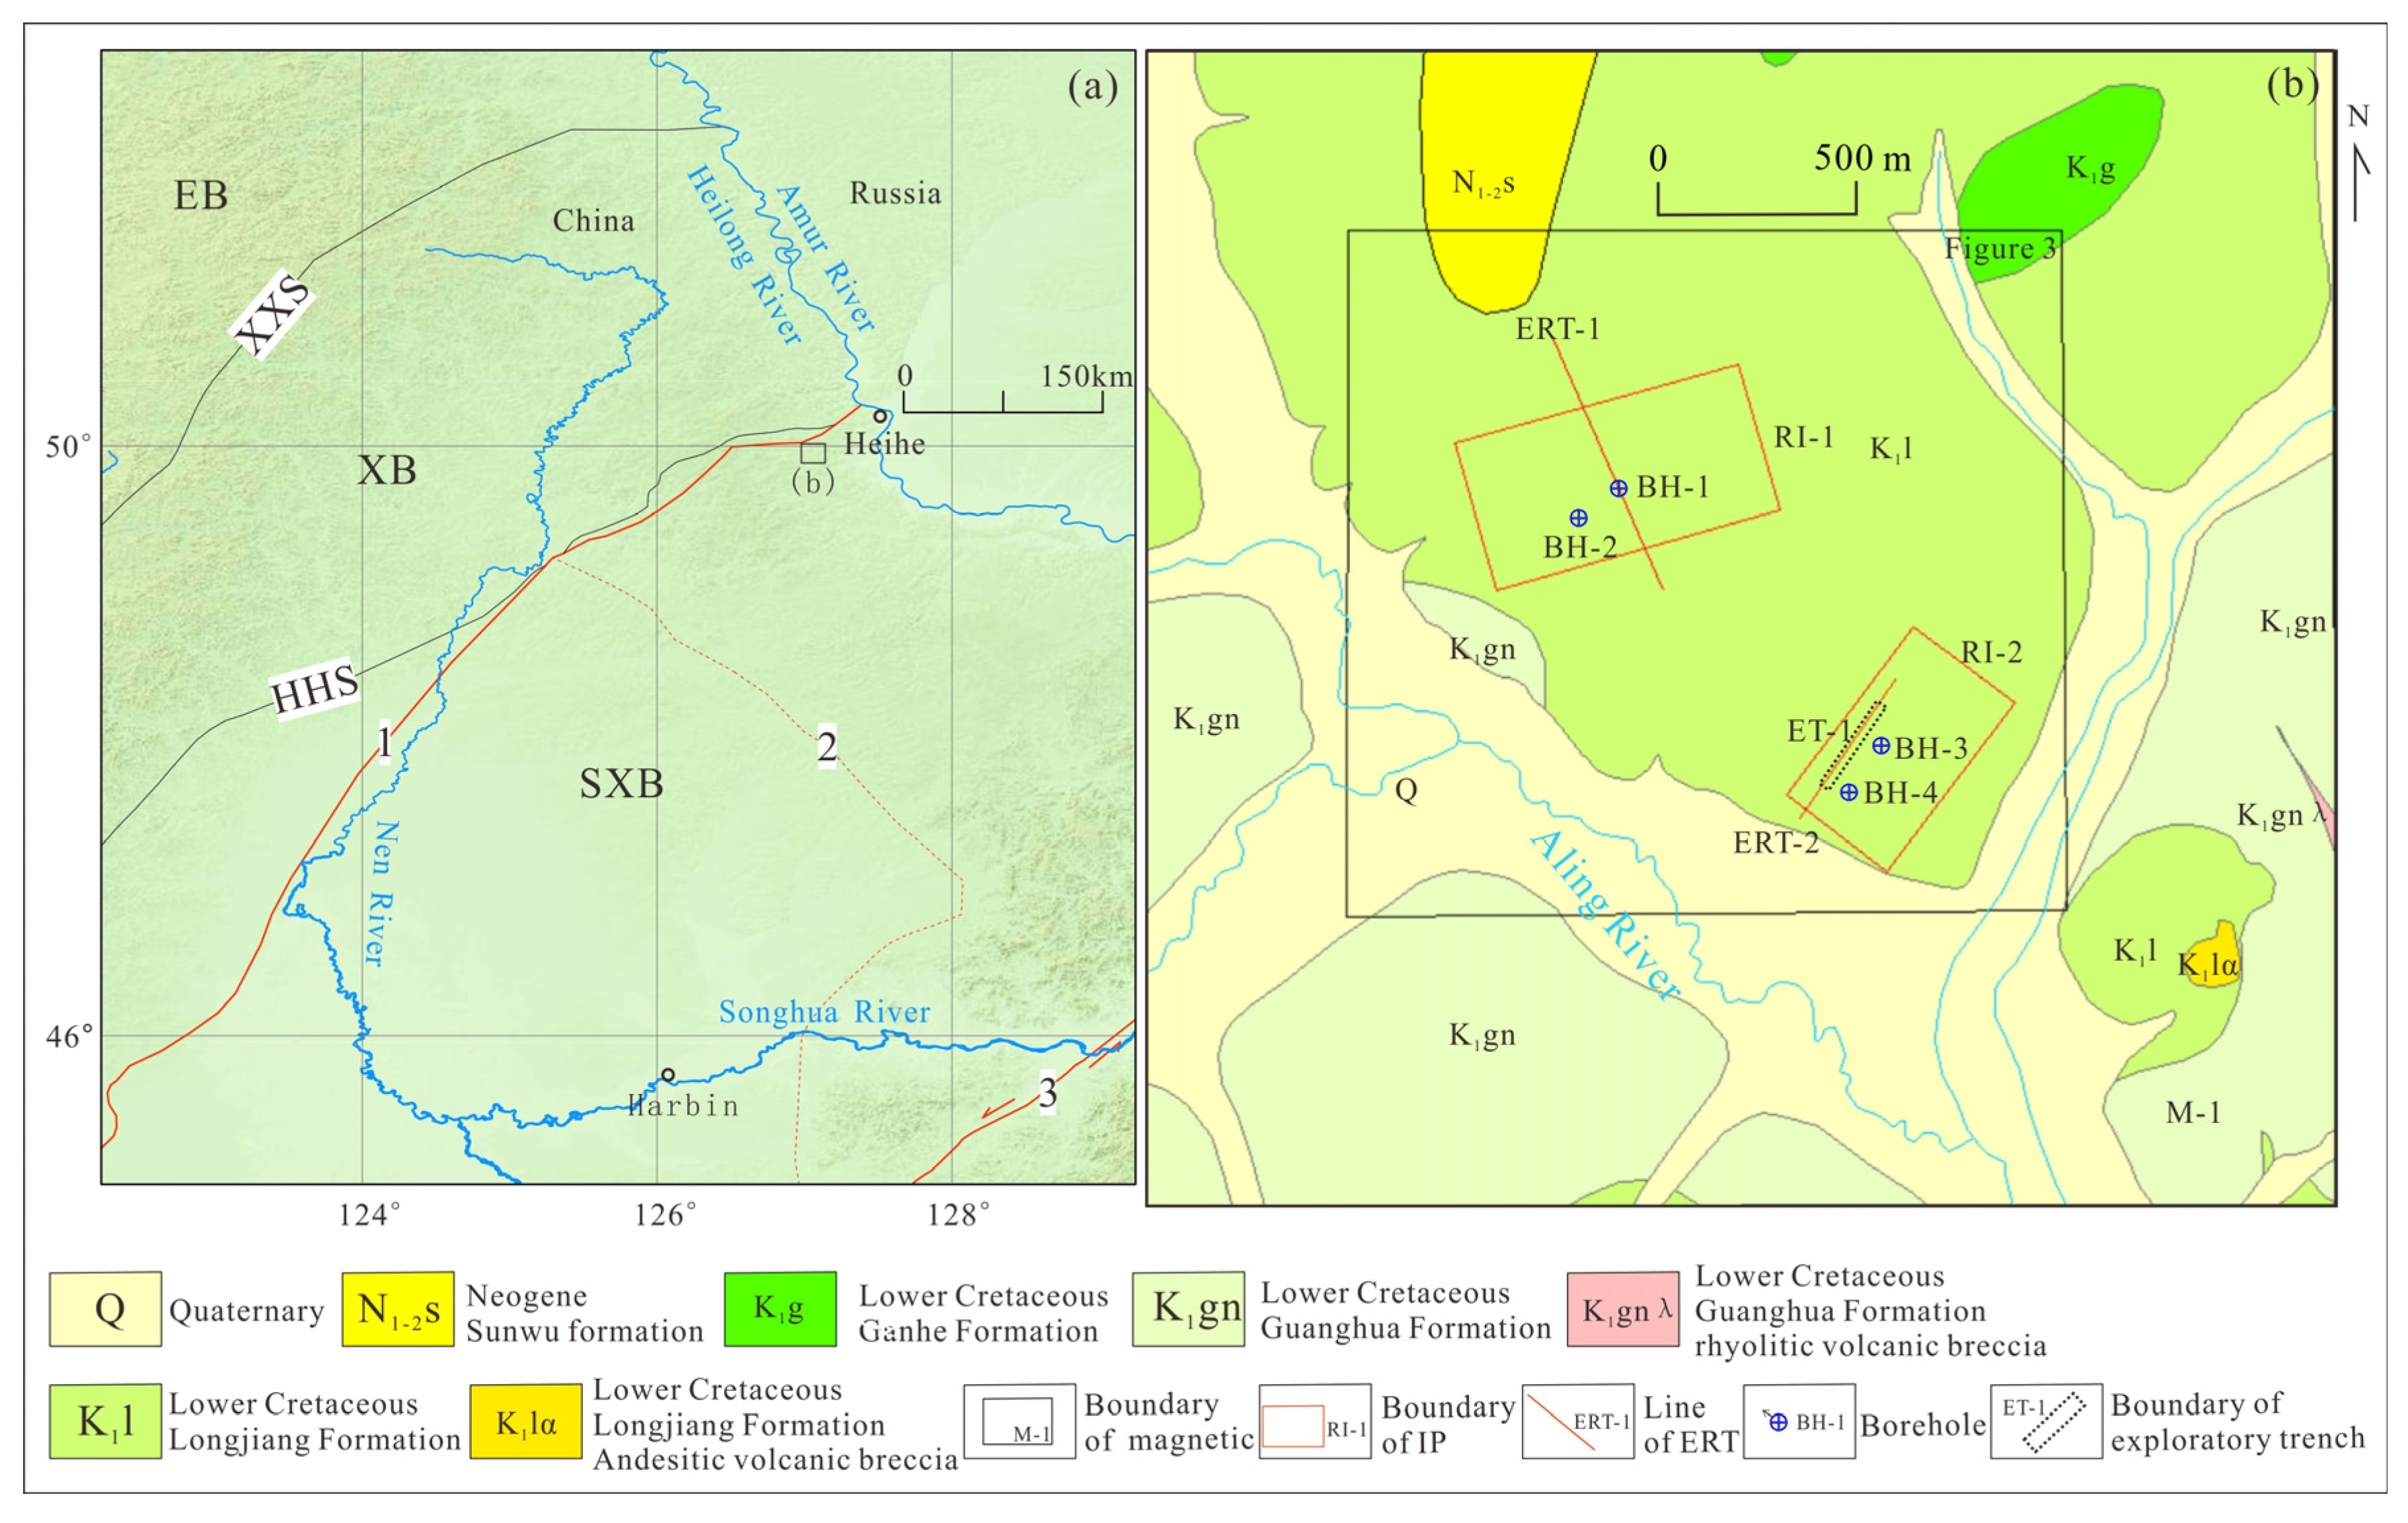
Figure 2.
Map of magnetic field △T contour and geological boundary in the study area (see Figure 1 for location and name of rock).
Figure 2.
Map of magnetic field △T contour and geological boundary in the study area (see Figure 1 for location and name of rock).
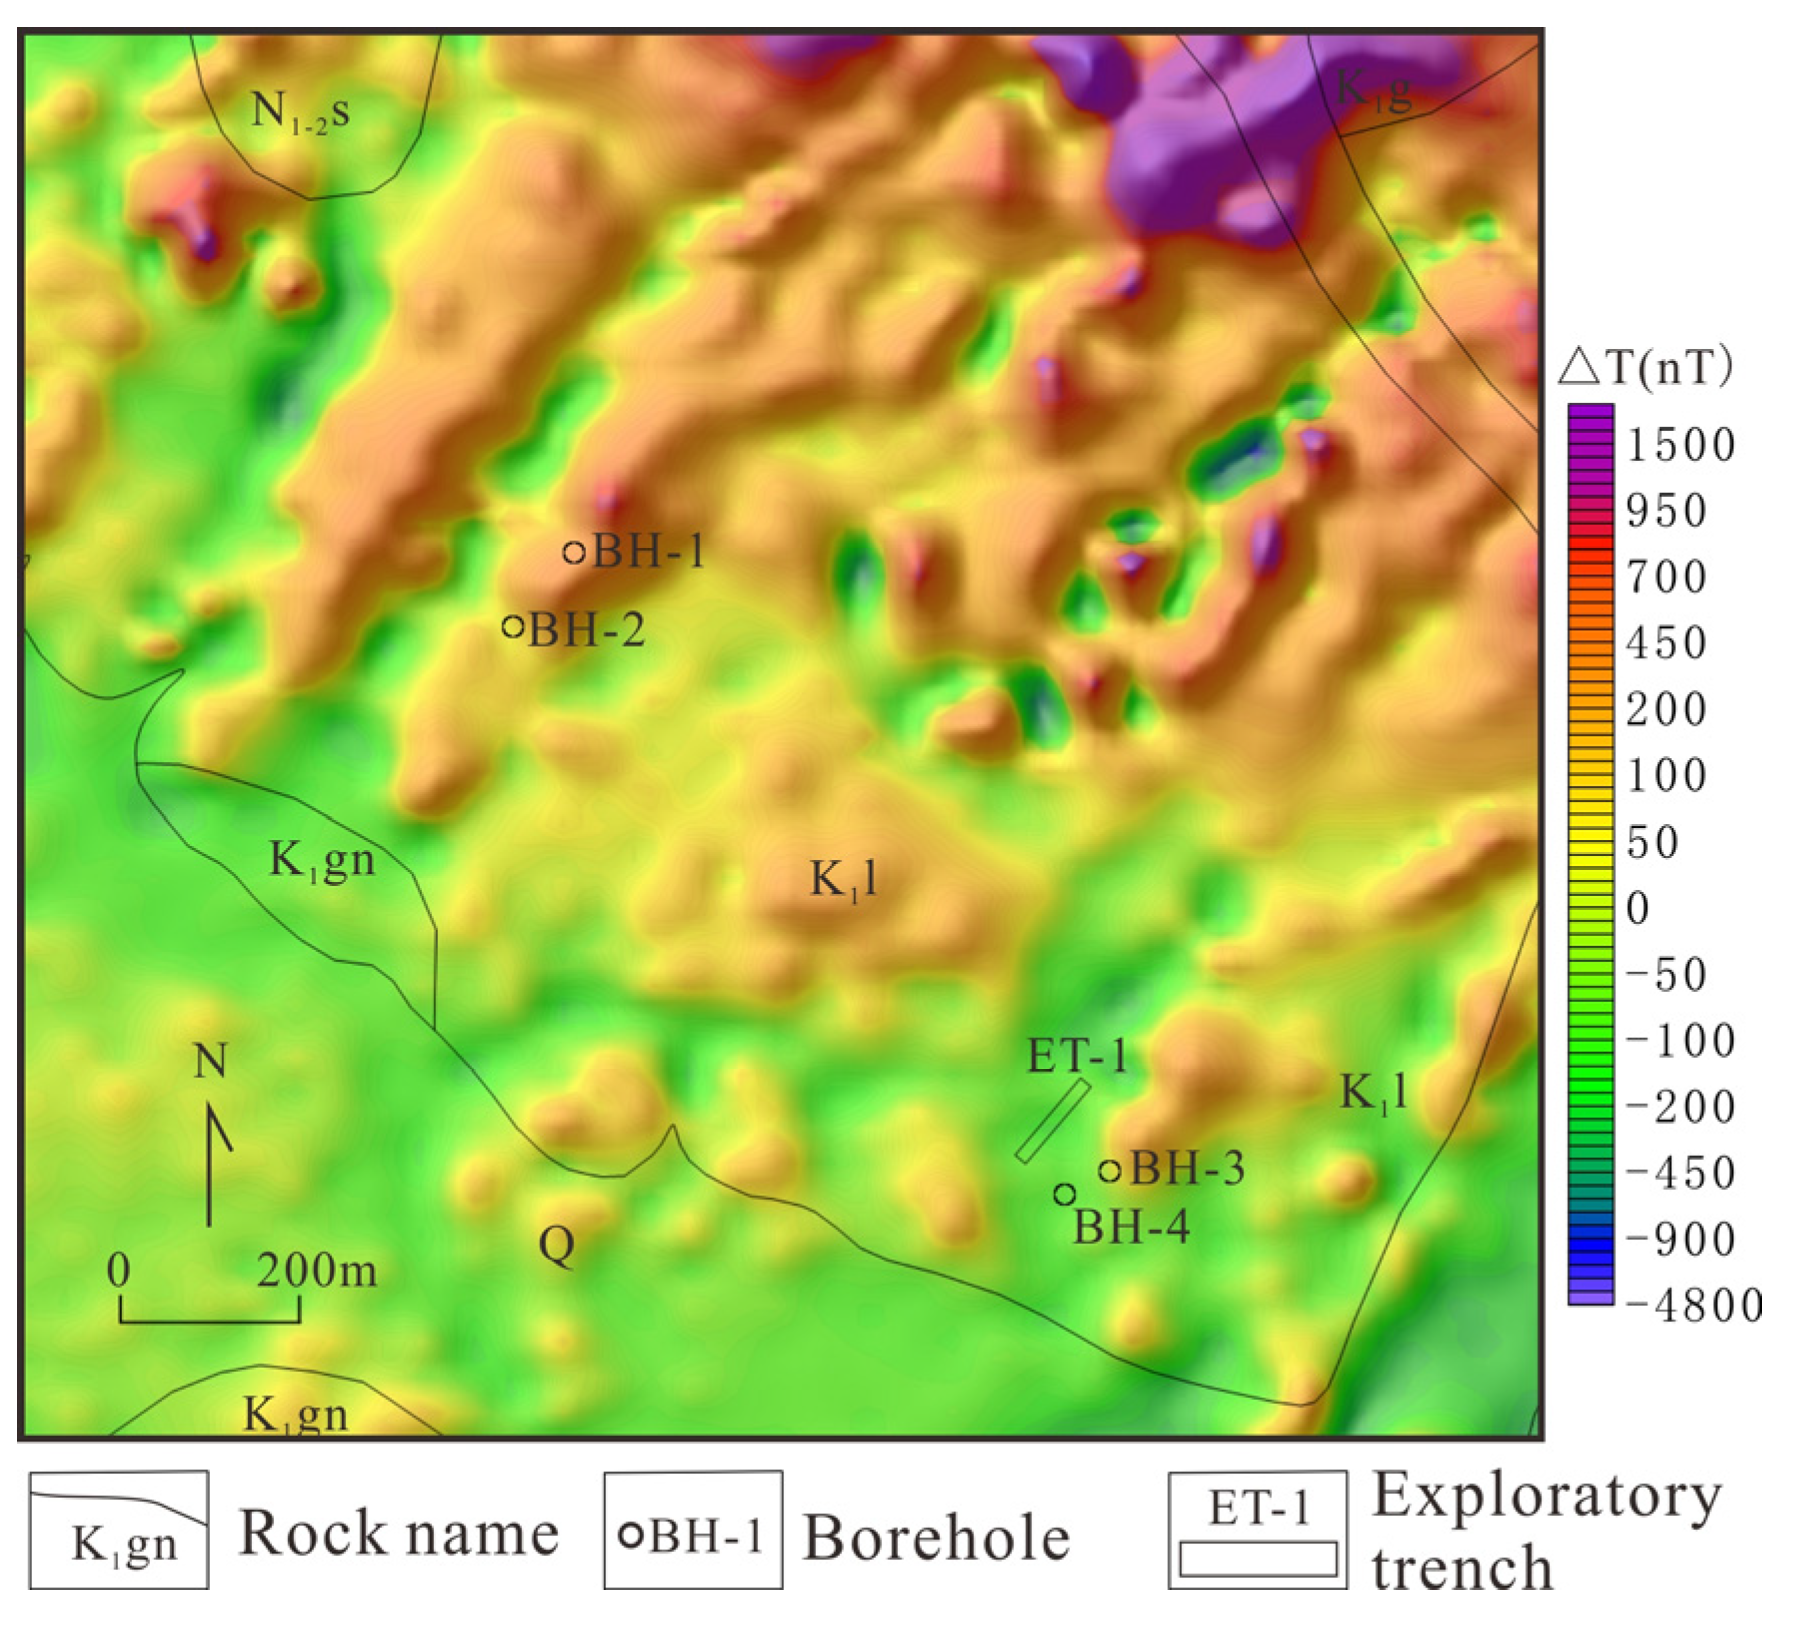
Figure 3.
Contour plots of apparent resistivity (a) and apparent amplitude frequency (b) in R-1 region and apparent resistivity (c) and apparent amplitude frequency (d) in R-2 region in the study area.
Figure 3.
Contour plots of apparent resistivity (a) and apparent amplitude frequency (b) in R-1 region and apparent resistivity (c) and apparent amplitude frequency (d) in R-2 region in the study area.
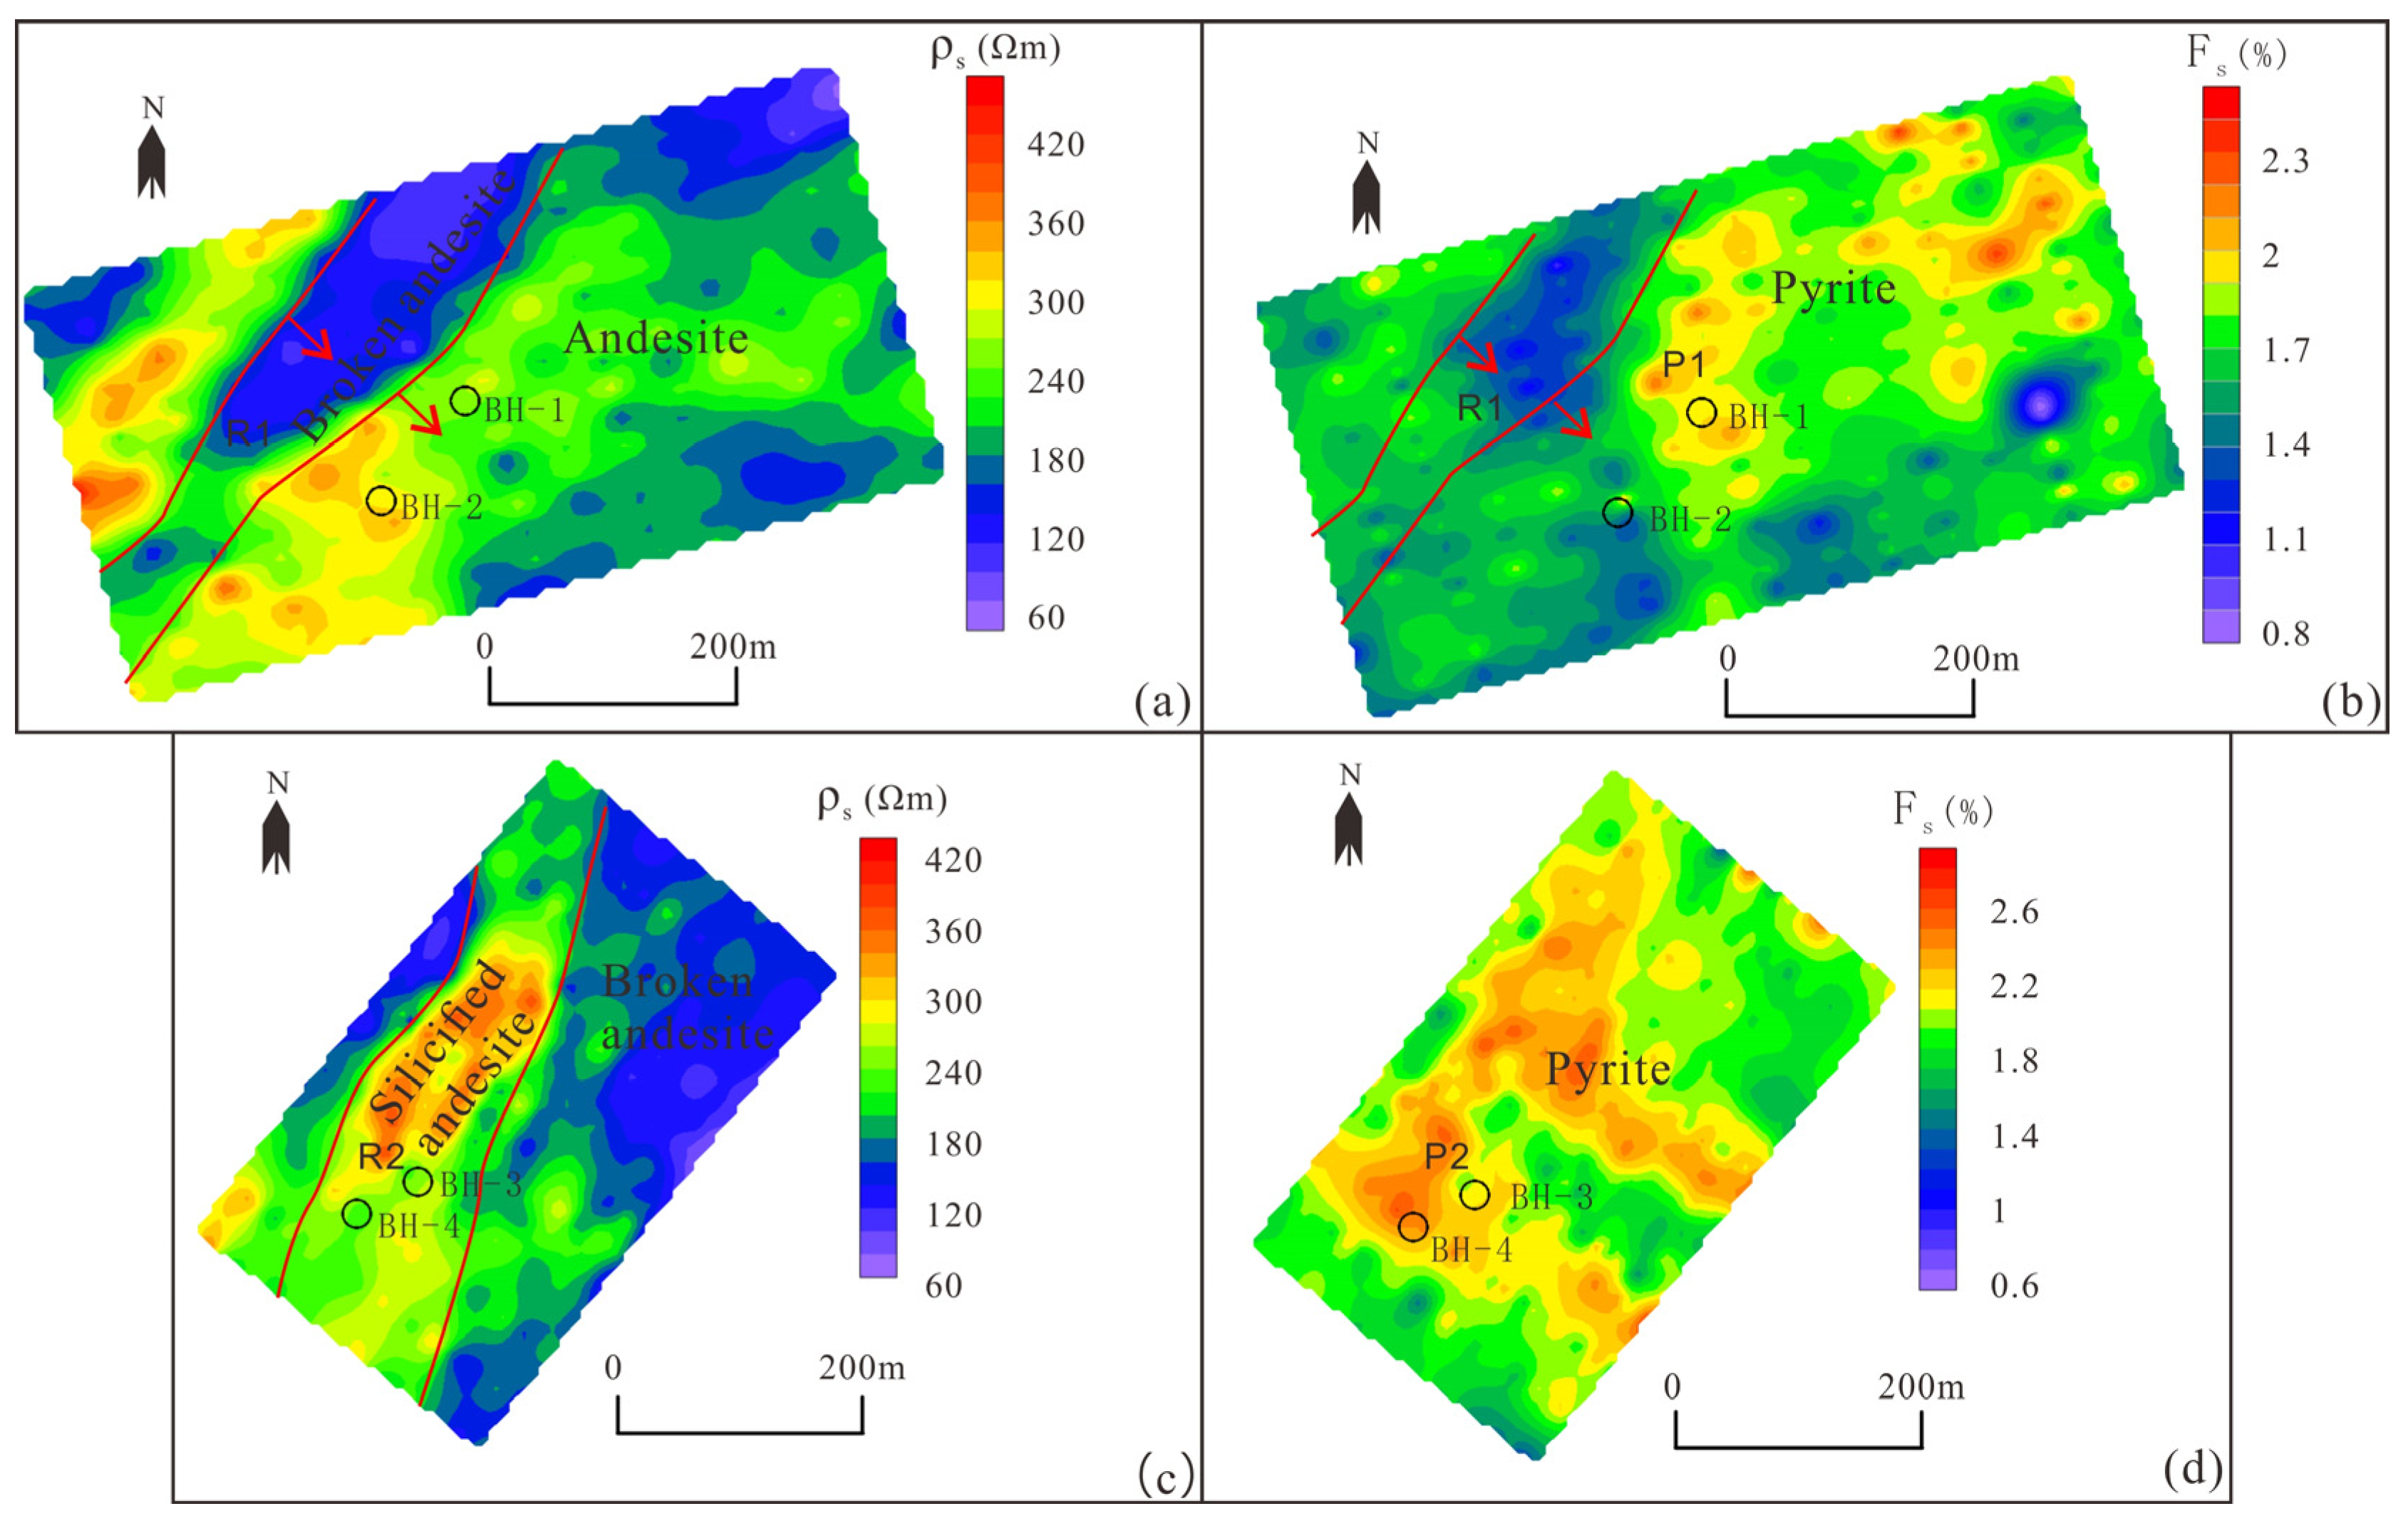
Figure 4.
Gold-bearing silicized andesite revealed in ET-1.
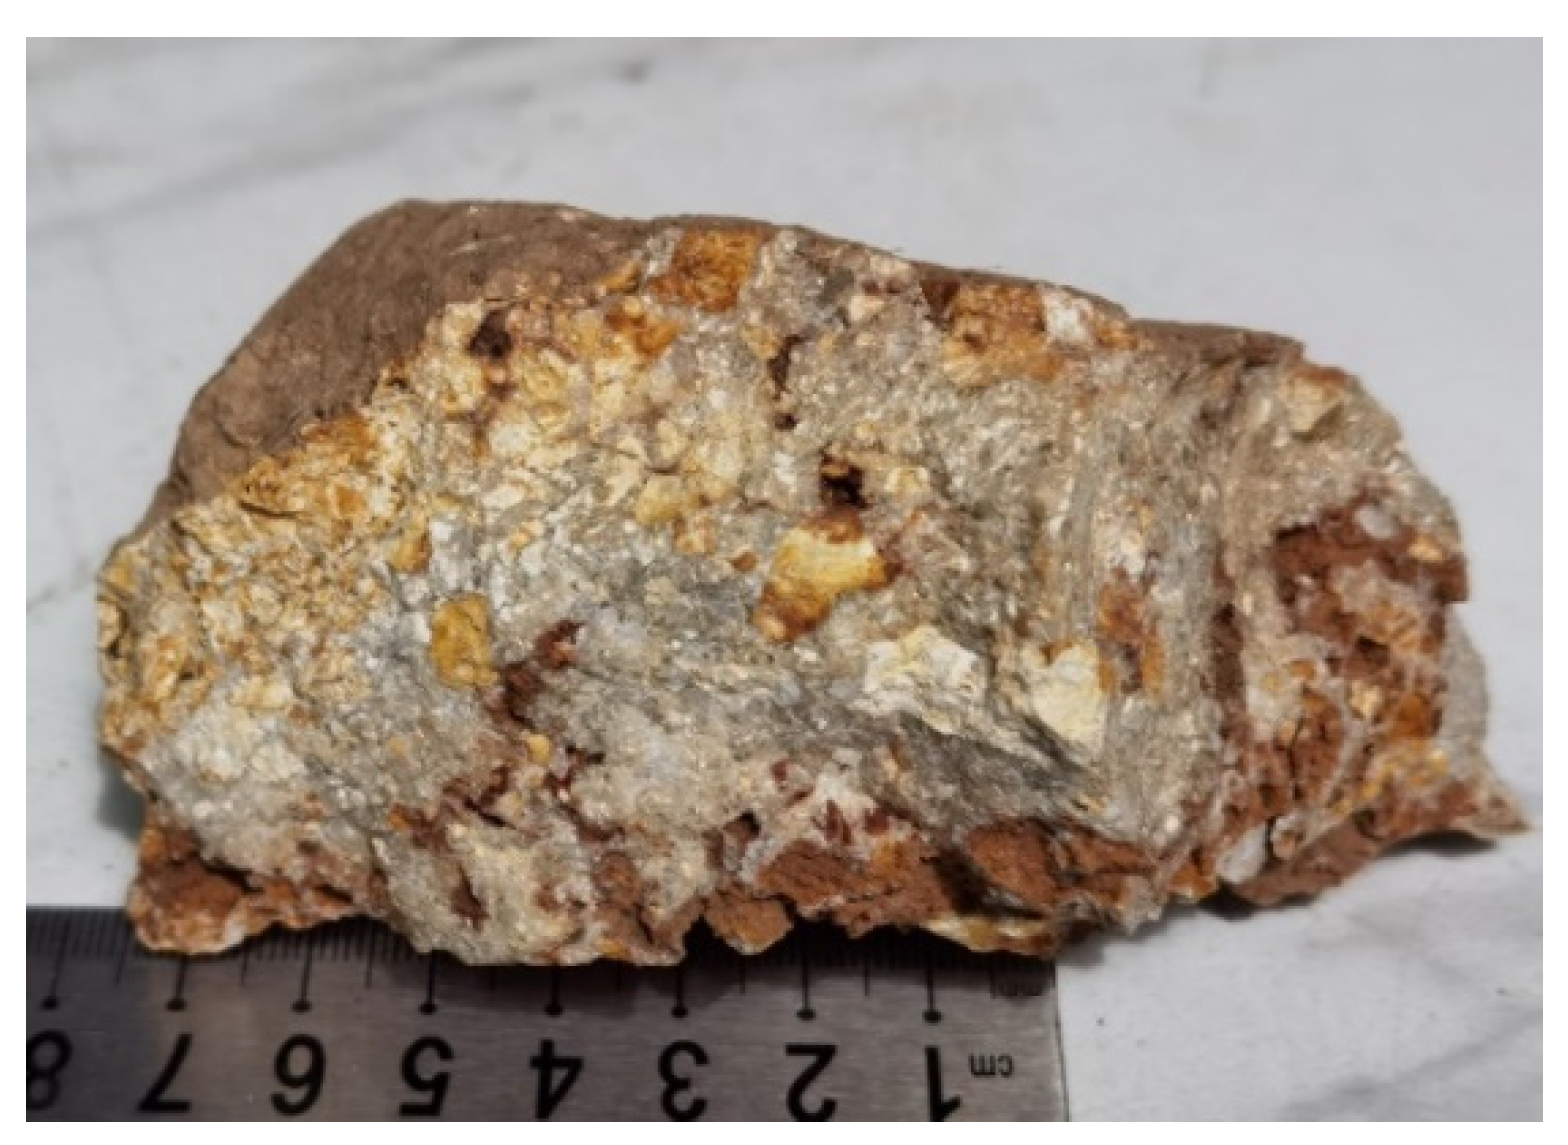
Figure 5.
Inversion and interpretation profiles of ERT-1 line’s (a) apparent resistivity, (b)apparent charge rate and ERT-2 line’s (c) apparent resistivity, (d)apparent charge rate.
Figure 5.
Inversion and interpretation profiles of ERT-1 line’s (a) apparent resistivity, (b)apparent charge rate and ERT-2 line’s (c) apparent resistivity, (d)apparent charge rate.
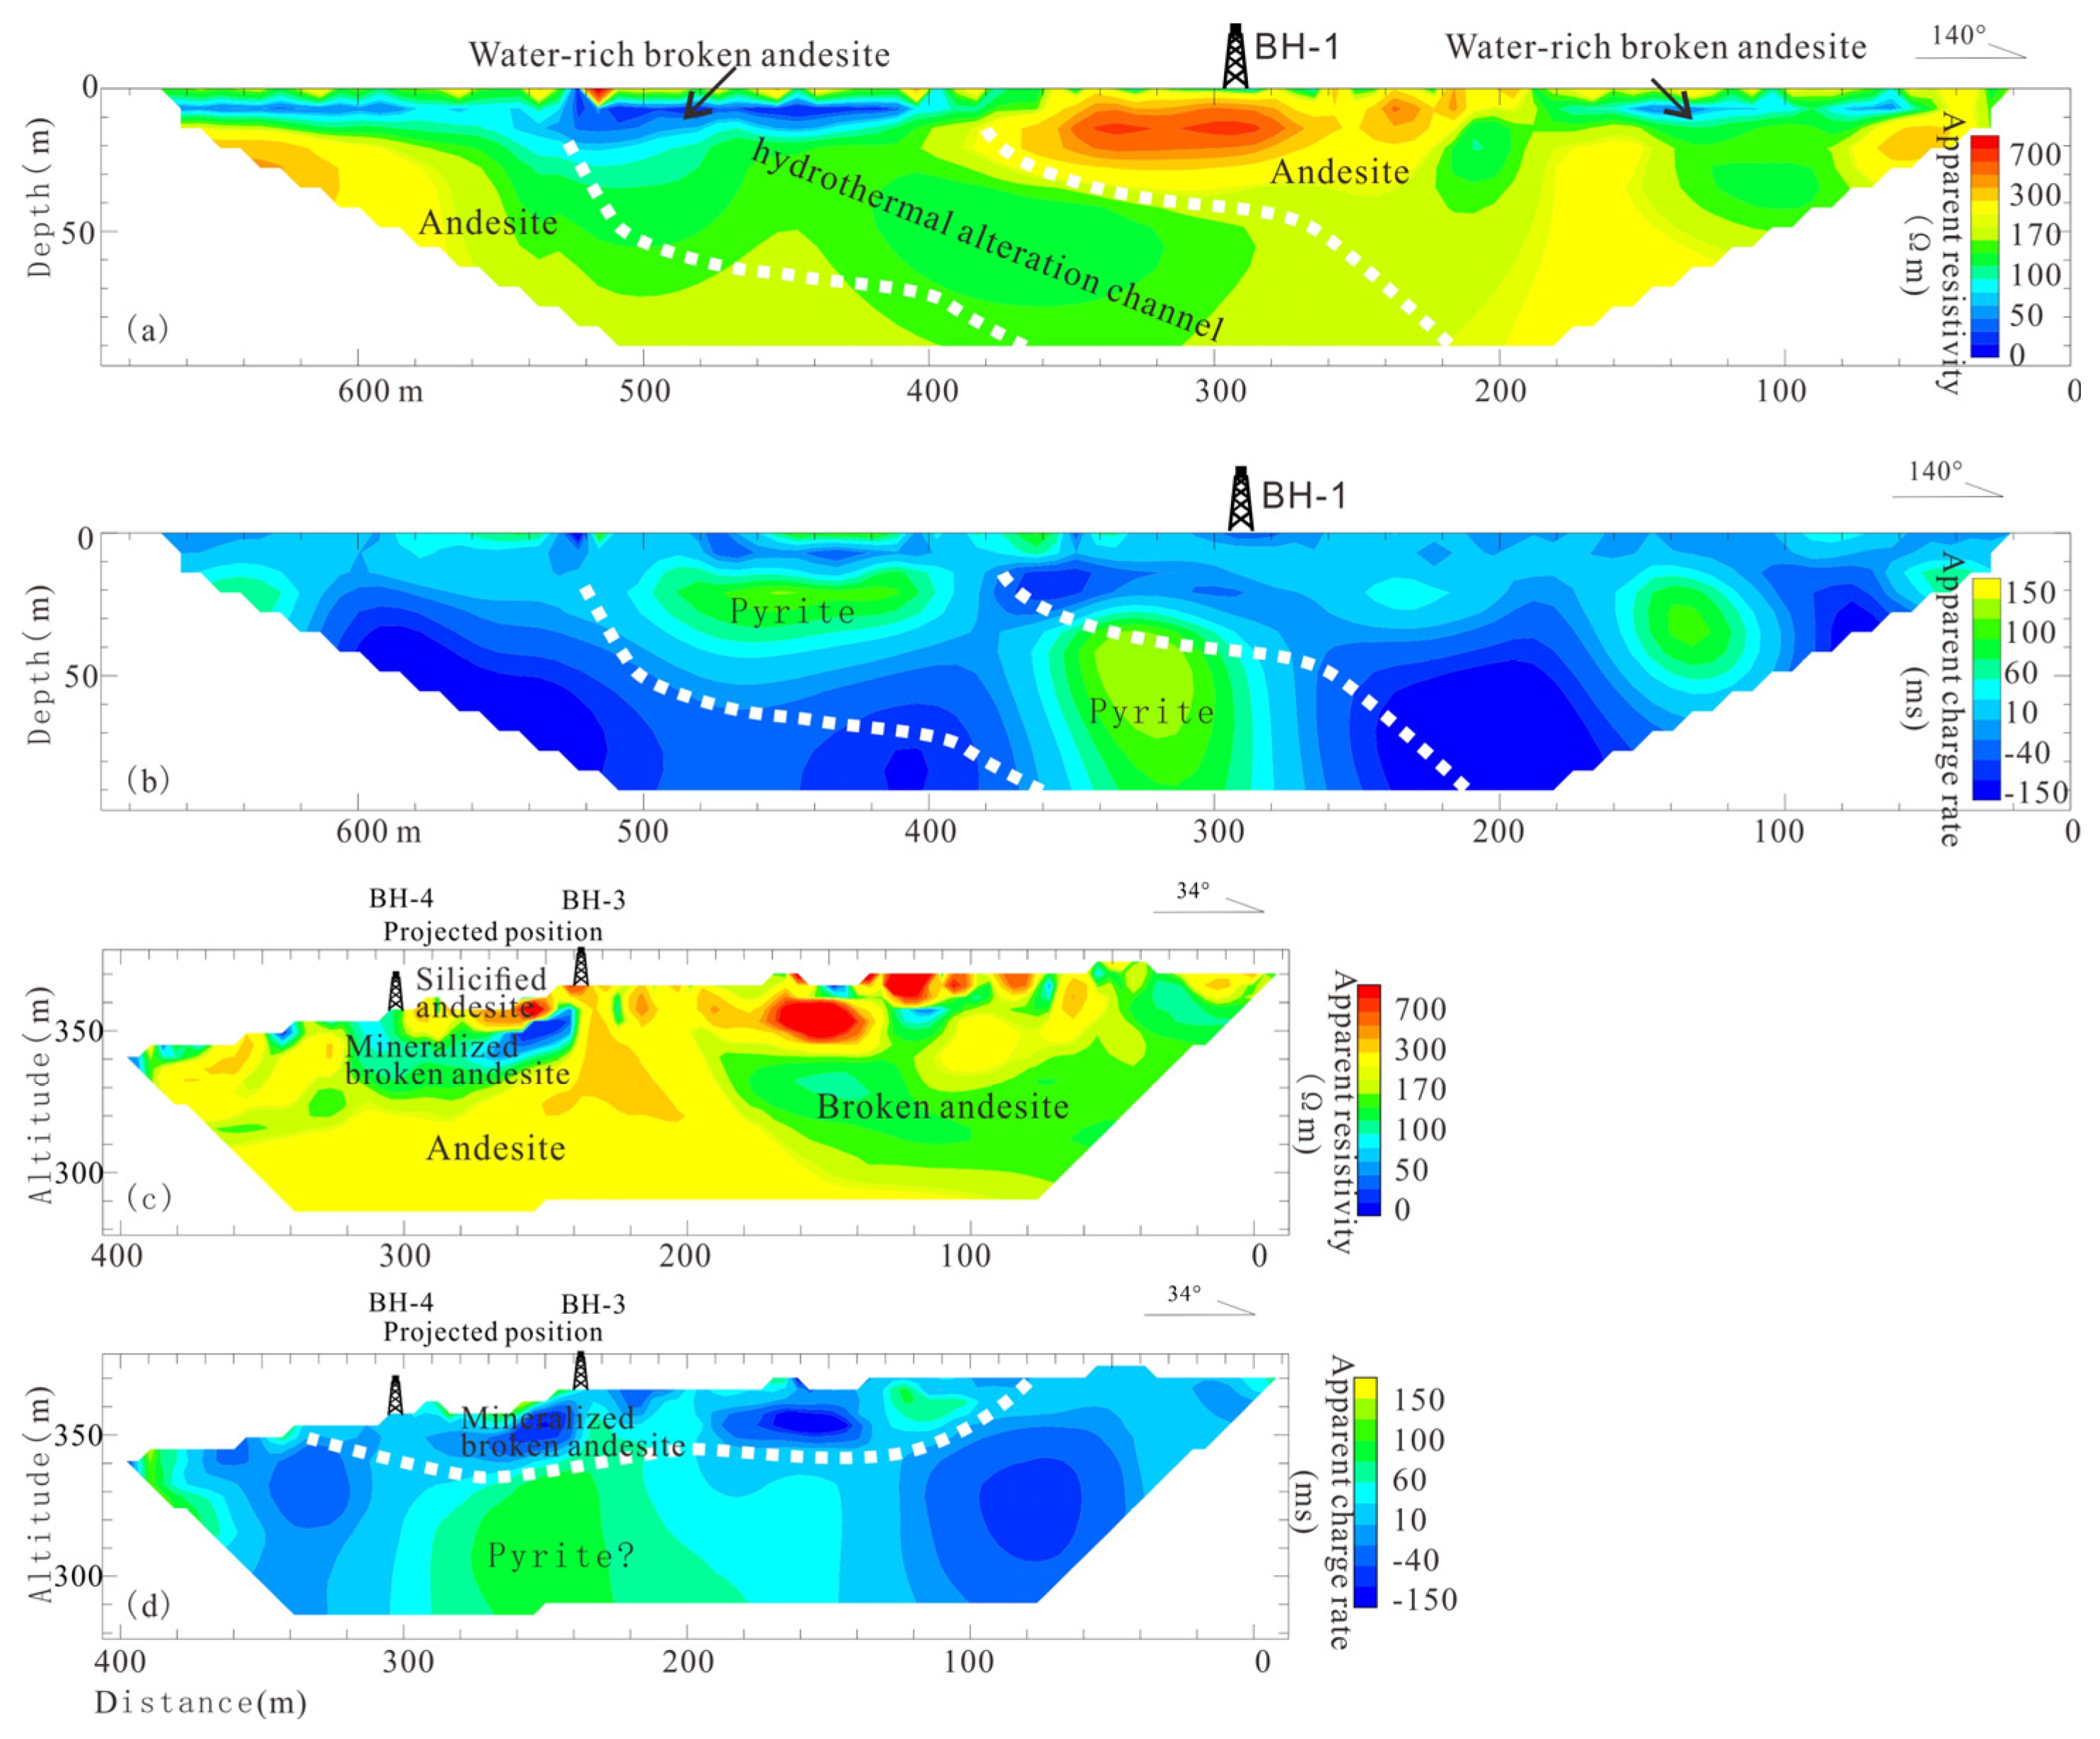
Figure 7.
Crossplot of geophysical parameters of andesitic surrounding rock (a), andesitic volcanic breccia (b), gold mineralized bodies and other meaningful logging sections(c) of the borehole BH-1.
Figure 7.
Crossplot of geophysical parameters of andesitic surrounding rock (a), andesitic volcanic breccia (b), gold mineralized bodies and other meaningful logging sections(c) of the borehole BH-1.
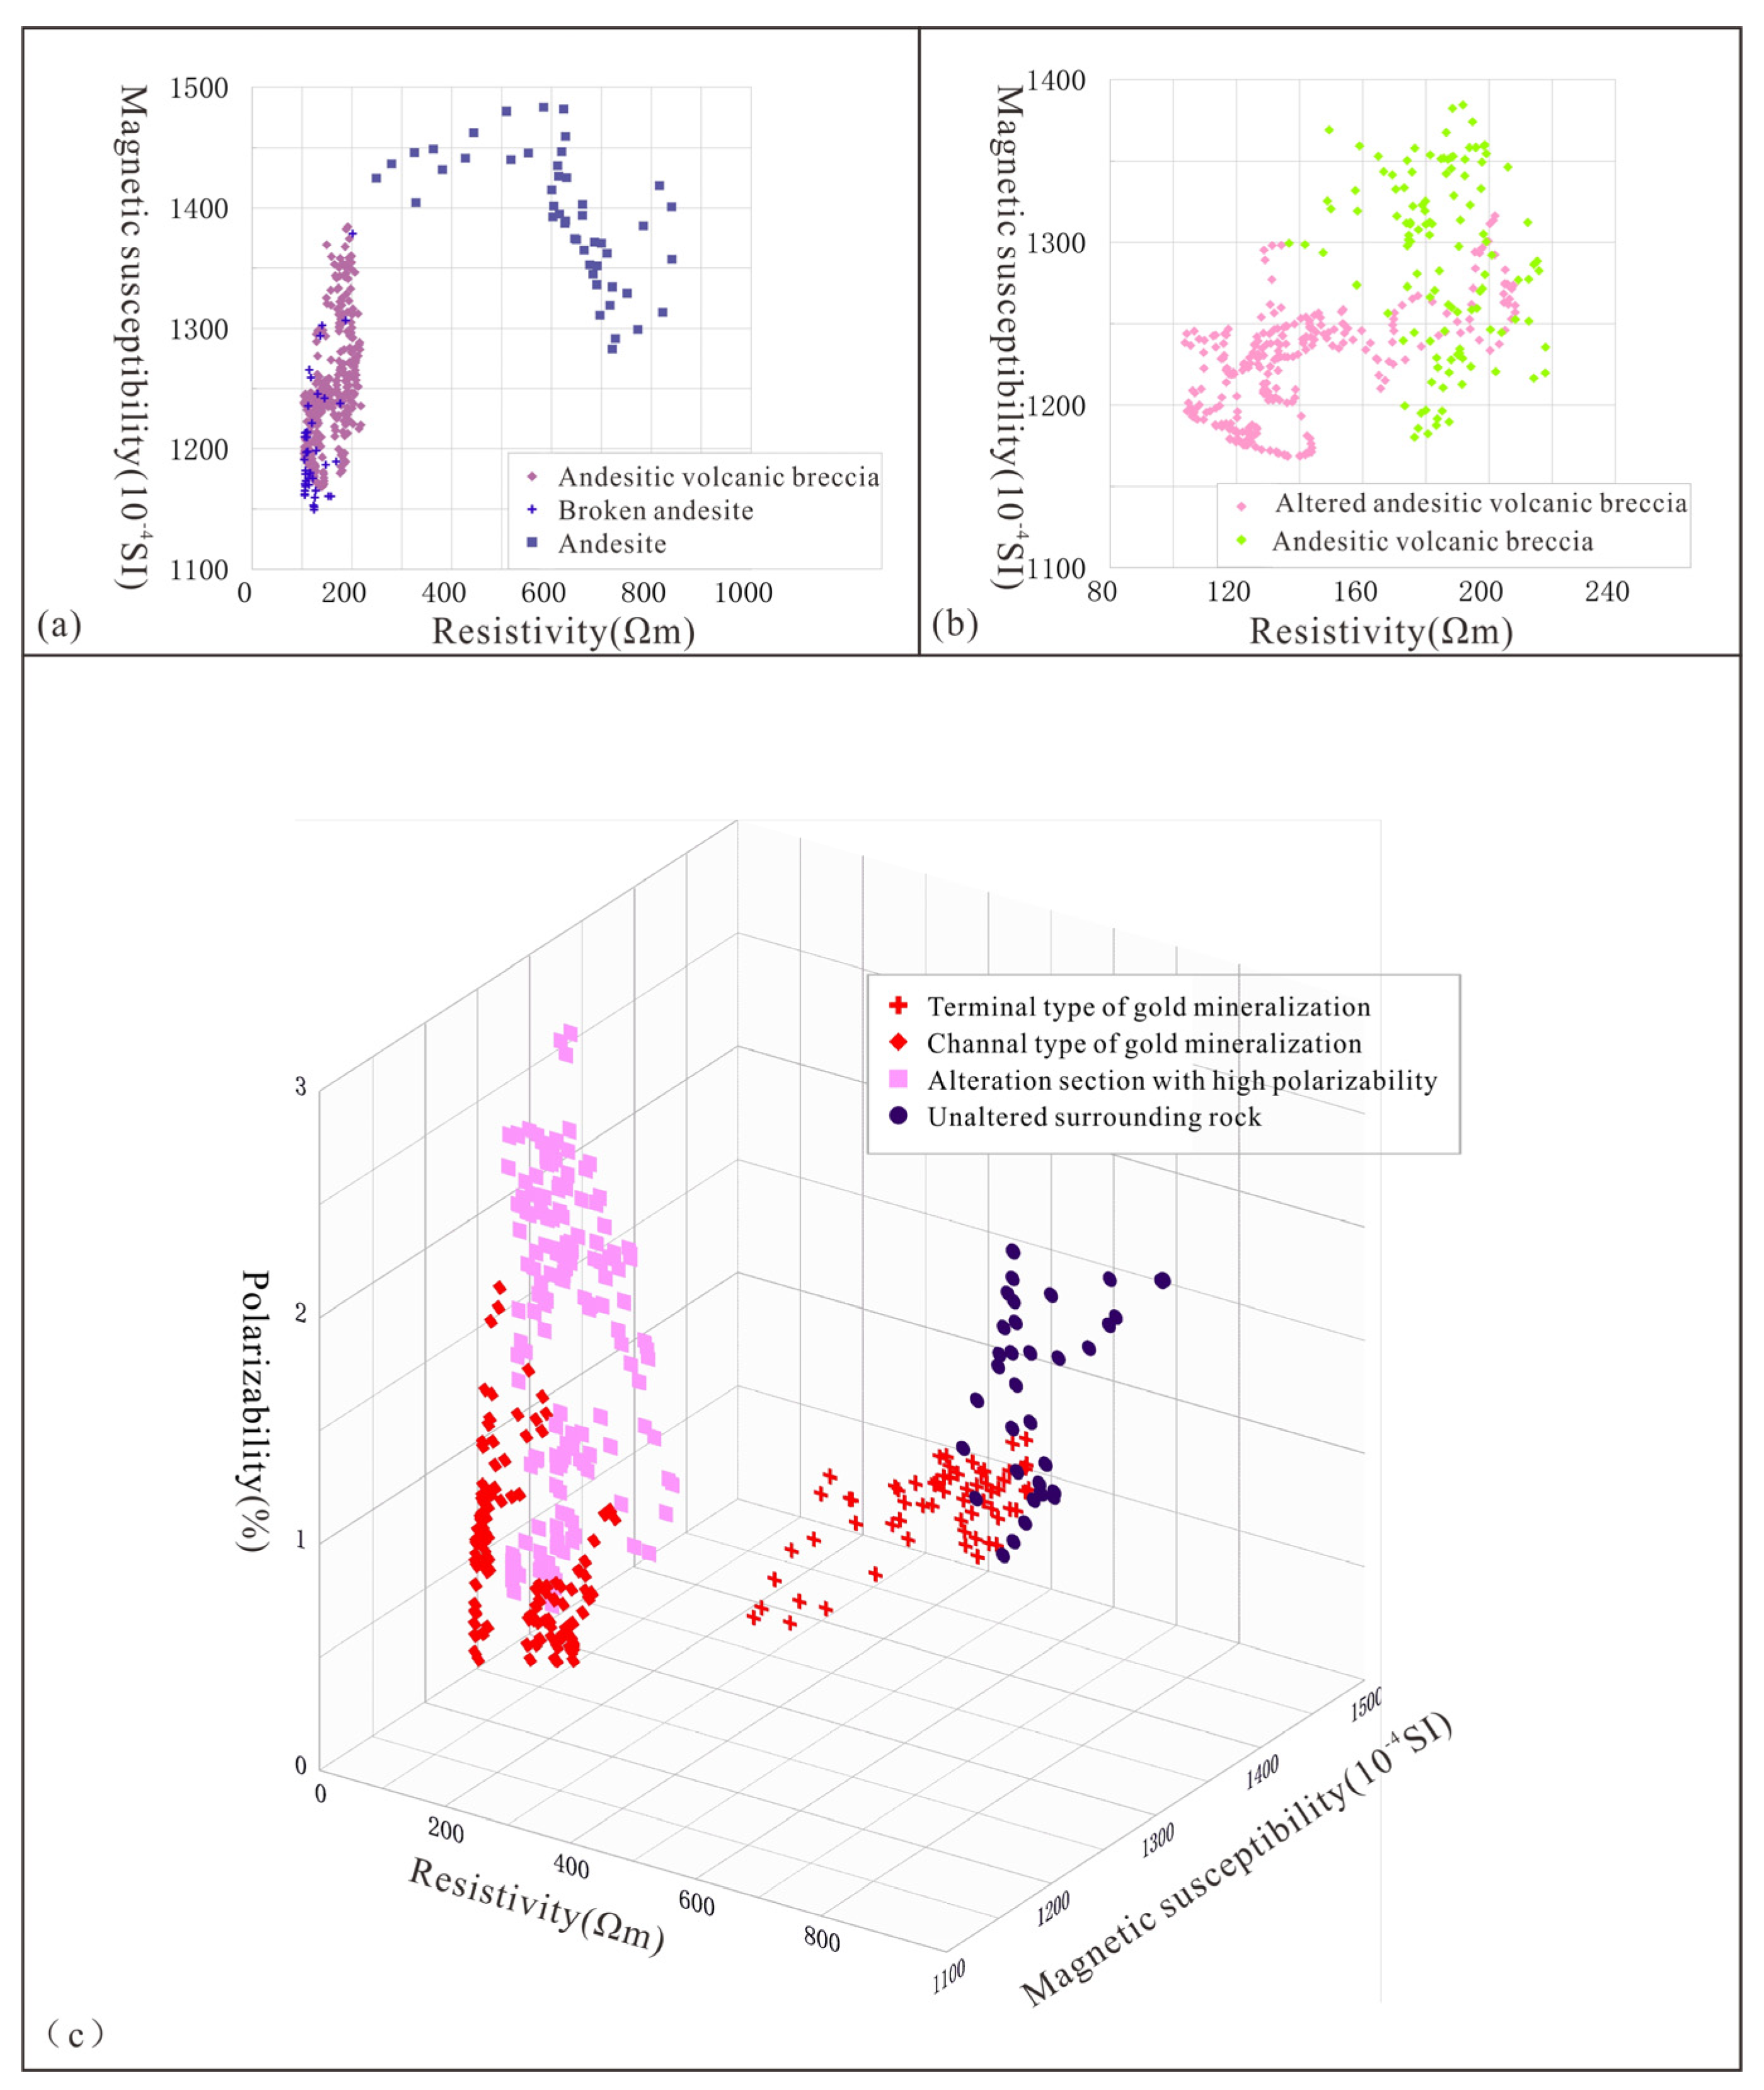

Table 1.
Physical parameters statistics of rock and ore body.
| Lithology | Magnetic Susceptibility(M.S.) (×10-5SI) |
Resistivity(Ω·m) | Polarizability(%) | |||
|---|---|---|---|---|---|---|
| Value range | Geometric mean | Value range | Geometric mean | Value range | Arithmetic mean | |
| (Inact) Andesite | 12~1510 | 170.1 | 80~4300 | 609.6 | 2.5~60 | 26.9 |
| Broken andesite | 35~933 | 113.7 | 65~407 | 182.9 | 4.6~16.8 | 10.6 |
| Andesite basalt | 2500~3130 | 2889.4 | 7000~21000 | 11154.2 | 11~16 | 12.7 |
| Andesitic volcanic breccia | 8~490 | 133.9 | 50~2805 | 267.6 | 3.43~29 | 7.9 |
| rhyolite | 0.6~6 | 3.1 | 500~993 | 690.5 | 4.5~30 | 18.5 |
| Gold ore body from drilling | 10~490 | 82.3 | 120~1076 | 283.4 | 3.6~63.8 | 17.2 |
| Gold ore body from exploratory trench | 6.5~37.5 | 19.9 | 476~2806 | 789.6 | 25~50 | 37.6 |
Disclaimer/Publisher’s Note: The statements, opinions and data contained in all publications are solely those of the individual author(s) and contributor(s) and not of MDPI and/or the editor(s). MDPI and/or the editor(s) disclaim responsibility for any injury to people or property resulting from any ideas, methods, instructions or products referred to in the content. |
© 2024 by the authors. Licensee MDPI, Basel, Switzerland. This article is an open access article distributed under the terms and conditions of the Creative Commons Attribution (CC BY) license (http://creativecommons.org/licenses/by/4.0/).
Copyright: This open access article is published under a Creative Commons CC BY 4.0 license, which permit the free download, distribution, and reuse, provided that the author and preprint are cited in any reuse.


