1. INTRODUCTION
Idiopathic inflammatory myopathies (IIMs) encompass a diverse group of autoimmune disorders with variable clinical manifestations. IIM are primarily known for affecting skeletal muscles, causing chronic inflammation and progressive muscle weakness. Nevertheless, it is now recognized that IIM can present without myositis, manifesting instead in the skin, lungs, heart, and joints, or overlapping with other systemic autoimmune diseases (SAID) [
1,
2]. While the precise cause of IIMs is not yet fully understood, a combination of genetic and environmental factors, including viral infections, has been suggested as a potential trigger for their development. [
3].
Myositis autoantibodies (MAs), including myositis-specific autoantibodies (MSA) and myositis- associated autoantibodies (MAA), are considered key biomarkers of IIM, with a prevalence of approximately 70% in patients, helping to classify patients into a more homogeneous clinical phenotypes [
4]. Anti-synthetase syndrome (ASSD), a subset of IIM, is characterized by the presence of anti-aminoacyl-tRNA synthetase (ARS) autoantibodies and the clinical triad of arthritis, myositis and interstitial lung disease (ILD). The pathophysiology of this condition involves an autoimmune response against cellular components which results in the development of inflammation and tissue damage [
5].
The diagnosis of IIM is challenging due to the diversity of clinical manifestations and MAs involved and the lack of consensus on classification criteria and interpretation of autoantibody positivity [
6]. For instance, the identification of MAs in patients with severe interstitial lung disease (ILD) has substantial implications for diagnosis and treatment, particularly in amyopathic dermatomyositis (DM) with anti- MDA5 autoantibodies and in cases of ASSD-associated anti-PL-7 or anti-PL-12 ARS-autoantibodies [
8].
Coronavirus disease 2019 (COVID-19) is a well-known multisystemic disease with a wide range of clinical manifestations, the first cases of which were reported in late 2019 in the Caucasian population. Emerging evidence suggests that the acute inflammatory response and production of autoantibodies contribute to the morbidity observed in patients with COVID-19 [
9]. Recently, case reports in the literature have described more atypical and rarer presentations of infection with Severe Acute Respiratory Syndrome Coronavirus 2 (SARS-CoV-2) resulting in a pattern of ILD [
10]. Some pathologies can radiologically mimic this pulmonary involvement, as occurs in many SAID, such as ASSD, DM, polymyositis (PM) and systemic sclerosis (SSc) [
11]. Therefore, it is crucial to perform a correct differential diagnosis, including the determination of MAs.
Also in recent years, the COVID-19 pandemic has led to increased research interest in autoimmunity. Although rare, cases of IIM following SARS-CoV-2 infection or vaccination have been reported. Several studies to date suggest that more severe autoimmune reactions may manifest through mechanisms such as molecular mimicry or virus- or vaccine-induced Toll-like receptor activation [
12]. A small but significant number of studies have reported the appearance of MAs after SARS-CoV-2 infection or vaccination. MAs detected include anti-Jo-1, anti-MDA5, anti-Mi-2α/β, anti-NXP2, anti-SAE1, anti-PL7 and anti-PL12 [
13]. There are documented cases in the literature of DM, PM and clinically amyopathic- DM developing within months of SARS-CoV-2 infection. [
14]. Similarly, a small number of patients have presented with myositis symptoms shortly after receiving a COVID-19 messenger RNA (mRNA) vaccine [
15].
Preliminary results showed an increase in the incidence of anti-MDA5 antibodies coinciding with the onset of SARS-CoV-2 infection in 2020, and anti-PL7 antibodies at the time of vaccination against COVID-19 in 2021 [
16]. Given the need for further epidemiological investigation, a multicenter study was conducted to assess the possible association of MAs, especially MSA-ARS autoantibodies with SARS-CoV-2 infection and/or vaccination. For this purpose, patients with a specific autoantibody profile were studied. This collaborative effort will facilitate the optimization of care for patients with IIM through the advancement of disease understanding and the implementation of standardized diagnostic approaches.
2. METHODS
2.1. Patients and Study Design
A multicenter retrospective observational study was conducted by the Immunology Department of the Hospital Clínico San Carlos in Madrid, Spain. Serum samples from patients with suspected IIM were referred to the Immunology laboratories for MAs determination by line blot immunoassays (LIA). Further analysis was performed on samples that tested positive for at least one or more MAs and were recruited between January and December 2022.
The results of the other parameters examined were obtained from the same or a closely related day's autoantibody analysis. A patient was considered to have a SARS-CoV-2 infection if the reverse transcription polymerase chain reaction (RT-PCR) or another validated test were positive and was written evidence in the patient's medical record. The vaccines administered were classified into two groups. mRNA vaccines includes the mRNA-1273 SARS-CoV-2 vaccine (Moderna) and the BNT162b2 vaccine (Pfizer). Non-mRNA vaccines includes the ChAdOx1 nCoV-19 vaccine (Oxford/AstraZeneca) and the Ad26.CoV2.S vaccine (Janssen). The term "combined vaccine" refers to administering both types of vaccines to the same patient.
For a more rigorous statistical analysis of the clinical associations and implications for diagnosis and prognosis, MAs were divided into three groups: 1. MSA-ARS (Myositis-specific anti-aminoacyl-tRNA synthetase autoantibodies), including anti-Jo-1, anti-PL-7, anti-PL-12, anti-EJ and anti-OJ); 2. MSA- Non-ARS (Myositis-specific non-anti-aminoacyl-tRNA synthetase autoantibodies), including anti-SRP, anti-Mi-2α/2β, anti-MDA5, anti-NXP2, anti-TIF1-γ, anti-SAE autoantibodies; 3. MAA (Myositis- associated autoantibodies) including anti-Ro-52, anti-Ku and anti-PM-Scl-75/100. Similarly, patients were classified into three groups based on their autoantibody profile: 1) Group I: MSA-ARS patients (Includes patients with one MSA-ARS and those with one MSA-ARS combined with one MAA); 2) Group II: MSA-Non-ARS patients (includes patients with one MSA-Non-ARS, patients with one MAA and patients with one MSA-Non-ARS combined with one MAA); 3) Group III: Multi-specificity patients (includes patients with two or more positive MAs, excluding those belonging to groups I and II).
In accordance with the clinical manifestations, patients were classified based on their clinical examination and evaluation by their physicians. These included asthenia, muscular involvement (proximal symmetrical weakness, motility disorders), skin lesions (heliotrope rash, Gottron's papules/signs, mechanic hands), and pulmonary involvement (clinical findings, high-resolution computed tomography findings/pattern, pulmonary function test results, or lung biopsy findings) and/or the presence of neoplasia.
Patients were divided according to their final diagnosis into four main groups: 1. ASSD or IIM-non- ASSD (including polymyositis (PM), dermatomyositis (DM) and, immune-mediated necrotizing myopathy (IMNM)); 2. SAID (including systemic lupus erythematosus (SLE), Sjögren syndrome (SjS), SSc or rheumatoid arthritis (RA), among others) and 3. Overlap IIM-SAID. The criteria used were those proposed by Solomon for ASSD and those proposed by EULAR/ACR for patients with IIM-non-ASSD and SAID. Patients with specific clinical features but insufficient for an accurate diagnosis were classified as pre-ASSD, pre-IIM-non-ASSD, pre-SAID or pre-IIM/SAID.
The study was approved by the hospital's Institutional Review Board (IRB) Ethics Committee (22/534- E).
2.2. Laboratory Assessment
2.2.1. Line Blot Immunoassay Analysis
In patients with clinical suspicion of IIM, MAs were analyzed using LIA methods from three commercial companies. The EUROIMMUN Myositis blot (AG, Lübeck, Germany) was used by 9 of the 11 centers and the following 16 myositis autoantibodies were measured: Jo-1, PL-7, anti-PL-12, EJ, OJ, SRP, Mi- 2α, Mi-2β, MDA5, NXP2, TIF1-γ, SAE 1, Ro-52, Ku, PM-Scl-75, PM-Scl-100. The intensities of the strips were analyzed using the EUROLineScan system and semi-quantitative units were obtained. According to the manufacturer's recommendations, the detection limit for weak positives was 11.
The other two centers employed myositis blot from two distinct commercial entities. The BlueDot Myositis, MYO12D-24 (D-TEK, Belgium) measures the following twelve MAs: Jo-1, PL-7, PL-12, EJ, SRP, Mi-2, MDA-5, TF1γ, HMGCR, Ro52, SAE1/SAE2, and NXP2. In addition, the following eight MAs were measured by Palex (Sant Cugat del Vallès, Barcelona): Jo-1, PL-7, PL-12, SRP, Mi-2, Ku, PM-Scl, and Scl-70. The assays yielded positive results with lower cut-off points of 10 for both assays. As can be observed, the autoantibodies were measured in a similar manner, with the exception of the autoantibody pairs PM75/PM100 and Mi-2α/Mi-2β, which were measured together. Due to the observed discrepancies in antibody measurement, it was deemed necessary to homogenize the data by quantifying the Mi-2α/Mi-2β and PM/Scl-75/PM-Scl-100 antibody pairs collectively.
A standard level of band intensity positivity was established for all centres, with low positive (LPOS)<20 and high positive (HPOS) >20 being considered.
2.2.2. Indirect Immunofluorescence Assay
Antinuclear antibodies (ANA) detection was performed by indirect immunofluorescence (IIF) technique using HEp-2 (human epithelial cell line) substrate slides. The serum samples were titrated from a starting dilution of 1/80 to the endpoint, with the results expressed as the last positive dilution. The ANA patterns observed were defined according to the International Consensus on ANA Patterns (ICAP). The results were stratified according to the titer positivity obtained into three categories: low titer (1/80 and 1/160), medium titer (1/320), and high titer (1/640 or ≥1/1280).
2.2.3. Extractable Nuclear Antigen Antibodies
We have evaluated extractable nuclear antigen (ENAs) antibody screening using different immunoassays among the participating centers: BioPlex 2200 ANA screen (Bio-Rad Laboratories, Hercules [CA], US) and APTIVA (CTD Essential, Werfen, USA) following a positive ANA test. The detected anti-ENAs antibodies, not included in the myositis blot, were: anti-DNA Topoisomerase I (anti-Scl-70), anti-double-strand DNA (anti-DNAds), anti-La/SSB, anti-Ro60/SSA, anti-Sm and anti- ribonucleoprotein (anti-RNP).
2.2.4. Muscle and Liver Enzymes
Measurement of serum levels of muscle creatine kinase (CK), alanine aminotransferase (ALT), aspartate aminotransferase (AST) and lactate dehydrogenase (LDH) was performed using an immunoturbidimetric method (Beckman Coulter AU480 Analyzer, Spain). The reference ranges values were as follows: The reference range for CK is ≤155 U/L, for ALT it is ≤35 U/L, AST it is ≤35 U/L and LDH 208-378 U/L. On the other hand, aldolase was quantified using a colorimetric enzymatic method (Sentinel Diagnostic, Spain). The manufacturer's reference values for aldolase measured with this kit range from 1.0-7.6 IU/L. Elevations above the normal ranges were considered to be abnormal.
2.2.5. Analysis of HLA Typing
The LIFECODES HLA-SSO kit was used for low-resolution typing of human leucocyte antigen (HLA) class I (HLA-A and HLA-B) and class II (HLA-DRB1, HLA-DQA1 and HLA-DQB1). Microsphere-bound oligonucleotide probes were analysed using the Luminex 100/200 system (Luminex Corp., Austin, Texas, USA), a flow cytometry-based platform using the principles of xMAP technology. Written informed consent for genetic analysis was obtained from the patients studied.
2.3. Statistical Analysis
The results were presented in a narrative format. For continuous variables, the data were summarized by mean (standard deviation), median (range), and frequency/percentage. For categorical variables, the mean (standard deviation) or median (range) were employed. The number and percentage of subjects in each category were used to describe categorical variables. The chi-square test was employed to assess the statistical significance of differences between categorical variables across groups, with a p-value of less than 0.05 considered to be statistically significant. The statistical analysis was conducted using the SPSS software version 27, Microsoft Excel version 14.1.0, and GraphPad Prism software version 8.1.0.
3. RESULTS
3.1. Overall Overview and Incidence of Myositis Autoantibodies
A retrospective analysis was performed on patients’ samples in which a MA profile was requested between January 2022 and December 2022. If a patient underwent one or more repeated tests with a positive MA result after an initial negative result, only the initial positive result was considered.
A total of 11 hospitals in Spain participated, with the following distribution of patients in descending order: 1) Hospital Universitario Donostia, San Sebastián (n=250); 2) Hospital Clínico San Carlos, Madrid (n=230); 3) Hospital Universitario Nuestra Señora de Candelaria, Santa Cruz de Tenerife (n=154); 4) Hospital Universitario Reina Sofía, Córdoba (n=50); 5) Hospital General Universitario Gregorio Marañón, Madrid (n=31); 6) Hospital Universitario Puerta del Mar, Cádiz (n=19); 7) Hospital Universitario Son Espases, Palma de Mallorca (n=17); 8) Hospital Universitario Germans Trias y Pujol, Badalona (n=15); 9) Hospital Universitario de Jaén (HUJ) (n=14); 10) Hospital General Universitario de Valencia (n=4) and 11) Hospital de Mérida (n=4).
A total of 841 patient requests were received out of more than 1,000 positive patients reported. After applying the exclusion criteria, the total number of patients included was 788 with a cumulative count of 1,209 MAs. Repeated requests (n=50) for the same patient were excluded. Therefore, if a patient underwent one or more repeat tests with a positive MA result after an initial negative result, only the initial positive result was considered. Patients under 18 years of age were also excluded.
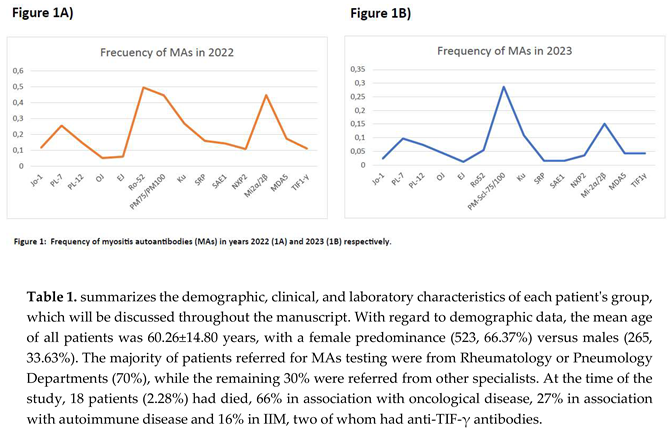
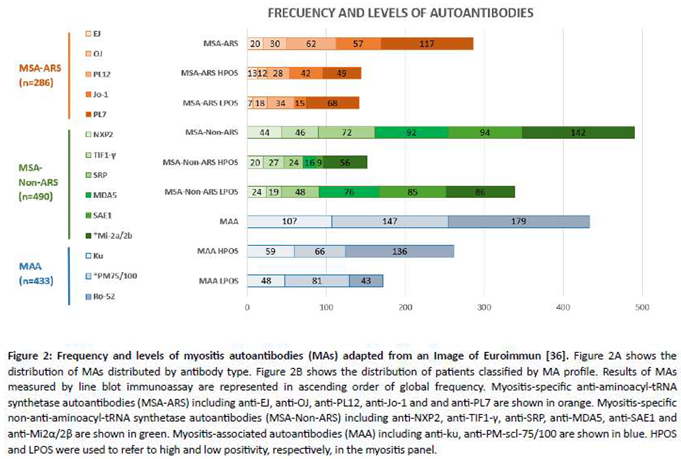
The frequency distribution of each MA collected in this work is shown in Figure 2A. To compare whether the positivity profile was similar in subsequent years, the frequency of MAs in 2023 was calculated using patients from the San Carlos Clinical Hospital as a cohort (Figure 2B).
3.2. Autoantibody Profile: Frequency and Levels
Figure 2A illustrates the total number of autoantibodies, along with their respective positivity levels expressed in absolute numbers. Of the total 1,209 MAs, 286 were MSA-ARS (23.65%), 490 MSA-Non- ARS (40.52%) and 433 MAA (35.81%). The most prevalent MA was anti-Ro-52 (14.81%), followed by anti-PL-7 (9.68%), with the *anti-PM-Scl-75/100 and *anti-Mi-2α/β and antibody pairs accounting for 12.16% and 11.75% respectively. A total of 557 (46.07%) HPOS autoantibodies were observed,distributed in: 144 MSA-ARS (25.85%), 152 MSA-Non-ARS (27.29%) and 261 MAA (46.89%). The HPOSMAs, in descending order of frequency, were as follows: anti-Ro-52 (24.42%), anti-Ku (10.59%), anti- Mi-2α/β (10.05%) and anti-PL7 (8.77%). On the other hand, the total number of LPOS was 652 (53.93%) grouped into 142 MSA-ARS (21.78%), 338 MSA-Non-ARS (51.84%) and 172 MAA (26.38%).
The most common LPOS MAs were listed in ascending order of frequency: anti-SAE1 (13.04%), *anti- Mi-2α/β (13.19%) *anti-PM-Scl-75/100 (12.42%), anti-MDA5 (11.66%) and anti-PL-7 (10.43%).
As illustrated in Figure 2B, the 788 patients were categorized into three groups based on their autoantibody profile. Group I: 123 MSA-ARS (15.61%) and 49 (MSA-ARS + MAA) (6.22%); Group II: 193 MSA-non-ARS (24.50%), 201 MAA (25.51%) and 49 (MSA-non-ARS + MAA) (6.22%); Group III: 173 patients (21.95%) with different combinations of autoantibodies: 114 MSA-ARS, 248 MSA-non-ARS, and 134 MAA. In group I, the most prevalent MSA-ARS was anti-PL7 (38.37%), followed by Jo-1 (26.74%). The most prevalent associated MAA in this subgroup was Ro-52 (81.63%), positive in 23.26% of MSA-ARS patients. In Group II, the most prevalent MSA-Non-ARS was anti-Mi-2α/β (16.87%), with the associated MAA being PM-Scl-75/100 (38.09%) and Ro-52 (36.11%). The remaining MSA-Non-ARS autoantibodies exhibited a similar frequency.
As shown in Table 1, there were significant differences in the antibody titers between the groups. In particular, the levels of HPOS autoantibodies were found to be significantly higher in groups I and II compared to group III (p <0.001). Conversely, patients in Group I exhibited greater HPOS autoantibodies than those in Group II (p <0.05). Among patients in group I with HPOS, the most prevalent MAs were Jo-1 (26.857%), Ro52 (23.07%), and PL-7 (22.37%). In groups II and III, the most prevalent autoantibody was anti-Ro-52, present in 27.41% and 20.38% of cases, respectively. With regard to LPOS autoantibodies, PL-7 was the most prevalent autoantibody in group I (43.59% of cases), PM-Scl-75/100 in group II (22.65%) and SAE1 and MDA5 in group III, with 17.16% and 16.57% of cases, respectively.
3.3. MAs Associated with ANA Antibodies
In regard to ANA-associated autoantibodies as determined by Hep-2, 60.66% (n=478) of patients exhibited a positive result, with no statistically significant differences between groups. In Group I, the majority of patients presented a cytoplasmic pattern, present in 63.37% of positive cases, higher than the ANA patterns observed in groups II and III (p<0.001). Among the MSA-ARS autoantibodies in group I, the predominant IIF pattern for Jo-1 was the cytoplasmic fine speckled (AC-20) pattern (54.76% of positive cases), whereas the cytoplasmic fine dense speckled (AC-19) pattern was mostly observed in association with PL-12 (53.85% of positive cases). The nuclear fine speckled (AC-4) pattern was identified as the predominant pattern for the remaining MSA-ARS autoantibodies (PL-7, EJ and OJ). In contrast, in groups II and III, the predominant ANA pattern was nuclear fine speckled (AC-4) in 84.49% and 73.87%, respectively, which was higher than in group I (44.95%, p<0.001).
Finally, regarding the presence of extractable nuclear antigens (ENA), 17.13% of patients had positive ENA, with no significant differences between groups (p>0.05). Among these, the most prevalent antibody was the anti-Ro52 antibody (65.98%) associated with ASSD (27.83%). Referring to the ENAS not included in the myositis blot, RNP was the most prevalent antibody at 12.92%, and it was mostly associated with ILD in 31.57% of cases in the context of CTD, SLE, and SSj.
3.3. Antibody Association to COVID-19 Infection Or Vaccination
The different combinations between groups according to whether they were infected and/or vaccinated against SARS-CoV-2 are shown in Table 1. Of the total 788 patients, 720 patients were
vaccinated, and classified according to Ab groups: Group I (n=165); Group II (n=393) and Group III (n=162) (p<0.05 group I vs group II). In the same way, there were a total of 299 patients with documented infection, distributed by group as follows: Group I (n=60), Group II (n=158) and Group III (n=81) (p<0.05 group I vs III).
Among patients with a history of SARS-CoV-2 infection confirmed by RT-PCR or an antigenic test, 47.16% of the cases had onset of symptoms suggestive of IIM after infection. There was a greater number of patients who belonged to group III compared to group I (26.59% vs. 13.95%, p<0.05). A total of 44 patients were diagnosed with long COVID, 28 belonged to groups I and II and 16 to group III.
Referred to vaccinated patients, 43.33% had symptoms compatible with IIM after vaccination. In group II there was a lower percentage of patients (36.57%) compared to groups I and II (43.93% and 43.02%, respectively) but with no significant difference between groups (p>0.05).
The distribution according to the type of vaccine administered indicated a higher proportion of mRNA vaccines in groups I and III compared to group II (group II vs. III, p < 0.05). The group of patients with the highest non-mRNA vaccine administration was group II (p >0.05), while in group III, the presence of combined vaccines was significantly greater (p < 0.05).
3.3. Description of clinical manifestations. Diagnosis, treatment and outcomes
The clinical characteristics of each group of patients are presented in Table 1. The prevalence of asthenia was significantly higher in groups I and III than in group II (p < 0.05). Pulmonary involvement and the presence of a neoplasm were more prevalent in group I than in groups II and III (p < 0.05). A significant majority of patients with fibromyalgia were observed in group II (p<0.05). No significant differences were observed between the groups for the remaining clinical manifestations.
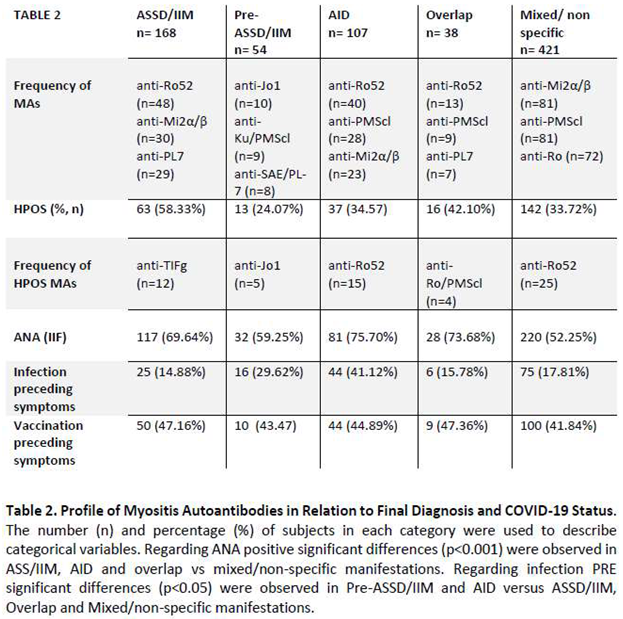
Subsequently, patients were classified into four categories according to their final diagnosis. The total number of patients with a diagnosis of ASSD or IIM-non-ASSD was 21.31% (n=168), which was significantly higher in groups I and III than in group II (p<0.05). A total of 54 patients (6.8%) were classified as pre-ASSD/pre-IMM, with this diagnosis being more common in group I than in group II (p< 0.05). The third group of patients were those diagnosed with a SAID other than IIM, including a total of 107 patients (13.57%). The most common SAID were SLE (n=15), RA (n=14) and SjS (n=11). The remaining patients were diagnosed with one of the following conditions: vasculitis, connective tissue disease, antiphospholipid syndrome, celiac disease, multiple sclerosis, cryoglobulinemia, primary biliary cholangitis and bullous pemphigus. Group III exhibited a higher prevalence of this diagnosis than the other groups (p < 0.05, group III vs. group I). The fourth group consisted of patients diagnosed with overlap myositis (4.82%, n = 38). Finally, the remaining patients (n=421) were classified as having no diagnosis or non-specific clinical features of IIM.
Table 2 Show the main characteristics of each group of patients, grouped by final diagnosis. The group with the highest number of HPOS antibodies was the group of patients diagnosed with ASSD/IIM (n=63, 58.33%), but there was no significant difference between the groups (p>0.05).
In the ASSD/IIM group anti-TIF-γ (n=12) and anti-Ro-52 (n=11) antibodies were the most commonly associated antibodies for the HPOS. Other autoantibodies such as anti-PL-7 (n=5), anti-Mi-2α/β (n=5)and anti-Ku (n=5) showed LPOS titers. In the PRE-ASSD/IIM group the most common HPOS antibodies was anti-Jo-1 (n=5), followed by anti-Ku (n=3). In AID, 34.57% (n=37) had HPOS antibodies titers, with Ro (n=15) the most frequent antibody. The distribution for the overlap group of combined and HPOS titers was similar (n=16). The most common antibodies in the latter group were Ro (n=4) and PM-Scl- 75/100 (n=4).
It is pertinent to highlight that the antibodies most frequently associated with neoplasia were anti-Ro- 52 (n=28), anti-PMScl-75/100 (n=19), and anti-TIF-γ (n=15). Of the patients with dermatomyositis diagnosis, 27.90% (n=12) presented high titers of anti-TIF-γ antibodies, of which 66% (n=8) were paraneoplastic. Conversely, the antibody most closely associated with the presence of ILD was anti- MDA5 (n=28), followed by anti-Ro-52 (n=27) and anti-SAE (n=27). Consequently, while anti-Ro-52, anti-PM-Scl-75/100, and anti-TIF-γ antibodies are more commonly associated with neoplastic processes, anti-MDA5 appears to be the most predictive serological marker of interstitial lung disease in patients with inflammatory myopathies (30.4%). In terms of cutaneous involvement, the most frequently associated antibodies were anti-Ro-52 (n=65), anti-PM-Scl-75/100 (n=44), anti-Mi-2α/β (n=41), Ku (n=36).
The distribution of ANA antibodies in the different groups is shown in Table 2. The presence of ANA was statistically higher (p<0.05) in the ASSD/IIM (69.64%), SAID (75.70%) and overlap IIM-SAID (73.68%) groups compared to the pre-ASSD/IIM (59.25%) and Mixed/Non-specific (52.25%) groups.
Regarding the onset of symptoms after infection, there was a significant majority of patients classified in the ASSD/IMM and overlap groups compared to the other groups (p<0.05).
On the other hand, patients who started with symptoms suggestive of IIM after vaccination were distributed in all groups without significant differences (p<0.05), although the highest percentage was observed in the AID group (45.79%) of all vaccinated patients with or without infection. These results were similar in patients only vaccinated without documented infection, as shown in Table 2, with a higher percentage observed in the overlap group (47.36%).
A comparison of patients with documented infection versus only vaccinated patients without documented infection revealed statistically significant differences with respect to anti-TIFy antibodies (p=0.014) in the vaccinated group and a higher prevalence of anti-PM-Scl antibodies (p<0.021) in the infected group.
3.6. HLA Typing in a Subgroup of Patients
A subset of 36 patients from the Hospital Clinic San Carlos underwent HLA class I and II gene analysis. All patients had a positive result for MA in 2022, and the result was confirmed one year later, along with the HLA gene study. While HLA testing was only available for a subset of the cohort, we deemed it important to include the results in the article for the benefit of the wider readership.
Of the patients studied, 61.1% (n=22) had a diagnosis of IIM or other SAID, while the remainder (n=14) had one of the following clinical symptoms: EPID, arthralgia, neurological symptoms or fibromyalgia. The main antibodies found were MSA-ARS, present in 50% (n=18) of patients, the most common being anti-PL7 and anti-PL12 (n=13).
With regard to HLA class I gene typing, all patients carried at least one of the following HLA-DR alleles: HLA-DR*01, HLA-DR*03, HLA-DR*04, HLA-DR*07; HLA-DR*11; HLA-DR*13 and/or HLA-DR*15. The most common alleles were HLA-DR*03 and HLA-DR*04, present in 56% (n=20) of all patients. The HLA- DR* allele combinations in the population were distributed as follows: 17% (n=6) of patients were homozygous for one of the above alleles, 63.9% (n=23) of patients carried combinations of two of these HLA-DR alleles and 19.4% (n=7) carried only one of these alleles in combination with another allele.
In contrast, 89% (n=32) of the patients carried at least one of the following HLA-A alleles in ascending order: The most common alleles were HLA-A*02 (44.4%, n=16), HLA-A*24 (16.7%, n=6), HLA-A*26 (13.9%, n=5), HLA-A*30 (11.1%, n=4) and/or HLA-A*33 (n=5). It is worth noting that only two patients were homozygous. One was homozygous for HLA-A*26 and had been diagnosed with ASS following SARS-CoV-2 infection. The other was homozygous for HLA-A*02 and had experienced severe neurological symptoms following SARS-CoV-2 infection. The results showed that 37.5% (n=12) of patients carried two of the aforementioned alleles, while the remainder (62.5%, n=20) carried only one.
Finally, the allele distribution for the HLA-B genes was found to be very heterogeneous. A study in a larger cohort would be necessary to draw clearer conclusions.
4. DISCUSSION AND FUTURE RESEARCH
Our data point to an unusually high number of IIM cases progressively increasing from 2020, 2021 and 2022 and 2023 in Spain, a highly vaccinated country, with specific MA patterns. Autoimmune and inflammatory pathologies have been associated with various infectious diseases, including the COVID- 19 [
17]. In a previous study, our group identified a significant increase in anti-RNA-sensor (MDA5) and anti-ARS (PL-7) antibodies coinciding with the 2020 and 2021 COVID-19 pandemic years respectively, based on LIA results [
16]. Nevertheless, David P. et al. demonstrate an increase in new cases of anti- MDA5, yet other MSAs did not exhibit this striking pattern of increase. Interestingly, differences in antibody profile have been reported in different geographic groups during pandemic [
18]. For example, Asian populations have displayed higher frequencies of anti-ARS and anti-MDA5 antibodies than Caucasian populations [
19].
Recent studies have indicated that the mortality rate of IIM accounts for 24% after a median follow- up period of 9.7 years, underscoring the importance of early diagnosis and treatment of these patients [
20]. During the 2022 study period, the mortality rate in our cohort was 2.28% (n=18). Of these deaths, 66% were associated with some type of oncological process and the remaining cases in the context of autoimmune background and IIM. In recent years, an increased incidence of MAs and other new-onset autoimmune diseases has been reported, coinciding with the COVID-19 pandemic. We decided to conduct a retrospective, observational, multicentre study from a routine diagnostic setting of the immunological characteristics and clinical spectrum of IIM based on the array of MAs detected during COVID19 pandemic.
The identification of MAs, in conjunction with other complementary parameters, is of paramount importance for the diagnosis, prognosis, and treatment of IIM. The gold standard method for the detection of MAs is immunoprecipitation. However, there is no general consensus on the detection limits of MAs in the commercial methods used, and there is controversy over their utility in IIM classification criteria. The detection of some antibodies, such as anti-MDA5, by immunoblotting correlates well with immunoprecipitation, but the detection of other antibodies, such as anti-OJ, by commercial methods has low sensitivity. This poses a challenge in routine practice due to the difficulty of interpreting the results. It is therefore crucial to emphasize the importance of laboratory work in antibody standardization. While the 2017 EULAR/ACR criteria consider only anti-Jo-1 as a biomarker for the diagnosis of IIM, in clinical practice it is important to evaluate other less frequent but significant MAs that can be detected through routine tests such as line dot immunoassays [
21,
22]. The exclusive reliance on anti-Jo-1 as a diagnostic criterion may result in the misdiagnosis of patients who would benefit from early intervention and improve outcomes with early immunosuppressive treatment.
In comparison to the prevalence of anti-PL-7 antibodies observed in the IIM population (<5%), our cohort exhibited an increased prevalence of 14%, which is higher than expected. A higher percentage of anti-PL-7 antibodies (38%) compared to anti-Jo-1 (26%) antibodies were also observed in group I. This prompts the question of whether this change in the detected antibody profile, when compared to those described in the literature, could be related to a specific stimulus that may result in the release of cryptic epitopes expressed on antigen-presenting cells, which could potentially lead to an autoimmune response. Despite the described high prevalence of anti-Jo-1 antibodies in patients with PM (28%-30%) [
23], our cohort exhibited a very low prevalence of this condition, at 5%. Nevertheless, 33% of the cohort with anti-Jo-1 received a final diagnosis of ASSD.
The majority of MAs identified during 2022 belonged to Group II (MSA-non-ARS). The highest number of HPOS belonged to anti-Ro-52 MAA with an overall prevalence of 22% in our cohort. MAAs can coexist with MSAs, with anti-Ro52 being one of the most common, helping to identify patients with more severe interstitial lung disease (ILD) and poorer outcomes [
24].
Although there are studies indicating that LPOS should be interpreted with caution and many authors describe this as a possible clinical false positive result, it is important to interpret the results taking into account the patient's clinical history. Our results demonstrated a higher frequency of anti-MDA5 and anti-SAE with LPOS associated with pulmonary involvement (17-20%). There are practically no long-term follow-up studies of these antibodies at LPOS. Most of the studies performed in patients with positive MAs are based on well-defined clinical phenotypes [
25], as opposed to the presence of MAs in clinical groups with non-specific manifestations and long-term follow-up. However, a recent investigation indicates that patients with positive anti-MDA5 autoantibodies exhibit distinct phenotypic clusters. Those who survive the first three months, either by navigating the fulminant stage or beyond, may demonstrate progressive improvement in lung function and a favorable prognosis. In contrast, patients with anti-PL7 antibodies are more likely to experience a progressive loss of lung function and may have a higher subsequent mortality rate than other patient groups. [
26].
The prevalence of anti-TIF-γ antibodies in DM has been reported to range from 7% to 41% [
27], with an association with cancer in the range of 19 to 100%. In our cohort, the observed prevalence was 27% associated with DM and 32% cancer-associated. It is noteworthy that 30% of patients with DM exhibited an associated oncologic process and 62% exhibited the anti-TIF-γ antibody as the most frequently detected antibody, with a median age of 72 ± 12 years and a male predominance. While anti-TIF-γ and anti-NXP2 are the most common antibodies associated with neoplasia [
28], group II (MSA-non-ARS) has been the group with the highest frequency of this manifestation.
While the prevalence and clinical associations of specific autoantibodies like anti-TIF-γ are important considerations, the choice of serological testing method can also impact the diagnosis of IIM. Some authors propose that ANA screening by HEp-2 IIF supports the diagnosis of IIM, while others argue that it is a technique with limitations due to insufficient sensitivity for some MSAs [
29]. Our findings indicate that there is no significant difference in ANA positivity between the groups, which was approximately 61%, in agreement with recent publications [
19]. Statistically significant differences were observed for AC-19 and AC-4 immunofluorescence patterns between the groups. In certain instances, the presence of characteristic HEp-2 and tissue patterns enhances the test's specificity. This finding was also confirmed in the group of patients with SAID. Although no statistically significant differences were observed in antibody titers between final diagnosis groups, the one with the highest percentage of strong positivity was the ASSD/IIM group. The ASSD/IIM, AID, and Overlap groups demonstrated greater consistency with positive ANA IIF, which supports the specificity of both techniques for clinical diagnosis with respect to the PRE-ASSD/MII and Mixed/non-specific clinical features.
Recent studies have demonstrated that SARS-CoV-2 infection may increase the risk of developing another SAID in individuals with pre-existing autoimmune conditions [
30]. It is notable that the incidence and prevalence of SAID vary across geographical regions. Overall, the prevalence of autoimmune diseases is estimated to be between 3 and 5% in the general population [
31]. The prevalence of SAID in our cohort was 13%, which exceeds the double than the rate observed in the general population. A recent review of 40 cases of COVID-19-associated myositis revealed that patients with a history of myositis concurrent with or developed post-infection comprised 78% of these cases, while myositis developed in the setting of vaccination comprised 22% of the cases. No cases of patients with a prior autoimmune disease history were included in the study [
32]. Despite the lack of sufficient data to investigate potential associations between antibody positivity and the development of AID in our group, twelve patients (2%) exhibited clinical onset post-pandemic. The remaining patients had already been diagnosed with SAID, thereby confirming the role of an underlying autoimmune background in the development of myopathies.
A recent publication has highlighted the coexistence of two or more MSA among patients with IIM, with a prevalence of 5.3% and a higher frequency of ILD. The presence of multiple MSAs complicates the classification of IIM and suggests a more complex autoimmune pathogenesis than previously thought [
33]. Group III consisted of patients with multiple positivity, 25% of whom exhibited interstitial lung disease. This group received the highest percentage of combined vaccines. The phenomenon of molecular mimicry, whereby vaccine antigens resemble self-antigens, has been postulated to play a role in the pathogenesis of SAID [
12]. This is believed to occur through the activation of autoreactive T cells. It is postulated that adjuvants in vaccines share structural similarities with self-antigens, leading to cross-reactivity. Although the concepts of molecular mimicry and bystander activation are theoretical, the precise pathogenic processes linking vaccinations to autoimmune disorders remain unclear [
34]. The distinct immune signatures elicited by the different vaccine combinations demonstrate that the immune response is shaped by the type of vaccines applied and the order in which they are delivered [
35]. This could explain our observation in group III.
It is acknowledged that one of the limitations of this study is the absence of radiological and/or muscle biopsy data in many patients' medical records. This precludes the performance of statistical analyses with these important diagnostic variables, which are part of current clinical practice for evaluating myositis. It should be noted, however, that clinical manifestations such as myositis may be the sole or initial presentation of IIM without involvement of other organs. This limitation underscores the lack of consensus across centers regarding cutoff points used to determine positivity for MAs. While the majority of centers employed manufacturers' cutoff points as previously mentioned, there was no uniformity in practice. Specifically, some specialists only reported MA positivity if clinical signs of IIM were present, whereas others established their own cut-off points based on experience, which introduced inconsistencies when comparing positivity rates between patients seen at different centers. Consequently, the absence of diagnostic data and the inconsistency in MA cutoff interpretations present challenges for the study conclusions. Furthermore, due to the use of different commercial kits for antibody measurement, some of which simultaneously measured anti-Mi-2α/β and anti-PMScl-75/100 antibodies, there is a possibility that our results were overestimated. To address potential limitations associated with heterogeneous assay methodologies, future studies could aim to standardize assay protocols, thereby facilitating more robust comparisons across patient cohorts.
This study presents our collective clinical experience and insights gained over the course of the COVID- 19 pandemic. Despite ongoing efforts to standardize autoantibody testing, further progress is required to establish international cut-off values and reporting methods. Our preliminary findings suggest a potential correlation between SARS-CoV-2-induced myositis and MA positivity. This lends support to the hypothesis that viral immunological dysfunction, intrinsic predisposition, and unknown molecular triggers contribute to post-infection autoimmunity. However, one of the limitations of this work is not being able to compare these results with those obtained in the same time period before the pandemic. Further research is therefore required to ascertain the actual magnitude clinical relevance of myositis- antibody associations in the context of post-COVID19 pandemic. While standardized protocols are still lacking, our experience demonstrates antibody profile differences versus prior reports, which should be taken into account. This underscores the importance of validation to refine clinical classification and phenotype characterization, thereby advancing our understanding of disease pathogenesis. Future research should aim to elucidate possible mechanisms underlying the association between infection and/or vaccination, ideally including homology between SARS-CoV2 spike proteins and some myositis antigens, mainly ARS.
Additional studies are required to address several outstanding questions regarding the role of MAs in the association between MII and SARS-CoV-2:
How does the clinical pattern of IIM correlate with the specific type of antibody involved, especially in the presence of multiple antibodies?
Could the potential epitopes recognized by each antibody provide insight into the mechanisms underlying the association with COVID-19?
Is it necessary to perform a clinical follow-up in those patients with antibody positivity and nonspecific clinical manifestations, for how long?
Does the persistence of these antibodies over time without associated clinical symptoms indicate a milder clinical phenotype or a true false positive?