Submitted:
08 November 2024
Posted:
08 November 2024
You are already at the latest version
Abstract
The effect of the angular rolling process on the plan view pattern of the plate is studied, the rectangular influence factor and improvement method for plate angular rolling process are proposed in this paper. Finite element models are established for the conventional rolling and angular rolling processes respectively, and with DEFORM software, the numerical simulation is carried out. A characterization formula reflecting the rectangular degree of the rolled piece is constructed and the rectangular degree of the plates under different rolling process conditions are compared. Considering the actual rolling process conditions, the range of theoretically calculated rectangular rotation angles is extended to obtain the optimum rectangular rotation angle with finite element simulation method. The one-group two-pass angular rolling is separated to one-group four-pass rolling and the simulation results show that the rectangular degree of the four-pass process is better than the two-pass process. Angular rolling experiments are carried out, the actual data shows that the rectangular characteristic value of the rolled piece is 1.003 with the four-pass process, and 1.014 with the two-pass process. It verifies that with separating one-group two-pass angular rolling process to one-group four-pass angular rolling process can improve the rectangular degree of the rolled plate.
Keywords:
plate
; angular rolling
; rectangular
; numerical simulation
; experimental study
1. Introduction
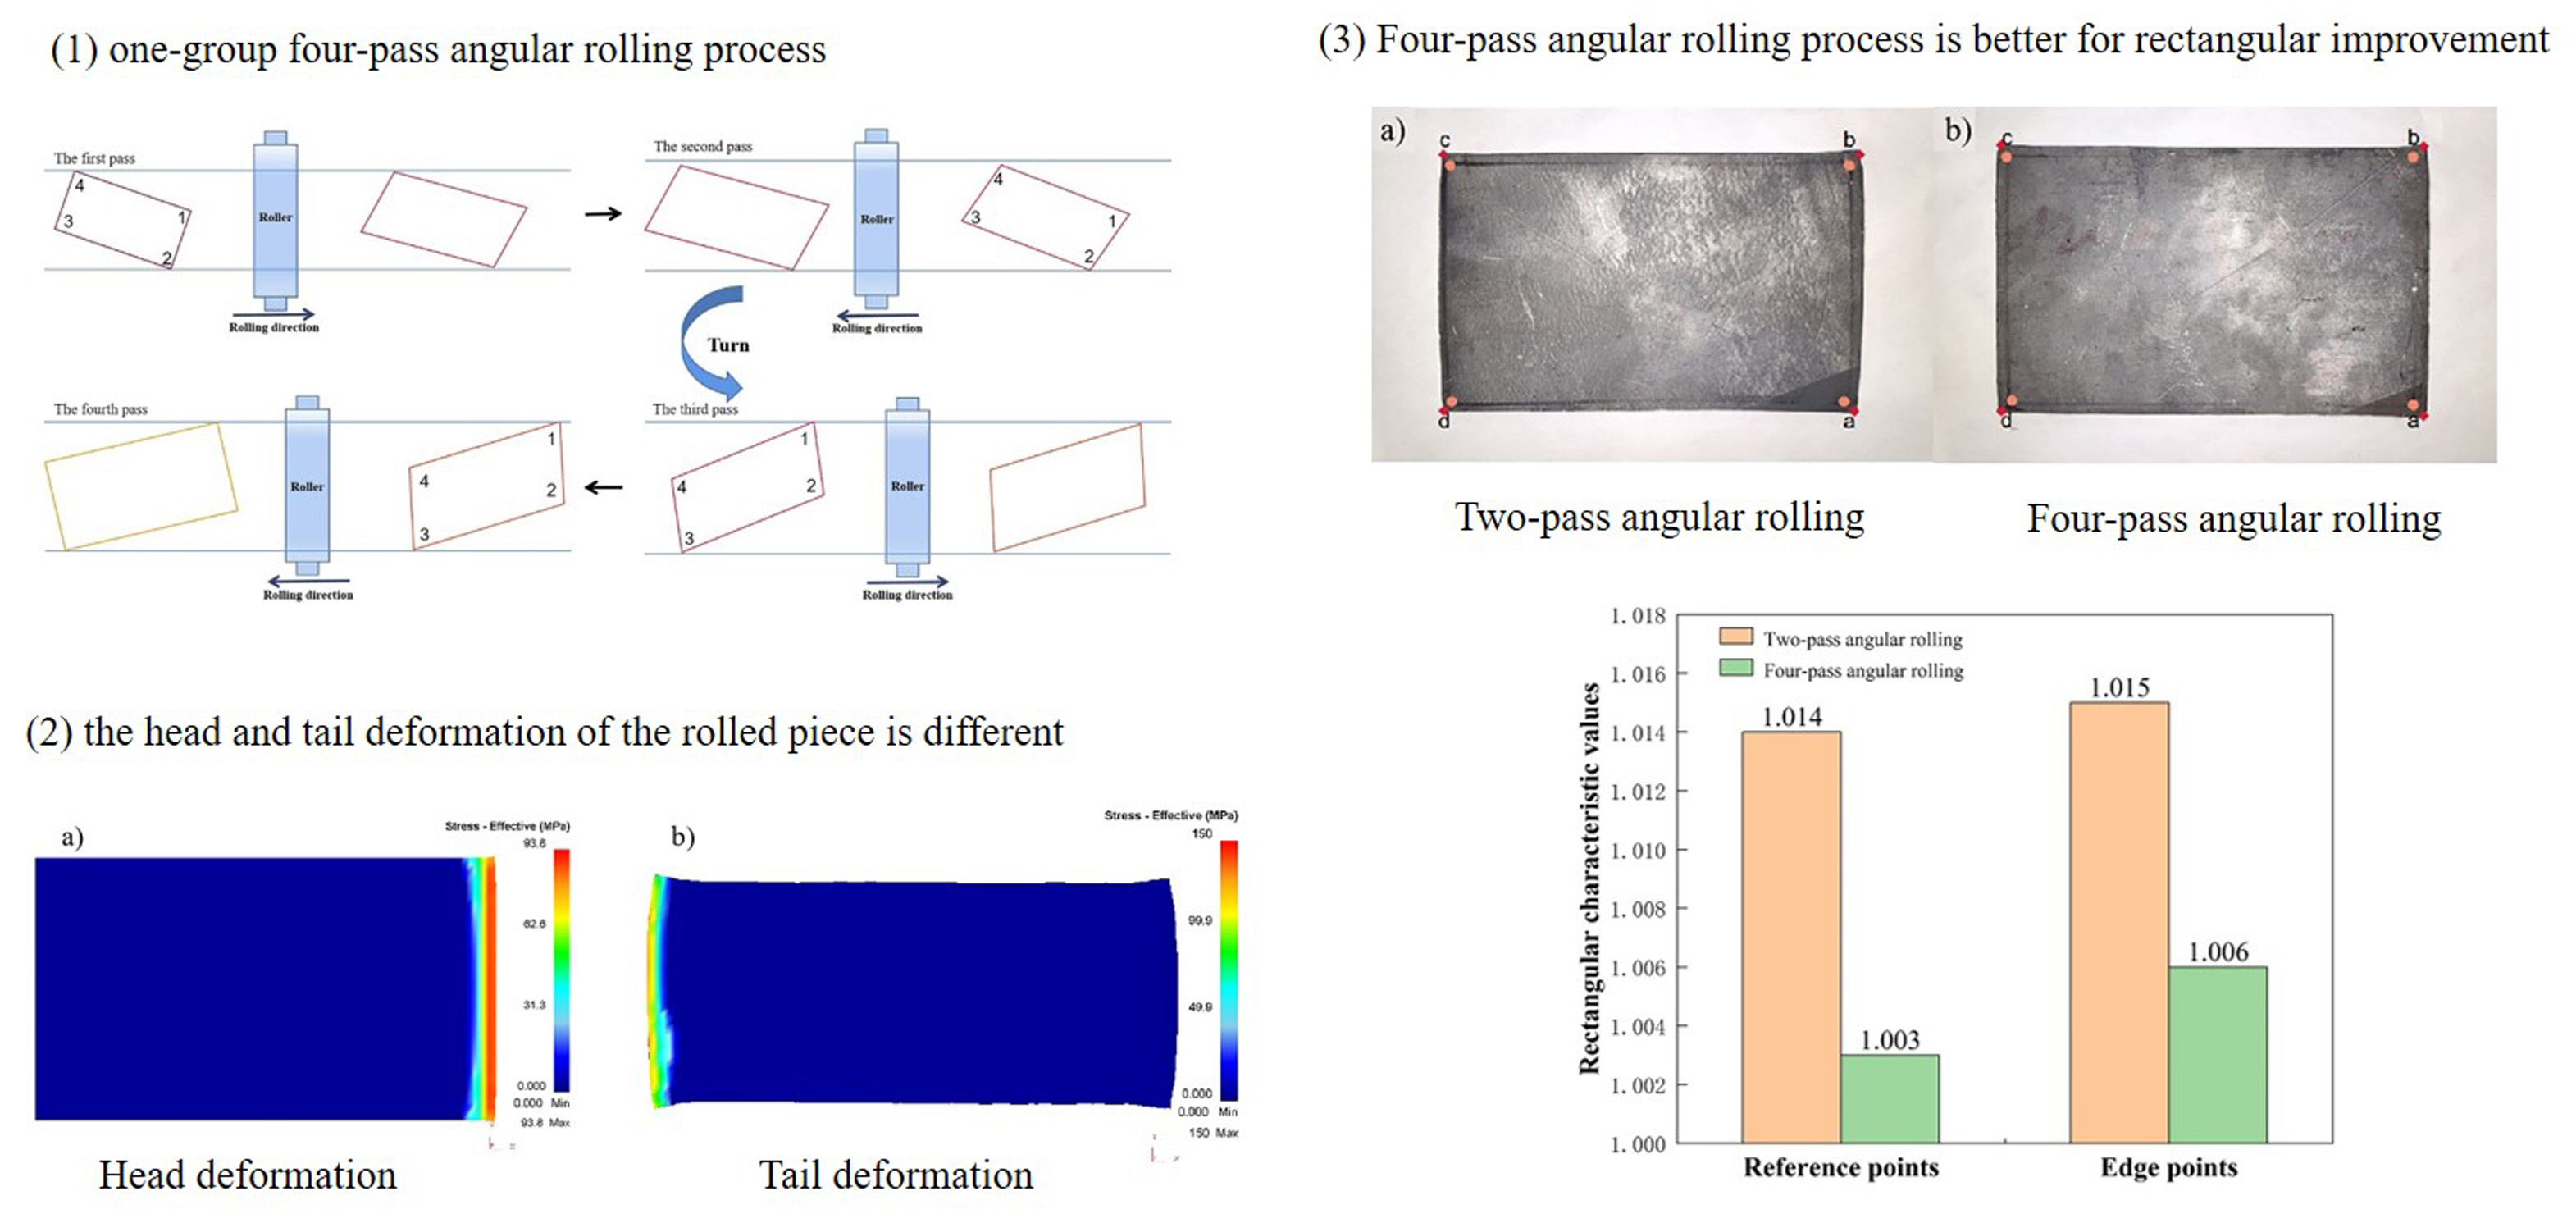
The world steel industry has entered a new stage [1]. Medium and heavy plate, as an important type of steel, acts an irreplaceable role in national economic construction, national security, and other aspects [2]. With the continuous changing of customer’s demand, the larger unit weight plates are needed [3]. When conventional rolling process is used to produce large unit weight products, the required length of slab is larger than the equipment’s limit, so the rolling mill capacity cannot meet the production requirements. In addition, in the production of plate with a small spread ratio, the plate also needs to be turned two times, it reduces production efficiency. These problems can be solved with angular rolling process [4]. In the process of production, the center line of the slab is rolled at a certain angle away from the rolling direction for the method of angular rolling [5,6]. Angular rolling is a rolling technique between broadening rolling and elongation rolling, as shown in Figure 1. During angular rolling process, the rolled piece is first rotated by a certain angle to set No. 1 corner biting into roll gap at first. The plan view pattern of rolled piece is rolled become a parallelogram. Then the rolled piece is turned to set No. 4 corner biting into roll gap at first. The plan view pattern of rolled piece is rolled from a parallelogram to a rectangle again [7].
Angular rolling process was first studied by scientists in the former Soviet Union, the width formula for angular rolling was proposed. And in China, in the 1990s, Li proposed a new formula for angular rolling [8]. Cao, et al. developed a calculation model and automatic control system for the angular rolling process [9]. Cao et al. explored the method of rotation angle control, obtained empirical widening parameters [10]. During the development and theoretical study of the angular rolling process, Zhou studied the effects of angular rolling process on the plate mechanical properties, and the improving of mill rolling conditions [4]. Hao et al. established a mathematical model based on the influence function method to calculate the thickness distribution and rolling force during angular rolling [11].
In the current research on the plate rolling process, using finite element software for simulation and analysis can greatly reduce research costs. Data close to actual situation can be obtained by establishing a reasonable finite element model. Finite element simulation studies have got good results in the evolution behavior of voids [12]. the prediction of the plan view pattern and the shape changing rule during plate rolling [13,14,15,16], and the width spreading of angular rolling [17,18]. DEFORM-3D, a finite element software which is quite suitable for rolling process researches, has also been applied to different aspects of strip and plate rolling process studies. Meanwhile, the experimental validation results have demonstrated the reliability of numerical simulations using DEFORM [19,20,21,22,23,24,25].
The tough problem during the practical application of angular rolling technology is that rectangular pattern is difficult to control. The rectangular degree is closely related to the yield rate which is an important factor affecting economic indicators. The method to improve the rectangular degree in conventional rolling is mainly to use the plan view pattern control technology [26]. Jiao et al. developed a mathematical model for plan view pattern prediction and control online[27,28,29]. Hiroyasu et al. proposed a technique of parameter identification with a locally weighted regression model for plan view pattern control of steel plates[30].
The plan view pattern control in conventional rolling technology is difficult to apply to the angular rolling process. How to improve the plan view pattern of the plate after angular rolling has become a tough problem at present. Hao proposed a method to predict the plan view pattern of the plate after angular rolling by segmenting the plate[31]. Jiao et al. used the trigonometric function and the principle of constant volume to predict the plan view pattern changing during two-pass angular rolling process, and obtained the relationship between the two passes that still revert to rectangular pattern after two-pass, under ideal conditions[32,33].
However, the two-pass angular rolling processes described above are based on ideal conditions, where the biting and throwing stages are considered symmetrical. The difference between the biting and throwing stages of the plate deformation is ignored. In the actual production process, it is difficult to ensure that the plane pattern of rolled piece is completely symmetrical, after two-pass angular rolling process.
In this paper, based on the difference between the biting and throwing stage plate deformation, the two-pass angular rolling process is separated to four-pass angular rolling process. The whole process is shown in Figure 2, the corner 1 is first bitten into the roll gap, then reverse rolling pass is carried out without turning the rolled piece. The corner 3 is rolled, and the rolled piece becomes a parallelogram. Then the rolled piece is turned, the corner 2 is rolled. Finally, another reverse rolling pass is carried out, the corner 4 is rolled, the rolled piece becomes a rectangle again. In this process, each corner of the rolled piece has been rolled through a biting phase and a throwing phase. With this process, the plan view pattern after angular rolling may be modified.
This paper studied the effect of the angular rolling process on the plan view pattern of the plate. In the second part of this paper, the conventional rolling and angular rolling process of steel plate are investigated with finite element numerical simulation method. The formula of rectangular characteristic value to characterize the rectangle degree of rolled plate is proposed. In the third part of this paper, one-group two-pass and one-group four-pass angular rolling process effects on the plan view pattern of rolled pieces are analyzed. In the fourth part, the simulation results are further validated by rolling experiments.
2. Numerical Simulation Researches of Angular Rolling Process
The finite element software DEFORM-3D is used for the numerical simulation researches of the rolling process. In the pre-processing module, the geometric model is created, meshing is performed and the mainly parameters are set.
2.1. Numerical Simulation Modeling and Parameter Setting
2.1.1. Geometric Model
Angular rolling is asymmetric rolling, so the whole plate and two work rolls should be modeled as the geometric model. In addition, a pusher is set up here to enable the slab to bite smoothly. The work rolls, plate, and pusher are all modeled using DEFORM-3D modeling module. The geometric model after creation is shown in Figure 3.
2.1.2. Material Settings
The rolls’ material is set to rigid; the slab is set to plastic. Steel AISI-H-13 and AISI-1045 are chosen from the DEFORM-3D material library as the rolls’ material and slab’s material The starting temperature of the slab is set to 1100°C.
2.1.3. Pre-Processing Settings
The slab is meshed into 20,000 hexahedral solid and the number of nodes is 24,846. Ambient temperature, roll temperature, thermal convection coefficient, thermal conductivity, and other parameters are set as shown in Table 1.
2.2. Numerical Simulation Scheme
2.2.1. Conventional Rolling Simulation Scheme
In order to study the plate deformation difference between the biting and throwing stages under conventional conditions, a group of the conventional one-pass rolling simulation was set up to simulate the deformation of the head and tail during rolling.
The simulation slab size is 320×2570×4500mm, which is like the slab size used in actual production. The pass reduction rate is set to 30%, with larger reduction rate, the head and tail deformation are more pronounced.
The simulation work roll size was set with 1200mm in diameter and 5000mm in length, the work roll size is also like the work roll used in actual production.
2.2.2. Angular Rolling Simulation Scheme
Using the angular rolling plan pattern prediction model in the literature,33) the rotation angle of second pass required for two-pass angular rolling can be calculated. But the model describes the ideal state of the angular rolling deformation behavior, the metal flow difference in the head and tail part of the rolled piece is ignored. So, the actual rolling conditions should be considered, when using these formulas to calculate the simulation pass schedule data.
The simulation slab size is thickness: 320mm, width: 2570mm and length: 4500mm specifications. Total reduction is set 40mm. One-group two-pass angular rolling and one-group four-pass angular rolling simulations with same pass reduction ratio are simulated. The pass reduction ratio is 6.46% and 3.28% of two-pass angular rolling and four-pass angular rolling.
The rotation angles of the first pass are set 15° and 20° respectively. Table 2 shows the second pass rotation angle calculated with theoretical model.
The values calculated by the theoretical model will deviate from the actual values. To be closer to the actual rolling conditions, the rotation angle of the second pass is expanded for simulation, based on the calculation result. Table 3 shows the simulation rotation angle for the first case. Also, the second case of 20° first pass rotation angle was expanded with same schema.
The best angle of rotation for rectangular was found by simulating for two cases. The one-group four-pass angular rolling was simulated using this angle to compare the rectangular degree.
2.3. Rectangular Characteristic Values
To facilitate the comparison of rectangular, a parameter characterizing the rectangular degree needs to be defined.
After the slab has been rolled, the edges are deformed to a certain extent, as shown in Figure 4. It can be seen from Figure 4a that the edges have a crocodile mouth defect. Which may lead to errors in the results if the points on the edges are directly selected for analysis. To avoid this problem, the points in the edge distortion area should not be selected. As can be seen in Figure 4b, the distortion is already more moderate on the right side of the third column of the mesh from left to right, and in Figure 4c, on the left side of the first column of the mesh from right to left. Extending the first line along the y-axis into a face and the second line along the x-axis into a face, the point where the two faces intersect is taken as one of the selected points, as shown in Figure 4d. The other three points are selected with the same principle in the other three corners.
After the record points are selected, they are marked as shown in Figure 5. The subscript of 0, 1, and 2 indicate the raw material stage, the first pass and the second pass of the rolling stage. For example, a0b0 indicates the length of the raw material stage of the ab side of the blank, and a1c1 indicates the length of the ac side after the first pass is completed.
Considering that the corner angles of the rolled piece are more difficult to measure after angular rolling, a rectangular characteristic value representing the rectangular degree is defined by the length, width, and diagonal length and can be expressed by Equation 1.
In the above equation, J represents the rectangular characteristic value. The closer this value is to 1 (J equals 1 for rectangles), the better the rectangular degree.
3. Simulation Result Analysis
3.1. Conventional Rolling Simulation Result
Plan view pattern after conventional rolling process is shown in Figure 6. Comparing the plan view pattern of the head and tail of the rolled piece, the head deformation of the rolled piece is smaller than the tail deformation of the rolled piece, which indicates that there is a difference between the deformation behavior of the rolled piece in the biting stage and the throwing stage. Figure 7 shows that the rolling stresses in the biting stage are less than those in the throwing stage. So, the higher stresses can produce more deformation. In addition, analysis the metal flow of pass rolling process, when the head of the rolled piece is bitten, the metal flow is backward along the rolling direction, by the back of the overall rolled piece. When the tail of the rolled piece is thrown, the metal is still backward flow, the back of the free end. Compared with the head, more conducive to metal flow, so the tail can produce more deformation.
3.2. Angular Rolling Simulation Results
The plan view pattern simulated after each pass of two different processes is intercepted respectively, and the pattern comparison diagrams after each pass of angular rolling are shown in Figure 8 and Figure 9. The innermost pattern in the figure is the initial plan view pattern of the rolled piece, the pattern in the middle is the plan view pattern after each pass of angular rolling, and the outermost one is the final plan view pattern after rolling.
After the simulation, all the data are recorded according to the above selected points.
3.3. The Rectangular Degree Comparison
By substituting the simulation results into the equation (1), the results obtained are shown in Figure 10.
The best rotation angles of the second pass and best rectangular characteristic values corresponding to the rotation angles of the first pass are shown in Table 4. Compared with the theoretical calculation results in Table 3, the best rectangular rotation angles obtained by simulation for the second pass need to increase, which indicates that the actual rolling process conditions have a certain influence on the deformation of the angular rolling and the rectangular rotation angle calculated theoretically has a certain deviation. It can also be seen that the angle deviation is only 0.2°, indicating that the accuracy of the angle setting formula obtained from the theoretical derivation is high.
The best rotation angle of the two-pass angular rolling is applied to the simulation of the four-pass angular rolling and the simulation values are brought into equation (1), and the results are as follows:
where indicates the rectangular characteristic value obtained by four-pass rolling with the rotation angle of 15 ° for the first pass and 14.275 ° for the third pass. The meaning of is similar with .
Comparing the best rectangular characteristic values of the two-pass angular rolling with their corresponding rectangular characteristic values of the four-pass angular rolling, it can be found that the four-pass angular rolling is better than the two-pass angular rolling in the rectangular degree.
4. Validation Experiment
4.1. Experimental Procedure
A comparison experiment of rectangular degree between two-pass angular rolling and four-pass angular rolling was carried out on a 450mm hot rolling experimental mill at the State Key Laboratory of Rolling and Automation in Northeastern University.The experimental equipment is shown in the Figure 11. The experimental material was two pure lead blocks, whose deformation behavior at room temperature was close to that of high-temperature steel plate. A rectangle 2mm inwards at the edge of the specimen is drawn for measurement after rolling. The rolling mill equipment parameters and rolled piece size data are shown in Table 5, and the experimental rolling schedules are shown in Table 6.
4.2. Experimental Result
The plan view patterns after the two-pass angular rolling and the four-pass angular rolling are shown in Figure 12, and point a is the first bitten corner during the angular rolling. Table 7 shows the dimensional data of the two processes after rolling (the edge points are the four vertices of the rolled piece surface, and the reference points are the four vertices of the rectangle connected by parallel lines 2mm inwards from each side of the rolled piece surface). The calculation results are shown in Figure 13. It can be seen from the data comparison that the rectangular degree of the rolled piece obtained by the four-pass angular rolling process is better than the two-pass angular rolling. The results are consistent with the results obtained from the simulation using finite element software.
The size of experimental rolling mill is much smaller than that of the field rolling mill, so the size of the selected experimental plate differs significantly from the actual plate in the field. The plate size used in the experiment is obtained by reducing the plate size used in the field in equal proportion as much as possible, and the designed rolling schedule is also the same as that in the field as much as possible. In this paper, the accuracy of the angular rolling processes comparison is verified on the experimental rolling mill, which lays a foundation for field practical application.
5. Conclusions
The reason for the difference between head and tail deformation of rolled pieces after conventional rolling is analyzed through numerical simulation. Since the two bites of the two-pass angular rolling start from two corners on the same side, the deformation difference of the rolled piece between the biting and throwing stage affects the rectangular degree of the two-pass angular rolled plate. It is proposed to modify the two-pass angular rolling process to the four-pass angular rolling process to improve the rectangle of the angular rolled plate.
The calculation formula of the rectangular characteristic values reflecting the rectangular degree of the plate is constructed. Through the numerical simulation, the deformation of the rolled piece under the optimal rectangular process conditions of two-pass angular rolling and four-pass angular rolling is analyzed and compared. The simulation results show that the rectangular degree obtained by four-pass angular rolling is better than that by two-pass angular rolling.
The verification experiment of the angular rolling processes was carried out, and the rectangular characteristic values of the reference point of the four-pass angular rolled piece was 1.003 and that of the two-pass angular rolled piece was 1.014. The rectangle of the four-pass angular rolled piece was obviously better than that of the two-pass angular rolled piece.
Author Contributions
Conceptualization, C.H. and Z.J.; methodology, C.H., J. L. and Z. X.; software, J. L. and Z. X.; validation, Z. X., and Z.W.; formal analysis, J. L., Z. X. and Z.W.; investigation, Z.Z. and Z.W.; data curation, Z.Z. and Z.W.; writing—original draft preparation, C.H., J. L. and Z. X.; writing—review and editing, C.H., and Z.J.; visualization, Z.Z. and Z.W.; supervision, C.H. and Z.J. All authors have read and agreed to the published version of the manuscript.
Funding
This research was funded by the Fundamental Research Funds for the Central Universities (No.: N160704003; N170708020; N2107007).
Institutional Review Board Statement
Not applicable.
Informed Consent Statement
Not applicable.
Data Availability Statement
The original contributions presented in the study are included in the article, further inquiries can be directed to the corresponding author.
Conflicts of Interest
The authors declare no conflict of interest.
References
- Wang, G.D. The development, current situation and prospects of rolling technology in China in recent years. Steel Rolling 2017, 34, 1–8. [Google Scholar] [CrossRef]
- Wang, G.D. Current status and prospects of research and development of key common technologies for high-quality medium and thick plate production. Steel Rolling 2019, 36, 1–8+30. [Google Scholar] [CrossRef]
- Tsuyama, S. Thick plate technology for the last 100 years: A world leader in thermo mechanical control process. ISIJ Int 2015, 55, 67–78. [Google Scholar] [CrossRef]
- Zhou, L.D. Theoretical research and technological development of aluminum plate vertical rolling and angular rolling. M.Thesis, Chongqing University, Chongqing, China, 1999.
- Kang, Y.L. Production status and development trends of medium and thick plate products in China. China Metallurgy 2012, 22, 1–4+14. [Google Scholar] [CrossRef]
- Zhao, S.Q. Hot rolling and hot continuous rolling technology of aluminum alloy; Metallurgical Industry Press: Beijing, CHINA, 2010. [Google Scholar]
- Sanjari, M.; He, Y. Development of the {113}〈uvw〉 texture during the annealing of a skew cold rolled non-oriented electrical steel. Scr. Mater 2016, 124, 179–183. [Google Scholar] [CrossRef]
- Li, S.Z. General formula for angular rolling (abstract). Journal of Northeast Heavy Machinery Institute 1984, 01. [Google Scholar]
- Cao, J.N.; Bai, B. Research and application of angular rolling widening technology for medium and thick plates. Steel Rolling 2021, 38, 10–16. [Google Scholar] [CrossRef]
- Cao, S.Q.; Tang, S.B. Application of angular rolling technology in 4100 roughing mill. Alum. Fabr. 2016, 4, 17–20. [Google Scholar] [CrossRef]
- Hao, P.J.; He, A.R. Predicting model of thickness distribution and rolling force in angular rolling process based on influence function method. Mech. Ind 2018, 19, 302–310. [Google Scholar] [CrossRef]
- Wang, B.; Zhang, J.M. Analysis of the evolution behavior of voids during the hot rolling process of medium plates. Journal of Materials Processing Technology 2015, 221, 121–127. [Google Scholar] [CrossRef]
- Yang, J. Finite element simulation study on the influence of different rolling conditions on the shape of medium and thick plates. M. Thesis, Inner Mongolia University of Science and Technology, Inner Mongolia, China, 2019. [CrossRef]
- Wang, Y.Y. Research and application of intelligent prediction model for flat shape of medium and thick plate. M. Thesis, Northeastern University, Liaoning,China, 2016. [CrossRef]
- Wang, W.H.; Lu, S.P. Finite element analysis of the deformation behavior of the up and down roll differential diameter rolling for medium plate. J. Phys. Conf. Ser 2020, 1653. [Google Scholar] [CrossRef]
- Ruan, J.H.; Zhang, L.W. Broadside compensation rolling model for plan view pattern control in wide and heavy plate rolling process. J. Iron Steel Res. Int 2014, 21, 503–508. [Google Scholar] [CrossRef]
- Chen, L. Finite element simulation of angular rolling of 3300mm aluminum plate hot rolling mill. Metallurgical Equipment 2017, 4, 34–36. [Google Scholar] [CrossRef]
- Li, S.L.; Sun, Y.T. Experimental study on hot rolled round steel rolling thin strip steel. J. Univ. Sci. Technol. Liaoning 2016, 39, 406–410. [Google Scholar] [CrossRef]
- Kumar, A.; Rath, S. Simulation of plate rolling process using finite element method. Mater. Today: Proc 2021, 42, 650–659. [Google Scholar] [CrossRef]
- Skripalenko, M.N.; Skripalenko, M.M. Using DEFORM-3D computing environment to detect the influence of roll vibration on the thickness formation of cold-rolled strip. Computer Research and Modeling 2017, 9, 111–116. [Google Scholar] [CrossRef]
- Chubenko, V.; Khinotskaya, A.; Yarosh, T. Sustainable development of the steel plate hot rolling technology due to energy-power process parameters justification. The Interational Conference on Sustainable Futures: Environmental, Technological, Social and Economic Matters(ICSF 2020), Qinghuangdao, CHINA, 21 8 2020.
- Kumar, A.; Rath, S. Simulation of plate rolling process using finite element method. Mater. Today: Proc 2021, 42, 650–659. [Google Scholar] [CrossRef]
- Bian, S.Y.; Zhang, X. Numerical Simulation, Microstructure, properties of EH40 ultra-heavy plate under gradient temperature rolling. Mater. Sci. Eng. A 2020, 791, 139778. [Google Scholar] [CrossRef]
- Huang, C.; Gan, Y. Shape rolling simulation of tailor rolled blanks based on Deform-3D. Appl. Mech. Mater 2012, 101-102, 897–900. [Google Scholar] [CrossRef]
- Gui, Y.L.; Qin, X. Numerical simulation of temperature field in plate rolling process. Mater. Rep 2013, 27, 139–141. [Google Scholar] [CrossRef]
- Luo, X.D. Briefly describe the current situation and progress of the yield rate of medium and thick plates in China. Steel Rolling 1999, 1, 42–44. [Google Scholar] [CrossRef]
- Jiao, Z.J.; Hu, X.L. Calculation of taper rolling time in plan view pattern control process. J. Iron Steel Res. Int 2006, 13, 1–3. [Google Scholar] [CrossRef]
- Jiao, Z.J.; Hu, X.L. Derivation of simplified models of plan view pattern control function for plate mill. J. Iron Steel Res. Int 2007, 14. [Google Scholar] [CrossRef]
- Jiao, Z.J.; He, C.Y. Torque model in plate rolling process with biting impact considered. ISIJ Int 2021, 61, 239–247. [Google Scholar] [CrossRef]
- Shigemori, H.; Nambu, K. Plan View Pattern Control for steel plates using locally-weighted regression. IFAC Proceedings Volumes 2007, 40, 125–130. [Google Scholar] [CrossRef]
- Hao, P.J. Research on the deformation behavior of wide aluminum alloy thick plate during angular rolling. Ph.D. Thesis, University of Science and Technology Beijing, Beijing China, 2019. [Google Scholar]
- Jiao, Z.J.; Wang, Z.Q. Research on shape prediction model for angle rolling process of medium and thick plate. J. Northeast. Univ, Nat. Sci 2022, 43, 815–820. [Google Scholar] [CrossRef]
- Jiao, Z.J.; Luo, J.Y. Research and application of the angular rolling technology for plate mill. Adv. Manuf 2023, 11, 462–476. [Google Scholar] [CrossRef]
Figure 1.
Schematic diagram of two-pass angular rolling.
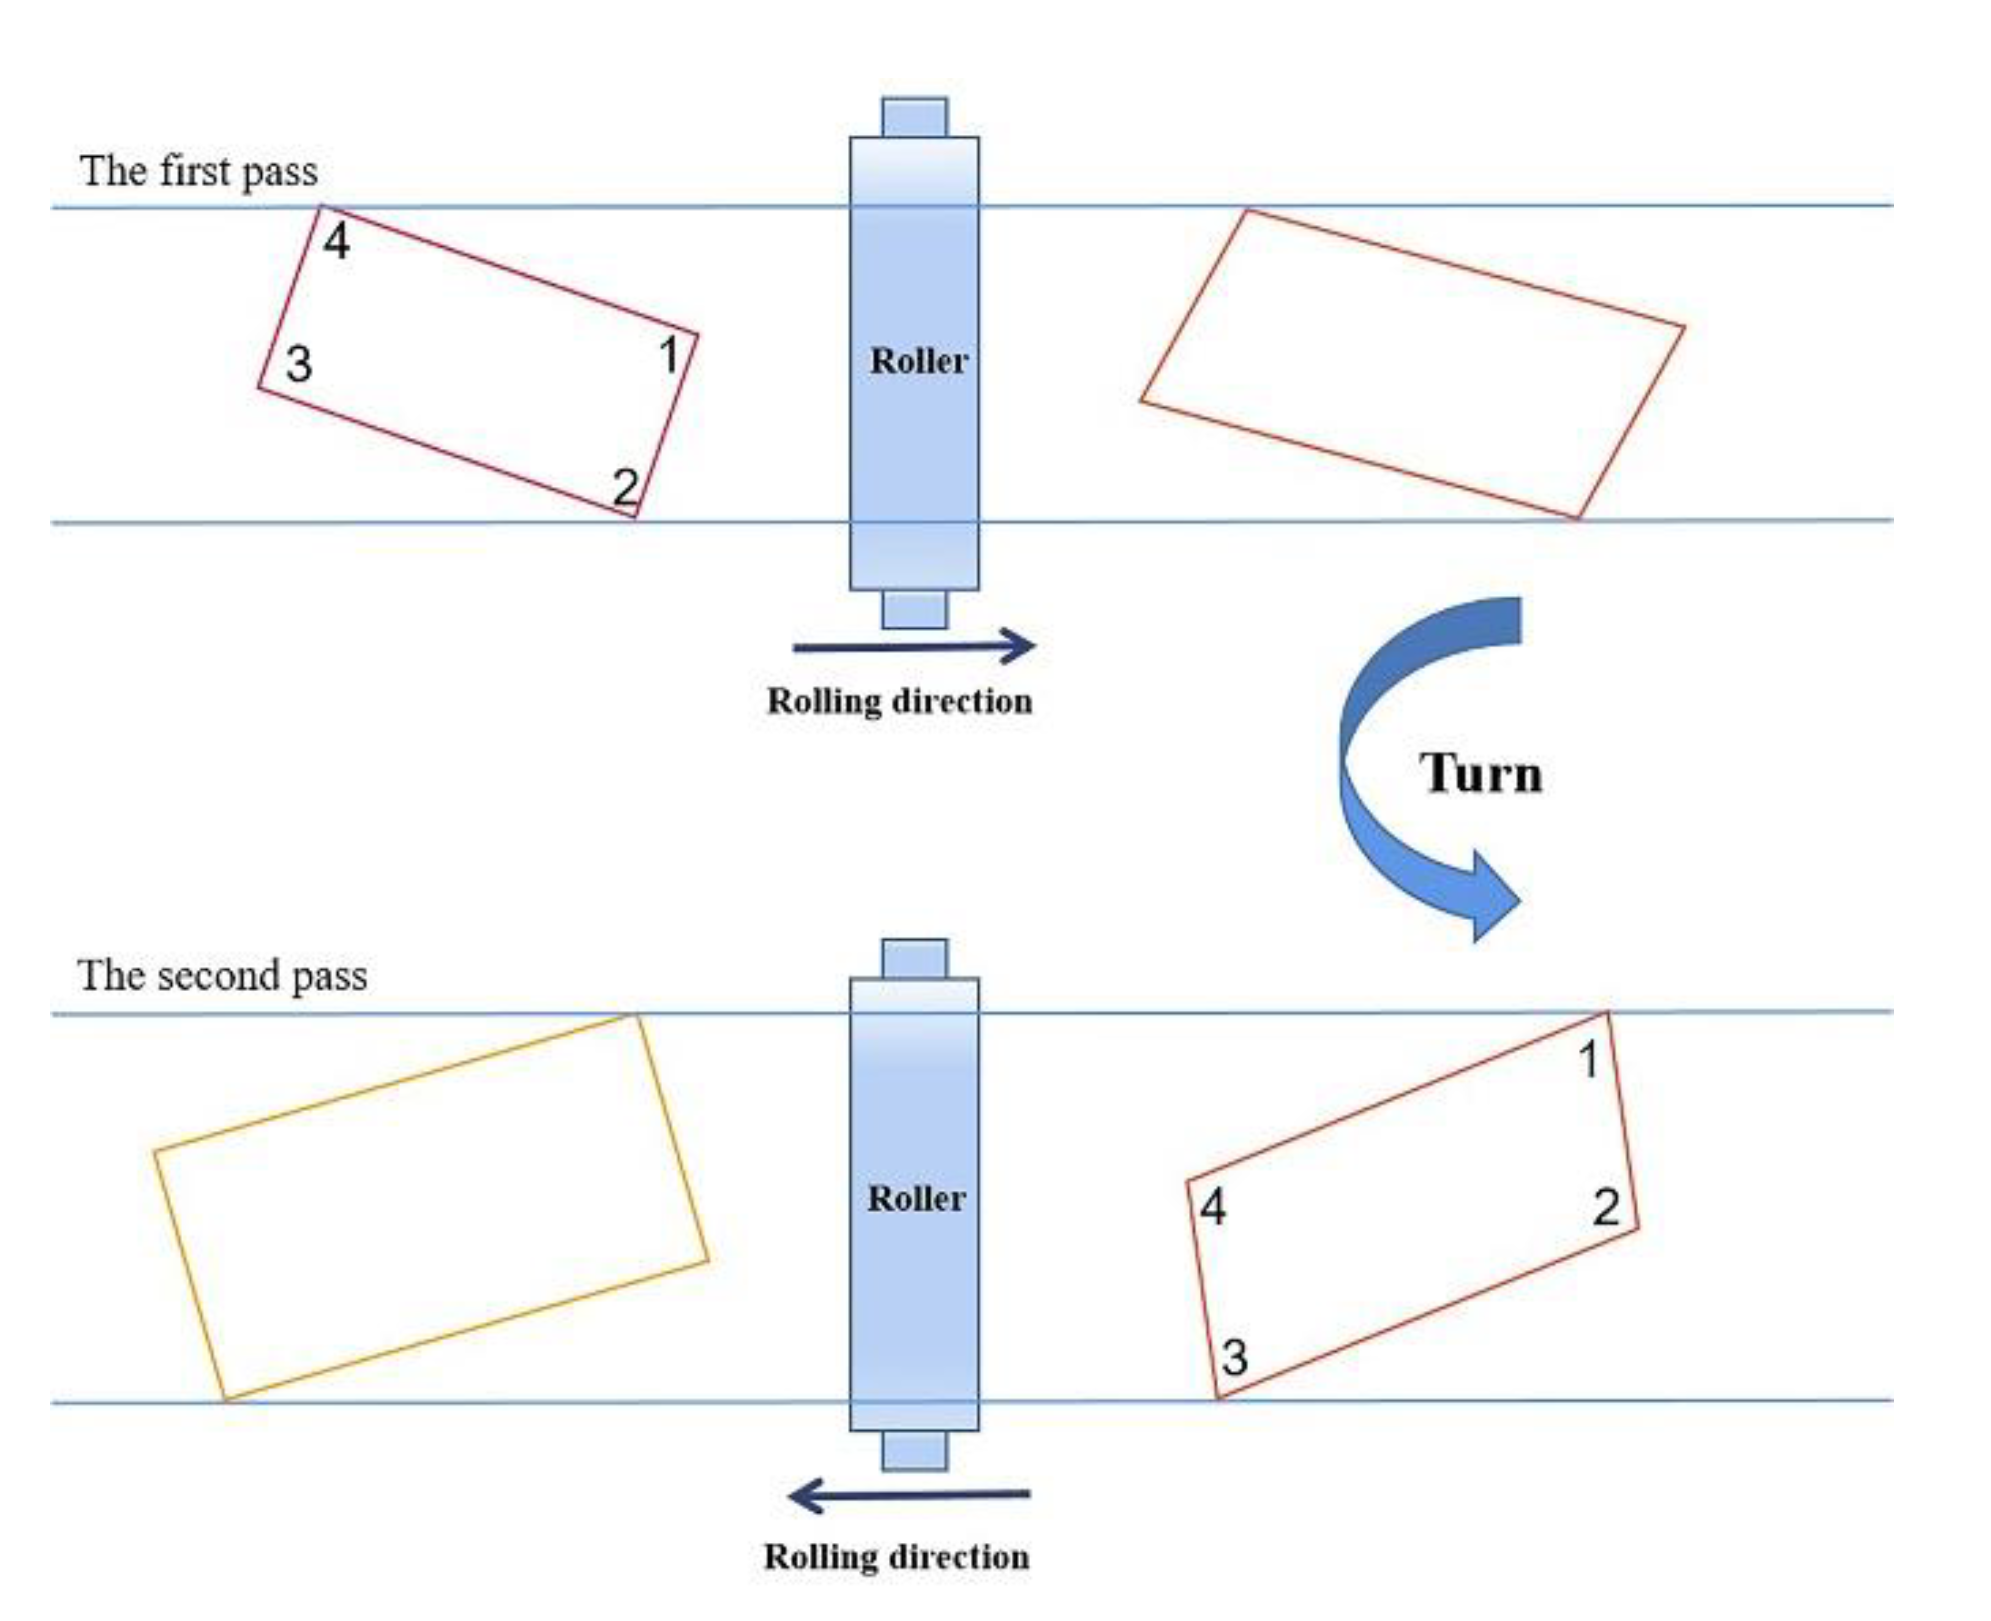
Figure 2.
Schematic diagram of four-pass angular rolling.
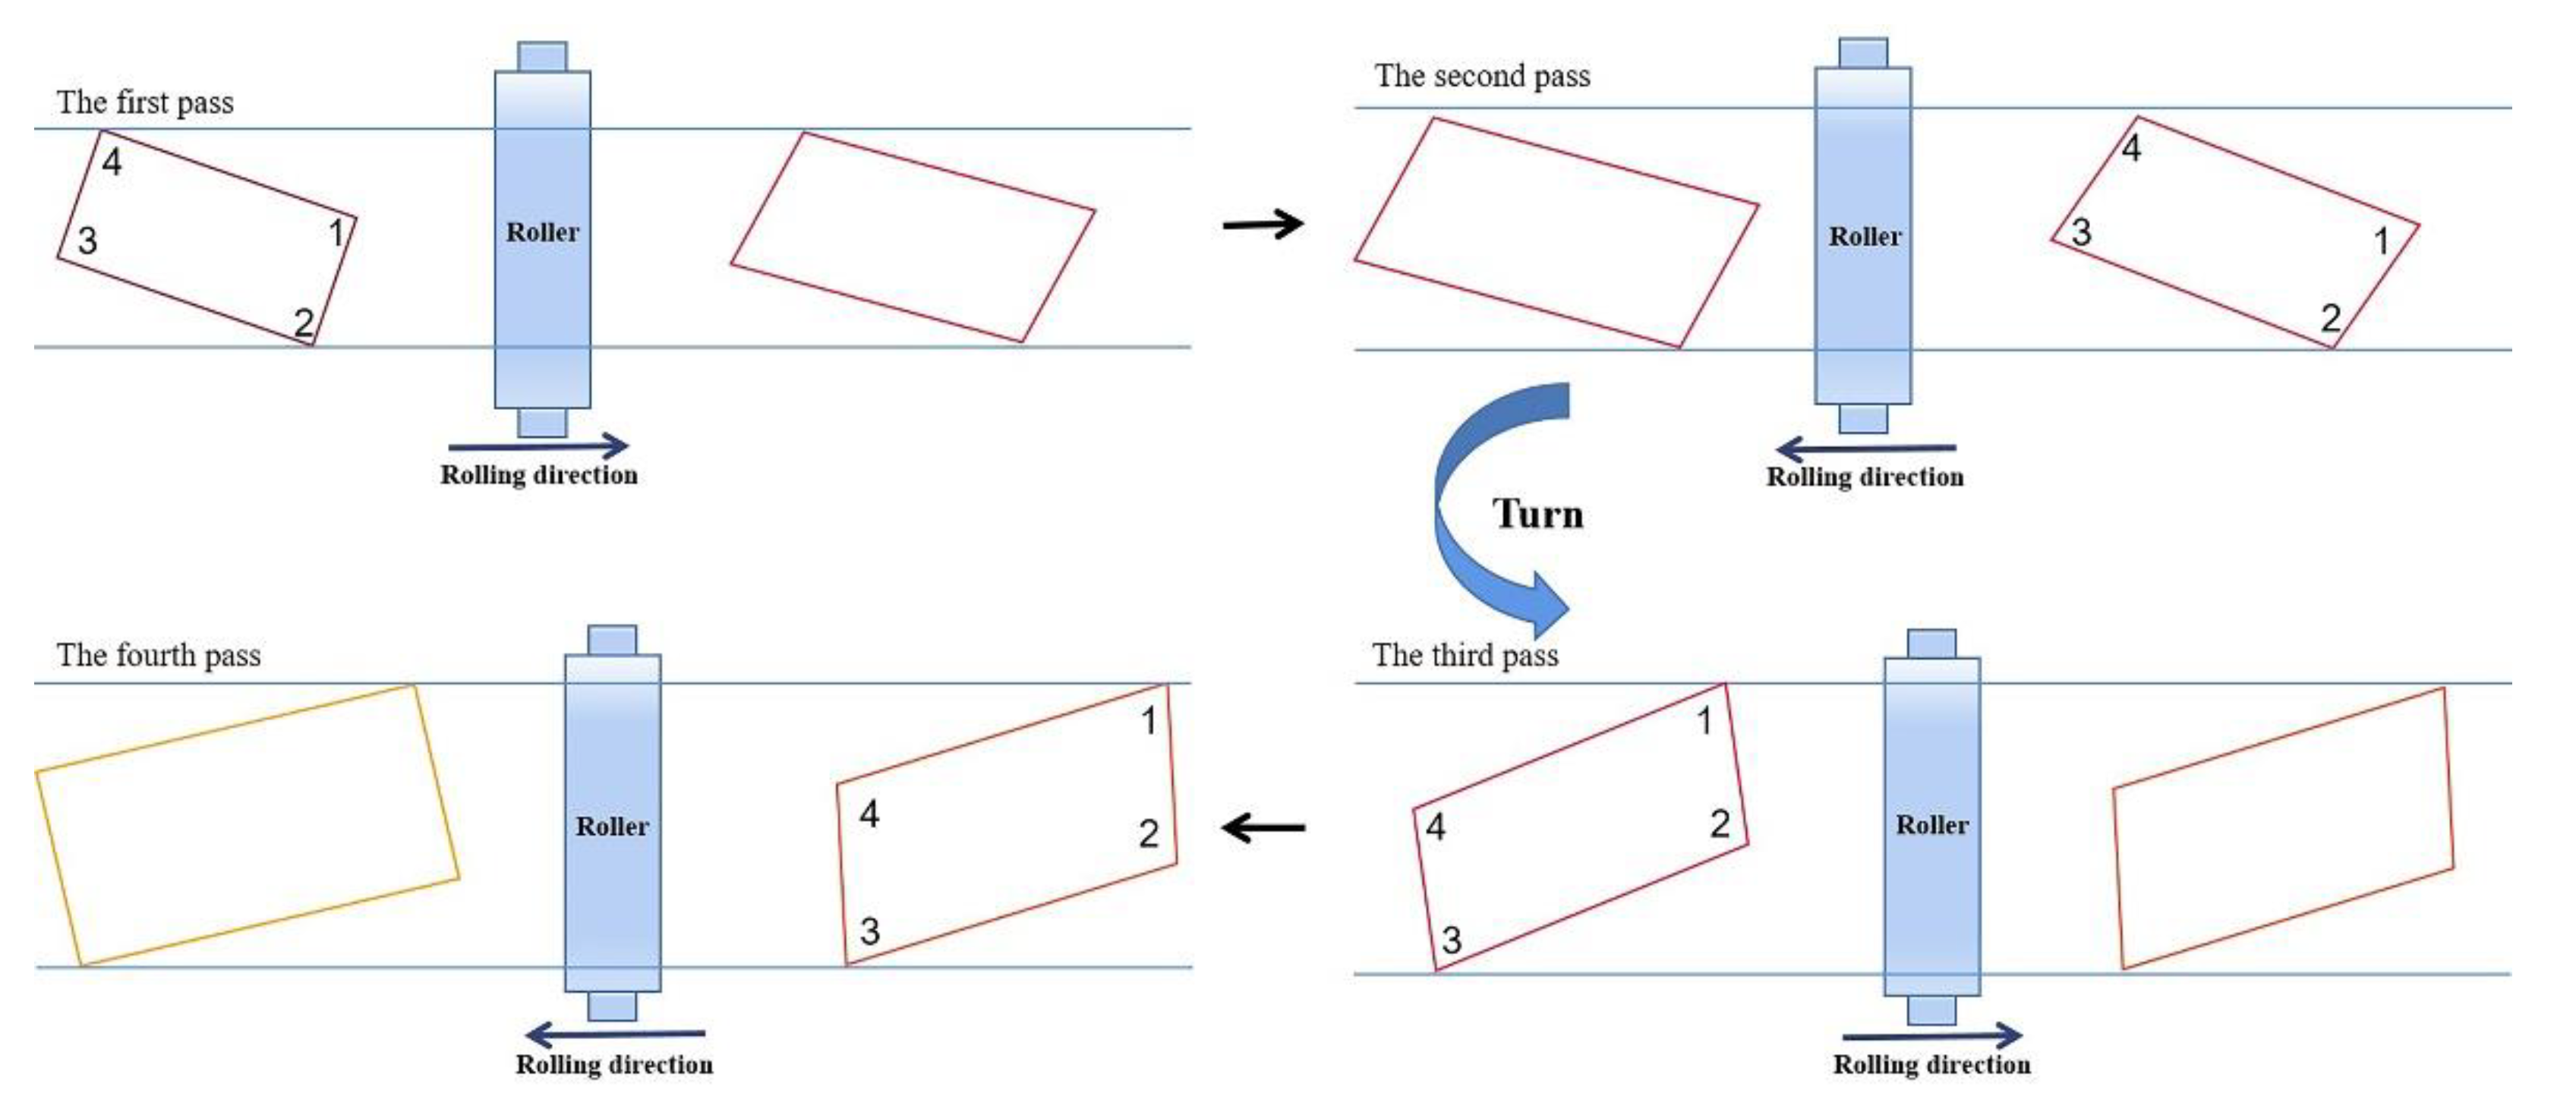
Figure 3.
Schematic diagram of the geometric model.
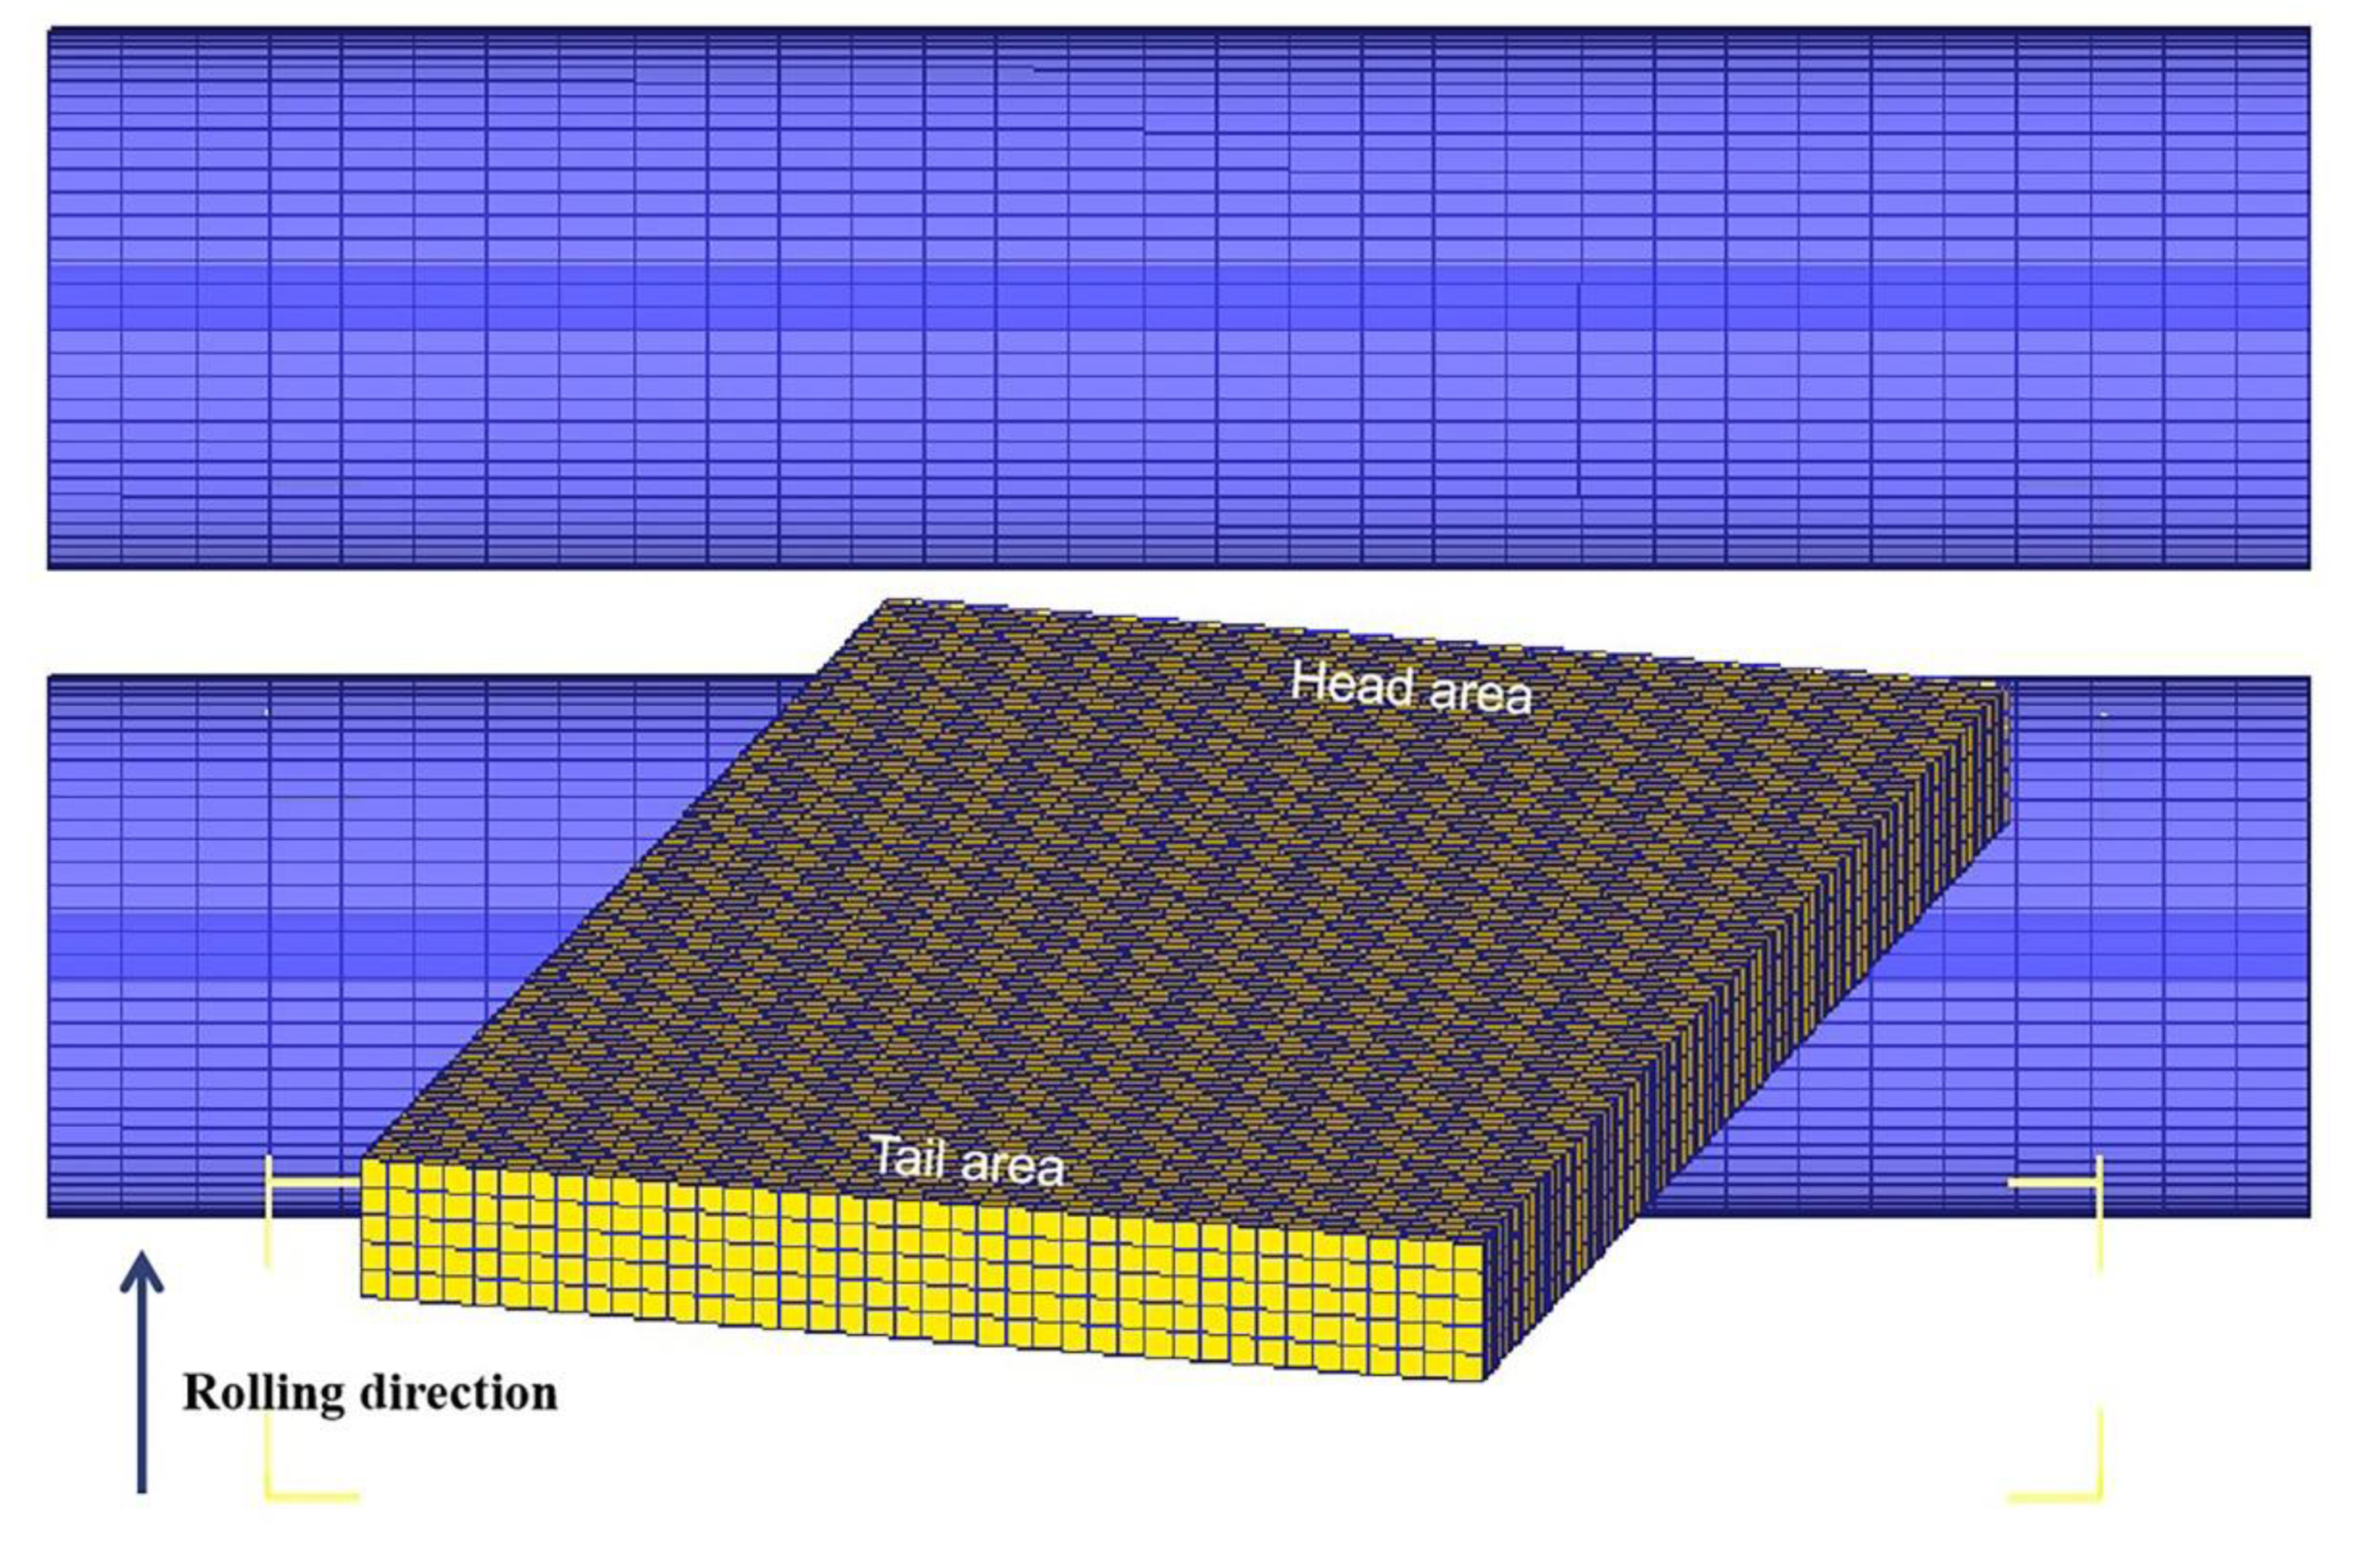
Figure 4.
Lower right corner after rolling: (a) Lower right corner 3D view; (b) Lower right corner x-z view; (c) Lower right corner y-z view; (d) Lower right corner x-y view.
Figure 4.
Lower right corner after rolling: (a) Lower right corner 3D view; (b) Lower right corner x-z view; (c) Lower right corner y-z view; (d) Lower right corner x-y view.
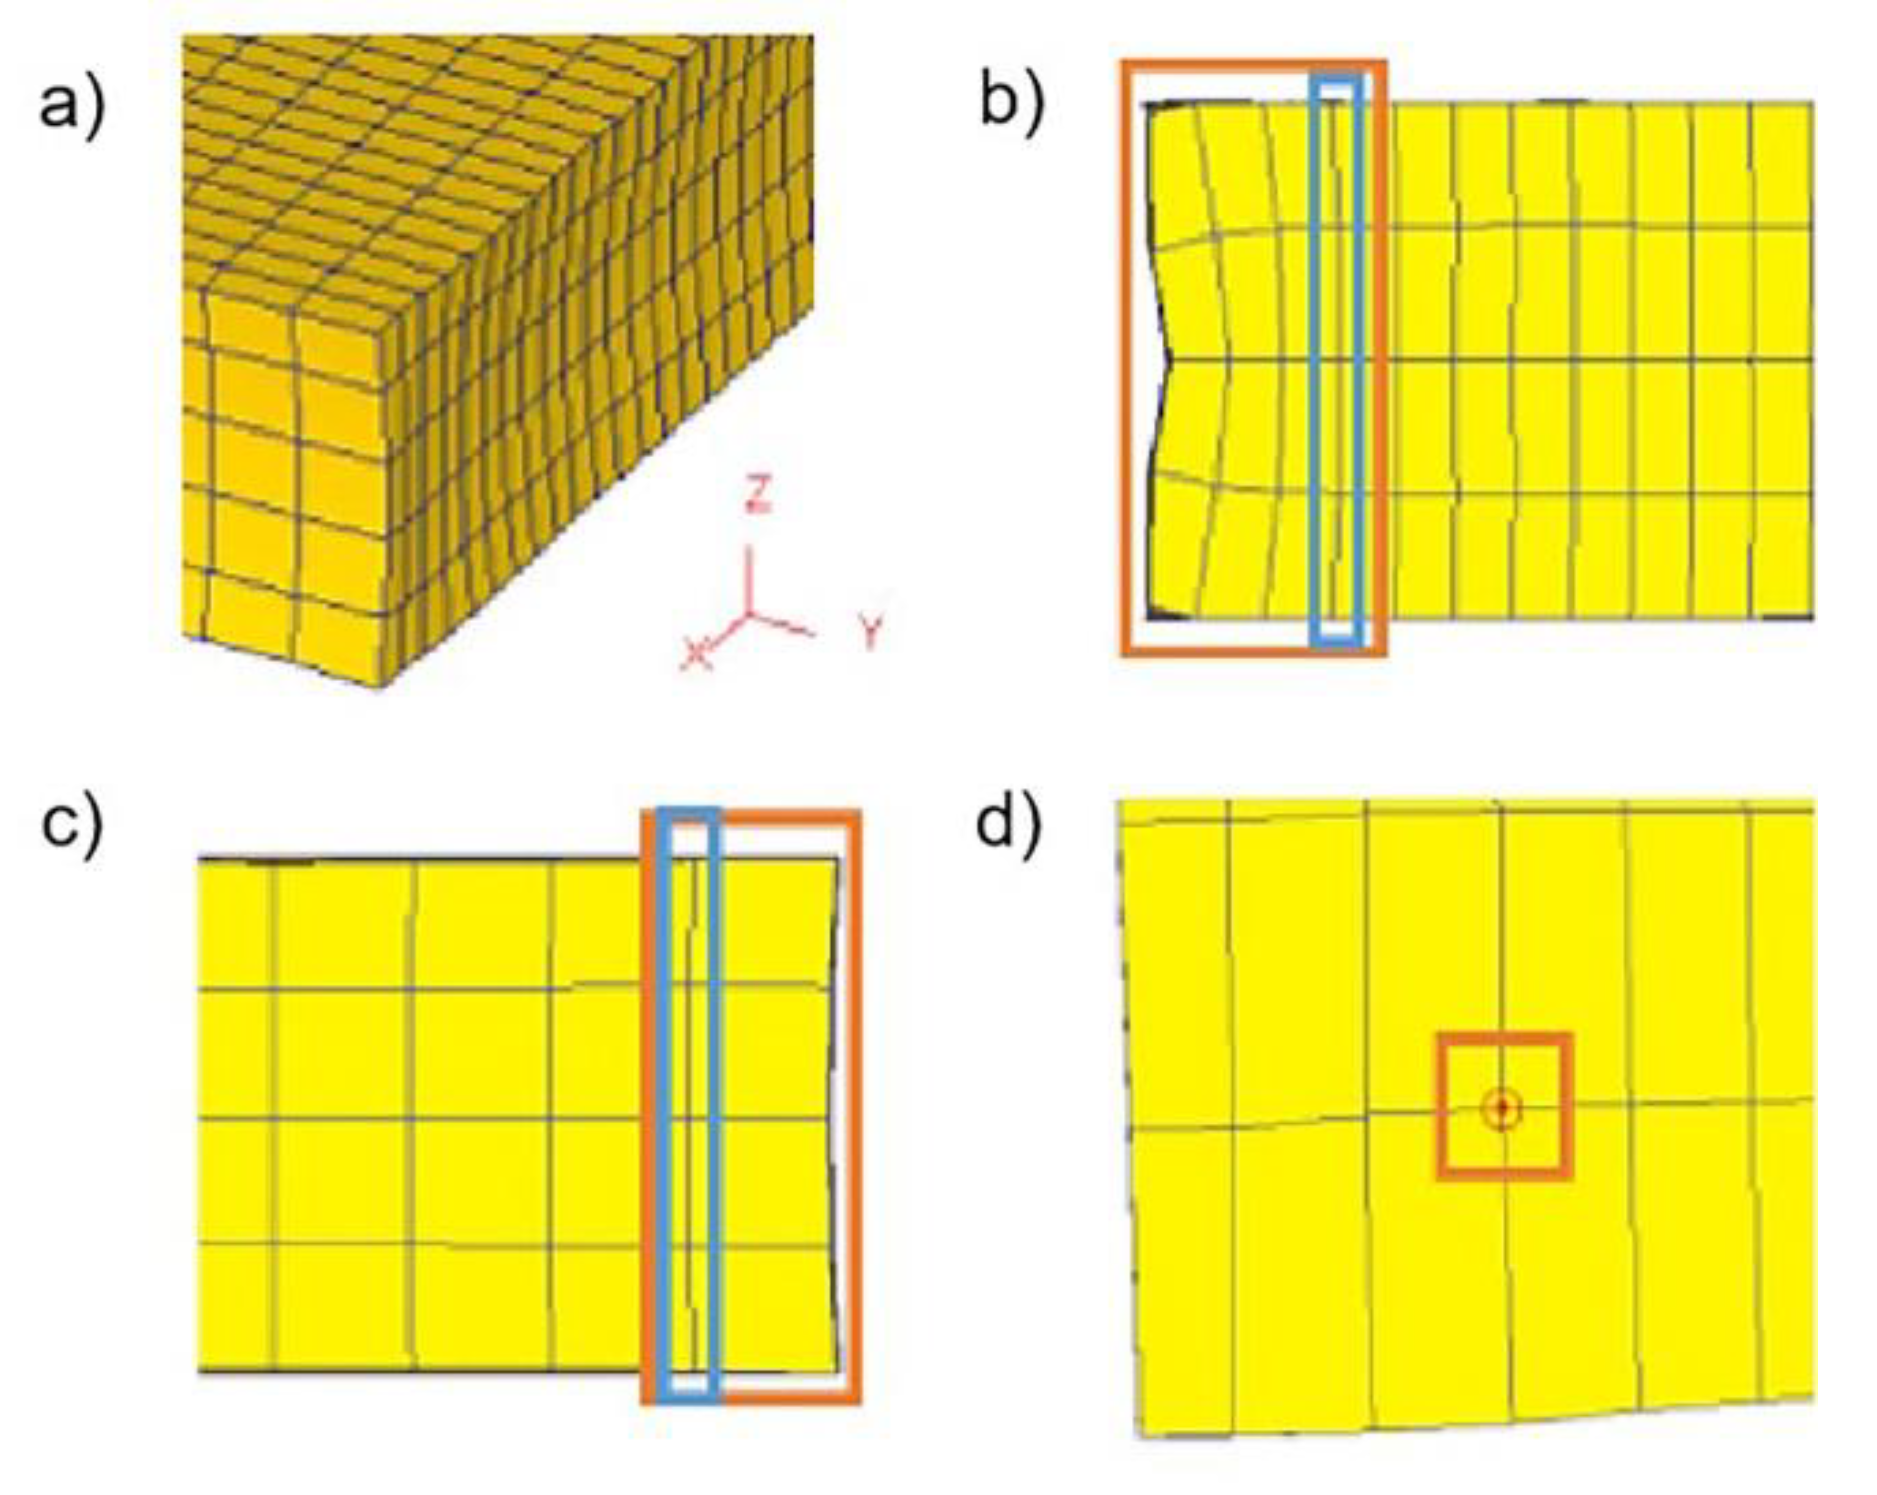
Figure 5.
Pointing diagram for angular rolled parameters: (a) Before the first pass rolling and (b) After the first pass rolling.
Figure 5.
Pointing diagram for angular rolled parameters: (a) Before the first pass rolling and (b) After the first pass rolling.
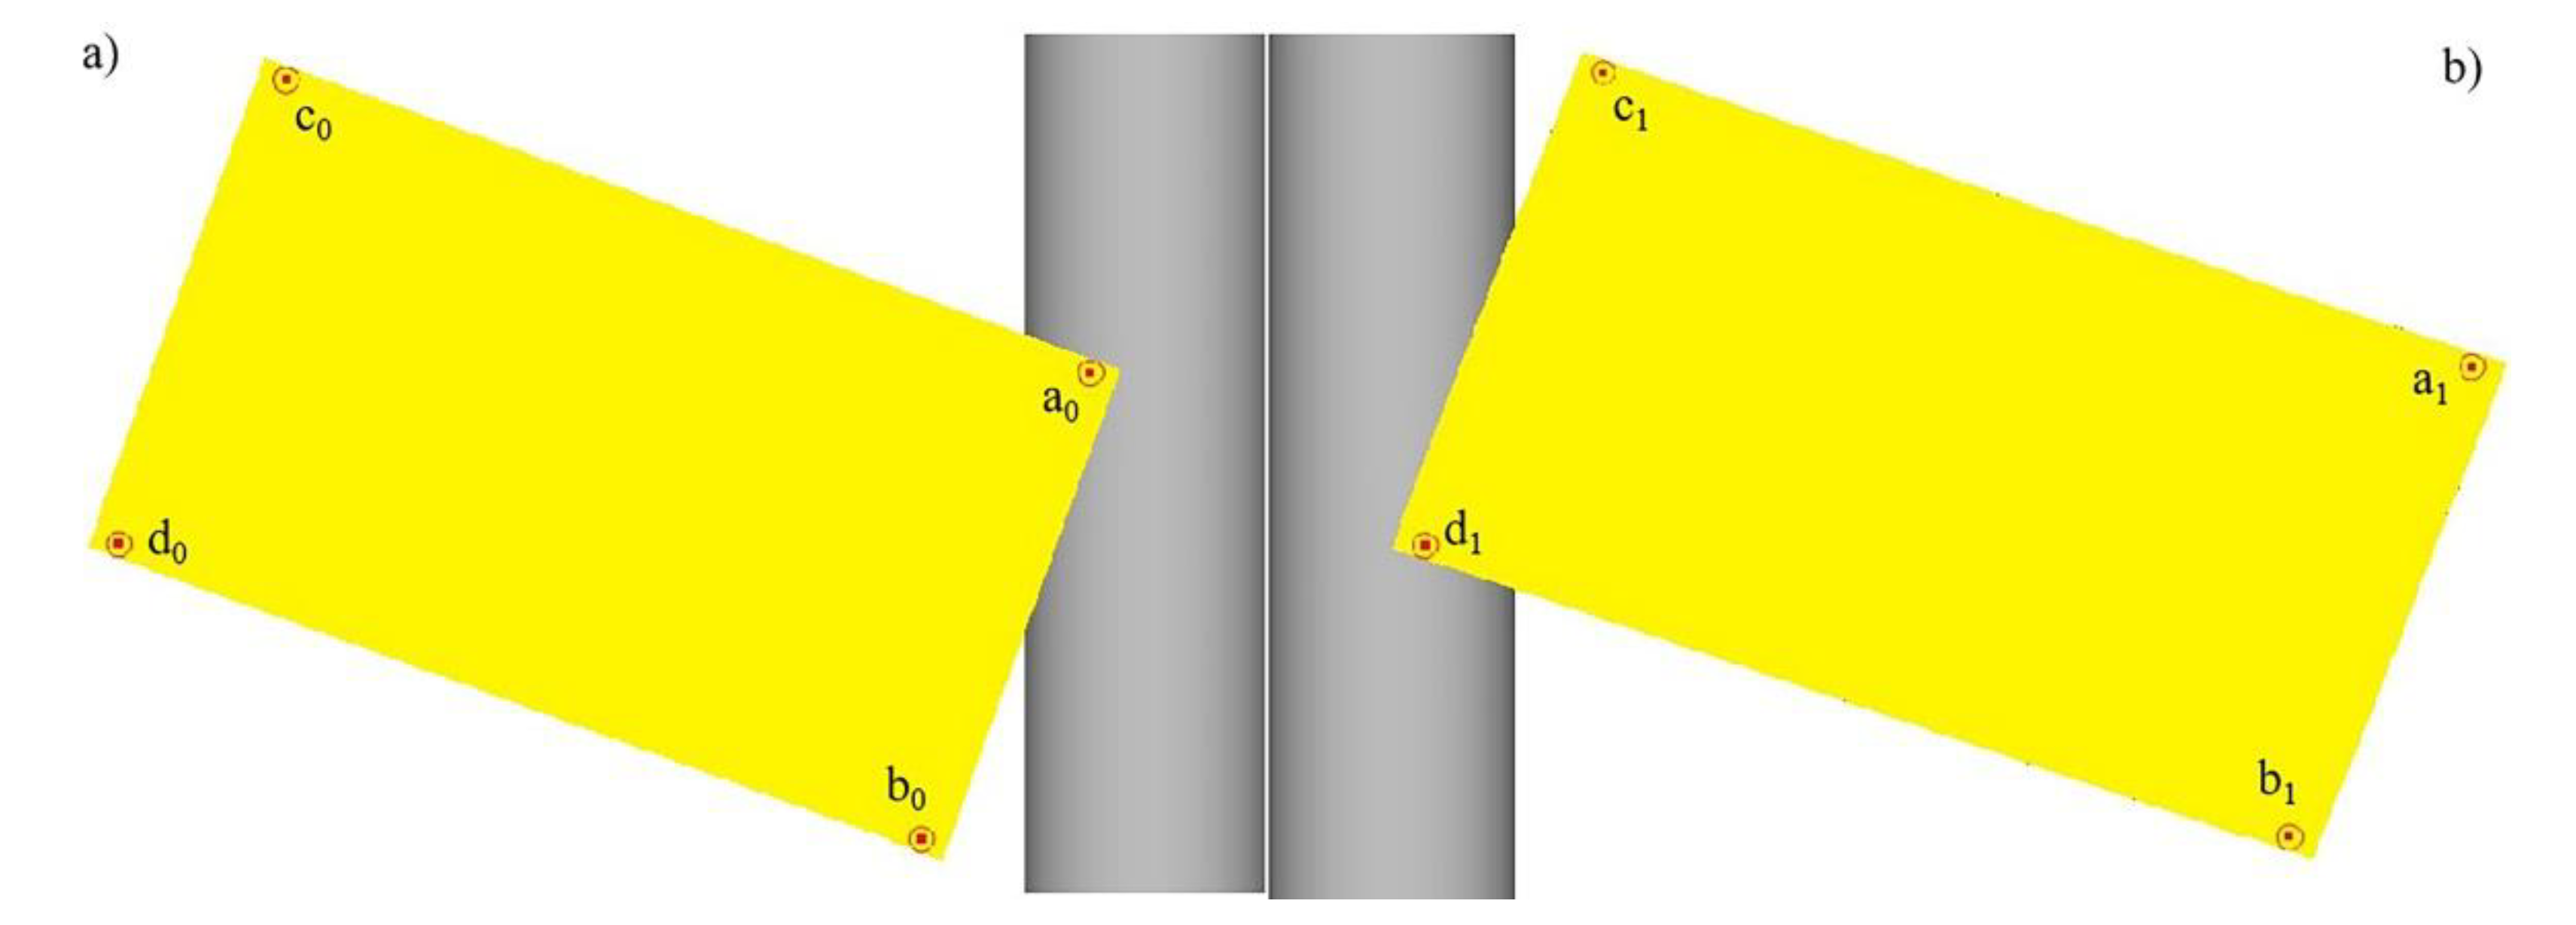
Figure 6.
Conventional rolling deformation diagram: (a) Plan view pattern after rolling and (b) Comparison of the plan view pattern of the head and tail along the center line after rolling.
Figure 6.
Conventional rolling deformation diagram: (a) Plan view pattern after rolling and (b) Comparison of the plan view pattern of the head and tail along the center line after rolling.
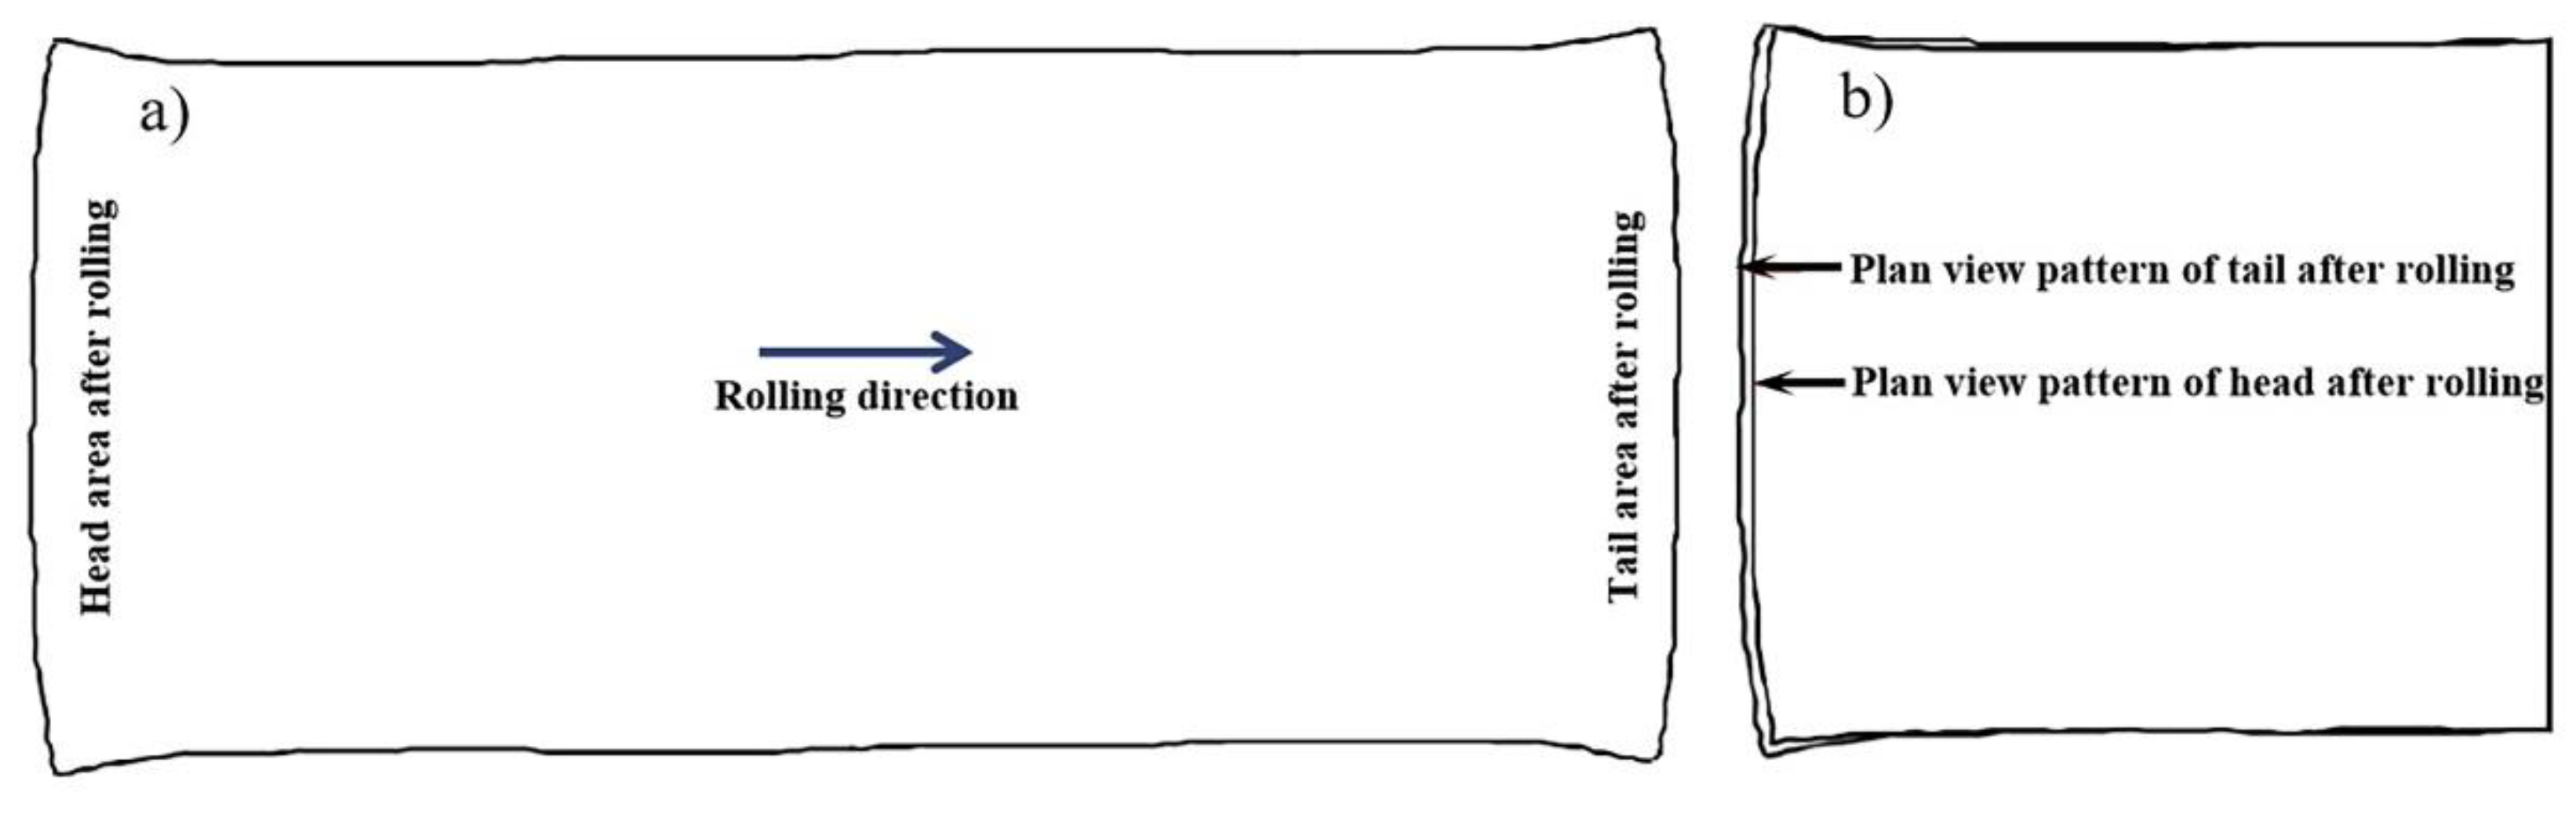
Figure 7.
Stress diagram for conventional rolling biting and throwing stages: (a) Rolling biting stage and (b)Rolling throwing stage.
Figure 7.
Stress diagram for conventional rolling biting and throwing stages: (a) Rolling biting stage and (b)Rolling throwing stage.
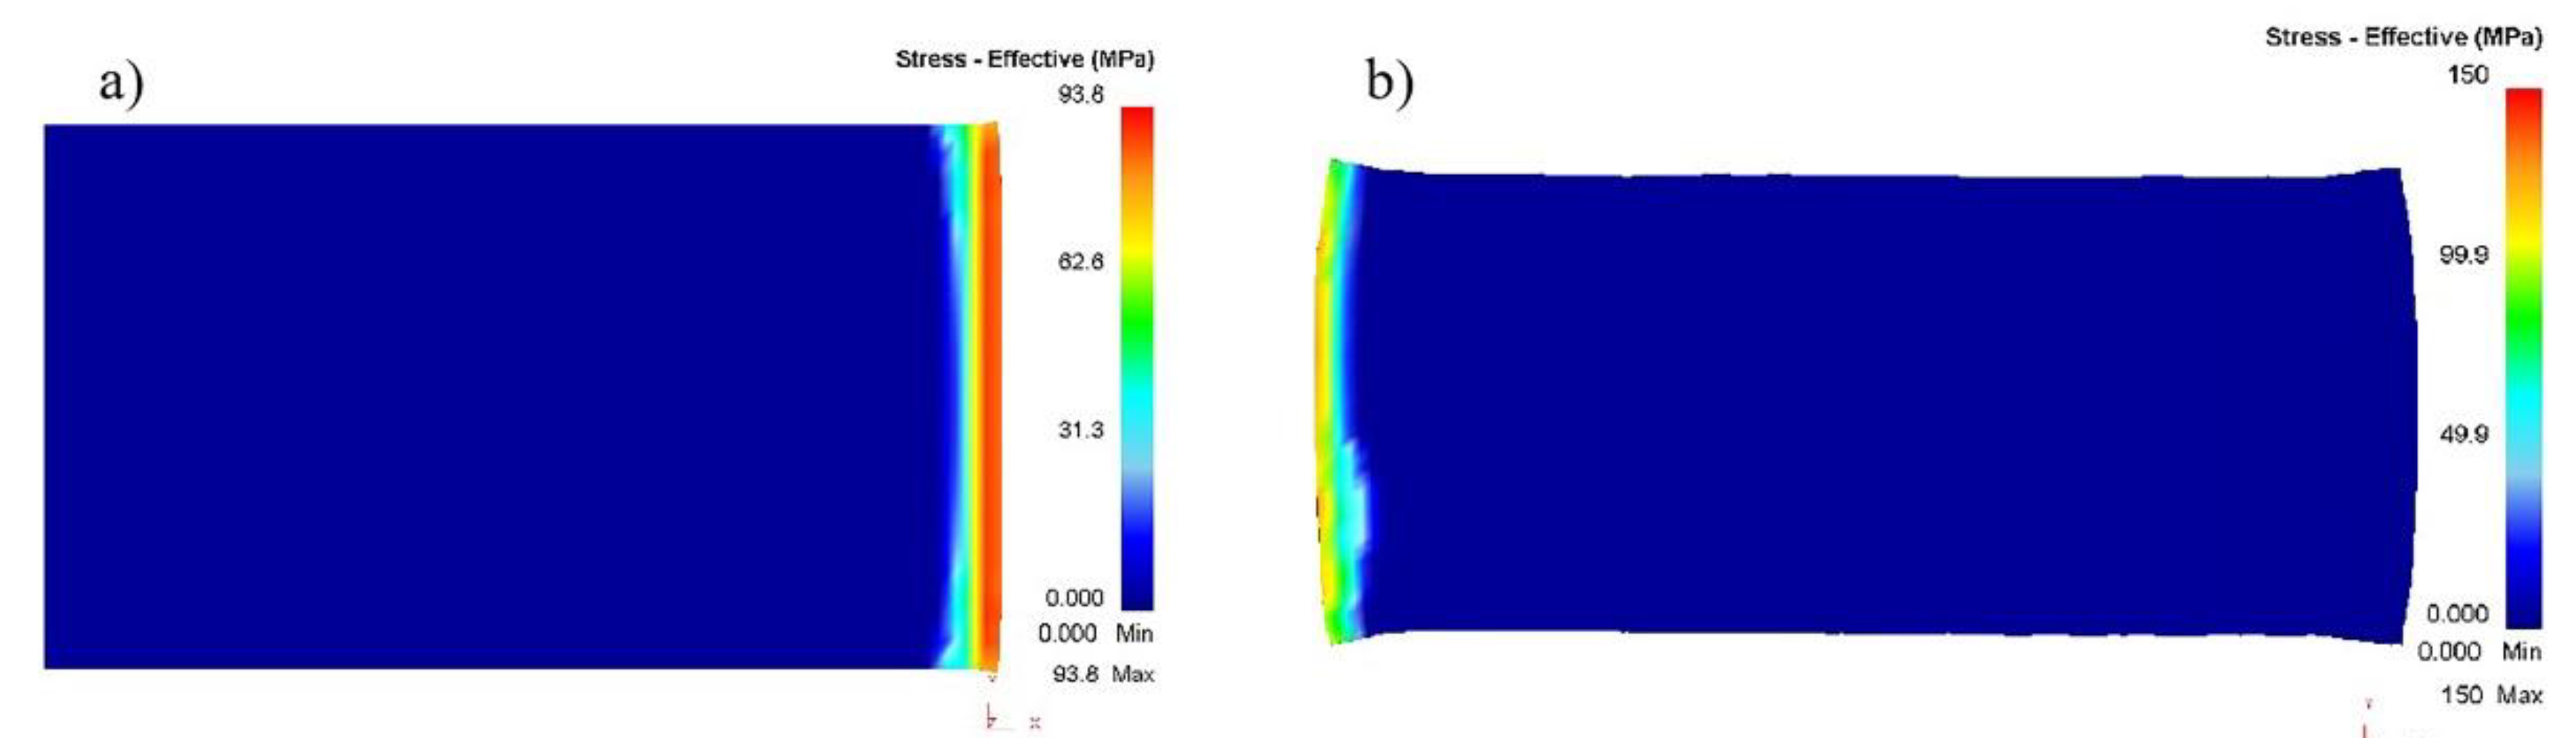
Figure 8.
Evolution of the plan view pattern of the rolled piece by two-pass angular rolling.
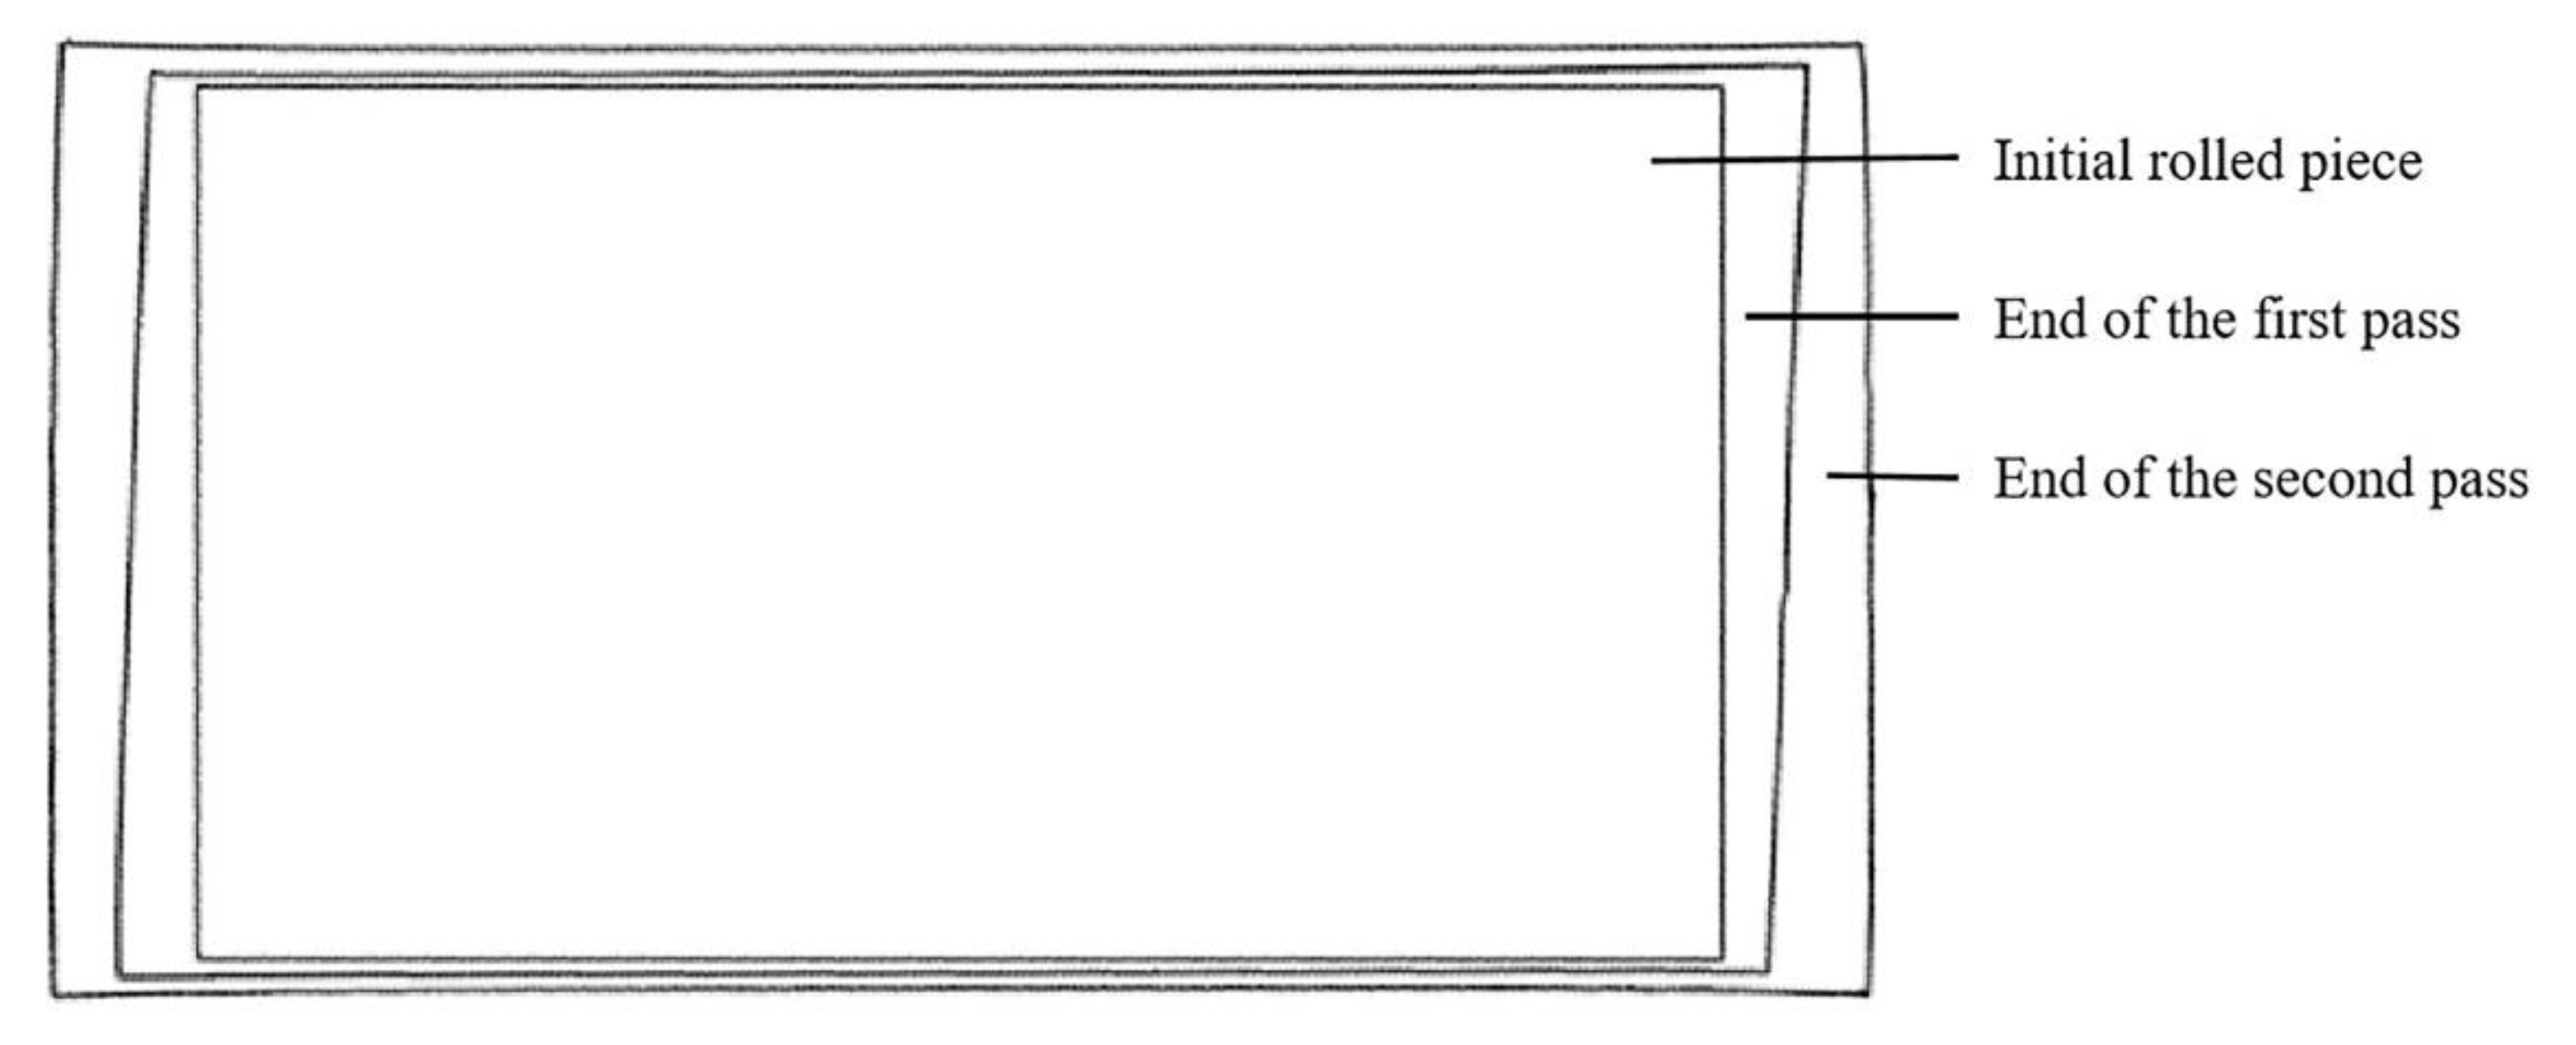
Figure 9.
Evolution of the plan view pattern of the rolled piece by four-pass angular rolling.
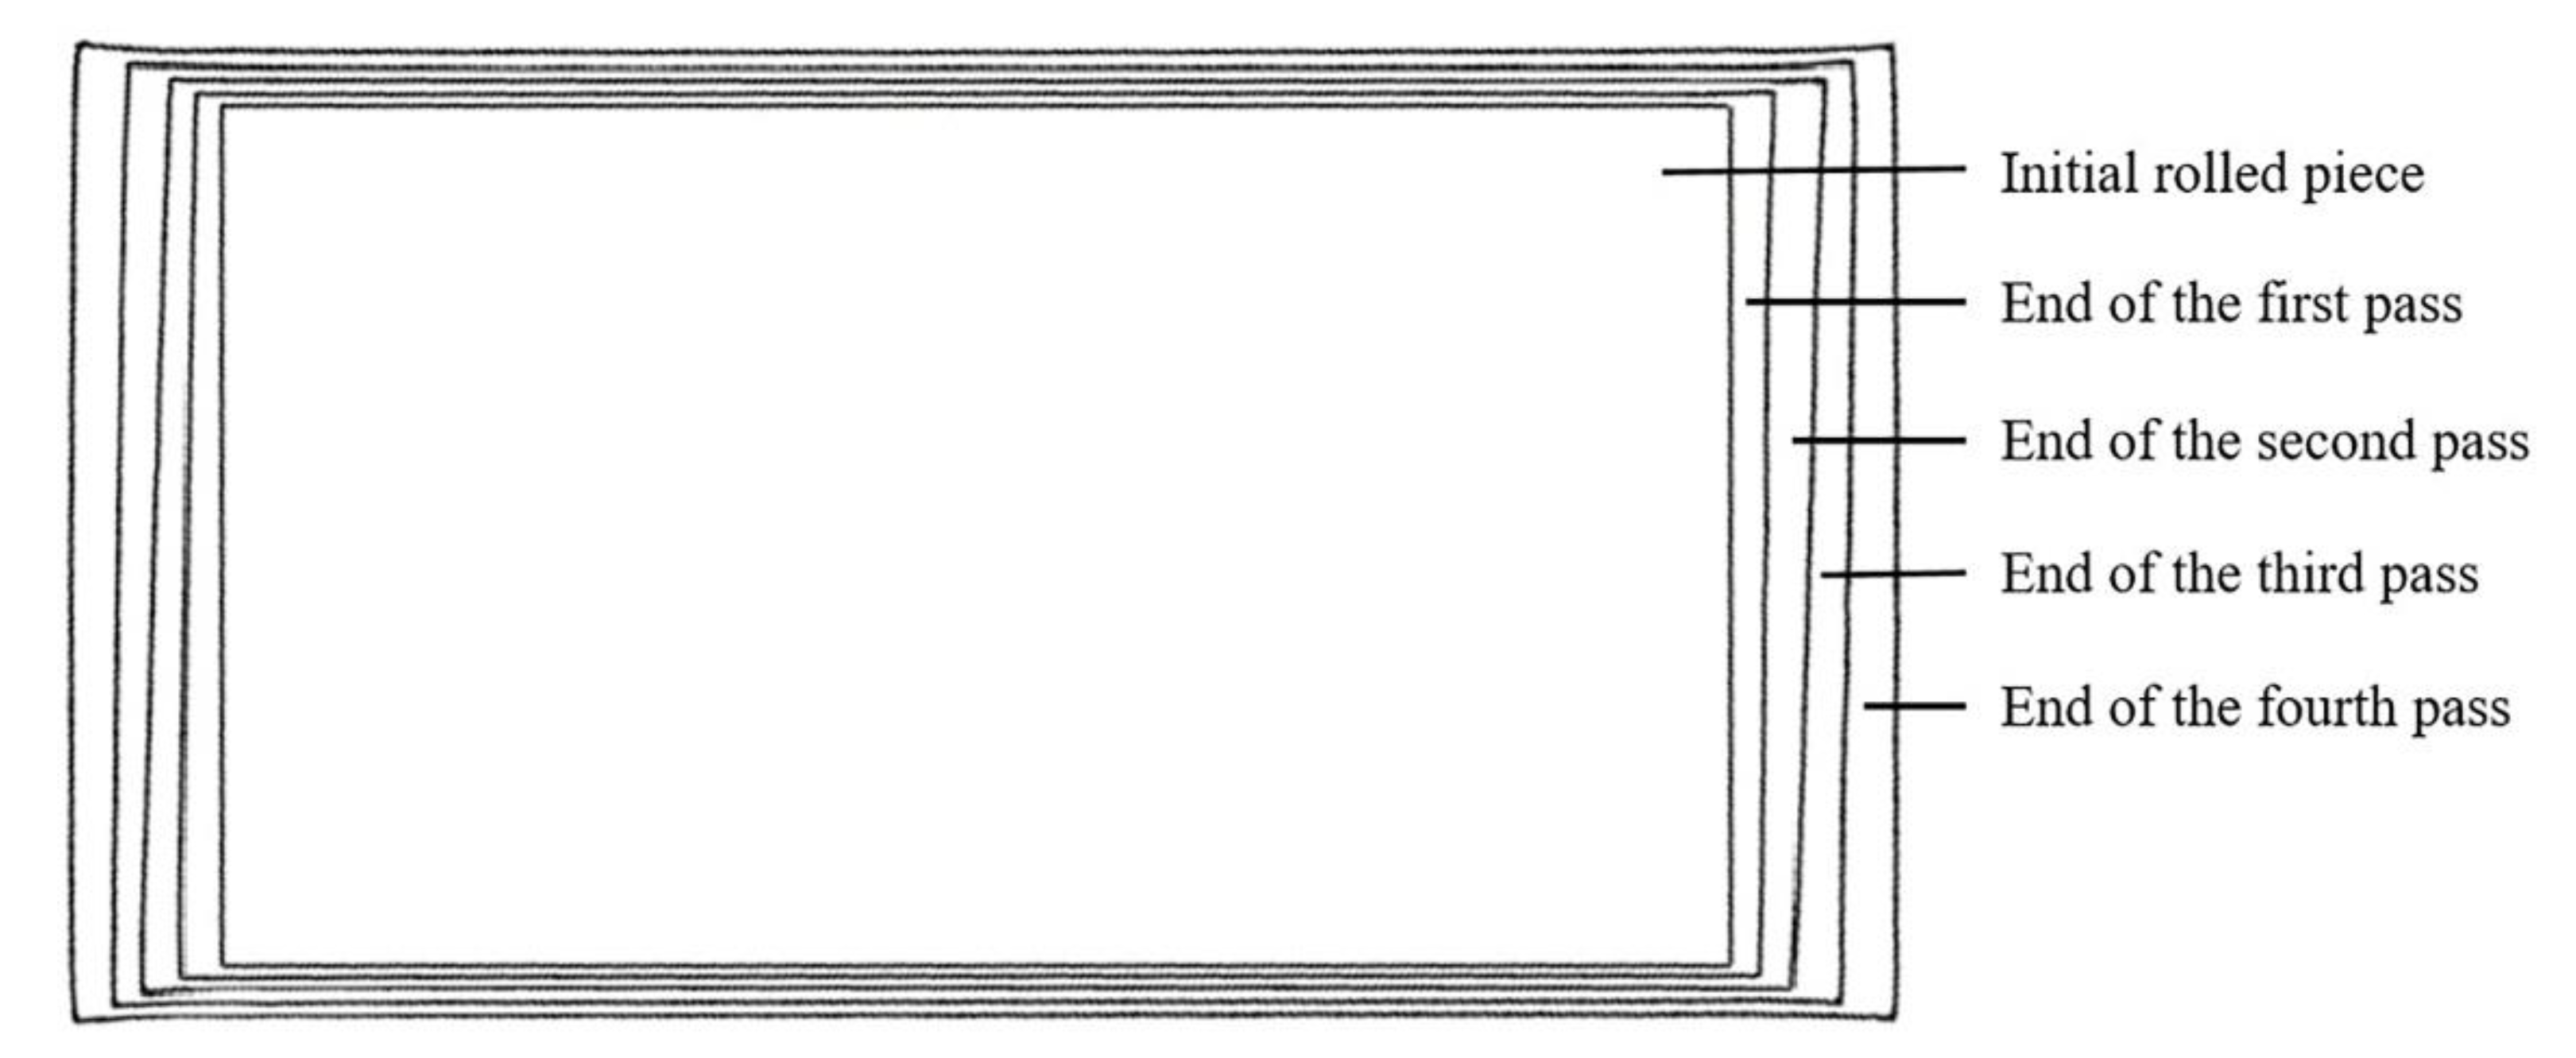
Figure 10.
Rectangular characteristic values of two-pass angular rolling: (a) First pass rotated by 15° and (b) First pass rotated by 20°.
Figure 10.
Rectangular characteristic values of two-pass angular rolling: (a) First pass rotated by 15° and (b) First pass rotated by 20°.
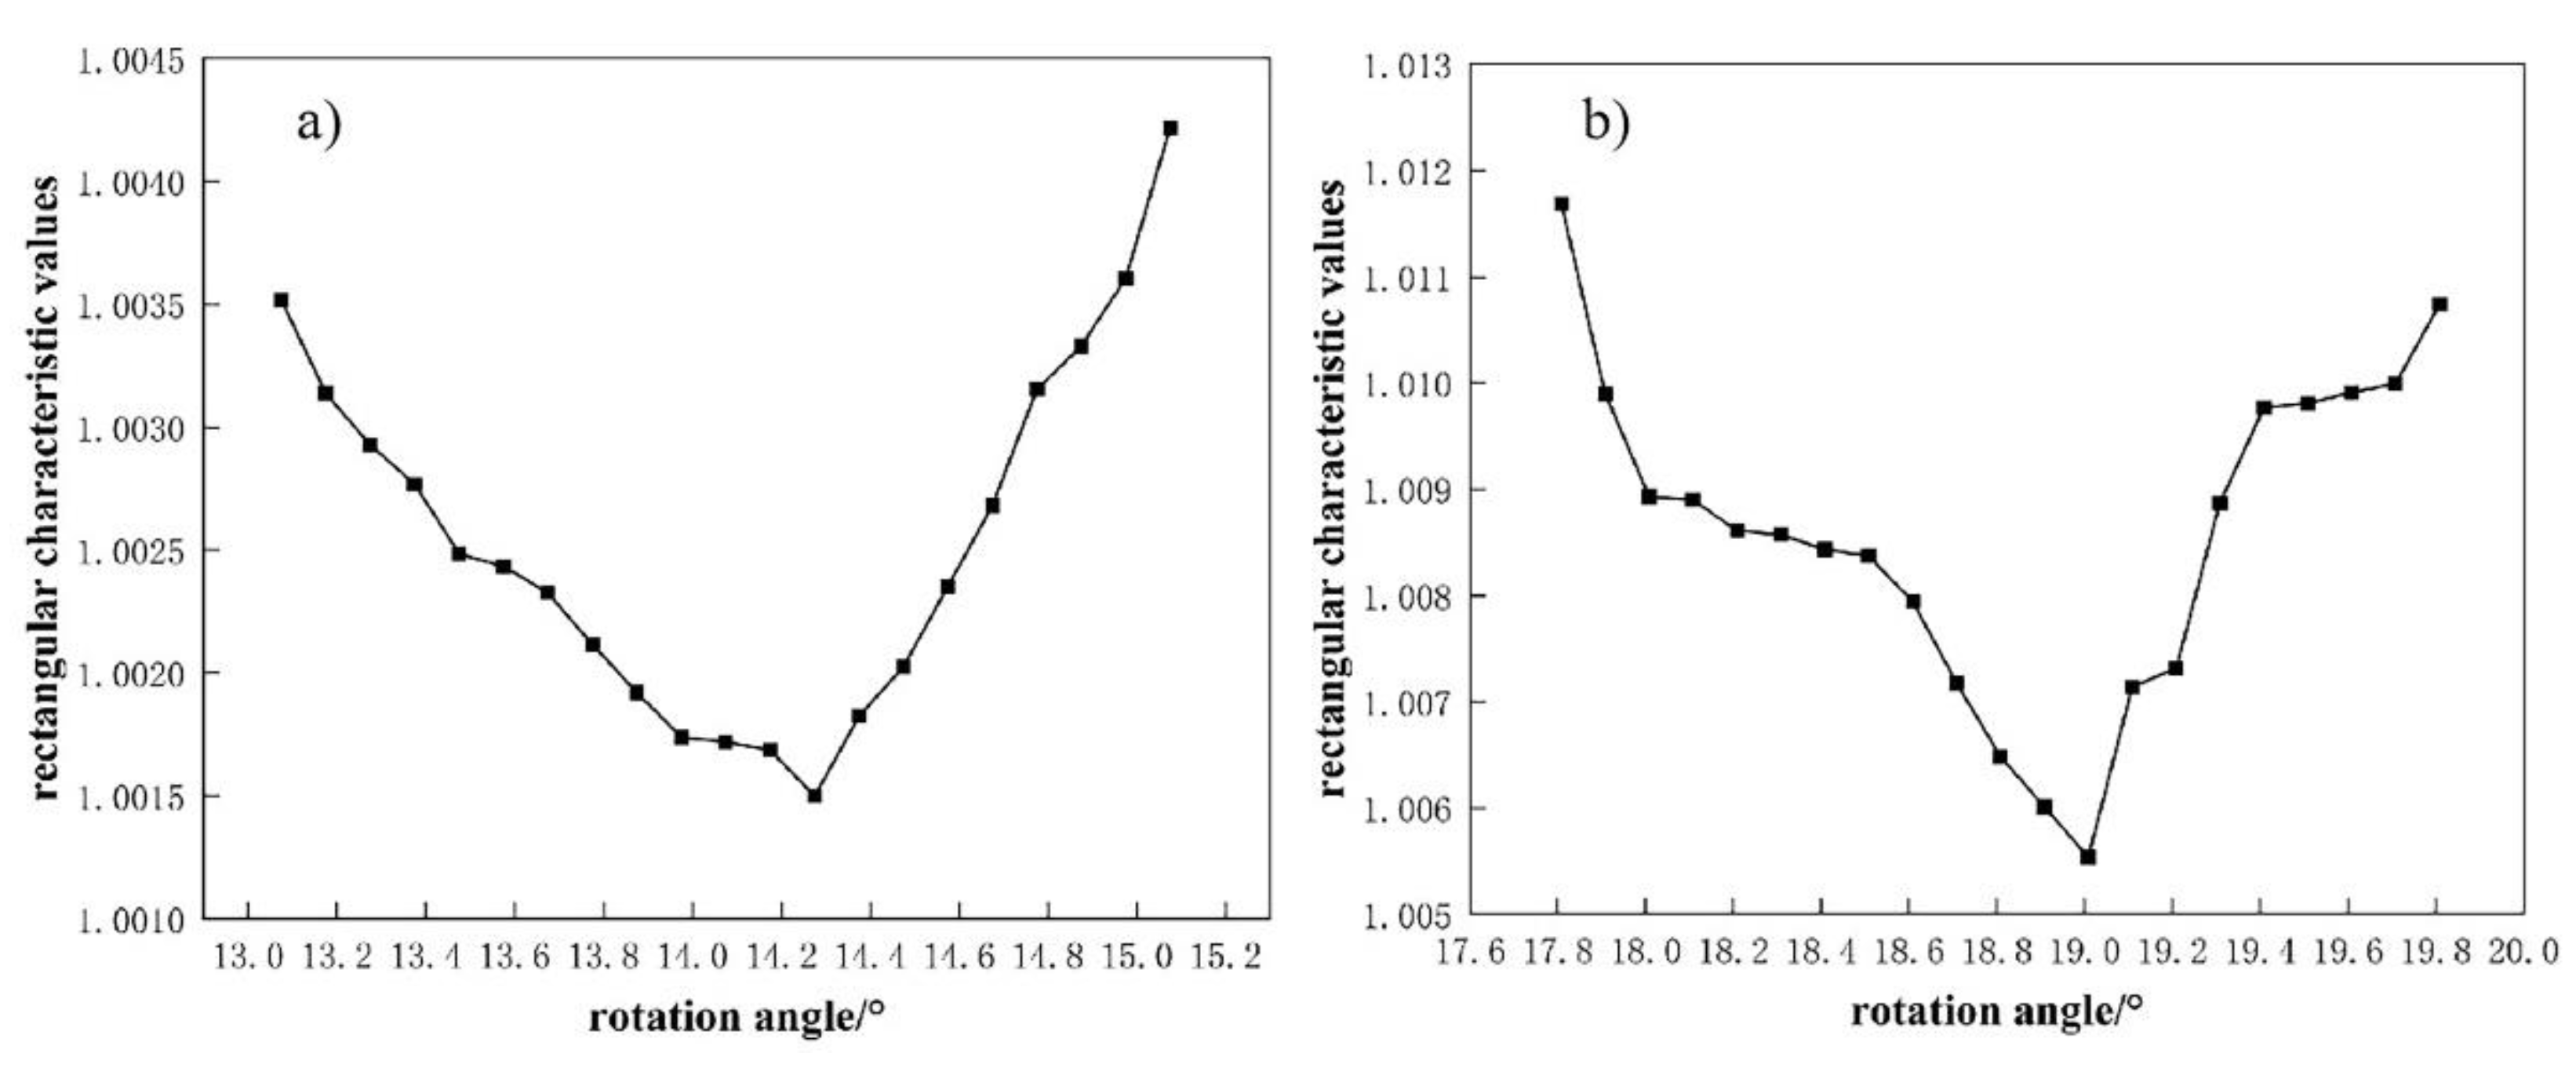
Figure 11.
Experimental rolling mill.
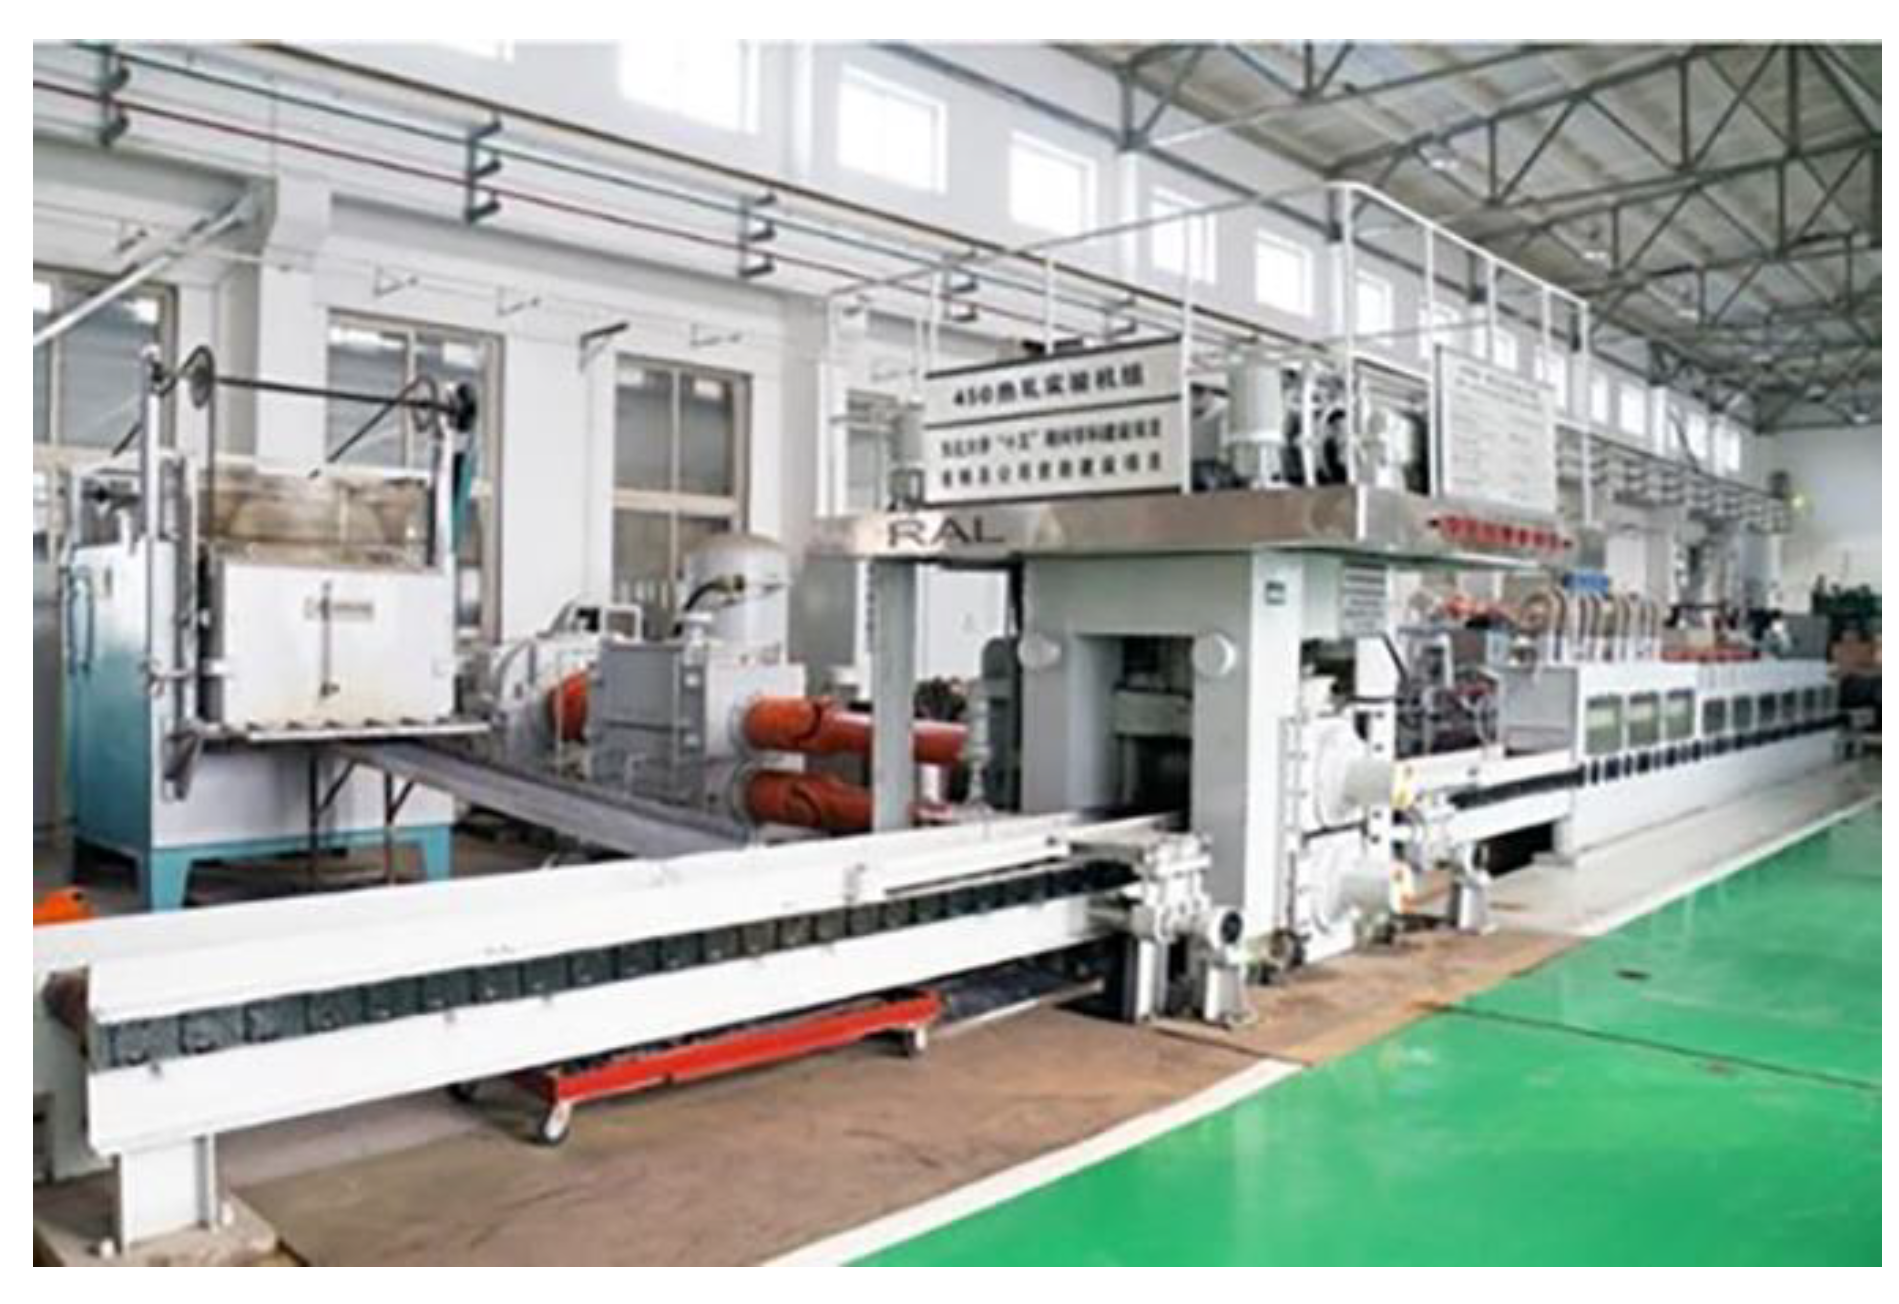
Figure 12.
Plan view pattern after angular rolling ( - reference points,
  - edge points): (a) Two-pass angular rolling and (b) Four-pass angular rolling.
- reference points, - edge points): (a) Two-pass angular rolling and (b) Four-pass angular rolling.
Figure 12.
Plan view pattern after angular rolling (- reference points, - edge points): (a) Two-pass angular rolling and (b) Four-pass angular rolling.
- reference points, - edge points): (a) Two-pass angular rolling and (b) Four-pass angular rolling.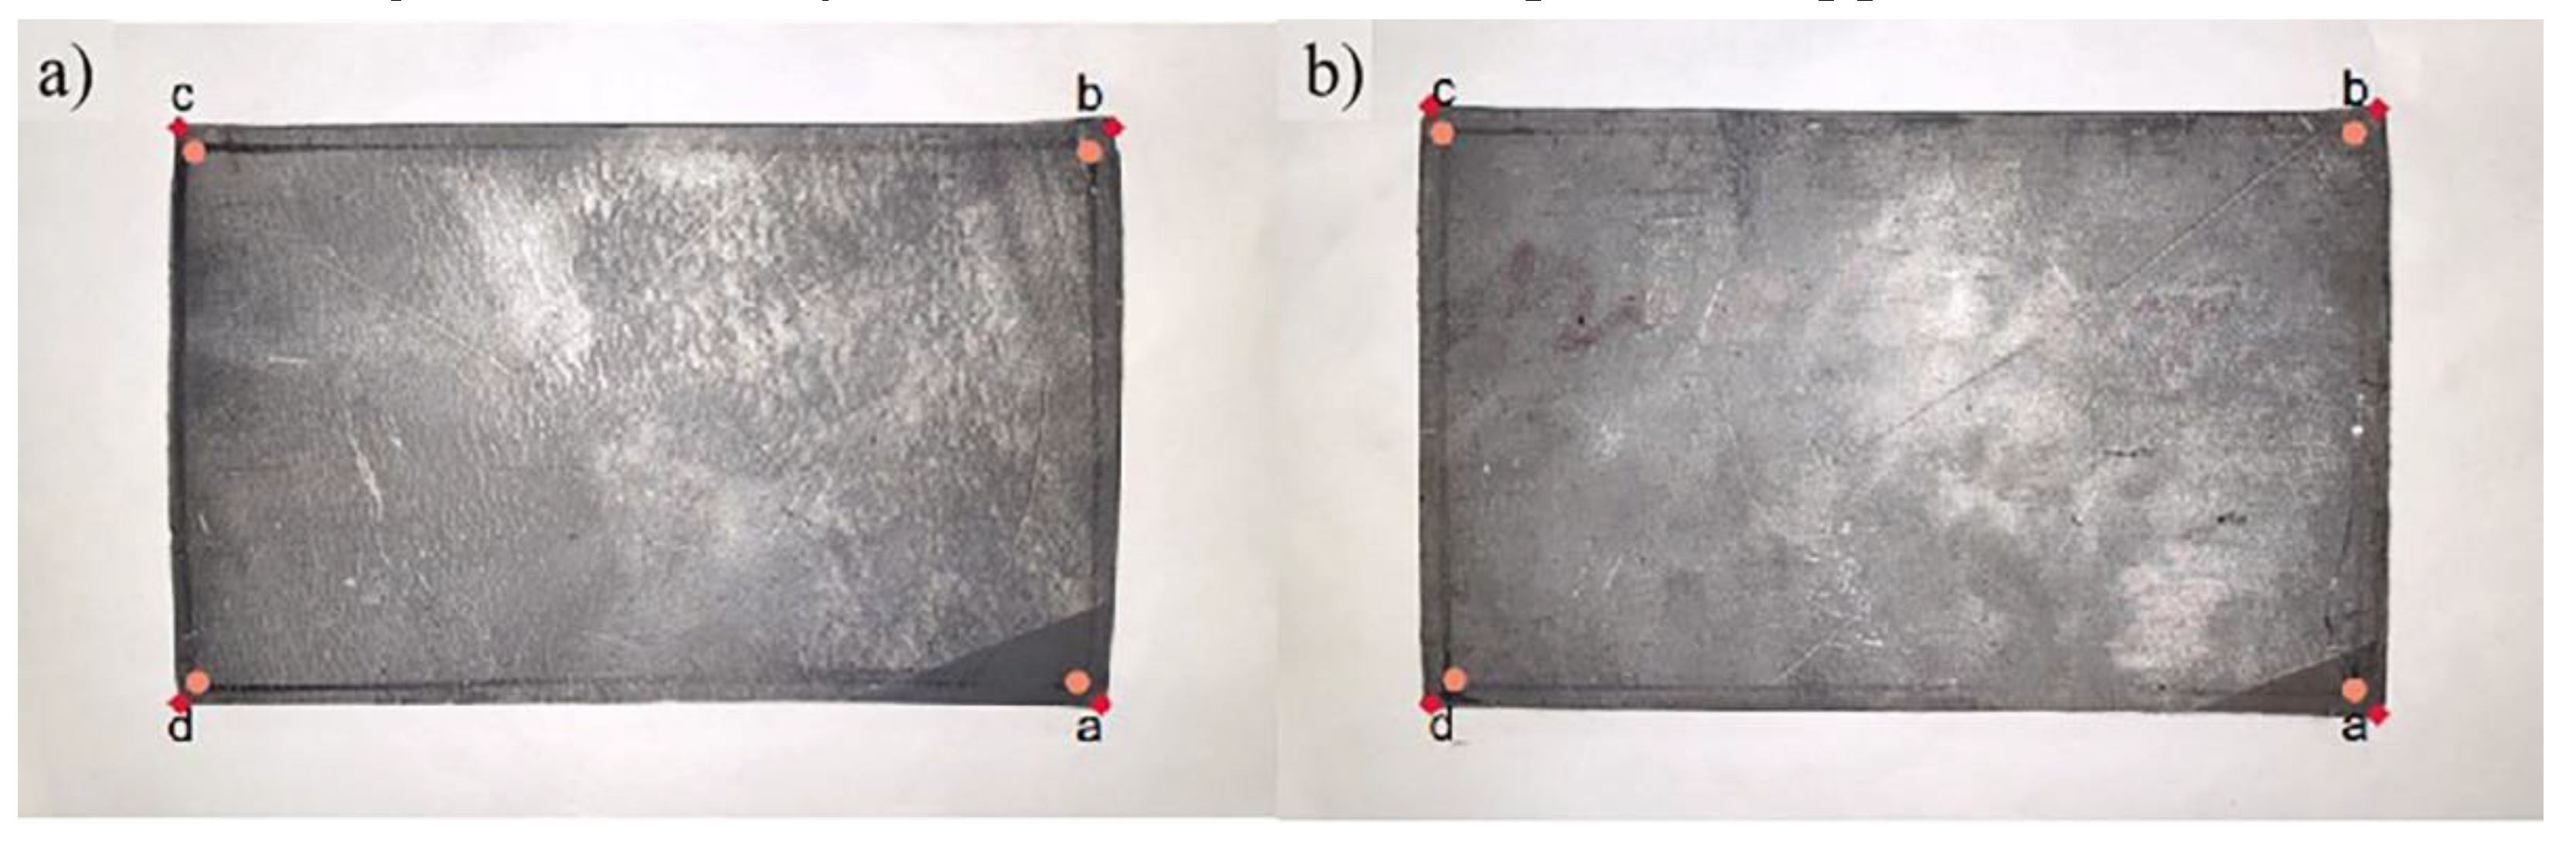
Figure 13.
Comparison of the rectangular characteristic values of the two processes.
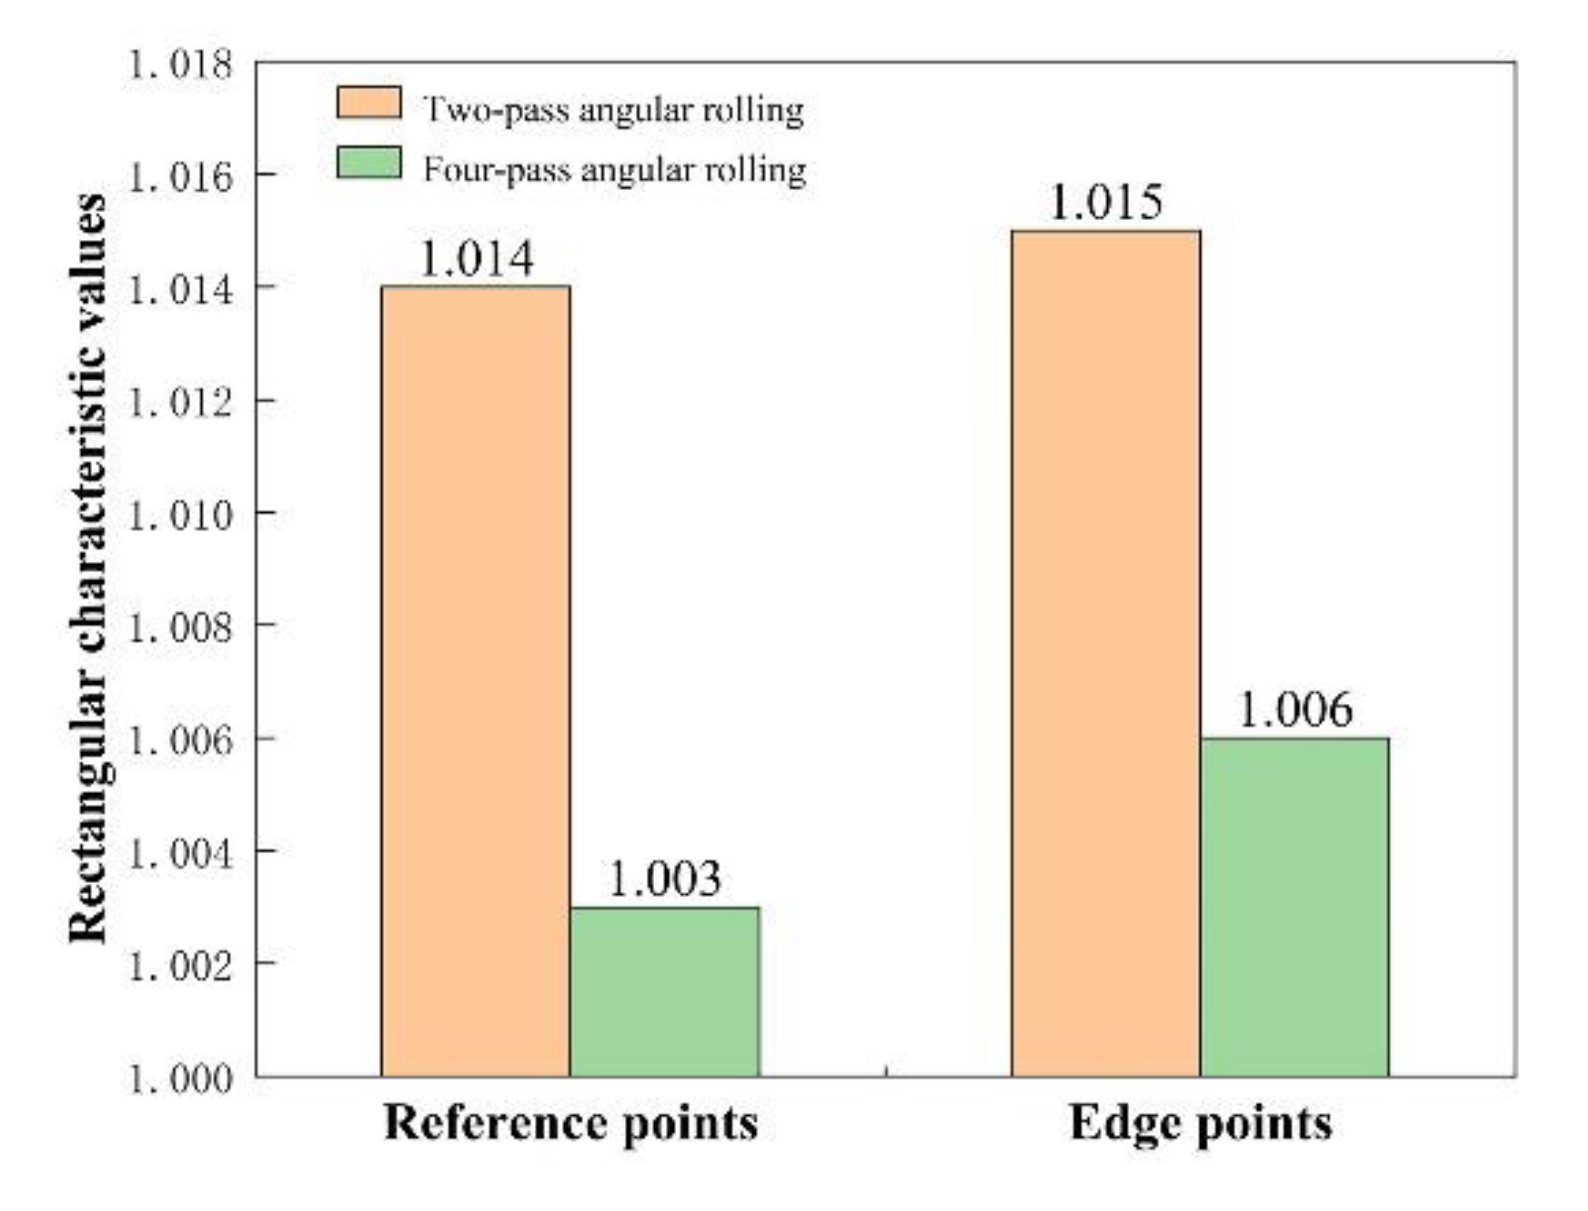

Table 1.
Simulation parameter settings.
| Ambient temperature /℃ |
Roll temperature /℃ |
Coefficient of Heat transfer /Wm-2℃-1 |
|---|---|---|
| 20 | 40 | 5 |
Table 2.
Rotation angle pass schedule of two-pass angular rolling.
| The first pass rotation angle /° | The second pass rotation angle /° |
|---|---|
| 15 | 14.075 |
| 20 | 18.808 |
Table 3.
Simulation rotation angle values.
| No. | The first pass rotation angle /° | The second pass rotation angle /° |
|---|---|---|
| 1 | 15 | 13.075 |
| 2 | 13.175 | |
| 3 | 13.275 | |
| 4 | 13.375 | |
| 5 | 13.475 | |
| 6 | 13.575 | |
| 7 | 13.675 | |
| 8 | 13.775 | |
| 9 | 13.875 | |
| 10 | 13.975 | |
| 11 | 14.075 | |
| 12 | 14.175 | |
| 13 | 14.275 | |
| 14 | 14.375 | |
| 15 | 14.475 | |
| 16 | 14.575 | |
| 17 | 14.675 | |
| 18 | 14.775 | |
| 19 | 14.875 | |
| 20 | 14.975 | |
| 21 | 15.075 |
Table 4.
Rectangular characteristic values obtained from the simulation.
| Rotation angle of the first pass /° | Optimum rotation angle of the second pass /° | Rectangular characteristic value |
|---|---|---|
| 15 | 14.275 | 1.0015 |
| 20 | 19.008 | 1.0055 |
Table 5.
Rolling mill and mill parameters.
| Parameter | Size |
|---|---|
| The diameter of roller /mm | 450 |
| The length of roller /mm | 450 |
| The length of rolled piece /mm | 160 |
| The width of rolled piece /mm | 120 |
| The thickness of rolled piece /mm | 16 |
Table 6.
Experimental rolling schedule.
| Rolling pass | Two-pass | Four-pass |
|---|---|---|
| The exit thickness of the first pass /mm | 13.9 | 14.9 |
| The exit thickness of the second pass /mm | 12 | 13.9 |
| The exit thickness of the third pass /mm | / | 12.9 |
| The exit thickness of the fourth pass /mm | / | 12 |
| The rotation angle of the first pass /° | 20 | 20 |
| The rotation angle of the second pass /° | 17.5 | / |
| The rotation angle of the third pass /° | / | 17.5 |
| The rotation angle of the fourth pass /° | / | / |
Table 7.
Experimental data.
| Parameter | Two-pass angular rolling (edge points) | Four-pass angular rolling (edge points) | Two-pass angular rolling (reference points) | Four-pass angular rolling (reference points) |
|---|---|---|---|---|
| ab /mm | 124.70 | 127.86 | 115.89 | 116.84 |
| cd /mm | 126.01 | 127.87 | 116.40 | 116.86 |
| ad /mm | 199.53 | 201.75 | 193.3 | 191.74 |
| bc /mm | 200.05 | 202.31 | 194.18 | 192.01 |
| ac /mm | 235.8 | 237.55 | 225.04 | 224.42 |
| bd /mm | 236.19 | 238.36 | 226.24 | 224.74 |
Disclaimer/Publisher’s Note: The statements, opinions and data contained in all publications are solely those of the individual author(s) and contributor(s) and not of MDPI and/or the editor(s). MDPI and/or the editor(s) disclaim responsibility for any injury to people or property resulting from any ideas, methods, instructions or products referred to in the content. |
© 2024 by the authors. Licensee MDPI, Basel, Switzerland. This article is an open access article distributed under the terms and conditions of the Creative Commons Attribution (CC BY) license (http://creativecommons.org/licenses/by/4.0/).
Copyright: This open access article is published under a Creative Commons CC BY 4.0 license, which permit the free download, distribution, and reuse, provided that the author and preprint are cited in any reuse.


