
Submitted:
07 November 2024
Posted:
08 November 2024
You are already at the latest version
Abstract
Estuaries are dynamic and resource-rich ecosystems renowned for their high productivity and ecological significance. The Rías Baixas, located in the northwest of the Iberian Peninsula, consist of four highly productive estuaries that support the region's economy through key fisheries and aquaculture activities. Numerical modelling of biogeochemical processes in the rias is essential to address environmental and anthropogenic pressures, particularly in areas facing intense human development. This study presents a high-resolution water quality model developed using Delft3D software, integrating hydrodynamic (Delft3D-FLOW) and water quality (Delft3D-WAQ) modules. Calibration and validation demonstrate the robust performance and reliability of the model in simulating critical biogeochemical processes, such as nutrient cycling and phytoplankton dynamics. The model effectively captures seasonal and spatial variations in water quality parameters, including water temperature, salinity, inorganic nutrients, dissolved oxygen, and chlorophyll-a. Of the variables studied, the model performed best for dissolved oxygen, followed by nitrates, phosphates, ammonium, silicate and chlorophyll-a. While some discrepancies were observed in inner zones and deeper layers of the rias, overall performance metrics aligned closely with observed data, enhancing confidence in the model's utility for future research and resource management. These results highlight the model's value as a tool for research and managing water and marine resources in the Rías Baixas.
Keywords:
Delft3D-WAQ
; Iberian Peninsula
; model performance
; numerical modeling
; Rías Baixas
; water quality
1. Introduction
Coastal zones and estuaries are among the most important ecosystems globally. These transitional environments, where freshwater meets seawater, are highly productive and provide essential food resources and habitats for species of both ecological and economic significance [1,2]. Despite their importance, estuaries worldwide face numerous environmental and anthropogenic perturbations that alter habitats and disrupt biotic communities [3,4]. Key drivers of these changes include rising sea levels, eutrophication, and direct human activities within estuarine systems [5,6]. As these pressures intensify, the stability of aquatic communities and ecosystems is increasingly at risk, leading to deteriorating water quality and changes in ecosystem structure, function, and productivity [7,8,9,10].
The Galician Rías Baixas, located in the northwest Iberian Peninsula, are four estuaries of significant ecological, economic and social importance. These estuaries support rich marine biodiversity, including commercially valuable species, such as mussels and clams, that play a vital role in the economy of the region [11,12]. For example, in 2023, small-scale bivalve fisheries contributed approximately €62 million and sustained the livelihoods of around 4,300 fishers [13]. Moreover, the Rías Baixas support approximately 32% of the world’s production of Mytilus galloprovincialis [14]. However, like other coastal zones, the Rías Baixas are also experiencing increasing environmental pressures. Numerous studies have reported adverse effects and even mortality events in key species related to rising seawater temperatures [15,16,17] and salinity drops [18,19,20,21]. Other stressors, such as the increasing frequency and intensity of harmful algal blooms [22] and increased concentrations of metals and metalloids in sediments [23], also pose significant risks to biodiversity and the local economies [24].
In response to these challenges, numerical models have become essential tools for understanding estuarine dynamics and predicting the impacts of human activities, extreme events and climate change [25,26]. Models provide valuable insights into how changes in one or various factors influence estuarine systems [27,28]. Additionally, they help overcome limitations in field observations, allowing for a comprehensive assessment of hydrodynamic, water quality and sediment transport [29]. Such information is critical for improving ecosystem management, enhancing service delivery, and ensuring ecosystem resilience. These models have been applied to assess pollution and contamination responses in China (e.g., [30,31,32]); to predict algal blooms and eutrophication in the Dutch North Sea [33,34]; and to enhance estuarine knowledge and evaluate climate change impacts on aquaculture in Portugal (e.g., [35,36,37,38]).
In the Rías Baixas, previous research has extensively utilized numerical models to improve the understanding of hydrodynamic processes (e.g., [10,39,40,41,42,43]). Additionally, simplified models have provided valuable insights into biogeochemical cycles and nutrient dynamics in the region [43,45,46,47]. To our knowledge, however, only [48] have addressed the complex task of jointly simulating hydrodynamic and water quality processes in three dimensions.
This study presents the validation of a coupled hydrodynamic and water quality model developed using Delft3D-4 software, designed for a comprehensive spatial and temporal analysis of environmental conditions within the Rías Baixas. The model, which integrates the Delft3D-FLOW and Delft3D-WAQ modules, was calibrated and validated against observed data for the four estuaries of the Rías Baixas. Simulations were conducted from September 1, 2016, to June 1, 2018, with the first 6 months serving as spin-up and the study period spanning from March 2017 to May 2018. A key advancement of this model, compared to other water quality models developed for this area, is the inclusion of the Minho River, which has a significant influence on the Rías Baixas impacting residence times and primary production dynamics through plume intrusions. Additionally, this study advances the validation process by including nutrient dynamics, a crucial factor in processes such as eutrophication, which can severely impact biodiversity and ecosystem health. The insights gained from this research will support future studies and inform management strategies to protect and improve water quality in these ecosystems.
2. Study Area
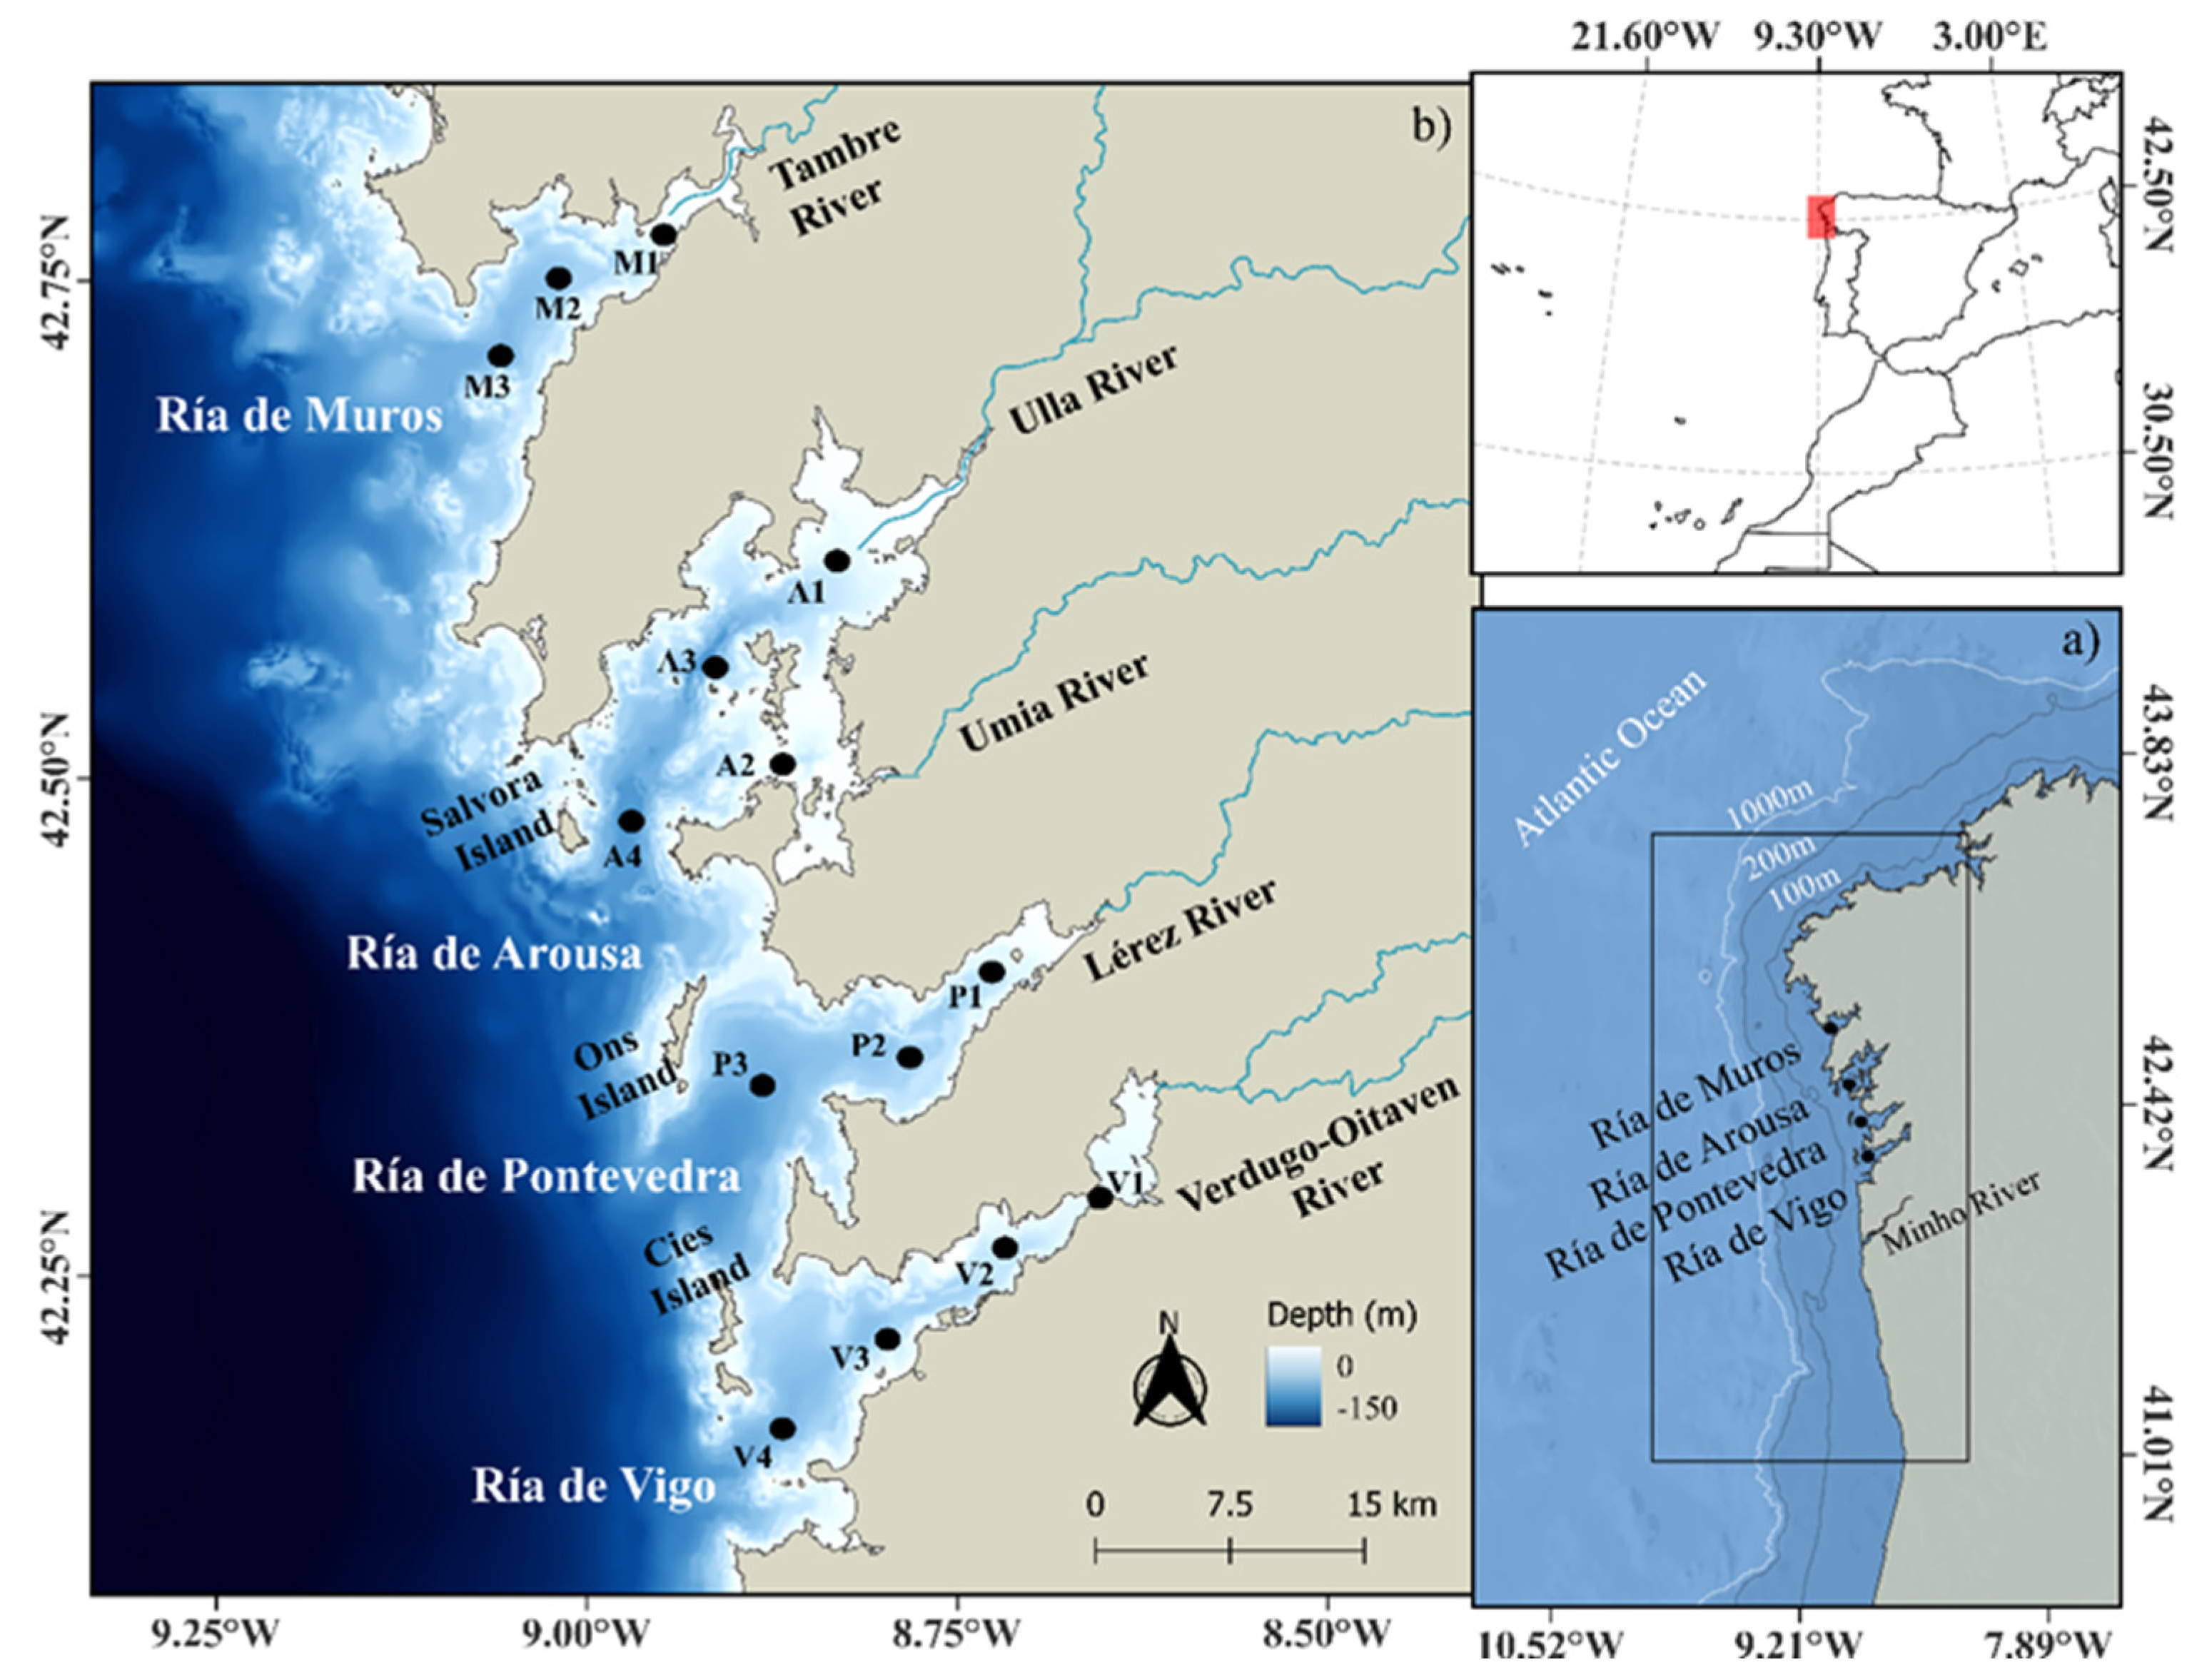
The Rías Baixas comprise four specific subtypes of estuary, known as rias, located in the NW Iberian Peninsula, at the northern boundary of the North Atlantic Upwelling System (Figure 1b, [49]). From North to South, these estuaries are named Ría de Muros, Ría de Arousa, Ría de Pontevedra, and Ría the Vigo. They have a NE-SW orientation along their main axis, are bordered by steep hills, and were formed by the flooding of river valleys due to rising sea levels [50,51,52]. The average water depths within the rias range from 5-10 m in the inner parts, where the main rivers flow into the estuary, to 40-60 m at the outer (SW) entrance to the sea. The rias, with the exception of the Ría de Muros, are partially protected by small islands at their mouths, which corresponds to structural highs [51,53,54]. More information about the morphologic characteristics of the Rías Baixas are shown in Table 1.
Figure 2.
(a) Location of the study area, with the box indicating the modeled region. (b) Close-up view of the study area, showing the locations of the in-situ data stations (dots) used to perform model calibration and validation.
Figure 2.
(a) Location of the study area, with the box indicating the modeled region. (b) Close-up view of the study area, showing the locations of the in-situ data stations (dots) used to perform model calibration and validation.
Hydrodynamically, Rías Baixas typically behave as partially mixed estuaries with a two-layered positive circulation [39]. Freshwater flows offshore through the surface while dense, saline ocean water enters through the bottom layers. However, this circulation is strongly influenced by upwelling and downwelling events [50]. During the upwelling season, from April to October, equatorward winds over the shelf enhance the positive circulation by driving Eastern North Atlantic Water into the estuaries along the bottom increasing the net inflow of cold, nutrient-rich water [45,55,56]. This nutrient influx makes the rias highly productive, with elevated remineralization and sedimentation due to intensified physical and biological activity [44,57]. Contrarily, during downwelling events, when poleward winds dominate, the positive circulation weakens or even reverses, trapping water inside the rias. This leads to nutrient depletion, except in the innermost areas, where river outflow becomes the main nutrient source, boosting biological activity [44,58]. The Minho River can also induce a reversal of the positive circulation through freshwater intrusions during downwelling conditions and high river discharge [59,60,61]. Under these conditions, water exchange with the continental shelf is limited, potentially reducing water quality [59]. Additionally, intrusions can also increase nutrient levels, promoting phytoplankton blooms that can enter the rias [62].
Nutrient dynamics within the Rías Baixas are also significantly influenced by upwelling and downwelling events. Upwelling introduces nutrient-rich water into the deeper layers, while thermal stratification limits the upward movement of nutrients, resulting in high concentrations at depth and lower levels near the surface. In contrast, during downwelling, the influx of less saline surface waters from continental runoff—especially in winter—elevates nutrient levels in the upper layers. This spatial variability in nutrient distribution is shaped by the interaction of continental runoff and upwelled water [63]. Primary production follows this variability, with lower production in winter but reaching levels exceeding 10 g C m² d⁻¹ in spring and summer as phytoplankton growth accelerates. Notably, about 55% of this production is available to higher trophic levels [64,65]. Phytoplankton biomass peaks seasonally, reaching around 8 mg m⁻³ in spring and autumn, while winter values remain below 1 mg m⁻³ and summer values average around 5 mg m⁻³ [66,67].
The tidal regime in the Rías Baixas is semi-diurnal and mesotidal, with tides occurring approximately every 12.25 hours. The tidal amplitude ranges from 1.3 m during neap tides to 3.4 m during spring tides. Tides are the most energetic force driving water circulation within the rias.
3. Methodology
3.1. In Situ Data for Model Calibration and Validation
In situ data measured by the Technological Institute for Monitoring the Marine Environment in Galicia [69] at representative points in the inner, middle, and outer sections of each estuary (Figure 1b) were used for model calibration and validation. Samples for nitrate, ammonium, phosphate, and silicate were collected weekly during the study period (March 2017 to May 2018) using a PVC hose to sample three depth intervals: 0-5m, 5-10m, and 10-15m. Additionally, biweekly samples were collected from the inner (V1) and outer stations (M3, A4, P3, and V4) at 1m depth and at the bottom. Nutrient analysis was based on colorimetric methods via continuous segmented flow analysis, as described by [68], using unfiltered samples. Weekly vertical profiles of seawater temperature, salinity, dissolved oxygen, and fluorescence (used to estimate the chlorophyll-a), were collected using a SBE25 CTD [69].
3.2. Numerical Modeling
This study uses the open-source Delft3D-4 suite [70] Access to to perform a three-dimensional (3D) hydrodynamic and water quality modeling of the Rías Baixas. The following modules were used:
The Delft3D-FLOW module was used to simulate water circulation, accounting for key physical processes such as tides, currents, and coastal structures. The 3D approach allows for a detailed spatial analysis of hydrodynamic conditions, including vertical stratification and circulation patterns within the estuaries. The grid and parametrization used in this study were presented and validated by [61], ensuring accurate flow predictions across the Rías Baixas.
The main focus of this study is implementing the 3D Delft3D-WAQ module, which simulates water quality dynamics through three-dimensional advection-diffusion equations. The model captures a wide range of ecological and chemical processes, including nutrient cycling, phytoplankton dynamics, eutrophication, and oxygen levels. It also considers the behavior of substances at air-water and water-sediment interfaces. One of the model’s keys is its extensive library of constituents, allowing users to customize the chemical and biological composition of aquatic systems effectively.
3.1.1. Hydrodynamic Module
This section summarizes the setup of the hydrodynamic module, with a detailed description available in [61]. The model uses a structured curvilinear grid that spans from 41.18° to 43.50° N and from 10.00° to 8.33° W (Figure 1a). The horizontal grid resolution varies, starting at 2200 × 800 m at the western boundary and refining to 220 × 140 m in the inner areas of the Rías Baixas. The grid is vertically divided into 16 sigma layers with refined top layers. The computational time step is 0.5 minutes. A spin-up period of 6 months was considered to ensure numerical stability and accuracy.
Bathymetric data were sourced from several providers. Nautical charts from the Hydrographic Institute of the Spanish Navy provided the data for the Muros and Arousa rias, while bathymetric data for the Vigo and Pontevedra rias were obtained from the Spanish General Fishing Secretary. The Hydrographic Institute of the Portuguese Navy provided data for the Minho estuary. To fill data gaps data from the General Bathymetric Chart of the Oceans was incorporated [71].
Daily salinity and water temperature at the open ocean boundary and for initial conditions were sourced from the Atlantic-Iberian Biscay Irish-Ocean Physics Reanalysis (product ID: IBI_MULTIYEAR_PHY_005_002), available through the Copernicus Marine Environment Monitoring Service (CMEMS) website [72]. This dataset has a spatial resolution of 0.083° × 0.083° and 50 vertical levels.
Astronomical forcing at the oceanic boundary was applied using thirteen tidal harmonic constituents (M2, S2, N2, K2, K1, O1, P1, Q1, MgF, MM, M4, MS4, MN4) based on a high-resolution model derived from TOPEX/Poseidon Altimetry data, with a spatial resolution of approximately 25 meters.
Atmospheric surface boundary conditions (air temperature, relative humidity, net solar radiation, surface pressure, and wind components) were imposed using hourly data from the ERA5 dataset [73] with a spatial resolution of 0.25° x 0.25°.
3.1.1. Water Quality module
The Delft3D-WAQ model configuration was optimized to balance computational efficiency, result quality, and data availability. The input variables selected for the simulation were ammonium (NH4+), nitrate (NO3-), phosphate (PO₄³⁻), dissolved silica (Si), dissolved oxygen (DO), total inorganic carbonate (TIC), alkalinity, biogenic silica (Opal-Si), diatoms, green algae, particulate organic carbon (POC1, fast decomposing fraction), nitrogen (PON1, fast decomposing fraction) and phosphorus (POP1, fast decomposing fraction). Key processes selected for the simulation of each variable are summarized in Table S1. Detailed descriptions of the formulations for these processes can be found in the Delft3D-WAQ technical reference manual [76].
The simulations were run with a computational time step of 30 min and a 6-month spin-up period. The 16 vertical layers from the FLOW grid were aggregated vertically into the WAQ module, where each layer from the hydrodynamic module directly corresponds to one layer in the WAQ module (1:1 aggregation approach). Default parameters were used, except for those listed in Table 2. Carbonaceous biological oxygen demand (CBOD5), sediment oxygen demand (SOD), and zooplankton parameters were incorporated into the model as spatially homogeneous time series, following the values from [77,78,79] respectively (see Figure S1). Irradiation was applied uniformly across the water surface using a net solar radiation time series. Julian day numbers were calculated starting from January 1 of the corresponding year.
Daily water quality data for the oceanic open boundary was obtained from the Atlantic-Iberian Biscay Irish Ocean BioGeoChemistry NON-ASSIMILATIVE Hindcast (product ID: IBI_MULTIYEAR_BGC_005_003), provided by CMEMS. This product provides 3D biogeochemical data with a horizontal resolution of 0.083º x 0.083º and 50 vertical layers. Variables such as NH4+, NO3-, PO₄³⁻, Si, and DO were directly retrieved from this dataset. TIC, alkalinity, diatoms, green algae, POC1, PON1, POP1 and Opal-Si were derived using other variables from IBI_MULTIYEAR_BGC_005_003 (see Table 3).
Due to the lack of available data for river boundary water properties during the simulation period, climatological and bibliographic data were used instead (see Table 4 for further details).
Finally, the atmospheric condition for surface radiation was forced using hourly net solar radiation as a time series from ERA5 [72].
3.3. Model Calibration
The model was run from September 1, 2016, to June 1, 2018, with the first 6 months serving as spin-up period. Calibration covered the study period from March 2017 to May 2018, focusing on accurate simulation of water temperature, salinity, and water quality variables in the Rías Baixas. Calibrated variables included NH₄⁺, NO₃⁻, PO₄³⁻, Si, DO, and Chl-a. Model outputs were compared with in-situ measurements, with the best fit achieved using the parameterization shown in Table 2.
Model performance was assessed using qualitative and quantitative methods based on [35,86,87]. Evaluation metrics included Root Mean Square Error (RMSE), relative RMSE (rRMSE), percentage Bias (pBias), cost function (CF), Pearson correlation coefficient (r), and reliability (F).
RMSE quantifies the difference between predicted () and observed () values. Lower RMSE values indicate better model performance. It was calculated as:
where N is the total number of observations.
rRMSE normalizes the RMSE by the range between the 1st and 99th percentiles of observed values, O_99 and respectively O_1, reducing the impact of outliers. Acceptable thresholds for model performance are ±20% for water temperature, salinity, and DO; ±50% for nutrients, and ±100% for algae biomass following [88]. It was calculated as:
Cost Function (CF) is a dimensionless metric that assesses the fit between model outputs and observations. According to the [89], CF < 1 indicates very good model performance, 1–2 good, 2–5 reasonable, and CF > 5 poor:
were is the standard deviation of the data.
pBias measures whether the model systematically underestimates or overestimates observed values. According [90], an absolute value of pBias < 10% is excellent, 10–20% is very good, 20-40% is good, and values above 40% are weak. It was calculated as:
Pearson correlation coefficient (r) quantifies the correlation between observed and simulated data. It was calculated as:
Reliability (F) indicates the confidence in the correlation between model and in situ data. Reliability categories are 99%, 95%, and 75%, with higher F values indicating greater confidence in the model’s correlation. It is derived from the p-value and was calculated as:
4. Results
From the complete set of model results, only outputs for Ría de Muros and Ría de Arousa are presented in the main text. Ría de Arousa, with extensive mussel rafts and significant aquaculture, contrasts with the minimally impacted Ría de Muros, allowing for a comparison between areas with and without major aquaculture influence. Detailed results for the other two rias, Ría de Pontevedra and Ría de Vigo, as well as additional depth layers, are provided in the Supplementary Material.
4.1. Model Calibration and Performance
4.1.1. Hydrodynamic
Near surface (averaged from 0 to 5 m depth) model outputs showed good agreement with in-situ observations across all stations. RMSE values for both variables (temperature and salinity) tended to be higher at inner stations and decreased toward middle and outer stations, reflecting spatial variations within the estuaries (Figure 2 and Figure 3). Specifically, the RMSE for water temperature ranged from 0.43 to 0.63 ºC in the Ría de Muros (Figure 2) and from 0.57 to 0.78 ºC in the Ría de Arousa (Figure 3). For salinity, RMSE ranged from 0.32 to 1.69 in Ría de Muros and from 0.57 to 1.73 in Ría de Arousa. The best fit was observed at middle and outer stations. Similarly, the model accurately captured the seasonal water temperature and salinity patterns observed in the field data, with higher values during summer (June, July, and August) and lower values in winter (December to February). Spatial gradients were also well reproduced, with higher water temperatures recorded at inner stations (M1, A1, and A2) and higher salinity levels observed at outer stations (M3 and A4). Additionally, the model effectively simulated the vertical distribution of water temperature and salinity providing a robust representation of surface and subsurface dynamics (Figures S2 to S9). These results suggest that the model is capable of replicating both horizontal and vertical hydrodynamic variability in the Rías Baixas, essential for further water quality simulations.
Pearson’s correlation coefficient (r) for salinity followed a similar pattern to RMSE, with higher values at the middle and outer stations compared to the inner ones (Figure 2 and Figure 3). In Ría de Muros, r for salinity ranged from 0.80 to 0.87, while in Ría de Arousa it ranged from 0.71 to 0.94. Water temperature, however, showed consistently high correlations across most stations, with r values of 0.9 or higher, except for slightly lower correlations at M1 (0.88) and V3 (0.8; Figure S15).
The rRMSE for both salinity and water temperature was below the threshold of 20% (Figure 4 and Figure S20), demonstrating the model’s strong predictive capabilities. However, for water temperature, rRMSE was slightly higher in deeper layers compared to near-surface (0–5 meters), while for salinity, rRMSE was lower at greater depths. At specific stations, such as A1 for salinity (Figure 4) and V3 (Figure S20) for water temperature, rRMSE exceeded 20% in the bottom and surface layers. Despite these discrepancies, both variables showed 99% reliability across all stations.
The cost function (CF) values for salinity and water temperature ranged from 0.15 to 0.6 (Figure 5 and Figure S21), while the pBIAS remained below 6% (Figure 6 and Figure S22), indicating very good model performance for both metrics. Notably, the highest CF values were observed for salinity at inner stations of the Ría de Arousa (0.85 at A1) and Ría de Pontevedra (0.78 at P1; Figure S21), as well as the bottom layer in Ría de Muros (0.66 at M3). Importantly, despite these elevated CF values, the pBIAS for these stations remained below 1% reflecting a strong model accuracy.
4.2. Water Quality
The model’s performance in predicting water quality variables exhibited a similar trend to that of salinity, with RMSE values generally higher at inner stations and decreasing towards the middle stations and the estuary mouth. NO3- and Si had the highest average RMSE, ranging from 2.46 to 4.02 µmol L-1 and from 2.27 to 6.61 µmol L-1 in Ría de Muros (Figure 7), and from 2.96 to 3.18 µmol L-1 and from 3.97 to 6.43 µmol L-1 in Ría de Arousa (Figure 8). Underestimations of nutrient concentrations were observed during autumn and winter, particularly in inner areas and upper layers of the rias of Arousa and Vigo, as well as for NH4+ and Si in the Ría de Pontevedra (see stations P1, P2, V1 and V2; Figures S10 and S15). Deeper layer concentrations at the mouth of the estuaries were also slightly underestimated during summer (Figures S5 and S9). Peak concentrations of NH4+ and Si were recorded in the rias of Muros and Pontevedra in October 2017, and in the rias of Muros, Arousa and Vigo in spring 2018. RMSE for Chl-a ranges from ~3 mg m-3 in outer stations to ~4.4 mg m-3 in inner stations (Figure 7 and Figure 8), with a tendency to underestimate winter concentrations in the Ría de Muros and overestimate spring peaks in the rias of Arousa and Pontevedra (Figure S10). Nevertheless, the model was able to satisfactorily reproduce inorganic nutrient concentrations (for the upper 15 meters) in spring and summer, and Chl-a concentrations in summer and autumn. Similarly, spatial gradients were also well reproduced with the highest (lowest) concentrations occurring at internal (external) stations.
Regarding rRMSE, all water quality variables exhibited average values below or equal to acceptable thresholds across all stations (~21% for NO3-, ~23% for PO43-, ~26% for NH4+, Si, and DO, and 30% for Chl-a; Figure 9 and Figure S20). The cost function (CF) indicated strong model performance, with values below 1 across the region (~0.49 for NO3-, ~0.62 for PO43-, ~0.64 for Si, ~0.73 for NH4+, ~0.83 for DO, and ~0.99 for Chl-a; Figure 10 and Figure S21). CF exceeded 1 only at inner stations (V1, A1, and M1), particularly for NH4+, Si, DO, and Chl-a. NO3-, PO43-, and DO exhibit the best overall performance, with pBIAS values of ~21% for NO3- and PO43-, and ~6% for DO (Figure 11 and Figure S22). Correlation coefficients (r) were above 0.60 for NO3- and 0.50 for both PO43- and DO, with reliability levels averaging ~97% for PO43-, ~98% for DO, and ~99% for NO3-. In contrast, Si presented higher pBIAS values, exceeding 40% in most cases, while NH4+ exhibited a similar pattern in deeper layers (10-15 meters and bottom) in the rias of Vigo, Pontevedra, and Arousa. Both nutrients showed positive correlations, with r values of 0.24 for NH4+ and 0.47 for Si, while their reliability was lower, around 80% for NH4+ and 86% for Si. Chl-a had the lower reliability (~77%; Figure 11) and r value (0.26), with an average pBIAS of ~37% across the region (Figure 11 and Figure S22).
5. Discussion
The coupled Delft3D-FLOW and Delft3D-WAQ modules exhibited higher accuracy at the estuary mouths compared to inner stations. This trend aligns with modeling errors reported for other estuarine systems, such as in Mondego [91] and Sado [38,87] estuaries. Discrepancies between model outputs and observations can be due to uncertainties in riverine boundary conditions, the exclusion of minor tributaries due to data limitations, and inadequate bathymetric data in shallower areas [92]. Moreover, in this study, water quality inputs in the riverine boundary were based on existing datasets from the region and, due to the limited availability of data, often represent different periods or climatological conditions and may not fully capture specific conditions of the simulation period. For instance, October 2017 was marked by the second-highest wildfire outbreak in Galicia [93], which likely influenced nutrient dynamics by contributing NH4+, NO3-, and PO43- through atmospheric deposition and post-fire runoff [94,95,96].
Challenges in reproducing nutrient dynamics in deeper layers likely derive from the simplified parameterization of processes such as phytoplankton production and remineralization. This study’s approach, which considered only two phytoplankton groups (diatoms and green algae) with most rates and parameters fixed may not fully capture the intra- and inter-annual variability within the phytoplankton community. Multiple phytoplankton groups differ in their carbon-specific photosynthetic rates and their responses to light and nutrient uptake [98,99,100,101,102]. Consequently, the simplified model configuration could lead to overestimated production and nutrient uptake, leading to depletion in the water column [103,104,105]. The model’s constant rates for remineralization processes, like nitrification and ammonification, also omit seasonal variations, potentially explaining nutrient peaks, particularly NH4+, observed in October and November in upper layers [66,106].
Despite these constraints, this study has successfully implemented the coupled Delft3D-FLOW and Delft3D-WAQ model for the Rías Baixas, demonstrating proficiency in reproducing both physical variables (water temperature and salinity) and water quality parameters (inorganic nutrients, DO, and Chl-a). The performance of the hydrodynamic module is consistent with [61], whose grid and parameterization were adopted and aligns with studies by [48,107,108], which used the MOHID, ROMS, and Delft3D models for the same region. The performance of the water quality model lags behind that of hydrodynamic models. It was expected due to the complexity of modeling the natural and biological processes within aquatic environments led to the consensus that water quality models often perform worse than those for hydrodynamics [35,86,87]. Nevertheless, the results of this study are consistent with previous research [35,36,38,82,87,91,109]. For example, Chl-a RMSE values in the Breton Sound Estuary reported by [109] exceeded 10 mg m⁻³, while [82] reported values between 1 and 12 mg m⁻³ for Chl-a, 0.64 to 14.19 µmol L⁻¹ for NO3-, and 0.126 to 0.59 µmol L⁻¹ for PO₄³⁻ in the North Sea, all exceeding values obtained for the Rías Baixas. Notably, [38,87] reported similar pBIAS values for inorganic nutrients to those found in this study, indicating that the model demonstrates comparable or even superior performance in nutrient representation compared to other regions. Furthermore, DO results align closely with those obtained by [110] for the same region; however, the set-up used in the present study shows higher performance in reproducing transport conditions.
Usually, the most favorable results for environmental or aquatic models are achieved for water temperature and dissolved oxygen, followed by inorganic nutrients, with algal biomass exhibiting higher errors [111,112]. This study similarly observed the most accurate predictions for water temperature and DO, followed by inorganic nutrients (in the order of NO3-, PO43-, NH4+, and Si), with the highest errors noted in the predictions for Chl-a across the region.
Finally, the coupled model captured the hydrodynamic and biogeochemical processes accurately, properly representing seasonal and spatial variations in the Rias Baixas. However, accounting for mussel farming dynamics, particularly in the rias of Arousa and Vigo, would likely enhance model performance. Mussels, as filter feeders, remove organic particles (including phytoplankton) from the water, reducing DO levels and depositing particulate organic matter on the seabed, which enriches the nutrient pool [87,113,114]. By incorporating mussel dynamics, the model could better capture phytoplankton fluctuations and nutrient recycling, thereby improving Chl-a and DO predictions in surface layers and helping to correct overestimated nutrients observed during certain periods.
6. Conclusions
This study successfully implemented a coupled Delft3D-FLOW and Delft3D-WAQ model for the Rías Baixas, effectively reproducing key hydrodynamic and biogeochemical processes. By accurately simulating water temperature, salinity, and essential water quality variables such as inorganic nutrients, dissolved oxygen (DO), and chlorophyll-a (Chl-a), the model provides a reliable representation of seasonal and spatial variations within the estuary system.
The model’s higher accuracy at estuary mouths compared to inner regions highlights the importance of refining boundary conditions and model resolution in complex estuarine environments. Discrepancies in nutrient dynamics and Chl-a levels underscore the intricacies of biogeochemical processes in estuarine settings, indicating a need for enhanced parameterization of nutrient cycling and phytoplankton dynamics.
Incorporating factors like phytoplankton diversity, seasonal variation in remineralization rates, and the influence of agricultural runoff and wildfire events could further improve model precision. Additionally, including dynamics related to mussel farming may be particularly beneficial for regions like Arousa and Vigo, where high mussel densities significantly impact nutrient and phytoplankton levels.
In summary, the coupled Delft3D model demonstrates valuable potential for predicting estuarine dynamics. Its application in the Rías Baixas serves as a model for similar studies, supporting better-informed decisions for ecosystem management, climate adaptation, and water quality enhancement in complex coastal systems.
Supplementary Materials
The following supporting information can be downloaded at the website of this paper posted on Preprints.org, TableS1: Simulated state variables and main processes in water quality modeling. Figure S1. Forced (a) biological oxygen demand (BOD), (b) sediment oxygen demand (SOD), and (c) pelagic grazing of zooplankton incorporated into the model. These parameters were included as spatially homogeneous time series and vary according to [77,78,79], respectively. Figure S2. Comparison between observed and predicted water temperature, salinity, NO3-, PO4-3, NH4+, Si, DO, and Chl-a concentrations at 5-10 meters depth across the M1 to M3 monitoring stations in Ría de Muros. Black dots represent observed values, while the grey line shows the modeled time series for the period March 2017 – May 2018. Statistical results (RMSE and r) are included, where ***, ** and * denote reliability levels of 99%, 95%, and 75%, respectively. Figure S3. Comparison between observed and predicted water temperature, salinity, NO3-, PO4-3, NH4+, Si, DO, and Chl-a concentrations at 10-15 meters depth across the M1 to M3 monitoring stations in Ría de Muros. Black dots represent observed values, while the grey line shows the modeled time series for the period March 2017 – May 2018. Statistical results (RMSE and r) are included, where ***, ** and * denote reliability levels of 99%, 95%, and 75%, respectively. Figure S4. Comparison between observed and predicted water temperature, salinity, NO3-, PO4-3, NH4+, Si, DO, and Chl-a concentrations at surface layers across the M1 to M3 monitoring stations in Ría de Muros. Black dots represent observed values, while the grey line shows the modeled time series for the period March 2017 – May 2018. Statistical results (RMSE and r) are included, where ***, ** and * denote reliability levels of 99%, 95%, and 75%, respectively. Figure S5. Comparison between observed and predicted water temperature, salinity, NO3-, PO4-3, NH4+, Si, DO, and Chl-a concentrations at bottom layers across the M1 to M3 monitoring stations in Ría de Muros. Black dots represent observed values, while the grey line shows the modeled time series for the period March 2017 – May 2018. Statistical results (RMSE and r) are included, where ***, ** and * denote reliability levels of 99%, 95%, and 75%, respectively. Figure S6. Comparison between observed and predicted water temperature, salinity, NO3-, PO4-3, NH4+, Si, DO, and Chl-a concentrations at 5-10 meters depth across the A1 to A4 monitoring stations in Ría de Arousa. Black dots represent observed values, while the grey line shows the modeled time series for the period March 2017 – May 2018. Statistical results (RMSE and r) are included, where ***, ** and * denote reliability levels of 99%, 95%, and 75%, respectively. Figure S7. Comparison between observed and predicted water temperature, salinity, NO3-, PO4-3, NH4+, Si, DO, and Chl-a concentrations at 10-15 meters depth across the A1 to A4 monitoring stations in Ría de Arousa. Black dots represent observed values, while the grey line shows the modeled time series for the period March 2017 – May 2018. Statistical results (RMSE and r) are included, where ***, ** and * denote reliability levels of 99%, 95%, and 75%, respectively. Figure S8. Comparison between observed and predicted water temperature, salinity, NO3-, PO4-3, NH4+, Si, DO, and Chl-a concentrations at surface layers across the A1 to A4 monitoring stations in Ría de Arousa. Black dots represent observed values, while the grey line shows the modeled time series for the period March 2017 – May 2018. Statistical results (RMSE and r) are included, where ***, ** and * denote reliability levels of 99%, 95%, and 75%, respectively. Figure S9. Comparison between observed and predicted water temperature, salinity, NO3-, PO4-3, NH4+, Si, DO, and Chl-a concentrations at bottom layers across the A1 to A4 monitoring stations in Ría de Arousa. Black dots represent observed values, while the grey line shows the modeled time series for the period March 2017 – May 2018. Statistical results (RMSE and r) are included, where ***, ** and * denote reliability levels of 99%, 95%, and 75%, respectively. Figure S10. Comparison between observed and predicted water temperature, salinity, NO3-, PO4-3, NH4+, Si, DO, and Chl-a concentrations at 0-5 meters depth across the P1 to P3 monitoring stations in Ría de Pontevedra. Black dots represent observed values, while the grey line shows the modeled time series for the period March 2017 – May 2018. Statistical results (RMSE and r) are included, where ***, ** and * denote reliability levels of 99%, 95%, and 75%, respectively. Figure S11. Comparison between observed and predicted water temperature, salinity, NO3-, PO4-3, NH4+, Si, DO, and Chl-a concentrations at 5-10 meters depth across the P1 to P3 monitoring stations in Ría de Pontevedra. Black dots represent observed values, while the grey line shows the modeled time series for the period March 2017 – May 2018. Statistical results (RMSE and r) are included, where ***, ** and * denote reliability levels of 99%, 95%, and 75%, respectively. Figure S12. Comparison between observed and predicted water temperature, salinity, NO3-, PO4-3, NH4+, Si, DO, and Chl-a concentrations at 10-15 meters depth across the P1 to P3 monitoring stations in Ría de Pontevedra. Black dots represent observed values, while the grey line shows the modeled time series for the period March 2017 – May 2018. Statistical results (RMSE and r) are included, where ***, ** and * denote reliability levels of 99%, 95%, and 75%, respectively. Figure S13. Comparison between observed and predicted water temperature, salinity, NO3-, PO4-3, NH4+, Si, DO, and Chl-a concentrations at surface layers across the P1 to P3 monitoring stations in Ría de Pontevedra. Black dots represent observed values, while the grey line shows the modeled time series for the period March 2017 – May 2018. Statistical results (RMSE and r) are included, where ***, ** and * denote reliability levels of 99%, 95%, and 75%, respectively. Figure S14. Comparison between observed and predicted water temperature, salinity, NO3-, PO4-3, NH4+, Si, DO, and Chl-a concentrations at bottom layers across the P1 to P3 monitoring stations in Ría de Pontevedra. Black dots represent observed values, while the grey line shows the modeled time series for the period March 2017 – May 2018. Statistical results (RMSE and r) are included, where ***, ** and * denote reliability levels of 99%, 95%, and 75%, respectively. Figure S15. Comparison between observed and predicted water temperature, salinity, NO3-, PO4-3, NH4+, Si, DO, and Chl-a concentrations at 0-5 meters depth across the V1 to V4 monitoring stations in Ría de Vigo. Black dots represent observed values, while the grey line shows the modeled time series for the period March 2017 – May 2018. Statistical results (RMSE and r) are included, where ***, ** and * denote reliability levels of 99%, 95%, and 75%, respectively. Figure S16. Comparison between observed and predicted water temperature, salinity, NO3-, PO4-3, NH4+, Si, DO, and Chl-a concentrations at 5-10 meters depth across the V1 to V4 monitoring stations in Ría de Vigo. Black dots represent observed values, while the grey line shows the modeled time series for the period March 2017 – May 2018. Statistical results (RMSE and r) are included, where ***, ** and * denote reliability levels of 99%, 95%, and 75%, respectively. Figure S17. Comparison between observed and predicted water temperature, salinity, NO3-, PO4-3, NH4+, Si, DO, and Chl-a concentrations at 10-15 meters depth across the V1 to V4 monitoring stations in Ría de Vigo. Black dots represent observed values, while the grey line shows the modeled time series for the period March 2017 – May 2018. Statistical results (RMSE and r) are included, where ***, ** and * denote reliability levels of 99%, 95%, and 75%, respectively. Figure S18. Comparison between observed and predicted water temperature, salinity, NO3-, PO4-3, NH4+, Si, DO, and Chl-a concentrations at surface layers across the V1 to V4 monitoring stations in Ría de Vigo. Black dots represent observed values, while the grey line shows the modeled time series for the period March 2017 – May 2018. Statistical results (RMSE and r) are included, where ***, ** and * denote reliability levels of 99%, 95%, and 75%, respectively. Figure S19. Comparison between observed and predicted water temperature, salinity, NO3-, PO4-3, NH4+, Si, DO, and Chl-a concentrations at bottom layers across the V1 to V4 monitoring stations in Ría de Vigo. Black dots represent observed values, while the grey line shows the modeled time series for the period March 2017 – May 2018. Statistical results (RMSE and r) are included, where ***, ** and * denote reliability levels of 99%, 95%, and 75%, respectively. Figure S20. Summary of the rRMSE metric at stations of Ría de Pontevedra and Ría de Vigo. Colored bars represent different depth layers: blue (surface), orange (0–5 m), yellow (5–10 m), purple (10–15 m), and green (bottom). The dotted line indicates rRMSE acceptance. Asterisks denote model reliability levels: *** for > 99%, ** for > 95%, and * for > 75%. Figure S21. Summary of the CF metric at stations of Ría de Pontevedra and Ría de Vigo. Colored bars represent different depth layers: blue (surface), orange (0–5 m), yellow (5–10 m), purple (10–15 m), and green (bottom). Solid and dotted lines indicate CF criteria: CF < 1 (very good) and CF between 1 and 2 (good). Figure S22. Summary of the pBIAS metric at stations of Ría de Pontevedra and Ría de Vigo. Colored bars represent different depth layers: blue (surface), orange (0–5 m), yellow (5–10 m), purple (10–15 m), and green (bottom). Solid, dotted and dash lines indicate |pBias| classification: |pBias| <10% (excellent), values between 10 and 20 (very good), between 20 to 40 (good).
Author Contributions
Conceptualization, Adrián Castro-Olivares, Marisela Des, Maite deCastro and Moncho Gómez-Gesteira; Data curation, Adrián Castro-Olivares, Marisela Des and Moncho Gómez-Gesteira; Formal analysis, Adrián Castro-Olivares, Marisela Des, Maite deCastro and Moncho Gómez-Gesteira; Funding acquisition, Marisela Des, Maite deCastro and Moncho Gómez-Gesteira; Investigation, Adrián Castro-Olivares; Methodology, Adrián Castro-Olivares, Marisela Des, Maite deCastro and Moncho Gómez-Gesteira; Project administration, Marisela Des, Maite deCastro and Moncho Gómez-Gesteira; Resources, Maite deCastro, João Miguel Días and Moncho Gómez-Gesteira; Software, Adrián Castro-Olivares, Marisela Des, Humberto Pereira, Ana Picado and Moncho Gómez-Gesteira; Supervision, Marisela Des, Maite deCastro and Moncho Gómez-Gesteira; Validation, Adrián Castro-Olivares, Marisela Des, Maite deCastro and Moncho Gómez-Gesteira; Visualization, Adrián Castro-Olivares and Marisela Des; Writing – original draft, Adrián Castro-Olivares, Marisela Des, Maite deCastro and Moncho Gómez-Gesteira; Writing – review & editing, Adrián Castro-Olivares, Marisela Des, Maite deCastro and Moncho Gómez-Gesteira.
Funding
M.Des acknowledges support from Xunta de Galicia through postdoctoral grant ED481D-2024-018. This study was partially funded by the Xunta de Galicia, Consellería de Cultura, Educación e Universidade, under Project ED431C 2021/44 “Programa de Consolidación e Restructuración de Unidades de Investigación Competitivas”; by the project “Resiliencia de bivalvos comerciales frente al cambio climático (RECOBI, TED2021-129524B-I00)” funded by the Spanish Ministerio de Ciencia e Innovación with funding from European Union NextGenerationEU; by the “Neutralidad climática: papel del Carbono Azul en la costa de Portugal y Galicia (CAPTA, 0062_CAPTA_1_E)” project, funded by the European Union Interreg Europe programm ERDF-(POCTEP); by the project “Las Rías Baixas (NO sistema de afloramiento ibérico) como zonas experimentales para estudiar el impacto de la acidificación del medio marino en ecosistemas costeros (ACID, Oriented Research Projects grant number, PID2021-127092OB-I00)” co-funded by the Spanish Ministry of Science, Innovation and Universities and the European Structural Funds (FSE and FEDER); and by the “Programa de ciencias mariñas-Plan complementario de i+d+i. Next Generation: (Programa de Ciencias Mariñas de Galicia). CienciasMariñas-MRR C286”. This study is part of the Marine Science program (ThinkInAzul) supported by Ministerio de Ciencia e Innovación and Xunta de Galicia with funding from European Union NextGenerationEU (PRTR-C17·I1) and European Maritime and Fisheries Fund.
Institutional Review Board Statement
This study does not require ethical approval.
Informed Consent Statement
Not applicable.
Data Availability Statement
Data will be fully available upon request.
Acknowledgments
The authors thank the Instituto Tecnolóxico para o Control do Medio Mariño de Galicia (INTECMAR) for collecting and providing data on inorganic nutrients, fluorescence, dissolved oxygen, salinity, and water temperature. Appreciation is also due to the Hype Web portal for river discharge data; the General Fishing Secretary, the Spanish Navy Hydrographical Institute and General Bathymetry Chart of the Oceans for bathymetry data; the Copernicus Marine Service for IBI data; and the European Centre for Medium-Range Weather Forecasts for Era5 data.
Conflicts of Interest
One of the guest editors of this Special Issue, Ana Picado, is a co-author of this paper. To ensure impartiality and maintain the integrity of the editorial process, Ana Picado was excluded from all decision-making processes related to this manuscript. The funders had no role in the design of the study; in the collection, analysis, or interpretation of data, in the writing of the manuscript, or in the decision to publish the results.
References
- Kennish, M.J. Environmental threats and environmental future of estuaries. Environ Conserv 2002, 29, 78–107. [Google Scholar] [CrossRef]
- Wołowicz, M.; Sokołowski, A.; Lasota, R. Estuaries—a biological point of view. Oceanol Hydrobiol Stud 2007, 36, 113–30. [Google Scholar] [CrossRef]
- Jackson, J.B. What was natural in the coastal oceans? Proc Natl Acad Sci 2001, 98, 5411–8. [Google Scholar] [CrossRef] [PubMed]
- Cloern, J.E.; Abreu, P.C.; Carstensen, J.; Chauvaud, L.; Elmgren, R.; Grall, J.; et al. Human activities and climate variability drive fast-paced change across the world’s estuarine–coastal ecosystems. Global Change Biol 2016, 22, 513–29. [Google Scholar] [CrossRef]
- Solomon, S.; Qin, D.; Manning, M.; Alley, R.B.; Berntsen, T.; Bindoff, N.L.; et al. Technical summary. Climate Change 2007: The Physical Science Basis. Contribution of Working Group I to the Fourth Assessment Report of the Intergovernmental Panel on Climate Change. 2007. [Google Scholar] [CrossRef]
- Jennerjahn, T.C.; Mitchell, S.B. Pressures, stresses, shocks and trends in estuarine ecosystems–An introduction and synthesis. Estuar Coast Shelf Sci 2013, 130, 1–8. [Google Scholar] [CrossRef]
- Hoegh-Guldberg, O.; Poloczanska, E.S. The effect of climate change across ocean regions. Front Mar Sci 2017, 4, 361. [Google Scholar] [CrossRef]
- Ecosystem collapse and climate change; Canadell, J.G., Jackson, R.B., Eds.; Springer: Cham, Switzerland, 2021. [Google Scholar] [CrossRef]
- Des, M.; Fernández-Nóvoa, D.; DeCastro, M.; Gómez-Gesteira, J.L.; Sousa, M.C.; Gómez-Gesteira, M. Modeling salinity drop in estuarine areas under extreme precipitation events within a context of climate change: effect on bivalve mortality in Galician Rías Baixas. Sci Total Environ 2021, 790, 148147. [Google Scholar] [CrossRef]
- Castro-Olivares, A.; Des, M.; Olabarria, C.; DeCastro, M.; Vázquez, E.; Sousa, M.C.; Gómez-Gesteira, M. Does global warming threaten small-scale bivalve fisheries in NW Spain? Mar Environ Res 2022, 180, 105707. [Google Scholar] [CrossRef]
- Álvarez-Salgado, X.A.; Gago, J.; Míguez, B.M.; Gilcoto, M.; Pérez, F.F. Surface waters of the NW Iberian margin: Upwelling on the shelf versus outwelling of upwelled waters from the Rías Baixas. Estuar Coast Shelf Sci 2000, 51, 821–37. [Google Scholar] [CrossRef]
- Labarta, U.; Fernández-Reiriz, M.J. The Galician mussel industry: Innovation and changes in the last forty years. Ocean Coast Manag 2019, 167, 208–18. [Google Scholar] [CrossRef]
- Pesca de galicia. Available online: http://www.pescadegalicia.gal (accessed on 29 March 2024).
- FAO. FishStat: Global aquaculture production 1950-2022. 2024. Available online: www.fao.org/fishery/en/statistics/software/fishstatj (accessed on 29 March 2024).
- Román, M.; Román, S.; Vázquez, E.; Troncoso, J.; Olabarria, C. Heatwaves during low tide are critical for the physiological performance of intertidal macroalgae under global warming scenarios. Sci Rep 2020, 10, 19530. [Google Scholar] [CrossRef] [PubMed]
- Des, M.; Gómez-Gesteira, M.; DeCastro, M.; Gómez-Gesteira, L.; Sousa, M.C. How can ocean warming at the NW Iberian Peninsula affect mussel aquaculture? Sci Total Environ 2020, 709, 136117. [Google Scholar] [CrossRef]
- Des, M.; Martínez, B.; DeCastro, M.; Viejo, R.M.; Sousa, M.C.; Gómez-Gesteira, M. The impact of climate change on the geographical distribution of habitat-forming macroalgae in the Rías Baixas. Mar Environ Res 2023, 193, 106884. [Google Scholar] [CrossRef] [PubMed]
- Olabarria, C.; Gestoso, I.; Lima, F. P.; Vázquez, E.; Comeau, L. A.; Gomes, F.; Seabra, R.; Babarro, J. M. F. Response of two mytilids to a heatwave: the complex interplay of physiology, behaviour and ecological interactions. PLoS ONE. 2016, 11. [Google Scholar] [CrossRef] [PubMed]
- Domínguez, R.; Olabarria, C.; Woodin, S. A.; Wethey, D. S.; Peteiro, L. G.; Macho, G.; Vázquez, E. Contrasting responsiveness of four ecologically and economically important bivalves to simulated heat waves. Mar Environ Res. 2021, 164, 105229. [Google Scholar] [CrossRef]
- Vázquez, E.; Woodin, S. A.; Wethey, D. S.; Peteiro, L. G.; Olabarria, C. Reproduction under stress: acute effect of low salinities and heat waves on reproductive cycle of four ecologically and commercially important bivalves. Front Mar Sci. 2021, 8, 685282. [Google Scholar] [CrossRef]
- Román, M.; Gilbert, F.; Viejo, R. M.; Román, S.; Troncoso, J. S.; Vázquez, E.; Olabarria, C. Are clam-seagrass interactions affected by heatwaves during emersion? Mar Environ Res. 2023, 186, 105906. [Google Scholar] [CrossRef]
- Detoni, A. M. S.; Navarro, G.; Padín, X. A.; Ramirez-Romero, E.; Zoffoli, M. L.; Pazos, Y.; Caballero, I. Potentially toxigenic phytoplankton patterns in the northwestern Iberian Peninsula. Front Mar Sci. 2024, 11, 1330090. [Google Scholar] [CrossRef]
- Rubio, B.; López-Pérez, Á. E.; León, I. Impact of sediment mobilization on trace elements release in Galician Rías (NW Iberian Peninsula): insights into aquaculture. Environ Monit Assess. 2024, 196, 1–19. [Google Scholar] [CrossRef]
- Stevens, A. M.; Gobler, C. J. Interactive effects of acidification, hypoxia, and thermal stress on growth, respiration, and survival of four North Atlantic bivalves. Mar Ecol Prog Ser. 2018, 604, 143–61. [Google Scholar] [CrossRef]
- Coelho, C.; Silva, R.; Veloso-Gomes, F.; Taveira-Pinto, F. Potential effects of climate change on northwest Portuguese coastal zones. ICES J Mar Sci. 2009, 66, 1497–1507. [Google Scholar] [CrossRef]
- Iglesias, I.; Bio, A.; Melo, W.; Avilez-Valente, P.; Pinho, J.; Cruz, M.; Veloso-Gomes, F. Hydrodynamic model ensembles for climate change projections in estuarine regions. Water. 2022, 14. [Google Scholar] [CrossRef]
- Bastos, L.; Bio, A.; Iglesias, I. The importance of marine observatories and of RAIA in particular. Front Mar Sci. 2016, 3, 140. [Google Scholar] [CrossRef]
- Teng, J.; Jakeman, A. J.; Vaze, J.; Croke, B. F.; Dutta, D.; Kim, S. J. E. Flood inundation modelling: a review of methods, recent advances and uncertainty analysis. Environ Model Softw. 2017, 90, 201–16. [Google Scholar] [CrossRef]
- Iglesias, I.; Venâncio, S.; Pinho, J. L.; Avilez-Valente, P.; Vieira, J. M. P. Two models solutions for the Douro estuary: flood risk assessment and breakwater effects. Estuaries Coasts. 2019, 42, 348–64. [Google Scholar] [CrossRef]
- Xu, C.; Zhang, J.; Bi, X.; Xu, Z.; He, Y.; Gin, K. Y. H. Developing an integrated 3D-hydrodynamic and emerging contaminant model for assessing water quality in a Yangtze Estuary reservoir. Chemosphere. 2017, 188, 218–30. [Google Scholar] [CrossRef]
- Huang, W.; Ma, W.; Liu, X.; Peng, W.; Zhang, J. Numerical study of hydrodynamics and water quality in Qinhuangdao coastal waters, China: implication for pollutant loadings management. Environ Model Assess. 2021, 26, 63–76. [Google Scholar] [CrossRef]
- Xiong, J.; Zheng, Y.; Zhang, J.; Quan, F.; Lu, H.; Zeng, H. Impact of climate change on coastal water quality and its interaction with pollution prevention efforts. J Environ Manag. 2023, 325, 116557. [Google Scholar] [CrossRef]
- Chen, Q. , Mynett, A.E. Modelling algal blooms in the Dutch coastal waters by integrated numerical and fuzzy cellular automata approaches. Ecol Model. 2006, 199, 73–81. [Google Scholar] [CrossRef]
- Troost, T.A.; De Kluijver, A.; Los, F.J. Evaluation of eutrophication variables and thresholds in the Dutch North Sea in a historical context—a model analysis. J Mar Syst. 2014, 134, 45–56. [Google Scholar] [CrossRef]
- Vaz, L.; Frankenbach, S.; Serôdio, J.; Dias, J.M. New insights about the primary production dependence on abiotic factors: Ria de Aveiro case study. Ecol Indic. 2019, 106, 105555. [Google Scholar] [CrossRef]
- Picado, A.; Mendes, J.; Ruela, R.; Pinheiro, J.; Dias, J.M. Physico-chemical characterization of two Portuguese coastal systems: Ria de Alvor and Mira estuary. J Mar Sci Eng. 2020, 8. [Google Scholar] [CrossRef]
- Picado, A.; Pereira, H.; Vaz, N.; Dias, J.M. Assessing present and future ecological status of Ria de Aveiro: a modeling study. J Mar Sci Eng. 2024, 12. [Google Scholar] [CrossRef]
- Pereira, H.; Picado, A.; Sousa, M.C.; Brito, A.C.; Biguino, B.; Carvalho, D.; Dias, J.M. Effects of climate change on aquaculture site selection at a temperate estuarine system. Sci Total Environ. 2023, 888, 164250. [Google Scholar] [CrossRef]
- Taboada, J.J.; Prego, R.; Ruiz-Villarreal, M.; Gómez-Gesteira, M.; Montero, P.; Santos, A.P.; Pérez-Villar, V. Evaluation of the seasonal variations in the residual circulation in the Ría of Vigo (NW Spain) by means of a 3D baroclinic model. Estuar Coast Shelf Sci. 1998, 47, 661–670. [Google Scholar] [CrossRef]
- Carballo, R.; Iglesias, G.; Castro, A. Residual circulation in the Ría de Muros (NW Spain): a 3D numerical model study. J Mar Syst. 2009, 75(1-2), 116–130. [Google Scholar] [CrossRef]
- Iglesias, G.; Carballo, R. Seasonality of the circulation in the Ría de Muros (NW Spain). J Mar Syst. 2009, 78, 94–108. [Google Scholar] [CrossRef]
- Sousa, M.C.; Vaz, N.; Alvarez, I.; Dias, J.M. Effect of Minho estuarine plume on Rias Baixas: numerical modeling approach. J Coast Res. 2013, (65), 2059–2064. [Google Scholar] [CrossRef]
- Des, M.; Gómez-Gesteira, J.L.; Decastro, M.; Iglesias, D.; Sousa, M.C.; ElSerafy, G.; Gómez-Gesteira, M. Historical and future naturalization of Magallana gigas in the Galician estuaries (NW Spain). Aquaculture. 2023, 569, 739843. [Google Scholar] [CrossRef]
- Prego, R. General aspects of carbon biogeochemistry in the ria of Vigo, northwestern Spain. Geochim Cosmochim Acta. 1993, 57, 2041–2052. [Google Scholar] [CrossRef]
- Álvarez-Salgado, X.A.; Rosón, G.; Pérez, F.F.; Figueiras, F.G.; Pazos, Y. Nitrogen cycling in an estuarine upwelling system, the Ria de Arousa (NW Spain). I. Short-time-scale patterns of hydrodynamic and biogeochemical circulation. Mar Ecol Prog Ser. 1996, 135, 259–273. [Google Scholar] [CrossRef]
- Torres-López, S.; Álvarez-Salgado, X.A.; Varela, R.A. Offshore export versus in situ fractionated mineralization: a 1-D model of the fate of the primary production of the Rías Baixas (Galicia, NW Spain). J Mar Syst. 2005, 54(1-4), 175–193. [Google Scholar] [CrossRef]
- Piedracoba, S.; Nieto-Cid, M.; Souto, C.; Gilcoto, M.; Rosón, G.; Álvarez-Salgado, X.A.; Figueiras, F.G. Physical–biological coupling in the coastal upwelling system of the Ría de Vigo (NW Spain). I: In situ approach. Mar Ecol Prog Ser. 2008, 353, 27–40. [Google Scholar] [CrossRef]
- Vaz, L.; Sousa, M.C.; Gómez-Gesteira, M.; Dias, J.M. A habitat suitability model for aquaculture site selection: Ria de Aveiro and Rias Baixas. Sci Total Environ. 2021, 801, 149687. [Google Scholar] [CrossRef]
- Fraga, F. Upwelling off the Galician coast, northwest Spain. Coastal Upwelling. 1981, 1, 176–182. [Google Scholar] [CrossRef]
- Evans, G.; Prego, R. Rias, estuaries and incised valleys: is a ria an estuary? Mar Geol. 2003, 196(3-4), 171–175. [Google Scholar] [CrossRef]
- García-Gil, S. A natural laboratory for shallow gas: the Rías Baixas (NW Spain). Geo-Mar Lett. 2003, 23, 215–229. [Google Scholar] [CrossRef]
- Cartelle, V.; García-Moreiras, I.; Martínez-Carreño, N.; Sobrino, C.M.; García-Gil, S. The role of antecedent morphology and changing sediment sources in the postglacial palaeogeographical evolution of an incised valley: The sedimentary record of the Ría de Arousa (NW Iberia). Glob Planet Change. 2022, 208, 103727. [Google Scholar] [CrossRef]
- Vilas, F.; Bernabeu, A. M.; Méndez, G. Sediment distribution pattern in the Rias Baixas (NW Spain): main facies and hydrodynamic dependence. J Mar Syst 2005, 54(1-4), 261–276. [Google Scholar] [CrossRef]
- Alvarez, I.; deCastro, M.; Gomez-Gesteira, M.; Prego, R. Inter- and intra-annual analysis of the salinity and temperature evolution in the Galician Rías Baixas–ocean boundary (northwest Spain). Journal of Geophysical Research: Oceans. 2005, 110(C4). [Google Scholar] [CrossRef]
- Álvarez-Salgado, X. A.; Rosón, G.; Pérez, F. F.; Pazos, Y. Hydrographic variability off the Rías Baixas (NW Spain) during the upwelling season. Journal of Geophysical Research: Oceans. 1993, 98, 14447–55. [Google Scholar] [CrossRef]
- Gómez-Gesteira, M.; Moreira, C.; Alvarez, I.; DeCastro, M. Ekman transport along the Galician coast (northwest Spain) calculated from forecasted winds. Journal of Geophysical Research: Oceans 2006, 111(C10). [Google Scholar] [CrossRef]
- Finenko, Z. Z. Production in plant populations. Marine Ecology. 1978, 4, 13–87. [Google Scholar]
- Ospina-Álvarez, N.; Prego, R.; Álvarez, I.; DeCastro, M.; Álvarez-Ossorio, M. T.; Pazos, Y.; Varela, M. Oceanographical patterns during a summer upwelling–downwelling event in the Northern Galician Rias: Comparison with the whole Ria system (NW of Iberian Peninsula). Continental Shelf Research. 2010, 30, 1362–72. [Google Scholar] [CrossRef]
- deCastro, M.; Gómez-Gesteira, M.; Alvarez, I.; Prego, R. Negative estuarine circulation in the Ria of Pontevedra (NW Spain). Estuarine, Coastal and Shelf Science. 2004, 60, 301–12. [Google Scholar] [CrossRef]
- Alvarez, I.; DeCastro, M.; Gomez-Gesteira, M.; Prego, R. Hydrographic behavior of the Galician Rias Baixas (NW Spain) under the spring intrusion of the Mino River. Journal of Marine Systems. 2006, 60(1-2), 144–52. [Google Scholar] [CrossRef]
- Des, M.; deCastro, M.; Sousa, M. C.; Dias, J. M.; Gómez-Gesteira, M. Hydrodynamics of river plume intrusion into an adjacent estuary: The Minho River and Ria de Vigo. Journal of Marine Systems. 2019, 189, 87–97. [Google Scholar] [CrossRef]
- deCastro, M.; Alvarez, I.; Varela, M.; Prego, R.; Gómez-Gesteira, M. Miño River dams discharge on neighbor Galician Rias Baixas (NW Iberian Peninsula): hydrological, chemical and biological changes in water column. Estuarine, Coastal and Shelf Science. 2006, 70, 52–62. [Google Scholar] [CrossRef]
- Castro, C. G.; Ríos, A. F. La Ría de Vigo: una aproximación integral al ecosistema marino de la Ría de Vigo, (Biogeoquímica de la Ría de Vigo: ciclo de las sales nutrientes; Trampa/sumidero de CO2), 2008; 85–111.
- Pérez, F. F.; Alvarezsalgado, X.; Rosón, G.; Ríos, A. F. Carbonic-calcium system, nutrients and total organic nitrogen in continental runoff to the Galician Rias Baixas, NW Spain. Oceanologica Acta. 1992, 15, 595–602. [Google Scholar]
- Doval, M. D.; López, A.; Madriñán, M. Temporal variation and trends of inorganic nutrients in the coastal upwelling of the NW Spain (Atlantic Galician rías). Journal of Sea Research. 2016, 108, 19–29. [Google Scholar] [CrossRef]
- Nogueira, E.; Pérez, F. F.; Ríos, A. F. Seasonal patterns and long-term trends in an estuarine upwelling ecosystem (Ría de Vigo, NW Spain). Estuarine, Coastal, and Shelf Science. 1997, 44, 285–300. [Google Scholar] [CrossRef]
- Figueiras, F. G.; Labarta, U.; Reiriz, M. F. Coastal upwelling, primary production and mussel growth in the Rías Baixas of Galicia. In Sustainable Increase of Marine Harvesting: Fundamental Mechanisms and New Concepts: Proceedings of the 1st Maricult Conference held in Trondheim, Norway, 25–28 June 2000; Springer Netherlands, 2002; pp. 121–31. [Google Scholar]
- Hansen, H. P.; Grasshoff, K. Automated chemical analysis. In: Methods of seawater analysis. 1983. p. 347-395.
- INTECMAR. Available online: http://www.intecmar.gal/Ctd/Default.aspx (accessed on 24 May 2023).
- Deltares. Available online: https://oss.deltares.nl/web/delft3d (accessed on 20 October 2022).
- GEBCO. Available online: https://www.gebco.net/ (accessed on 10 October 2023).
- Copernicus Marine Data Store. Available online: https://data.marine.copernicus.eu (accessed on 19 February 2022).
- Climate Copernicus. Available online: https://cds.climate.copernicus.eu (accessed on 20 March 2023).
- Meteogalicia. Available online: https://www.meteogalicia.gal (accessed on 1 February 2023).
- Confederación Hidrográfica del Miño-Sil. Available online: https://www.chminosil.es/es/ (accessed on 1 February 2023).
- Deltares. D-Water Quality Technical Reference Manual, 5.01 ed.; Deltares, 2024. [Google Scholar]
- Lønborg, C.; Martínez-García, S.; Teira, E.; Álvarez-Salgado, X. A. Bacterial carbon demand and growth efficiency in a coastal upwelling system. Aquat Microb Ecol. 2011, 63, 183–91. [Google Scholar] [CrossRef]
- Alonso-Pérez, F.; Castro, C. G. Benthic oxygen and nutrient fluxes in a coastal upwelling system (Ria de Vigo, NW Iberian Peninsula): seasonal trends and regulating factors. Mar Ecol Prog Ser. 2014, 511, 17–32. [Google Scholar] [CrossRef]
- Figueiras, F. G.; Miranda, A.; Riveiro, I.; Vergara, A. R.; Guisande, C. La Ría de Vigo: una aproximación integral al ecosistema marino de la Ría de Vigo, (El Plancton de la Ría de Vigo). 2008. pp: 111-152.
- McNichol, A. P.; Osborne, E. A.; Gagnon, A. R.; Fry, B.; Jones, G. A. TIC, TOC, DIC, DOC, PIC, POC—unique aspects in the preparation of oceanographic samples for 14C-AMS. Nucl Instrum Methods Phys Res B. 1994, 92(1-4), 162–5. [Google Scholar] [CrossRef]
- Munhoven, G. Mathematics of the total alkalinity–pH equation–pathway to robust and universal solution algorithms: the SolveSAPHE package v1.0.1. Geosci Model Dev. 2013, 6, 1367–88. [Google Scholar] [CrossRef]
- Zijl, F.; Laan, S. C.; Emmanouil, A.; van Kessel, T.; van Zelst, V. T.; Vilmin, L. M.; van Duren, L. A. Potential ecosystem effects of large upscaling of offshore wind in the North Sea. Report 11203731-004-ZKS-0015, Version 1.1, 22 April 2021. p. 96.
- Vieira, L. R.; Guilhermino, L.; Morgado, F. Zooplankton structure and dynamics in two estuaries from the Atlantic coast in relation to multi-stressors exposure. Estuar Coast Shelf Sci. 2015, 167, 347–67. [Google Scholar] [CrossRef]
- Vergara, J.; Prego, R. Estimación de los aportes fluviales de nitrato, fosfato y silicato hacia las rías gallegas. 1997.
- Gago, J.; Álvarez-Salgado, X. A.; Nieto-Cid, M.; Brea, S.; Piedracoba, S. Continental inputs of C, N, P and Si species to the Ría de Vigo (NW Spain). Estuar Coast Shelf Sci. 2005, 65(1-2), 74–82. [Google Scholar] [CrossRef]
- Allen, J. I.; Holt, J. T.; Blackford, J.; Proctor, R. Error quantification of a high-resolution coupled hydrodynamic-ecosystem coastal-ocean model: Part 2. Chlorophyll-a, nutrients and SPM. J Mar Syst. 2007, 68(3-4), 381–404. [Google Scholar] [CrossRef]
- Brito, A. C.; Pereira, H.; Picado, A.; Cruz, J.; Cereja, R.; Biguino, B.; Dias, J. M. Increased oyster aquaculture in the Sado Estuary (Portugal): How to ensure ecosystem sustainability? Sci Total Environ. 2023, 855, 158898. [Google Scholar] [CrossRef]
- Kaçıkoç, M.; Beyhan, M. Hydrodynamic and water quality modeling of Lake Eğirdir. CLEAN–Soil Air Water. 2014, 42, 1573–82. [Google Scholar] [CrossRef]
- OSPAR Commission. Report of the modelling workshop on eutrophication issues. 5–8 November 1996. Den Haag, The Netherlands. OSPAR Report.
- Maréchal, D.; Holman, I. P. Comparison of hydrologic simulations using regionalised and catchment-calibrated parameter sets for three catchments in England. 2004.
- Mendes, J.; Ruela, R.; Picado, A.; Pinheiro, J. P.; Ribeiro, A. S.; Pereira, H.; Dias, J. M. Modeling dynamic processes of Mondego estuary and Óbidos lagoon using Delft3D. J Mar Sci Eng. 2021, 9. [Google Scholar] [CrossRef]
- Shan, X.; Zhu, Z.; Ma, J.; Fu, D.; Song, Y.; Li, Q.; Zhao, H. Modeling nutrient flows from land to rivers and seas–A review and synthesis. Mar Environ Res. 2023, 186, 105928. [Google Scholar] [CrossRef] [PubMed]
- Gutiérrez-Barral, A.; Teira, E.; Díaz-Alonso, A.; Justel-Díez, M.; Kaal, J.; Fernández, E. Impact of wildfire ash on bacterioplankton abundance and community composition in a coastal embayment (Ría de Vigo, NW Spain). Mar Environ Res. 2024, 194, 106317. [Google Scholar] [CrossRef] [PubMed]
- Coombs, J. S.; Melack, J. M. Initial impacts of a wildfire on hydrology and suspended sediment and nutrient export in California chaparral watersheds. Hydrol Process. 2013, 27, 3842–51. [Google Scholar] [CrossRef]
- Morrison, K. D.; Kolden, C. A. Modeling the impacts of wildfire on runoff and pollutant transport from coastal watersheds to the nearshore environment. J Environ Manag. 2015, 151, 113–23. [Google Scholar] [CrossRef]
- Teixeira, I. G.; Arbones, B.; Froján, M.; Nieto-Cid, M.; Álvarez-Salgado, X. A.; Castro, C. G.; Figueiras, F. G. Response of phytoplankton to enhanced atmospheric and riverine nutrient inputs in a coastal upwelling embayment. Estuar Coast Shelf Sci. 2018, 210, 132–41. [Google Scholar] [CrossRef]
- Wagner, S.; Harvey, E.; Baetge, N.; McNair, H.; Arrington, E.; Stubbins, A. Investigating atmospheric inputs of dissolved black carbon to the Santa Barbara Channel during the Thomas Fire (California, USA). J Geophys Res Biogeosciences. 2021, 126. [Google Scholar] [CrossRef]
- Margalef, R.; Durán, M.; Saiz, F. El fitoplancton de la ría de Vigo de enero de 1953 a marzo de 1954. 1955.
- Cermeño, P.; Marañón, E.; Rodríguez, J.; Fernández, E. Large-sized phytoplankton sustain higher carbon-specific photosynthesis than smaller cells in a coastal eutrophic ecosystem. Mar Ecol Prog Ser. 2005, 297, 51–60. [Google Scholar] [CrossRef]
- Cermeño, P.; Marañón, E.; Pérez, V.; Serret, P.; Fernández, E.; Castro, C. G. Phytoplankton size structure and primary production in a highly dynamic coastal ecosystem (Ría de Vigo, NW-Spain): seasonal and short-time scale variability. Estuar Coast Shelf Sci. 2006, 67, 251–66. [Google Scholar] [CrossRef]
- Ospina-Álvarez, N.; Varela, M.; Doval, M. D.; Gómez-Gesteira, M.; Cervantes-Duarte, R.; Prego, R. Outside the paradigm of upwelling rias in NW Iberian Peninsula: Biogeochemical and phytoplankton patterns of a non-upwelling ria. Estuar Coast Shelf Sci. 2014, 138, 1–13. [Google Scholar] [CrossRef]
- Comesaña, A.; Fernández-Castro, B.; Chouciño, P.; Fernández, E.; Fuentes-Lema, A.; Gilcoto, M.; Mouriño-Carballido, B. Mixing and phytoplankton growth in an upwelling system. Front Mar Sci. 2021, 8, 712342. [Google Scholar] [CrossRef]
- Droop, M. R. The nutrient status of algal cells in continuous culture. J Mar Biol Assoc UK. 1974, 54, 825–55. [Google Scholar] [CrossRef]
- Malone, T. C.; Boynton, W.; Horton, T.; Stevenson, C. Nutrient loadings to surface waters: Chesapeake Bay case study. Keeping pace with science and engineering 1993, 8, 38. [Google Scholar]
- Broullón, E.; Franks, P. J.; Fernández Castro, B.; Gilcoto, M.; Fuentes-Lema, A.; Pérez-Lorenzo, M.; Mouriño-Carballido, B. Rapid phytoplankton response to wind forcing influences productivity in upwelling bays. Limnol Oceanogr Lett. 2023, 8(3), 529–37. [Google Scholar] [CrossRef]
- Paz, M. D. L.; Pérez, F. F.; Álvarez-Rodríguez, M.; Bode, A. Seasonal ventilation controls nitrous oxide emission in the NW Iberian upwelling. Prog Oceanogr. 2024, 103261. [Google Scholar] [CrossRef]
- Sousa, M. C.; Vaz, N.; Alvarez, I.; Gomez-Gesteira, M.; Dias, J. M. Modeling the Minho River plume intrusion into the rías Baixas (NW Iberian Peninsula). Cont Shelf Res. 2014, 85, 30–41. [Google Scholar] [CrossRef]
- Cerralbo, P.; Grifoll, M.; Espino, M.; López, J. Predictability of currents on a mesotidal estuary (Ría de Vigo, NW Iberia). Ocean Dyn. 2013, 63, 131–41. [Google Scholar] [CrossRef]
- Wang, H.; Chen, Q.; Hu, K.; La Peyre, M. K. A modeling study of the impacts of Mississippi River diversion and sea-level rise on water quality of a deltaic estuary. Estuaries Coasts. 2017, 40, 1028–54. [Google Scholar] [CrossRef]
- Vaz, L. Optimization of Estuarine Aquaculture Exploitation: Modelling Approach. PhD thesis, University of Aveiro, 2020; p. 235. [Google Scholar]
- Arhonditsis, G. B.; Brett, M. T. Evaluation of the current state of mechanistic aquatic biogeochemical modeling. Mar Ecol Prog Ser. 2004, 271, 13–26. [Google Scholar] [CrossRef]
- DSLLC. Dynamic Solutions LLC, 3-Dimensional Hydrodynamic and Water Quality Model of Lake Thunderbird, Oklahoma EFDC Water Quality Model Setup, Calibration and Load Allocation Tasks 1A, 1B, 1C and 1D (Draft). Technical Report Prepared by Dynamic Solutions, Knoxville, TN for Oklahoma Department Environmental Quality, Water Quality Division, Oklahoma City, OK; 2012.
- Dumbauld, B. R.; Ruesink, J. L.; Rumrill, S. S. The ecological role of bivalve shellfish aquaculture in the estuarine environment: a review with application to oyster and clam culture in West Coast (USA) estuaries. Aquaculture. 2009, 290(3‐4), 196–223. [Google Scholar] [CrossRef]
- Ferreira, J. G.; Corner, R. A.; Moore, H.; Bricker, S. B.; Rheault, R. Ecological carrying capacity for shellfish aquaculture—sustainability of naturally occurring filter-feeders and cultivated bivalves. J Shellfish Res. 2018, 37, 709–26. [Google Scholar] [CrossRef]
Figure 2.
Comparison of observed (dots) and modeled (grey line) water temperature and salinity at 0-5 m depth across stations in Ría de Muros from March 2017 – May 2018. Statistical metrics (RMSE and r) are provided, with reliability levels denoted by ***, ** and * for 99%, 95%, and 75%, respectively.
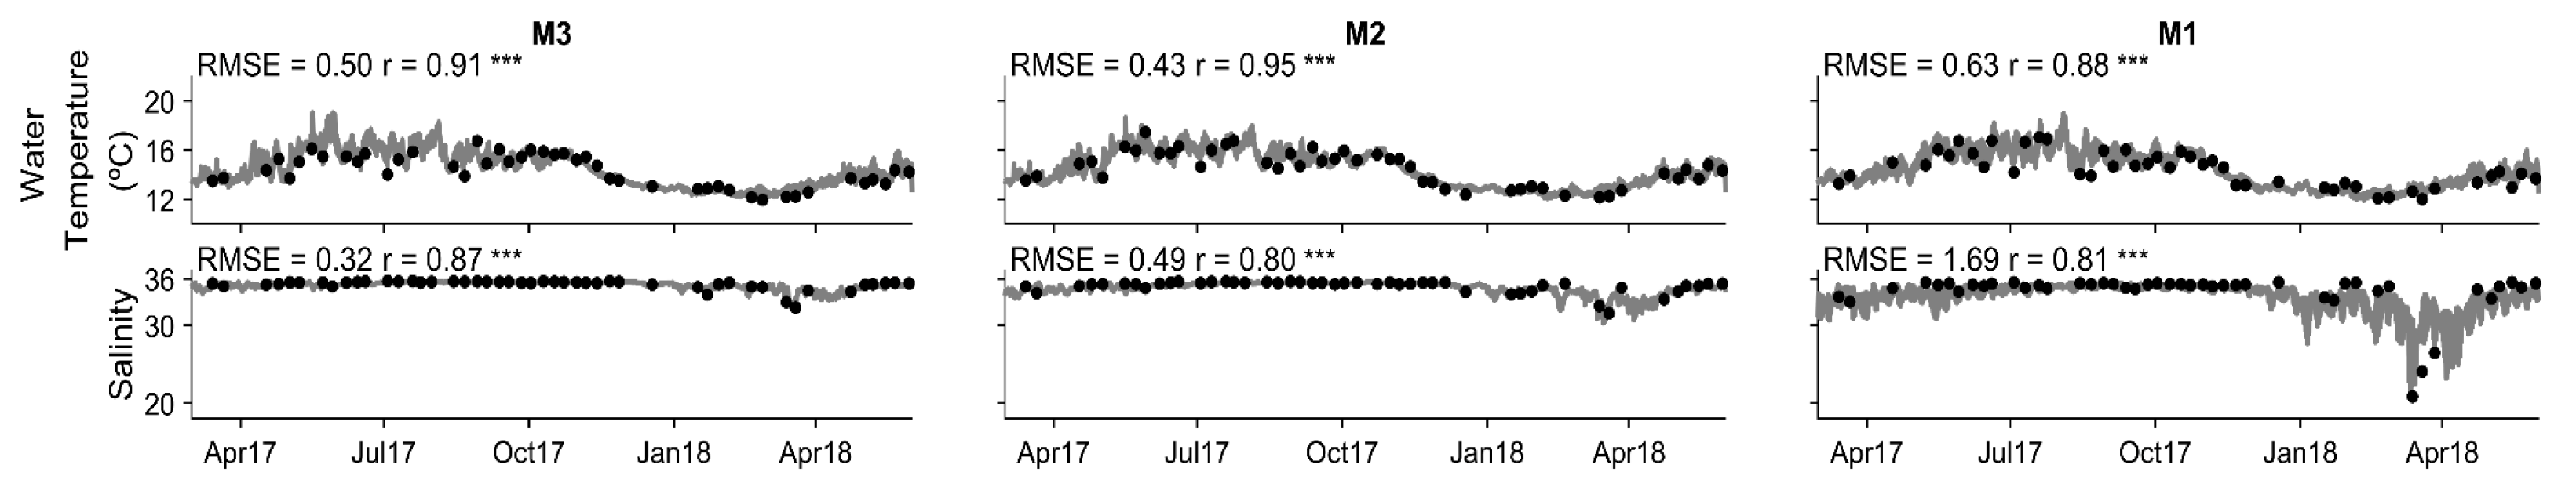
Figure 3.
Comparison of observed (dots) and modeled (grey line) water temperature and salinity at 0-5 m depth across stations in Ría de Arousa from March 2017 – May 2018. Statistical metrics (RMSE and r) are provided, with reliability levels denoted by ***, ** and * for 99%, 95%, and 75%, respectively.
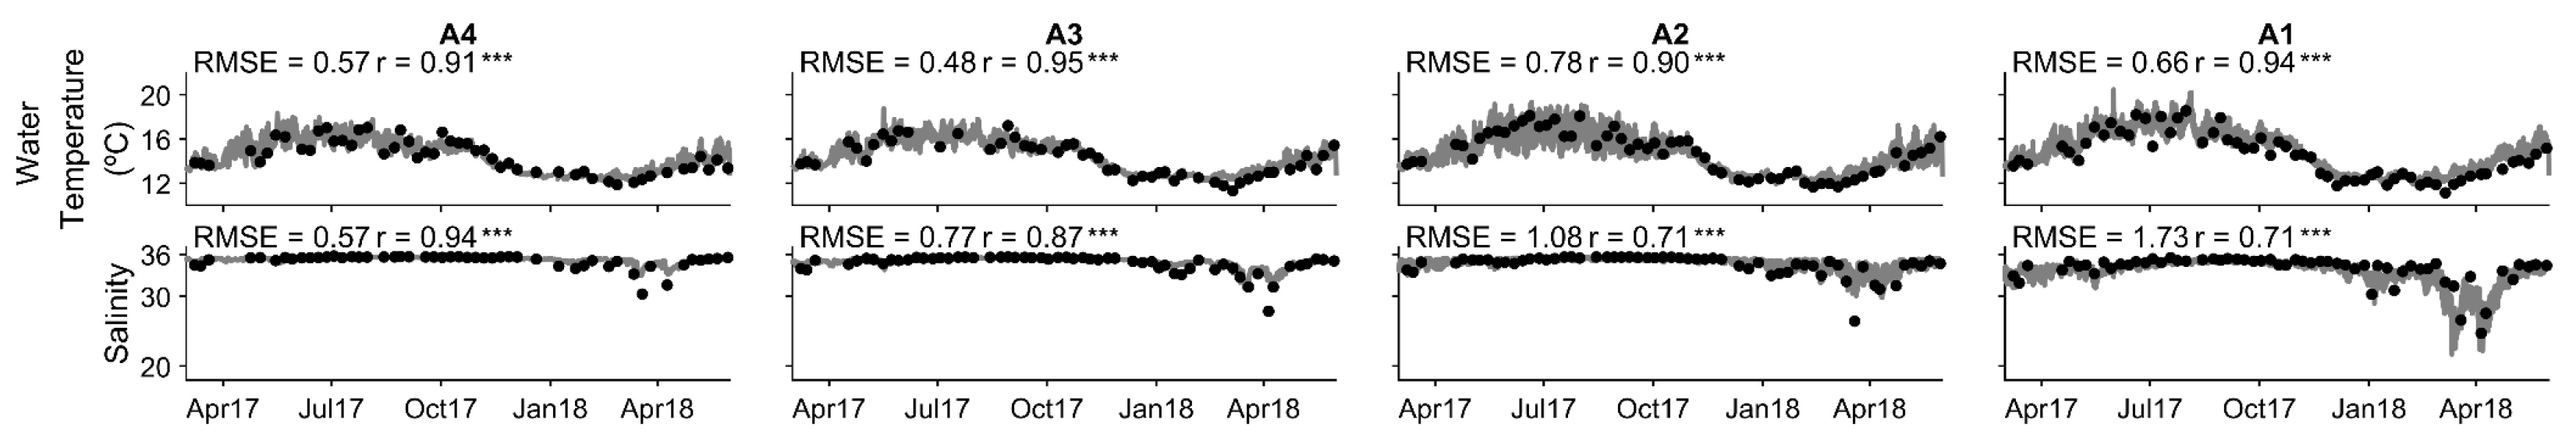
Figure 4.
Summary of the rRMSE metric for temperature and salinity at stations of Ría de Muros and Ría de Arousa. Colored bars represent different depth layers: blue (surface), orange (0–5 m), yellow (5–10 m), purple (10–15 m), and green (bottom). The dotted line indicates rRMSE acceptance. Asterisks denote model reliability levels: *** for > 99%, ** for > 95%, and * for > 75%.
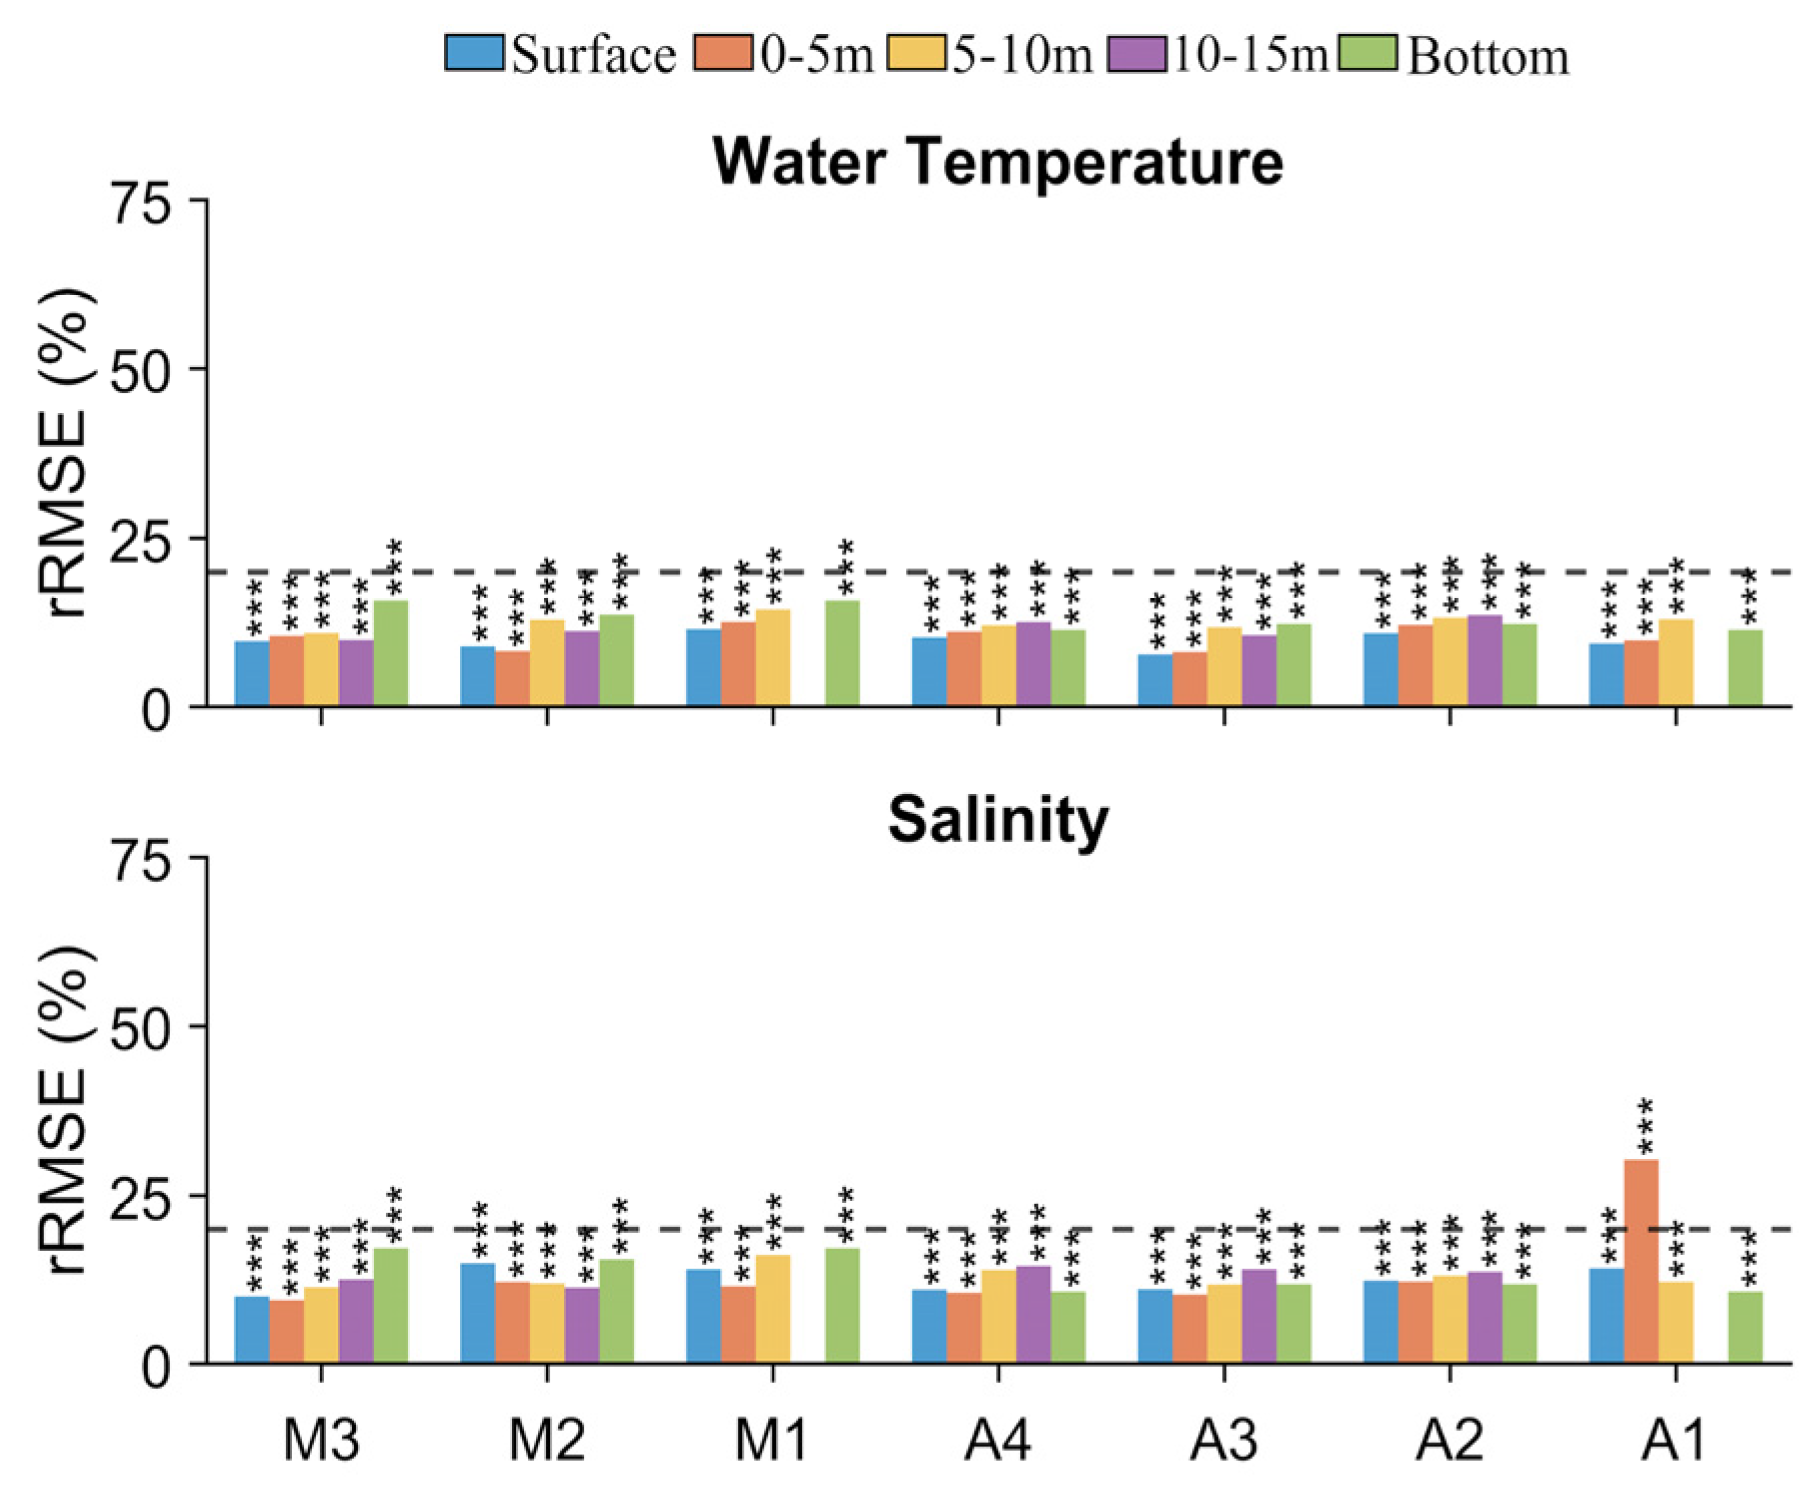
Figure 5.
Summary of the CF metric for temperature and salinity at stations of Ría de Muros and Ría de Arousa. Colored bars represent different depth layers: blue (surface), orange (0–5 m), yellow (5–10 m), purple (10–15 m), and green (bottom). Solid and dotted lines indicate CF criteria: CF < 1 (very good) and CF between 1 and 2 (good).
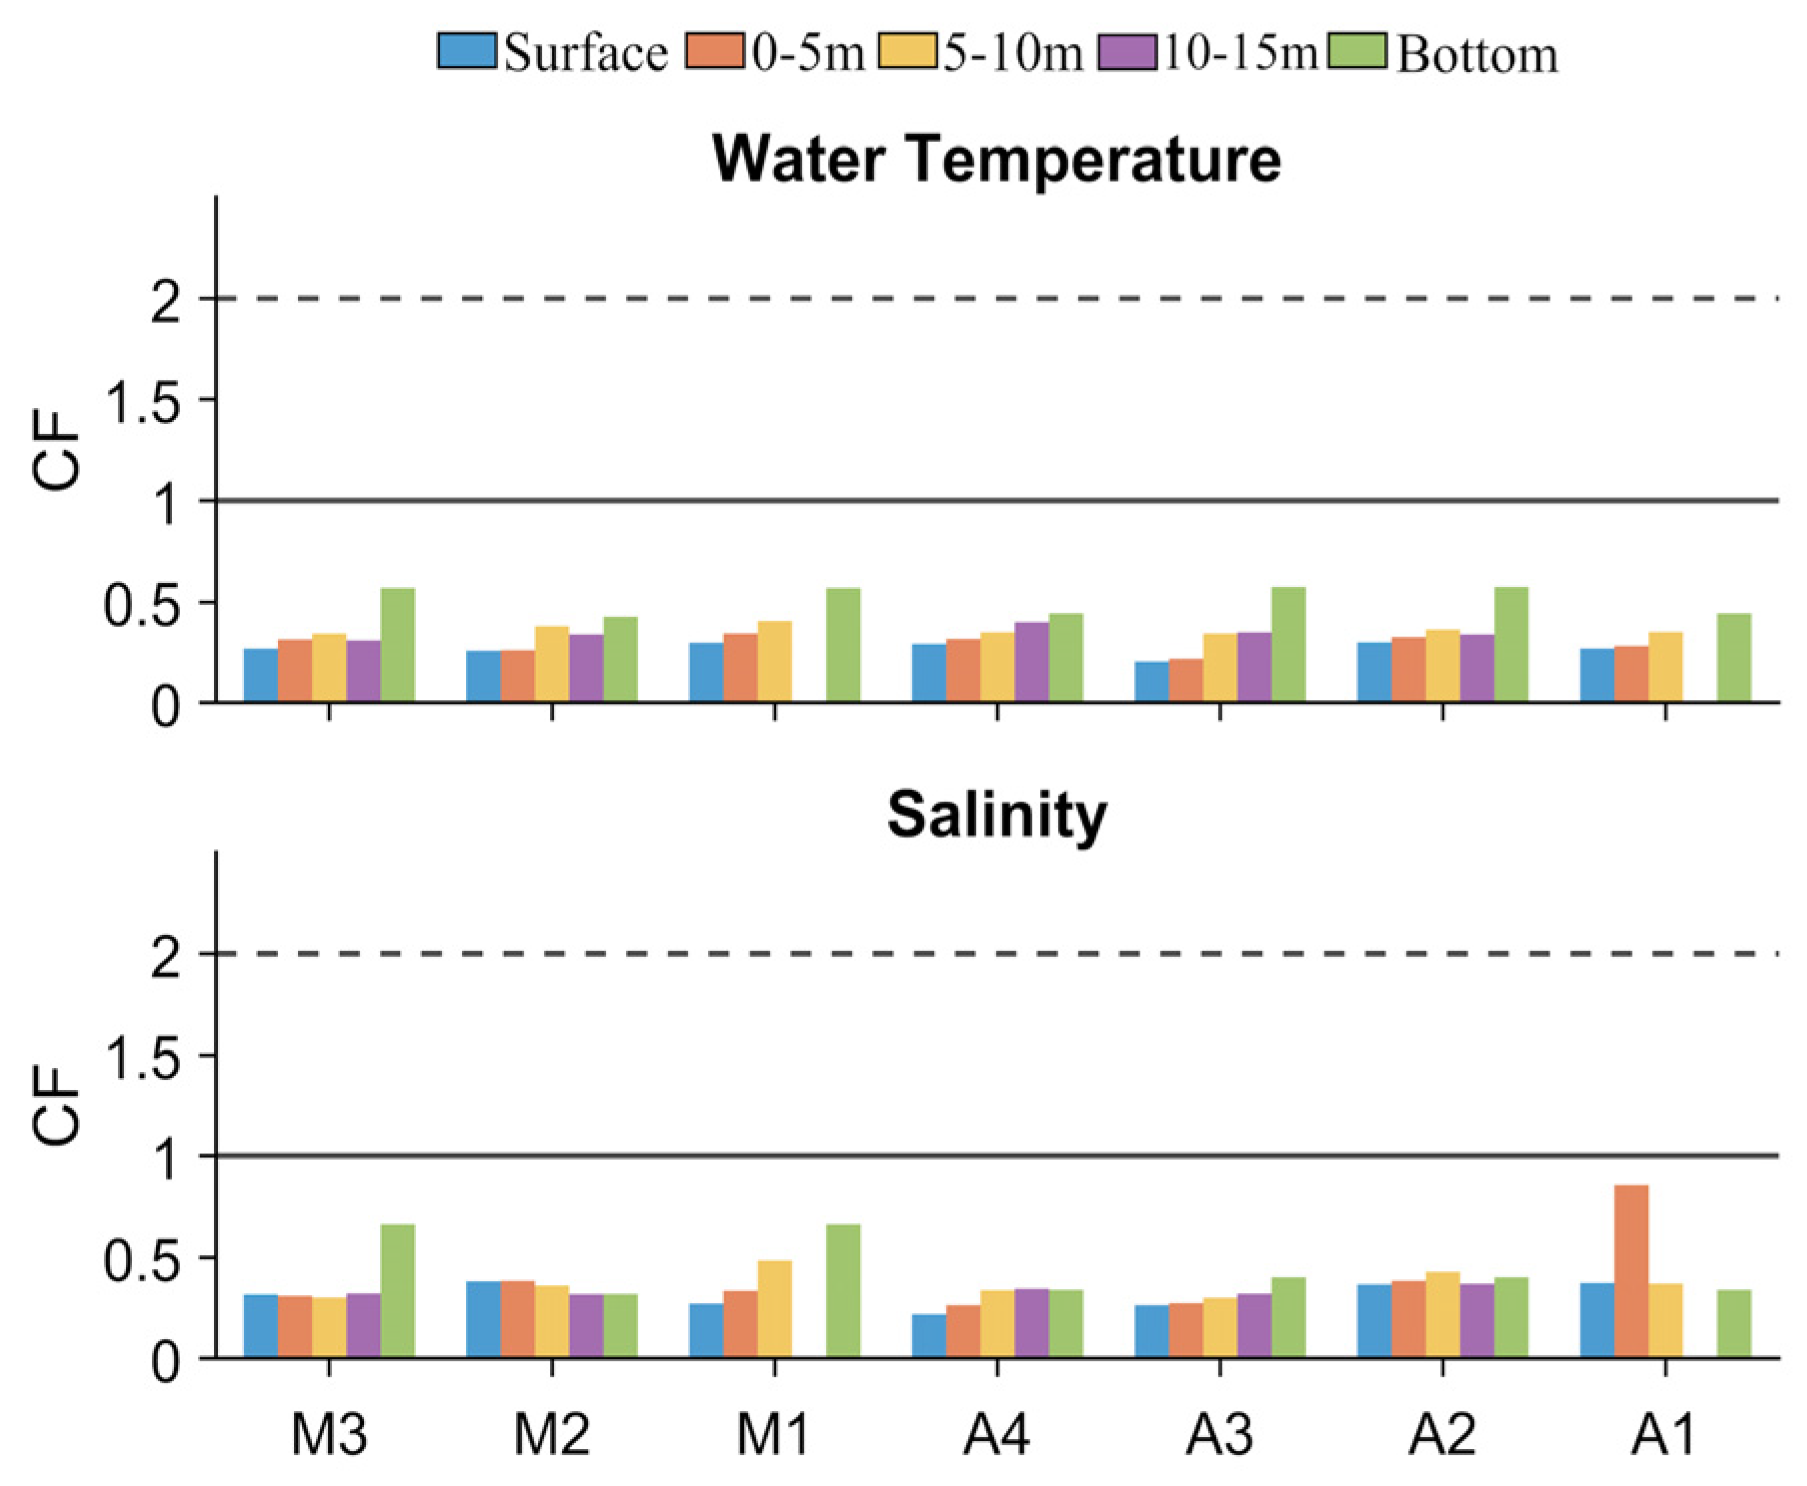
Figure 6.
Summary of the pBias metric for temperature and salinity at stations of Ría de Muros and Ría de Arousa. Colored bars represent different depth layers: blue (surface), orange (0–5 m), yellow (5–10 m), purple (10–15 m), and green (bottom). Solid line indicates |pBias| classification: |pBias| <10% (excellent).
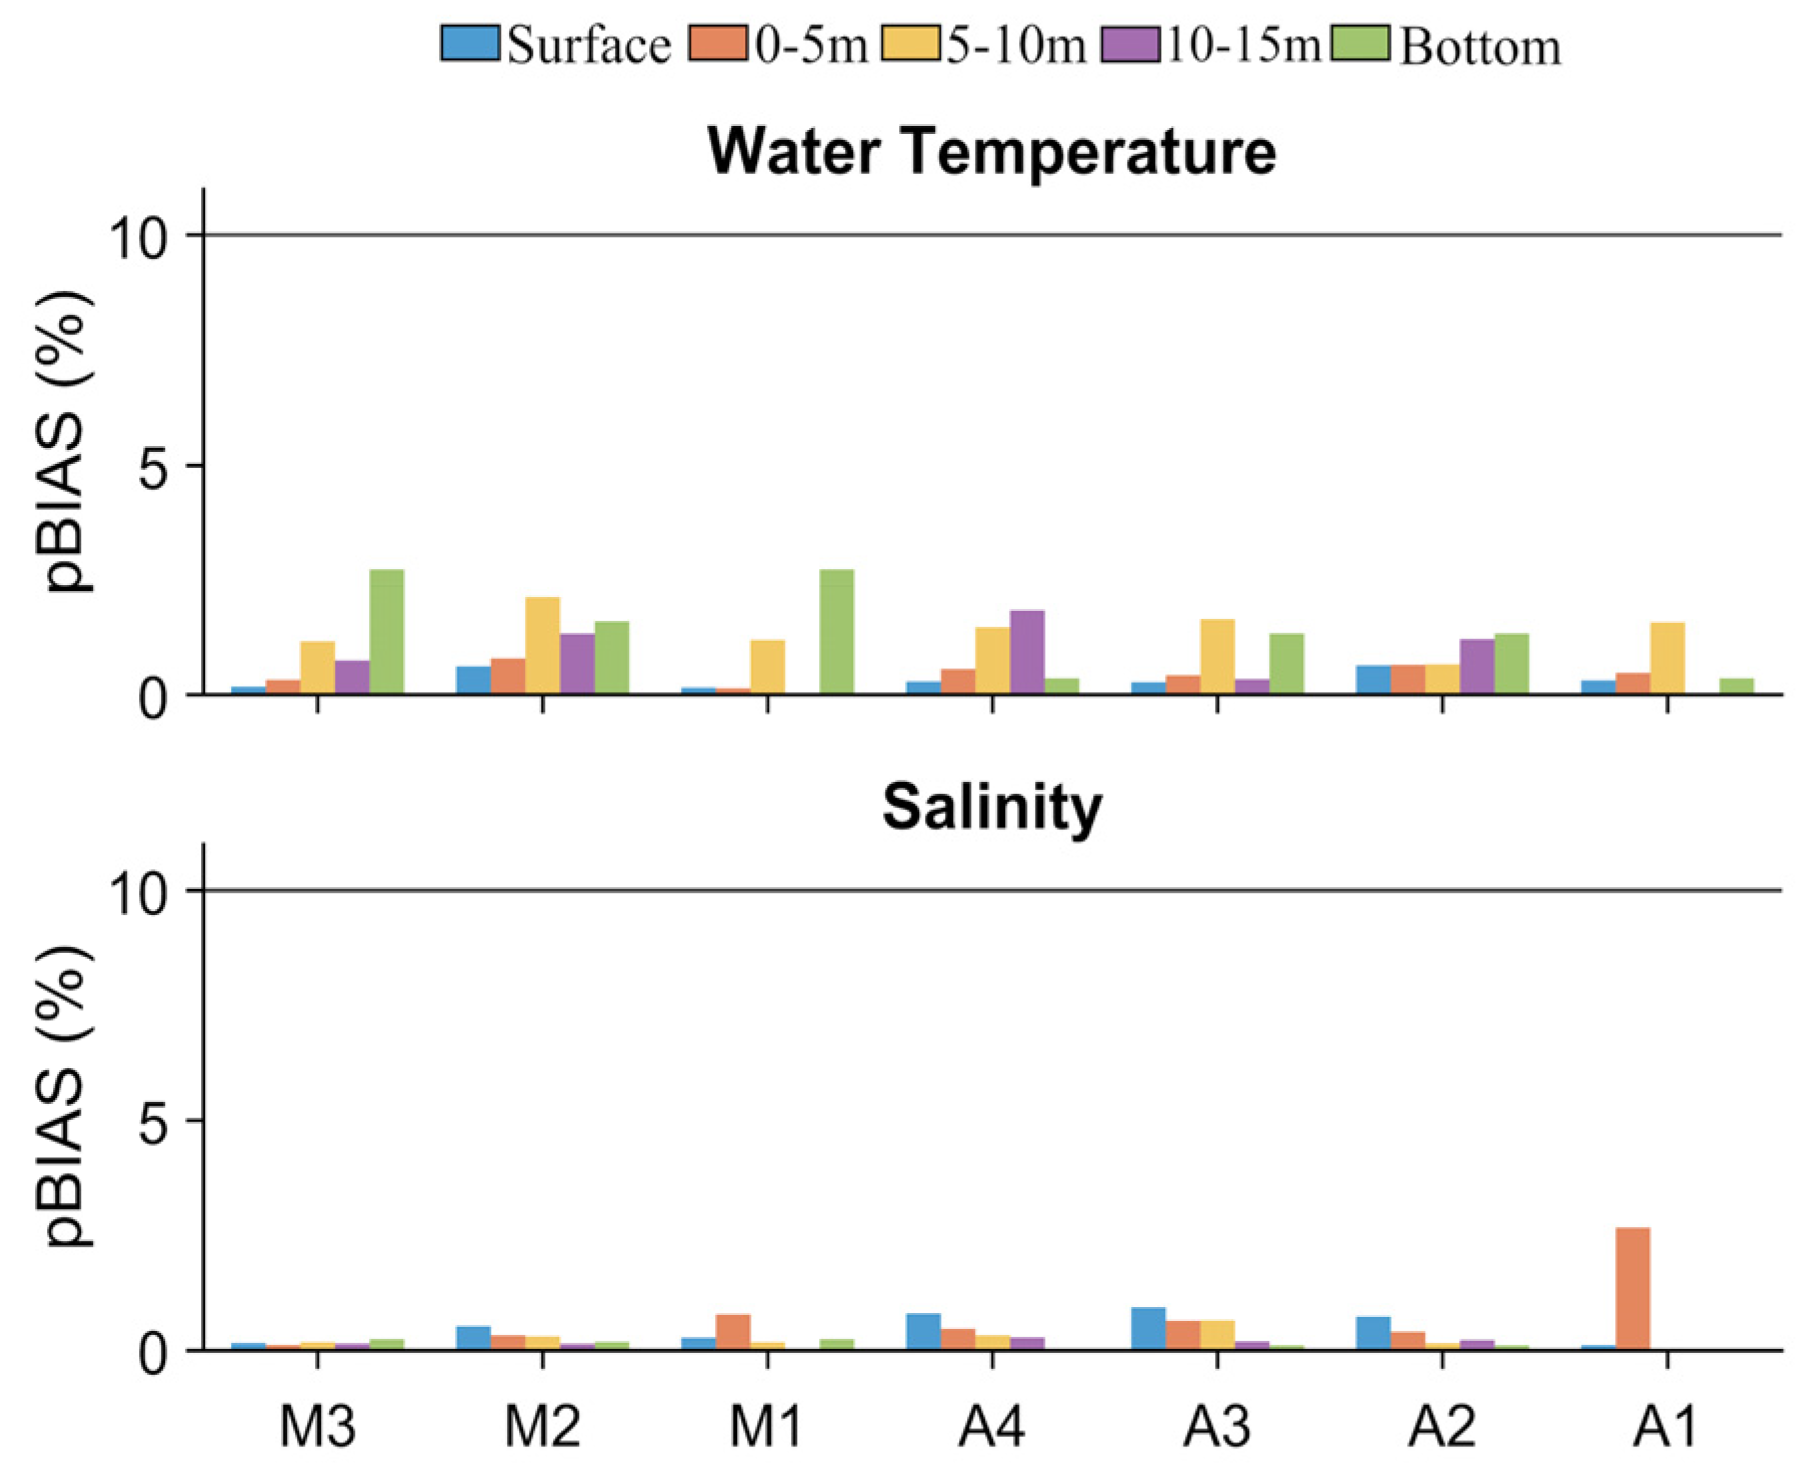
Figure 7.
Comparison of observed (dots) and modeled (grey line) NO3-, PO43-, NH4+, Si, DO and Chl-a concentrations at 0-5 m depth across stations in Ría de Muros from March 2017 – May 2018. Statistical metrics (RMSE and r) are provided, with reliability levels denoted by ***, ** and * for 99%, 95%, and 75%, respectively.
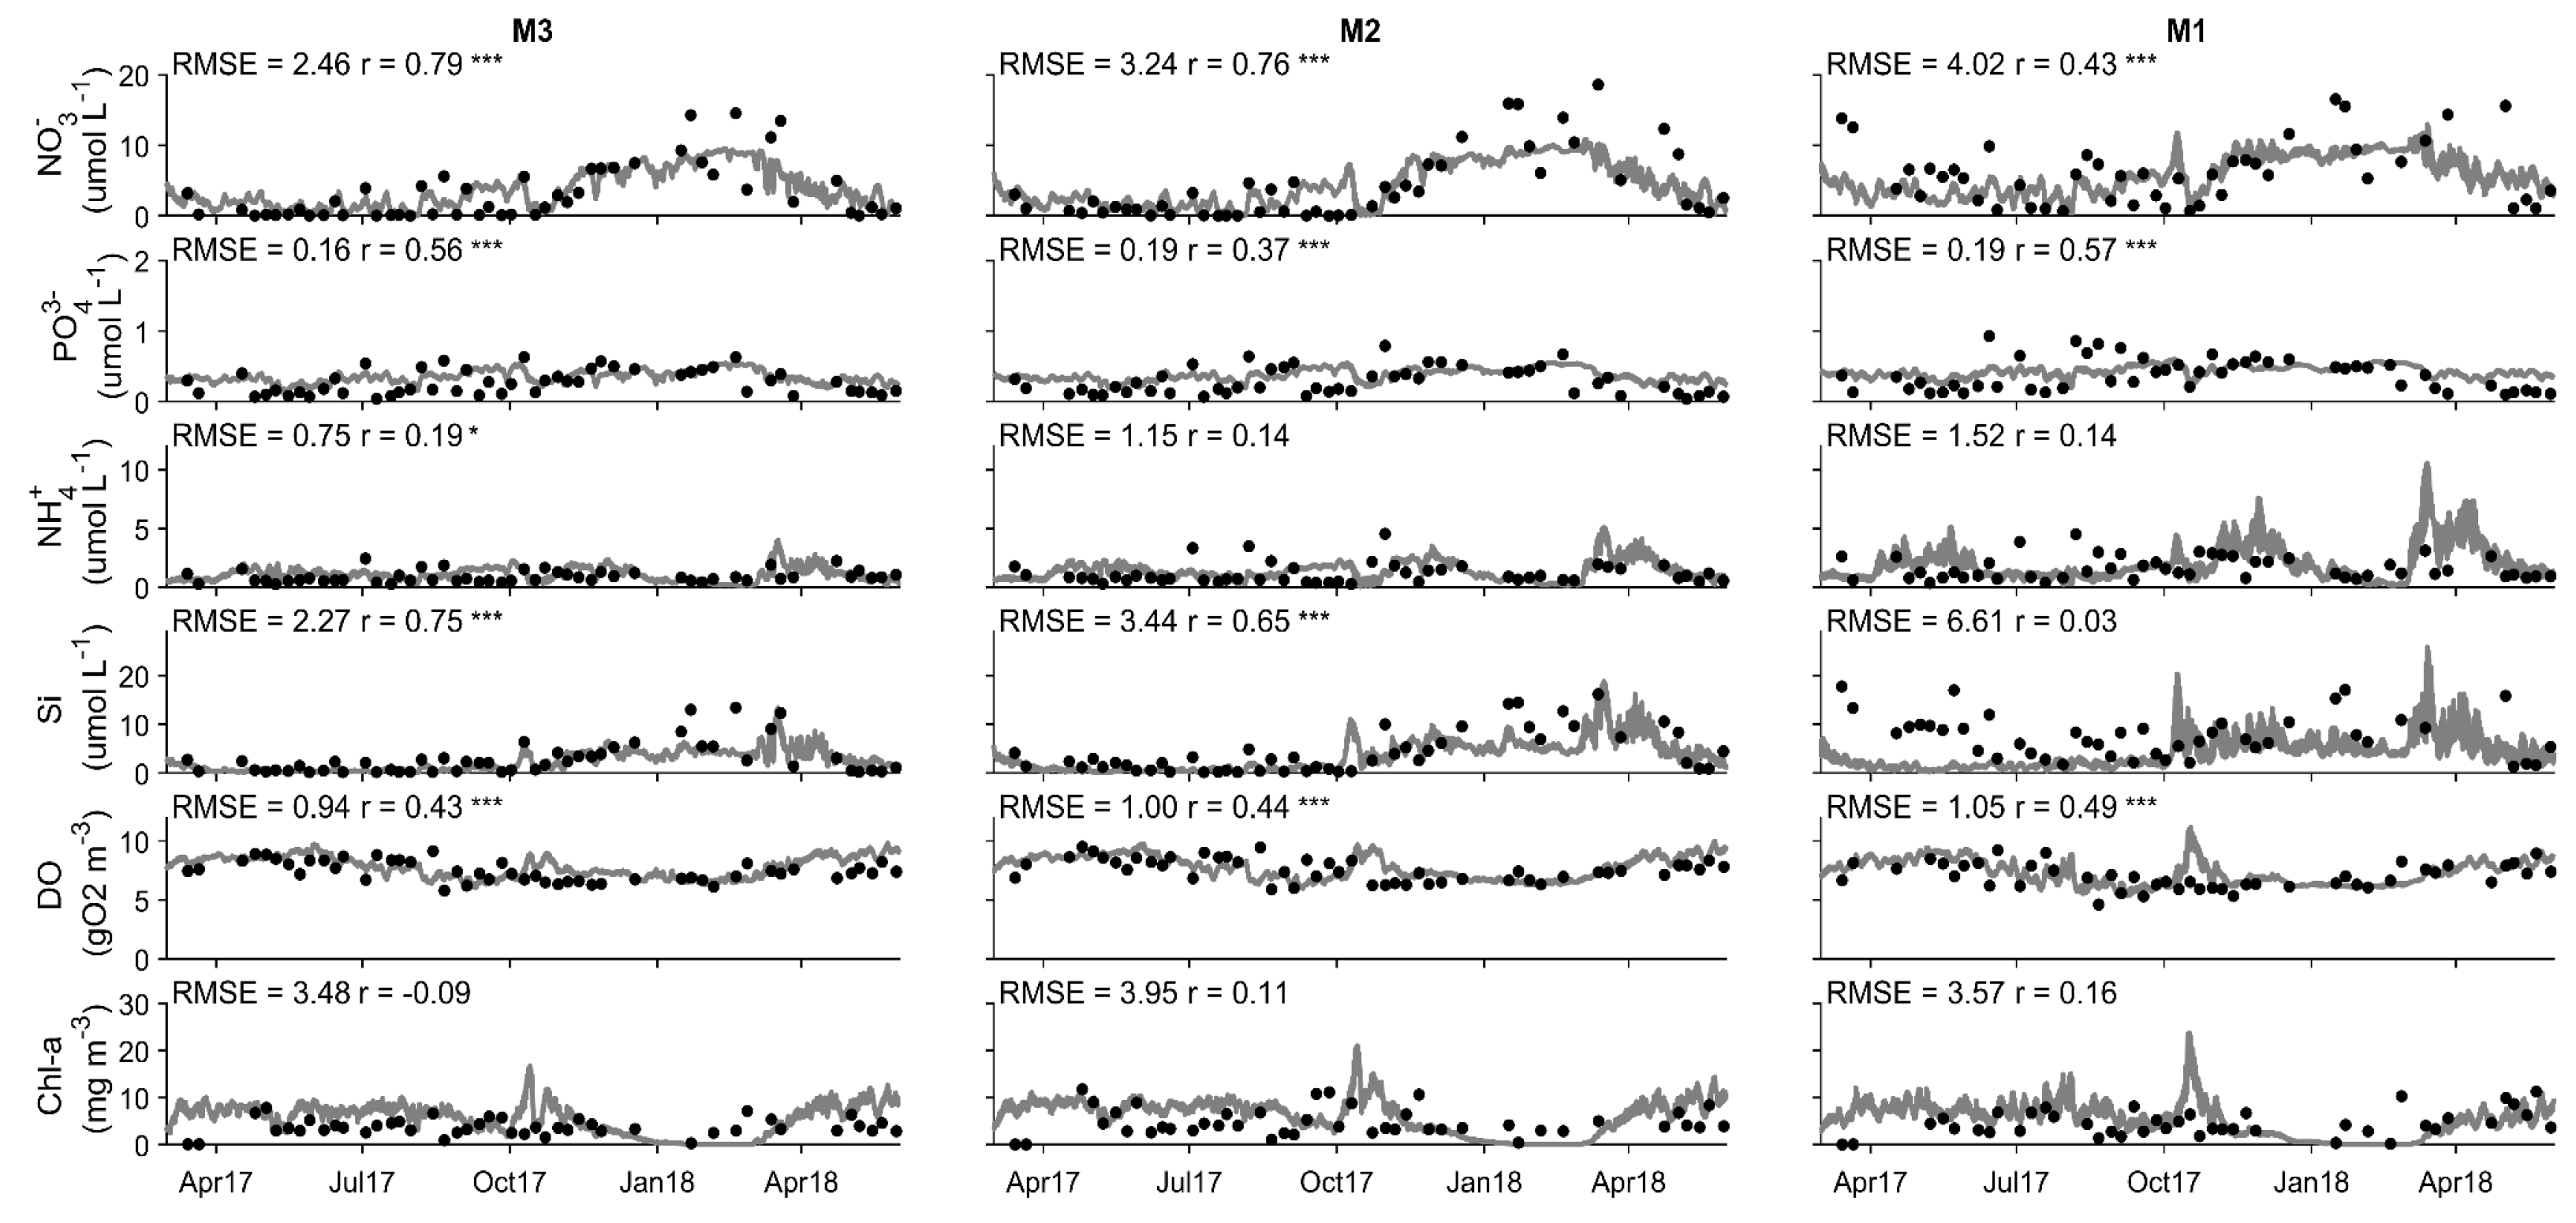
Figure 8.
Comparison of observed (dots) and modeled (grey line) NO3-, PO43-, NH4+, Si, DO and Chl-a concentrations at 0-5 m depth across stations in Ría de Arousa from March 2017 – May 2018. Statistical metrics (RMSE and r) are provided, with reliability levels denoted by ***, ** and * for 99%, 95%, and 75%, respectively.
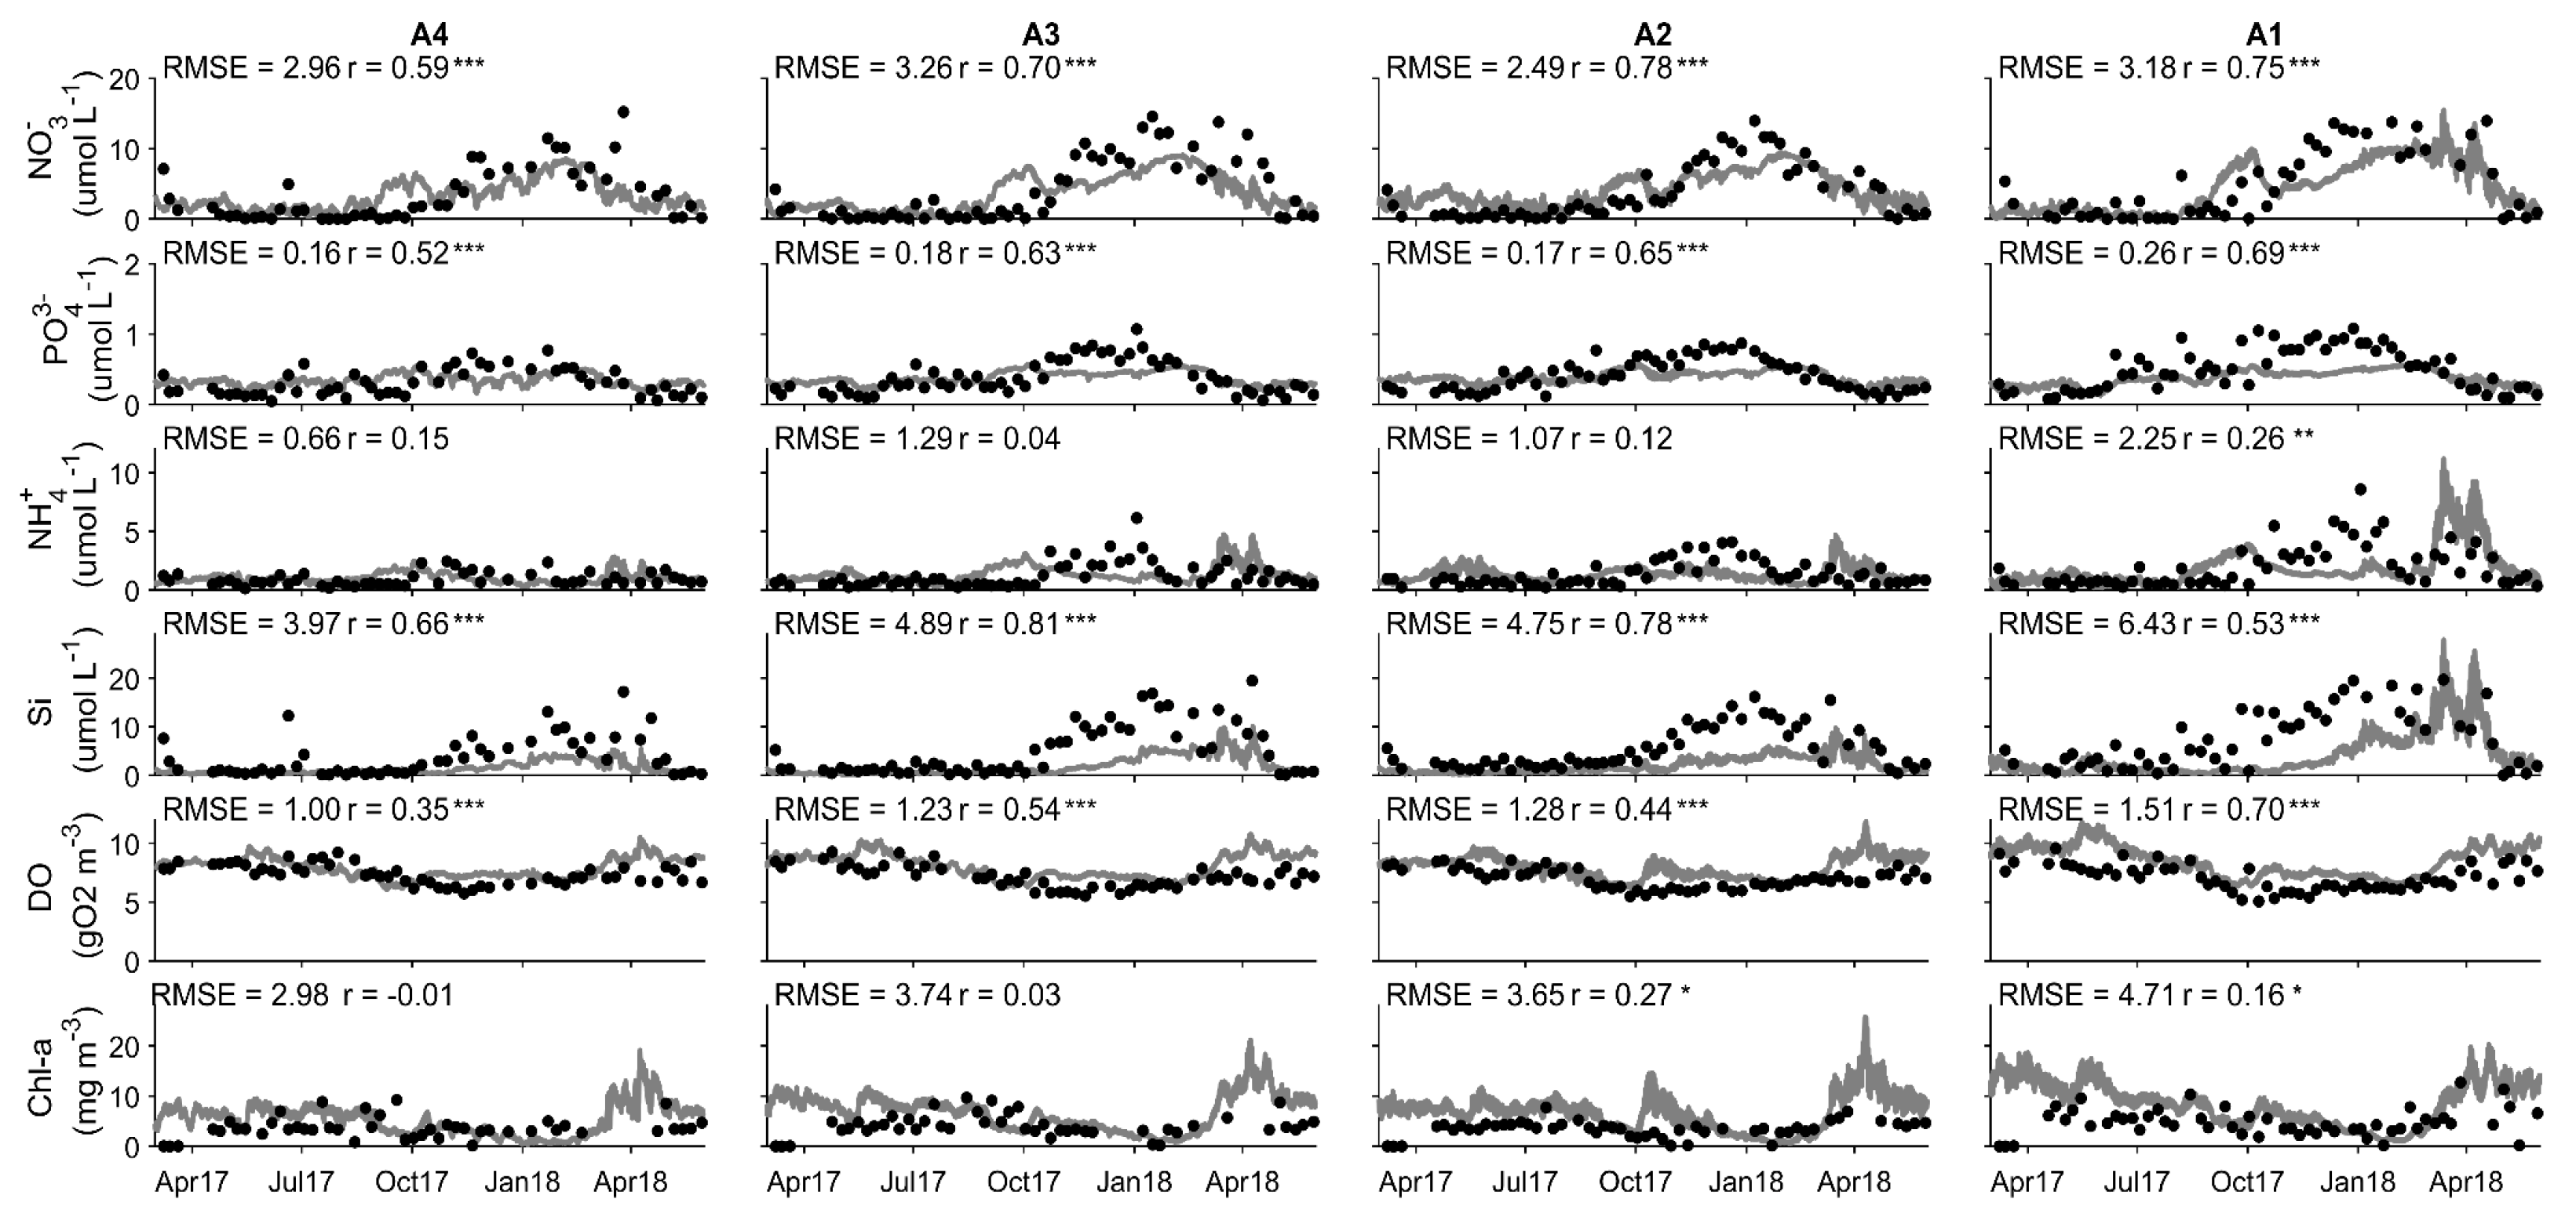
Figure 9.
Summary of the rRMSE metric for NO3-, PO43-, NH4+, Si, DO and Chl-a at stations of Ría de Muros and Ría de Arousa. Colored bars represent different depth layers: blue (surface), orange (0–5 m), yellow (5–10 m), purple (10–15 m), and green (bottom). The dotted line indicates rRMSE acceptance. Asterisks denote model reliability levels: *** for > 99%, ** for > 95%, and * for > 75%.
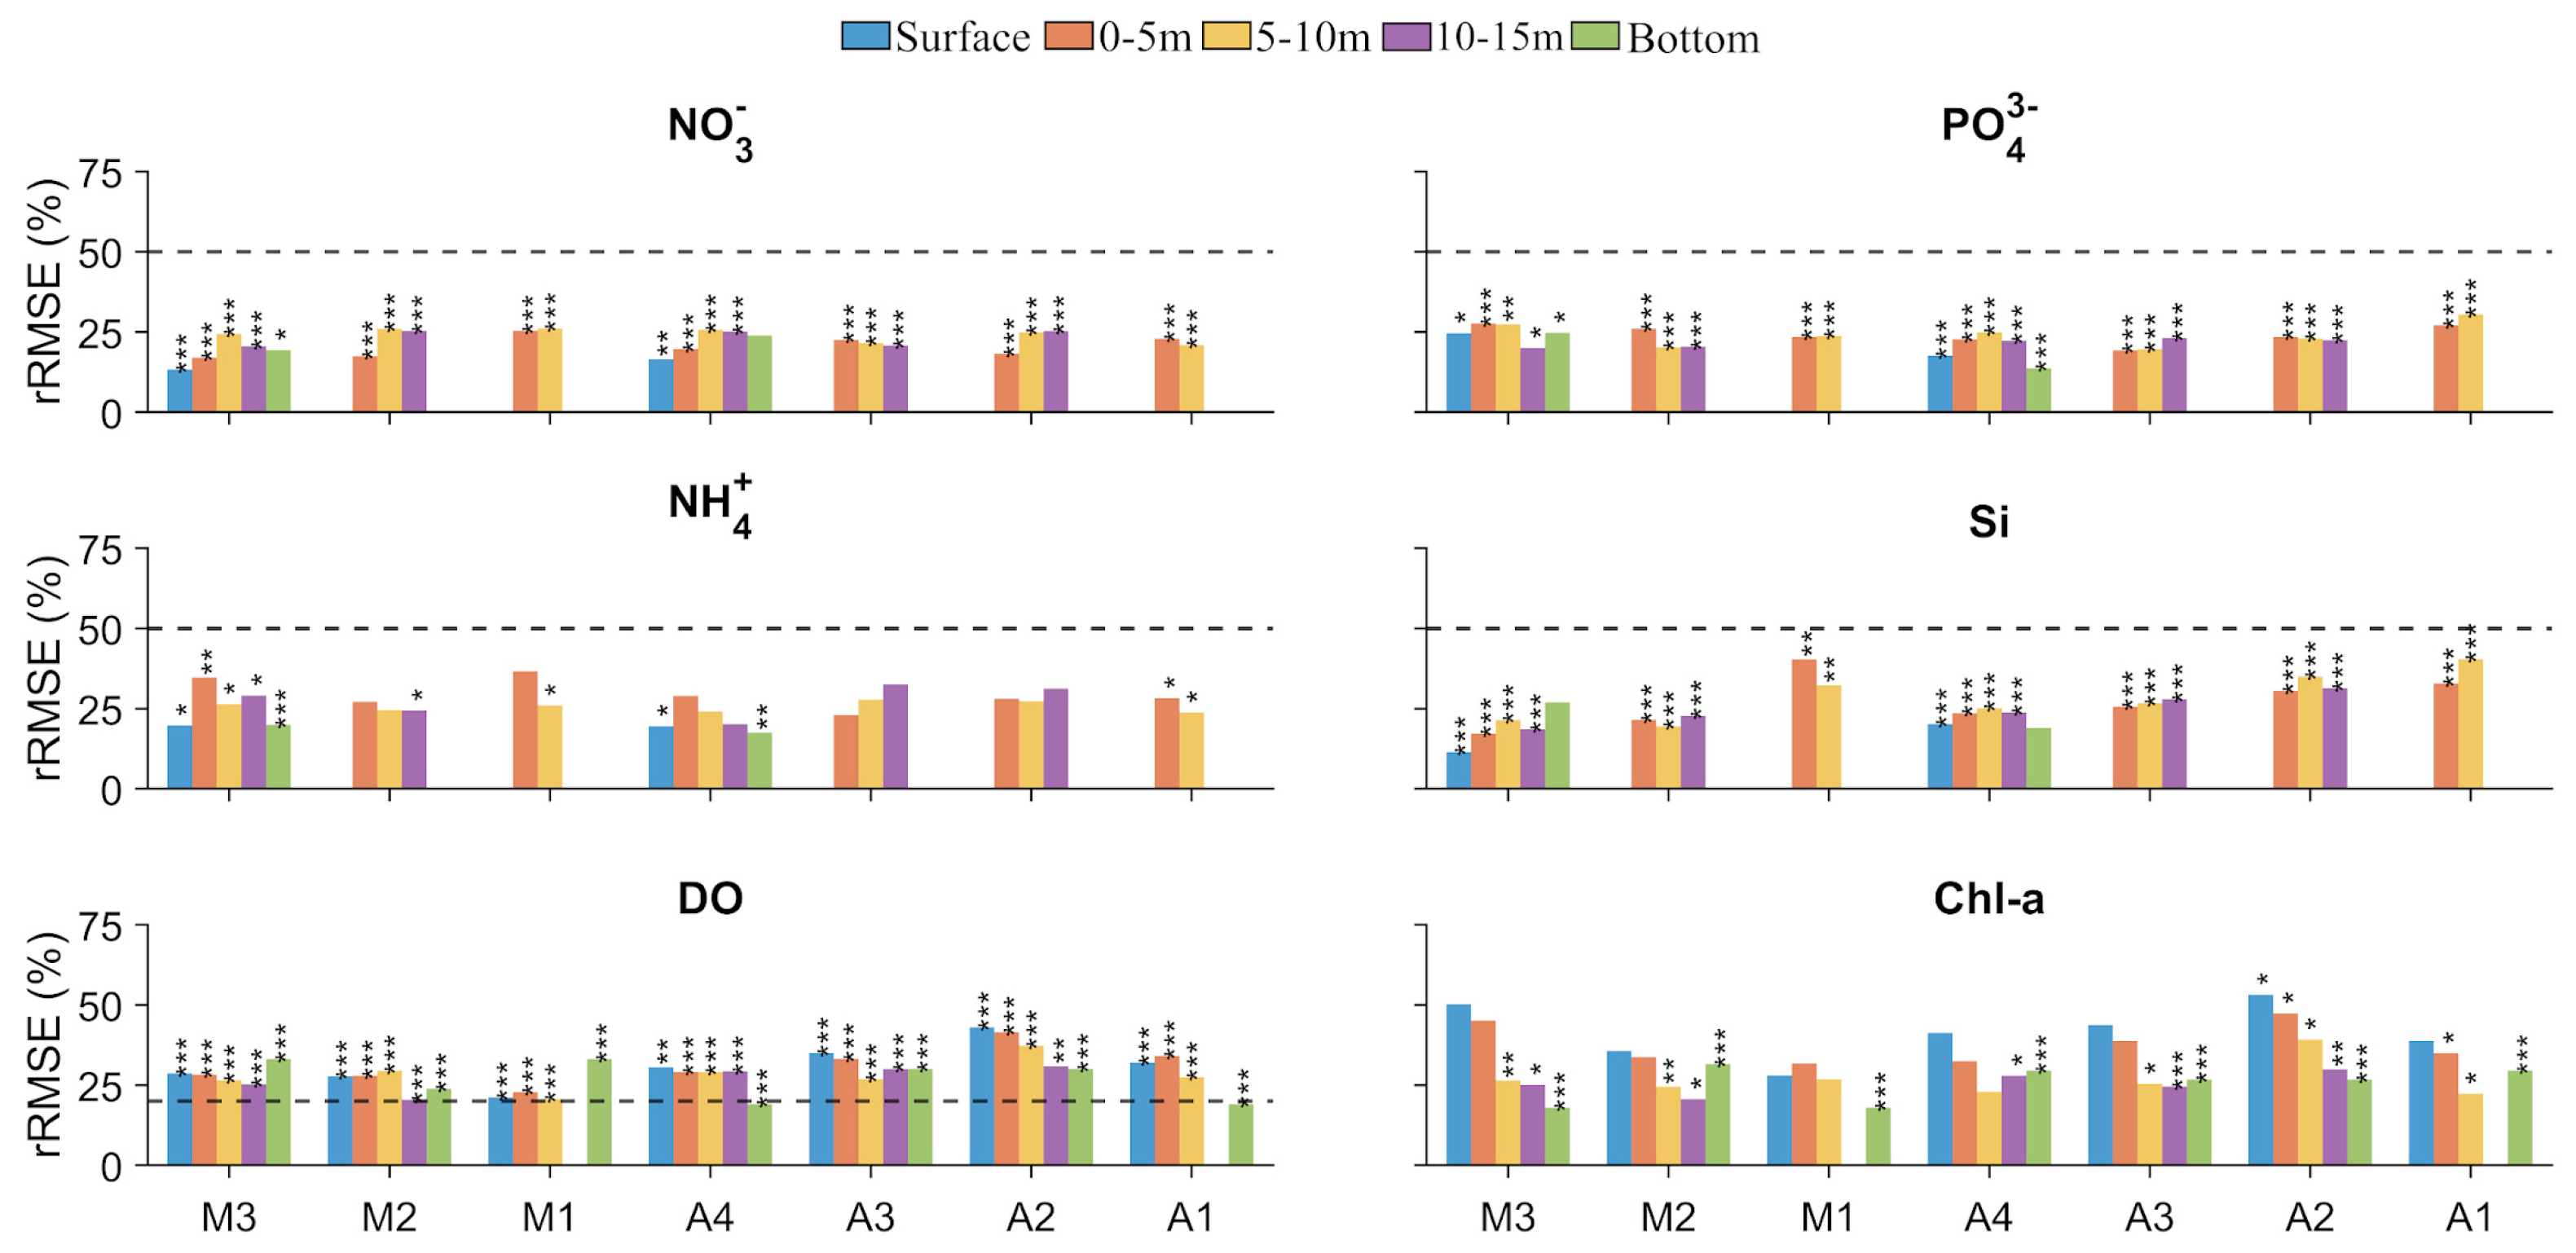
Figure 10.
Summary of the CF metric for NO3-, PO43-, NH4+, Si, DO and Chl-a at stations of Ría de Muros and Ría de Arousa. Colored bars represent different depth layers: blue (surface), orange (0–5 m), yellow (5–10 m), purple (10–15 m), and green (bottom). Solid and dotted lines indicate CF criteria: CF < 1 (very good) and CF between 1 and 2 (good).
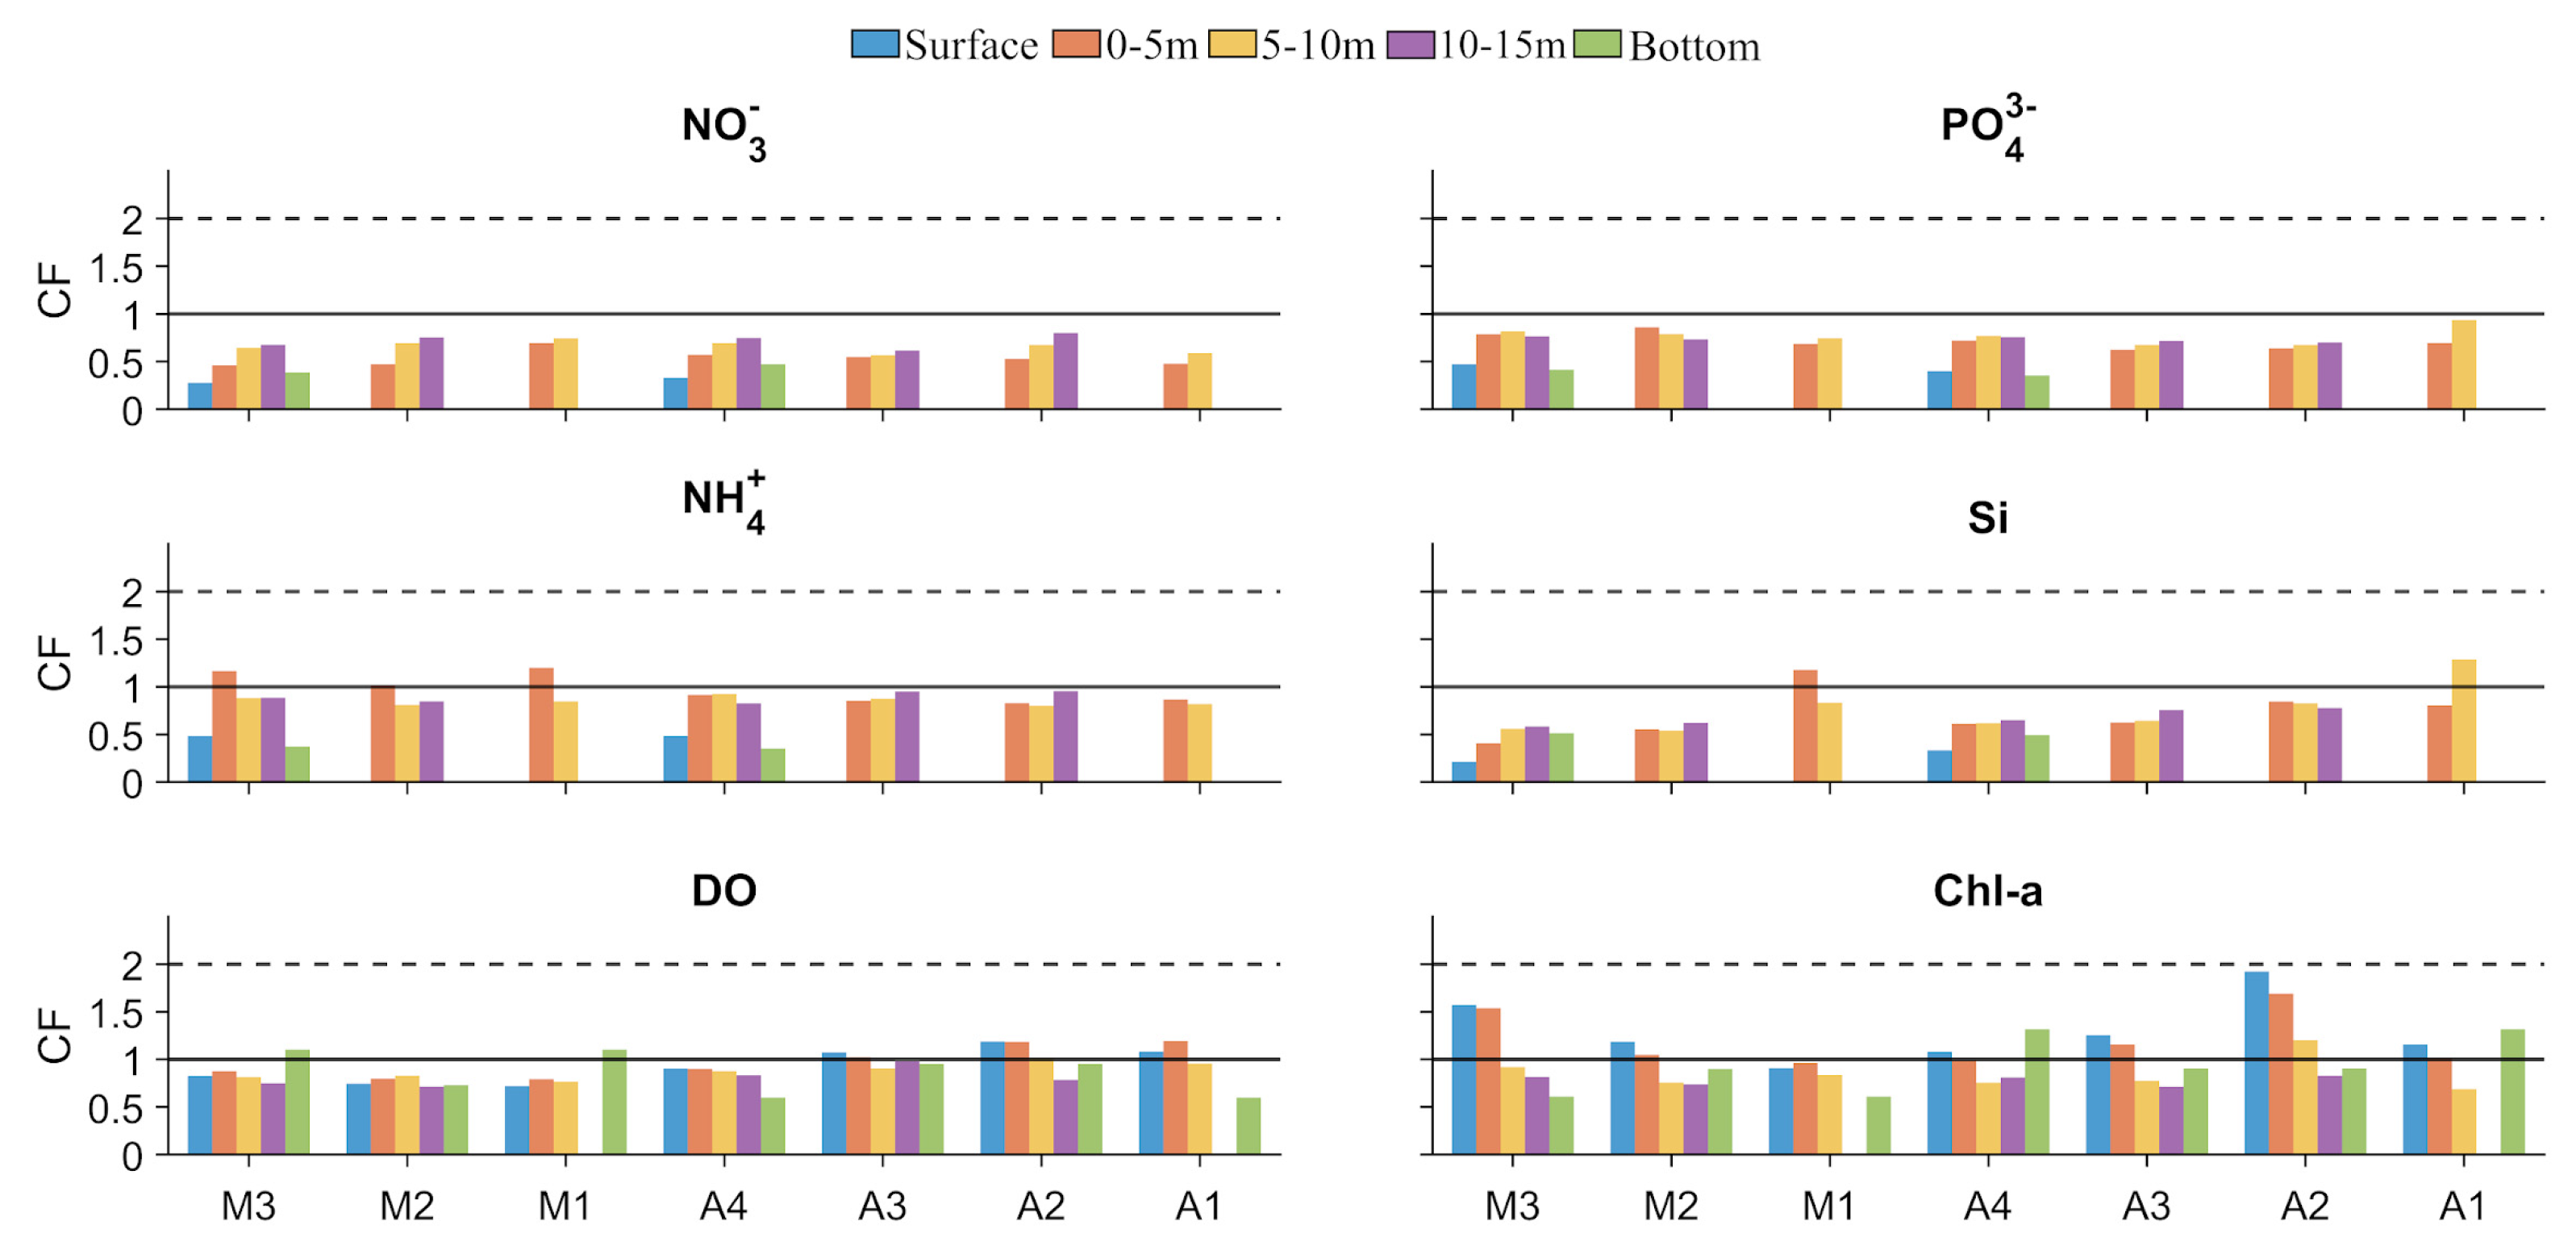
Figure 11.
Summary of the pBias metric for NO3-, PO43-, NH4+, Si, DO and Chl-a at stations of Ría de Muros and Ría de Arousa. Colored bars represent different depth layers: blue (surface), orange (0–5 m), yellow (5–10 m), purple (10–15 m), and green (bottom). Solid line indicates |pBias| classification: |pBias| <10% (excellent), values between 10 and 20 (very good), between 20 to 40 (good).
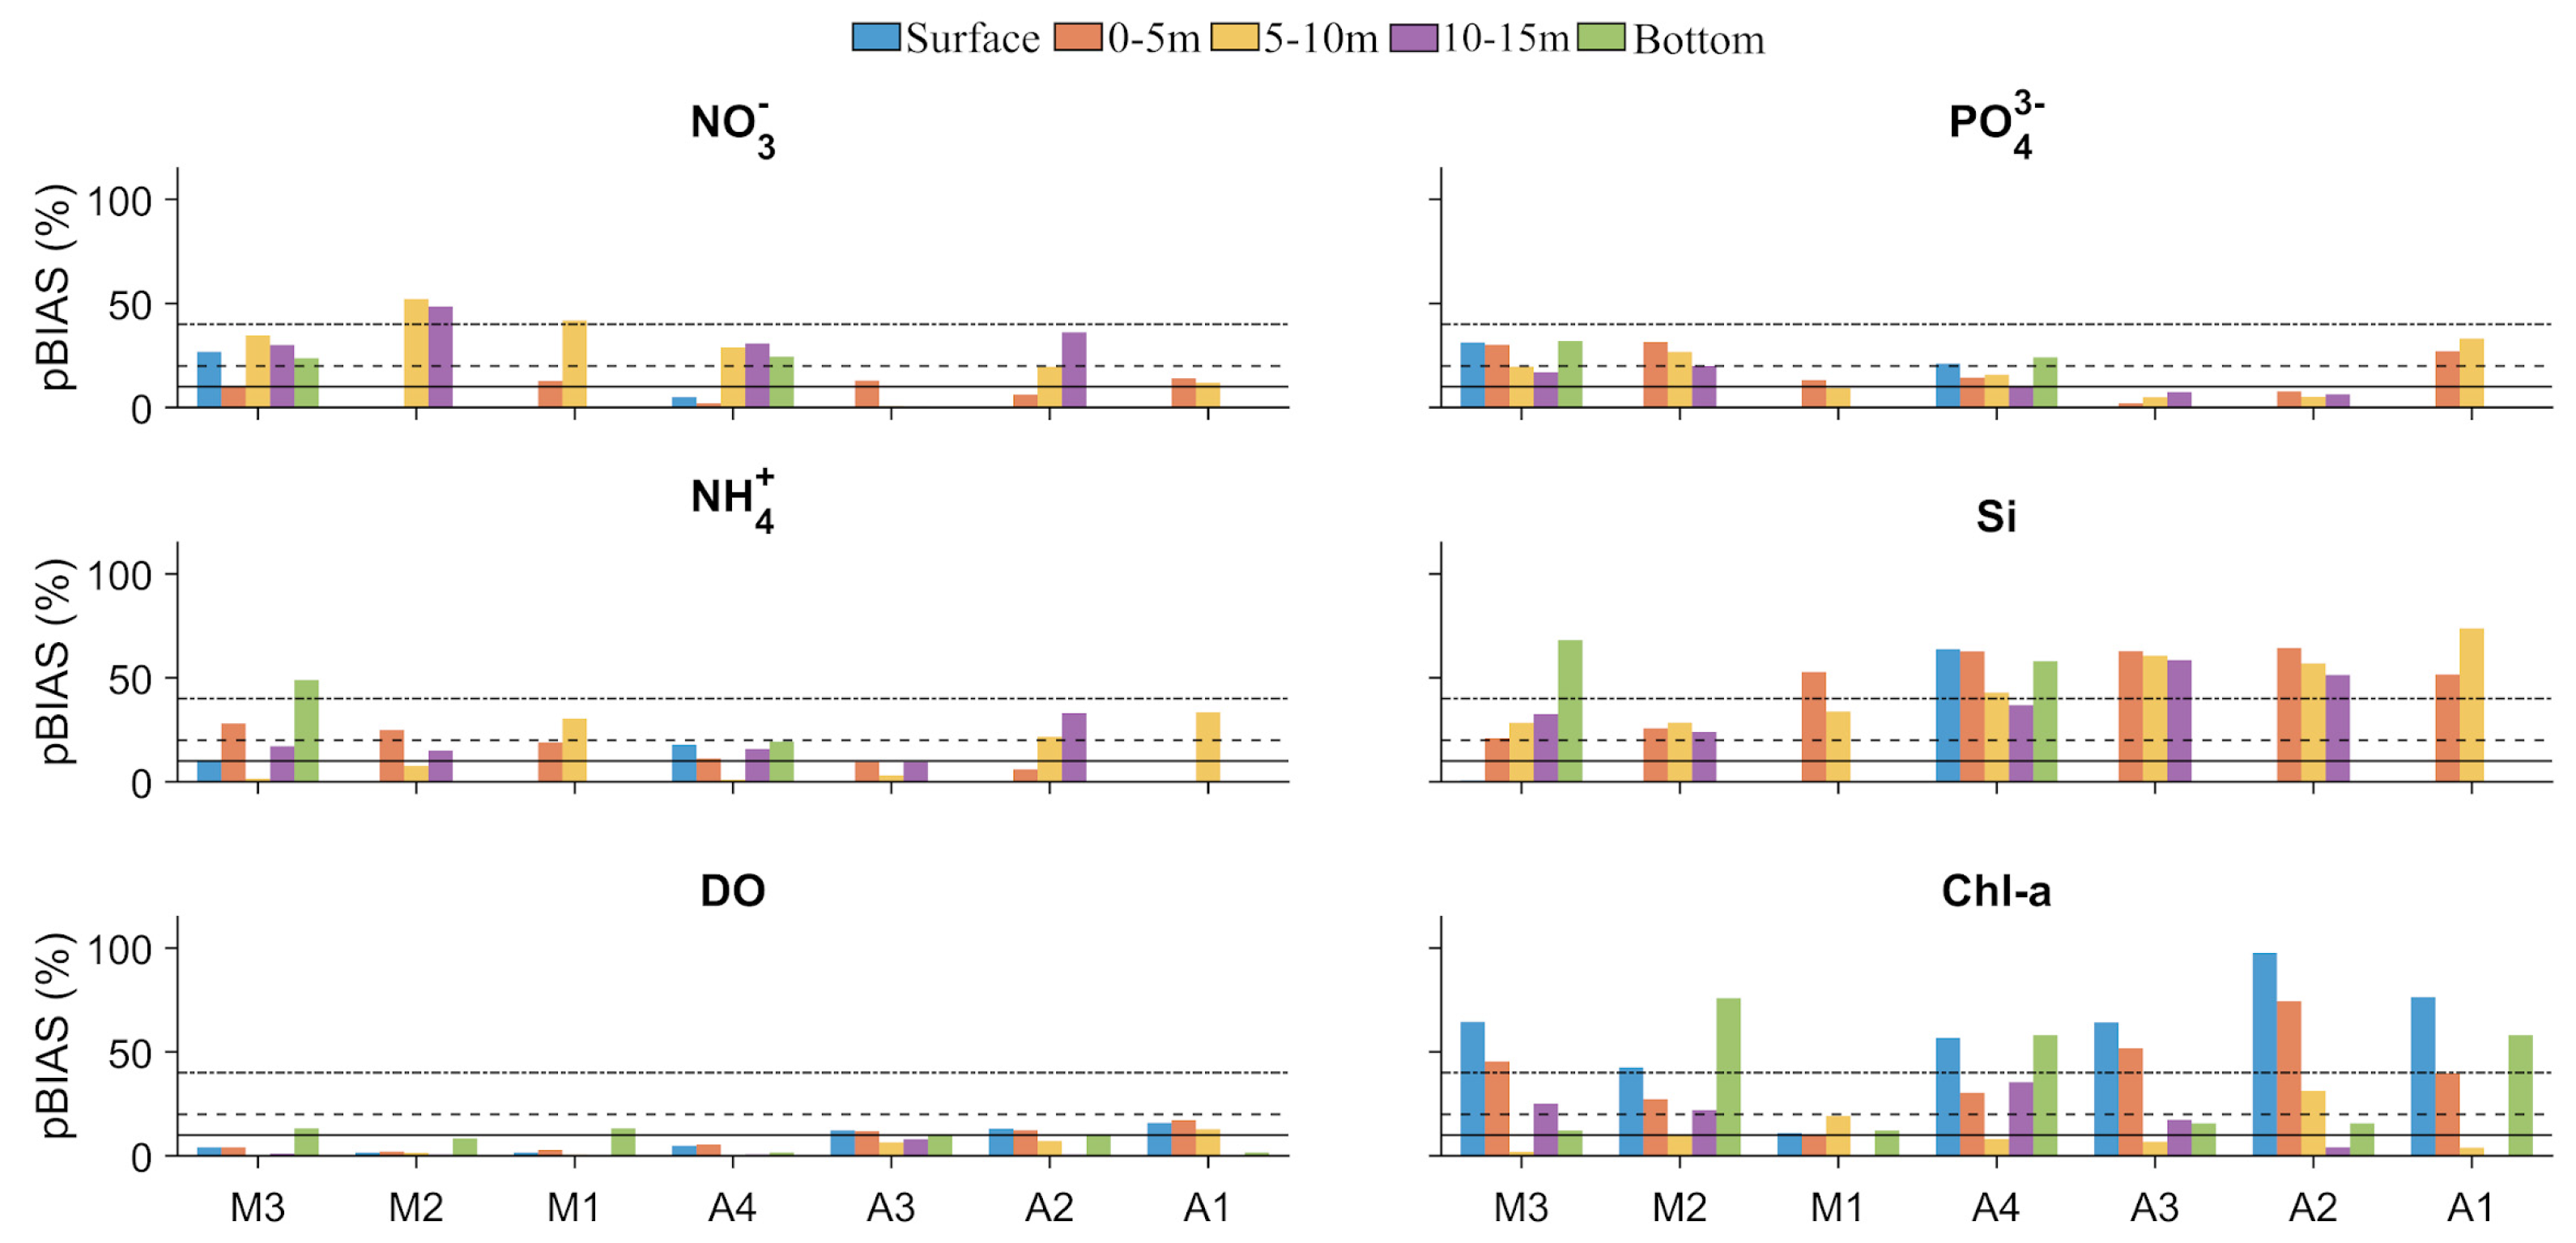

Table 1.
Dimensions and key characteristics of the Galician Rías Baixas.
| Ría | Water Volume (km3) |
Surface Area (km3) |
Length (km) |
Mean Mouth Depth (m) |
Main River(s) | Mean River Flow (m3 s-1) |
|---|---|---|---|---|---|---|
| Vigo | 3.1 | 176 | 31 | southern 50 | Verdugo-Oitaven | 17 |
| northern 25 | ||||||
| Pontevedra | 3.5 | 141 | 22 | southern 60 | Lérez | 25.6 |
| northern 15 | ||||||
| Arousa | 4.5 | 230 | 25 | southern 55 | Ulla | 79.3 |
| northern 5 | Umia | 16.3 | ||||
| Muros | 2.1 | 125 | 13 | 50 | Tambre | 54.1 |
Table 2.
Parametrization of the Delft3D-WAQ module for water quality simulations.
| Parameter | Description [units] | Value |
|---|---|---|
| Temp | ambient water temperature [ºC] | Delft3D-FLOW |
| Salinity | salinity [g kg-1] | Delft3D-FLOW |
| NCRatGreen | green stoichiometric constant for N over C in algae biomass [gN gC-1] | 0.12 |
| PCRatGreen | green stoichiometric constant for P over C in algae biomass [gP gC-1] | 0.01 |
| NCRatDiat | diatoms stoichiometric constant for N over C in algae biomass [gN gC-1] | 0.16 |
| PCRatDiat | diatoms stoichiometric constant for P over C in algae biomass [gP gC-1] | 0.01 |
| SCRatDiat | diatoms stoichiometric constant for Si over C in algae biomass [gSi gC-1] | 0.15 |
| NH4KRIT | critical concentration of ammonium [gN m-3] | 0.1 |
| SWRear | switch for oxygen reaeration formulation - | 7 |
| fPPtot | total net primary production [gC m-2 d-1] | 10 |
| fResptot | total respiration flux [gC m-2 d-1] | 0.5 |
| CBOD5 | carbonaceous biological oxygen demand [gO2 m-3] | time-varying |
| SOD | sediment oxygen demand [gO2 m-3] | time-varying |
| SalM1Green | lower salinity limit for mortality Greens [g kg-1] | 0 |
| SalM2Green | upper salinity limit for mortality Greens [g kg-1] | 50 |
| GRespDiat | growth respiration factor Diatoms [1 d-1] | 0.25 |
| SalM1Diat | lower salinity limit for mortality Diatoms [g kg-1] | 0 |
| SalM2Diat | upper salinity limit for mortality Diatoms [g kg-1] | 50 |
| Zooplank | input concentration of zooplankton [gC m-3] | time-varying |
| Latitude | latitude of study area [degrees] | 42.2 |
| RefDay | day number of reference day simulation [d] | time-varying |
| RadSurf | irradiation at water surface [W m-2] | time-varying |
| Ditochl | Chlorophyll-a:C ratio in Diatoms [mg Chlfa/g C] | 22 |
| Grtochl | Chlorophyll-a:C ratio in Greens [mg Chlfa/g C] | 15 |
Table 3.
Water quality model input variables and data availability for forcing the oceanic open boundary.
Table 3.
Water quality model input variables and data availability for forcing the oceanic open boundary.
| Parameter input | Available | Variable selected | Adjustment |
|---|---|---|---|
| NH4+ | YES | ||
| NO3- | |||
| PO₄³⁻ | |||
| Si | |||
| DO | |||
| TIC | NO | DIC | It is assumed that the concentration of TIC is equal to DIC (based on [80]) |
| Alkalinity | pH, water temperature, salinity and DIC | Alkalinity is calculated from pH, seawater temperature, salinity and DIC (based on [80]). Water temperature and salinity fields were retrieved form the IBI_MULTIYEAR_PHY_005_002 product. | |
| Diatoms | NO | Chl-a | Based on [79] from 1987 to 1996 at Ría de Vigo. December, January, February: 40% diatoms and 60% green. March, April, May: 80% diatoms and 20% green. June, July, August: 50% diatoms and 50% green. September, October, November: 80% diatoms and 20% green. |
| Green Algae | |||
| Opal-Si | NO | PHYC | PHYC × (28/12) × 0.5 × 0.13 (based on [82]) |
| POC1 | NO | PHYC | PHYC × 2 × 12/1000 (based on [82]) |
| PON1 | POC | POC × (14/12) /106 (based on [82]) | |
| POP1 | POC | POC × (31/12) / 106 (based on [82]) |
Table 4.
Data sources for forcing river boundary discharge inputs.
| Parameter input | River | Source | Adjustment |
|---|---|---|---|
| NH4+ | Minho | [83] | Monthly NH4+ values (2010 - 2011) |
| Rías Baixas | HYPEWEB | Monthly IN values from all available models (2000-2010). It is assumed that 10% of the IN corresponds to NH4+ (based on [82]) | |
| NO3- PO₄³⁻ Si |
Minho | [83] | Monthly values (2010 - 2011) |
| Rías Baixas | [84] | Maximum value dry and wet season (1980-1992) | |
| DO | Minho Rías Baixas |
[83] - |
Monthly O2 values (2010 - 2011) A constant value of 8 gO2 m-3 is assigned. |
| TIC Alkalinity |
Minho Rías Baixas |
[83] [85] |
Alkalinity is calculated from pH, TIC, water temperature and salinity following [82]. Seasonal values (2002) |
| Diatoms Green Algae |
Minho Rías Baixas |
[83] - |
Monthly values of Chl-a (2010 - 2011) are divided by two. A constant value of 0.001 gC m-3 is assigned. |
| Opal-Si | Minho Rías Baixas |
- - |
A constant value of 0 gSi m-3 is assigned. |
| POC1 PON1 POP1 |
Minho | HYPEWEB | Based on [82] it is estimated that: PON = TN – (NH4++NO3-); POC = 12 x PON; POP = TP – PO4 |
| Rías Baixas | [85] | Seasonal values (2002) |
Disclaimer/Publisher’s Note: The statements, opinions and data contained in all publications are solely those of the individual author(s) and contributor(s) and not of MDPI and/or the editor(s). MDPI and/or the editor(s) disclaim responsibility for any injury to people or property resulting from any ideas, methods, instructions or products referred to in the content. |
© 2024 by the authors. Licensee MDPI, Basel, Switzerland. This article is an open access article distributed under the terms and conditions of the Creative Commons Attribution (CC BY) license (http://creativecommons.org/licenses/by/4.0/).
Copyright: This open access article is published under a Creative Commons CC BY 4.0 license, which permit the free download, distribution, and reuse, provided that the author and preprint are cited in any reuse.


