Submitted:
07 November 2024
Posted:
07 November 2024
You are already at the latest version
Abstract
The period from mid-February to May marks the celebration of the Amarula fruit har-vest, vital for producing Amarula Cream liqueur, an alcoholic beverage made from sugar, cream, and fruits. The fruits of the Amarula plant are rich in ascorbic acid, con-taining three times the vitamin C found in orange juice, along with various minerals and antioxidants. Despite these nutritional benefits, research indicates that the full potential of Amarula fruit still needs to be explored, posing a risk to the plant's sus-tainability. In Kwa-Zulu Natal (KZN), there is a growing trend of utilising Amarula fruits in producing "utshwala bamaganu," a locally favoured alcoholic beverage fer-mented from fruits and sweetened with sugar. However, households with limited al-cohol consumption often do not partake in this beverage. In KZN, most non-alcoholic fermented drinks are maize-based, raising concerns about potential vitamin A defi-ciencies in rural areas where excessive consumption of these beverages may displace more nutritious food options. This study addresses these issues by developing non-alcoholic fermented beverages incorporating Amarula fruits and Provitamin A biofortified maize. Using an experimental design, recipes sourced from key informants were combined, standardised, and modified by substituting traditional white maize meals with 100% Provitamin A biofortified maize to enhance the nutritional profile of the beverages. At full concentration, Amarula juices served as both the sugar source and fermenting agent, while other ingredients remained unchanged. Various fermen-tation techniques—including roasting, milling, and boiling—were employed to assess differences in nutrient composition. The beverage samples were analysed for nutri-tional content, focusing on vitamin A, amino acids, and mineral compositions. Fol-lowing analysis, 60 consumers participated in sensory evaluations using a 5-point he-donic scale to provide feedback. Descriptive statistics were employed for data analysis, including means and standard deviations. The results revealed significant nutritional improvements, particularly in essential minerals like zinc and iron; Sample 2 exhibited the highest iron content at 53 ppm. Roasting significantly enhanced flavour and over-all acceptability, with consumers rating Sample 1 the highest. However, vitamin A levels across all samples were below detection limits, likely due to degradation from heat exposure. This study highlights the potential of incorporating Amarula and bio-fortified maize into fermented beverages to enhance food and nutrition security. The findings suggest that optimizing fermentation and processing methods could improve nutritional benefits, although retaining vitamin A remains challenging. Future research should focus on re-fining fermentation techniques to preserve heat-sensitive nutrients, conducting micro-bial analyses to explore probiotic properties, and educating consumers about the nutri-tional advantages of biofortified products. Expanding market research could enhance product acceptability and facilitate the commercialization of nutritionally fortified beverages.
Keywords:
Amarula
; fermented beverage
; non-alcoholic beverage
; Indigenous
; provitamin A biofortified maize
; product development
; acceptability
1. Introduction
In recent years, there has been a global surge of interest in developing innovative and healthy non-alcoholic beverages, also known as functional beverages [1,2]. This heightened attention has prompted researchers and food scientists to explore alternative ingredients and fermentation processes, aiming to create beverages that not only provide nutritional benefits but also meet consumer acceptability standards [3,4]. Sclerocarya birrea, commonly referred to as Amarula, is a tree Indigenous to the African continent, celebrated for its delightful and aromatic fruits [5,6,7]. These fruits boast a rich vitamin C content, three times higher than that of orange juice, along with abundant minerals and antioxidants such as phosphorus, magnesium, copper, zinc, and thiamine [8,9]. Traditionally, Amarula fruits have been utilized in households for sweetening cereals, producing jam and juice, and creating the renowned Amarula beer [10,11]. Noteworthy is the distinctive Amarula flavour, suggested by Maluleke [12] to enhance products with minimal flavour. Despite limited past research on the utilization of native Amarula fruit in product development [13], the recent demand for non-alcoholic options has spurred investigations into Amarula's potential in creating fermented beverages, given the absence of evidence of other non-cream liquor beverages made from the fruit [14].
Concurrently, efforts to combat malnutrition and vitamin A deficiency have led to the development of biofortified maize varieties with enhanced ProVitamin A content [15,16,17]. These maize varieties, bred for higher nutrient levels, including carotenoids, can serve as valuable additions to fermented beverage formulations, appealing to health-conscious consumers [17]. Incorporating ProVitamin A biofortified maize in the formulation of fermented beverages can further enhance their nutritional value, making them an attractive choice for health-conscious consumers. In many underdeveloped parts of the world, biofortified staple foods can potentially reduce micronutrient deficiency. However, since biofortification frequently modifies the taste, appearance, and other characteristics of foods, this may limit consumer acceptance of the new types and lessen their influence [18]. In a study by Stevens and Winter-Nelson [19], taste tests and trade experiments to determine how well-liked provitamin A-biofortified maize was in Maputo, Mozambique, and results indicated a preference for the local white maize over an orange biofortified variety and over a white variety that had a similar texture and flavour to the biofortified maize in terms of taste, texture, and appearance [19]. Other studies conducted in South Africa using PVA-based Uphuthu and ujeqe [20], Amahewu [21], and several other products also report low consumer acceptability of PVA maize compared to the commonly used white maize [22,23]
Fermentation plays a critical role in producing desirable flavours and textures in beverages [24]. Different microbial strains, fermentation conditions and processing techniques can influence the organoleptic qualities and nutritional composition of the final product [25]. Researchers must, however, optimize the fermentation parameters to achieve a well-balanced and appealing beverage [26]. Furthermore, the sensory attributes and acceptability of these non-alcoholic beverages among consumers must be thoroughly evaluated. Factors such as aroma, taste, colour, and textures significantly influence consumer preference and purchase decisions [27]. Consumer acceptability studies, sensory evaluations and market research are crucial steps in determining these beverages' viability and potential commercial success [28]. This study aimed to develop innovative Indigenous non-alcoholic fermented beverage/s from provitamin A biofortified maize and Amarula.
2. Materials and Methods
2.1. Fruits Harvesting and Post-Harvesting
The marula fruits were collected at Pongola, Richards Bay and Empangeni. The consumers of the fruits noted that they are not to be picked directly from the trees. However, they fall from the tree and are handpicked from the ground (See Figure 1). Interestingly, the IK holders reported that the fruits are generally picked by women responsible for processing them. This was in line with [11] who reported that in Swaziland, it was a tradition for women to pick marula fruits exclusively. A bright yellow colour and soft texture are used to determine the ripeness of the fruit.
Figure 1 depicts the variety of fruits harvested at their different stages. The fruits labelled A are ripe and ready for processing, whilst those labelled B still need to be kept outside and continue ripening.
2.2. Sorting and Grading
Although this stage is usually unimportant for “utshwala bamaganu” producers, for this research to control quality, fruits that were bruised and those that had spoilt (Figure 2) were discarded. Only fresh fruits were used (Figure 3 and Figure 4). In local communities, they indicated that “when the fruits are at this stage, they are the best for them as they make the process of breaking them easier, and they believe that this contributes to the extent of fermentation that was going to be attained on the final product.
2.3. Juice Extraction
According to the IK holders, to produce the alcoholic fermented beverage, fill the container with half water and use an equal amount of the fruits. In this study, 10 litres of water were used, and marula fruits were used. To extract, break the fruits open to separate the skin from water, as shown in the Figure 5 below. Once done, the skins are removed, allowing the mixture to ferment with the kennel. The process is repeated daily mainly because of the amount of labour that goes into the process. The fermentation period is about 3-4 days for a non-alcoholic beverage and longer for an alcoholic one, according to the IK holder. In this study, the juice mixture was refrigerated at 4 degrees Celsius to inhibit the microbes from activating the microbes until use.
2.4. Sample Preparation Methods

Table 1.
Beverage preparation methods.
| Beverage 1 (Sample 1) | Beverage 2 (Sample 2) | Beverage 3 (Sample 3) |
|---|---|---|
|
Ingredients: • Provitamin A Biofortified Maize (PVABM) • Marula juice (for fermentation and blending) • Clean water (for washing the grains) Method • In a clean container, combine PVABM with extracted Marula juice. Cover and allow the mixture to ferment at room temperature for 3 to 4 days. • After fermentation, the grains should be swollen and ready for further processing. Rinse the fermented grains thoroughly with clean water. • Heat a pan over medium heat. Add the washed grains and roast them until they turn golden brown. • Transfer the roasted grains to an electric blender. Add Marula juice and blend until smooth. • Sift the blended mixture to remove any coarse particles. Cover and let it ferment for an additional 3 days at room temperature. • After the second fermentation, refrigerate the mixture into clean glass bottles. |
Ingredients: Provitamin A Biofortified Maize grains Marula juice (For fermentation, cooking and cooling) Method • Using an electric miller or blender, grind Provitamin A Biofortified Maize grains into a fine powder. • In a clean container, mix the ground maize powder with 1 cup of extracted Marula juice. Cover and let the mixture ferment for 3 to 4 days at room temperature. This traditional fermentation process is known as "ukuncwancwisa," according to Indigenous Knowledge (IK) experts. • After 4 days of fermentation, transfer the wet maize mixture to a pot. Add Marula juice and cook over medium heat, stirring occasionally, until a soft porridge forms. • Once the porridge is cooked, gradually add cold Marula juice to cool it down and achieve a smooth, pouring consistency. • Pour the cooled porridge into a clean glass bottle. Seal and refrigerate for further use. |
• Ingredients: • Provitamin A Biofortified Maize grains • Marula juice (For fermentation and blending) • Clean water • Method • In a large container, add Marula juice to yellow maize and allow the mixture to ferment for 3 to 4 days at room temperature. • Wash the Fermented Maize**: • After fermentation, wash the maize thoroughly with clean running water to prepare for blending. • Place the fermented maize in a blender and add some Marula juice. Blend until a very smooth consistency is achieved. • Sift the blended maize to remove any unwanted chaff. Set aside the smooth mixture. • Let the mixture stand for 2 hours. During this time, it will separate into water and settle solids. • Carefully decant the water, leaving behind the settled part of the mixture. • Place the settled mixture into a muslin cloth and allow it to drain for 3 hours to release any remaining water. • Spread the drained mixture in an oven at 70°C with a fan for 3 hours to dehydrate. Alternatively, you can use a dehydrator or sun drying to achieve the same result. • Once dried, process the mixture using a dry miller or blender. Sift the resulting powder to ensure a fine consistency. • Store the powder in an airtight container or freezer for future use. • To make the final product, cook the powder in Marula juice over medium heat, stirring until a thick, drinkable consistency is achieved. • Allow the mixture to cool. Transfer to a glass bottle and refrigerate for further use. |
2.5. Nutritional Analysis
Vitamin A Content Profile Determination of Fermented Beverages
Vitamin A (Provitamin A) was obtained from Mérieux NutriSciences. The method used to analyze the vitamin A content followed [21], utilizing high-performance liquid chromatography (HPLC) to analyse and extract carotenoids from the samples. In the procedure, 0.5 g of freeze-dried samples were weighed, and the extraction occurred under dim light. Each sample was mixed with 6 mL of absolute ethanol containing 0.1% butylated hydroxytoluene (BHT) and heated in an 85°C water bath for 5 minutes. After heating, 120 µL of 80% potassium hydroxide (KOH) was added, followed by vortexing for 20 seconds and another 10 minutes in the water bath for saponification, with intermittent vortexing. The samples were then quickly cooled in an ice bath, and 3 mL of cold deionized distilled water was added. Subsequently, 3 mL of petroleum ether and diethyl ether mixture (2:1, v/v) was added, vortexed, and centrifuged at 1400×g for 5 minutes. The upper layer was transferred to a new test tube, and the extraction was repeated twice more with the remaining pellet. The combined organic supernatants were dried under nitrogen gas. The dried residue was stored at -20°C and reconstituted with 500 µL of the mobile phase before HPLC analysis. Finally, the carotenoid extract was filtered through a 0.4 mm filter paper before being loaded onto the HPLC instrument [21].
2.6. Minerals Profile Determination of Fermented Beverage
A method, as described by Oyeyinka, et al. [30], was used to determine the mineral composition in the sample. The neutral detergent fibre (NDF) and the acid detergent fibre (ADF) content of the samples were analyzed using a Dosi-Fiber machine (JP Selecta, Abrera, Barcelona, Spain), following the AOAC method (lc 2002.04) (AOAC, 2002). Mineral analysis was conducted using atomic absorption spectroscopy (GBC 908 Atomic Absorption Spectrophotometer, Braeside, Victoria, Australia) per the AOAC guidelines [31]. The samples' total mineral content (ash) was determined as ash according to the AOAC official method 942.05 [32]. The samples were weighed and placed in a furnace at 550 °C overnight. The minerals remained ash residue in the crucibles after the samples volatilized the organic matter. The following equation was used to determine the percentage of ash found in the samples:
2.7. Amino Acid Profile Determination of Fermented Beverage
The amino acid (AA) analysis was conducted using a method adopted from Tsomele, et al. [33] and [30], performed at Stellenbosch University. The amino acid content was determined using a Waters Acquity Ultra Performance Liquid Chromatograph (UPLC) AccQ-Tag system, with MassLynx software and a Photodiode Array (PDA) detector. The analysis is based on reverse-phase chromatography with phenylthiocarbamyl precolumn derivatization following acid digestion. Samples were hydrolyzed with 6 M HCl at 110°C for 24 hours in a sealed tube before chromatographic analysis. Cysteine and methionine contents were determined after performic acid oxidation, while tryptophan content was determined after alkaline hydrolysis. The hydrolysates were separated on a Waters Ultra Tag C18 column using a gradient of sodium citrate buffers at a flow rate of 0.70 mL/min. The amino acid profile was analyzed using the Pico-Tag method, with proteins hydrolyzed using HCl and amino acids derivatized into phenylthiocarbamyls. Hydrolyzed samples (100 mg) were mixed with 0.5 mL of 6 M HCl, sealed, and incubated at 110°C for 24 hours. After incubation, the solution was filtered, evaporated to dry at 140°C for one hour, and then derivatized with phenylisothiocyanate. Amino acid standards were used to calibrate the HPLC. MassLynx software was used for instrument control and data acquisition, integrating peaks at defined retention times and plotting calibration curves based on peak response against concentration.
2.8. Sensory and Consumer Acceptability
A series of trials were done, and sensory evaluation was done with key informants. 60 Untrained panellists recruited from Pongola and Richards Bay were used to test if there were any differences between the samples and evaluate the acceptance and preference for samples in this study [34]. The panellists were consumers of Mahewu and knew the marula fruits, although they had never been used before. Ethical clearance was obtained from the Biomedical Research Ethics Committee (BREC), University of KwaZulu-Natal, and consent was obtained from participants before they evaluated the samples. A five (5) point hedonic scale was used to assess the product. The scale provides a balanced approach to sensory evaluation, offering simplicity, efficiency, and the ability to capture meaningful insights into consumer preferences and product quality [35]. Its use is justified by its widespread acceptance, ease of application, and sensitivity to differences, making it a valuable tool for both product development and quality control in the food, beverage, and other consumer goods industries [36]. The beverages were evaluated for sensory attributes: colour, texture, aroma, taste and overall acceptability, and each panellist evaluated three samples. To prevent bias, each panellist received samples in a randomized order, which was done using a table of permutations. Water was used to rinse the mouth before and in between the testing of samples to get rid of previous tastes. The scores obtained from panellists were used to calculate the mean. Coding and a randomized table of numbers were used to assign a code to each sample, and panellists were seated apart to avoid bias. All participants were given a cup of mineral water, serviette, and samples to taste.
2.9. Alcohol Content Determination in the Samples
The alcohol content in fermented beverages was determined using a method outlined by [37]. In this method, 12 ml of each sample was distilled in round-bottom flasks, with the distillate collected into another round-bottom flask. The distillate was then transferred to clean 15 ml centrifuge tubes, and distilled water was added to reach the 12 ml mark. The ethanol content of the distillates was measured using an alcohol meter (Anton Paar DMA 35, Graz).
2.10. Data Analysis
The Statistical Package for Social Science (SPSS version 25.0 SPSS Inc., Chicago, IL, USA) was used to analyse data. Mean acceptability scores were computed. One-way analysis of variance (ANOVA) was conducted, and the mean separation was determined by the Fisher most minor significance difference (LSD) test (p < 0.05). The principal component analysis (PCA) determines the similarities and differences in the acceptability of provitamin A biofortified maize and marula-based beverages.
3. Results
3.1. Vitamin A Analysis of the Developed Beverages
The following table displays the results of the vitamin A analysis. According to Nuss and Tanumihardjo [38], a typical grain of Provitamin A contains between 7.30 and 8.30 µg/g DW. The results presented below were interpreted based on this reference to assess the sample's retention of vitamin A content.
Table 2.
vitamin A analysis.
| Test (Vitamin A (Retinol) |
Results [±Uncertainty] |
Units | Limits | LOQ |
|---|---|---|---|---|
| Sample 1 | < 50 | μg/100g | - | 50 |
| Sample 2 | < 50 | μg/100g | - | 50 |
| Sample 3 | < 50 | μg/100g | - | 50 |
3.2. Consumer Acceptability of the Fermented Non-Alcoholic Beverages Developed
The following table gives means scores for each of the samples tasted.
Table 3.
Sensory Acceptability Scores for developed beverages.
| Sample ID: | Colour | Taste | Aroma | Thickness | No Lumps | Overall |
|---|---|---|---|---|---|---|
| Ave/STDV | Ave/STDV | Ave/STDV | Ave/STDV | Ave/STDV | Ave/STDV | |
| 1 | 4.05±1.14a | 3.65±1.16a | 3.45±1.26a | 3.83±1.01a | 3.80±1.33a | 3.95±1.01a |
| 2 | 3.49±1.52a | 3.26±1.16a | 3.18±1.39a | 3.78±1.37a | 3.71±1.45a | 3.40±1.31a |
| 3 | 4.00±1.15a | 3.29±1.16a | 3.58±1.17a | 3.74±1.25a | 3.88±1.19a | 3.77±1.00a |
S1, S2, S3, *data reported as mean ± standard deviation * values with the same letter in a column are not statistically different (P < 0.05, letters were assigned in descending order in reference to the mean.3.3. Amino acid profile determination of fermented beverage.
Table 4.
Amino acids present in the three samples (mg/Kg).
| His |
Arg | Ser | Gly | Asp | Glu | Thr | Ala | Pro | Lys | Tyr | Met | Val | ILe | Leu | |
|---|---|---|---|---|---|---|---|---|---|---|---|---|---|---|---|
| Sample ID |
mg/Kg | mg/Kg | mg/Kg | mg/Kg | mg/Kg | mg/Kg | mg/Kg | mg/Kg | mg/Kg | mg/Kg | mg/Kg | mg/Kg | mg/Kg | mg/Kg | mg/Kg |
| 1 |
162,608 | 293,441 | 323,941 | 235,167 | 408,739 | 1446,506 | 219,815 | 589,229 | 777,83 | 203,747 | 361,566 | 92,373 | 291,309 | 242,616 | 1008,326 |
| 2 |
521,246 | 967,454 | 1213,703 | 736,675 | 1380,063 | 5312,344 | 835,091 | 2147,56 | 2462,819 | 504,686 | nd | 82,319 | 1093,02 | 901,447 | 3722,275 |
| 3 |
181,859 | 429,448 | 436,109 | 355,074 | 600,909 | 1934,364 | 331,016 | 817,788 | 1062,586 | 268,46 | 164,671 | nd | 398,461 | 332,799 | 1298,06 |
3.3. Minerals Profile Determination of Fermented Beverage
Table 5.
Mineral composition of the three samples.
| Sample ID |
LIMS No |
ADF | amm | Ash | Ca | Cu | Fat | Fe | K | K/Ca+Mg | lac |
| % | % | % | % | ppm | % | ppm | % | % | % | ||
| 1 | 31466 | 1.84±0.01a | 0.07±0.005a | 2.64±0.01a | 0.07±0.005a | 4±1.00b | 1.47±0.01a | 30±1.00b | 0.92±0.01a | 2.16±0.01a | 2.12±0.01a |
| 2 | 31467 | 2.08±0.01a | 0.07±0.005a | 2.18±0.01a | 0.05±0.005a | 3±1.00b | 2.93±0.01a | 53±1.00b | 0.62±0.01a | 2.13±0.01a | 1.82±0.01a |
| 3 | 31468 | 3.33±0.01a | 0.06±0.005a | 3.15±0.01a | 0.05±0.005a | 31±1.00b | 1.68±0.01a | 26±1.00b | 0.55±0.01a | 2.13±0.01a | 2.15±0.01a |
S1, S2, S3, *data reported as mean ± standard deviation * values with the same letter in a column are not statistically different (P < 0.05, letters were assigned in descending order in reference to the mean.
Table 6.
Mineral composition of the three samples.
| Sample ID |
LIMS No |
Mg | Mn | Moisture | Na | NDF | NPN | P | Protein | Starch | Zn |
| % | ppm | % | % | % | % | % | % | % | ppm | ||
| 1 | 31466 | 0.09±0.006a | 2±0.50b | 6.77±0.01a | 0.05±0.006a | 9.80±0.01a | 0.11±0.01a | 0.17±0.006a | 8.78±0.01a | 46.84±0.01a | 12±0.60b |
| 2 | 31467 | 0.06±0.006a | 1±0.006a | 5.50±0.01a | 0.04±0.006a | 10.66±0.01a | 0.10±0.01a | 0.13±0.006a | 9.52±0.01a | 44.79±0.01a | 9±0.58b |
| 3 | 31468 | 0.05±0.006a | 1±0.006a | 1.14±0.01a | 0.03±0.006a | 11.53±0.01a | 1.02±0.01a | 0.12±0.006a | 9.55±0.01a | 33.76± | 21±1.00b |
S1, S2, S3, *data reported as mean ± standard deviation * values with the same letter in a column are not statistically different (P < 0.05, letters were assigned in descending order in reference to the mea.
4. Discussion
Vitamin A is a fat-soluble vitamin received from the diet either as preformed vitamin A (primarily retinol and retinyl esters) in meals of animal origin or as provitamin A carotenoids in plant-based diets (EFSA, 2024). Each sample's result is indicated as "< 50 μg/100g." The Vitamin A concentration is below the test equipment's detection limit of 50 μg/100g. Although the maize used in the beverage was biofortified with provitamin A, the finished product has less than 50 μg of Vitamin A per 100g, making it inconsequential for meeting dietary Vitamin A needs. According to EFSA (2015) and EFSA (2024) Population Reference Intakes (PRIs), Vitamin A intake is set at 750 µg RE/day for men and 650 µg RE/day for women. From Table 1, the results show that all three samples had < 50 μg/100g, contributing very little toward meeting these daily recommendations. These findings indicate that, despite biofortification, the beverage's Vitamin A contribution is insignificant, and the anticipation that it will be a source of this vitamin has not been met [39]. The low Vitamin A content could be attributed to the heat in the beverage's preparation. Carotenoids, precursors to Vitamin A, are known to be heat sensitive, and high temperatures during preparation (e.g., boiling, pasteurization) can significantly degrade these molecules [40]. This is consistent with recent research demonstrating that heat processing of biofortified maize reduces provitamin A levels [41].
Another key factor that could have contributed to the low Vitamin A level is exposure to air and sunshine. Carotenoids oxidize when exposed to air, and light can hasten the deterioration process [42,43]. The decline in carotenoid levels during processing and storage can significantly impact the final Vitamin A content of the beverage, which could explain why all of the samples had levels lower than the LOQ. Fermentation can improve specific nutritional properties of maize, such as bioavailability and eliminating antinutritional components [44]. However, it may not prevent or increase provitamin A levels. In reality, research indicates that the fermentation process might cause carotenoids to degrade due to pH changes and the activity of particular bacteria, which has a detrimental influence on nutritional stability. For example, a study discovered that, while fermentation had little effect on provitamin A carotenoid preservation in foodstuffs such as maize and cassava, it might cause significant losses after processing. Fermentation before boiling reduced β-carotene levels, suggesting that it did not improve provitamin A retention in the final product [42]. Thus, while fermentation has advantages, it does not always improve the retention of provitamin A in maize-based beverages.
According to research, fermenting biofortified maize can significantly reduce total carotenoid concentration, with some studies indicating reductions of up to 63%. This shows that fermentation may deleteriously impact the retention of provitamin A in the final product [45]. While biofortification enhances the nutritional content of crops, the effectiveness of these crops in supplying Vitamin A post-processing is frequently lowered due to degradation during food production [46]. A study by De Moura, Miloff and Boy [42], a study on high β-carotene maize indicated that fermentation reduced β-carotene levels, showing that while there are some benefits, the overall preservation of provitamin A was not positively influenced by the fermentation process.
Studies have indicated that lower-temperature processing procedures can better maintain carotenoids than high-temperature methods, frequently resulting in severe nutritional degradation [46]. It is critical to limit oxygen exposure during processing since it can accelerate carotenoids' oxidation and degradation. Techniques restricting air contact have been shown to help preserve these nutrients [40]. Light-resistant packaging has been shown to improve the stability of carotenoids in various food products, enhancing the nutritional profile of the final product [47].
Table 4 above presents the amino acid analysis results for three developed product samples: Sample 1, Sample 2, and Sample 3, respectively. The analysis is provided in mg/kg for each amino acid. Essential amino acids are those that the human body cannot synthesise and must be received from the diet [48]. These are histidine, isoleucine, leucine, lysine, methionine, phenylalanine, threonine, tryptophan, and valine. The literature emphasizes these amino acids' role in various physiological processes. For example, Norton and Layman [49] reported that leucine regulates the translation initiation of protein synthesis in skeletal muscle after exercise, while methionine is a dietary necessary amino acid that has distinct roles in both protein structure and metabolism [50]. The lack or low content of critical amino acids, such as methionine in Sample 3 and tyrosine in Sample 2, can be attributed to the behaviour of some amino acids under heat and acidic pH. Amino acids behave differently under different conditions. For example, According to Ozols [51], when foods are processed, mainly heat processed, the side-chain amino group can react with other compounds, such as reducing sugars.
Sample 1 contains high levels of glutamic acid (1446.506 mg/kg), leucine (1008.326 mg/kg), proline (777.83 mg/kg), glycine (235.167 mg/kg), and aspartic acid (408.739 mg/kg). It contains lower levels of Methionine (92.373 mg/kg), Histidine (162.608 mg/kg), and Tyrosine (361.566 mg/kg). Most amino acids in this sample have moderate to high quantities, with exceptionally high levels of leucine and glutamic acid. High levels of essential amino acids such as leucine make sample 1 vital for dietary requirements. As reported in the literature [52,53], leucine is vital for protein metabolism in skeletal muscle. Similarly, Sample 2 shows higher levels of glutamic acid (5312.344 mg/kg), leucine (3722.275 mg/kg), proline (2462.819 mg/kg), glycine (736.675 mg/kg), and aspartic acid (1380.063 mg/kg). It possesses low quantities of methionine (82.319 mg/kg) and histidine (521.246 mg/kg), but no tyrosine was identified.
Compared to the other two samples, Sample 2 shows the most significant total amino acid contents of the three samples, particularly Glutamic Acid and Leucine. Sample 3 contains high levels of glutamic acid (1934.364 mg/kg), leucine (1298.06 mg/kg), proline (1062.586 mg/kg), glycine (355.074 mg/kg), and aspartic acid (600.909 mg/kg). It has low quantities of histidine (181.859 mg/kg) and tyrosine (164.671 mg/kg), but no methionine is identified. As reported above, the absence of some amino acids could be attributed to various factors, such as sample preparation and physiochemical characteristics of the samples [54]. The absence of Tyrosine in Sample 2 and Methionine in Sample 3 could be attributed to changes in product formulation. Glutamic Acid has the highest amino acid concentration in each sample, indicating its abundance in the product. Leucine and proline levels are relatively high across all samples. The amino acid profile of the product shows that high amounts of some amino acids, particularly glutamic acid and leucine, may provide distinct functional and nutritional properties. The variation in amino acid contents across the three samples could be attributed to factors such as fermentation time, physiochemical characteristics such as pH and the preparation method.
Indigestible fibre, also known as dietary fibre or roughage, is not digestible by the human body; however, it is essential for overall health maintenance. Research suggests that high-fibre, low-glycaemic index (GI) diets enhance glycaemic control and aid in managing body weight [55]. Moreover, a higher consumption of total dietary fibre, including insoluble fibre, is linked to a reduced risk of cardiovascular disease and coronary heart disease [56,57]. This is likely due to its positive effects on gut flora, body weight, and metabolic health. Additional health benefits of dietary fibre include a lower risk of cancer and improved intestinal health [58] another study found that dietary fibre consumption is linked to decreased incidence of coronary heart disease, stroke, and peripheral vascular disease [59]. Also, high fibre intake provides a protective relationship between dietary fibre intake and colon cancer incidence [59] Fiber promotes regular bowel movements and prevents constipation by adding bulk to the stool [60]. Additionally, fibre aids in weight management by increasing satiety and reducing total calorie intake. For diabetics, dietary fibre is beneficial for managing blood sugar levels [55], in diabetic patients is especially significant because viscous fibres provide the most health benefits associated with dietary fibre intake. These fibres' viscosity slows down nutrient digestion by inhibiting food movement through the intestinal lining. This reduced absorption helps lower blood sugar and insulin levels after meals, crucial for preventing and managing insulin resistance and type 2 diabetes. It also supports a healthy gut microbiome by serving as a prebiotic, promoting the growth of beneficial bacteria [61]. As illustrated in Table 3, the highest fibre content was found in Sample 3 (3.33%), indicating it has more indigestible fibre compared to Sample 1 (1.84%) and Sample 2 (2.08%).
The measurement of the anionic mineral mixture (amm) in the fermented food product, with concentrations of 0.07%, 0.07%, and 0.06%, demonstrates a consistent and well-controlled fermentation process. This consistency indicates that the conditions and quality of raw materials used in fermentation are stable, leading to predictable and uniform product properties. Anionic minerals play a crucial role in fermentation by maintaining pH balance and providing essential nutrients for microbial development, which are necessary for the process (Cariappa et al., 2022). Additionally, the consistent levels of these minerals enhance the product's nutritional value, ensuring it meets specific health benefits and consumer expectations. According to Nabrzyski [62], the interactions between minerals and certain anionic substances like ascorbic acid are crucial in influencing mineral absorption. The stable anionic mineral concentration also contributes to the fermented food's overall stability and shelf life, preventing spoilage and preserving quality. The similarity in anionic mineral mixture (amm) levels across all samples, with Samples 1 and 2 at 0.07% and Sample 3 slightly lower at 0.06%, underscores this consistency.
Ash (%) in food products is a crucial measure of mineral content and overall quality [63]. The ash content represents the inorganic residue remaining after the combustion of organic matter, providing an estimate of the total mineral content in the food. This measurement is important for nutritional labelling, quality control, and food standards and regulations compliance. According to Nabrzyski [62], high ash content can indicate the presence of essential minerals like calcium, magnesium, potassium, and sodium, which are vital for various bodily functions. However, excessive ash levels may also suggest contamination with undesirable substances. Therefore, monitoring ash content helps ensure that food products are both nutritious and safe for consumption, maintaining their quality and adherence to health standards. Ash content reflects the total mineral content. Sample 3 has the highest ash content (3.15%), followed by Sample 1 (2.64%) and Sample 2 (2.18%). This indicates that Sample 3 has a higher mineral composition.
Calcium content in food products is an essential indicator of their nutritional value and general health benefits [64]. Calcium is a crucial mineral because it is a significant component of hydroxyapatite (Ca10[PO4]6[OH]2), which is used to make bones and teeth. It also plays an important role in physiological processes such as vasodilation, muscular function, neuron transmission, and intracellular activity control. Furthermore, calcium aids bone growth, supporting the concept that enough calcium intake is required for overall health and well-being [65]. As depicted in Table 3, calcium content is slightly higher in Sample 1 (0.07%) compared to Samples 2 and 3 (both at 0.05%). Suggesting that sample 1 has slightly higher calcium benefits than the other sample. Calcium composition differences could be attributed to the methods used to prepare the samples. Monitoring calcium levels ensures that food products are both nutritious and advantageous to bone health and overall bodily functions, preserving product quality and conformity to health standards.
Copper (Cu) in food products indicates their trace mineral level and nutritional value. Cu is an essential trace element required for various body activities, including red blood cell creation, bone and connective tissue health, and immunological and neurological system function [66]. According to the National Institutes of Health, 2021, copper is an essential mineral that occurs naturally in some foods and is accessible as a dietary supplement. It plays an essential function in a variety of physiological processes. It is a cofactor for many enzymes called cuproenzymes, which are involved in energy production, iron metabolism, neuropeptide activation, connective tissue development, and neurotransmitter synthesis. Ceruloplasmin (CP), a significant cuproenzyme involved in iron metabolism, transports more than 95% of the copper in healthy human plasma. Copper also promotes angiogenesis, neurohormone balancing, gene expression regulation, brain development, pigmentation, and immune system function [67]. Copper deficiency can cause anaemia, hypopigmentation, hypercholesterolemia, connective tissue problems, osteoporosis and other bone deformities, incorrect lipid metabolism, ataxia, and an increased risk for infection [68,69,70]. Table 3 shows a significant variation in copper content. Sample 3 has a notably higher copper content (31 ppm) compared to Samples 1 (4 ppm) and 2 (3 ppm). The results show an adequate amount of copper in all three samples, suggesting that produced beverages can help mitigate challenges associated with copper deficiency.
A food product's fat level considerably impacts its nutritional profile, sensory properties, and overall quality [71]. The results show that Sample 2 has a higher fat content (2.93%), which is nearly double that of Sample 1 (1.47%) and higher than Sample 3 (1.68%). The increased fat level in Sample 2 can improve the product's flavour, mouthfeel, and texture. The fat-soluble vitamins A, D, E, and K, structurally related to partly cyclized isoprenoid polymers, are principally soluble in lipids or oils. Their absorption and transportation throughout the body are dependent on the presence of dietary fats in the intestine. These vitamins are kept in the liver and adipose tissue, and because of their lipophilicity, they are removed more slowly from the body. This emphasizes the importance of lipids in absorbing and adequately using these vitamins [72]. However, balancing fat content and health concerns is critical, as excessive fat consumption has been linked to various health problems. As a result, the higher fat content in Sample 2 indicates a more indulgent product, but it must be considered in the context of overall dietary balance and customer health expectations.
Iron is an important micronutrient in diet, as it is required for various physiological functions such as oxygen transport, energy metabolism, and DNA synthesis [73]. In the results, Sample 2 has the most significant iron level (53 ppm), which is much higher than Sample 1 (30 ppm) and Sample 3 (26 ppm). The increased iron level in Sample 2 may improve the product's nutritional value, especially for populations at risk of iron deficiency, such as children, pregnant women, and people with specific health conditions. This view is supported by a study by Jáuregui-Lobera [74] stating that adequate iron prevents anaemia, improves cognitive function, and sustains overall energy levels. Micronutrient deficiencies, particularly involving iodine and iron, are associated with various cognitive impairments and possible long-term behavioural changes. Furthermore, iron deficiency is linked to deficits in attention span, intelligence, sensory perception, and emotional and behavioural issues [75]. These challenges are often directly connected to iron deficiency anaemia, highlighting the critical role of iron in maintaining cognitive and behavioural health. The higher iron content of Sample 2 makes it a more appealing alternative for consumers seeking to increase their iron consumption through fermented non-alcoholic beverages. Overall, Sample 2's enhanced iron content improves its nutritional profile, making it an essential supplement to a balanced diet, particularly for people who require higher iron levels.
Potassium is a vital mineral and electrolyte that aids in fluid equilibrium, neuron function, and muscular contraction [76]. The results show that Sample 1 has the highest potassium level (0.92%) compared to the other two samples, followed by Sample 2 (0.62%) and Sample 3 (0.55%). Sample 1's higher potassium content increases its nutritional value, making it especially useful for cardiovascular health and blood pressure regulation. This is supported by the work of Castro and Raij [77]; potassium plays a crucial role in blood pressure regulation through various mechanisms, with increased chronic potassium intake providing significant benefits for maintaining healthy blood pressure levels. The enhanced potassium levels in Sample 1 can also help to minimize muscle cramps and improve general muscle function, which is critical for active people and sports. Potassium is vital for maintaining healthy blood pressure since it controls blood pressure through numerous processes and has considerable long-term advantages when ingested regularly [78]. Furthermore, potassium is necessary for normal renal function and acid-base equilibrium in the body. As a result, Sample 1's increased potassium content makes it a better choice for consumers looking to increase their potassium intake for improved health results. This differential makes Sample 1 a critical part of a balanced diet, especially for those who need to increase their potassium intake.
The potassium-to-calcium-plus-magnesium (K/Ca+Mg) ratio in a food product is an essential measure of mineral balance, which can affect both nutritional quality and physiological impacts [79]. The results show that samples 2 and 3 have similar K/Ca+Mg ratios of 2.13%, whereas Samples 1 has a slightly higher ratio of 2.16%. This ratio helps determine the relative abundance of potassium compared to calcium and magnesium, essential for numerous body activities. A higher K/Ca+Mg ratio, as seen in Sample 1, indicates a higher proportion of potassium compared to calcium and magnesium, which may be helpful in terms of cardiovascular health and fluid balance. Potassium balances the effects of sodium, but calcium and magnesium are essential for bone health and muscle function. Maintaining a proper balance of these minerals is critical for good health since imbalances can impair cardiovascular function, bone density, and general mineral homeostasis. Sample 1 has a slightly higher K/Ca+Mg ratio, indicating a better potassium balance with calcium and magnesium. This could provide further health benefits, notably regulating blood pressure and supporting metabolic activities. In a study by Fouhy, et al. [80], it was reported that the calcium-to-magnesium intake ratio (Ca:Mg) may be significant for bone health due to competitive absorption.
Lactose, a disaccharide sugar in products, substantially impacts food nutrition and functionality [81]. From Table 5, the results show that Sample 3 has the highest lactose level (2.15%), followed by Sample 1 (2.12%) and Sample 2 (1.82%). The difference could be attributed to the behaviour of Pichia sp. Under different conditions during fermentation. The increased lactose levels in Samples 3 and 1 can improve the product's sweetness, texture, and mouthfeel, increasing its overall sensory appeal. Lactose also serves as a fermentable carbohydrate for beneficial bacteria in the gut, which may improve digestive health and support a healthy microbiome. According to [82], lactose facilitates the growth of beneficial bacteria. The lactose level in dairy products is important in determining texture and consistency, especially in fermented products where lactose can affect fermentation dynamics and product quality. However, for people who are lactose intolerant, high lactose levels might cause pain or digestive problems. As a result, while the increased lactose content in Samples 3 and 1 may be advantageous for specific product characteristics and health advantages, it is critical to address the demands of consumers who want lactose-free choices.
Magnesium is an essential mineral that supports a variety of physiological processes, including muscle and neuron function, bone health, and energy metabolism. The results show that Sample 1 has the highest magnesium level at 0.09%, followed by Sample 2 at 0.06% and Sample 3 at 0.05%. Sample 1's higher magnesium concentration increases the product's nutritional value, making it a more beneficial source of this crucial mineral. De Baaij, et al. [83] states that Mg2+ is a key component of the RNA and DNA tertiary structures due to how it interacts with the negatively charged O and N molecules found in polynucleotide chains. Mg2+ plays a vital role in the cell's DNA repair mechanisms, which include nucleotide excision repair (NER), base excision repair (BER), and mismatch repair. Mg2+ serves as a cofactor for nearly every enzyme engaged in every step of the NER [83,84]. Adequate magnesium intake is also essential for bone health since it aids calcium absorption and mineralization. The higher magnesium level in Sample 1 indicates a possible benefit for customers wishing to increase their magnesium consumption, which can improve general health and well-being. However, the reduced magnesium levels in Samples 2 and 3 may provide less nutritional value. The diversity in magnesium concentration emphasizes the significance of mineral composition in food products and how it influences dietary recommendations and health consequences [85].
Manganese is an essential dietary element coenzyme in various biological processes. These processes include macronutrient metabolism, bone production, free radical defence, ammonia clearance, and neurotransmitter synthesis [86]. The results show that Sample 1 has the highest Mn level at 2 ppm, compared to 1 ppm in Samples 2 and 3. The increased manganese levels in Sample 1 improve its nutritional profile, as manganese is required for the action of various antioxidant-protecting enzymes, including superoxide dismutase. Manganese deficiency has been linked to the mitochondria's aberrant cell function and ultrastructure [87]. The higher manganese concentration in Sample 1 may provide additional health benefits compared to the lower amounts in Samples 2 and 3, making it a more appealing option for customers looking to increase their manganese intake. However, manganese intake must be balanced with other minerals, and excessive consumption is not recommended, as high levels can be harmful [88]. According to Mehta, et al. [89], inhaling a considerable amount of manganese dust or fumes may irritate the lungs, perhaps leading to pneumonia.
Moisture plays a vital role in food quality, preservation, and resistance to deterioration [90]. The results show that Sample 1 has the highest moisture content at 6.77%, followed by Sample 2 at 5.50% and Sample 3 at 1.14%. Sample 1's higher moisture content can lead to a softer texture and more pleasant mouthfeel, potentially increasing consumer satisfaction. Moisture is also important in maintaining freshness and preventing deterioration by inhibiting microbial growth. However, excessive moisture can reduce shelf life and raise the danger of microbiological contamination. On the other hand, Sample 3's extremely low moisture level implies a drier product, which may result in a more brittle texture and a longer shelf life due to less microbial activity. Effective moisture management is vital for maintaining the quality and prolonging the shelf life of foods [91].
Sodium is an essential mineral in food items influencing flavour, preservation, and total nutritional value (He and MacGregor, 2003). The results show that Sample 1 has the greatest salt concentration (0.05%), followed by Sample 2 (0.04%) and Sample 3 (0.03%). Historically, salt (sodium chloride) has been regarded as a food preservative that promotes human health by inhibiting or eliminating foodborne pathogens and spoilage microorganisms. However, in recent years, the rising consumption of processed foods with high sodium content has shifted the perception of dietary salt, leading some to view it as a possible health risk [92]. As a result, while increasing salt content can improve flavour and preservation, sodium levels must be managed to ensure compliance with dietary requirements and health recommendations. Samples 2 and 3's decreased salt level may appeal to health-conscious consumers looking to limit their sodium intake, indicating a trend toward healthier, lower-sodium food options.
Neutral Detergent Fiber (NDF) is an essential metric in food items that determines the amount of cell wall components such as hemicellulose, cellulose, and lignin [93]. The results show that Sample 3 has the highest NDF at 11.53%, followed by Sample 2 at 10.66% and Sample 1 with the lowest NDF at 9.80%. A higher NDF concentration suggests that the food has more dietary fibre, which can improve digestive health and promote satiety. Fibre from NDF components helps regulate bowel motions, lower cholesterol, and manage blood sugar levels. However, excessive NDF might change the product's texture, making it more fibrous or less appetizing. The difference in NDF content among samples demonstrates its influence on the food's functional qualities and nutritional advantages [94].
NPN impacts fermented foods' flavour, nutritional content, and quality, often signalling protein breakdown and maturation [95]. Non-protein nitrogen consists of molecules such as urea, creatinine, nucleotides, free and peptides. The results show that Sample 3 has a much greater NPN content (1.02%) than Samples 1 and 2, which have 0.11% and 0.10%, respectively. Elevated NPN levels in Sample 3 indicate a higher concentration of these non-protein nitrogenous chemicals.
Phosphorus is an essential nutrient that regulates energy metabolism, bone mineralization, and cellular signalling. Its presence is especially significant for bone health because it modulates the link between dairy product consumption and bone mineral density [96]. The results show that Sample 1 has the highest phosphorus concentration at 0.17%, followed by Sample 2 at 0.13% and Sample 3 with the lowest at 0.12%. Sample 1's higher phosphorus content increases its nutritional value since phosphorus is required to construct and maintain healthy bones and teeth and for energy transmission inside cells. Furthermore, phosphorus creates nucleic acids and phospholipids essential for cell structure and function. Higher phosphorus levels in Sample 1 may benefit people looking to improve bone health or metabolic function. However, balancing phosphorus intake with calcium levels is critical since an imbalance can harm bone health and other physiological functions. Thus, Monitoring phosphorus content is crucial for ensuring dietary adequacy and preserving general health [97].
Proteins provide the nitrogen and amino acids required for tissue growth and maintenance. It is an essential component of enzymes, hormones, cell membranes, and transport proteins, which aid in transporting other metabolites around the body [98]. The results in Table 3 show that the protein level of the samples is very similar, with Sample 3 having the highest protein content at 9.55%, followed by Sample 2 at 9.52% and Sample 1 at 8.78%. The high protein levels in Samples 2 and 3 indicate a solid nutritional profile, providing sufficient protein to meet dietary requirements. Protein content is critical for muscle maintenance, hormone production, and general metabolic function. The modest differences in protein content among the samples indicate that, while all three supply significant protein, Sample 3 has a significantly higher protein level, which may provide somewhat better nutritional benefits. However, the minor variances may not affect the product's overall health advantages. Consistent protein levels across samples emphasize their significance in contributing to daily protein requirements, making them excellent for consumers wishing to increase their protein intake [99].
Starch is a major carbohydrate in many dietary products and is a primary energy source National Health Service (NHS) [100]. The analysis indicates that Sample 1 has the highest starch content at 46.84%, followed by Sample 2 at 44.79% and Sample 3 at 33.76%. The elevated starch level in Sample 1 suggests an excellent carbohydrate supply, which can enhance energy levels and promote satiety. Starch is vital for providing glucose, which is necessary for maintaining both physical and cognitive functions. Therefore, Sample 1's higher starch content may particularly benefit individuals with increased energy needs, such as athletes. Conversely, Sample 3's lower starch content may reduce energy contribution, making it more suitable for those monitoring their carbohydrate intake or seeking lower-calorie options. The variation in starch levels among the samples highlights its influence on the energy density of the product, suggesting that adjustments in starch content can tailor the product to meet diverse dietary requirements and consumer preferences.
Zinc is an essential trace mineral in various physiological processes, including supporting the immune system [101], protein synthesis, wound healing, and cellular metabolism. The analysis reveals that Sample 3 has the highest zinc concentration at 21 ppm, followed by Sample 1 at 12 ppm and Sample 2 at 9 ppm. The increased zinc levels in Sample 3 enhance its nutritional profile, making it a more significant contributor to daily zinc requirements. Adequate zinc intake is vital for maintaining normal immune function and reducing the risk of infections [102]. Additionally, zinc is necessary for enzyme activity, taste perception, and DNA synthesis. Therefore, the higher zinc content in Sample 3 may be particularly beneficial for individuals needing to boost their zinc intake for optimal health. In contrast, the lower zinc levels in Samples 1 and 2 may offer less nutritional benefit regarding zinc but can still contribute to overall dietary intake. The differences in zinc content among samples highlight the importance of this mineral in food products and the necessity of ensuring adequate dietary zinc levels to support various bodily functions and overall health [103,104].
Consuming yellow maize, abundant in provitamin A carotenoids presents a potentially cost-effective method for preventing and/or alleviating vitamin A deficiency in vulnerable populations within developing countries. However, this crop faces low popularity among consumers in southern Africa. This reluctance may be attributed to the negative association between yellow maize and unacceptable organoleptic characteristics, possibly stemming from the mishandling of food aid and resulting in the perception that it is unsuitable for human consumption [96,105]. In comparison to Samples 2, whose maize was fermented, powdered, and then cooked, and 3, whose maize was cooked, milled, and fermented, Sample 1, whose corn was roasted, has the highest mean colour rating (4.05) in Table 4 above, suggesting a more favourable collar perception. Sample 2 may be viewed as less visually appealing because it has the lowest mean colour rating (3.49). The processing techniques used to prepare maize affect how the finished product is perceived to be coloured. Roasting enhances the perception of colour, whereas the amalgamation of fermentation, powdering, and heating can yield a less visually pleasing product. These results might affect consumer preferences and direct future investigations into how to prepare maize products to improve their aesthetic appeal.
Moreover, there are a few reasons why Sample 1, which was roasted before being ground with marula, had a higher flavour rating. According to Agume Ntso, et al. [106], roasting is a popular culinary technique that improves the flavour profile of various products, including grains like maize. Roasting produces complex and attractive Flavors because heat triggers Maillard browning reactions [107]. This was also confirmed by focus group discussions where participants described this beverage as having a buttery, nutty taste and flavour. Furthermore, adding marula to the grinding process could add distinct and pleasing Flavors to the finished product. Sample 1's flavour profile was probably more complex and acceptable than the other samples because of the roasting and milling process with marula. This result is consistent with previous research highlighting the beneficial effects of roasting and adding flavour-enhancing ingredients on food products taste [106]. Sample 1 may have tasted better because of the precise specifics of the roasting process and the addition of marula, which may have affected the sensory qualities.
Sample 1, which was roasted before grinding with marula, received the highest mean rating (3.83) for thickness/texture. By altering their structure and dissolving some of their constituent parts, roasting can affect the texture of grains and possibly produce a more gratifying mouthfeel [108]. The marula may be added during milling, resulting in a smoother texture. Sample 2, which involved cooking, grinding with marula, and fermentation, scored somewhat higher (3.78) than Sample 1, but still indicated a decent texture. The overall texture profile may have been altered by the combination of cooking and marula milling and by variations in texture brought about by the fermentation process. Sample 3, which included cooking after fermentation and grinding, was rated 3.74 on a mean scale, indicating a moderate degree of thickness and texture.
Finally, Sample 1 had the highest mean rating for smooth consistency (3.80) when it came to the lack of lumps. This could be attributed to including marula throughout the milling and roasting processes [109]. The mean ratings for Samples 2 and 3 were marginally lower (3.71 and 3.88, respectively), suggesting similar textures but marginally less smooth. Compared to Sample 1, these samples' consistency may have been somewhat less uniform because of texture variances brought about by fermentation and extra cooking procedures. Sample 1 is considered the most favourable in all aspects, as evidenced by its highest overall mean rating of 3.95. Compared to the previous samples, Sample 2 has the lowest overall mean rating (3.40), suggesting it may not be as well-liked. Sample 3 has an overall mean rating of 3.77 and is in the middle. In conclusion, Sample 1 is the one people perceive the best overall, especially regarding colour, taste, scent, and overall impression. Sample 3 lies in the middle but is generally closer to the positive side, whereas Sample 2 tends to have lower ratings across most categories.
Standards for alcohol content in non-alcoholic beverages adapted from [110]. The alcohol content of the new product, which is labelled as non-alcoholic, was determined using an alcohol meter (Anton Paar DMA 35, Graz), and no measurable alcohol was found in the sample. The product meets South African rules, which allow for a maximum alcohol concentration of ≤0.5% in non-alcoholic beverages. The absence of measurable alcohol concentration demonstrates that the product is non-alcoholic and meets accepted criteria.
5. Conclusions
This study demonstrates the potential of developing innovative non-alcoholic fermented beverages using Sclerocarya birrea (Marula) and Provitamin A biofortified maize to address food and nutrition security in KwaZulu-Natal, South Africa. Recipe development was conducted, and a complete product was formulated. Nutritional analysis reveals that these beverages can significantly improve the nutritional profile, particularly by increasing essential minerals such as zinc, iron, and copper and providing a variety of amino acids. However, the expected benefit of biofortified maize for Vitamin A enrichment was not fully realized, likely due to heat degradation and oxidation during processing. Sensory evaluations showed that roasting enhanced the beverages' flavour, texture, and overall acceptability. While the beverages were well-received by consumers, variations in nutrient content across samples highlight the importance of optimizing preparation methods to maximize health benefits. To address nutrient deficiencies, commercialize these beverages with improved formulations that target essential nutrient enrichment, such as fortifying with additional vitamins or minerals. Alternative fermentation techniques that limit heat exposure and oxygen contact should be explored to enhance nutrient retention. Microbial Analysis and Probiotic Potential are recommended to identify beneficial strains and to assess their probiotic activity. This could enhance the beverages' functionality as health-promoting products, which will be addressed in the next chapter.
Author Contributions
Conceptualization, N.D.D.; U.K.; M.S. and N.G.D.; formal analysis, N.D.D and N.G.D.; investigation, N.D.D. and N.G.D.; supervision, U.K. and M.S.; writing—original draft, N.N.D. writing—review and editing, N.G.D. All authors have read and agreed to the published version of the manuscript.
Data Availability Statement
The data will be made available upon request.
Acknowledgments
Nothando Delight Dlamini would like to acknowledge the Council for Scientific and Industrial Research (CSIR, South Africa) for financial assistance through a Doctoral bursary.
Conflicts of Interest
The authors declare no conflicts of interest.
Ethical clearance
Ethical clearance was obtained from the Biomedical Research Ethics Committee at the University of KwaZulu-Natal under the ethical clearance number BREC/00003554/2021.
References
- French, S.A.; Tangney, C.C.; Crane, M.M.; Wang, Y.; Appelhans, B.M. Nutrition quality of food purchases varies by household income: the SHoPPER study. BMC public health 2019, 19, 1–7. [Google Scholar] [CrossRef]
- Bader-Ul-Ain, H.; Abbas, M.; Saeed, F.; Khalid, S.; Suleria, H.A.R. Functional nonalcoholic beverages: A global trend toward a healthy life. In Non-Alcoholic Beverages, Elsevier: 2019; pp. 73-105.
- Granato, D.; Branco, G.F.; Nazzaro, F.; Cruz, A.G.; Faria, J.A. Functional foods and nondairy probiotic food development: trends, concepts, and products. Comprehensive reviews in food science and food safety 2010, 9, 292–302. [Google Scholar] [CrossRef]
- Nazir, M.; Arif, S.; Khan, R.S.; Nazir, W.; Khalid, N.; Maqsood, S. Opportunities and challenges for functional and medicinal beverages: Current and future trends. Trends in Food Science & Technology 2019, 88, 513–526. [Google Scholar]
- Takaidza, S. Indigenous South African Food: Nutrition and Health Benefits. 2023.
- Sileshi, G.W.; Dagar, J.C.; Akinnifesi, F.K.; Mng’omba, S.A. Potentials of Indigenous Fruit Trees in Enhancing Nutrition, Income and Biodiversity Conservation in African Agroforestry. In Agroforestry for Sustainable Intensification of Agriculture in Asia and Africa, Springer: 2023; pp. 321-361.
- Msangi, J.P.; Msangi, J.P. Indigenous plant resources and food security among small-scale agricultural producers: Southern Africa. Food Security Among Small-Scale Agricultural Producers in Southern Africa 2014, 75-104.
- Dorothy, M.Z.; Suinyuy, T.N.; Lubaale, J.; Peter, B.O. Physicochemical properties and antioxidant activities of marula fruit (Sclerocarya birrea subsp. Caffra) steamed and boiled before juice extraction. Food Science & Nutrition 2023, 11, 4607–4615. [Google Scholar]
- Mokoena, D.Z.; Suinyuy, T.N.; Lubaale, J.; Peter, B.O. Physicochemical properties and antioxidant activities of marula fruit (Sclerocarya birrea subsp. Caffra) steamed and boiled before juice extraction. Food Science & Nutrition 2023, 11, 4607–4615. [Google Scholar] [CrossRef]
- Nwonwu, F.O. The socio-economic and economic relevance of the Marula tree and its sustainable use in South Africa. Africa Insight 2006, 36, 249–265. [Google Scholar]
- Murye, A.F.; Pelser, A.J. Commercial harvesting of marula (Sclerocarya birrea) in Swaziland: A quest for sustainability. In Selected Studies in Biodiversity, IntechOpen: 2018.
- Maluleke, E. CHARACTERISATION OF THE MICROORGANISMS AND DETERMINATION OF THE CHEMICAL CONSTITUENTS OF MARULA BREWS DURING FERMENTATION. University of Limpopo, Limpopo, 2019.
- Ndlovu, P.F. The development of indigenous marula (sclerocarya birrea) fruit leather: effect of drying temperature and sugar concentration on the drying characteristics, physico-chemical and consumer sensory properties of marula fruit leathers. 2016.
- Rampedi, I.T. Indigenous plants in the Limpopo Province: Potential for their commercial beverage production. University of South Africa Pretoria, 2010.
- Awobusuyi, T.D. Quality and storage stability of provitamin A biofortified amahewu, a non-alcoholic cereal beverage. 2015.
- Khush, G.S.; Lee, S.; Cho, J.-I.; Jeon, J.-S. Biofortification of crops for reducing malnutrition. Plant biotechnology reports 2012, 6, 195–202. [Google Scholar] [CrossRef]
- Zuma, M.K.; Kolanisi, U.; Modi, A.T. The potential of integrating provitamin A-biofortified maize in smallholder farming systems to reduce malnourishment in South Africa. International journal of environmental research and public health 2018, 15, 805. [Google Scholar] [CrossRef]
- Razzaq, A.; Tang, Y.; Qing, P. Towards sustainable diets: Understanding the cognitive mechanism of consumer acceptance of biofortified foods and the role of nutrition information. International Journal of Environmental Research and Public Health 2021, 18, 1175. [Google Scholar] [CrossRef] [PubMed]
- Stevens, R.; Winter-Nelson, A. Consumer acceptance of provitamin A-biofortified maize in Maputo, Mozambique. Food Policy 2008, 33, 341–351. [Google Scholar] [CrossRef]
- Ndwandwe, N.K. Sensory quality of provitamin A biofortified maize-based foods and the effect of a provitamin A biofortified maize awareness campaign on their acceptance in KwaZulu-Natal, South Africa. 2018.
- Awobusuyi, T.D.; Siwela, M.; Kolanisi, U.; Amonsou, E.O. Provitamin A retention and sensory acceptability of amahewu, a non-alcoholic cereal-based beverage made with provitamin A-biofortified maize. Journal of the Science of Food and Agriculture 2016, 96, 1356–1361. [Google Scholar] [CrossRef] [PubMed]
- De Groote, H.; Kimenju, S.C. Comparing consumer preferences for color and nutritional quality in maize: Application of a semi-double-bound logistic model on urban consumers in Kenya. Food policy 2008, 33, 362–370. [Google Scholar] [CrossRef]
- Pillay, K.; Siwela, M.; Derera, J.; Veldman, F.J. Provitamin A carotenoids in biofortified maize and their retention during processing and preparation of South African maize foods. Journal of food science and technology 2014, 51, 634–644. [Google Scholar] [CrossRef] [PubMed]
- Tangyu, M.; Muller, J.; Bolten, C.J.; Wittmann, C. Fermentation of plant-based milk alternatives for improved flavour and nutritional value. Applied microbiology and biotechnology 2019, 103, 9263–9275. [Google Scholar] [CrossRef] [PubMed]
- Ravyts, F.; Vuyst, L.D.; Leroy, F. Bacterial diversity and functionalities in food fermentations. Engineering in Life Sciences 2012, 12, 356–367. [Google Scholar] [CrossRef]
- Khaleghi, M.K.; Savizi, I.S.P.; Lewis, N.E.; Shojaosadati, S.A. Synergisms of machine learning and constraint-based modeling of metabolism for analysis and optimization of fermentation parameters. Biotechnology Journal 2021, 16, 2100212. [Google Scholar] [CrossRef]
- Fandos, C.; Flavian, C. Intrinsic and extrinsic quality attributes, loyalty and buying intention: an analysis for a PDO product. British food journal 2006. [Google Scholar] [CrossRef]
- Granato, D.; Branco, G.F.; Cruz, A.G.; Faria, J.d.A.F.; Shah, N.P. Probiotic dairy products as functional foods. Comprehensive reviews in food science and food safety 2010, 9, 455–470. [Google Scholar] [CrossRef]
- Pillay, K.; Derera, J.; Siwela, M.; Veldman, F. Consumer acceptance of yellow, provitamin A-biofortified maize in KwaZulu-Natal. South African Journal of Clinical Nutrition 2011, 24, 186–191. [Google Scholar] [CrossRef]
- Oyeyinka, A.T.; Pillay, K.; Siwela, M. Full title- In vitro digestibility, amino acid profile and antioxidant activity of cooked Bambara groundnut grain. Food Bioscience 2019, 31, 100428. [Google Scholar] [CrossRef]
- Horwitz, W.; Latimer, G. AOAC International: Gaithersburg. MD, USA 2005, 18. [Google Scholar]
- Thiex, N.J.; Anderson, S.; Gildemeister, B.; F, C.A.W.B.J.B.E.C.R.C.K.D.A.F.E.G.M.H.P.K.T.M.J.l.J.R.R.R.M.S. Crude fat, diethyl ether extraction, in feed, cereal grain, and forage (Randall/Soxtec/submersion method): collaborative study. Journal of AOAC International 2003, 86, 888–898. [Google Scholar] [CrossRef] [PubMed]
- Tsomele, G.F.; Meiring, B.; Anyasi, T.A.; Mlambo, V.; Amonsou, E.; Lepule, S.P.; Siwela, M.; Wokadala, O.C. Influence of amino acid profile and secondary structure on nutritional and functional properties of Trichilia emetica and Trichilia dregeana protein concentrates. International Journal of Food Science & Technology 2023, 58, 5489–5500. [Google Scholar]
- Curtis, P.C. Chapter 12: Untrained sensory panels. Kerth, C., Ed. The science of meat quality, Wiley online library: 2013. [CrossRef]
- Qahtan, S.; Alsattar, H.A.; Zaidan, A.A.; Deveci, M.; Pamucar, D.; Martinez, L. A comparative study of evaluating and benchmarking sign language recognition system-based wearable sensory devices using a single fuzzy set. Knowledge-Based Systems 2023, 269, 110519. [Google Scholar] [CrossRef]
- Vargas, H.C.; Aggabao, C.M. Organoleptic Evaluation of Mixed Powdered Cotton Fruit (Sandoricum Koetjape) and Rattan Fruit (Calamus Manillensis) as Souring Agent. 2023.
- Ngwenya, M.; Nkambule, T.; Kidane, S. Physicochemical Attributes and Acceptability of Marula Wine Fermented with Natural Lactobacillus Plantarum and Saccharomyces Cerevisiae. Available at SSRN 4408467 2023. [Google Scholar]
- Nuss, E.T.; Tanumihardjo, S.A. Maize: a paramount staple crop in the context of global nutrition. Comprehensive reviews in food science and food safety 2010, 9, 417–436. [Google Scholar] [CrossRef]
- Huang, Z.; Liu, Y.; Qi, G.; Brand, D.; Zheng, S.G. Role of vitamin A in the immune system. Journal of clinical medicine 2018, 7, 258. [Google Scholar] [CrossRef]
- Rodriguez-Amaya, D.B. Carotenoids and food preparation: the retention of provitamin A carotenoids in prepared, processed and stored foods; Citeseer: 1997.
- Bechoff, A. Investigating carotenoid loss after drying and storage of orange-fleshed sweet potato. University of Greenwich, 2010.
- De Moura, F.F.; Miloff, A.; Boy, E. Retention of provitamin A carotenoids in staple crops targeted for biofortification in Africa: cassava, maize and sweet potato. Critical reviews in food science and nutrition 2015, 55, 1246–1269. [Google Scholar] [CrossRef]
- Allwood, M. The influence of light on vitamin A degradation during administration. Clinical Nutrition 1982, 1, 63–70. [Google Scholar] [CrossRef]
- Ejigui, J.; Savoie, L.; Marin, J.; Desrosiers, T. Beneficial changes and drawbacks of a traditional fermentation process on chemical composition and antinutritional factors of yellow maize (Zea mays). Journal of Biological Sciences 2005, 5, 590–596. [Google Scholar]
- Ortiz, D.; Nkhata, S.G.; Rocheford, T.; Ferruzzi, M.G. Steeping of biofortified orange maize genotypes for Ogi production modifies pasting properties and carotenoid stability. Agronomy 2019, 9, 771. [Google Scholar] [CrossRef]
- Huey, S.L.; Konieczynski, E.M.; Mehta, N.H.; Krisher, J.T.; Bhargava, A.; Friesen, V.M.; Mbuya, M.N.; Monterrosa, E.C.; Nyangaresi, A.M.; Mehta, S. A systematic review of the impacts of post-harvest handling on provitamin A, iron and zinc retention in seven biofortified crops. Nature Food 2023, 4, 978–985. [Google Scholar] [CrossRef] [PubMed]
- Lee, S.; Choi, Y.; Jeong, H.S.; Lee, J.; Sung, J. Effect of different cooking methods on the content of vitamins and true retention in selected vegetables. Food science and biotechnology 2018, 27, 333–342. [Google Scholar] [PubMed]
- Brestenský, M.; Nitrayová, S.; Patráš, P.; Nitray, J. Dietary requirements for proteins and amino acids in human nutrition. Current Nutrition & Food Science 2019, 15, 638–645. [Google Scholar]
- Norton, L.E.; Layman, D.K. Leucine regulates translation initiation of protein synthesis in skeletal muscle after exercise. The Journal of nutrition 2006, 136, 533S–537S. [Google Scholar] [CrossRef] [PubMed]
- Brosnan, J.T.; Brosnan, M.E.; Bertolo, R.F.; Brunton, J.A. Methionine: a metabolically unique amino acid. Livestock Science 2007, 112, 2–7. [Google Scholar] [CrossRef]
- Ozols, J. [44] Amino acid analysis. In Methods in enzymology, Elsevier: 1990; Vol. 182, pp. 587-601.
- Garlick, P.J. The role of leucine in the regulation of protein metabolism. The Journal of nutrition 2005, 135, 1553S–1556S. [Google Scholar] [CrossRef]
- Pasiakos, S.M.; McClung, H.L.; McClung, J.P.; Margolis, L.M.; Andersen, N.E.; Cloutier, G.J.; Pikosky, M.A.; Rood, J.C.; Fielding, R.A.; Young, A.J. Leucine-enriched essential amino acid supplementation during moderate steady state exercise enhances postexercise muscle protein synthesis. The American journal of clinical nutrition 2011, 94, 809–818. [Google Scholar] [CrossRef]
- Tripathy, D.B.; Mishra, A.; Clark, J.; Farmer, T. Synthesis, chemistry, physicochemical properties and industrial applications of amino acid surfactants: A review. Comptes Rendus. Chimie 2018, 21, 112–130. [Google Scholar] [CrossRef]
- Kendall, C.W.; Esfahani, A.; Jenkins, D.J. The link between dietary fibre and human health. Food hydrocolloids 2010, 24, 42–48. [Google Scholar] [CrossRef]
- Threapleton, D.E.; Greenwood, D.C.; Evans, C.E.; Cleghorn, C.L.; Nykjaer, C.; Woodhead, C.; Cade, J.E.; Gale, C.P.; Burley, V.J. Dietary fibre intake and risk of cardiovascular disease: systematic review and meta-analysis. Bmj 2013, 347. [Google Scholar] [CrossRef]
- Liu, S.; Buring, J.E.; Sesso, H.D.; Rimm, E.B.; Willett, W.C.; Manson, J.E. A prospective study of dietary fiber intake and risk of cardiovascular disease among women. Journal of the American College of Cardiology 2002, 39, 49–56. [Google Scholar] [CrossRef]
- Barber, T.M.; Kabisch, S.; Pfeiffer, A.F.; Weickert, M.O. The health benefits of dietary fibre. Nutrients 2020, 12, 3209. [Google Scholar] [CrossRef] [PubMed]
- Ötles, S.; Ozgoz, S. Health effects of dietary fiber. Acta scientiarum polonorum Technologia alimentaria 2014, 13, 191–202. [Google Scholar] [CrossRef] [PubMed]
- McRorie Jr, J.W. Evidence-based approach to fiber supplements and clinically meaningful health benefits, part 1: What to look for and how to recommend an effective fiber therapy. Nutrition today 2015, 50, 82–89. [Google Scholar] [CrossRef] [PubMed]
- Holscher, H.D. Dietary fiber and prebiotics and the gastrointestinal microbiota. Gut microbes 2017, 8, 172–184. [Google Scholar] [CrossRef]
- Nabrzyski, M. Functional role of some minerals in foods. In Mineral components in foods, CRC Press: 2006; pp. 123-161.
- Marshall, M.R. Ash analysis. Food analysis 2010, 4, 105–116. [Google Scholar]
- Heaney, R.P. Calcium, dairy products and osteoporosis. Journal of the American college of nutrition 2000, 19, 83S–99S. [Google Scholar] [CrossRef]
- Ross, A.C.; Taylor, C.L.; Yaktine, A.L.; Del Valle, H.B. Overview of calcium. In Dietary reference intakes for calcium and vitamin D, National Academies Press (US): 2011.
- Tapiero, H.; Townsend, D.á.; Tew, K. Trace elements in human physiology and pathology. Copper. Biomedicine & pharmacotherapy 2003, 57, 386–398. [Google Scholar]
- NIFH. Copper-Fact Sheet for Health Professionals. NIFH [elektroninis išteklius] 2021.
- Ross, A.C.; Caballero, B.; Cousins, R.J.; Tucker, K.L. Modern nutrition in health and disease; Jones & Bartlett Learning: 2020.
- Fairweather-Tait, S.J.; Harvey, L.J.; Collings, R. Risk–benefit analysis of mineral intakes: Case studies on copper and iron. Proceedings of the Nutrition Society 2011, 70, 1–9. [Google Scholar] [CrossRef]
- Prohaska, J.R. Impact of copper deficiency in humans. Annals of the New York Academy of Sciences 2014, 1314, 1–5. [Google Scholar] [CrossRef] [PubMed]
- Vieira, S.A.; McClements, D.J.; Decker, E.A. Challenges of utilizing healthy fats in foods. Advances in Nutrition 2015, 6, 309S–317S. [Google Scholar] [CrossRef]
- Ravisankar, P.; Reddy, A.A.; Nagalakshmi, B.; Koushik, O.S.; Kumar, B.V.; Anvith, P.S. The comprehensive review on fat soluble vitamins. IOSR Journal of Pharmacy 2015, 5, 12–28. [Google Scholar]
- Beard, J.L. Iron biology in immune function, muscle metabolism and neuronal functioning. The Journal of nutrition 2001, 131, 568S–580S. [Google Scholar] [CrossRef]
- Jáuregui-Lobera, I. Iron deficiency and cognitive functions. Neuropsychiatric disease and treatment 2014, 2087–2095. [Google Scholar] [CrossRef] [PubMed]
- Pivina, L.; Semenova, Y.; Doşa, M.D.; Dauletyarova, M.; Bjørklund, G. Iron deficiency, cognitive functions, and neurobehavioral disorders in children. Journal of Molecular Neuroscience 2019, 68, 1–10. [Google Scholar] [CrossRef]
- Kinabo, J.; SALAAM, D. Role of potassium in human and animal nutrition. In Proceedings of First National Potash Symposium Dares Salaam.
- Castro, H.; Raij, L. Potassium in hypertension and cardiovascular disease. In Proceedings of Seminars in nephrology; pp. 277-289.
- Bhor, R.J.; Damdhar, H.; Kokate, G.; Salve, M.; Andhale, S. An Overview on Cause of Muscles Cramps or Leg spasms; Types of Muscle Cramps and its Pharmacological Treatment by New Drugs. Research Journal of Pharmacology and Pharmacodynamics 2016, 8, 134–140. [Google Scholar] [CrossRef]
- Allahdadi, I. Impact de niveaux élevés de résidus de désencrage sur le rendement, la fixation symbiotique de l'azote et la nutrition minérale de quatre légumineuses fourragères; National Library of Canada= Bibliothèque nationale du Canada, Ottawa: 2001.
- Fouhy, L.E.; Mangano, K.M.; Zhang, X.; Hughes, B.D.; Tucker, K.L.; Noel, S.E. Association between a calcium-to-magnesium ratio and osteoporosis among Puerto Rican adults. The Journal of Nutrition 2023, 153, 2642–2650. [Google Scholar] [CrossRef] [PubMed]
- Schaafsma, G. Lactose and lactose derivatives as bioactive ingredients in human nutrition. International Dairy Journal 2008, 18, 458–465. [Google Scholar] [CrossRef]
- Aslam, H.; Marx, W.; Rocks, T.; Loughman, A.; Chandrasekaran, V.; Ruusunen, A.; Dawson, S.L.; West, M.; Mullarkey, E.; Pasco, J.A. The effects of dairy and dairy derivatives on the gut microbiota: A systematic literature review. Gut microbes 2020, 12, 1799533. [Google Scholar] [CrossRef]
- De Baaij, J.H.; Hoenderop, J.G.; Bindels, R.J. Magnesium in man: implications for health and disease. Physiological reviews 2015. [Google Scholar] [CrossRef]
- Calsou, P.; Salles, B. Properties of damage-dependent DNA incision by nucleotide excision repair in human cell-free extracts. Nucleic acids research 1994, 22, 4937–4942. [Google Scholar] [CrossRef] [PubMed]
- Mohamed, D.I.; Abo Nahas, H.H.; Elshaer, A.M.; El-Waseef, D.A.E.-D.A.; El-Kharashi, O.A.; Mohamed, S.M.; Sabry, Y.G.; Almaimani, R.A.; Almasmoum, H.A.; Altamimi, A.S. Unveiling the interplay between NSAID-induced dysbiosis and autoimmune liver disease in children: insights into the hidden gateway to autism spectrum disorders. Evidence from ex vivo, in vivo, and clinical studies. Frontiers in Cellular Neuroscience 2023, 17, 1268126. [Google Scholar] [CrossRef]
- Erikson, K.M.; Aschner, M. Manganese: its role in disease and health. Met. Ions Life Sci 2019, 19, 253–266. [Google Scholar]
- Tuormaa, T.E. The adverse effects of manganese deficiency on reproduction and health: A literature review. cell 1996, 2, 7. [Google Scholar]
- Bowman, A.B.; Kwakye, G.F.; Hernández, E.H.; Aschner, M. Role of manganese in neurodegenerative diseases. Journal of trace elements in medicine and biology 2011, 25, 191–203. [Google Scholar] [CrossRef] [PubMed]
- Mehta, P.; Antao, V.; Kaye, W.; Sanchez, M.; Williamson, D.; Bryan, L.; Muravov, O.; Horton, K. Division of Toxicology and Human Health Sciences, Agency for Toxic Substances and Disease Registry, Atlanta, Georgia; Centers for Disease Control and Prevention (CDC). Prevalence of amyotrophic lateral sclerosis-United States, 2010-2011. MMWR suppl 2014, 63, 1–14. [Google Scholar]
- Nielsen, S.S. Determination of moisture content. Food analysis laboratory manual 2010, 17–27. [Google Scholar]
- Zhang, M.; Xing, S.; Fu, C.; Fang, F.; Liu, J.; Kan, J.; Qian, C.; Chai, Q.; Jin, C. Effects of Drying Methods on Taste Components and Flavor Characterization of Cordyceps militaris. Foods 2022, 11, 3933. [Google Scholar] [CrossRef]
- Doyle, M.E.; Glass, K.A. Sodium reduction and its effect on food safety, food quality, and human health. Comprehensive reviews in food science and food safety 2010, 9, 44–56. [Google Scholar] [CrossRef]
- Arce-Cordero, J.A.; Paula, E.M.; Daniel, J.L.; Silva, L.G.; Broderick, G.A.; Faciola, A.P. Effects of neutral detergent fiber digestibility estimation method on calculated energy concentration of canola meals from 12 Canadian processing plants. Journal of Animal Science 2021, 99, skab309. [Google Scholar] [CrossRef] [PubMed]
- Van Soest, P.J. Nutritional ecology of the ruminant; Cornell university press: 1994.
- Márton, M.; Mándoki, Z.; Csapo-Kiss, Z.; Csapó, J. The role of sprouts in human nutrition. A review. 2010. [Google Scholar]
- Takeda, E.; Yamamoto, H.; Yamanaka-Okumura, H.; Taketani, Y. Dietary phosphorus in bone health and quality of life. Nutrition reviews 2012, 70, 311–321. [Google Scholar] [CrossRef]
- Bird, R.P.; Eskin, N.M. The emerging role of phosphorus in human health. In Advances in food and Nutrition Research, Elsevier: 2021; Vol. 96, pp. 27-88.
- Wu, G. Dietary requirements of synthesizable amino acids by animals: a paradigm shift in protein nutrition. Journal of animal science and biotechnology 2014, 5, 1–12. [Google Scholar] [CrossRef] [PubMed]
- Weijs, P.J.; Cynober, L.; DeLegge, M.; Kreymann, G.; Wernerman, J.; Wolfe, R.R. Proteins and amino acids are fundamental to optimal nutrition support in critically ill patients. Critical care 2014, 18, 1–13. [Google Scholar] [CrossRef]
- NHS. Starchy foods and carbohydrates 15 March 2023 ed.; NHS: 2023.
- Shankar, A.H.; Prasad, A.S. Zinc and immune function: the biological basis of altered resistance to infection. The American journal of clinical nutrition 1998, 68, 447S–463S. [Google Scholar] [CrossRef] [PubMed]
- Haase, H.; Rink, L. The immune system and the impact of zinc during aging. Immunity & Ageing 2009, 6, 1–17. [Google Scholar]
- Prasad, A.S. Discovery of zinc for human health and biomarkers of zinc deficiency. In Molecular, genetic, and nutritional aspects of major and trace minerals, Elsevier: 2017; pp. 241-260.
- Wessels, I.; Maywald, M.; Rink, L. Zinc as a gatekeeper of immune function. Nutrients 2017, 9, 1286. [Google Scholar] [CrossRef]
- Muzhingi, T.; Langyintuo, A.S.; Malaba, L.C.; Banziger, M. Consumer acceptability of yellow maize products in Zimbabwe. Food Policy 2008, 33, 352–361. [Google Scholar] [CrossRef]
- Agume Ntso, A.S.; Njintang, Y.N.; Mbofung, C.M.F. Physicochemical and pasting properties of maize flour as a function of the interactive effect of natural-fermentation and roasting. Journal of Food Measurement and Characterization 2017, 11, 451–459. [Google Scholar] [CrossRef]
- Starowicz, M.; Zieliński, H. How Maillard reaction influences sensorial properties (color, flavor and texture) of food products? Food Reviews International 2019, 35, 707–725. [Google Scholar] [CrossRef]
- Das, P.P.; Duarah, P.; Purkait, M.K. Fundamentals of food roasting process. In High-Temperature Processing of Food Products, Elsevier: 2023; pp. 103-130.
- Rothschild, J.; Rosentrater, K.A.; Onwulata, C.; Singh, M.; Menutti, L.; Jambazian, P.; Omary, M.B. Influence of quinoa roasting on sensory and physicochemical properties of allergen-free, gluten-free cakes. International journal of food science & technology 2015, 50, 1873–1881. [Google Scholar]
- Okaru, A.O.; Lachenmeier, D.W. Defining no and low (NoLo) alcohol products. Nutrients 2022, 14, 3873. [Google Scholar] [CrossRef] [PubMed]
Figure 1.
Ripe and Unripe harvested Marula (Taken by Author, January 2023). A= Ripe Amarula Fruits B= Unripe Amarula Fruits
Figure 1.
Ripe and Unripe harvested Marula (Taken by Author, January 2023). A= Ripe Amarula Fruits B= Unripe Amarula Fruits
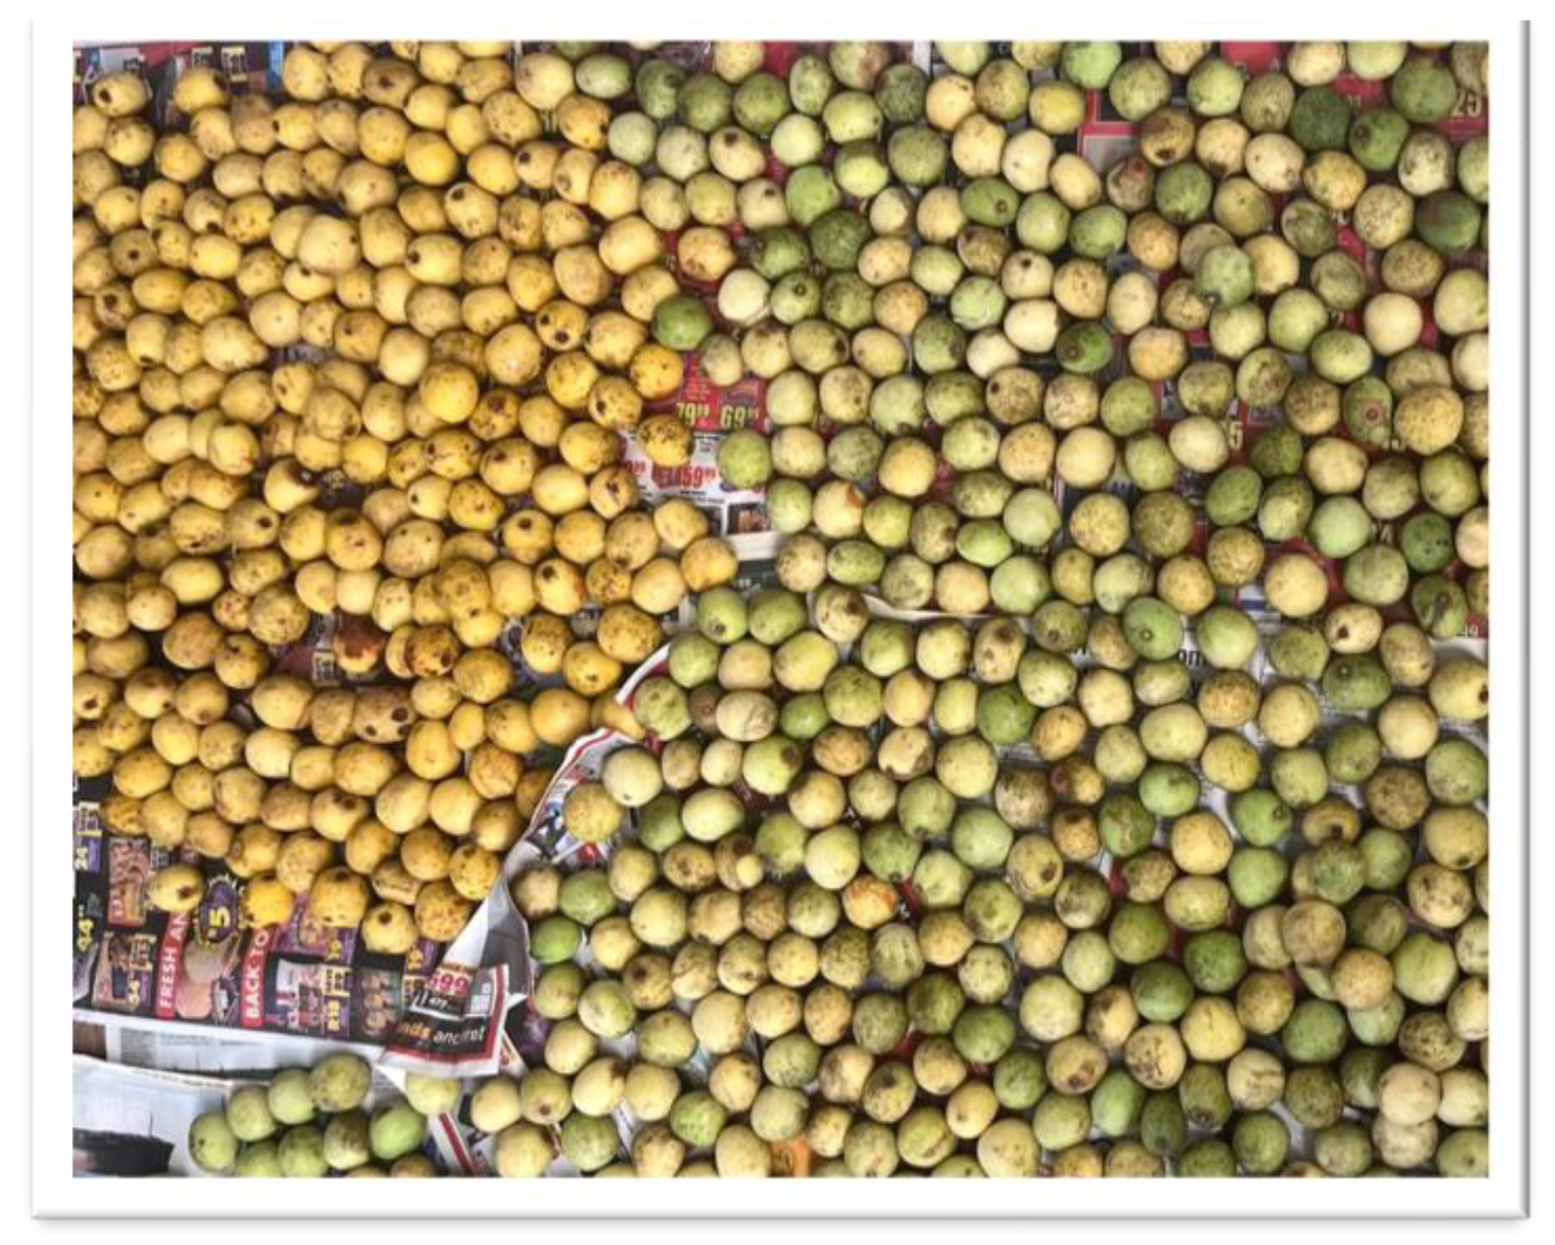
Figure 2.
Spoilt marula. [Image captured by Author in January 2023].
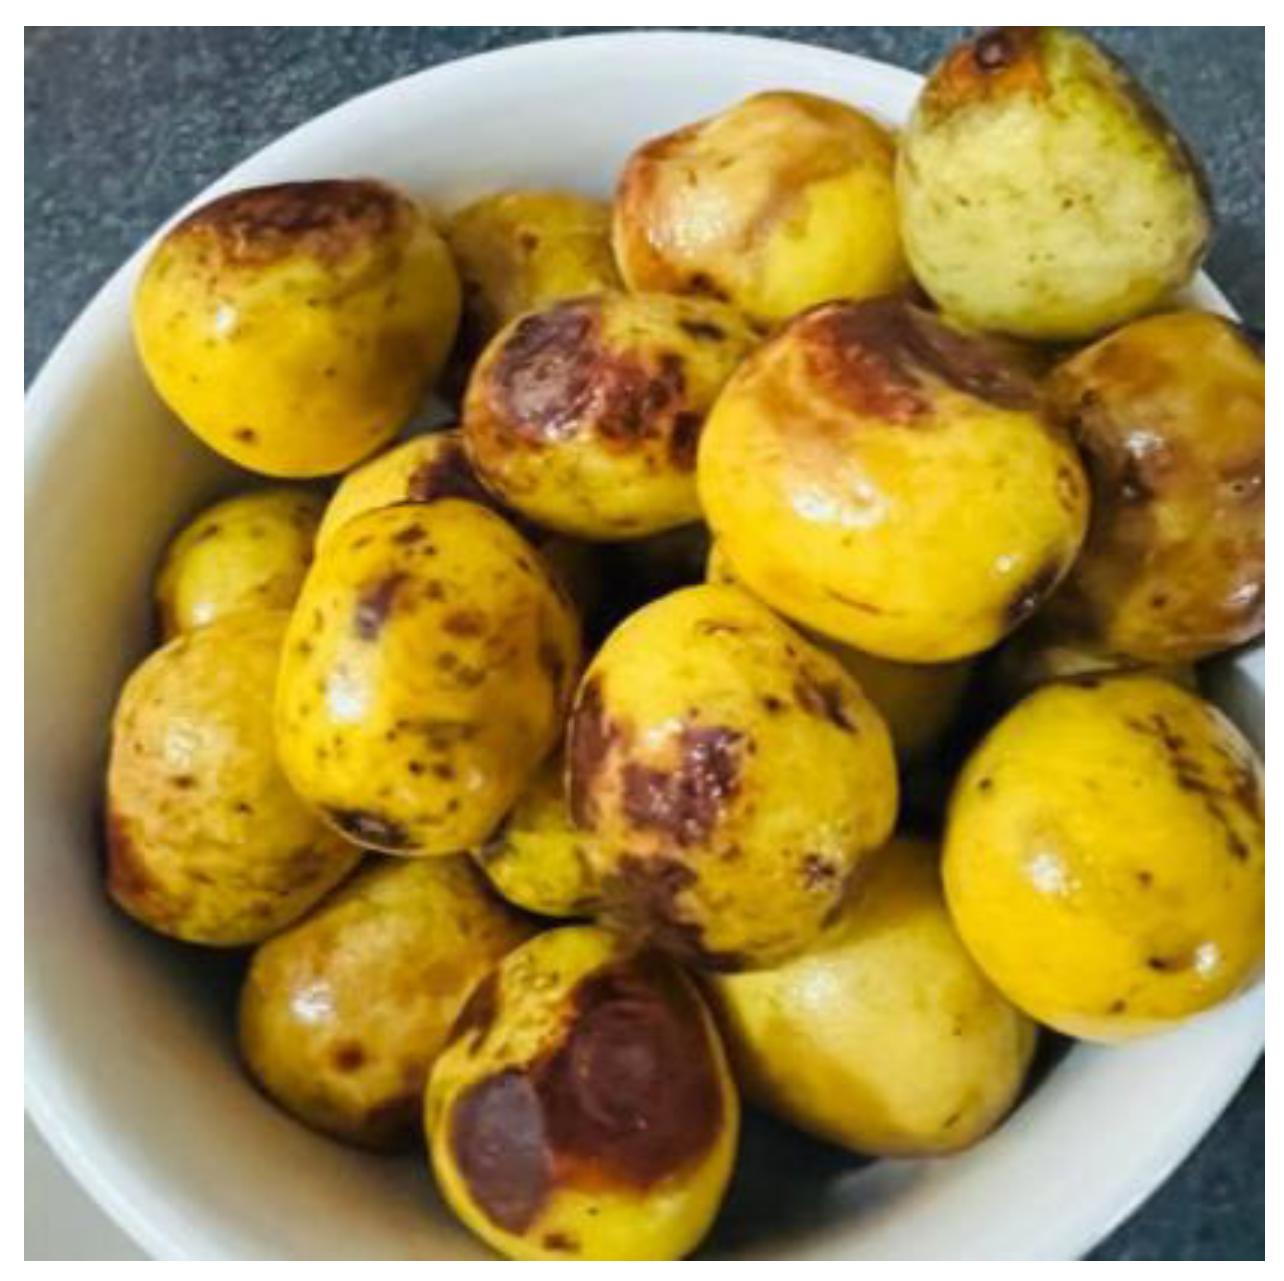
Figure 3.
Ripe, fresh marula. [Image captured by Author in January 2023].
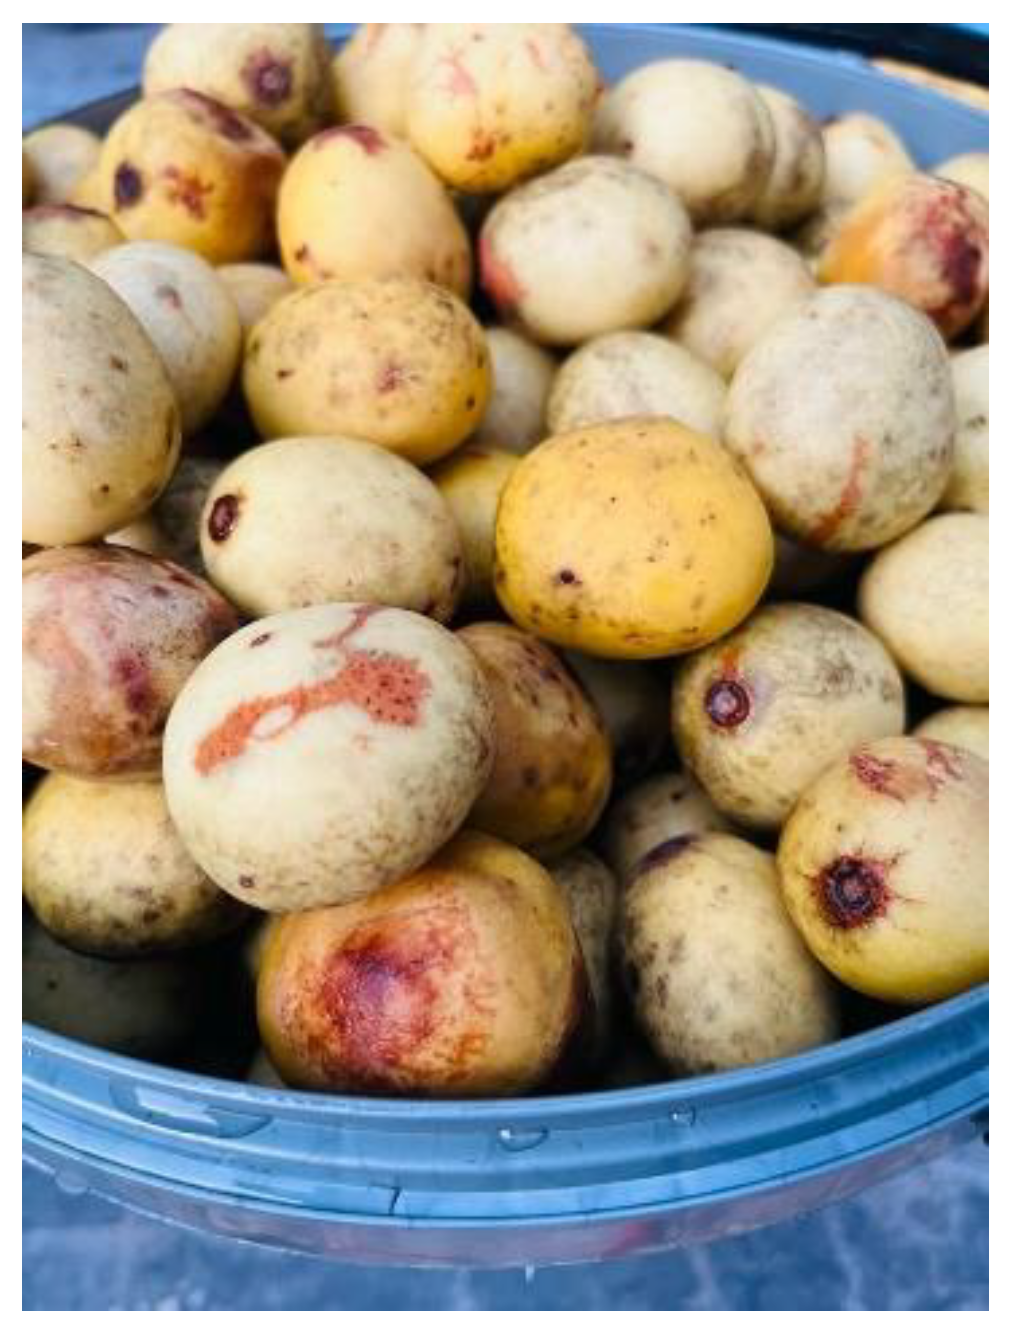
Figure 4.
Washed marula. [Image captured by Author in January 2023].
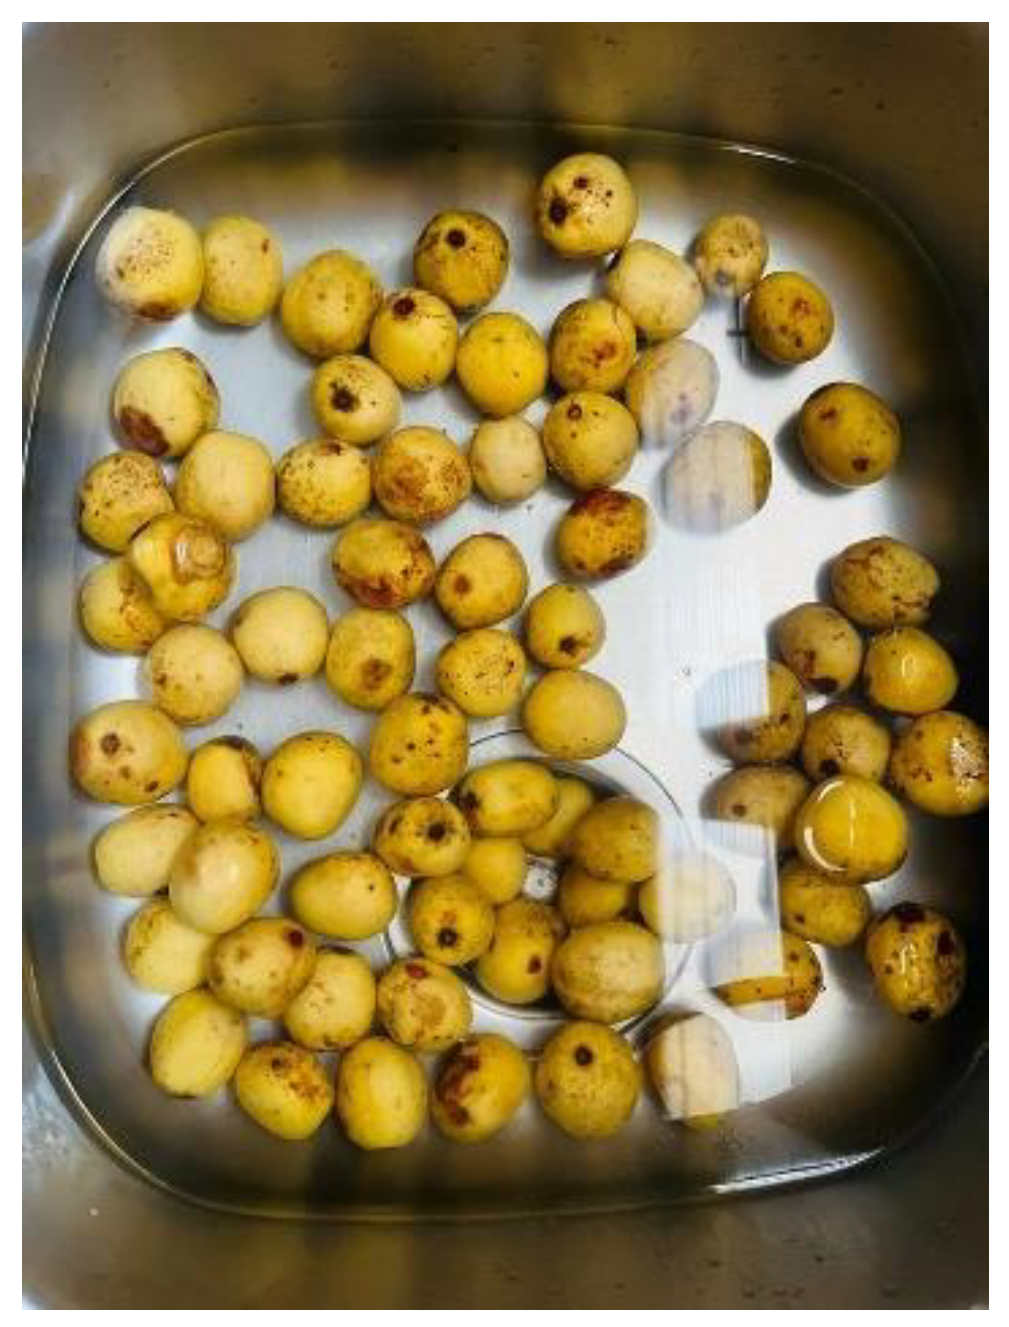
Figure 5.
Marula fruit extraction process.
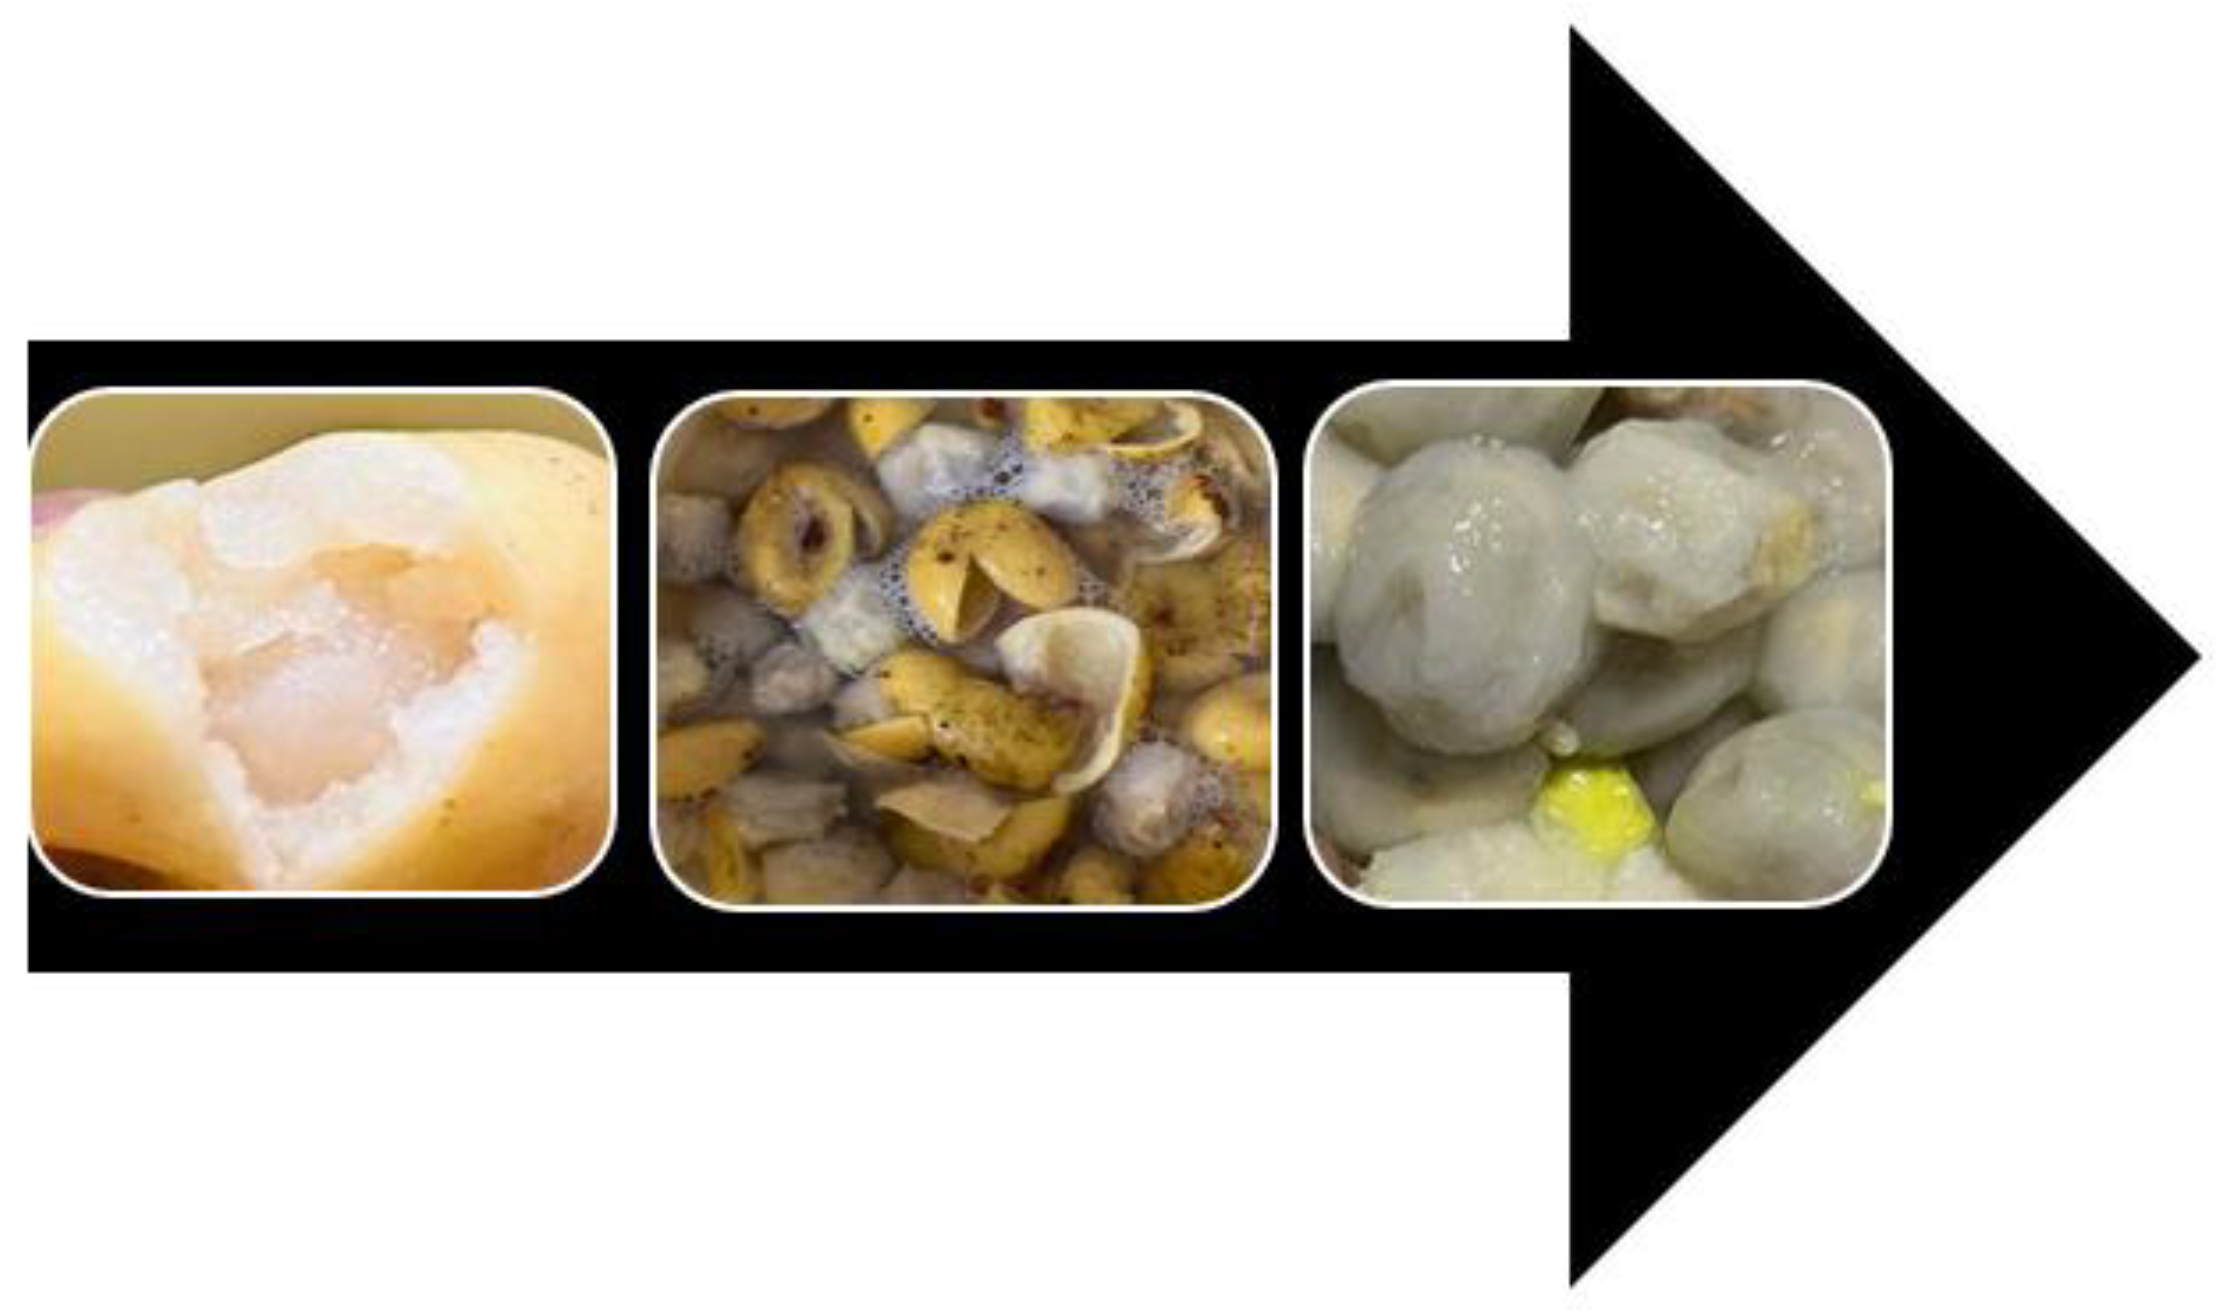
Disclaimer/Publisher’s Note: The statements, opinions and data contained in all publications are solely those of the individual author(s) and contributor(s) and not of MDPI and/or the editor(s). MDPI and/or the editor(s) disclaim responsibility for any injury to people or property resulting from any ideas, methods, instructions or products referred to in the content. |
© 2024 by the authors. Licensee MDPI, Basel, Switzerland. This article is an open access article distributed under the terms and conditions of the Creative Commons Attribution (CC BY) license (http://creativecommons.org/licenses/by/4.0/).
Copyright: This open access article is published under a Creative Commons CC BY 4.0 license, which permit the free download, distribution, and reuse, provided that the author and preprint are cited in any reuse.


