
Submitted:
07 November 2024
Posted:
08 November 2024
You are already at the latest version
Abstract
Triple-negative breast cancers (TNBC) typically have a greater immune cell infiltrate and are more likely to respond to immune checkpoint inhibition (ICI) than ER+ or HER2+ breast cancers. However, there is crucial need to optimize combining chemotherapy strategies with ICI to enhance overall survival TNBC. Therefore, we developed a high-throughput co-culture screening assay to identify compounds enhancing CD8+T-cell-mediated tumor cell cytotoxicity, screening over 400 FDA-approved compounds or agents under investigation for oncology indications. Four chemotherapy agents were chosen as priority hits for mechanistic follow-up due to their ability to enhance T-cell mediated cytotoxicity at multiple doses and multiple timepoints: paclitaxel, bleomycin sulfate, ispinesib and etoposide. Lead compounds affected expression of MHCI, MHCII, and PD-L1, and induced markers of immunogenic cell death (extracellular ATP or HMGB1). Based on ability to increase tumor cell susceptibility to T-cell mediated cytotoxicity, while minimizing T-cell toxicity, bleomycin was identified as the most promising lead candidate. Overall, the results of these studies provide mechanistic insight into potential new chemotherapy partners to enhance anti-PD-1 efficacy in TNBC patients.
Keywords:
Breast Cancer
; Immune Response
; CD8+ T-cells
; Cytotoxic Chemotherapy
1. Introduction
Triple-negative breast cancer (TNBC) is a heterogenous subtype accounting for about 10% of breast cancer (BC) cases in the United States annually [1]. TNBCs are characterized by lack of HER2 amplification, and lack of expression of the hormone receptors for estrogen and progesterone (HR-). The immune checkpoint inhibitor, anti-PD-1, was approved for clinical use in the adjuvant and neoadjuvant settings in combination with physician’s choice chemotherapy for TNBC because of the KEYNOTE-355 and KEYNOTE-522 trials respectively. Although anti-PD-1 is now routinely used in TNBC treatment, there is great variability in responses between patients and few achieve a durable response. For example, in the KEYNOTE-355 trial, the addition of anti-PD-1 improved PFS by about 4 months (9.7 v. 5.6 months) [2]. The taxanes, nanoparticle albumin-bound paclitaxel (nab-PTX) or paclitaxel (PTX), are common chemotherapy partners used with anti-PD-1. PTX often requires pre-treatment with steroids to counteract hypersensitivity reactions caused by the drug solvent – a polyethylated caster oil – while nab-PTX does not require steroid pretreatment [3]. While originally defined by their ability to disrupt microtubule assembly during cell division, taxanes are further being explored for their ability to induce immunogenic cell death [4]. However, there is a concern that dose-dense chemotherapy regiments or the steroid pre-medication required for tolerance of PTX may have immunosuppressive effects in non-responding patients. For example, TNBC patients after taxane neoadjuvant chemotherapy exhibited decreased immune gene expression patterns [5]. Consequently, there is great interest in identifying optimal chemotherapy or targeted therapy approaches to use in combination with anti-PD-1. In this study, we utilized a novel, high-throughput immune-oncology screening platform to identify candidate compounds, from a library of anti-cancer compounds, that may enhance T-cell mediated cytotoxicity. Such compounds may be effective in combination with anti-PD-1. Of 448 starting compounds we identified 22 high priority compounds for follow-up based of ability to enhance T-cell mediated cytotoxicity across multiple concentrations and/or time points. Based upon drug class and clinical relevance, we further specified four key lead compounds for mechanistic characterization of immunostimulatory properties including effects on CD8+ T-cell proliferation and cytokine profile, tumor cell antigen presentation, and induction of immunogenic cell death markers. These four compounds – paclitaxel (PTX), ispinesib (Isp), etoposide (Etop), and bleomycin sulfate (Bleo) are traditional chemotherapies with well characterized cytotoxic mechanisms. PTX is considered standard of care in combination with anti-PD-1 in TNBC [6]. Isp is a kinesin spindle protein inhibitor which causes cell-cycle arrest by preventing formation of the microtubule spindle complex [7]. Overexpression of kinesin proteins is associated with PTX resistance in patients with basal-like breast cancers [8], and in a screen of PDOs established from treatment naïve TNBC biopsies, compounds targeting kinesin spindle proteins were effective in PDOs found to be non-responsive to taxanes [9]. While Isp was abandoned clinically because of lack of efficacy, it was associated with fewer side effects than traditional taxanes like PTX [7], and may still be useful in the setting of PTX resistance. Etop is an FDA approved topoisomerase II inhibitor used in the treatment of several cancers including bladder, stomach, lung, prostate, testicular, and some lymphomas [10,11]. Etop plus platinum-based chemotherapy is used in combination with ICI in small cell lung cancer [12]. Oral Etop is being investigated as an alternative chemotherapy for heavily pre-treated metastatic breast cancer patients and early studies show this is a safe and potentially effective strategy for this patient population [13]. Interest in Etop was renewed during the COVID-19 pandemic since the drug can be given orally and doesn’t rely on patients traveling to an infusion center [14]. Bleo is a glycopeptide antibiotic approved for use in treating head and neck squamous cell carcinoma, Hodgkin’s lymphoma, and testicular carcinoma. Pre-clinical studies show that Bleo may enhance CD8+ T-cell activity through inducing ICD [15]. In the CT26 mouse model of colon cancer, Bleo significantly reduced tumor growth, but this effect was lost if the mice were also treated with either a depleting anti-CD8 antibody or a depleting anti-IFNy antibody [16]. Since PTX, Isp, Etop, and Bleo are clinically used or tested chemotherapy agents, repurposing them to take advantage of newly identified immunostimulatory properties may be a promising direction for further investigation for TNBC treatment. In this work we describe dose-dependent immunostimulatory mechanisms of these compounds.
Figure 1.
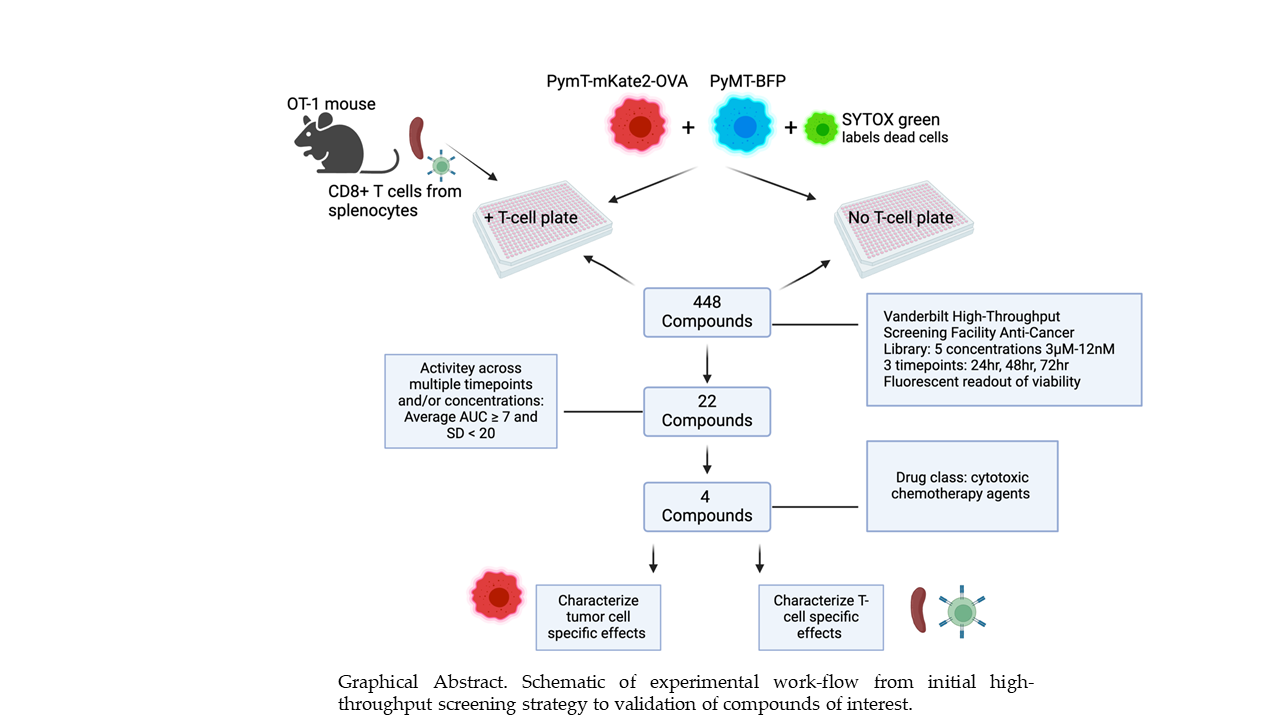
Graphical Abstract. Schematic of experimental work-flow from initial high-throughput screening strategy to validation of compounds of interest.
Figure 1.
Graphical Abstract. Schematic of experimental work-flow from initial high-throughput screening strategy to validation of compounds of interest.
2. Materials and Methods
Cell lines and treatments. All cell lines were maintained in a humidified 5% CO2 incubator at 37°C and tested for mycoplasma contamination regularly (e-Myco TM Plus, LiliF Diagnostics). Mycoplasma negative cells were used for all experiments. The PyMT breast cancer cells derived from an MMTV-PyMT breast tumor in a C57Bl/6 mouse were provided by the Hal Moses laboratory. Early passage PyMT-OVA and E0771-OVA cells were obtained from the laboratory of Jin Chen (Vanderbilt). The PyMT-mKate2-OVA cell line was generated through a lentiviral transfection of the PyMT-OVA cell line with mKate2, a far-red fluorescent reporter, and the PyMT-BFP cell line was generated through a lentiviral transfection of the PyMT cell line with a blue fluorescent reporter (BFP). The mKate2 and BFP lentiviral vectors were provided by Josh Bauer (Vanderbilt High-Throughput Screening Facility). mKate2 positive cells were selected based on resistance to blasticidin (10ug/mL, InvivoGen, Cat. #ant-bl-05) and BFP positive cells were selected based upon hygromycin B resistance (500ug/mL, RPI, Cat. #H75020). The following compounds were used in cell treatment studies: paclitaxel (Selleckchem, Cat. #S1150), bleomycin sulfate (Selleckchem, Cat. #S1214), ispinisib (Selleckchem, Cat. #S1452), etoposide (Selleckchem, Cat. #S1225).
OT-1 splenic T-cell isolation and culture. Spleens were harvested from 8-12 week old OT-1 mice (Jax strain #003831). OT-1 mice were housed and cared for in the AAALAC-accredited Vanderbilt University Medical Center Animal Research Facility, and routinely monitored by laboratory and veterinary staff. Animals were euthanized by CO2 asphyxiation using isoflurane overdose followed by cervical dislocation in accordance with the Guide for the Care and Use of Laboratory Animals. Splenocytes were dissociated into a single cell suspension using gentleMACSTMDissociator (Miltenyi Biotec, Cat. #130-093-235) and passed through a 70μM filter. Red blood cell lysis was performed using sterile ACK lysing buffer (KD Medical Cat. #RGC-3015). CD8+ T-cells were isolated from the single cell suspension via negative selection using the MagCellectTM mouse CD8+ T cell isolation kit (R&D, Cat. #MAGM203) or the EasySepTM mouse CD8+ T cell isolation kit (Stem Cell Tech, Cat. #19853). Successful enrichment of the CD8+ population was confirmed via flow cytometry (AF700, Biolegend, Cat. #100729). OT-1 CD8+ T-cells were cultured in RPMI containing 10% FBS, 1% PenStrep, IL-2 (10ng/mL, BioLegend) and 2-BME (50μM, Sigma, Cat. #M3148). OT-1 CD8+ T-cells were activated with OVA (257-264) peptide (5ug/mL, Sigma, Cat. #S7951) and/or Dynabeads® Mouse T-activator CD3/CD28 (Gibco, Cat. #11452D) according to the manufacturer’s instructions for 48 hours prior to addition to tumor cell cultures. The activation status of the CD8+ T-cells used in the HTS assay was confirmed by analyzing culture supernatants for IFNy by ELISA (Invitrogen, Cat. #KMC4021).
HTS assay. 500 PyMT-BFP and 500 PyMT-mKate2-OVA cells in 20uL FluoroBriteTM DMEM (Gibco, Cat. #A1896701) were placed in each well in 384-well plates using the automated liquid handling multidrop Combi (Thermo Scientific Cat. #5840330). The next day, compounds from the 448 Anti-Cancer Compound Library (https://medschool.vanderbilt.edu/hts/compound-management/) were resuspended in SYTOX green (Invitrogen, Cat. #S7020) then individually aliquoted to each well of tumor cells. The SYTOX green dye is taken up by dead cells. Compounds were tested across a range of 5 concentrations: 3µM, 0.8µM, 0.2µM, 50nM, and 12nM. Immediately following the addition of compounds, either 500 pre-stimulated OT-1 CD8+ T-cells in 10uL DMEM or 10uL DMEM without T-cells was added per well. Whole-well images (4X) were acquired at 24hr, 48hr, 72hr treatment timepoints using the MetaXpress imaging system. Fluorescent imaging at each timepoint was used to assess cell viability in response to treatments in the presence or absence of T-cells. ImageXpress software was used to analyze images and score live/dead PyMT-mKate2-OVA cells versus live/dead PyMT-BFP cells.
For each concentration of individual compounds, several ratios were calculated. The number of dead (STYOX +) PyMT-mKate2-OVA expressing cells compared to dead (SYTOX +) PyMT-BFP cells was assessed per well. To account for antigen-specific T-cell effects compared to non-antigen specific T-cell effects in the T-cell containing plates, the following calculation was performed: A Kt ratio > 1 represents greater antigen specific, than non-antigen specific T-cell cytotoxicity. To account for T-cell independent, cytotoxic effects of the compounds, a similar ratio was calculated for each corresponding, tumor-cell only plate: . Theoretically, we would expect this ratio to be 1, as the cytotoxicity of the compounds should be independent of whether or not the PyMT cells express the OVA antigen. A final ratio, Tf, comparing the T-cell plate to the tumor-cell only plate was calculated: . If Tf is greater than 1, meaning Kt>Kc, this suggests enhanced, antigen-specific T-cell mediated cytotoxicity in that treatment condition. Tf was plotted versus concentration for each compound at each timepoint to calculate area under the curve (AUC). The average AUC and SD across timepoints was calculated and compounds with an average AUC >= 7 were identified as high priority for follow-up.
Viability assays. PyMT-OVA cells were seeded at a density of 0.01x10⁶ cells per well in 96-well flat bottom plates (Genesee Scientific, Cat. #25-109MP) in complete DMEM. The following day, media were aspirated, the cells were treated with the compound of interest at 2x desired concentration in 100uL, and either 100uL of T-cell media (RPMI 10%FBS, 1%PenStrep, IL-2 (10ng/mL, BioLegend) and 2-BME (50μM, Sigma, Cat. #M3148) or 100uL of T-cells media with 0.002x10⁶, CD3/CD28 ((Gibco, Cat. #11452D) pre-activated CD8+ T-cells were added to each well. After 48hrs of co-culture, the medium, including the T-cells in suspension, was aspirated from each well. Phenol-Red free DMEM (100µl) and 100µL of CellTiter-Glo® luminescent cell viability reagent (Promega, Cat. #G7572) were added per well. CD8+ T-cell only wells were included to specifically assess the compound toxicity on the T-cell population. Luminescence was read on a Promega GloMax Discover plate reader and values normalized to media only and DMSO control wells to assess tumor cell viability after co-culture.
Flow cytometry. All flow data were collected using a 5-Laser Fortessa at the Vanderbilt Flow Cytometry Shared Resource. Data were analyzed using FLowJo 10.5.3 software. Apoptosis was assessed via staining for Annexin-V/FITC (Invitrogen, Cat. #11-8005-74) and cell death was assessed by 7-AAD (Invitrogen, Cat. #00-6993-50) according to the manufacturer’s instructions using flow cytometry. Prior to addition to co-culture, CD8+ T-cells were labeled with 25μM CellTracker™ Blue CMF2HC (Invitrogen, Cat. #C12881) according to manufacturer’s instructions.
To assess CD8+ cell proliferation, OT-1 splenocytes were labeled with CellTrace Deep Red (Invitrogen, Cat. # C34553), stimulated with Dynabeads® Mouse T-activator CD3/CD28 (Gibco, Cat. #11452D) and treated with compounds of interest at 10nM or 50nM concentrations. Wells were sampled at 24hr, 48hr, and 72hr timepoints and cells were stained using the following antibodies: CD3/PerCpCy5.5 (Biolegend, Cat. #100217, 1:200) and CD8/PE (Biolegend, Cat. #100707, 1:200). Live/Dead-Ghost Dye Violet 540 (Tonbo Biosciences, Cat. #13-0870-T100) was used to exclude dead cells. Proliferation was assessed via measuring intensity of APC fluorophore overtime.
PyMT-OVA tumor cells were treated with compounds of interest and stained for flow cytometry with the following antibodies: MHCI(H2Kb)/APC (Biolegend, Cat. #116517, 1:100), MHCII/AF700 (Biolegend, Cat. #107622, 1:100), and PDL1/PE (Biolegend, Cat. #124307, 1:100). Live/Dead-Ghost Dye Violet 540 (Tonbo Biosciences, Cat. #13-0870-T100) was used to exclude dead cells.
Immunogenic cell death marker assays. PyMT-OVA tumor cells were seeded at a density of 0.01x10⁶ cells per well in 96-well flat bottom plates in complete phenol-red free DMEM. Extracellular ATP was assessed via luminescence using the RealTime-Glo Extracellular ATP assay according to manufacturer instructions (Promega, Cat. #GA5010). HMGB1 was measured using the Lumit high mobility group box 1 protein (HMBG1) Human/Mouse Immunoassay (Promega, Cat. #W6110) according to the manufacturer’s instructions.
3D culture assays. PyMT-OVA tumor cells were grown as spheroids in complete DMEM + 5% Matrigel (Corning, Cat. #356234) in 24-well or 96-well ultra-low attachment plates (Corning, Cat. #3473 & #3474). Images were acquired using an EVOS M7000 at 20x or 10x and analyzed using FIJI 3 software. For 24-well plates, cells were seeded a density of 50,000 tumor cells per well and for 96-well plates cells were seeded at a density of 2,500 tumor cells per well. Prior to imaging, tumor cells were stained with DAPI (300nM, ThermoFisher Cat. #D1306). When indicated, T-cells were stained with CellTracker Deep Red according to the manufacturer’s instructions (ThermoFisher, Cat. #C34565).
3. Results
3.1. Compound Screen of 448 Drugs Across Three Timepoints Identifies Four Lead Compounds
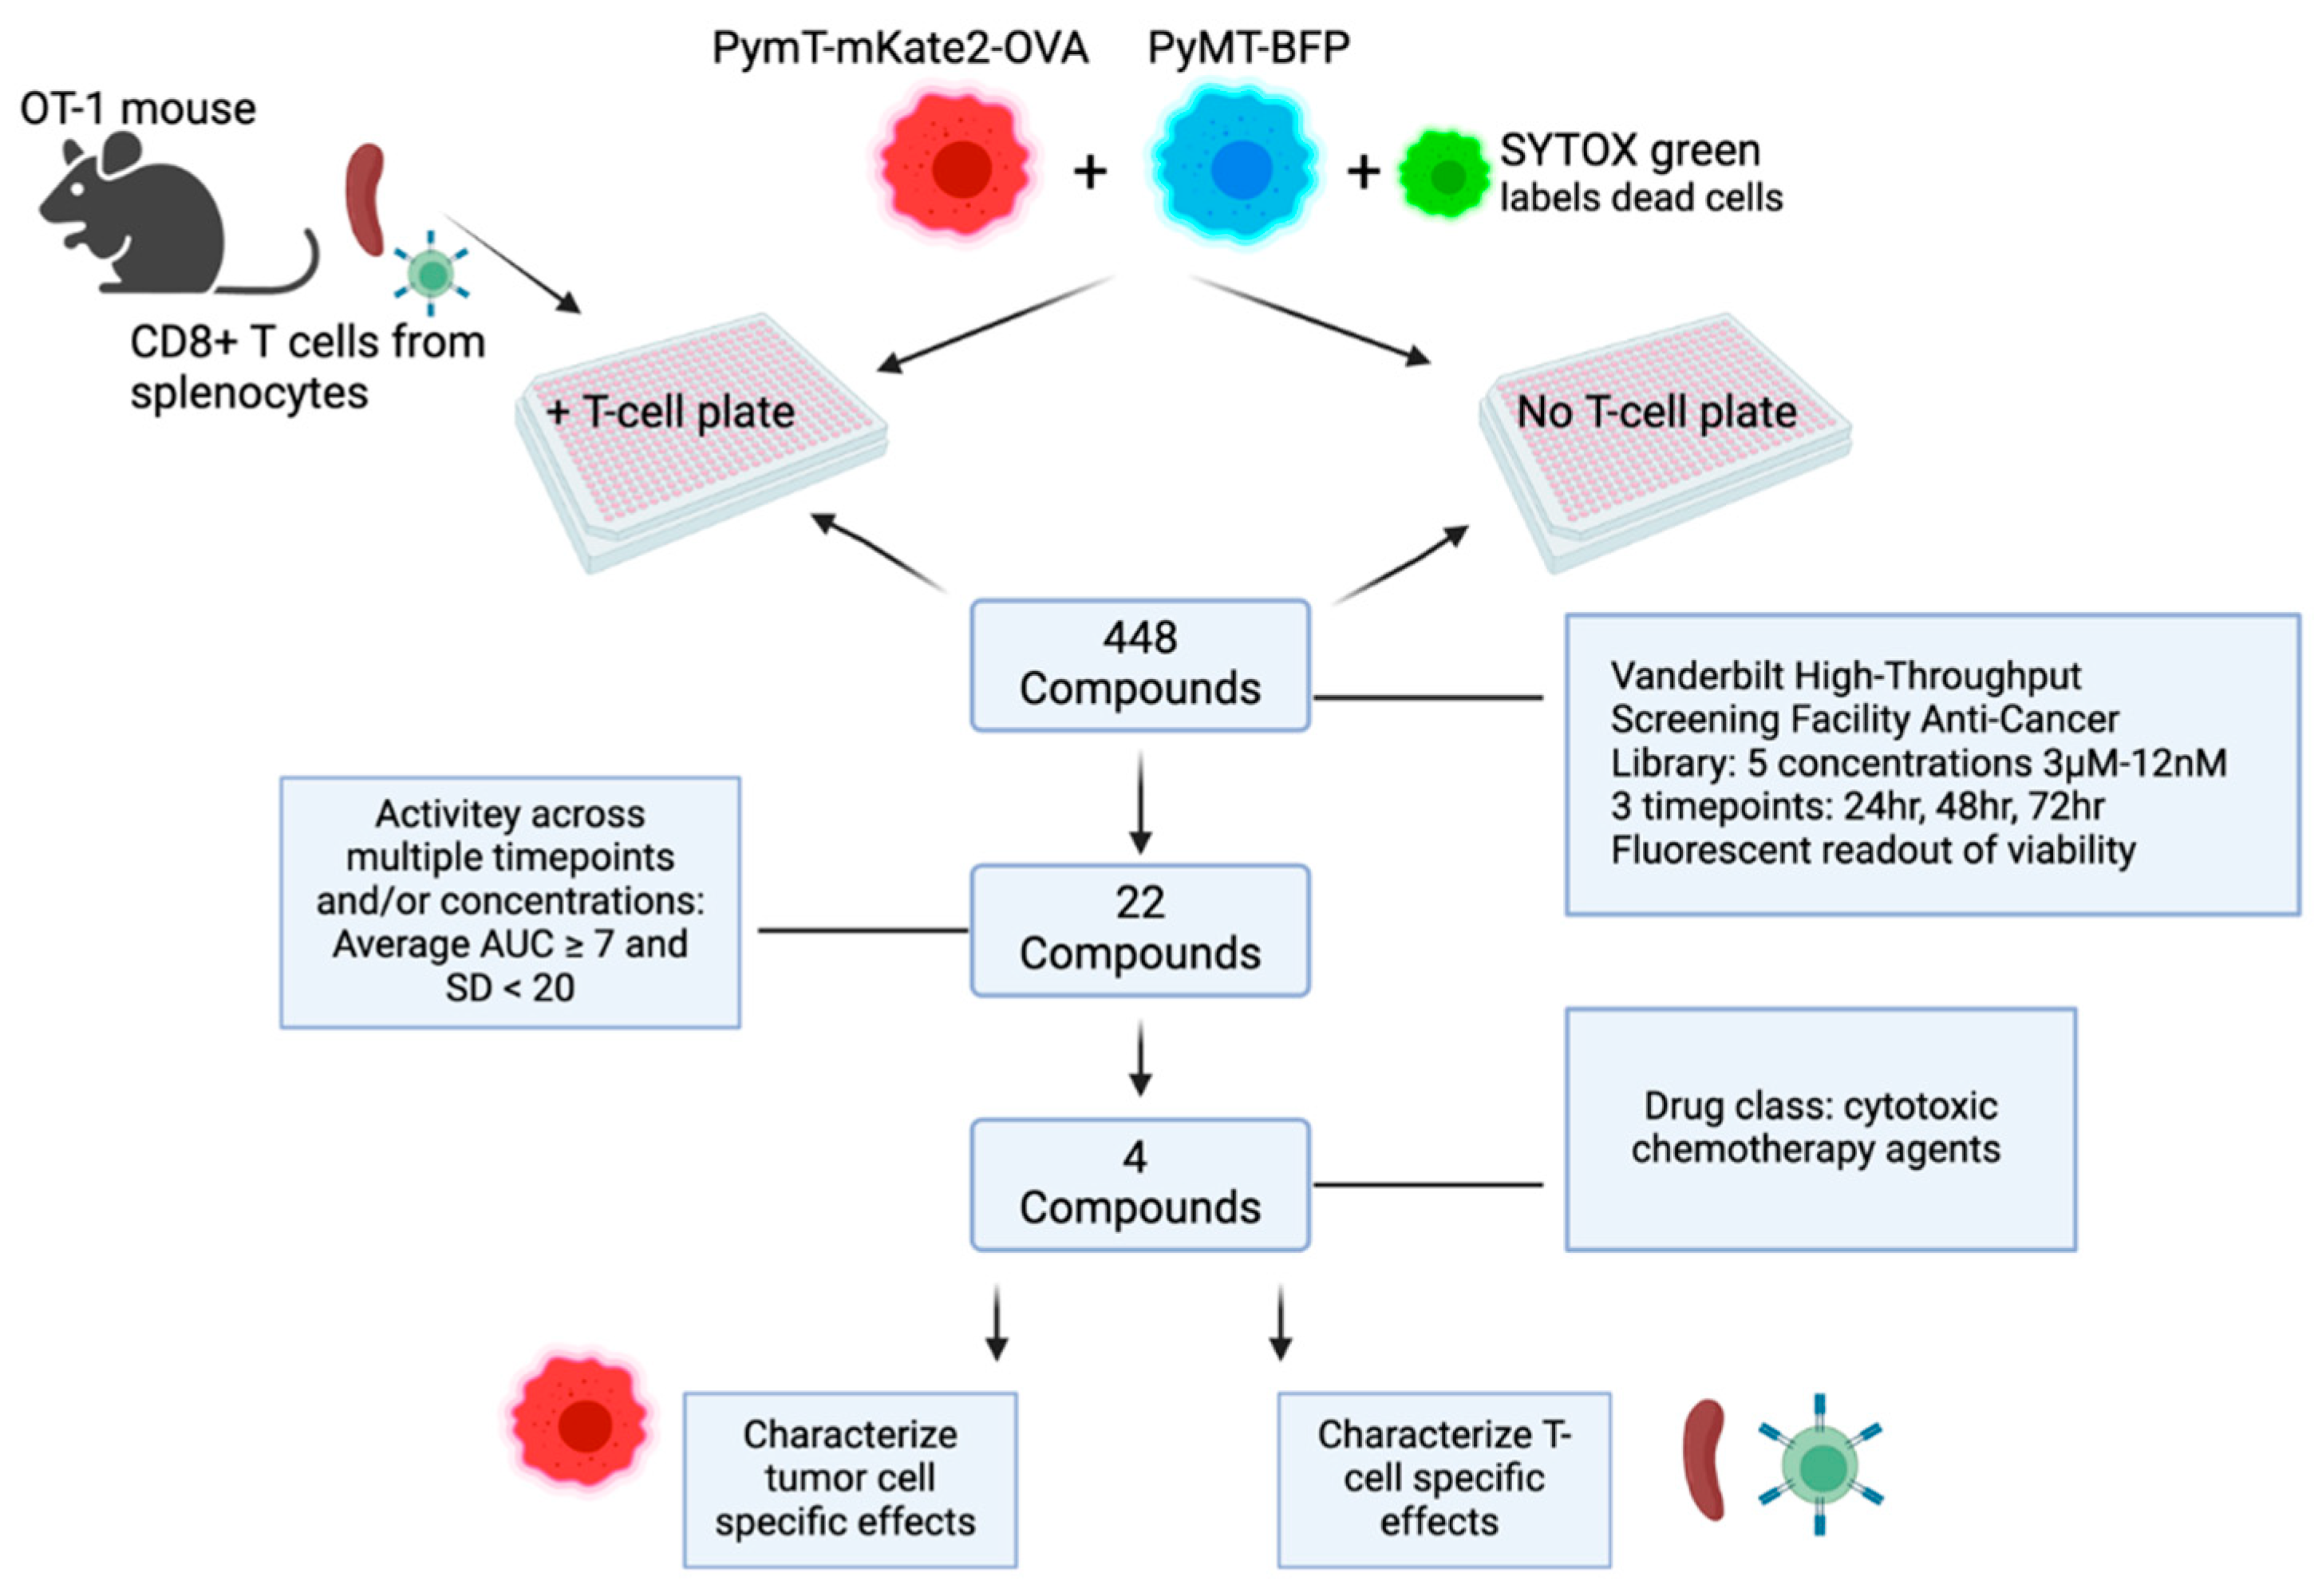
Using a library of anti-cancer compounds, we sought to identify compounds that enhance T-cell mediated tumor cell cytotoxicity that may be useful in combination with anti-PD-1 therapy in TNBC models. Compounds were tested at 5 concentrations (3µM, 0.8µM, 0.2µM, 50nM, and 12nM) across three timepoints (24hr, 48hr, 72hr), either in the presence or absence of pre-activated murine OT-1 CD8+ T-cells isolated as described in the Methods section. Briefly, two days prior to addition of drugs to tumor cells (day-2), CD8+ T-cells were isolated from OT-1 mouse splenocytes as described in Methods (Figure 2). Enrichment for CD8+ T-cells after magnetic selection was confirmed via flow cytometry (Figure S1). Supernatants from unstimulated control and pre-activated T-cells were analyzed by ELISA for secretion of IFNy to confirm the activation status of T-cells added to the co-culture (Figure S1). One day prior to addition of drugs to cultures, 500 PyMT-mKate2-OVA or 500 PyMT-BFP cells in 20uL FluoroBriteTM DMEM were plated into 384-well plates. Immediately following the addition of compounds, either 500 pre-stimulated OT-1 CD8+ T-cells in 10uL DMEM or 10uL DMEM without T-cells was added per well. Cultures were incubated for 24, 48 or 72 hours and dead cells were evaluated based on SYTOX green staining. A Tf greater than 1 represents enhanced death in the PyMT-mKate2-OVA population in the presence of T-cells compared to the PyMT-BFP population, suggesting enhanced, antigen-specific T-cell mediated cytotoxicity. Tf was plotted against log[drug] for each compound to calculate an AUC value (Figure S2). Compounds with a Tf >3 at more than one test concentration per timepoint are shown in Figure 3a. To further prioritize compounds, the average AUC and SD representing all three timepoints was calculated for each compound. Compounds with a SD > 20 were discarded for high variability. Compounds with an average AUC ≥ 7 were considered high priority compounds as these compounds have a Tf >3 at more than one timepoint and/or concentration (Figure 3b, Table 1). AUC and SD values for all compounds tested in the screen can be found in Table S1. PTX, Bleo, Isp, and Etop were chosen as priority compounds for mechanistic follow-up based upon drug class and clinical relevance. All four compounds are cytotoxic chemotherapy agents that have been well studied and tested clinically. Paclitaxel is routinely used in combination with anti-PD-1 for TNBC [6].
3.2. Confirmation of Increased T-Cell Mediated Cytotoxicity
We next used two additional methods to confirm that the four priority compounds enhance T-cell mediated cytotoxicity as detected in the initial screen. CellTiter-Glo® viability assays of PyMT-OVA cells cultured with or without OT-1 CD8+ T-cells were performed as the first validation method. In this assay, intracellular ATP detected after cells are washed and lysed is used as a measure of metabolically active, viable cells. A decrease in luminescent signal is interpreted as a decrease in intracellular ATP, and a decrease in metabolic activity and cell viability. T-cells were removed prior to CellTiter-Glo® analysis by removing and replacing the culture media at the experiment endpoint as to only measure PyMT-OVA cell viability. In all conditions tested, samples treated with T-cells exhibited significantly reduced tumor cell viability compared to each corresponding treatment without T-cells. Samples treated with T-cells plus PTX (PTX+T) at 10nM, 25nM, 50nM, or 100nM exhibited significantly reduced tumor cell viability compared to samples treated with DMSO and T-cells (DMSO+T) (p<0.0001) (Figure 4a). Similarly, samples treated with Isp+T exhibited significantly reduced tumor cell viability compared to DMSO+T at Isp concentrations of 10nM, 25nM, 50nM, and 100nM (p<0.0001) (Figure 4b). Samples treated with Bleo+T exhibited significantly reduced tumor cell viability compared to DMSO+T at all of the concentrations tested (1nM p<0.01, 10nM-100nM p<0.0001) (Figure 4c). Samples treated with Etop+T also exhibited significantly reduced tumor cell viability only at Etop concentrations of 50nM (p<0.05) and 100nM (p<0.01) (Figure 4d).
Evidence of enhanced apoptosis in the presence of both T-cells and the compound of interest was used as a secondary validation approach. PyMT-OVA tumor cells were cultured with or without pre-stimulated, fluorescently labeled OT-1 splenic CD8+ T-cells and treated with the indicated compounds for 48hrs. After 48hrs, the co-cultured cells were collected, and apoptosis was assessed via flow cytometry as described in the Methods section by staining for Annexin V and 7-AAD. The CD8+ T-cells were labeled with a CellTrace dye, and therefore could be excluded from analysis by gating, allowing analysis of apoptosis specifically in the tumor cell population. Significantly more tumor cells were positive for Annexin V, a marker of apoptosis, in the presence of compound plus T-cell compared to compound alone for PTX (p<0.0001), Bleo (p<0.0001), Isp (p<0.0001), and Etop (p<0.001), confirming the increased T-cell mediated cytotoxicity observed in the high-throughput assay (Figure 4e,f). Importantly, significantly more tumor cells were positive for Annexin V in the PTX+T, Bleo+T and Isp+T groups compared to DMSO+T (p<0.0001) (Figure 4e,f). No significant differences were observed in 7-AAD positivity, indicating that the increases in apoptosis observed at 48hrs is early, rather than late-stage apoptosis.
3.3. Dose-Dependent Effects of Lead Compounds on Antigen Presentation by Tumor Cells
The increased T-cell mediated cytotoxicity detected in the high-throughput and apoptosis assays may occur through two distinct mechanisms; compounds may be affecting tumor cells in such a way that they are more susceptible to T-cell killing, or they may be directly affecting T-cell function. To test the hypothesis that compounds affect tumor cells in such a way that they are more susceptible to T-cell killing, we first probed for induction of antigen presentation. PyMT-OVA tumor cells were treated with DMSO, or 50nM of PTX, Isp, Bleo, or Etop for 48hrs. Surface expression of MHCI (H2kb) was assessed via flow cytometry. PTX and Bleo significantly increased H2kb expression compared to DMSO control (p<0.001), while Isp significantly decreased H2kb expression (p<0.01) (Figure 5a). Since enhanced tumor cell death was observed with the combination of T-cells plus compound at doses as low as 1nM for Bleo and 10nM for PTX (Figure 4c,a) the dose dependency of MHCI induction was further explored. Starting at 10nM, Bleo and PTX significantly enhance MHCI expression compared to DMSO control (Figure 5b). Importantly, 10nM is below the IC50 of Bleo for PyMT-OVA cells (Bleo 20.84nM) (Figure 5c), indicating that Bleo may be able to stimulate T-cell mediated cytotoxicity at sub-cytotoxic concentrations. MHCII surface expression was also assessed via flow cytometry since MHCII+ tumor cells were previously found to predict response to ICI in a study that used mass cytometry to profile TNBC tumors before, during, and after treatment [37]. PTX, Isp, and Bleo significantly increased MHCII expression (Figure 4d) p<0.0001, p<0.01, p<0.0001). PD-L1 was also assessed by flow cytometry since, in the late disease setting, TNBC tumors with high PD-L1 expression are more likely to benefit from ICI, though it has been reported that most of the PD-L1 is produced by stromal cells and not the tumor cells [38]. By FACS analysis of cultured PyMT cells, we observed that approximately 40% of the cells express PD-L1 at baseline (Figure 5e). Isp significantly decreased PD-L1 expression in PyMT tumor cells, while PTX, Bleo, and Etop had no significant effect after 48hr of treatment (Figure 5e).
3.4. Lead Compounds Induce Markers of ICD
To probe how lead compounds may be affecting the immunogenicity of tumor cells, we next probed for markers of ICD. While ICD is a complex process best studied in in vivo models, we can probe for markers of ICD such as extracellular ATP and HMGB1, which may be detected in an in vitro setting [39]. Compared to DMSO treated control, PTX, Isp, Etop, and Bleo significantly increase release of extracellular ATP after 24hr of treatment at concentrations of 10nM and 50nM (Figure 6a). After 24hrs of treatment, 50nM, but not 10nM, of PTX significantly increases HMGB1 release compared to DMSO control (p<0.01) (Figure 6b). Etop and Bleo both significantly increased HMGB1 release when used at 10nM or 50nM. Conversely, neither 10nM nor 50nM Isp significantly induces HMBG1 release, but it is possible that Isp would induce HMGB1 if tested at higher concentrations.
3.5. Dose-Dependent Effects of Lead Compounds on CD8+ T-Cell Activity
To investigate the second hypothesis that candidate compounds affect T-cell function, OT-1 CD8+ T-cells were treated with the indicated compounds for 48hr, and supernatants were collected for cytokine analysis. Supernatants were subject to Luminex cytokine analysis at the Vanderbilt Analytical services core using the high sensitivity T-cell assay of 18 analytes. At the 48hr timepoint and 50nM concentration of drug tested, the cytokine profile of T-cells was not significantly altered when compared to DMSO control (Figure 7a). Of note, IFNy and TNFα, two important cytokines involved in T-cell cytotoxicity were not negatively impacted by drug treatment (Figure 7a). Moreover, the T-cells make substantial amounts of IL-1a in addition to cytokines that regulate myeloid cells (GM-CSF, LIX, MCP1, MCP2), though the levels of these cytokines were also not altered by drug treatment. To assess compound toxicity on CD8+ T-cells, the CellTiter-Glo® luminescent cell viability assay was used to generate dose-response curves and calculate an IC50 for each compound after 48hrs of treatment across a range of doses. PTX and Isp were more toxic to CD8+ T-cells than were Etop and Bleo with IC50s of approximately 3nM, 4nM, 61nM, and 35nM respectively (Figure 6b). The effects of PTX and Bleo on T-cell function were further assessed since they were the most effective at inducing tumor cell MHCI expression. CD8+ T-cell proliferation was assessed via flow cytometry using the CellTrace proliferation assay where the intensity of the fluorescent dye decreases over time as cell divisions occur. Therefore, sustained fluorescent intensity indicates a reduction in cell proliferation. 50nM of Bleo did not significantly alter T-cell proliferation compared to CD3/CD28 stimulated, DMSO control at 48 or 72hrs (Figure 7c). Conversely, 50nM of PTX did significantly reduce T-cell proliferation at both 48hr and 72hr. To test whether the negative effects of PTX and Isp on T-cell proliferation were dose dependent, the proliferation assay was repeated using 10nM of the indicated compounds. The lower dose of 10nM did not significantly affect T-cell proliferation at either 48hr or 72hr (Figure 7c). Altogether, this indicates that while the lead compounds are not enhancing T-cell activation and at 10nM concentrations, they may not substantially hindering T-cell activation and function. However, 50nM concentrations of PTX can reduce T cell proliferation.
3.6. Validation in Additional Models
We next sought to test the effectiveness of lead compounds in 3D culture models. As the current standard of care for use in combination with anti-PD-1 for TNBC, PTX was included in these studies. Bleo was chosen as the second compound for 3D validation since it increased expression of MHCI, MHCII, release of extracellular ATP, and release of HMGB1 at 10nM. 10nM is less than the IC50 of Bleo both for OT-1 CD8+ T-cells (Figure 7b, 35nM) and PyMT-OVA tumor cells (Figure 5c, 20.84nM). Therefore, Bleo is a promising candidate to be used at sub-cytotoxic concentrations to maximize immunostimulatory properties without negatively impacting T-cell function. PyMT-OVA cells were grown as spheroids in 5% Matrigel and cultured with or without OT-1 CD8+ T-cells in the presence of DMSO, 50nM PTX, or 50nM Bleo. Baseline Images were acquired at timepoint zero prior to addition of T-cells or drug treatment to confirm no significant differences in starting sizes of spheroids in each well. After 48hrs, the average spheroid area of samples treated with PTX+T was significantly smaller than PTX alone (p<0.05) and DMSO+T (p<0.001) (Figure 4.8a). Similarly, the average spheroid area of samples treated with Bleo+T was significantly smaller than Bleo alone (p<0.05) and DMSO+T (p<0.0001) (Figure 4.8a). The experiment was repeated to test PTX and Bleo at 10nM. PyMT-OVA spheroids were labeled with DAPI prior to imaging and CD8+ OT-1 T-cells were labeled with CellTracker Deep Red. 10nM PTX+T and 10nM Bleo+T significantly reduced average spheroid size compared to DMSO+ T (p<0.01) and compared to corresponding drug treatment without T (p<0.05) (Figure 8b). Fluorescent imaging allowed us to confirm that CD8+ T-cells did localize to tumor spheroids (Figure 8c).
Since TNBC is a heterogenous disease, we also sought to validate PTX and Bleo in the E0771-OVA cell line, an additional TNBC-like cell line. CellTiter-Glo® viability assays of E0771-OVA cells cultured with or without OT-1 CD8+ T-cells were performed as described in the methods. In all conditions tested, samples treated with T-cells exhibited significantly reduced tumor cell viability compared to each corresponding treatment without T-cells (Figure 8d,e). Samples treated with PTX+T at 100nM, 1uM, and 10uM exhibited significantly reduced tumor cell viability compared to samples treated with DMSO and T-cells (DMSO+T) (Figure 8d). Samples treated with Bleo+T at 1uM and 10uM exhibited significantly reduced tumor cell viability compared to each corresponding treatment without T-cells (Figure 8e).
4. Discussion
The study herein describes a high-throughput methodology to identify compounds that may enhance T-cell mediated cytotoxicity and therefore are potential candidates for combination therapies with ICI. A total of 448 compounds from an anti-cancer compound library were tested across five concentrations and three timepoints for their ability to enhance T-cell mediated cytotoxicity. The OT-1 model was used a model of antigen specific T-cell mediated cytotoxicity. The OT-1 mouse is engineered to have transgenic T-cell receptors that specifically recognize the ovalbumin peptide (residues 257-264). While a useful tool, the OT-1 model is limited in its translational relevance because tumor antigen specific T-cells may not be present in the TME. Nevertheless, the OT-1 model allows us to study T-cell to tumor cell interactions in isolation and the findings presented in this work can be tested in non-antigen specific models in future work. In the initial screen of 448 compounds, an average AUC was calculated across all three timepoints and 22 compounds were identified as high priority hits (Table 1, Figure 3b). Of these, PTX, Isp, Etop, and Bleo were chosen for detailed validation and follow-up analysis because they belong to a common drug class of cytotoxic chemotherapies. All four compounds exhibited enhancement of T-cell mediated cytotoxicity in follow-up viability and apoptosis assays (Figure 4).
While four compounds were chosen for detailed follow-up analysis in the present work, the remaining 18 compounds may be the subject of future work (Table 1). Of particular interest are CYC116 and AT9283 which act as aurora kinase a/b inhibitors and BIBR1532, a telomerase inhibitor. These act through a common mechanism of inducing cellular senescence. Therapy induced senescence (TIS) was previously found to affect tumor infiltrating lymphocytes and enhance the response to checkpoint inhibition in a mouse model of melanoma [40]. Rigosertib, a RAS mimetic, was also identified in this screen and may be the subject of further studies. It did not meet selection criteria to be included in the list of 22 high priority compounds, but it did show evidence of enhancing T-cell mediated cytotoxicity at the 48hr timepoint specifically (Figure 3a). In a mouse model of melanoma, rigosertib was previously found to induce ICD and synergize with ICI [41].
We first explored how the compounds of interest may affect immunogenicity of the tumor cells. MHCI is a key molecule involved in presenting intracellular antigen to the cell surface where it can be recognized by CD8+ T-cells as part of an adaptive immune response. MHCI downregulation is an immune evasive mechanism used by tumor cells. While NK cells can recognize cells missing this “self-signal” according to the missing-self hypothesis [42], MHCI downregulation is associated with resistance to ICI and increasing MHCI expression is thought to improve ICI responses [43]. PTX and Bleo significantly increased MHCI expression at doses as low as 10nM (Figure 5b). PTX, Isp, and Bleo also significantly increased expression of MHCII (Figure 5d). MHCII is primarily responsible for presenting antigen to CD4+ T-cells. In a study that characterized TNBC biopsies pre, during, and after treatment with anti-PD-1, pre-treatment levels of MHCII+ tumor cells were a strong predictor of response [37]. An increase in MHCII expression does not explain the increased T-cell mediated cytotoxicity observed in the HTS assay in the present study since CD4+ T-cells are not present in the co-culture assay. However, understanding how MHCII expression is affected will inform the suitability of combining these compounds with ICI in future studies and in vivo.
We next studied the ability of PTX, Bleo, Etop, and Isp to induce markers of ICD. Bleo and PTX have previously been found to induce markers of ICD such as HMGB1 [4], but here we test a variety of doses and show that 10nM of Bleo or PTX is sufficient to induce ATP and HMGB1 release (Figure 6). Etop was also found to increase ATP and HMGB1 release at 10nM and 50nM (Figure 6). Etop was previously found to increase extracellular ATP and HMGB1 when used in combination with cisplatin, but not as a single agent, in a lung cancer cell line [44]. Isp has not previously been described as an ICD inducer, but in the present work, 10nM and 50nM significantly increased extracellular ATP release (Figure 6a). Beyond the proposed mechanisms of increasing T-cell mediated cytotoxicity discussed so far, there are many other possible mechanistic explanations not explored in this work. For example, immunogenic modulation independent of induction of immunogenic cell death has been described for docetaxel [45]. This study found that docetaxel enhanced CD8+ T-cell mediated tumor cell killing but did not induce traditional markers of ICD such as ATP and HMGB1, but rather relied primarily on CRT translocation to the membrane [45]. A similar mechanism may be at play here with PTX and Isp. Isp did not increase HMGB1 release and PTX increased HMGB1 at 10nM but not 50nM (Figure 6), despite both compounds enhancing T-cell mediated cytotoxicity at 10nM and 50nM (Figure 4a,b). While these studies are informative, ICD is best studied as an in vivo phenomenon and future validation should include testing these compounds in mouse models of TNBC.
We next examined the effects of the compounds specifically on OT-1 CD8+ T-cells in vitro. No significant alterations in the cytokine profile of CD8+ T-cells were observed (Figure 7a), however, cytokine expression may need to be analyzed in the context of co-culture with tumor cells in order to observe composite alterations. The proliferation of CD8+ T-cells was also analyzed, and it was found that at 50nM, Bleo does not negatively impact proliferation while PTX does decrease T cell proliferation. This problem can be mitigated by using PTX at the lower concentration of 10nM , which is also effective (Figure 7c). The CD8+ T-cell specific toxicity of these compounds was further explored using CellTiter-Glo viability assays to calculate IC50s for each compound. While all four compounds are toxic to CD8+ T-cells at a high enough concentration (µM), Bleo and Etop are less toxic than are PTX and Isp with IC50s of 35nM, 61nM, 3nM, 4nM respectively (Figure 7c).
Bleo and PTX were chosen for follow-up analysis in 3D culture models. PTX was included since it is the current standard of care for TNBC. Bleo was chosen as the most promising of the three remaining compounds since Bleo induced MHCI expression, MHCII expression, ATP release, and HMGB1 release at concentrations as low as 10nM. Bleo also did not negatively impact CD8+ T-cell proliferation at 50nM or 10nM. Importantly, increased T-cell mediated cytotoxicity was observed at concentrations less than the IC50 for both CD8+ T-cells (35nM) and for PyMT-OVA tumor cells (20.84nM). Bleo+T significantly reduced spheroid size compared to Bleo and DMSO+T when used at 50nM at 10nM (Figure 8). To date, Bleo has not been tested in combination with ICI in TNBC or any tumor type. Toxicity remains a major concern that prevents the regular use of Bleo. Pulmonary toxicity involving pulmonary fibrosis is an adverse effect of Bleo reported to be experienced by about 10% of patients [46]. Lung and skin tissue lack expression of the hydrolase responsible for inactivating Bleo [36]. Respiratory immune related adverse events including interstitial lung disease and pneumonia are also reported for ICIs [47], and there would be concern of compounding these risk factors. However, targeted delivery strategies or refinement of dosing schedules may mitigate the risk of toxicity. Pre-clinical studies loading Bleo into exosomes or tumor targeting nanoparticles show promise in reducing toxicity and increasing drug delivery into the cytoplasm [48,49]. When Bleo and PTX were tested in an additional TNBC-like cell line, the E0771-OVA, both compounds enhanced T-cell mediated cytotoxicity, albeit at much higher concentrations than what was required in the PyMT-OVA cell line studies. Whereas 10nM of PTX or Bleo were sufficient to enhance T-cell mediated cytotoxicity in the PyMT-OVA cell line (Figure 4a,c), 100nM and 1uM respectively were required to enhance T-cell mediated cytotoxicity in the E0771-OVA cell line (Figure 8d,e). This is likely to due to baseline differences in the two cell lines’ sensitivities to PTX and Bleo. The E0771-OVA are less sensitive to PTX and Bleo in vitro and it has previously been shown that in in vivo mouse tumor models that E0771 tumors are less sensitive to PTX than are PyMT tumors [50]. This could be due to differences in drug efflux mechanisms in the different cell lines [51]. and further highlights the importance of validating findings and refining doses in multiple different TNBC models.
5. Conclusions
Overall, this work describes an HTS work-flow designed to identify compounds that enhance T-cell mediated cytotoxicity (Figure 1). The Anti-Cancer compound library from Vanderbilt University’s High Throughput Screening core was utilized in this study, but the work-flow can be adapted to screen other libraries as well as other cell types. PTX, Bleo, Etop, and Isp were identified and validated as compounds that enhance T-cell mediated cytotoxicity. Dose-dependent immunostimulatory effects were described, contributing to the growing body of literature working to identify optimal chemotherapy partners for use in combination with ICI. The PyMT-OVA cell line was tested here, but given the heterogeneity of TNBC, it will be useful to utilize additional TNBC models, including human TNBC organoids in the future to further elucidate the potential of using these compounds to potentially enhance response to ICI in TNBC.
Supplementary Materials
The following supporting information can be downloaded at the website of this paper posted on Preprints.org, Figure S1: Tool validation; Figure S2: Sample Tf v log[drug] curves used for AUC calculations; Table S1: AUC and SD values for all 448 compounds in Anti-Cancer compound library.
Author Contributions
Conceptualization, KKB, JB, and AR; methodology, ED, TH, and JB.; software, ED, JB, TH.; validation, KKB, PW, TH, and JB.; formal analysis, ED.; investigation, KKB, PAW, and TH.; resources, AR and JB.; writing—original draft preparation, KKB.; writing—review and editing, KKB and AR.; supervision, AR.; project administration, AR funding acquisition, AR. All authors have read and agreed to the published version of the manuscript.
Funding
This research was funded by the NCI (F31CA271790-01A1 (KKB), CA24332 (AR), R50-CA211206 (JAB), S10 ODO28719 and S10 ODO28715). Experiments were performed in the Vanderbilt High-Throughput Screening (HTS) Core Facility with assistance provided by Dr. Thomas Hasaka, Emily Days and Dr. Joshua Bauer. The HTS Core receives support from the Vanderbilt Institute of Chemical Biology and the Vanderbilt Ingram Cancer Center (P30 CA68485).
Conflicts of Interest
The authors declare no conflicts of interest.
References
- American Cancer Society Breast Cancer Facts & Figures 2022-2024; Atlanta , 2022.
- Cortes, J.; Cescon, D.W.; Rugo, H.S.; Nowecki, Z.; Im, S.-A.; Yusof, M.M.; Gallardo, C.; Lipatov, O.; Barrios, C.H.; Holgado, E.; et al. Pembrolizumab plus Chemotherapy versus Placebo plus Chemotherapy for Previously Untreated Locally Recurrent Inoperable or Metastatic Triple-Negative Breast Cancer (KEYNOTE-355): A Randomised, Placebo-Controlled, Double-Blind, Phase 3 Clinical Trial. Lancet 2020, 396, 1817–1828. [Google Scholar] [CrossRef] [PubMed]
- Gradishar, W.J.; Tjulandin, S.; Davidson, N.; Shaw, H.; Desai, N.; Bhar, P.; Hawkins, M.; O’Shaughnessy, J. Phase III Trial of Nanoparticle Albumin-Bound Paclitaxel Compared with Polyethylated Castor Oil-Based Paclitaxel in Women with Breast Cancer. J Clin Oncol 2005, 23, 7794–7803. [Google Scholar] [CrossRef] [PubMed]
- Galluzzi, L.; Humeau, J.; Buqué, A.; Zitvogel, L.; Kroemer, G. Immunostimulation with Chemotherapy in the Era of Immune Checkpoint Inhibitors. Nat Rev Clin Oncol 2020, 17, 725–741. [Google Scholar] [CrossRef] [PubMed]
- Axelrod, M.L.; Nixon, M.J.; Gonzalez-Ericsson, P.I.; Bergman, R.E.; Pilkinton, M.A.; McDonnell, W.J.; Sanchez, V.; Opalenik, S.R.; Loi, S.; Zhou, J.; et al. Changes in Peripheral and Local Tumor Immunity after Neoadjuvant Chemotherapy Reshape Clinical Outcomes in Patients with Breast Cancer. Clin Cancer Res 2021, 26, 5668–5681. [Google Scholar] [CrossRef] [PubMed]
- Jacob, S.L.; Huppert, L.A.; Rugo, H.S. Role of Immunotherapy in Breast Cancer. JCO Oncol Pract 2023, 19, 167–179. [Google Scholar] [CrossRef]
- Purcell, J.W.; Davis, J.; Reddy, M.; Martin, S.; Samayoa, K.; Vo, H.; Thomsen, K.; Bean, P.; Kuo, W.L.; Ziyad, S.; et al. Activity of the Kinesin Spindle Protein Inhibitor Ispinesib (SB-715992) in Models of Breast Cancer. Clin Cancer Res 2010, 16, 566–576. [Google Scholar] [CrossRef]
- Tan, M.H.; De, S.; Bebek, G.; Orloff, M.S.; Wesolowski, R.; Downs-Kelly, E.; Budd, G.T.; Stark, G.R.; Eng, C. Specific Kinesin Expression Profiles Associated with Taxane Resistance in Basal-like Breast Cancer. Breast Cancer Res Treat 2012, 131, 849–858. [Google Scholar] [CrossRef]
- Powell, R.T.; Redwood, A.; Liu, X.; Guo, L.; Cai, S.; Zhou, X.; Tu, Y.; Zhang, X.; Qi, Y.; Jiang, Y.; et al. Pharmacologic Profiling of Patient-Derived Xenograft Models of Primary Treatment-Naïve Triple-Negative Breast Cancer. Sci Rep 2020, 10. [Google Scholar] [CrossRef]
- Bailly, C. Etoposide: A Rider on the Cytokine Storm. Cytokine 2023, 168. [Google Scholar] [CrossRef]
- Montecucco, A.; Zanetta, F.; Biamonti, G. Molecular Mechanisms of Etoposide. EXCLI J 2015, 14, 95–108. [Google Scholar] [CrossRef]
- Pacheco, J.M. Immunotherapy for Extensive Stage Small Cell Lung Cancer. J Thorac Dis 2020, 12, 6212–6224. [Google Scholar] [CrossRef] [PubMed]
- Giannone, G.; Milani, A.; Ghisoni, E.; Genta, S.; Mittica, G.; Montemurro, F.; Valabrega, G. Oral Etoposide in Heavily Pre-Treated Metastatic Breast Cancer: A Retrospective Series. Breast 2018, 38, 160–164. [Google Scholar] [CrossRef] [PubMed]
- Cabel, L.; Carton, M.; Cheaib, B.; Pierga, J.Y.; Dalenc, F.; Mailliez, A.; Levy, C.; Jacot, W.; Debled, M.; Leheurteur, M.; et al. Oral Etoposide in Heavily Pre-Treated Metastatic Breast Cancer: Results from the ESME Cohort and Comparison with Other Chemotherapy Regimens. Breast Cancer Res Treat 2019, 173, 397–406. [Google Scholar] [CrossRef] [PubMed]
- Mignot, G.; Bugaut, H.; Ghiringhelli, F. Immune Ambivalence: The Schizophrenic Bleomycin. Oncoimmunology 2013, 2. [Google Scholar] [CrossRef] [PubMed]
- Bugaut, H.; Bruchard, M.; Berger, H.; Derangère, V.; Odoul, L.; Euvrard, R.; Ladoire, S.; Chalmin, F.; Végran, F.; Rébé, C.; et al. Bleomycin Exerts Ambivalent Antitumor Immune Effect by Triggering Both Immunogenic Cell Death and Proliferation of Regulatory T Cells. PLoS One 2013, 8. [Google Scholar] [CrossRef]
- Schiff, P.B.; Fant, J.; Horwitz, S.B. Promotion of Microtubule Assembly in Vitro by Taxol. Nature 1979, 277, 665–667. [Google Scholar] [CrossRef]
- Palmieri, C.; Linden, H.; Birrell, S.N.; Wheelwright, S.; Lim, E.; Schwartzberg, L.S.; Dwyer, A.R.; Hickey, T.E.; Rugo, H.S.; Cobb, P.; et al. Activity and Safety of Enobosarm, a Novel, Oral, Selective Androgen Receptor Modulator, in Androgen Receptor-Positive, Oestrogen Receptor-Positive, and HER2-Negative Advanced Breast Cancer (Study G200802): A Randomised, Open-Label, Multicentre, Multinational, Parallel Design, Phase 2 Trial. Lancet Oncol 2024, 25, 317–325. [Google Scholar] [CrossRef]
- Robarge, K.D.; Lee, W.; Eigenbrot, C.; Ultsch, M.; Wiesmann, C.; Heald, R.; Price, S.; Hewitt, J.; Jackson, P.; Savy, P.; et al. Structure Based Design of Novel 6,5 Heterobicyclic Mitogen-Activated Protein Kinase Kinase (MEK) Inhibitors Leading to the Discovery of Imidazo[1,5-a] Pyrazine G-479. Bioorg Med Chem Lett 2014, 24, 4714–4723. [Google Scholar] [CrossRef]
- Di Masi, A.; Leboffe, L.; De Marinis, E.; Pagano, F.; Cicconi, L.; Rochette-Egly, C.; Lo-Coco, F.; Ascenzi, P.; Nervi, C. Retinoic Acid Receptors: From Molecular Mechanisms to Cancer Therapy. Mol Aspects Med 2015, 41, 1–115. [Google Scholar] [CrossRef]
- Dawson, M.A.; Curry, J.E.; Barber, K.; Beer, P.A.; Graham, B.; Lyons, J.F.; Richardson, C.J.; Scott, M.A.; Smyth, T.; Squires, M.S.; et al. AT9283, a Potent Inhibitor of the Aurora Kinases and Jak2, Has Therapeutic Potential in Myeloproliferative Disorders: Research Paper. Br J Haematol 2010, 150, 46–57. [Google Scholar] [CrossRef]
- Bryan, C.; Rice, C.; Hoffman, H.; Harkisheimer, M.; Sweeney, M.; Skordalakes, E. Structural Basis of Telomerase Inhibition by the Highly Specific BIBR1532. Structure 2015, 23, 1934–1942. [Google Scholar] [CrossRef] [PubMed]
- Cui, J.J.; Tran-Dubé, M.; Shen, H.; Nambu, M.; Kung, P.P.; Pairish, M.; Jia, L.; Meng, J.; Funk, L.; Botrous, I.; et al. Structure Based Drug Design of Crizotinib (PF-02341066), a Potent and Selective Dual Inhibitor of Mesenchymal-Epithelial Transition Factor (c-MET) Kinase and Anaplastic Lymphoma Kinase (ALK). J Med Chem 2011, 54, 6342–6363. [Google Scholar] [CrossRef] [PubMed]
- Qi, W.; Shakalya, K.; Stejskal, A.; Goldman, A.; Beeck, S.; Cooke, L.; Mahadevan, D. NSC348884, a Nucleophosmin Inhibitor Disrupts Oligomer Formation and Induces Apoptosis in Human Cancer Cells. Oncogene 2008, 27, 4210–4220. [Google Scholar] [CrossRef] [PubMed]
- Du, C.; Guan, X.; Yan, J. Two-Pore Channel Blockade by Phosphoinositide Kinase Inhibitors YM201636 and PI-103 Determined by a Histidine Residue near Pore-Entrance. Commun Biol 2022, 5. [Google Scholar] [CrossRef]
- Hilgard, P.; Kampherm, E.; Nolan, L.; Pohl, J.; Reissmann, T. Investigation into the Immunological Effects of Miltefosine, a New Anticancer Agent under Development. J Cancer Res Clin Oncol 1991, 117, 403–408. [Google Scholar] [CrossRef]
- Montecucco, A.; Zanetta, F.; Biamonti, G. Molecular Mechanisms of Etoposide. EXCLI J 2015, 14, 95–108. [Google Scholar] [CrossRef]
- Rivera-Rivera, Y.; Marina, M.; Jusino, S.; Lee, M.; Velázquez, J.V.; Chardón-Colón, C.; Vargas, G.; Padmanabhan, J.; Chellappan, S.P.; Saavedra, H.I. The Nek2 Centrosome-Mitotic Kinase Contributes to the Mesenchymal State, Cell Invasion, and Migration of Triple-Negative Breast Cancer Cells. Sci Rep 2021, 11, 9016. [Google Scholar] [CrossRef]
- Zhang, C. qi; Bai, X.; Wan, Y.; Li, H.; Sun, H. Efficacy, Safety, and Retention Rate of Extended-Release Divalproex versus Conventional Delayed-Release Divalproex: A Protocol for Systematic Review and Meta-Analysis. Medicine 2021, 100. [Google Scholar] [CrossRef]
- Tuli, H.S.; Rath, P.; Chauhan, A.; Ramniwas, S.; Vashishth, K.; Varol, M.; Jaswal, V.S.; Haque, S.; Sak, K. Phloretin, as a Potent Anticancer Compound: From Chemistry to Cellular Interactions. Molecules 2022, 27. [Google Scholar] [CrossRef]
- Krop, I.; Demuth, T.; Guthrie, T.; Wen, P.Y.; Mason, W.P.; Chinnaiyan, P.; Butowski, N.; Groves, M.D.; Kesari, S.; Freedman, S.J.; et al. Phase I Pharmacologic and Pharmacodynamic Study of the Gamma Secretase (Notch) Inhibitor MK-0752 in Adult Patients with Advanced Solid Tumors. J Clin Oncol 2012, 30, 2307–2313. [Google Scholar] [CrossRef]
- Garton, A.J.; Crew, A.P.A.; Franklin, M.; Cooke, A.R.; Wynne, G.M.; Castaldo, L.; Kahler, J.; Winski, S.L.; Franks, A.; Brown, E.N.; et al. OSI-930: A Novel Selective Inhibitor of Kit and Kinase Insert Domain Receptor Tyrosine Kinases with Antitumor Activity in Mouse Xenograft Models. Cancer Res 2006, 66, 1015–1024. [Google Scholar] [CrossRef] [PubMed]
- Das, S.; Becker, B.N.; Hoffmann, F.M.; Mertz, J.E. Complete Reversal of Epithelial to Mesenchymal Transition Requires Inhibition of Both ZEB Expression and the Rho Pathway. BMC Cell Biol 2009, 10. [Google Scholar] [CrossRef]
- Borisa, A.C.; Bhatt, H.G. A Comprehensive Review on Aurora Kinase: Small Molecule Inhibitors and Clinical Trial Studies. Eur J Med Chem 2017, 140, 1–19. [Google Scholar] [CrossRef] [PubMed]
- Nakahara, T.; Takeuchi, M.; Kinoyama, I.; Minematsu, T.; Shirasuna, K.; Matsuhisa, A.; Kita, A.; Tominaga, F.; Yamanaka, K.; Kudoh, M.; et al. YM155, a Novel Small-Molecule Survivin Suppressant, Induces Regression of Established Human Hormone-Refractory Prostate Tumor Xenografts. Cancer Res 2007, 67, 8014–8021. [Google Scholar] [CrossRef] [PubMed]
- Ohnuma, T.; Holland, J.F.; Masuda, H.; Waligunda, J.A.; Goldberg, G.A. Microbiological Assay of Bleomycin: Inactivation, Tissue Distribution, and Clearance. Cancer 1974, 33, 1230–1238. [Google Scholar] [CrossRef]
- Wang, X.Q.; Danenberg, E.; Huang, C.S.; Egle, D.; Callari, M.; Bermejo, B.; Dugo, M.; Zamagni, C.; Thill, M.; Anton, A.; et al. Spatial Predictors of Immunotherapy Response in Triple-Negative Breast Cancer. Nature 2023, 621, 868–876. [Google Scholar] [CrossRef]
- Rodriguez-Barbosa, J.I.; Azuma, M.; Zelinskyy, G.; Perez-Simon, J.A.; del Rio, M.L. Critical Role of PD-L1 Expression on Non-Tumor Cells Rather than on Tumor Cells for Effective Anti-PD-L1 Immunotherapy in a Transplantable Mouse Hematopoietic Tumor Model. Cancer Immunology, Immunotherapy 2020, 69, 1001–1014. [Google Scholar] [CrossRef]
- Fucikova, J.; Kepp, O.; Kasikova, L.; Petroni, G.; Yamazaki, T.; Liu, P.; Zhao, L.; Spisek, R.; Kroemer, G.; Galluzzi, L. Detection of Immunogenic Cell Death and Its Relevance for Cancer Therapy. Cell Death Dis 2020, 11. [Google Scholar] [CrossRef]
- Vilgelm, A.E.; Johnson, C.A.; Prasad, N.; Yang, J.; Chen, S.C.; Ayers, G.D.; Pawlikowski, J.S.; Raman, D.; Sosman, J.A.; Kelley, M.; et al. Connecting the Dots: Therapy-Induced Senescence and a Tumor-Suppressive Immune Microenvironment. J Natl Cancer Inst 2016, 108. [Google Scholar] [CrossRef]
- Yan, C.; Saleh, N.; Yang, J.; Nebhan, C.A.; Vilgelm, A.E.; Reddy, E.P.; Roland, J.T.; Johnson, D.B.; Chen, S.C.; Shattuck-Brandt, R.L.; et al. Novel Induction of CD40 Expression by Tumor Cells with RAS/RAF/PI3K Pathway Inhibition Augments Response to Checkpoint Blockade. Mol Cancer 2021, 20. [Google Scholar] [CrossRef]
- Ljunggren, H.-G.; Karre, K. In Search of the “Missing Self”: MHC Molecules and NK Cell Recognition. Immunol Today 1990, 11, 237–244. [Google Scholar] [CrossRef] [PubMed]
- Gu, S.S.; Zhang, W.; Wang, X.; Jiang, P.; Traugh, N.; Li, Z.; Meyer, C.; Stewig, B.; Xie, Y.; Bu, X.; et al. Therapeutically Increasing MHC-I Expression Potentiates Immune Checkpoint Blockade. Cancer Discov 2021, 11, 1524–1541. [Google Scholar] [CrossRef] [PubMed]
- Solari, J.I.G.; Filippi-Chiela, E.; Pilar, E.S.; Nunes, V.; Gonzalez, E.A.; Figueiró, F.; Andrade, C.F.; Klamt, F. Damage-Associated Molecular Patterns (DAMPs) Related to Immunogenic Cell Death Are Differentially Triggered by Clinically Relevant Chemotherapeutics in Lung Adenocarcinoma Cells. BMC Cancer 2020, 20. [Google Scholar] [CrossRef] [PubMed]
- Hodge, J.W.; Garnett, C.T.; Farsaci, B.; Palena, C.; Tsang, K.Y.; Ferrone, S.; Gameiro, S.R. Chemotherapy-Induced Immunogenic Modulation of Tumor Cells Enhances Killing by Cytotoxic T Lymphocytes and Is Distinct from Immunogenic Cell Death. Int J Cancer 2013, 133, 624–636. [Google Scholar] [CrossRef]
- Haugnes, H.S.; Oldenburg, J.; Bremnes, R.M. Pulmonary and Cardiovascular Toxicity in Long-Term Testicular Cancer Survivors. Urologic Oncology: Seminars and Original Investigations 2015, 33, 399–406. [Google Scholar] [CrossRef]
- Yin, Q.; Wu, L.; Han, L.; Zheng, X.; Tong, R.; Li, L.; Bai, L.; Bian, Y. Immune-Related Adverse Events of Immune Checkpoint Inhibitors: A Review. Front Immunol 2023, 14. [Google Scholar] [CrossRef]
- Shaikh, S.; Younis, M.; Yingying, S.; Tanziela, T.; Yuan, L. Bleomycin Loaded Exosomes Enhanced Antitumor Therapeutic Efficacy and Reduced Toxicity. Life Sci 2023, 330. [Google Scholar] [CrossRef]
- Yuba, E.; Osaki, T.; Ono, M.; Park, S.; Harada, A.; Yamashita, M.; Azuma, K.; Tsuka, T.; Ito, N.; Imagawa, T.; et al. Bleomycin-Loaded PH-Sensitive Polymer-Lipid-Incorporated Liposomes for Cancer Chemotherapy. Polymers (Basel) 2018, 10. [Google Scholar] [CrossRef]
- Bullock, K.K.; Shattuck-Brandt, R.; Scalise, C.; Luo, W.; Chen, S.C.; Saleh, N.; Gonzalez-Ericsson, P.I.; Garcia, G.; Sanders, M.E.; Ayers, G.D.; et al. Endogenous PAKT Activity Is Associated with Response to AKT Inhibition Alone and in Combination with Immune Checkpoint Inhibition in Murine Models of TNBC. Cancer Lett 2024, 586, 216681. [Google Scholar] [CrossRef]
- Athanassiadou, P. : Athanassiades, P.; Petrakakou, E.; Zerva, C.; Mavrikakis, M.; Immunocytochemical detection of P-glycoprotein in the management of malignant effusions. J Clin Res Clin Oncol, 1997; 123, 456–490. [Google Scholar] [CrossRef]
Figure 2.
Schematic of high-throughput screening experimental timeline.
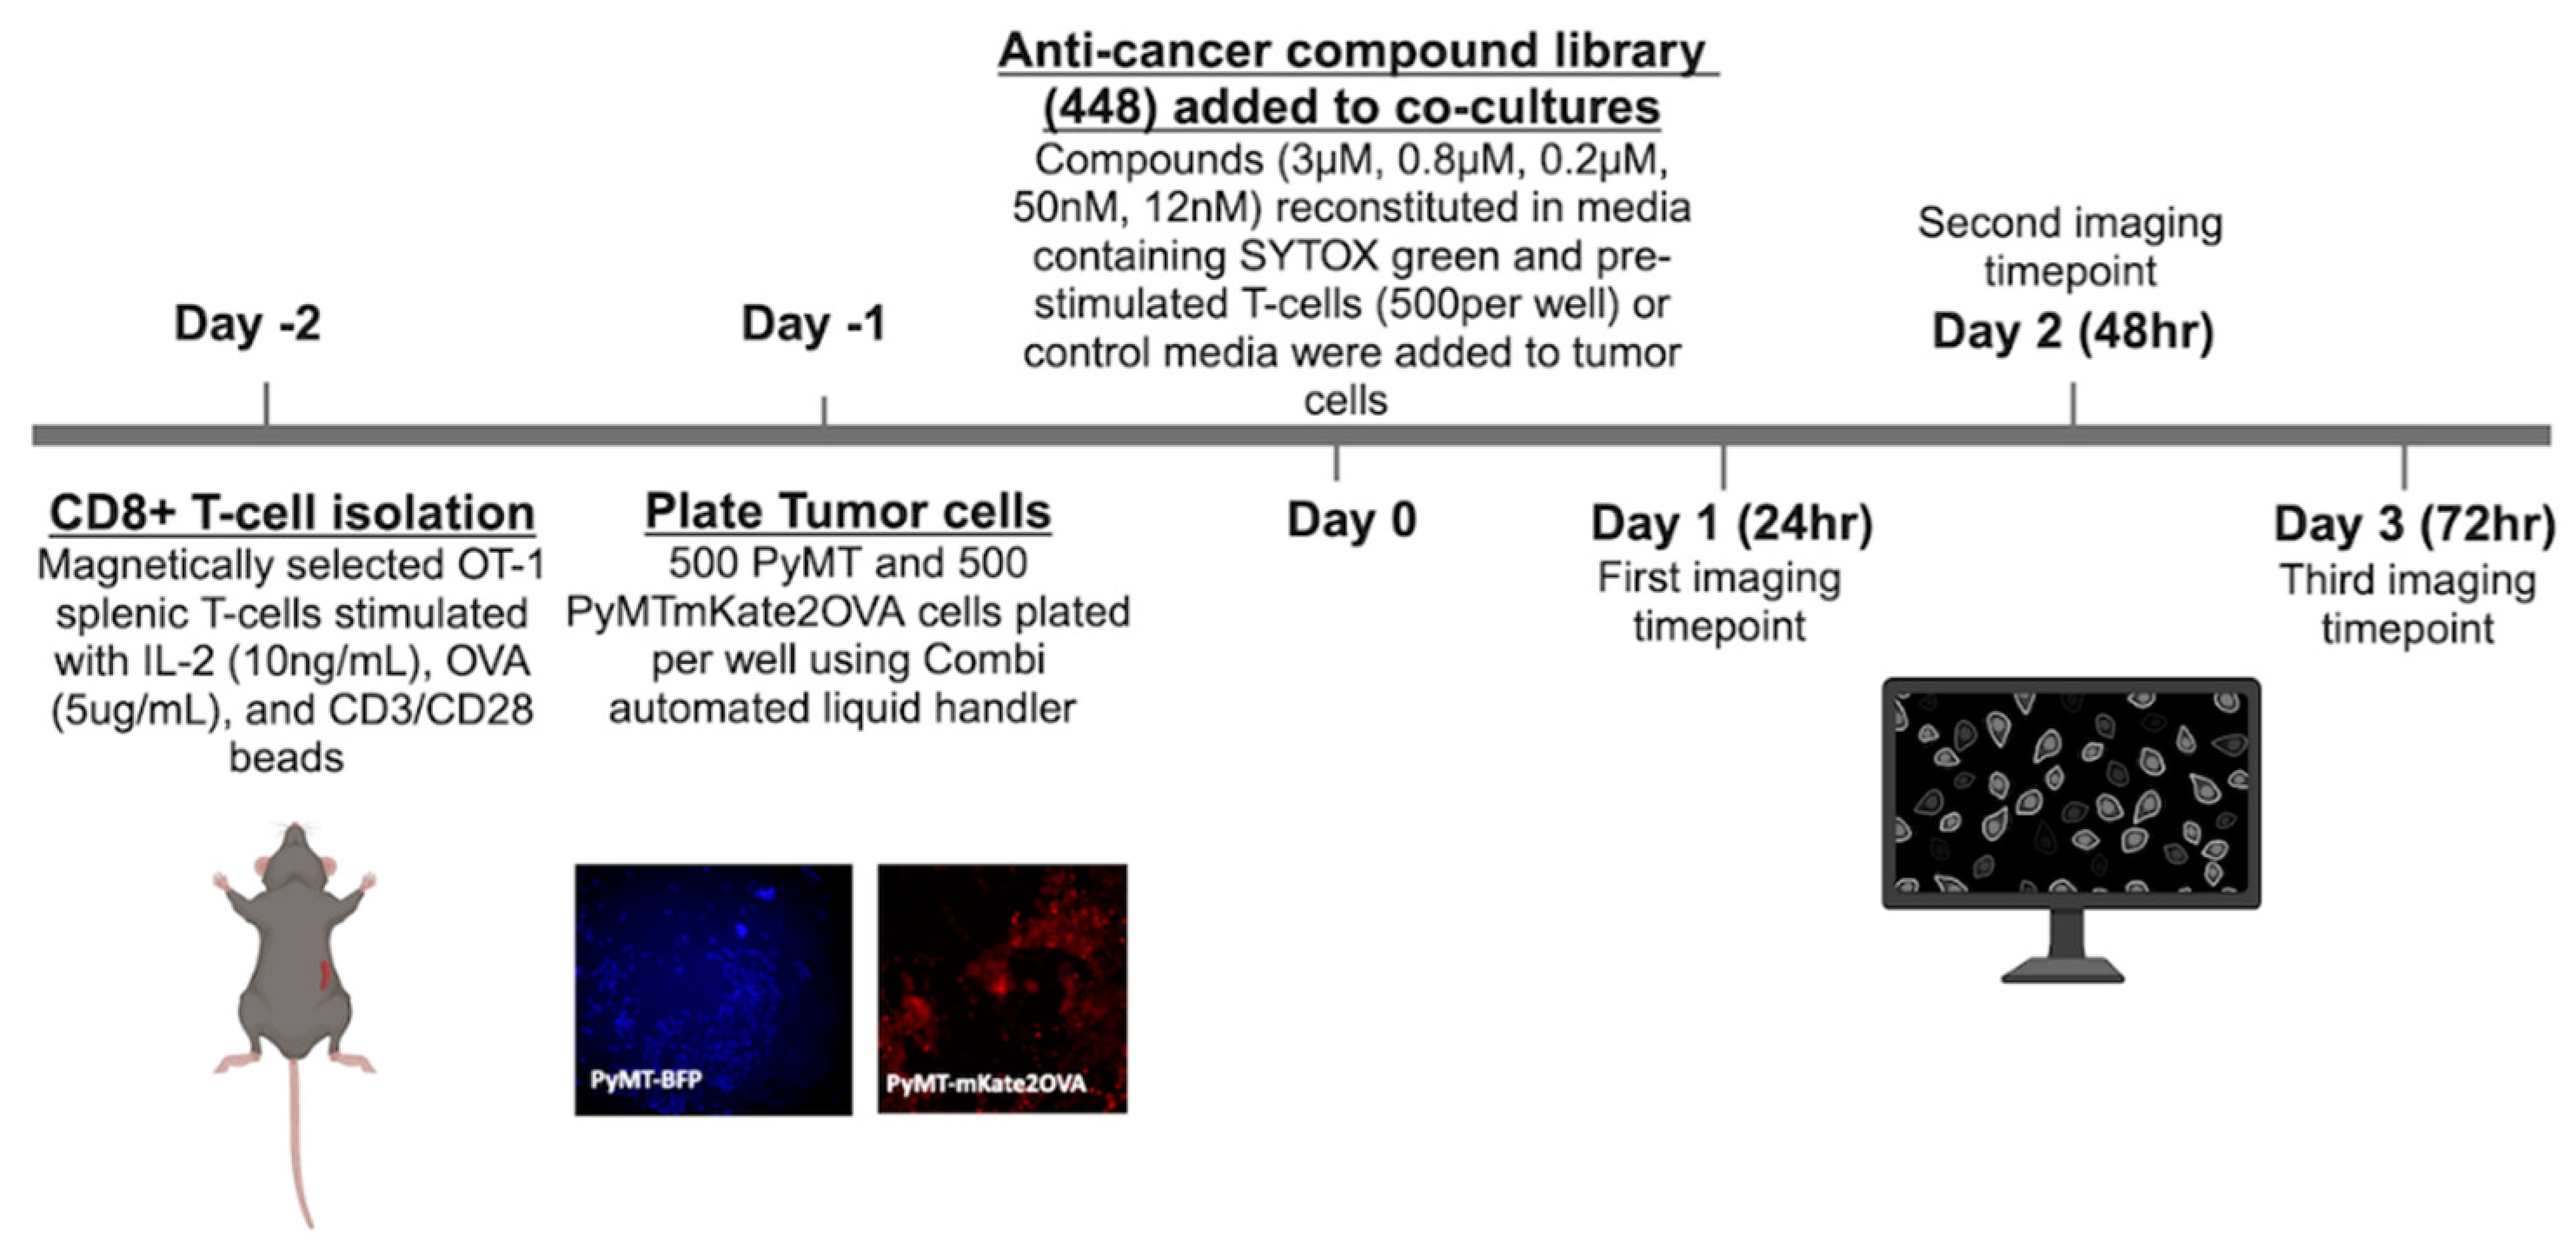
Figure 3.
Selection of high priority compounds (a) Compounds with a Tf>3 at more than one concentration for each time point (b) Average AUC of Tf v concentration across three time points plotted v standard deviation. Colored compounds chosen for detailed mechanistic follow-up due to clinical relevance.
Figure 4.
Confirmation of increased T-cell mediated cytotoxicity. CellTiterGlo viability assay of PyMT-OVA cells after 48hrs of treatment of (a) PTX (b) Isp (c) Bleo (d) Etop with or without CD8+ T-cells co-cultured at a 1:5 (T-cell:tumor cell) ratio. T-cell groups compared to DMSO + T using a one-way ANOVA with Tukey’s post hoc analysis. For each treatment concentration, T-cell versus no T-cell condition compared using an unpaired t-test. *=p<0.05, **=p<0.01, ***=p<0.001, ****=p<0.0001 e. Apoptosis assessed via FACS analysis of staining for AnnexinV and 7-AAD. CD8+ T-cells stained with CellTrace blue and excluded by gating f. representative flow plots of Annexin V and 7-AAD staining of PyMT-OVA tumor cells.
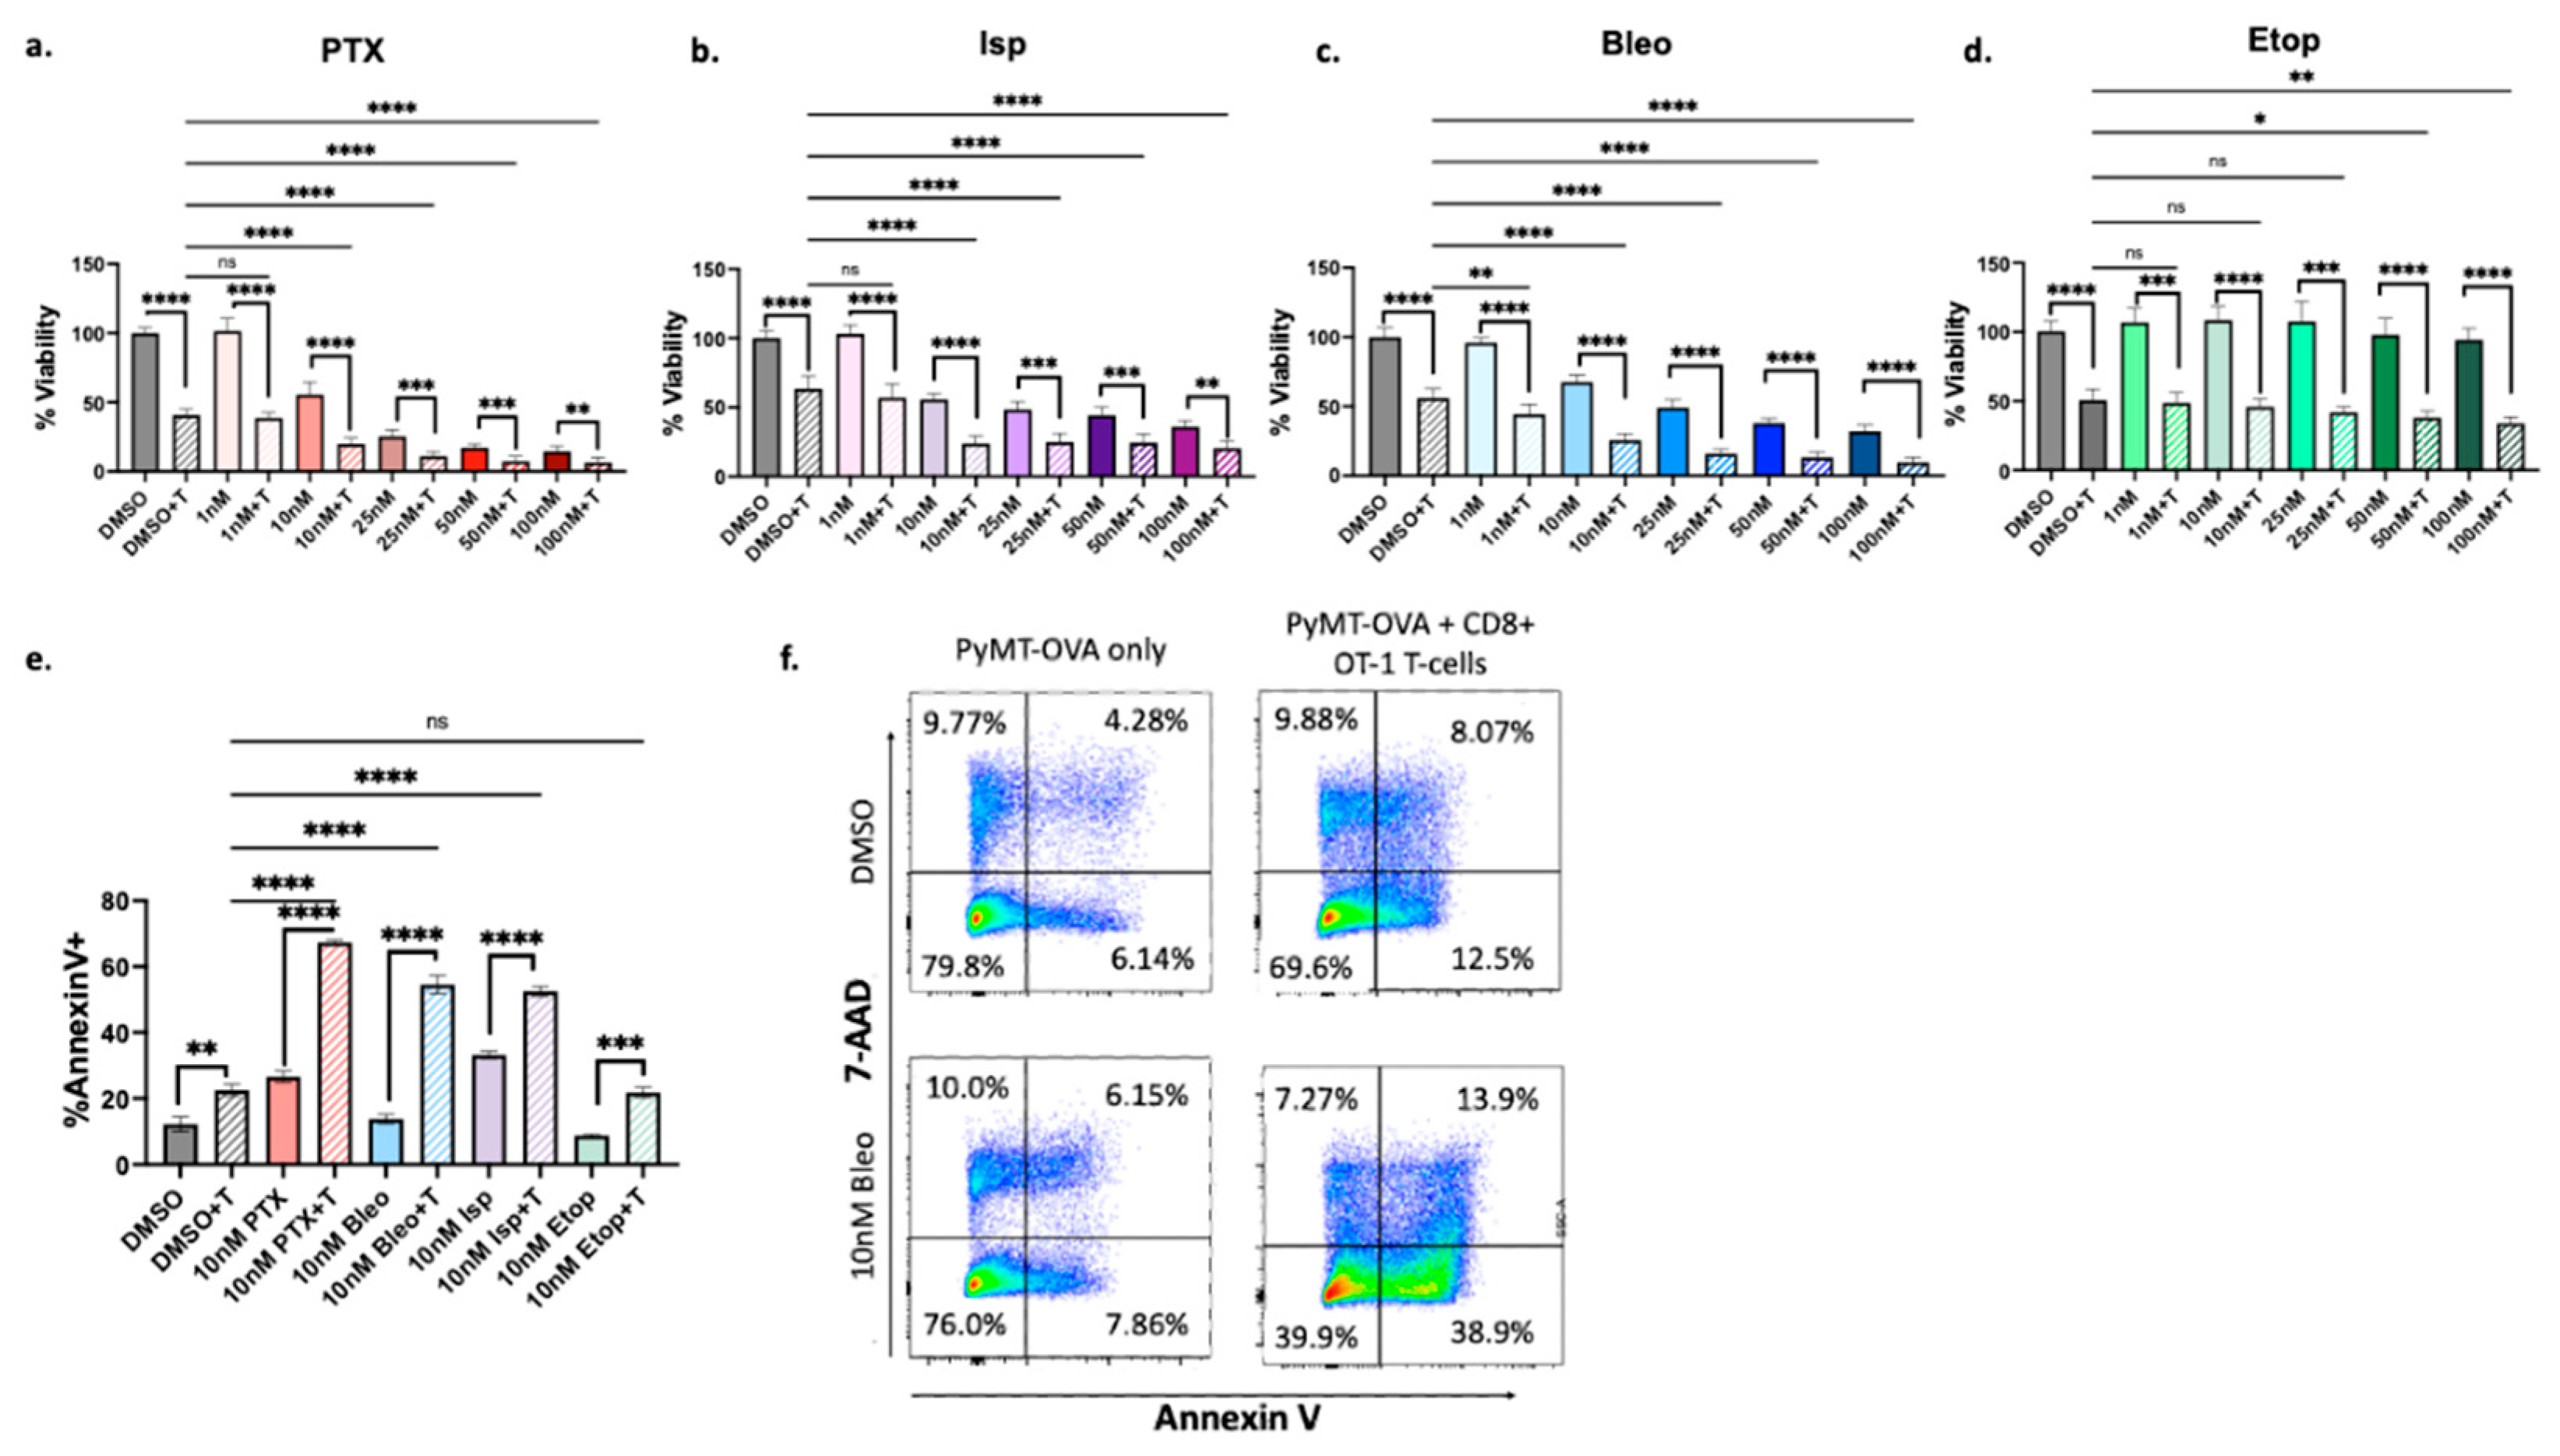
Figure 5.
Effect of lead compounds on MHCI, MHCII, and PD-L1 expression by tumor cells. (a) PyMT-OVA tumor cells were treated with indicated compounds at 50nM for 48hr and MHCI (H2kb) expression was assessed via flow cytometry. (b) PTX and Bleo tested at a range of doses for 48hrs. MHCI induction assessed via flow cytometry. (c) CellTiterBlue viability assay of OT-1 CD8+ T-cells treated with indicated compounds for 48hrs. IC50 values were calculated using a non-linear regression of the data plotted at log10[drug] versus fluorescence using Prism version 10.1.0. (d) MHCII expression assessed via flow cytometry after 48hr of treatment with indicated compounds at 50nM. (e) PD-L1 expression assessed via flow cytometry after 48hr of treatment of indicated compounds at 50nM. Treatment groups compared to DMSO control using a one-way ANOVA and Tukey’s post-hoc analysis. *=p<0.05, **=p<0.01, ***=p<0.001, ****=p<0.0001.
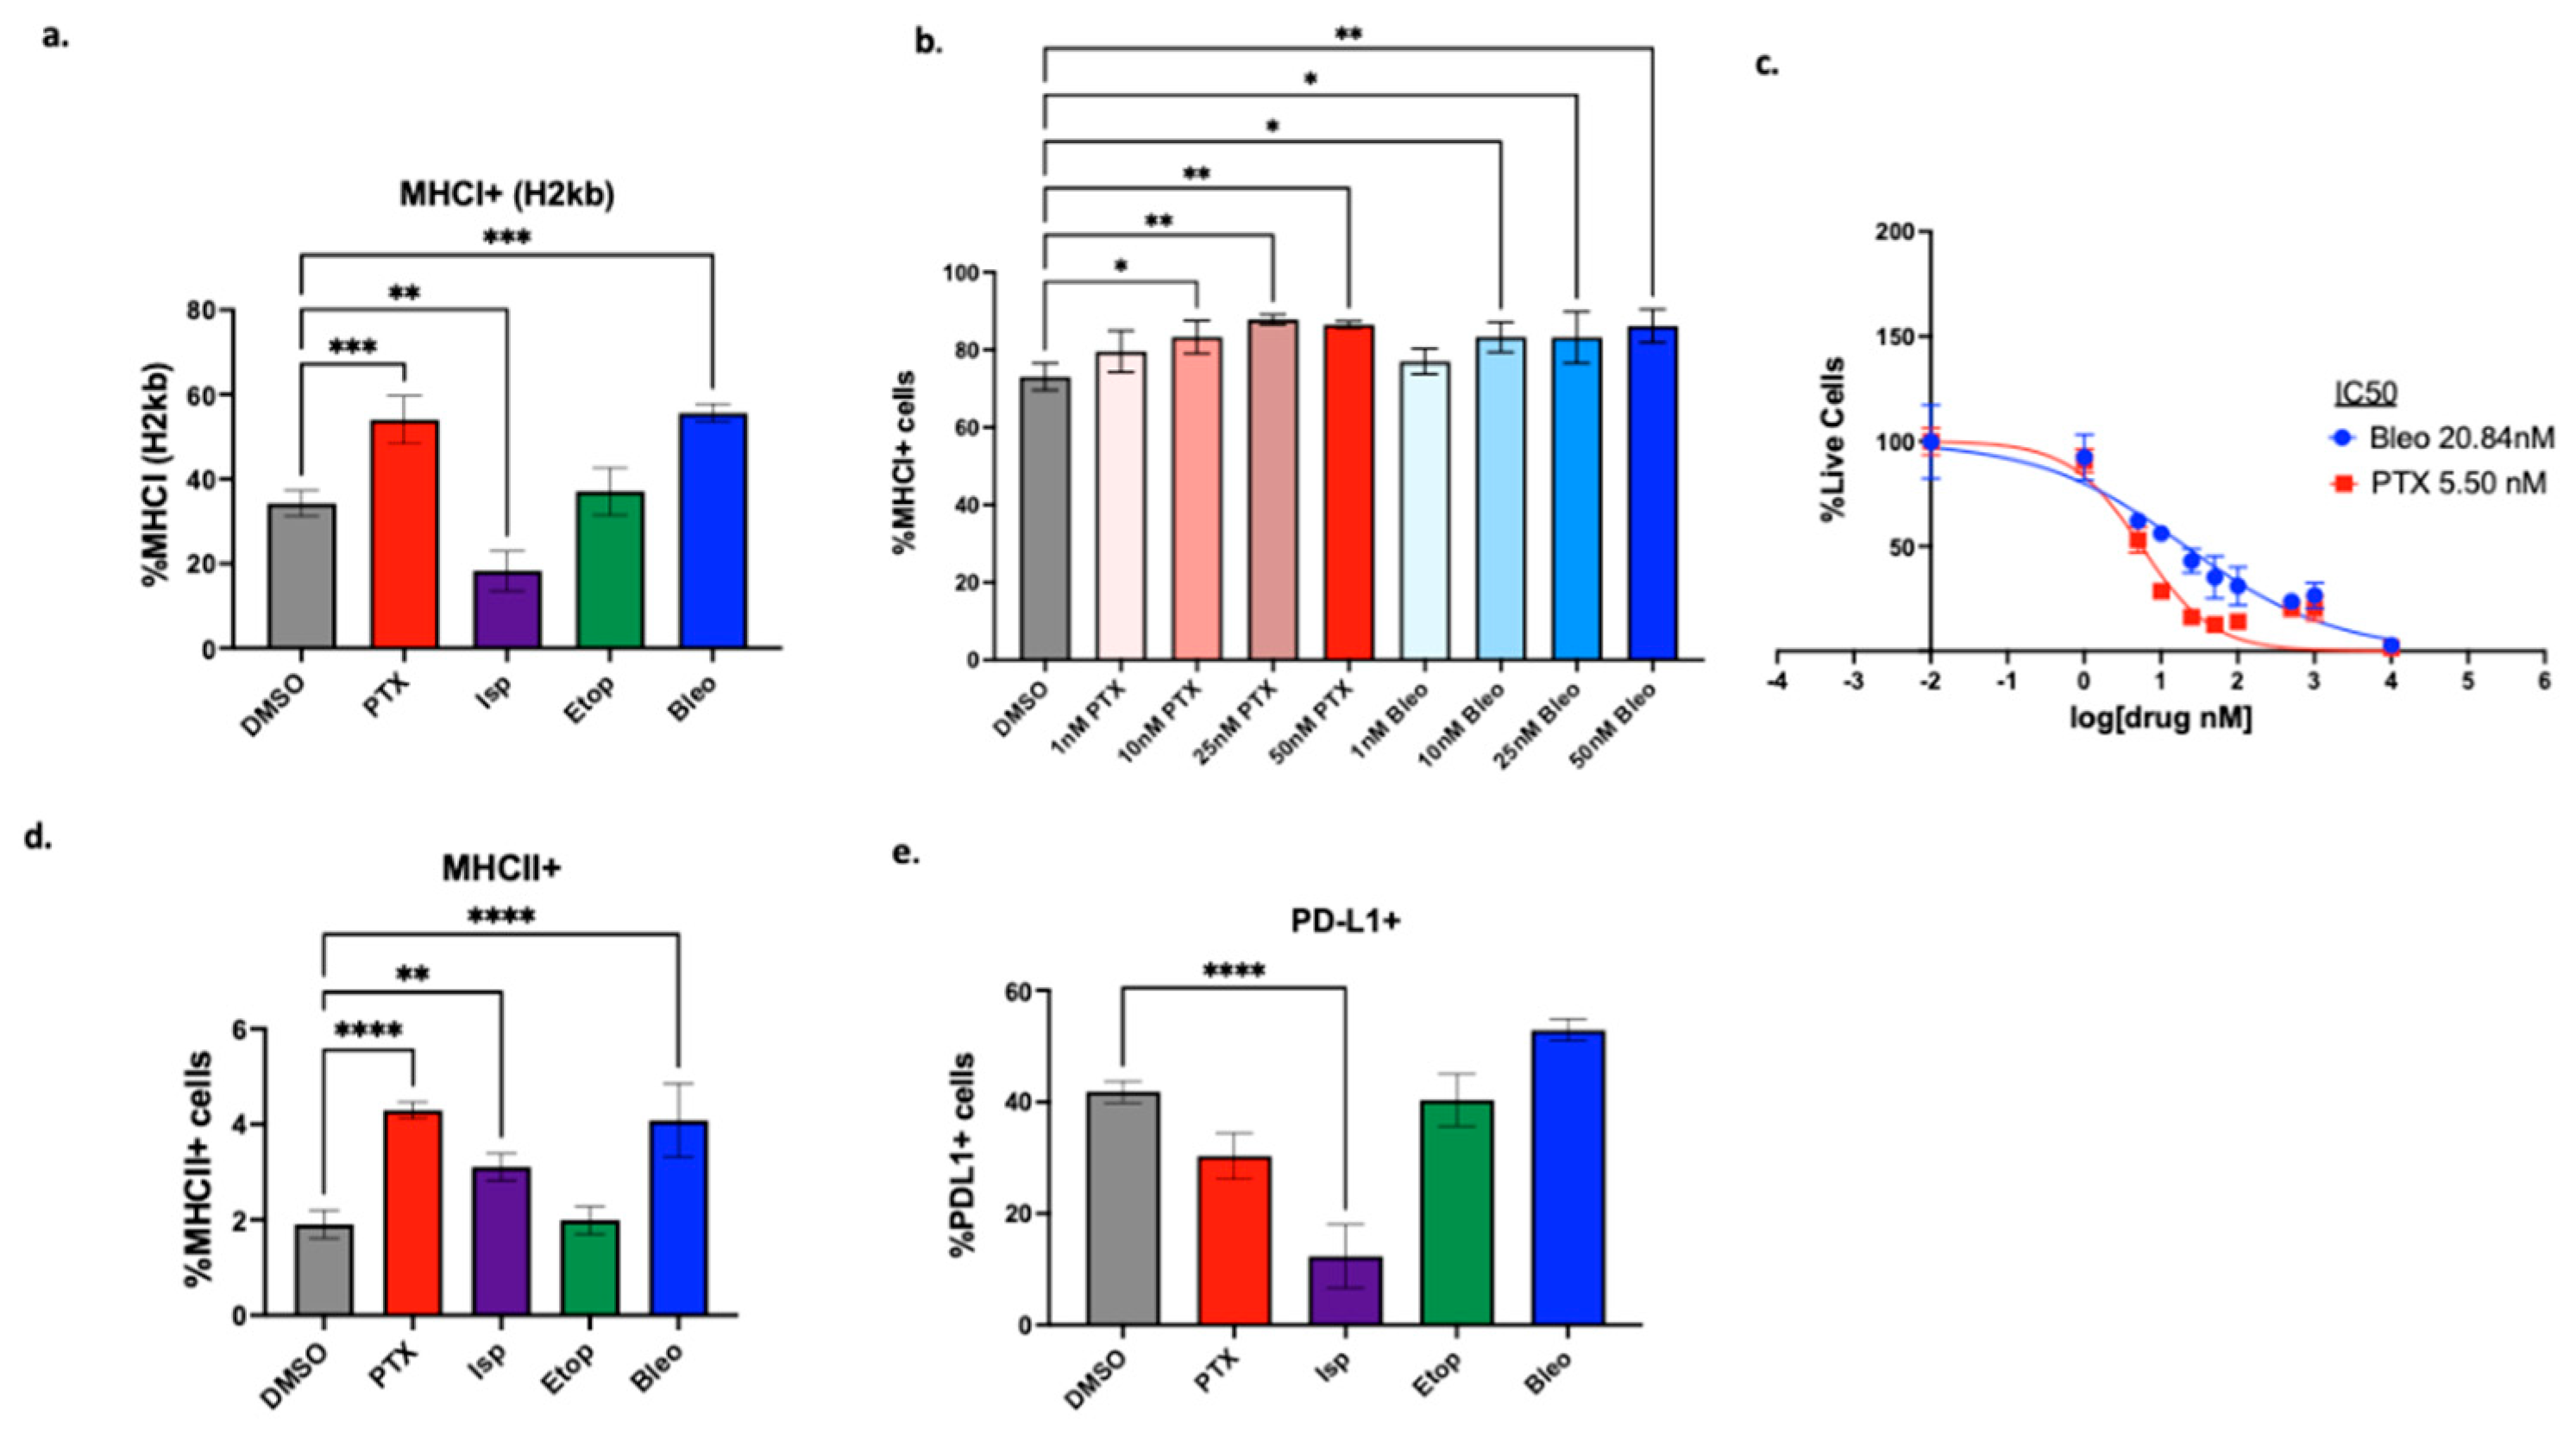
Figure 6.
Induction of markers of ICD. (a) Extracellular ATP and (b) HMGB1 measured after 24hrs of treatment with indicated compounds. Treatment conditions compared to DMSO control using a one-way ANOVA and Tukey’s post-hoc analysis *=p<0.05, **=p<0.01, ***=p<0.001, ****=p<0.0001.
Figure 6.
Induction of markers of ICD. (a) Extracellular ATP and (b) HMGB1 measured after 24hrs of treatment with indicated compounds. Treatment conditions compared to DMSO control using a one-way ANOVA and Tukey’s post-hoc analysis *=p<0.05, **=p<0.01, ***=p<0.001, ****=p<0.0001.
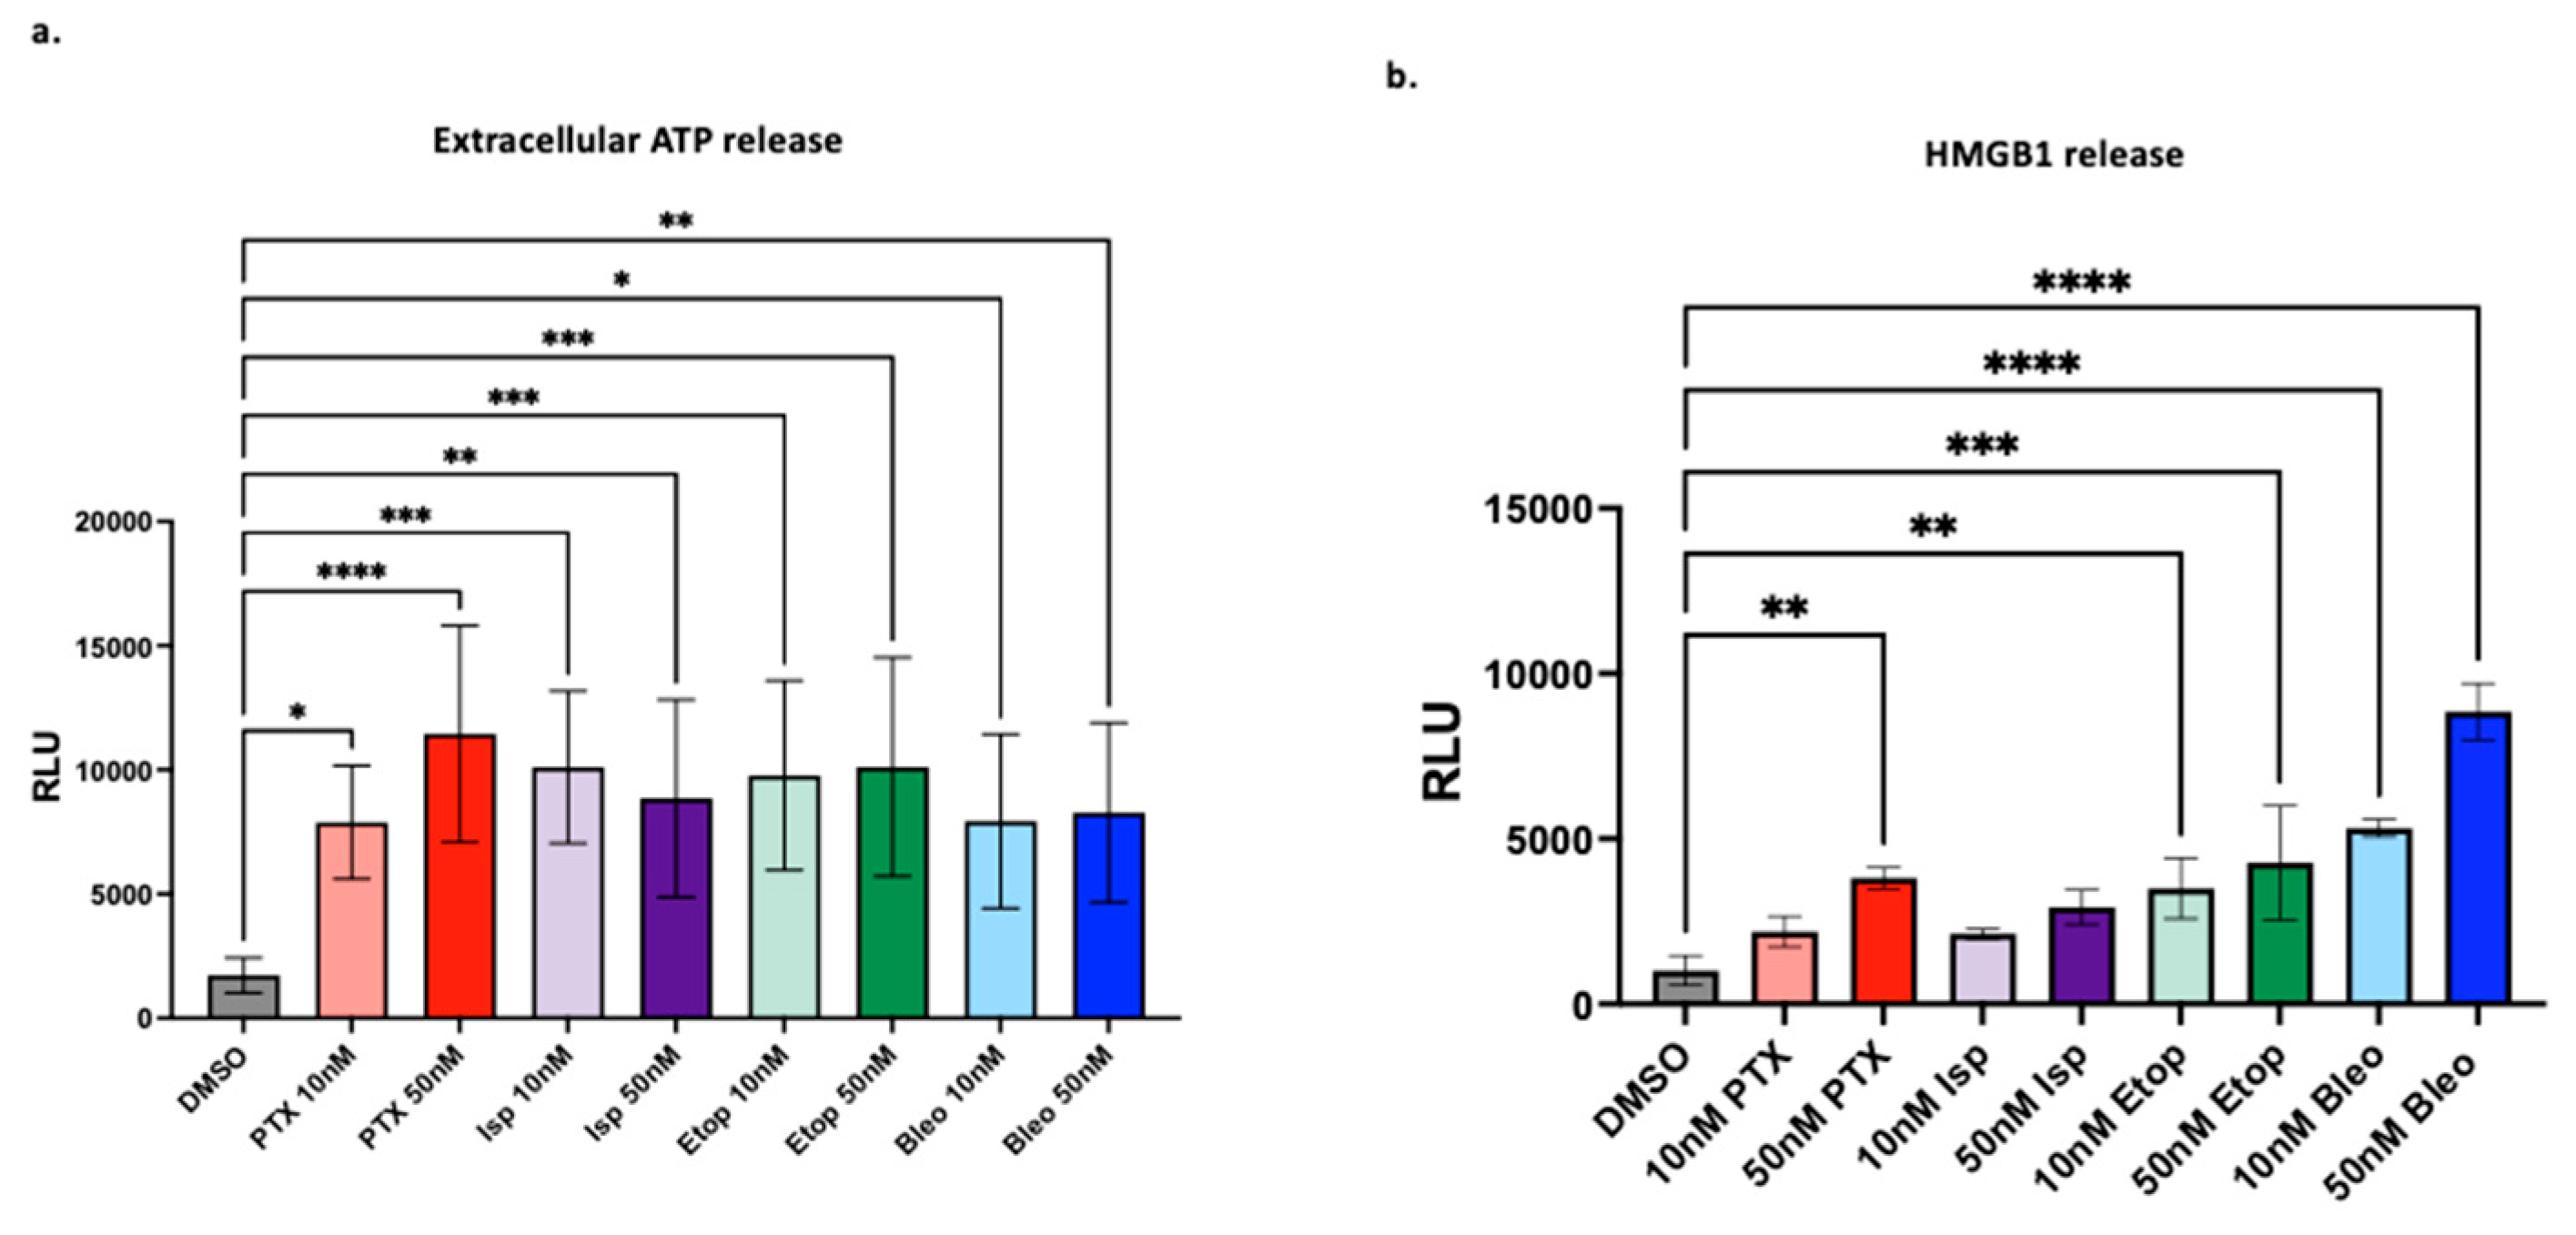
Figure 7.
Effect of lead compounds on CD8+ T-cells (a) Luminex cytokine array analysis of supernatants from OT-1 CD8+ T-cells treated with the indicated compounds at 50nM for 48hr. n=3 biological replicates. Data from IFNy and TNF shown in expanded view. (b) CellTiterGlo viability assay of OT-1 CD8+ T-cells treated with indicated compounds for 48hrs. IC50 values were calculated using a non-linear regression of the data plotted at log10[drug] versus luminescence using Prism version 10.1.0. Values presented as mean plus SD of three independent experiments. (c) CellTracker Assessment of OT-1 CD8+ T-cell proliferation via CellTracker proliferation assay. Mean fluorescent intensity (MFI) measured from samples at 24hr, 48hr, 72hr. For each timepoint, treatment conditions compared to corresponding DMSO control using a one-way ANOVA and Tukey’s post hoc analysis **=p<0.01. Representative plot of fluorescent intensity peak shown.
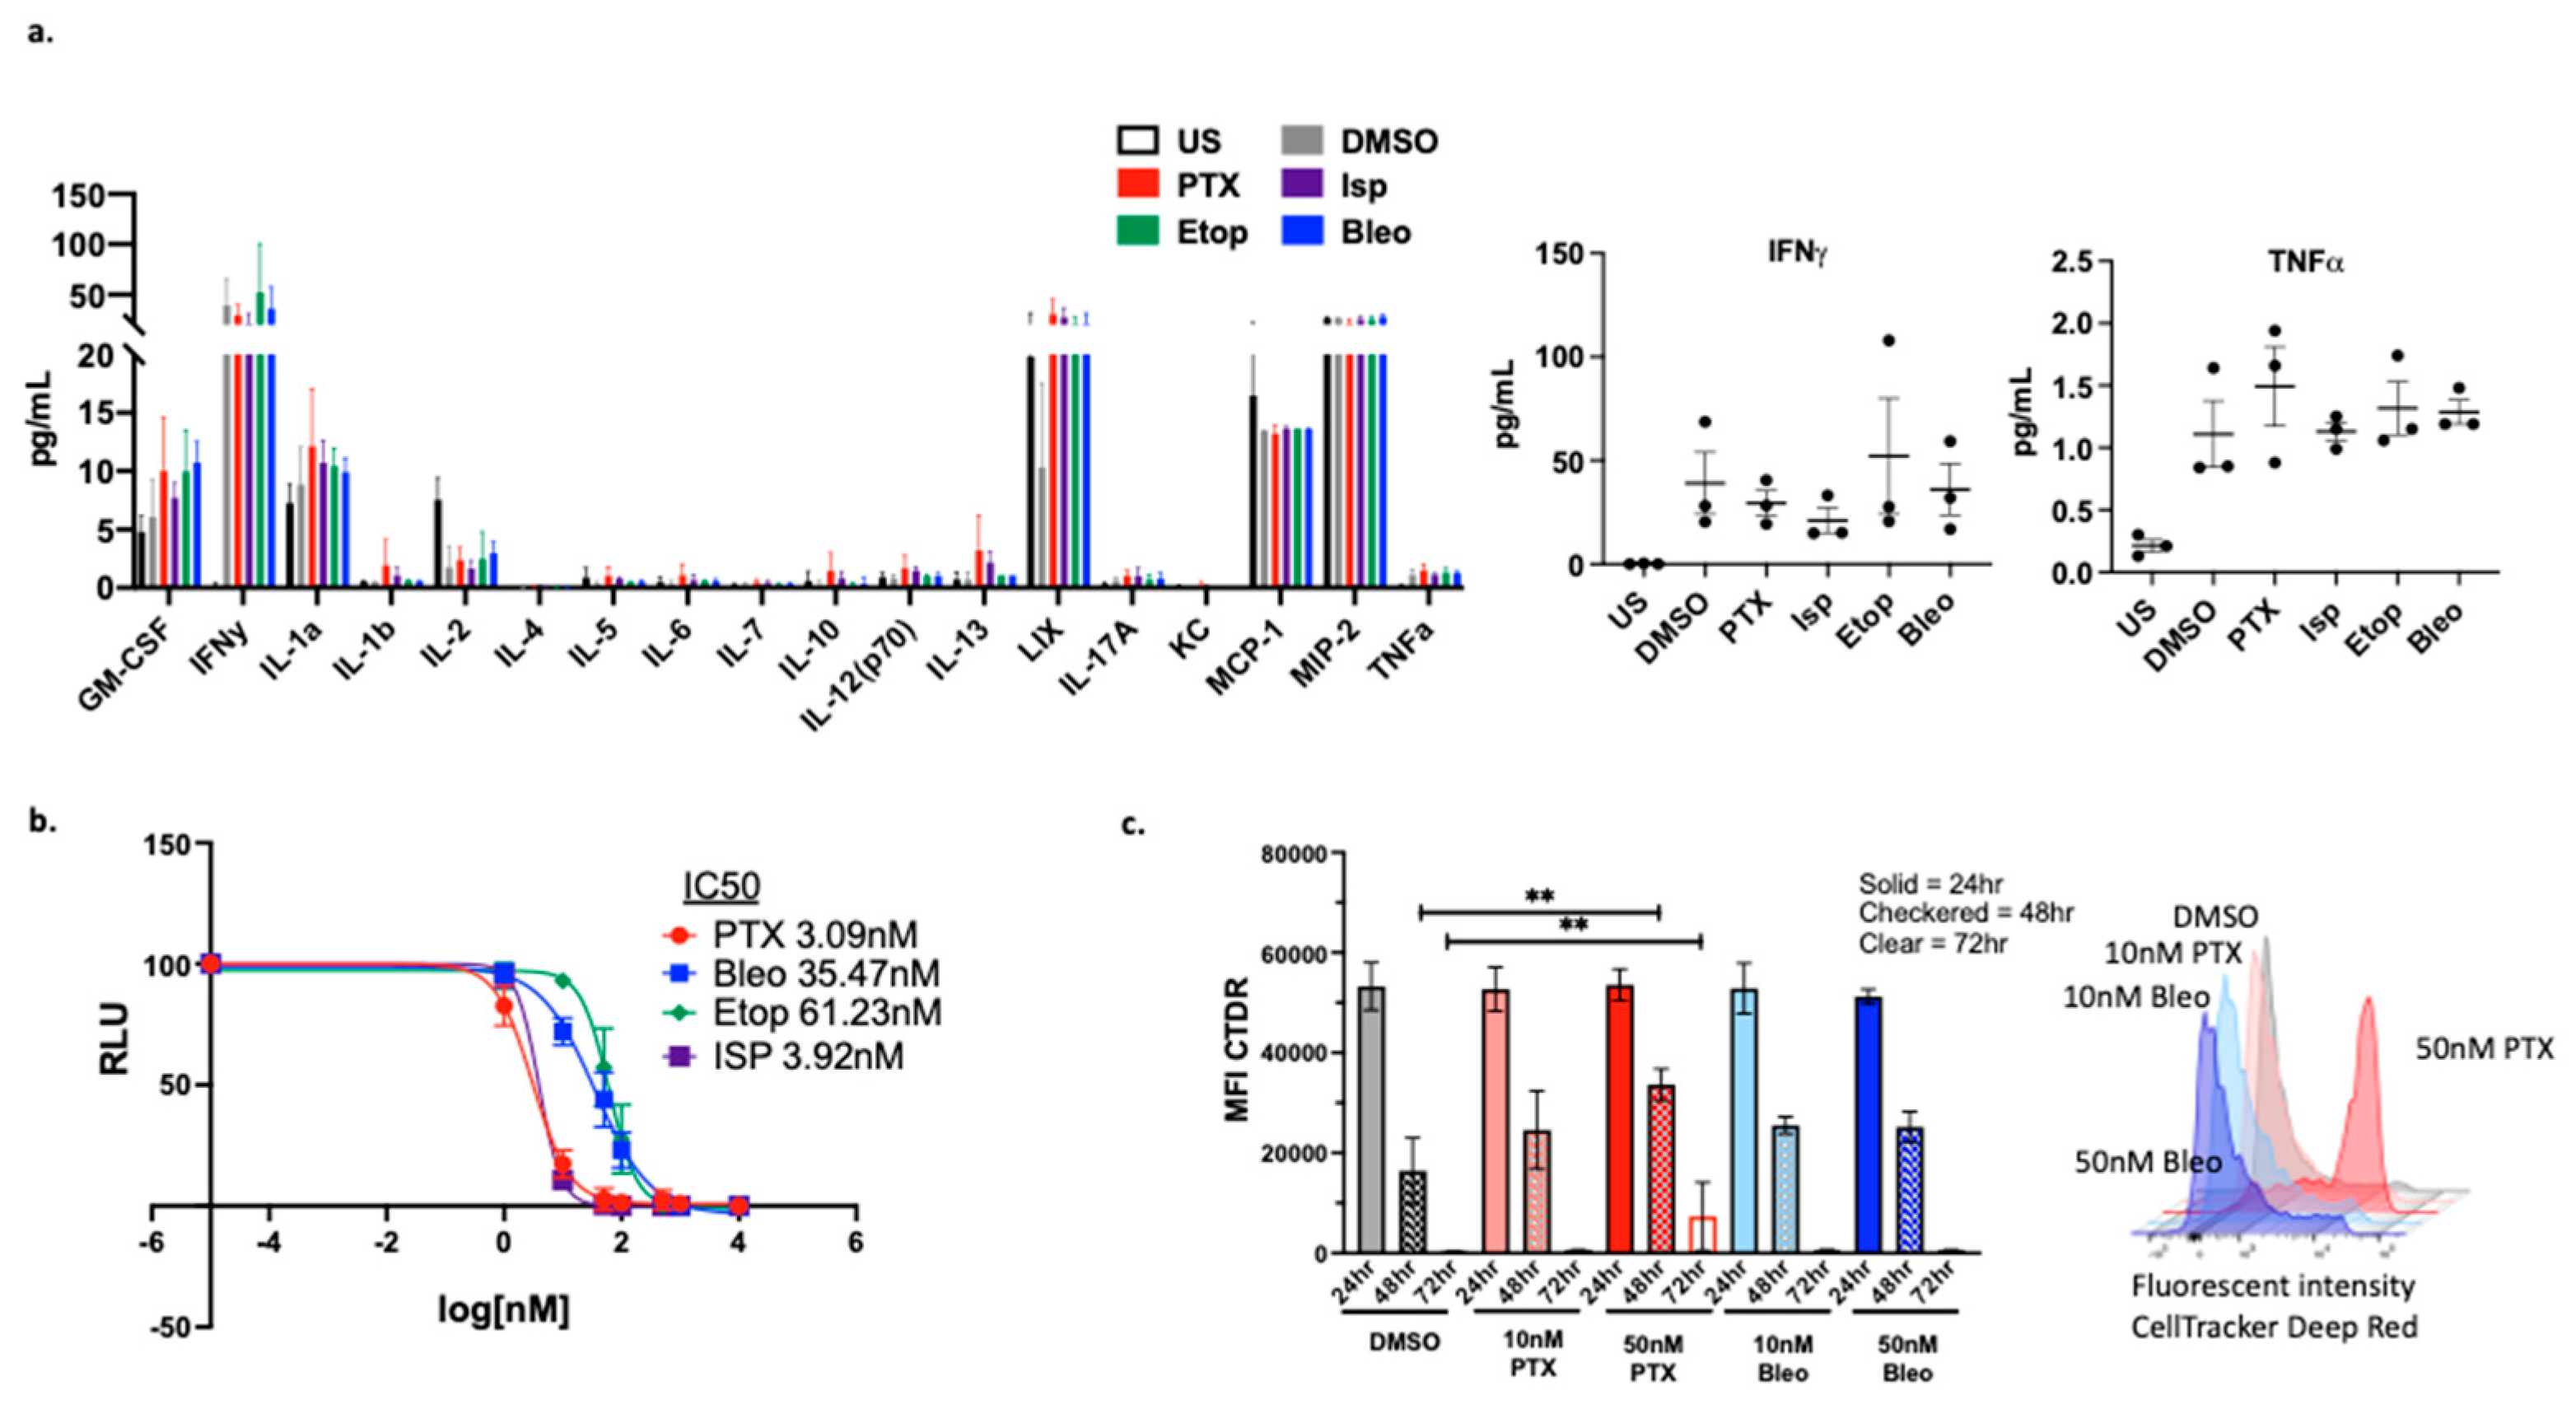
Figure 8.
Validation of PTX and Bleo in 3D culture models. (a) PyMT-OVA cells grown as spheroids in 5% Matrigel in 24-well low-attachment plates and treated with indicated compounds for 48hr. Representative brightfield 20x images shown. Scale bar = 150µm. Enlarged insert showing small tumor spheroid. (b) PyMT-OVA cells grown as spheroids in 5% Matrigel in 96-well low-attachment plates. OT-1 CD8+ T-cells labeled with CellTracker Deep Red (red) and tumor cells labeled with DAPI (blue). Representative 10x fluorescent images shown. Scale bar = 275µm. For (a) and (b) PTX + T and Bleo + T compared to DMSO + T using a one-way ANOVA and Tukey’s post-hoc analysis. For each treatment condition, T-cell versus no T-cell conditions compared using an unpaired t-test. *=p<0.05, **=p<0.01, ***=p<0.001, ****=p<0.0001. (c) Zoomed in capture from 20x image of 10nM PTX + T showing T-cells (red) infiltrating tumor spheroid (blue) (d) CellTiterGlo viability assay of E0771-OVA cells after 48hrs of treatment of PTX or (e) Bleo with or without CD8+ T-cells co-cultured at a 1:5 (T-cell:tumor cell) ratio. T-cell groups compared to DMSO + T using a one-way ANOVA with Tukey’s post hoc analysis. For each treatment concentration, T-cell versus no T-cell condition compared using an unpaired t-test. *=p<0.05, **=p<0.01, ***=p<0.001, ****=p<0.0001.
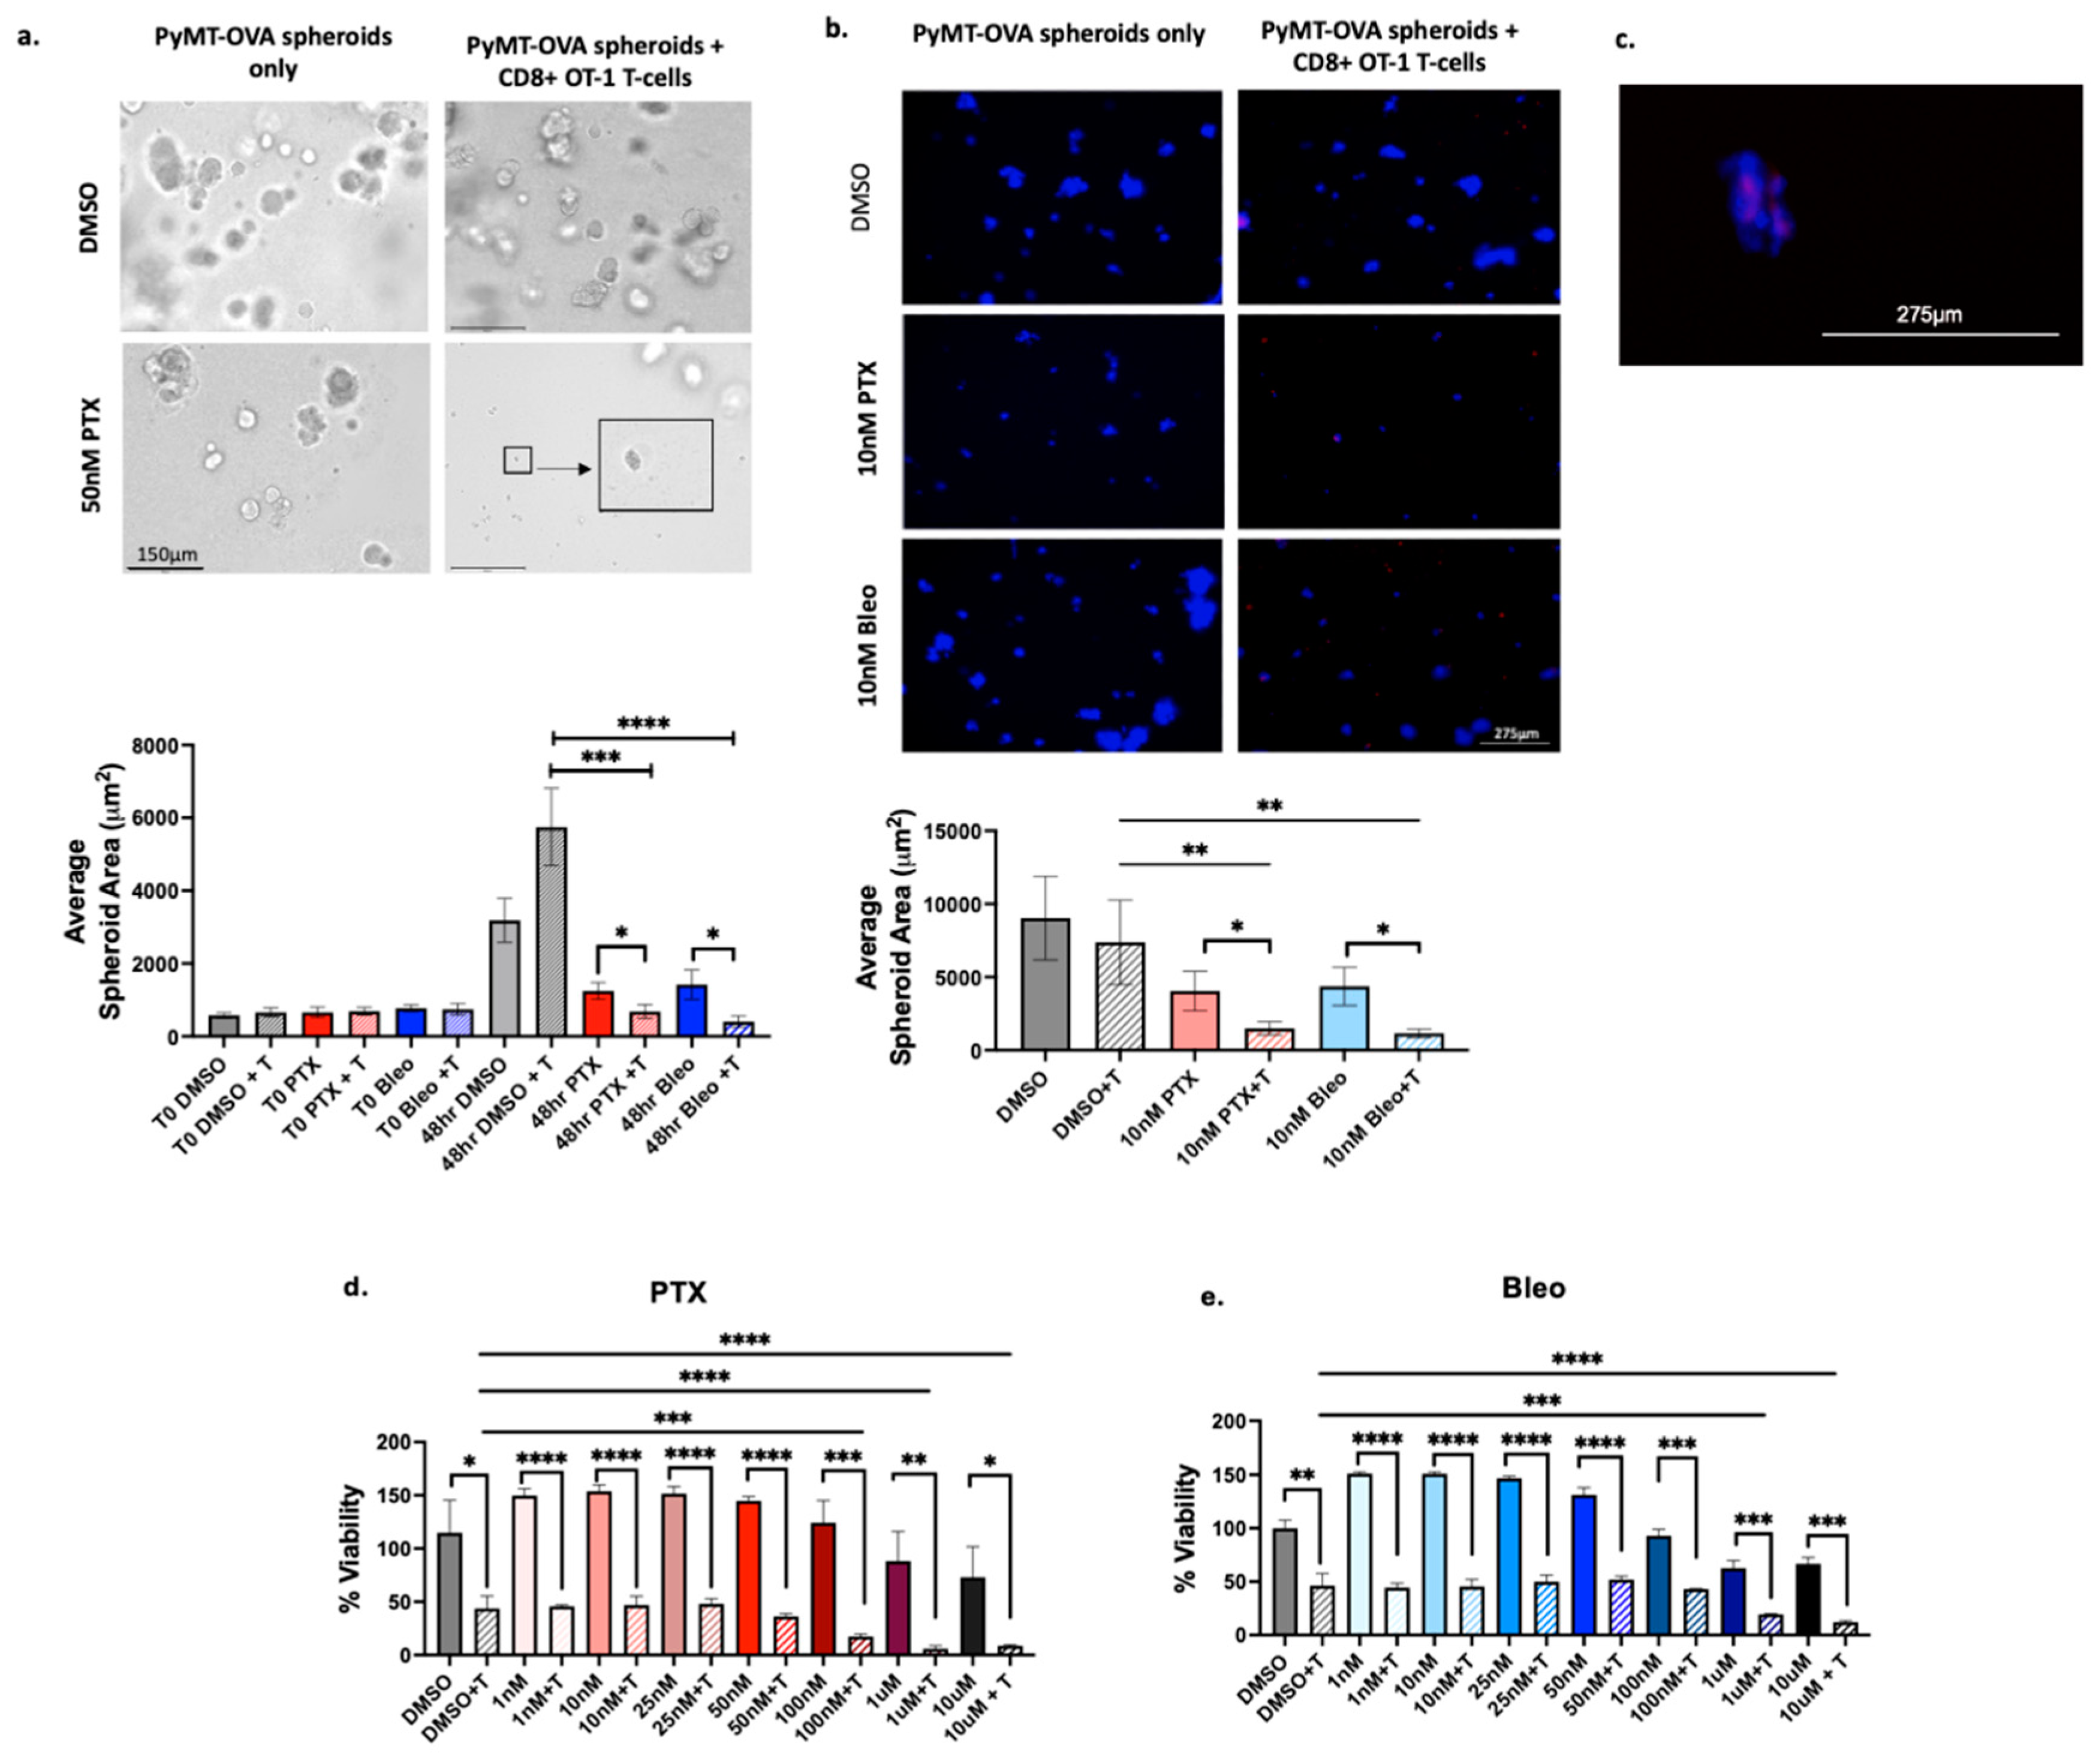

Table 1.
List of compounds with SD<20 and AUC≥ 7.
| Compound | AUC | SD | Drug Class | Ref |
|---|---|---|---|---|
| Paclitaxel | 6.99 | 1.11 | Taxane chemotherapy | [17] |
| Ispinesib (Sb-715992) | 7.06 | 3.84 | Kinesin spindle protein inhibitor | [7] |
| MK-2866 (GTx-024) | 7.25 | 3.88 | Nonsteroidal selective androgen receptor modulator | [18] |
| GDC-0623 | 7.31 | 4.09 | MEK1 inhibitor | [19] |
| Tretinoin (Aberela) | 7.33 | 4.7 | Vitamin A derivative | [20] |
| AT9283 | 7.40 | 4.24 | Aurora kinase A/B and Jak2 inhibitor | [21] |
| BIBR1532 | 7.49 | 1.88 | Telomerase inhibitor | [22] |
| Crizotinib (PF-02341066) | 7.76 | 0.87 | c-MET and ALK inhibitor | [23] |
| NSC348884 | 7.79 | 3.85 | Nucleophosphmin inhibitor | [24] |
| YM201636 | 7.85 | 1.83 | PIKfyve inhibitor | [25] |
| Miltefosine | 8.03 | 4.04 | Alkylphosphocholine | [26] |
| Etoposide (VP-16) | 8.04 | 8.08 | Topoisomerase II inhibitor | [27] |
| INH6 | 8.23 | 3.81 | Nek2/Hec1 inhibitor | [28] |
| Divalproex sodium | 8.39 | 6.07 | Anti-epileptic1 | [29] |
| Isoretinoin | 8.72 | 9.08 | Vitamin A derivative | [20] |
| Phloretin | 9.05 | 7.15 | Natural dihydrochalcone | [30] |
| MK-0752 | 9.06 | 9.79 | γ-secretase inhibitor | [31] |
| OSI-930 | 10.99 | 3.85 | c-Kit inhibitor | [32] |
| Y-27632 2HCI | 11.00 | 12.19 | ROCK1/2 inhibitor | [33] |
| CYC116 | 11.60 | 10.85 | Aurora Kinase A/B inhibitor | [34] |
| YM155 (Sepantronium Bromide) | 12.25 | 10.78 | Survivin inhibitor | [35] |
| Bleomycin sulfate | 12.39 | 14.99 | glycopeptide antibiotic | [36] |
Disclaimer/Publisher’s Note: The statements, opinions and data contained in all publications are solely those of the individual author(s) and contributor(s) and not of MDPI and/or the editor(s). MDPI and/or the editor(s) disclaim responsibility for any injury to people or property resulting from any ideas, methods, instructions or products referred to in the content. |
© 2024 by the authors. Licensee MDPI, Basel, Switzerland. This article is an open access article distributed under the terms and conditions of the Creative Commons Attribution (CC BY) license (https://creativecommons.org/licenses/by/4.0/).
Copyright: This open access article is published under a Creative Commons CC BY 4.0 license, which permit the free download, distribution, and reuse, provided that the author and preprint are cited in any reuse.


