
Submitted:
06 November 2024
Posted:
07 November 2024
You are already at the latest version
Abstract
This study focuses on Tsunami detection using SIMRAD Radar. A tsunami is a condition in which sea waves overflow the land and cause severe damage, which can claim human lives, as well as important infrastructure such as schools, buildings, and housing on the coast. As a sovereign country and has resilience in various fields including security and ocean exploration, Indonesia must apply appropriate technology, in this case, a smart radar that can detect high sea waves from tens of km away even 100 km if radar capacity is maximized. And able to provide fast information for disaster emergency response teams to swiftly notify the surrounding community about the arrival of a tsunami, even predict before this tsunami hits the coast. In this research, a comprehensive measurement of the radar system is carried out. The radar used and developed is SIMRAD Radar Helo 6 and can be integrated with data from other hardware such as SBE 26Plus, to obtain comprehensive data about the marine environment. In the measurement process, several combinations of measurements are needed starting from how to get digital data, process digital data, and turn it into a real-time image in the form of a Graphical User Interface SIMRAD Radar Hello 6. In the search, SIMRAD Radar is placed on the coast, while SBE26Plus is placed in the ocean with a certain depth in the coastal area for seawater pressure and sea level measurement. This radar system can be converted from the SBE26Plus data results from the Acoustic Doppler Current Profiler (ADCP), and also SIMRAD real-time monitoring at the coastal position in a higher area to avoid obstacles.
Keywords:
tsunami detector
; compressed pulse radar
; real-time detection
; ocean wave monitoring
; long-range radar
1. Introduction
A tsunami is a rising sea wave or tide due to an earthquake or plate fault in the sea that causes a great shock, water from the coast will enter the middle of the sea and then spew back to the ground. This must be damaging to coastal areas such as buildings, schools, houses, and other facilities, especially threatening human life. SIMRAD is one type of pulse radar [47] which is a type of S-Band radar with a frequency of 2.9-3.2 GHz with a wavelength of 10-12 mm, belongs to the type of Microwave Radar [7,29]. SIMRAD radar utilizes the Doppler effect [33,38,40,56,57] in data processing, especially object detection in the form of ocean waves. There is also a compressed radar [26,27,34,35,36] type with a transmitter frequency of 9.410 - 9.495 GHz. There are several ways to be able to see or monitor sea water levels, namely by using SIMRAD Radar in combination with various other tools such as SBE 26Plus, which is a tool for measuring ocean waves, especially seawater pressure and sea level. By converting using Acoustic Doppler Current Profiler (ADCP) data [59,60,61,62]. SIMRAD Radar used in this research is a type of Compressed Pulse radar [28,45,46], that functions for close and long-distance readings, a special function in this research is to see the height of sea waves, which can use image processing from reading SIMRAD radar data or ADCP conversion, namely sea water pressure and sea water level.
Several steps have been carried out, looking for clutter [8,12,13,15,16,19] which is a detected object, then analyzing seawater level data based on its classification color, for example, red with the highest height, yellow with medium seawater level, and blue or green with normal seawater level. in addition to clutter [5,6], Noise is also identified in the Radar detection system and then analyzed until the seawater level value is obtained. Then the next step is how the reading process from SIMRAD Radar and also the conversion of data from other types of data such as ADCP can be quickly executed into real-time final data and determine fast decision making, this includes data on potential conditions or water levels that allow Tsunami or normal water level data. It is necessary to conduct a comprehensive study so that accurate real-time data can be obtained.
2. Materials and Methods
2.1. Compressed Pulse Radar
Compressed Pulse Radar used in this research uses pulse waves and aims to detect clutter in the sea, the step is not significant to know the height of the sea but through various digital data conversions [39]. This type of radar emits radar signals in the form of pulses, as in radar systems in general, where there are transmitters and receivers on the radar when this pulse wave radiates and hits an object, then the wave or radar signal turns around and provides data to the radar [31,32,42,43]. Each data obtained from the object, namely seawater, has a different identification, it can be sea waves that cause sea clutter or noise, but not a sea level, so, additional data is done by placing such as Buoys or other types of devices such as SBE 26Plus to get sea water level data. The details of this radar type can be seen in Table 1.
SIMRAD radar or Compressed Pulse Radar [48,55] used in this research not only functions as a transmitter, and receiver but also as a processor and provides a complete form of navigation layer. The range of this radar is 6 meters to 72 nautical miles or equivalent to 133.34 kilometers. This radar can detect objects simultaneously by rotating, so that we can see more specifically and clearly, that is, with a wider detection area. Keep in mind that the location of the SIMRAD Radar must be in the right position, for example, a high area on the cliff to detect a large area of the sea and also comprehensively, precisely, and accurately. The components of this radar include a pedestal (Figure 12), several connection cables, interconnect cables, lifting straps, blanking plugs, anti-seize grease, mounting bolts and washers, and drill templates. Furthermore, the antenna consists of a Dome Nut, Spring Washer, and Flat Washer with different dimensions. Moreover, The dimensions of this type of radar have three sizes namely 3 feet, 4 feet, and 6 feet, radar interface using RI-12, with NMEA 0183 connector, mounting hardware, adapter for Ethernet RJ45 with 5 female pins, ethernet cable 1.8 meters, micro-CT Joiner, and Micro-C drop Cable 1.8 m.
Furthermore, Figure 1 shows the Surveillance Radar [10,21,23] for tide and wave of sea this type of compressed Pulse Radar in the initial test [50]. In this test, the radar is moved, so the antenna rotates and detects the area around it. This is the initial data, then the next step is to take the digital data and process it into image processing software, in this case, we use MATLAB. Previously we found all the functions of the SIMRAD radar to get the digital data. This is the first step. The next step is the clutter that is read, the data will be reversed, so that it becomes a clutter data that will be used as a reference for ocean movement. But even this is not enough because we need data conversion from the seawater pressure sensor and also the sea level, then the conversion process is carried out to get data specific to the sea level which will be displayed in real-time simultaneously between SIMRAD radar data and also the seawater pressure sensor and sea level.
As in Figure 2, the point or target of installing a seawater pressure sensor to determine the height of seawater using SBE 26Plus is shown in Figure 3. This tool is then placed in seawater with a certain depth and then monitored using specific software in the SBE 26Plus reading. We provide complete data in the results and discussion chapter.
Furthermore, at the beginning of this research, comprehensive measurements of each pin were taken to obtain specific digital data using an Oscilloscope, Spectrum Analyzer, and Simrad Radar Screen, while the antenna continued to rotate to obtain data. This was the initial sample before applying SIMRAD and placing it on the coast. This measurement step is shown in Figure 4 and Figure 5.
The seawater pressure sensor and temperature sensor using SBE 26Plus will show seawater pressure data and can be converted into seawater level data. Broadly speaking, this sensor can determine the condition of seawater pressure which is the essential data in this research. Furthermore, the data conversion process can be synergized with SIMRAD. To get valid data about sea level and sea water pressure. The complete specifications of these sensors can be seen in Table 1. This sensor accuracy data is specifically shown in the values of the pressure sensor, temperature sensor, specification memory, and frame used. The process of placing this sensor is very risky, for example, high sea wave conditions, bad weather such as rain or storms, and marine animal interference such as sharks that may interfere with the installation process as shown in Figure 6, Figure 7 and Figure 8. So the sensor installation process is carried out carefully and looks at good weather conditions and calm water waves.

Table 1.
Pressure and Temperature Sensors Specifications used in this research.
| Pressure Sensor | ||
| Sensor type | : | Quartz pressure |
| Reach | : | 1000 psi |
| Accuracy Initials | : | ± 0.01% of the range scale |
| Stability | : | 0.02 % of reach scale/year |
| Resolution | : | Tides 0.2 mm (1-minute integration) 0.01 mm (15 minutes integration) Waves 0.4 mm (0.25 seconds integration) 0.1 mm (1 second integration) |
| Hysteresis | : | 0.005% of the range scale |
| Temperature Sensor | ||
| Sensor type | : | Sensor internal |
| Reach | : | -5 - +35 °C |
| Accuracy Initials | : | ± 0.01 °C |
| Resolution | : | 0.001 °C |
| Memory and Data Storage | : | 32 Mbyte non-volatile FLASH Tide with temperature, time: 9 bytes/sample Tide with temperature, conductivity, and time: 12 bytes/sample Wave burst: 3 bytes/sample |
| Resources | : | 12 x Alkaline batteries D |
| Frame | ||
| Material | : | Acetal copolymer plastic |
| Depth rating | : | 600 m |
| Weight | : | Air 6.8 kg, in the water 2.3 kg |
| Size | : | 96.9 cm x Ø 9.9 cm |
Compressed pulse radar process is a signal processing [25] technique used in radar systems to improve range resolution and also Signal-to-noise (SNR) analysis [3]. So the measurement process is carried out by reading pins 1 to 8 on the Simrad radar to find out the specific functions and analyze the results of the signal generated on the spectrum analyzer.
Furthermore, Figure 9 shows the block diagram of the Compressed Pulse Radar used and developed in this research. Where the function of this Radar is to read or detect targets or objects, namely waves and tides. Specifically from Figure 9, it can be explained that the radar has a rotating antenna that works to get data from Wea or Sea clutter, this rotating antenna is found on the radar structure built, namely the pedestal, there is a process of transmitting and receiving signals here, and there is also a protector switch for the receiver. The process in this compressed pulse radar-based clutter detection system performs the process of converting analog to digital signals through ADC or Analog to Digital Converster through Low Noise Amplifier, Mixer or Preamplifier, Local Oscillator, and a detector which is packaged in the receiver, then the signal processor and finally can perform detection and measurement.
Table 2.
Pin Configuration for Measurement use RJ45.
| Pin | Wire Colour | Description |
|---|---|---|
| 1 | White / Orange | Data transmit positive (Tx+) |
| 2 | Orange | Data transmit negative (Tx-) |
| 3 | White / Green | Not used |
| 4 | Blue | Data receive positive (Rx+) |
| 5 | White / Blue | Data receive negative (Rx-) |
| 6 | Green | Not used |
| 7 | White / Brown | Not used |
| 8 | Brown | Not used |
Table 3.
Essential Parameter of Compressed Pulse Radar.
| Parameter | Value |
|---|---|
| transmitter frequency | 9.410 - 9.495 GHz |
| Pulse length/PRF and Compression ratio | Pulse length: 0.04 usec Chirp length:2-96 usec Chirp Bandwidth: 2-32 MHz |
| IF section | Center frequency: 28.625 MHz Bandwidth: 40 MHz |
| Noise figure Boudrate Rotating Antenna types |
5 dB (Average) 4800, 9600, 19200 or 38400 3ft (1127 mm), 4ft (1431 mm), 6 ft(2038 mm) |
Figure 10 is the SIMRAD Radar reading analysis system developed for image processing using MATLAB. The data resolved or read by the SIMRAD radar is then brought to MATLAB to detect symptoms of changes or sea conditions in terms of tidal waves [63]. If there is one or more parts of the wave condition, it is then analyzed or classified to a certain level, for example, the color that shows the level of sea water level. Images taken are cropped at a certain pixel value and then analyzed in Wavenumber 3D DFT [52]. While Figure 11 is the Power Percentage Compressed Pulse Radar which shows the performance of the SIMRAD radar in terms of the percentage of power from its transmission angle, from this transmission mode, it can be studied in depth about the radar polarimetry [14], in the straight direction with an angle of 12.5 degrees, it has 50% power, while 25 percent power at an angle of 25 degrees, we can also refer to as Antenna Beamwidth [1,18].
Moreover, Compression Radar uses a radar signal modulation technique with a specific pattern, this pattern must be matched with the pattern on the Receiver. This allows for longer patterns to be used for long-distance or range improvement efforts, while shorter pulses are used for improvement on the resolution side. The advantages of this compression system are resolution, range, SNR analysis, and Bandwidth analysis. Some of these parameters are essential and need to be known in detail between the Noise power (No) and also the Filter Bandwidth (B), the Noise is available in the corresponding filter bandwidth (Ni), this formula is shown in Equation (1).
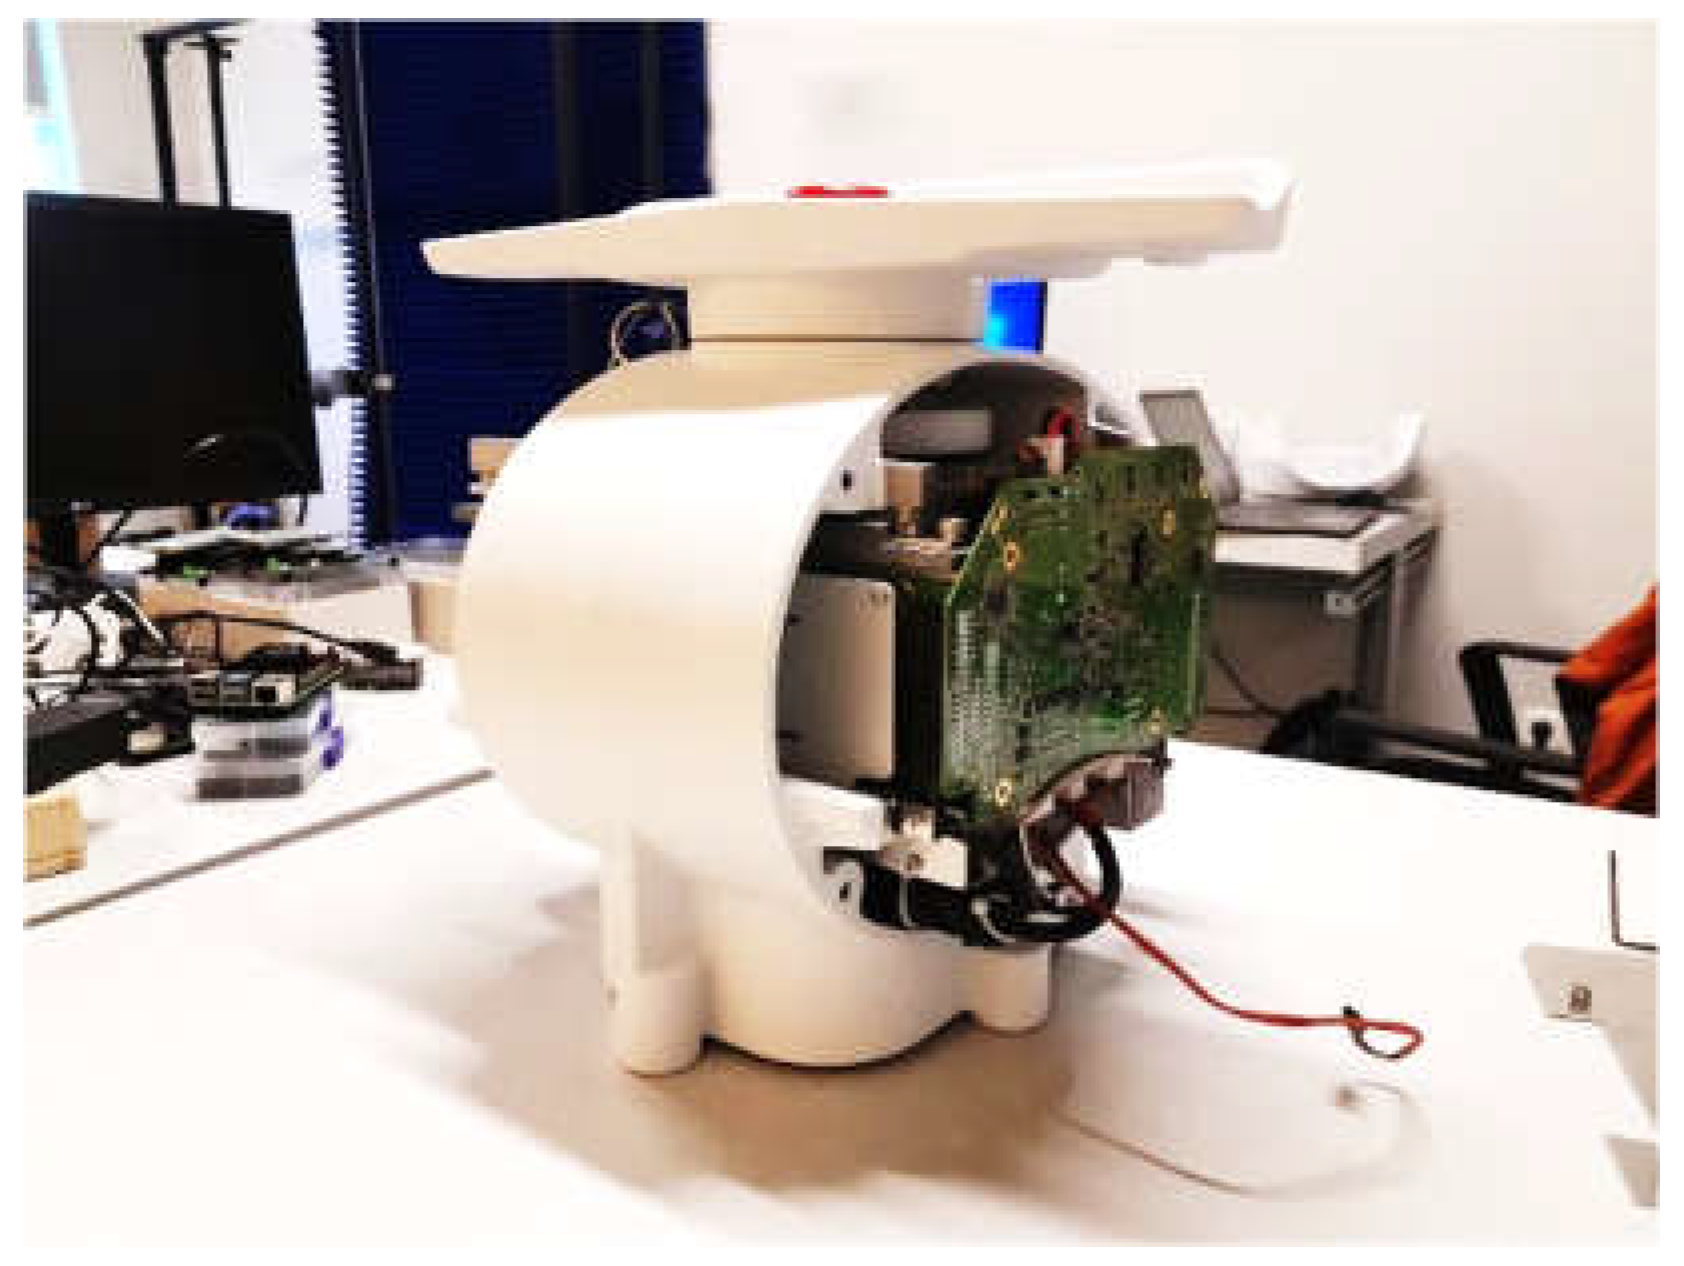
Figure 12.
Pedestal Compressed Noise Radar.
Moreover, from Figure 13, it can be seen that the two sides of the positive and negative frequencies have different signal power and also different pulse duration. Then the input signal power (S_i) can be represented from Equation (2). where the input signal power is the signal energy (E) divided by the pulse duration (τ^’).
The relationship between energy, input signal power (N_i), Pulse duration (τ^’), Bandwidth (B), and noise power (N_O) can determine the value of SNR; specifically, it can be shown in Equation (3).
SNR needs to be studied more deeply in conducting a deeper analysis of Pulse Compression; the relationship between SNR and peak power, pulse width, antenna gain, target, and Boltzmann constant can be represented in Equation (4).
Moreover, if connected to the compressed pulse width as τ_c, then the equation is developed into Equation (5).
Meanwhile, The SNR as an uncompressed pulse is represented in Equation (6).
The relationship between range and Bandwidth can be represented in Equation (7).
Furthermore, considering the correlation between the radar system and the receiver processor, Equation (8) can be written as the receiver window in meters.
Where R_max and R_min are the maximum and minimum range of Radar performance. While R_rec is specifically a representation of complex targets. The next normalized complex transmitted signal can be seen in Equation (9). τ^’ is the pulse width, and B is the Bandwidth, the relationship is 〖μ=B/τ〗^’. Echo received by Radar is represented as Equation (10), which is an extension of Equation (9). while the time delay τ_1 is formulated as Equation (11)
The reference signal is formulated with 2πf_0 t, and the phase of the resulting signal, after low pass filtering, is shown in Equation (12). The instantaneous frequency can be represented in Equation (13). The next essential process is to find raw data from digital data that already exists in the SIMRAD Halo 6 version or Pedestal Compressed Noise Radar as shown in Figure 12.
2.2. Radar Pulse Compression with an Approach to the SNR Parameter
Compressed signal radar in this research is the result of modulation that has a correlation with the signal to be received. This compressed signal system is used to improve performance as indicated by SNR, and range resolution, the goal is to shorten the duration of the echo. An important factor is the ADC conversion process and vice versa can be analyzed so that digital data on SIMRAD can be retrieved and analyzed. The conversion process is carried out for measurement development, the technique that can be developed is Fast Fourier Transform (FFT). Specifically, we can do calculations with equations and software that supports this conversion process such as MATLAB, and comprehensive analysis using Pulse Analog which is important in Radar technology.
An example of parameters for testing is Rectangular Chirp used in Time Domain Cross-Correlation. For example, a certain frequency f0 with 10 Hz and Sample rate fs 1 kHz, can form a specific signal, so with SIMRAD, for example SNR 60 dB, specific results are obtained from the parameters entered. For specific images that can be generated, we can use MATLAB Software, namely Noisy Received, Initial Pulse, and Noiseless Received. Specific Noisy Received, Initial Pulse, and Noiseless Received, there are two images displayed Transmitted or Received Signals, and Matched Filter Output. The Signal Emitted or Received by Radar with SNR 60 dB with MATLAB Code can be seen in Figure 14.
2.3. Essential and Specific Equations
In calculating the increase in sea waves and predicting the occurrence of Tsunamis, several equations are needed which are the basis for decision making and the results that can be displayed. Next, the wave behavior or changes in these ocean waves are expressed by the random nonlinear Schrodinger equation as shown in Equation (14).
The association between local coherence and the occurrence of extreme waves can be the cause of these waves, which are produced by the local interaction of the waves in the wave group and the influence of waves that are not nearby. Furthermore, Equation (15) displays the extreme wave signal.
Furthermore, plate faults brought on by underwater earthquakes, which can also be brought on by erupting marine volcanoes, pyroclastic flows (the spilling of marine volcanic material), meteor strikes into the sea, or nuclear explosions, can result in tsunamis. Tsunamis have a wavelength of up to 500 km and a time interval of minutes to two hours, whereas wind waves only have a wavelength of 200 meters and a time interval of a few minutes. In particular, the theory of nonlinear wave propagation in shallow waters, which is represented by Equation (16), governs how tsunamis spread.
Radar pictures can identify tsunamis when the radial current velocity is greater than 10 cm/s. Coastal radar (HF) detected the tsunami eight minutes before it reached the coast in a prior study of the Sendai earthquake of magnitude 9, which is three minutes faster than utilizing tidal data. Equation (17) expresses the radar intensity brought on by the tsunami’s radial velocity.
2.4. Method Used
Method Development is how to develop data from SBE 26Plus with output in the form of seawater pressure and sea water temperature that can be synchronized into data that determines the level of sea water level, so it is necessary to synchronize between SBE 26Plus sea water temperature and pressure data to synchronize sea water level with SIMRAD RADAR data. As shown in Figure 15, the software used is Seasoftwaves which displays data in the form of the frequency range of the wave from the SBE 26Plus sensor, the data needs to be synchronized with the results of measuring or detecting objects or signal processing from SIMRAD Radar and needs the results of data synchronization. Whether the data is accurate or not, which means the condition of the sea water level according to the measurement point. The tidal and wave synchronization process using SBE 26plus and SIMRAD can be seen in Figure 15.
Moreover, The block diagram of the Coastal Radar Concept can be seen in Figure 16. This talks about how the Coastal radar works, starting from 4 different parts, the Tx-Rx process, the voltage control oscillator to the splitter, the power amplifier, and the TX antenna, while the data or object from the Rx antenna is taken to the low noise amplifier then the mizer and LPF. from LPF there is the next process, namely ADC, FFT, from FFT then Beat Frequency detector, and determination of Range Angle detection, from FFT will also determine velocity detection, then the coastal area observation function functions as object detection in beach region. While this wave detection function consists of clutter extraction which will produce range-angle detection and wave amplitude detection, the process from clutter extraction to range-angle detection through the FFT stage will produce wave velocity.
3. Results
in this results chapter, we first need to explore the characteristics of the noise radar by knowing and checking all the existing pins. In this discussion, it will be broken down how the pin functions against noise, and what type of signal is generated. This test uses an oscilloscope, spectrum analyzer, and also other components. The test starts by opening the pedestal on the compressed noise radar to get digital data and analyze it. The coverage taken is at 1 ms [a], 4 ms [b], and 2.5 seconds. In the initial measurement, the SIMRAD Radar was placed on the beach and started to detect the movement of tidal waves as shown in Figure 17, but this step was less effective so it was developed by moving the radar to a more strategic place.
Moreover, the output obtained in the measurement or detection of ocean waves can be seen in Figure 18. Levels of height, motion, noise, and clutter can be seen directly with color indicators on the SIMRAD GUI. However, this needs to be further developed by looking at other obstruction factors such as objects around the beach that may also be detected, so that the results are less valid. Testing is again carried out by moving the location of SIMRAD to a high place or cliff around the coast, this raises the need for energy sources such as generators to supply energy or electrical power to SIMRAD because the location is far from residential areas or PLN, so in the future it is necessary to use renewable energy [2] to drive this radar system. Furthermore, Figure 19, Figure 20, Figure 21, Figure 22, Figure 23 and Figure 24 shows the measurement results of SIMRAD pins regarding their functionality as Tx, Rx, and data.
Furthermore, Figure 25 and Figure 26 are the views of Compressed Signal Radar when detecting objects around it, based on the datasheet this Radar can detect objects up to >130 Km. The development is sea Clutter which is the main object detector for Tsunami data and Sea Wave rise information, but in this initial test, it is used for the initial detection or trial of SIMRAD against object reading.
Furthermore, in Figure 27 and Figure 28, we can see more specifically the color differences in objects in the sea area after moving the SIMRAD radar to the appropriate place, so that we can classify based on color, from these measurements, it can be classified that red is a wave at a certain height, then yellow, blue and green, the lowest color is green which indicates normal water conditions, blue and light blue indicate slightly elevated water conditions, while yellow indicates slightly elevated conditions, until finally red which indicates the highest state of sea waves. The next process that must be done is that the initialization needs to be validated, one step is to process the images using MATLAB to produce MATLAB data in the form of sea waves at a certain point with a certain height, it is necessary to classify the sea level table in this case.
Figure 29 is an example of cropping images at a certain pixel such as 300x300 px. This object comes from direct data capture using SIMRAD, this data is a tide and wave of sea movement object. Then after going through image processing using MATLAB, be the object as in Figure 30. Figure 30 is the ocean wave 1 Detection example to be processed into Image Processing MATLAB, Color processing, and identification of wave height or wave level.
Moreover, do the same for the other object or Ocean Wave 2 as shown in Figure 31. We can see that the object in Figure 31 has more detection on the ocean wave. For this reason, we need to analyze whether it is a clutter, a normal ocean wave, or perhaps a heavy water movement with a wide range of water heights. After going through the analysis process, we get the output as shown in Figure 32.
Furthermore, with other sample images or multi-images or multi-target [37] as in Figure 33, we get some sample Wave Amplitude results as shown in Figure 35, Figure 36, Figure 37, Figure 38 and Figure 39. The 300x300 px images [Figure 34] that were analyzed using image processing produced wave amplitude as shown in Figure 39. The higher the wave amplitude, the higher the sea waves. This is just one point, we can make several points simultaneously and find out at which point there are high waves that have an impact on the Tsunami.
From the more specific images in the 300x300 pixel images, 1 specific sample image is then taken and tried to see the wave amplitude in detail as shown in Figure 33. This is the process of detecting the possibility of a Tsunami or at least the sea level is not facing at several points of radar measurement results, then this process will be validated in terms of a more detailed level of accuracy.
4. Discussion
The development of Radar technology, especially SIMRAD and SBE 26Plus will allow the results received to be more specific than just using SIMRAD. SIMRAD only performs detection based on the possibility of high waves in the sea area with the color indicator it shows, while with the SBE 26Plus sensor, for example, which is installed at several points in the sea, it will provide specific data about sea water levels and seawater environments such as seawater pressure and sea water temperature. Radar technology for coastal areas is expected to reduce the risk of Tsunami natural disasters that can occur at any time and we will never know the time. However, with the preparedness of the disaster management team in collaboration with researchers in creating a tool that can detect Tsunamis, it can minimize the risk that will occur.
SIMRAD devices as well as sea level detection sensors can be synergized and evaluated optimally, becoming one of the right ways to mitigate disasters. SIMRAD combined with the cloud or internet will provide a real-time and fast information system. Computerized systems such as web bases can be combined using MQTT such as low power radar, FMCW Radar [41] for detecting movement in front of it, especially respiratory movements and Arterial Pulse [58] can also be conditioned to be upgraded to IoT using MQTT Protocol. SIMRAD is also able to be combined with MQTT to provide fast data. While the calibration process between the data from SBE 26Plus and SIMRAD needs to be synchronized, after that the data must be able to be sent to the server and the control team will be able to quickly provide an alert before something bad happens. The development of this application is very useful for disaster mitigation teams, we call it a maritime application, it can also be for the marine world for example to detect fish or schools of fish, for the world of fisheries. SIMRAD or Compressed pulse radar is also effective for detecting changes that occur such as tides and waves of the sea because the identification of sea waves needs to be done in real-time, there should be no delay in the latency (second) process, this system must quickly provide data in the form of digital data. To reduce the risks that can occur at any time, especially for coastal communities.
Monitoring ocean waves is something that needs to be monitored in real-time, there should be no pause, for monitoring management and data storage is needed. Some information that can be drawn in addition to seawater pressure, and seawater temperature that provides real-time sea water level data is the condition of ships or the location or position of the movement of ships. This needs to be developed because, in the process of defense and security, other countries’ ships entering Indonesian territory are also among the things that should be monitored in real-time. Sometimes cases of fish theft occur at any time. Need a very fast response to overcome this. For this reason, making an integrated system must be realized, for example, ship navigation systems, ocean wave monitoring systems, and other navigation systems need to be integrated, so it is necessary to improve in terms of hybrid methods or Distribute Radar that can be built to combine these systems [49], and the development of other methods such as Synthetic Aperture Radar (SAR) [51], Reconstruction Radar Images [53], and Multi-Channel Radar [54]. For example, Buoy data can be taken and integrated with other systems to be able to build a real-time web-based system that can be monitored by all groups such as the weather detection system by BMKG.
Integrated systems are not all available in the market, sometimes the market only provides specific sensors or instruments, like SIMRAD Radar and SBE 26Plus provide digital data that cannot be developed anymore, so this team needs to synergize and integrate, so the data produced becomes more specific. The role of the market is how to produce specific products, but in contrast to researchers, researchers are the human resources, with the development of existing technology, researchers are expected to be able to develop existing devices to be better. In other words, it can be a Research and Development alias to synergize with the company.
Systems that are built must always have limitations from various sides, including endurance, sensors that are resistant to salt water, how to package sensors and other things that need to be considered, including how to maintain, how long can this SBE 26Plus be immersed in the sea? How long can this system survive continuously sending data without stopping or interrupting? This needs to be a serious concern, including other factors, such as interference that can occur due to bad weather, disasters, and collisions with other hard objects that can damage tools or infrastructure.
Finally, things that need to be discussed are implications, policies and risk management, mitigation strategies that are built, need to be supported by the government as well as getting special policies in building mitigation systems, and what advantages and disadvantages can result from the system being built. What strategies must be carried out, and the rescue process must be applied, this requires the cooperation of all parties if this system has been successfully tested. Tsunami disaster mitigation training, and also training in the maintenance of the system being built.
In developing this tide and wave of a sea monitoring system for the future, it can develop a detection system quickly and accurately, be able to add SBE 26Plus sensors at several points, collaborate with the government to make a policy for disaster mitigation, software, and hardware validation processes, patents that can be generated and also how to maintain the system built. Building sophisticated integration systems, satellite communication systems, and underwater sensors that have high endurance to create an effective and efficient system. It is a system that has a long enough period, is real-time and provides valid data. Figure 40 and Figure 41 are real-time data from SBE 26Plus against pressure and subsurface pressure (psi) against time This sensor specifically detects the sea surface [5,6,9,17,20,22] of the pressure indicator.
In detail, the explanation of Figure 42 is from the wave burst data, we know that the wave burst measurement starts after the tide measurement is completed, such as in burst 0, the start time is October 14, 2024, at 8:00:11 with a measurement duration of 256 seconds with a total of 1024 data. In burst 0 we can know that for almost 210 seconds the measured data still changes a lot because it is still in the installation process so that the data can be discarded so as not to interfere with the next process. Accordingly, the data with the *.wb extension is the data used for further processing.
While the SIMRAD radar also acquired significant wave height during the 24-hour observation period as shown in Figure 43, this system can do re-tracking [11,44] or repetition [30] according to the request and setting. The observation results will be processed to obtain significant wave height and calibrated at the same location using ADCP data. The results of the ADCP sensor installation have produced complete data for one day from October 14-15, 2024. Similarly, the SIMRAD radar observation results have also produced one day of data. So that the data is ready to be processed for the process of validating the significant wave height monitored by the radar.
5. Conclusions
The optimization of Compressed Noise Radar with the Radar specifications used in this research goes through several stages of research, including converting from Digital to Analog signals to change the detection function of targets in the ocean area such as ships, small islands, birds, and various other objects caught while detecting at sea. After the analog signal is found, the Radar function will be able to detect sea movements or sea waves and the movement of sea volume, which decreases significantly. Initially, these ocean waves are referred to as Sea Clutter or Noise that should be reduced, but in this research, it is displayed as essential data. The essential factor in the experiment of opening the Radar Pedestal section and converting the digital signal data into Raw Data form is the first step to perform detailed sea clutter detection. A more detailed radar detection process, namely Edge Detection, can be processed using Image Processing with the help of MATLAB Software, Moreover, the detection process using Image Processing of Radar-detected Objects is very helpful in determining the side of focus on the object being monitored, in this case, is the behavior of waves that are likely to be Tsunami or large dangerous waves. Furthermore, from this research by using the Filter, Normalization, 2D FFT, Wavelength domain check, Dispersion relation, and Band Pass Filter processes, the possible details of ocean waves can be estimated for the height of the level which refers to the possibility of a Tsunami if the water level is high, seen from the Wave amplitude.
Author Contributions
Conceptualization, T.A. and Y.W.; methodology, G.W., N.A; software, G.A,S.P, B.S.W; validation, A.A., P.D., R.R, D.L, and A.A.P.; formal analysis, Y.Y.M; investigation, F.O., B.S.W; resources, S.P.R.R; data curation, T.P.; writing—original draft preparation, P.D.P.A, R.J.Y; writing—review and editing, P.D.P.A.; visualization, G.A., A.A, T.P, F.O; supervision, S.S, Y.T.; project administration, R.J.Y.; funding acquisition, Y.W. All authors have read and agreed to the published version of the manuscript.
Funding
This research was funded by the Ministry of Finance’s Education Fund Management Institution (LPDP) or the Republic of Indonesia’s Education Fund Provider Institution (BRIN), Indonesia through the post-doctoral program.
Informed Consent Statement
Measurement data is purely derived from teamwork for Tsunami detection in Indonesian waters, specifically on the coast of Pameungpeuk, South Garut (Garsela) West Java, Indonesia, and has been approved by the team.
Data Availability Statement
We encourage all authors of articles published in MDPI journals to share their research data.
Acknowledgments
Thank you to The Research Center for Telecommunication, National Research and Innovation Agency (BRIN), and the entire team who got the task of completing the Halo 6 SIMRAD RADAR which includes Compressed Noise Radar, so that this Manuscript can be completed properly. Hopefully, it can be a reference for all academics in the field of Radar.
Conflicts of Interest
The authors declare no conflicts of interest.
References
- W. Kazimierski and A. Stateczny, “Analysis of beam sharpening effectiveness in broadband radar on inland waters,” 2015 16th International Radar Symposium (IRS), Dresden, Germany, 2015, pp. 870-875. [CrossRef]
- B. J. Williamson et al., “Field deployments of a self-contained subsea platform for acoustic monitoring of the environment around marine renewable energy structures,” 2014 Oceans - St. John’s, St. John’s, NL, Canada, 2014, pp. 1-6. [CrossRef]
- J. K. Horne, “Maximizing Single Target Resolution and Signal to Noise Ratios in Fisheries Acoustic Data,” OCEANS 2019 MTS/IEEE SEATTLE, Seattle, WA, USA, 2019, pp. 1-6. [CrossRef]
- Z. Bao, Z. Z. Bao, Z. Xi and J. Lu, “Improved adaptive co-pulse differential methods for nautical radar small target detection in sea clutter,” 2016 CIE International Conference on Radar (RADAR), Guangzhou, China, 2016, pp. 1-4. [CrossRef]
- G. Yao, J. G. Yao, J. Xie, W. Huang, Z. Ji and W. Zhou, “Theoretical analysis of the first-order sea clutter in shipborne high-frequency surface wave radar,” 2018 IEEE Radar Conference (RadarConf18), Oklahoma City, OK, USA, 2018, pp. 1255-1259. [CrossRef]
- Y. Luo, V. Y. Luo, V. Lutsenko, S. Shulga, I. Lutsenko and X. -A. Nguyen, “Observation Theory and Result Analysis of Sea Surface Wind Speed by Pulse Radar,” 2022 IEEE 2nd Ukrainian Microwave Week (UkrMW), Ukraine, 2022, pp. 634-637. [CrossRef]
- L. Fiorentino, R. L. Fiorentino, R. Heitsenrether, W. Krug and W. Hensley, “Wave Measurements from Pulse Microwave Radar Tide Gauges,” OCEANS 2018 MTS/IEEE Charleston, Charleston, SC, USA, 2018, pp. 1-6. [CrossRef]
- M. B. Porfido, M. M. B. Porfido, M. Martorella, M. Gashinova and M. Cherniakov, “Sea Clutter Power Reduction in Pulse Forward Scatter Radar,” 2018 19th International Radar Symposium (IRS), Bonn, Germany, 2018, pp. 1-9. [CrossRef]
- J. Shan, C. J. Shan, C. Lu and X. Xu, “Simulation and analysis of radar signatures for objects floating on time-evolving sea surface,” IET International Radar Conference (IET IRC 2020), Online Conference, 2020, pp. 128-132. [CrossRef]
- M. Li and H. Wang, “Realization of Sea Surveillance and Imaging Radar Signal Processing System Based on Domestic Digital Signal Processor,” 2021 International Applied Computational Electromagnetics Society (ACES-China) Symposium, Chengdu, China, 2021, pp. 1-2. [CrossRef]
- Di Bella, R. Kwok, T. W. K. Armitage, H. Skourup and R. Forsberg, “Multi-peak Retracking of CryoSat-2 SARIn 11 Over Arctic Sea Ice,” in IEEE Transactions on Geoscience and Remote Sensing, vol. 59, no. 5, pp. 3776-3792, 21. 20 May. [CrossRef]
- Y. Sun, H. Y. Sun, H. Fan, L. Ren, E. Mao and T. Long, “Folded Clutter Suppression for Pulse-Doppler Radar Based on Pulse-Agile Waveforms,” in IEEE Transactions on Signal Processing, vol. 70, pp. 3774-3788, 2022. [CrossRef]
- S. Xu, Y. S. Xu, Y. Ma and X. Bai, “Small Target Detection Method in Sea Clutter Based on Interframe Multi-feature Iteration,” 2021 IEEE 6th International Conference on Signal and Image Processing (ICSIP), Nanjing, China, 2021, pp. 82-87. [CrossRef]
- M. R. Inggs, S. M. R. Inggs, S. Lewis, R. Palamà, M. A. Ritchie and H. Griffiths, “Report on the 2018 Trials of the Multistatic NeXtRAD Dual Band Polarimetric Radar,” 2019 IEEE Radar Conference (RadarConf), Boston, MA, USA, 2019, pp. 1-6. [CrossRef]
- J. Wang and S. Li, “Maritime Radar Target Detection in Sea Clutter Based on CNN With Dual-Perspective Attention,” in IEEE Geoscience and Remote Sensing Letters, vol. 20, pp. 1-5, 2023, Art no. 3500405. [CrossRef]
- Y. Wang, B. Y. Wang, B. Yin, J. Zhang and Y. Zhang, “Effective Sea Clutter Region Extraction Based on Improved YOLOv4 Algorithm for Shore-Based UHF-Band Radar,” 2022 IEEE 6th Advanced Information Technology, Electronic and Automation Control Conference (IAEAC ), Beijing, China, 2022, pp. 1566-1573. [CrossRef]
- K. Zhang, P. K. Zhang, P. -L. Shui and Y. Feng, “Detection of Sea-Surface Small Targets Masked by Range Sidelobes of Large Objects,” in IEEE Transactions on Aerospace and Electronic Systems, vol. 58, no. 2, pp. 1446-1461, 22. 20 April. [CrossRef]
- Y. -C. Zhang and P. -L. Shui, “Antenna Beampattern Matched Optimum Coherent Detection in High-Resolution Mechanically Scanning Maritime Surveillance Radars,” in IEEE Transactions on Aerospace and Electronic Systems, vol. 59, no. 3, pp. 2764-2779, 23. 20 June. [CrossRef]
- S. Bocquet, “Analysis and Simulation of Low Grazing Angle X-Band Coherent Radar Sea Clutter Using Memoryless Nonlinear Transformations,” in IEEE Transactions on Geoscience and Remote Sensing, vol. 60, pp. 1-13, 2022, Art no. 5111113. [CrossRef]
- Y. Titchenko, V. Y. Titchenko, V. Karaev, M. Ryabkova, A. Kuznetsova and E. Meshkov, “Peculiarities of the Acoustic Pulse Formation Reflected by the Water Surface: a Numerical Experiments and the Results of Long-term Measurements Using the “Kalmar” Sonar,” OCEANS 2019 - Marseille, Marseille, France, 2019, pp. 1-7. [CrossRef]
- P. -L. Shui, X. P. -L. Shui, X. -Y. Xia and Y. -S. Zhang, “Sea–Land Segmentation in Maritime Surveillance Radars via K-Nearest Neighbor Classifier,” in IEEE Transactions on Aerospace and Electronic Systems, vol. 56, no. 5, pp. 3854-3867, Oct. 2020. [CrossRef]
- Z. Wang, Y. Z. Wang, Y. Liu, J. Zhang and C. Fan, “Sea Surface Imaging Simulation for 3D Interferometric Imaging Radar Altimeter,” in IEEE Journal of Selected Topics in Applied Earth Observations and Remote Sensing, vol. 14, pp. 62-74, 2021. [CrossRef]
- P. -L. Shui and K. Zhang, “Ship Radial Size Estimation in High-Resolution Maritime Surveillance Radars via Sparse Recovery Using Linear Programming,” in IEEE Access, vol. 7, pp. 70673-70688, 2019. [CrossRef]
- K. Kanemaru, T. K. Kanemaru, T. Iguchi, T. Masaki and T. Kubota, “Estimates of Spaceborne Precipitation Radar Pulsewidth and Beamwidth Using Sea Surface Echo Data,” in IEEE Transactions on Geoscience and Remote Sensing, vol. 58, no. 8, pp. 5291-5303, Aug. 2020. [CrossRef]
- G. Madhupriya, K. S. G. Madhupriya, K. S. Lavanya, V. Vennisa and N. R. Raajan, “Implementation of Compressed Wave Pulsed Radar Altimeter in Signal Processing,” 2019 International Conference on Computer Communication and Informatics (ICCCI), Coimbatore, India, 2019, pp. 1-5. [CrossRef]
- V. Chandrakanth, S. V. Chandrakanth, S. Singh, V. S. N. Murthy and P. V. R. R. Bhogendra Rao, “Interleaved Low PRF Processing Using Compressed Sensing for Improved Range Estimation in High PRF Pulsed Radars,” 2020 21st International Radar Symposium (IRS), Warsaw, Poland, 2020, pp. 62-66. [CrossRef]
- P. Brown, M. P. Brown, M. O’Shaugnessy, C. Rozell, J. Romberg and M. Flynn, “A 17.8MS/s Neural-Network Compressed Sensing Radar Processor in 16nm FinFET CMOS,” 2020 IEEE Custom Integrated Circuits Conference (CICC), Boston, MA, USA, 2020, pp. 1-4. [CrossRef]
- L. Jung Hoon, J. i. L. Jung Hoon, J. i. Jo, B. Park, C. h. Lee and S. Choi, “The range spreading EW technique against the compressed pulse,” 2022 13th International Conference on Information and Communication Technology Convergence (ICTC), Jeju Island, Korea, Republic of, 2022, pp. 2089-2091. [CrossRef]
- D. Onori and J. Azaña, “A Microwave Photonic Radar Warning Receiver based on Deep Compressed Sensing,” 2019 International Topical Meeting on Microwave Photonics (MWP), Ottawa, ON, Canada, 2019, pp. 1-4. [CrossRef]
- Q. Feng, J. Q. Feng, J. Huang, S. Liang and L. Kang, “A Pulse Repetition Rate Compressive Sampler for Radar Target Detection,” in IEEE Sensors Letters, vol. 4, no. 2, pp. 1-4, Feb. 2020, Art no. 7000604. [CrossRef]
- T. Roy, “Digital Implementation of Pulse Compression Algorithm for Multifunction Radars,” 2022 IEEE 7th International conference for Convergence in Technology (I2CT), Mumbai, India, 2022, pp. 1-5. [CrossRef]
- Focsa, M. Datcu and A. Anghel, “Compressed sensing-based multi-aperture focusing of spaceborne transmitter/stationary receiver bistatic SAR data,” 2020 IEEE Radar Conference (RadarConf20), Florence, Italy, 2020, pp. 1-4. [CrossRef]
- M. Setsu, T. M. Setsu, T. Hayashi, J. He and S. Kidera, “Super-Resolution Doppler Velocity Estimation by Kernel-Based Range– $\tau$ Point Conversions for UWB Short-Range Radars,” in IEEE Transactions on Geoscience and Remote Sensing, vol. 58, no. 4, pp. 2430-2443, 20. 20 April. [CrossRef]
- L. Qu, Z. L. Qu, Z. Li, T. Yang, L. Zhang and Y. Sun, “Stolt migration algorithm for impulse through-the-wall radar imaging based on compressive sensing,” IET International Radar Conference (IET IRC 2020), Online Conference, 2020, pp. 1447-1451. [CrossRef]
- Y. Li, T. Y. Li, T. Huang, X. Xu, Y. Liu, L. Wang and Y. C. Eldar, “Phase Transitions in Frequency Agile Radar Using Compressed Sensing,” in IEEE Transactions on Signal Processing, vol. 69, pp. 4801-4818, 2021. [CrossRef]
- Y. Tao, C. Y. Tao, C. Liu and J. Zhang, “A Measurement Matrix-Based Deceptive Jamming Suppression Method for Compressive Sensing Radar,” 2021 CIE International Conference on Radar (Radar), Haikou, Hainan, China, 2021, pp. 2371-2375. [CrossRef]
- C. V, S. S. C. V, S. S. Channappayya and S. Singh, “Multi-Channel Radar Signal Processor Design for Detection of Multiple Manoeuvring Targets,” 2022 23rd International Radar Symposium (IRS), Gdansk, Poland, 2022, pp. 57-62. [CrossRef]
- C. T. Rodenbeck, J. B. C. T. Rodenbeck, J. B. Beun, R. G. Raj and R. D. Lipps, “Vibrometry and Sound Reproduction of Acoustic Sources on Moving Platforms Using Millimeter Wave Pulse-Doppler Radar,” in IEEE Access, vol. 8, pp. 27676-27686, 2020. [CrossRef]
- Y. Li, T. Y. Li, T. Huang, X. Xu, Y. Liu and Y. C. Eldar, “Phase Transition in Frequency Agile Radar Using Compressed Sensing,” 2020 IEEE Radar Conference (RadarConf20), Florence, Italy, 2020, pp. 1-6. [CrossRef]
- X. Liu, D. X. Liu, D. Cohen, T. Huang, Y. Liu and Y. C. Eldar, “Unambiguous Delay-Doppler Recovery From Random Phase Coded Pulses,” in IEEE Transactions on Signal Processing, vol. 69, pp. 4991-5004, 2021. [CrossRef]
- M. Rameez, M. I. M. Rameez, M. I. Pettersson and M. Dahl, “Interference Compression and Mitigation for Automotive FMCW Radar Systems,” in IEEE Sensors Journal, vol. 22, no. 20, pp. 19739-19749, 15 Oct.15, 2022. [CrossRef]
- G. Stove, “Gabor Transforms for Compressing RESM Data,” 2020 17th European Radar Conference (EuRAD), Utrecht, Netherlands, 2021, pp. 128-131. [CrossRef]
- J. M. Mower, G. J. M. Mower, G. Farquharson, B. Frazer and J. G. Kusters, “Pulse Compression for an X-band Marine Wave-Sensing Radar,” OCEANS 2019 MTS/IEEE SEATTLE, Seattle, WA, USA, 2019, pp. 1-5. [CrossRef]
- G. A. Abd-Elfattah, A. E. G. A. Abd-Elfattah, A. E. Farahat, K. F. A. Hussein and M. A. Kotb, “Radar Target Identification and Tracking Algorithm for Active and Hybrid Homing Missiles,” 2022 39th National Radio Science Conference (NRSC), Cairo, Egypt, 2022, pp. 222-232. [CrossRef]
- R. Horiuchi, T. R. Horiuchi, T. Hoshino, N. Oishi and K. Suwa, “Azimuth Ambiguity Discrimination Using Doppler Spectrum of the Compressive Sensing-Based SAR Image with Downsampled PRF,” 2020 17th European Radar Conference (EuRAD), Utrecht, Netherlands, 2021, pp. 318-321. [CrossRef]
- T. Hoshino, K. T. Hoshino, K. Suwa, Y. Yokota and T. Hara, “Experimental Study of Compressive Sensing for Synthetic Aperture Radar on Sub-Nyquist Linearly Decimated Array,” IGARSS 2019 - 2019 IEEE International Geoscience and Remote Sensing Symposium, Yokohama, Japan, 2019, pp. 831-834. [CrossRef]
- W. Zhou and Y. Tousi, “An E-Band Phase Modulated Pulse Radar SoC with An Analog Correlator,” 2022 IEEE Radio Frequency Integrated Circuits Symposium (RFIC), Denver, CO, USA, 2022, pp. 127-130. [CrossRef]
- M. Rahman and K. Wu, “A Nonlinear Transmission Approach to Compressing Rise and Fall Time in Picosecond Pulse Generation,” in IEEE Transactions on Instrumentation and Measurement, vol. 70, pp. 1-13, 2021, Art no. 2004013. [CrossRef]
- J. Chen, X. J. Chen, X. Chen, H. Zhang, K. Zhang and Q. Liu, “Suppression Method for Main-Lobe Interrupted Sampling Repeater Jamming in Distributed Radar,” in IEEE Access, vol. 8, pp. 139255-139265, 2020. [CrossRef]
- D. Zhao, N. D. Zhao, N. Wang, Y. Wang and M. Zhou, “Mismatched Filters Design to Reduce Range Sidelobe Modulation of Pulse-to-Pulse Diverse Waveform,” 2021 CIE International Conference on Radar (Radar), Haikou, Hainan, China, 2021, pp. 1794-1799. [CrossRef]
- M. Nogueira Peixoto and M. Villano, “Processing Techniques for Nadir Echo Suppression in Staggered Synthetic Aperture Radar,” in IEEE Geoscience and Remote Sensing Letters, vol. 19, pp. 1-5, 2022, Art no. 4505705. [CrossRef]
- Q. Yang, L. Q. Yang, L. Jiang, X. Yu, C. Zhou and Z. Wang, “Sparse Aperture Based Radar Observation Resource Allocation Algorithm for Space Target 3D Imaging,” 2020 IEEE 3rd International Conference on Computer and Communication Engineering Technology (CCET), Beijing, China, 2020, pp. 122-129. [CrossRef]
- C. Wang, L. C. Wang, L. Ren, M. Sha, E. Mao and H. Fan, “Reconstruction of Targets Based on Adaptive Complex ℓ1 Reweighted Minimization via Homotopy,” 2021 CIE International Conference on Radar (Radar), Haikou, Hainan, China, 2021, pp. 2381-2385. [CrossRef]
- R. Chen, W. R. Chen, W. Li, K. Li, Y. Zhang and J. Yang, “A Super-Resolution Scheme for Multichannel Radar Forward-Looking Imaging Considering Failure Channels and Motion Error,” in IEEE Geoscience and Remote Sensing Letters, vol. 20, pp. 1-5, 2023, Art no. 3501305. [CrossRef]
- B. Liu, Y. B. Liu, Y. Zhao, X. Zhu, S. Matsushita and L. Xu, “Sparse Detection Algorithms Based on Two-Dimensional Compressive Sensing for Sub-Nyquist Pulse Doppler Radar Systems,” in IEEE Access, vol. 7, pp. 18649-18661, 2019. [CrossRef]
- Zakia, A. B. Suksmono, M. Ridwan Effendi and W. Shalannanda, “Reflectivity of I-WARP Pulse-Doppler Weather Radar from Measured Data,” 2020 14th International Conference on Telecommunication Systems, Services, and Applications (TSSA, Bandung, Indonesia, 2020, pp. 1-4. [CrossRef]
- R. H. Kenney, K. R. H. Kenney, K. Konyalioglu, M. Yeary, H. H. Sigmarsson and J. W. McDaniel, “An All-COTS High Sampling Frequency Pulse-Doppler Imaging Radar,” 2020 IEEE Radar Conference (RadarConf20), Florence, Italy, 2020, pp. 1-6. [CrossRef]
- R. Vasireddy, J. R. Vasireddy, J. Goette, M. Jacomet and A. Vogt, “Estimation of Arterial Pulse Wave Velocity from Doppler Radar Measurements: a Feasibility Study,” 2019 41st Annual International Conference of the IEEE Engineering in Medicine and Biology Society (EMBC), Berlin, Germany, 2019, pp. 5460-5464. [CrossRef]
- Leibetseder and, A. Stelzer, “Doppler Effect in a 79-GHz Sequential Sampling Pulse Radar,” 2021 18th European Radar Conference (EuRAD), London, United Kingdom, 2022, pp. 329-332. [CrossRef]
- G. Metcalf and S. Flandermeyer, “On Spectrum Sharing for Pulse-Doppler Radar and OFDM Communications,” 2020 IEEE Radar Conference (RadarConf20), Florence, Italy, 2020, pp. 1-6. [CrossRef]
- Klilou, A. Arsalane, M. Najoui and S. Belkouch, “Design and Implementation of Parallel Pipelined Pulse-Doppler Radar on Parallel-Embedded Computing System,” 2020 International Symposium on Advanced Electrical and Communication Technologies (ISAECT), Marrakech, Morocco, 2020, pp. 1-5. [CrossRef]
- J. Wright and J. P. Donohoe, “Target Mask Reduction in Pulse-Doppler Radar Using Wavelet Domain Spatial Filtering,” 2019 IEEE Radar Conference (RadarConf), Boston, MA, USA, 2019, pp. 1-6. [CrossRef]
- Sulaiman, A. et.al. 2018. Study of Spatial Variation of Ocean Surface Waves by Using SAR Images in Coastal Area. IOP Conf. Series: Earth and Environmental Science 165 (2018) 012003, 3rd ICOIRS 2017. doi. 10. 1088. [Google Scholar]
Figure 1.
The Compressed Pulse Radar Pulse Radar Running Test [Personal Documents].
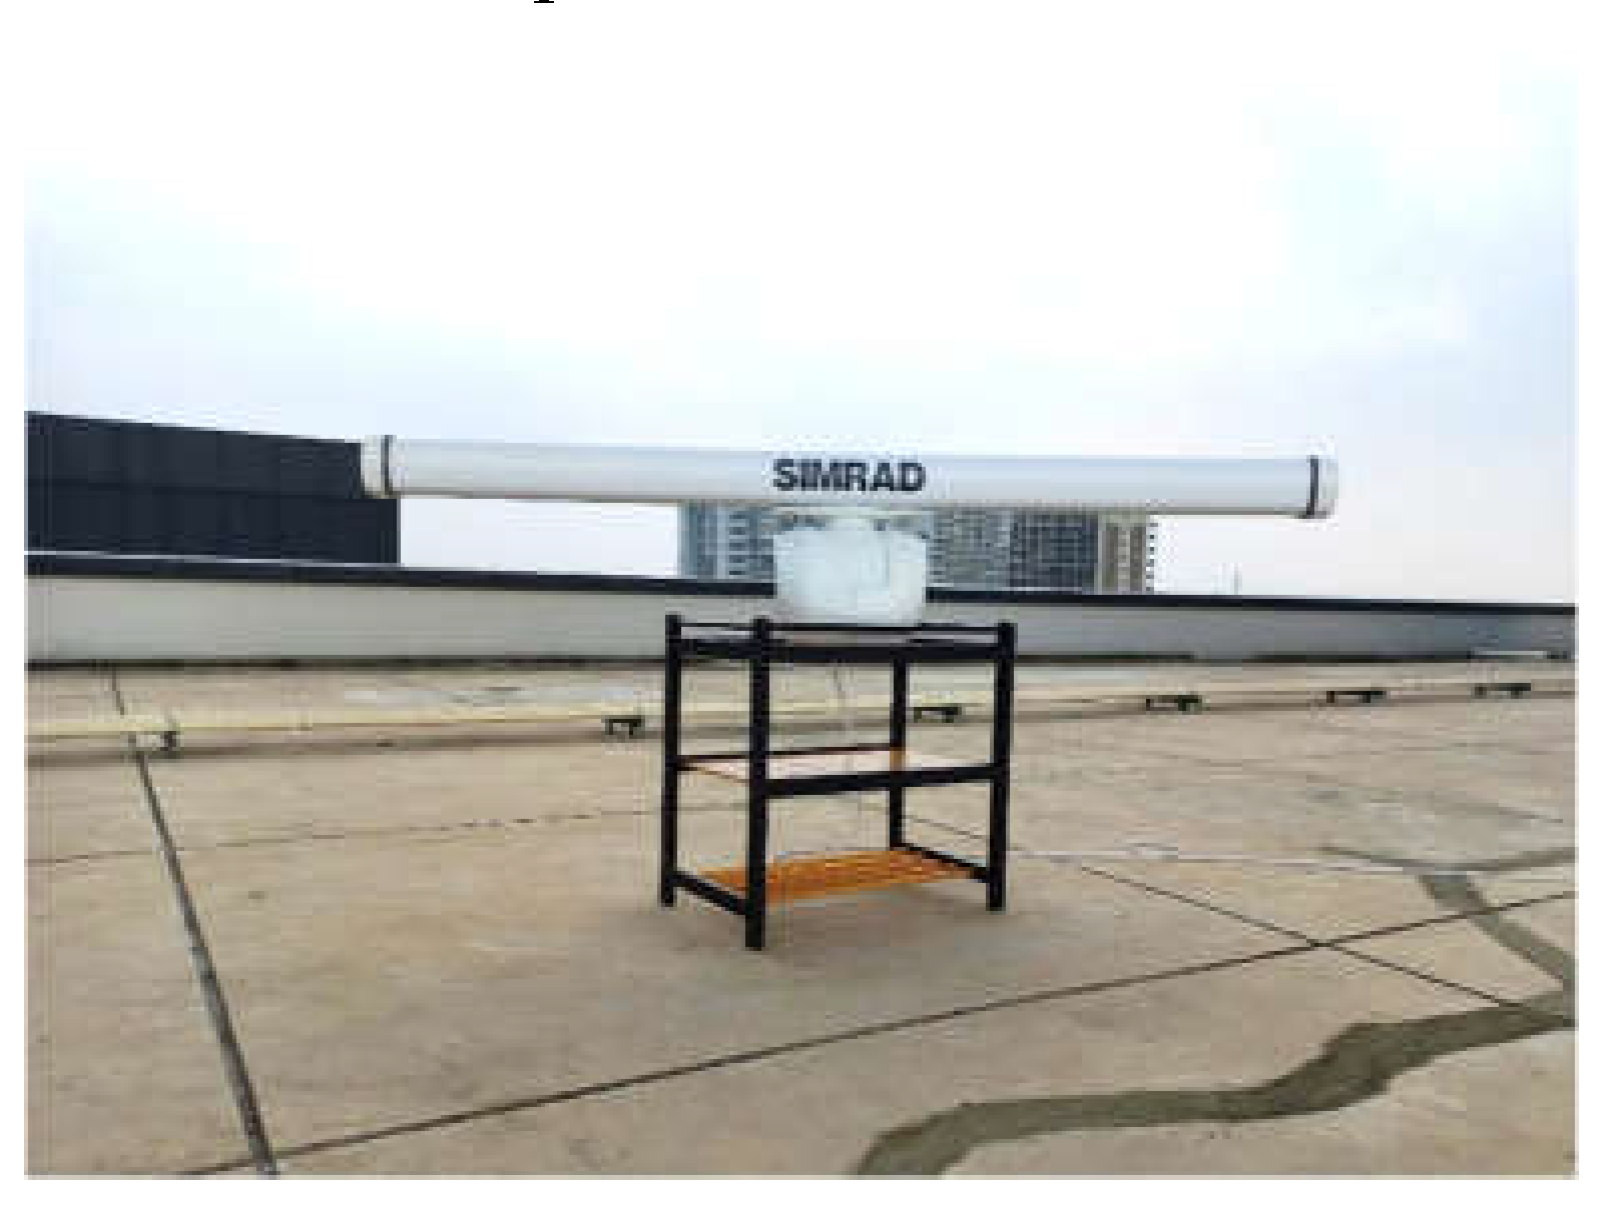
Figure 2.
Target installation of measuring instruments.
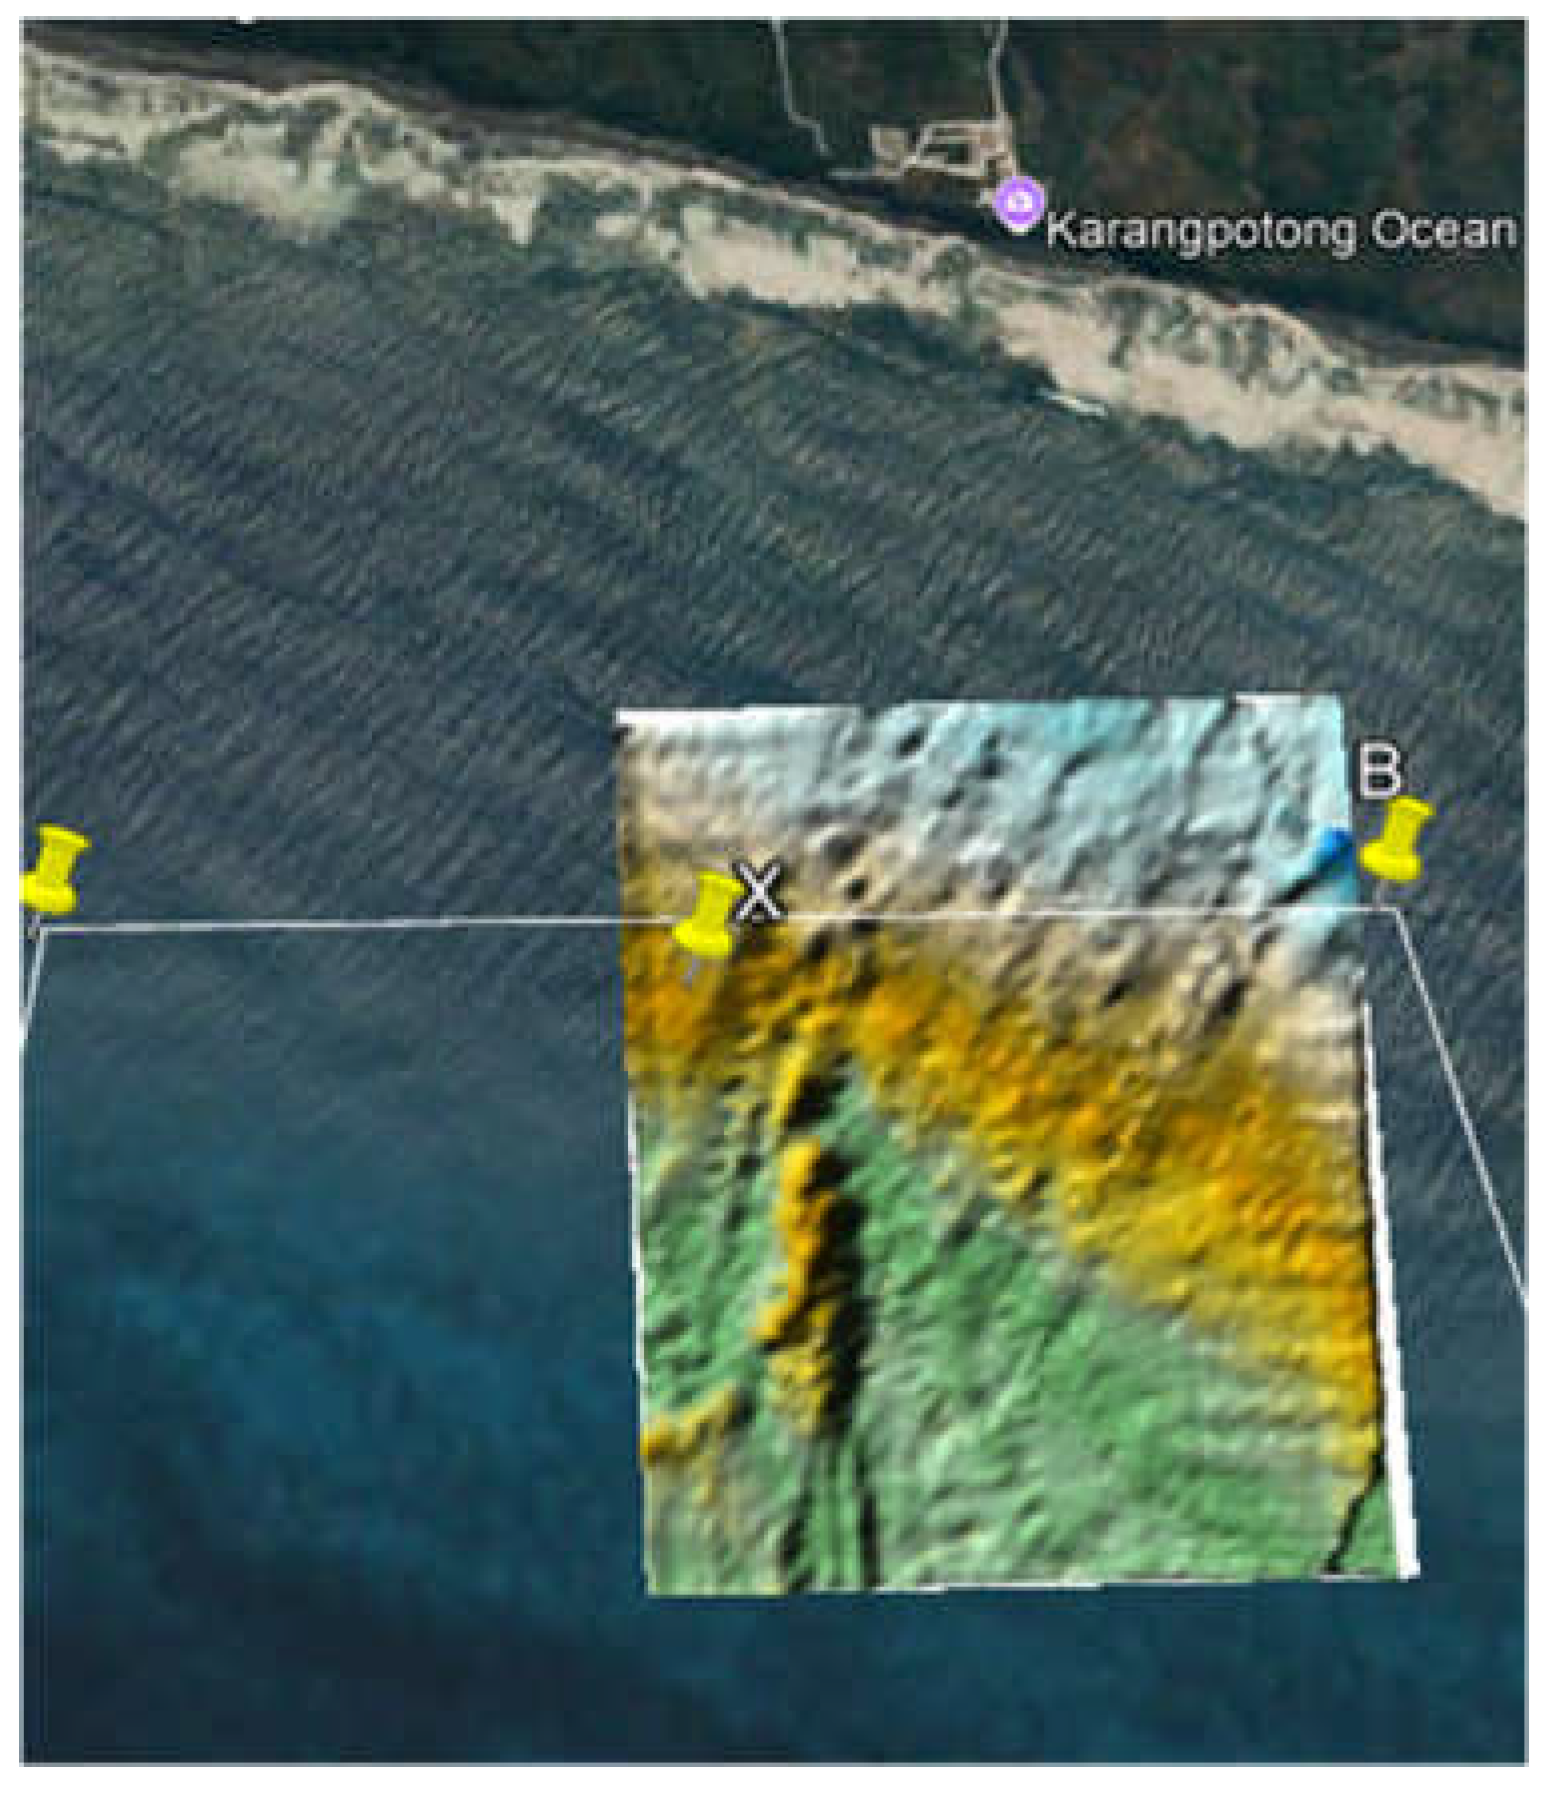
Figure 3.
SBE26 Plus to measure sea level using seawater pressure & temperature sensor.
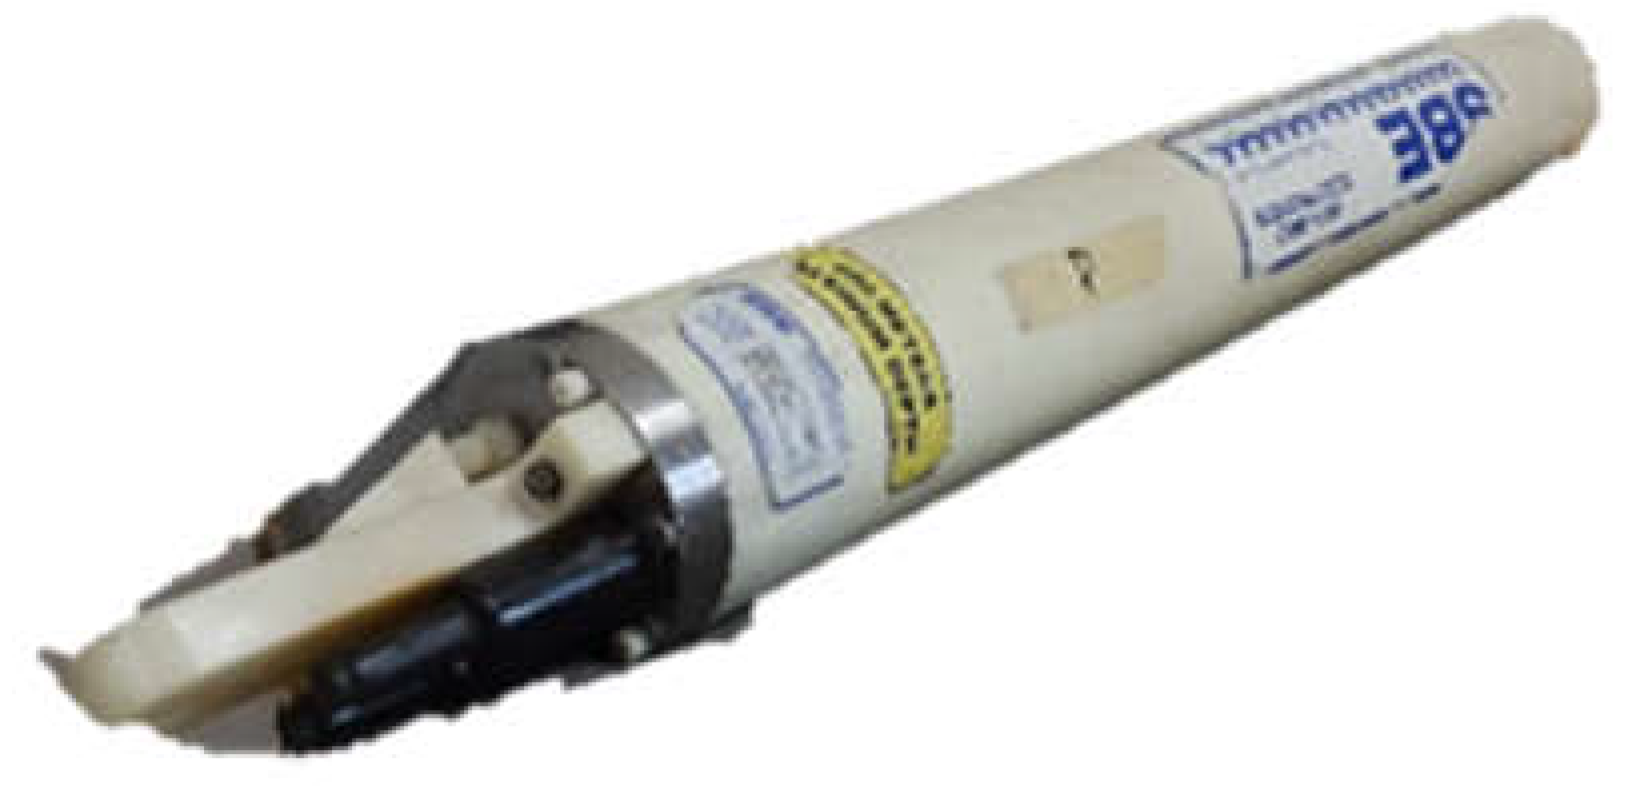
Figure 4.
Measurement and Data Collection of Pins on The Compressed Pulse Radar Pulse Radar [Personal Documents].
Figure 4.
Measurement and Data Collection of Pins on The Compressed Pulse Radar Pulse Radar [Personal Documents].
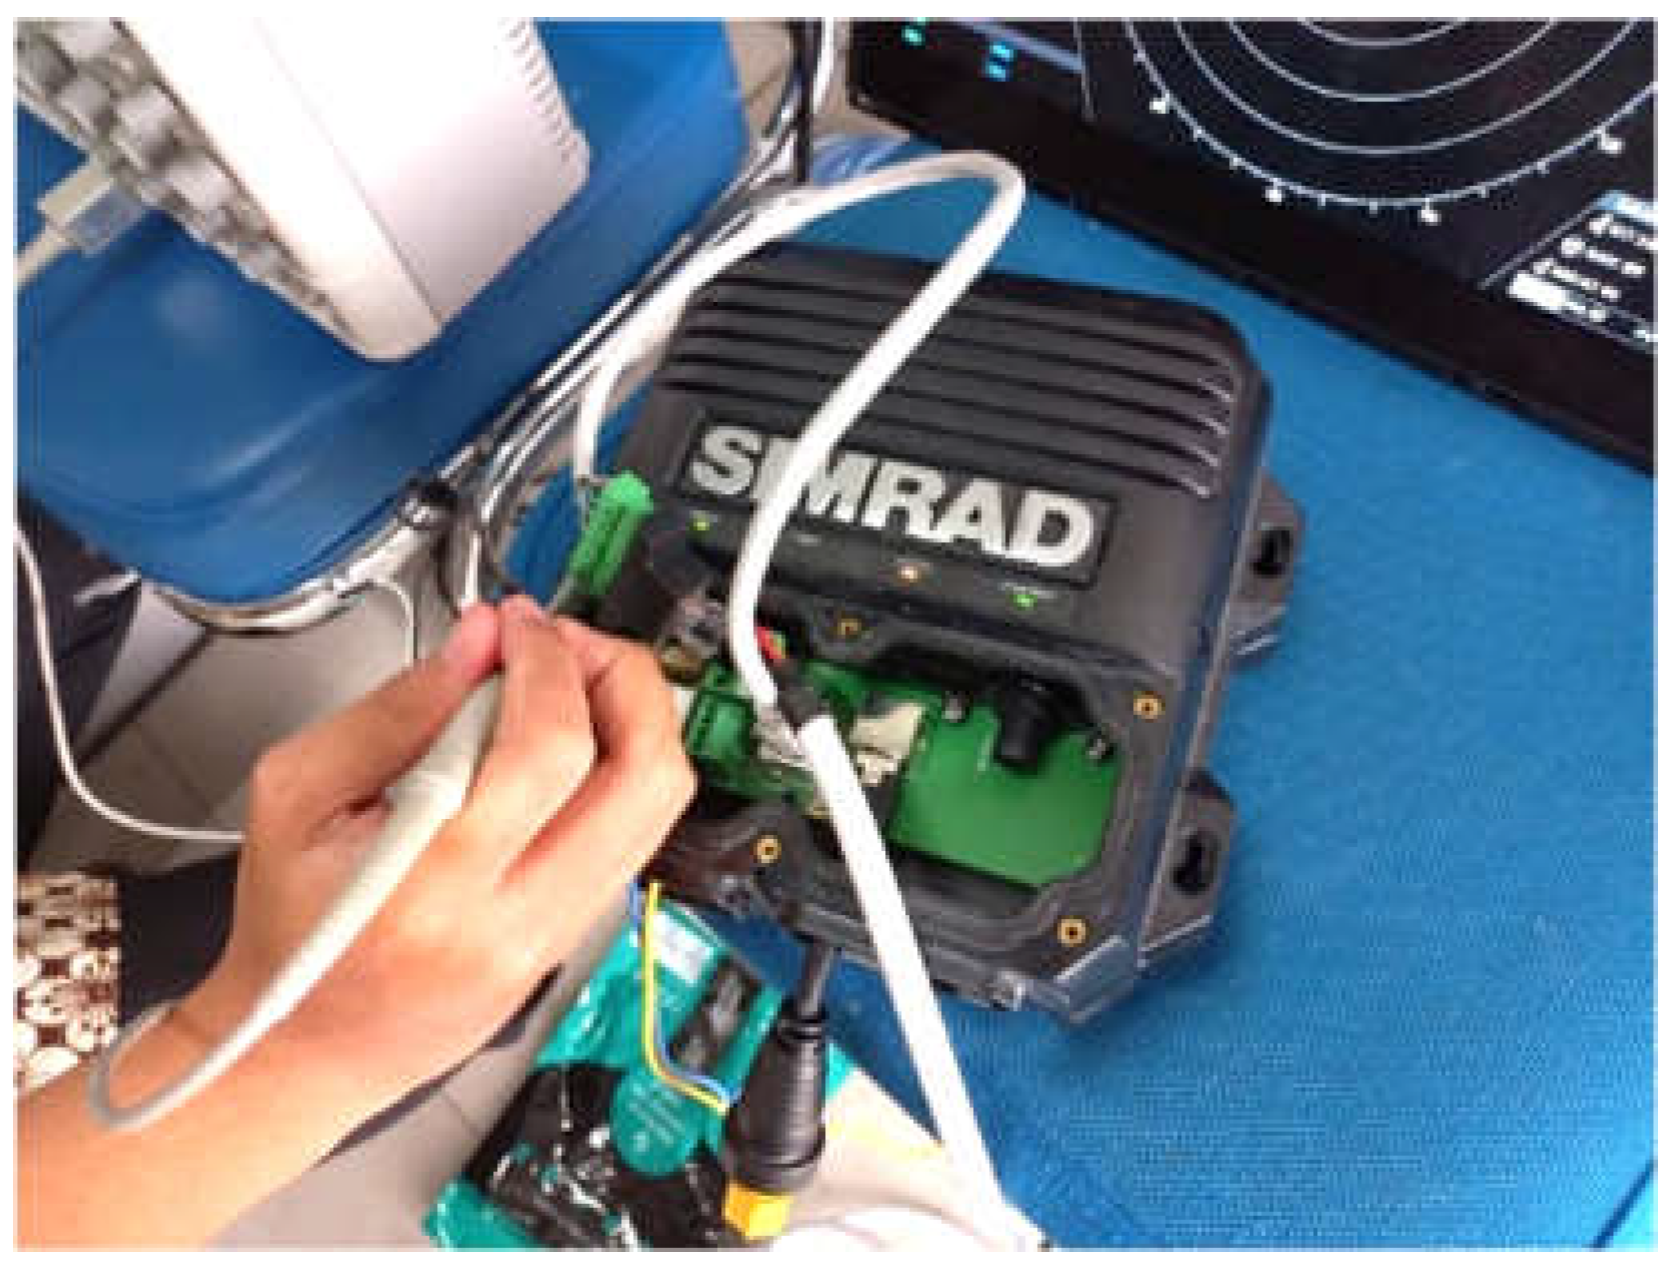
Figure 5.
Retrieval of signal data from each pin on The Compressed Pulse Radar complex using Spectrum Analyzer and SIMRAD [Personal Documents].
Figure 5.
Retrieval of signal data from each pin on The Compressed Pulse Radar complex using Spectrum Analyzer and SIMRAD [Personal Documents].
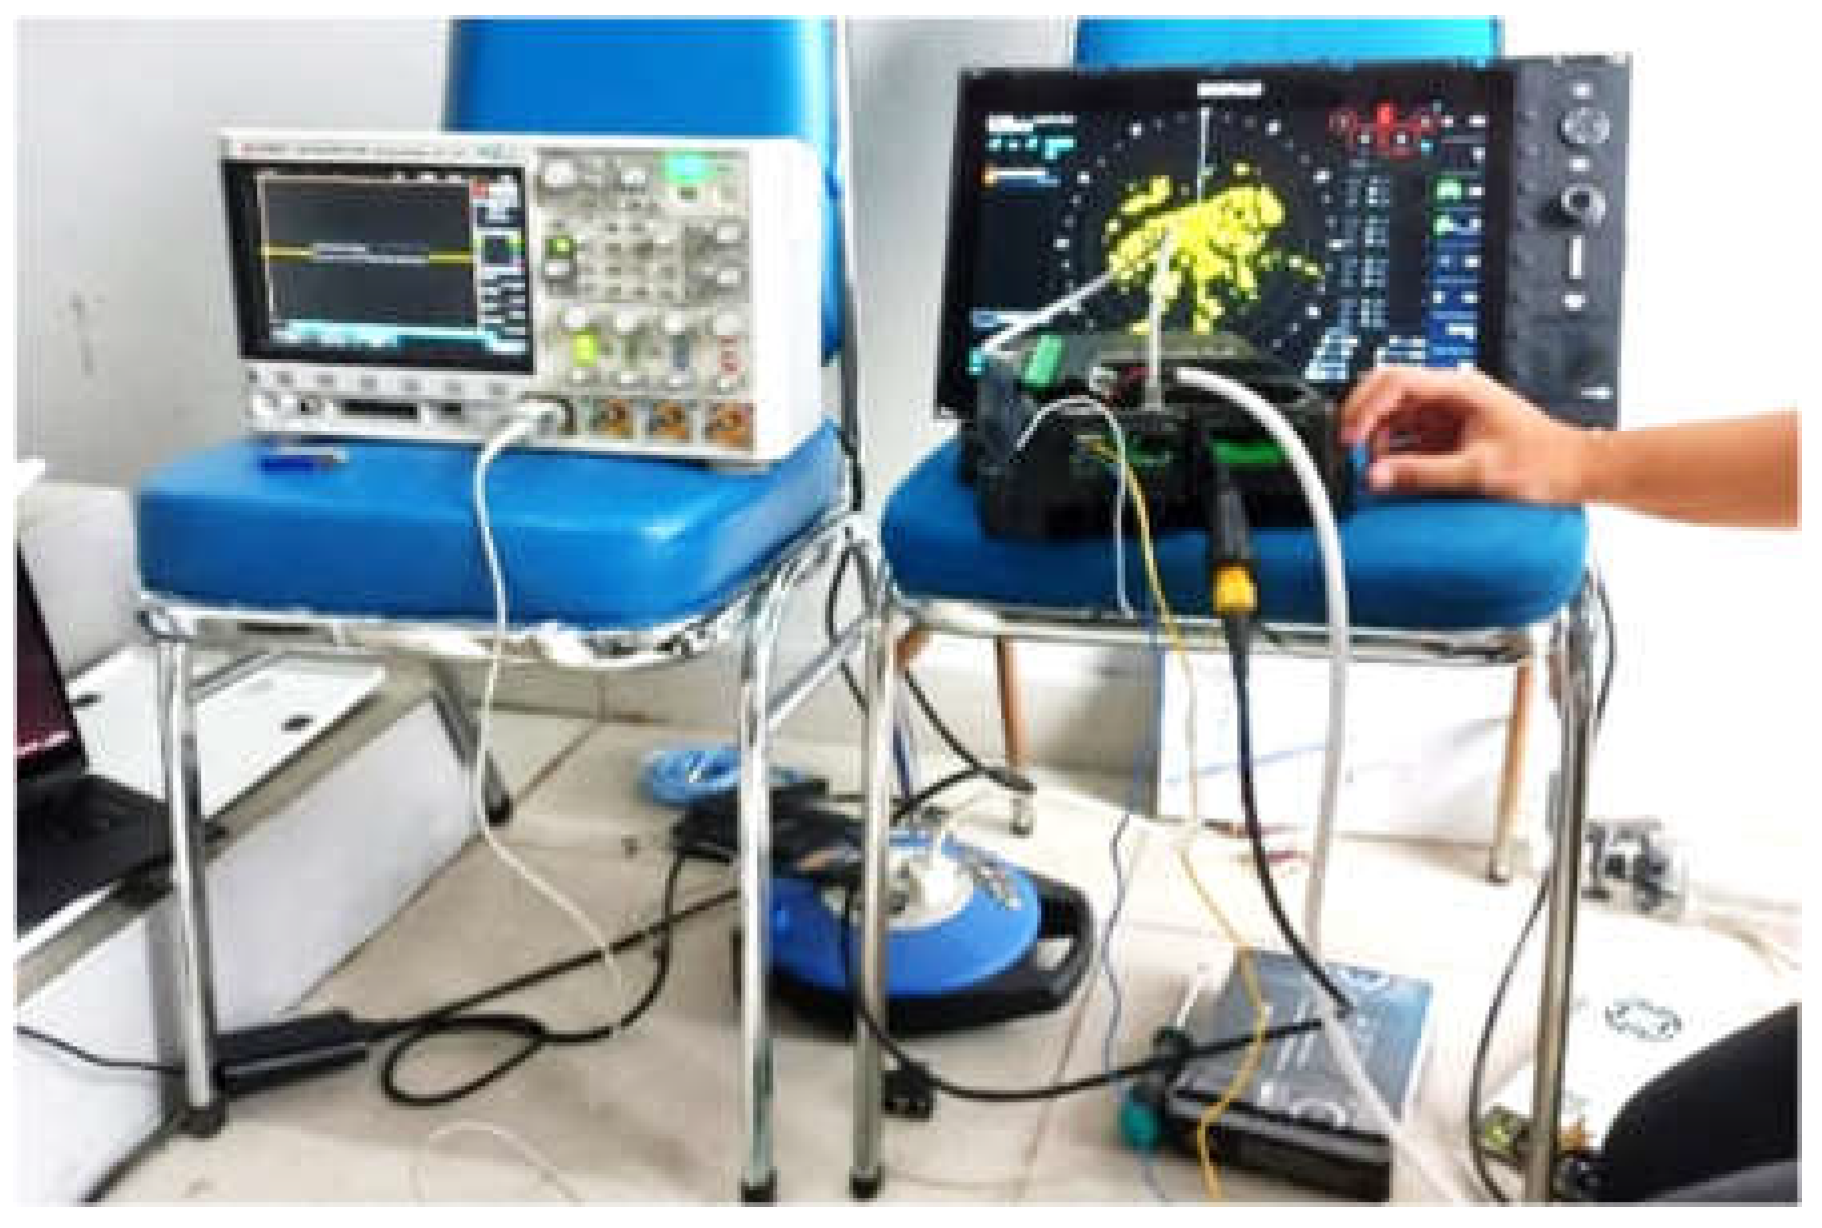
Figure 6.
Installation of instruments that will be placed at sea.
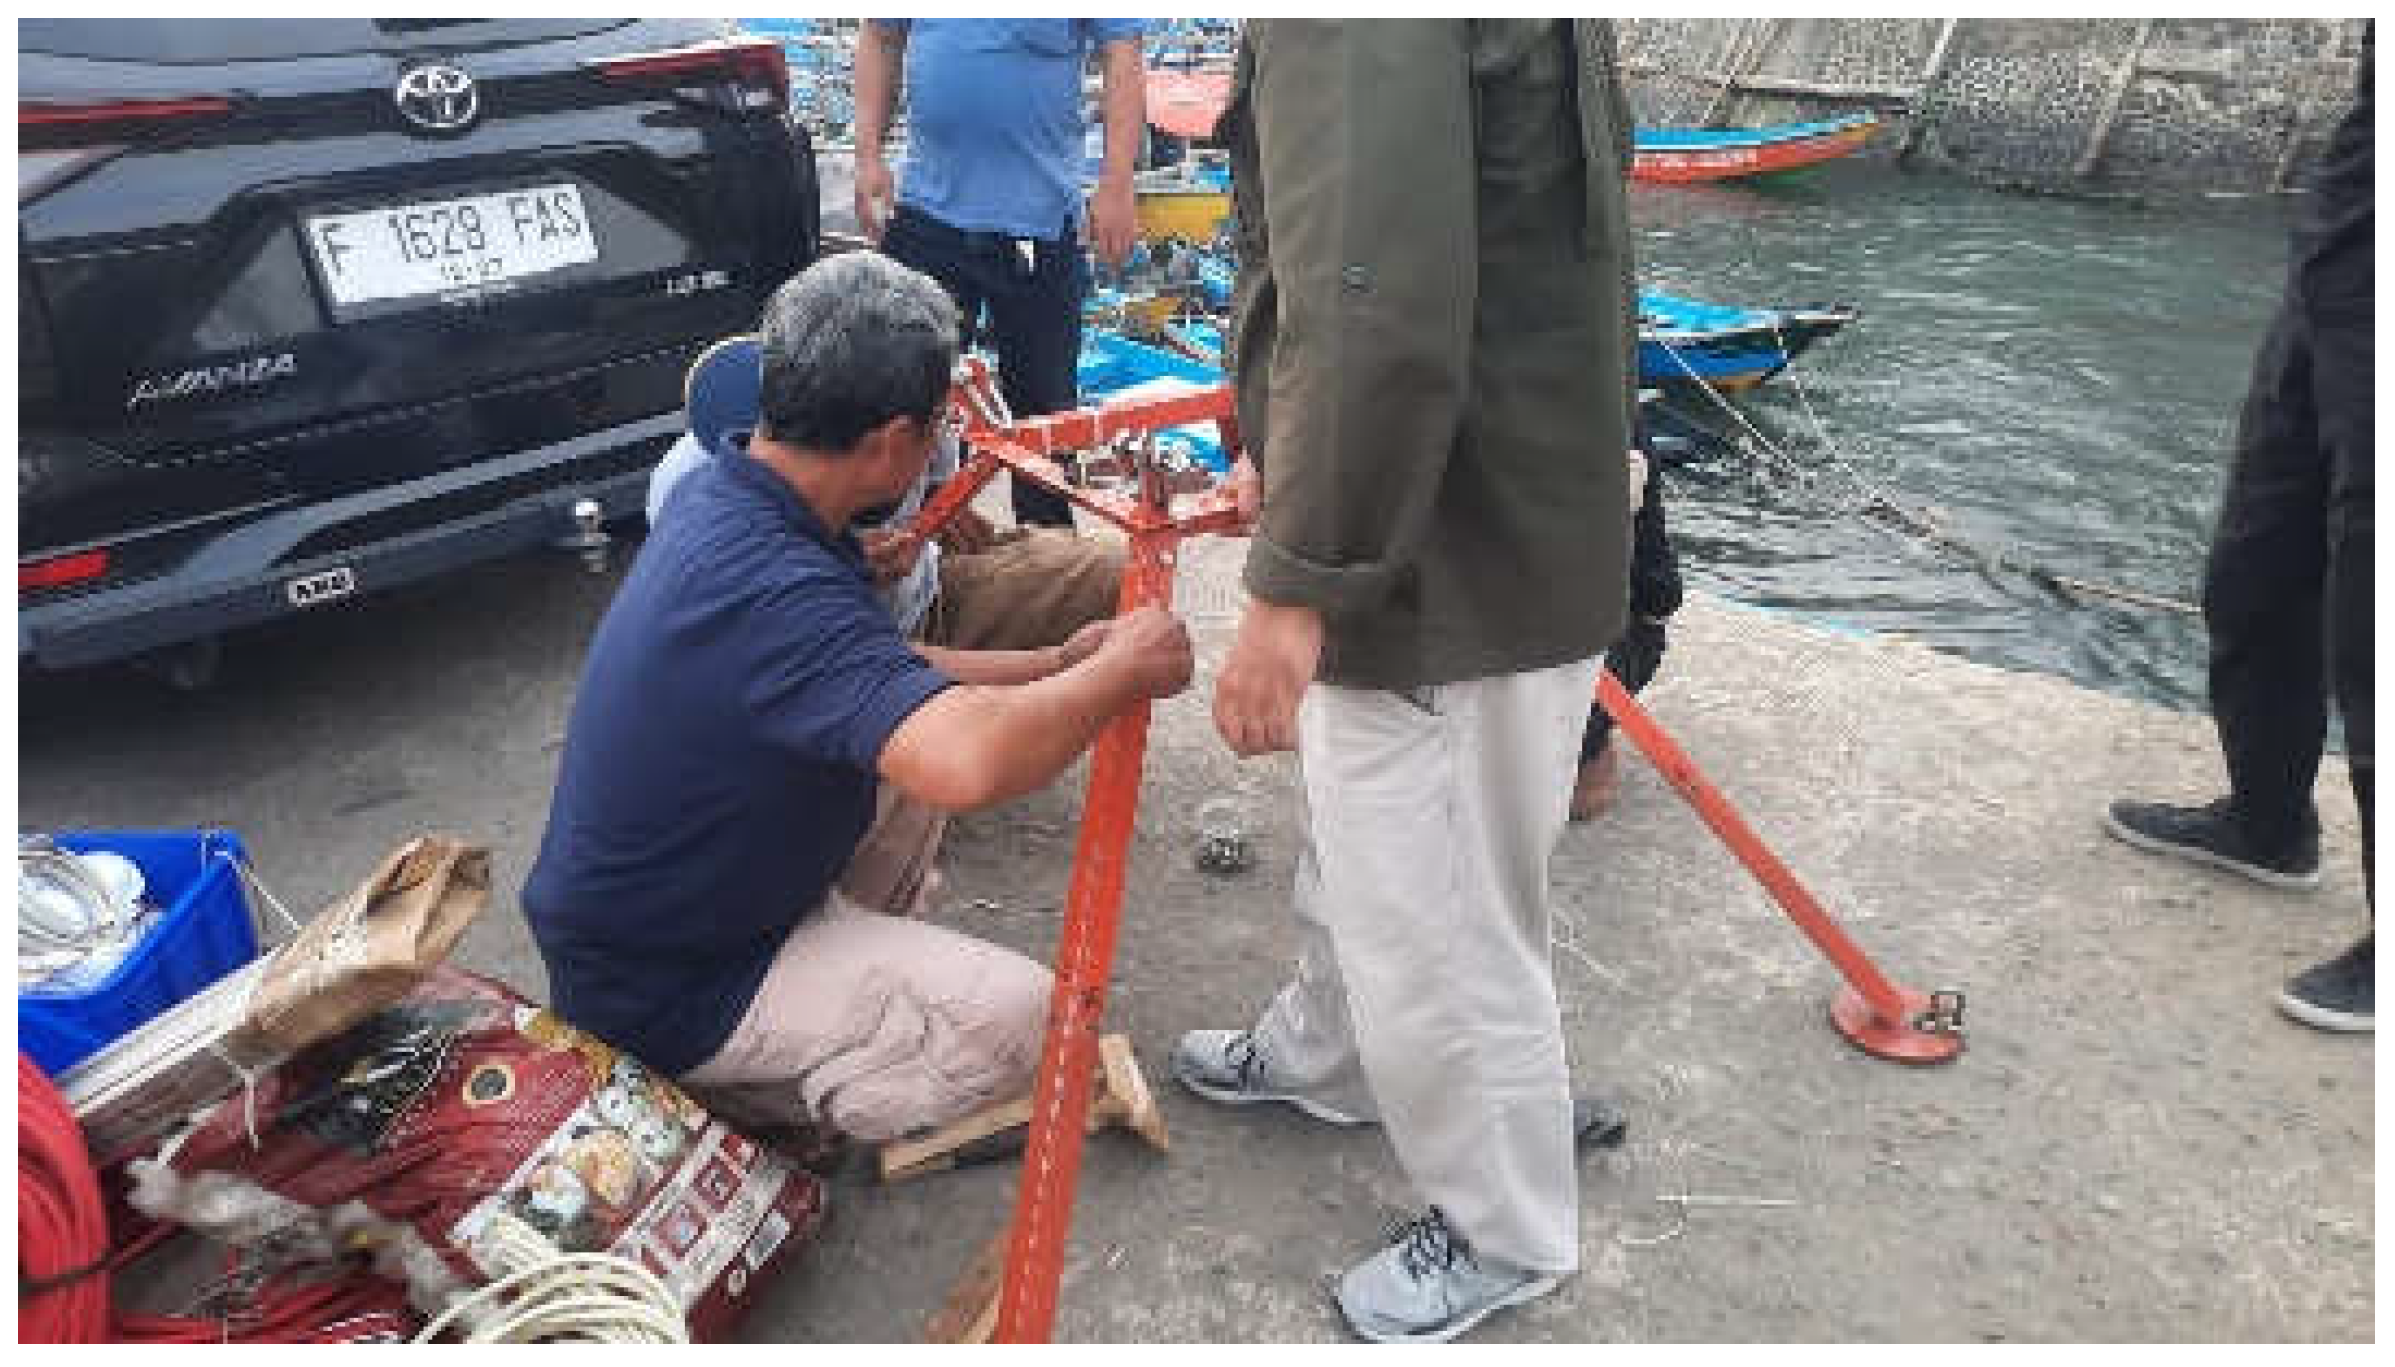
Figure 7.
Installation of instruments that will be placed at sea, enter by small boat to the center of the sea.
Figure 7.
Installation of instruments that will be placed at sea, enter by small boat to the center of the sea.
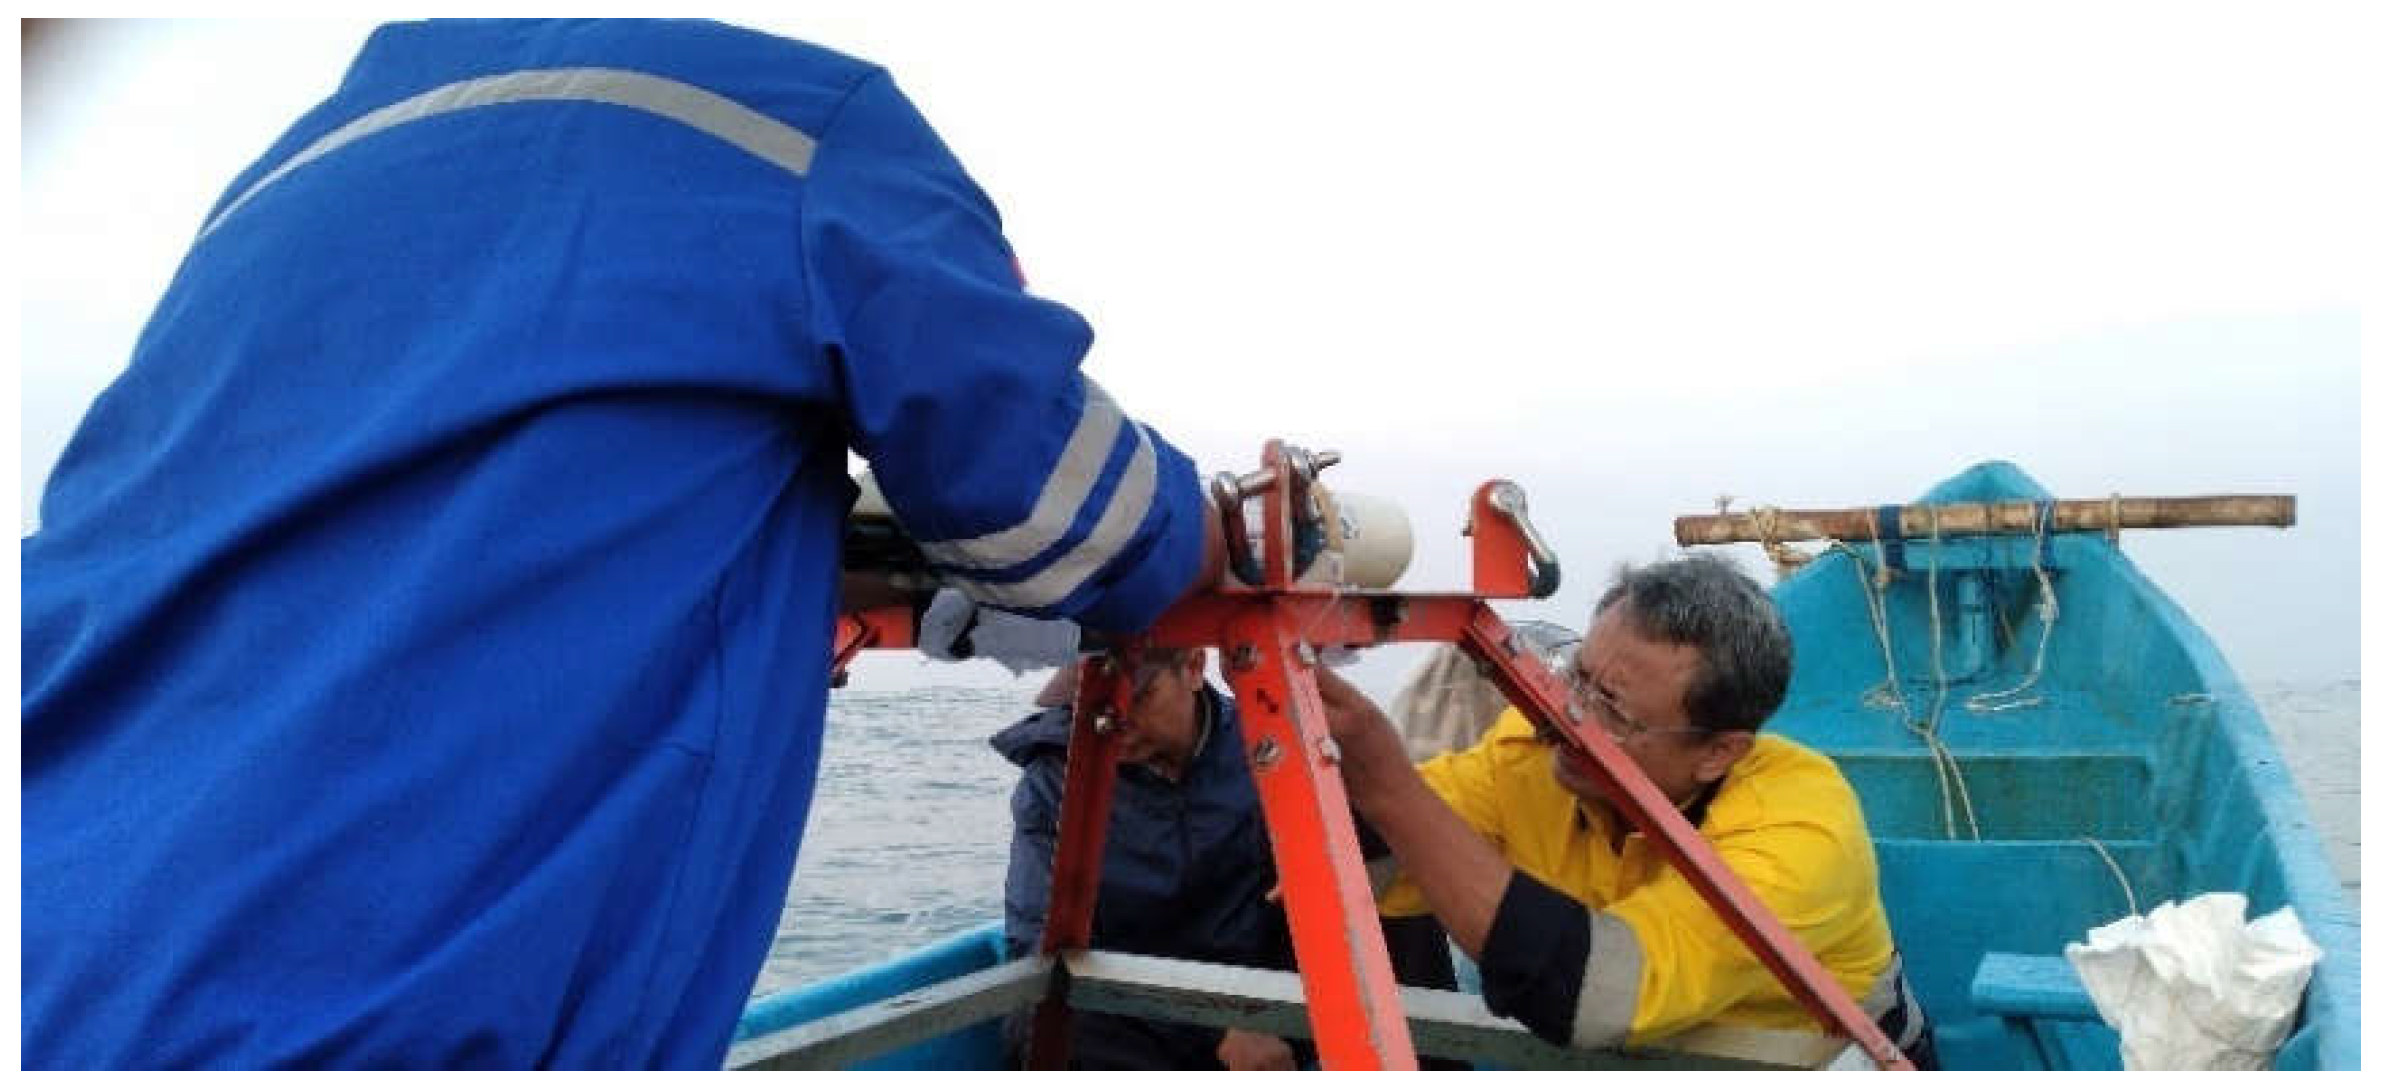
Figure 8.
The process of traveling to the middle of the sea using a boat to install sensors or instruments.
Figure 8.
The process of traveling to the middle of the sea using a boat to install sensors or instruments.
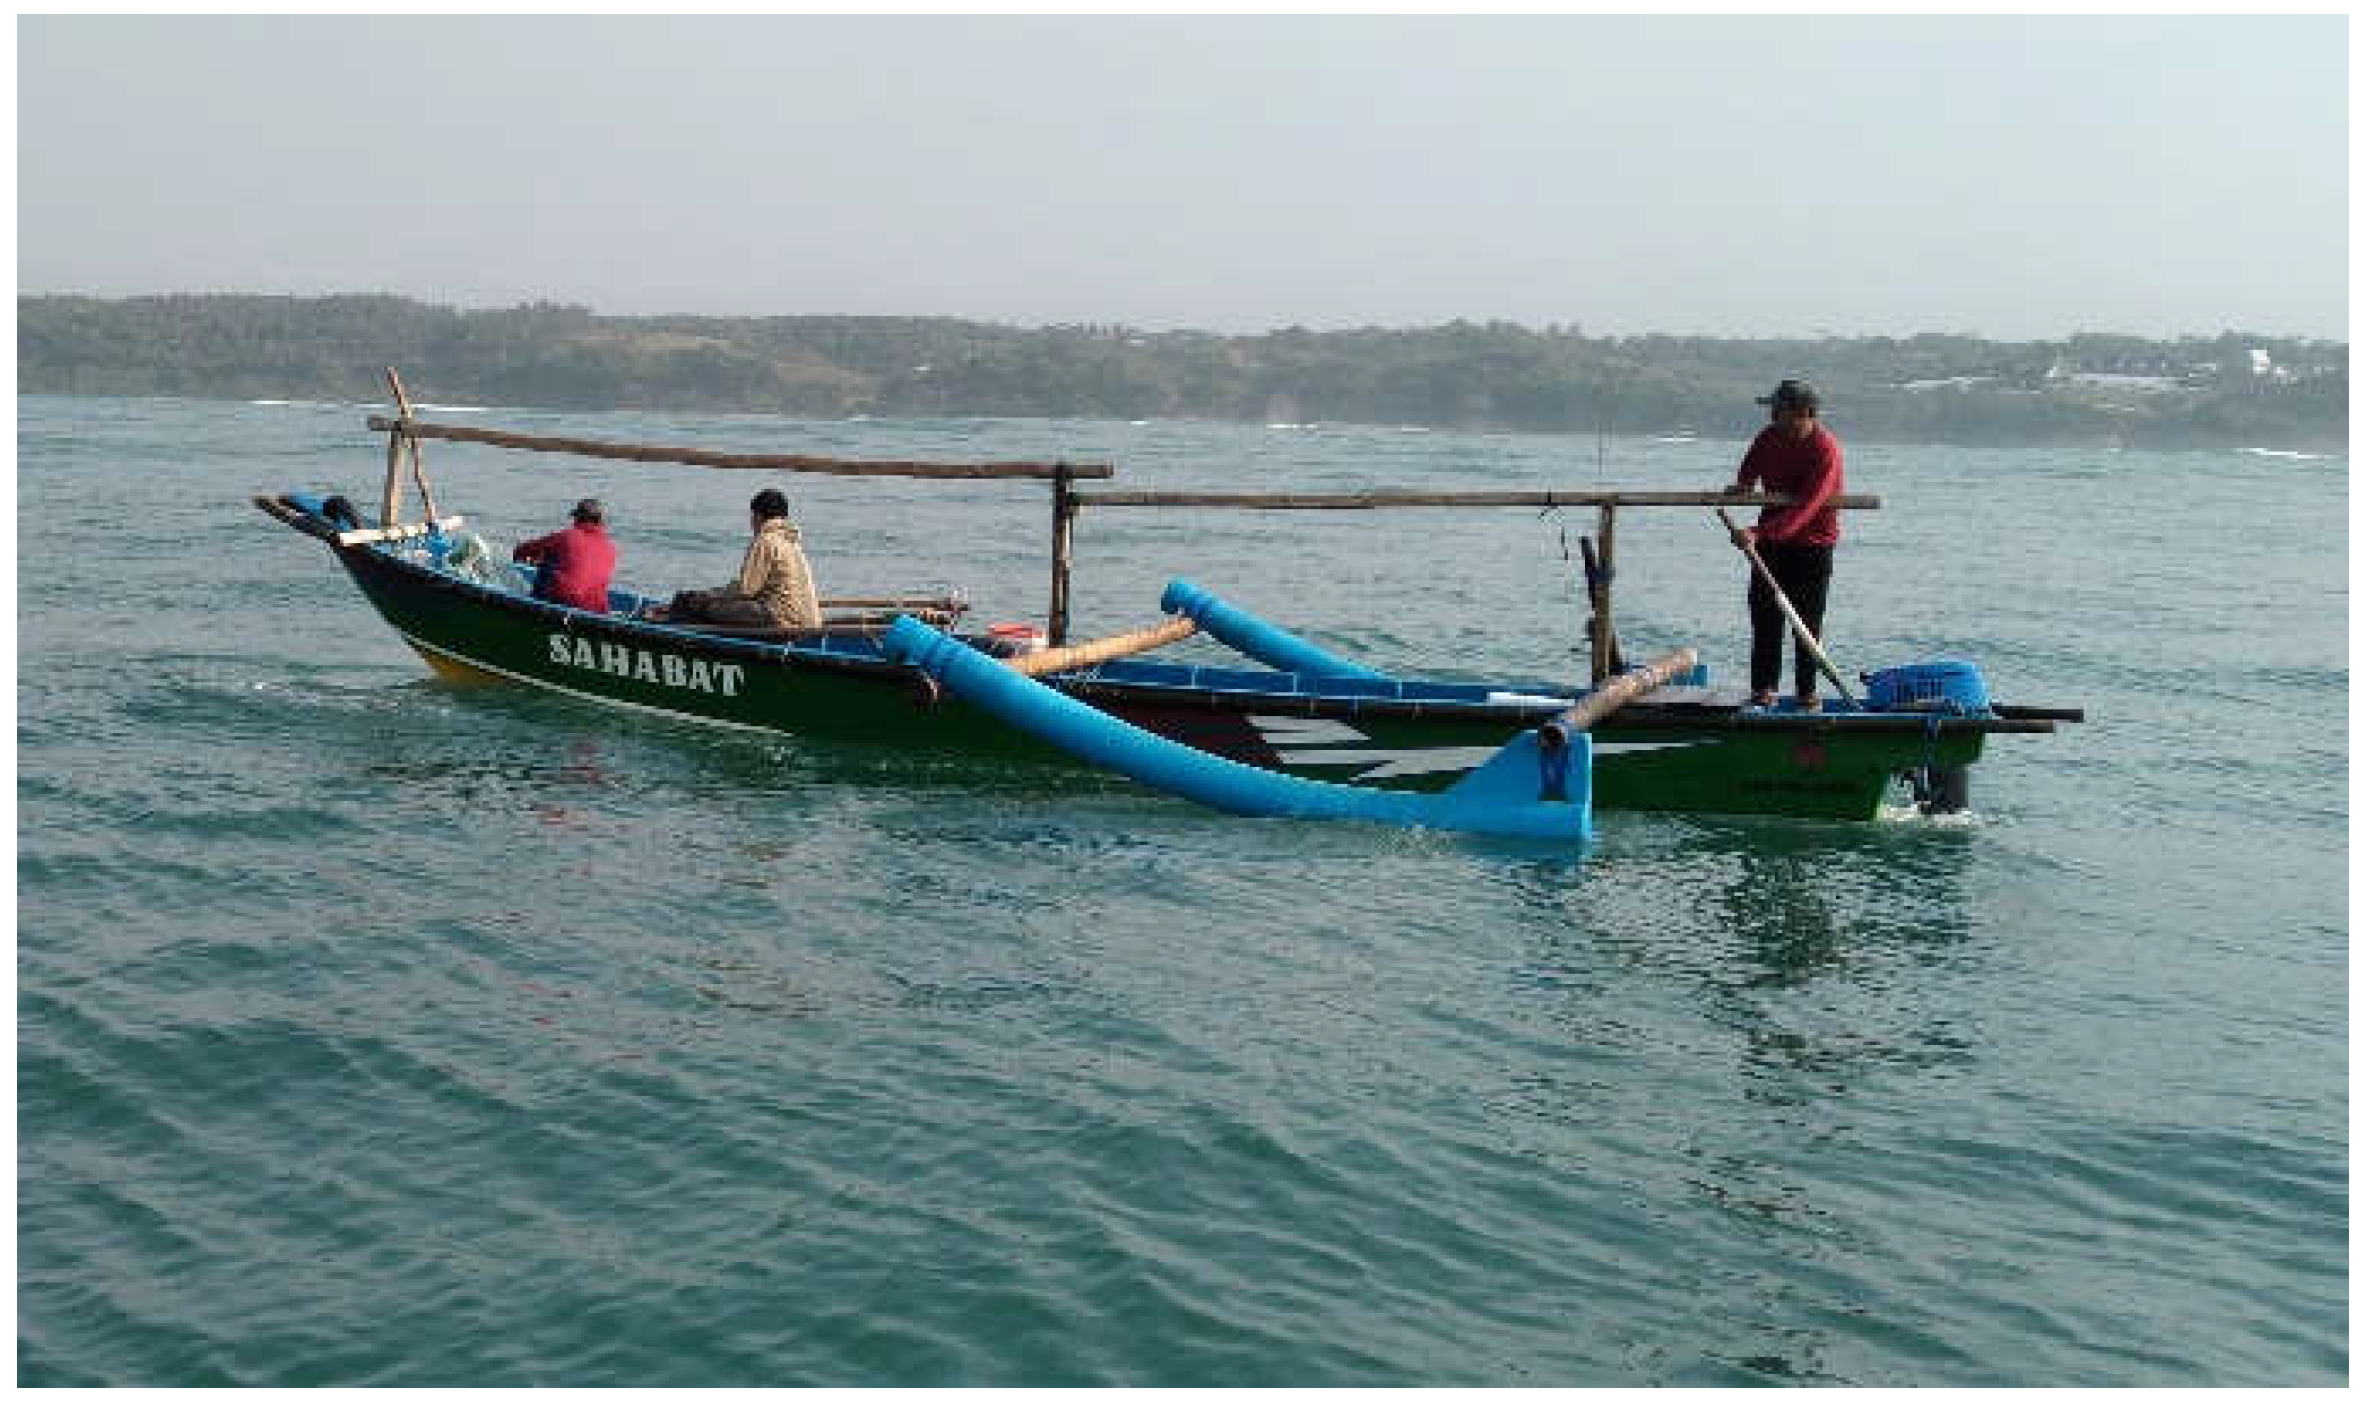
Figure 9.
Target Reading on Sea Clutter by The Compressed Pulse Radar [Personal Documents].
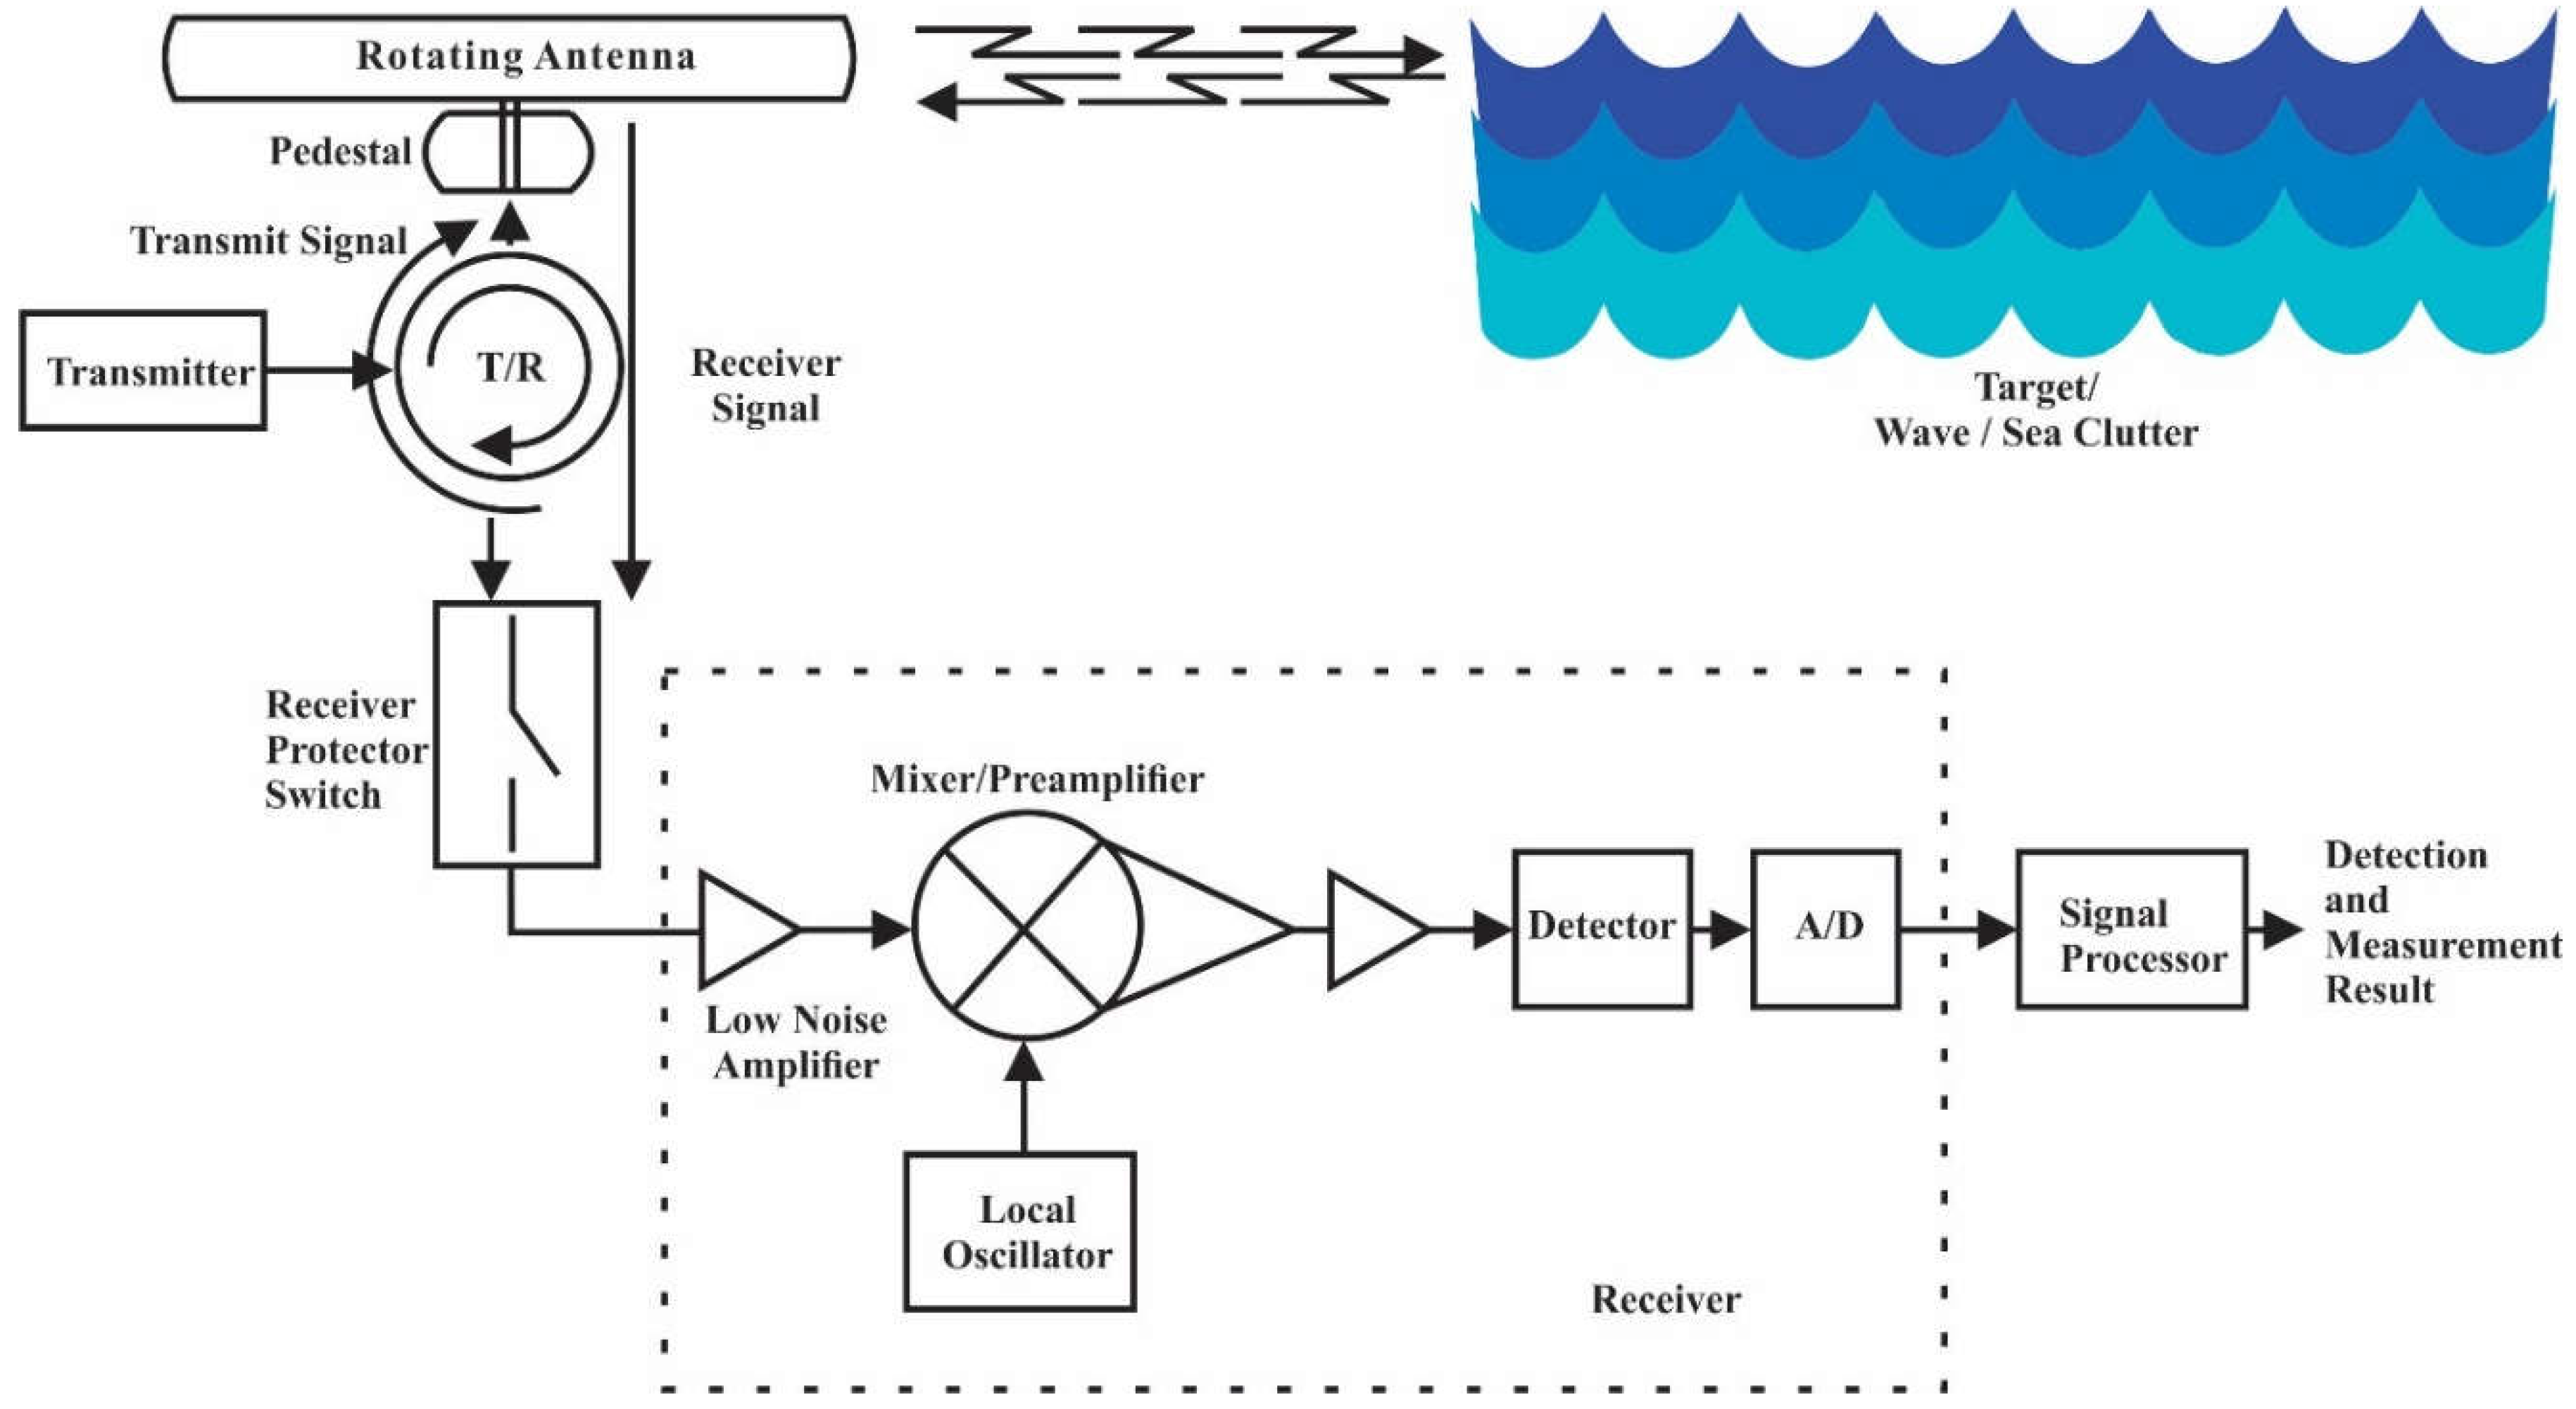
Figure 10.
Data Retrieval from SIMRAD Radar with openCPN and MATLAB Image Processing.
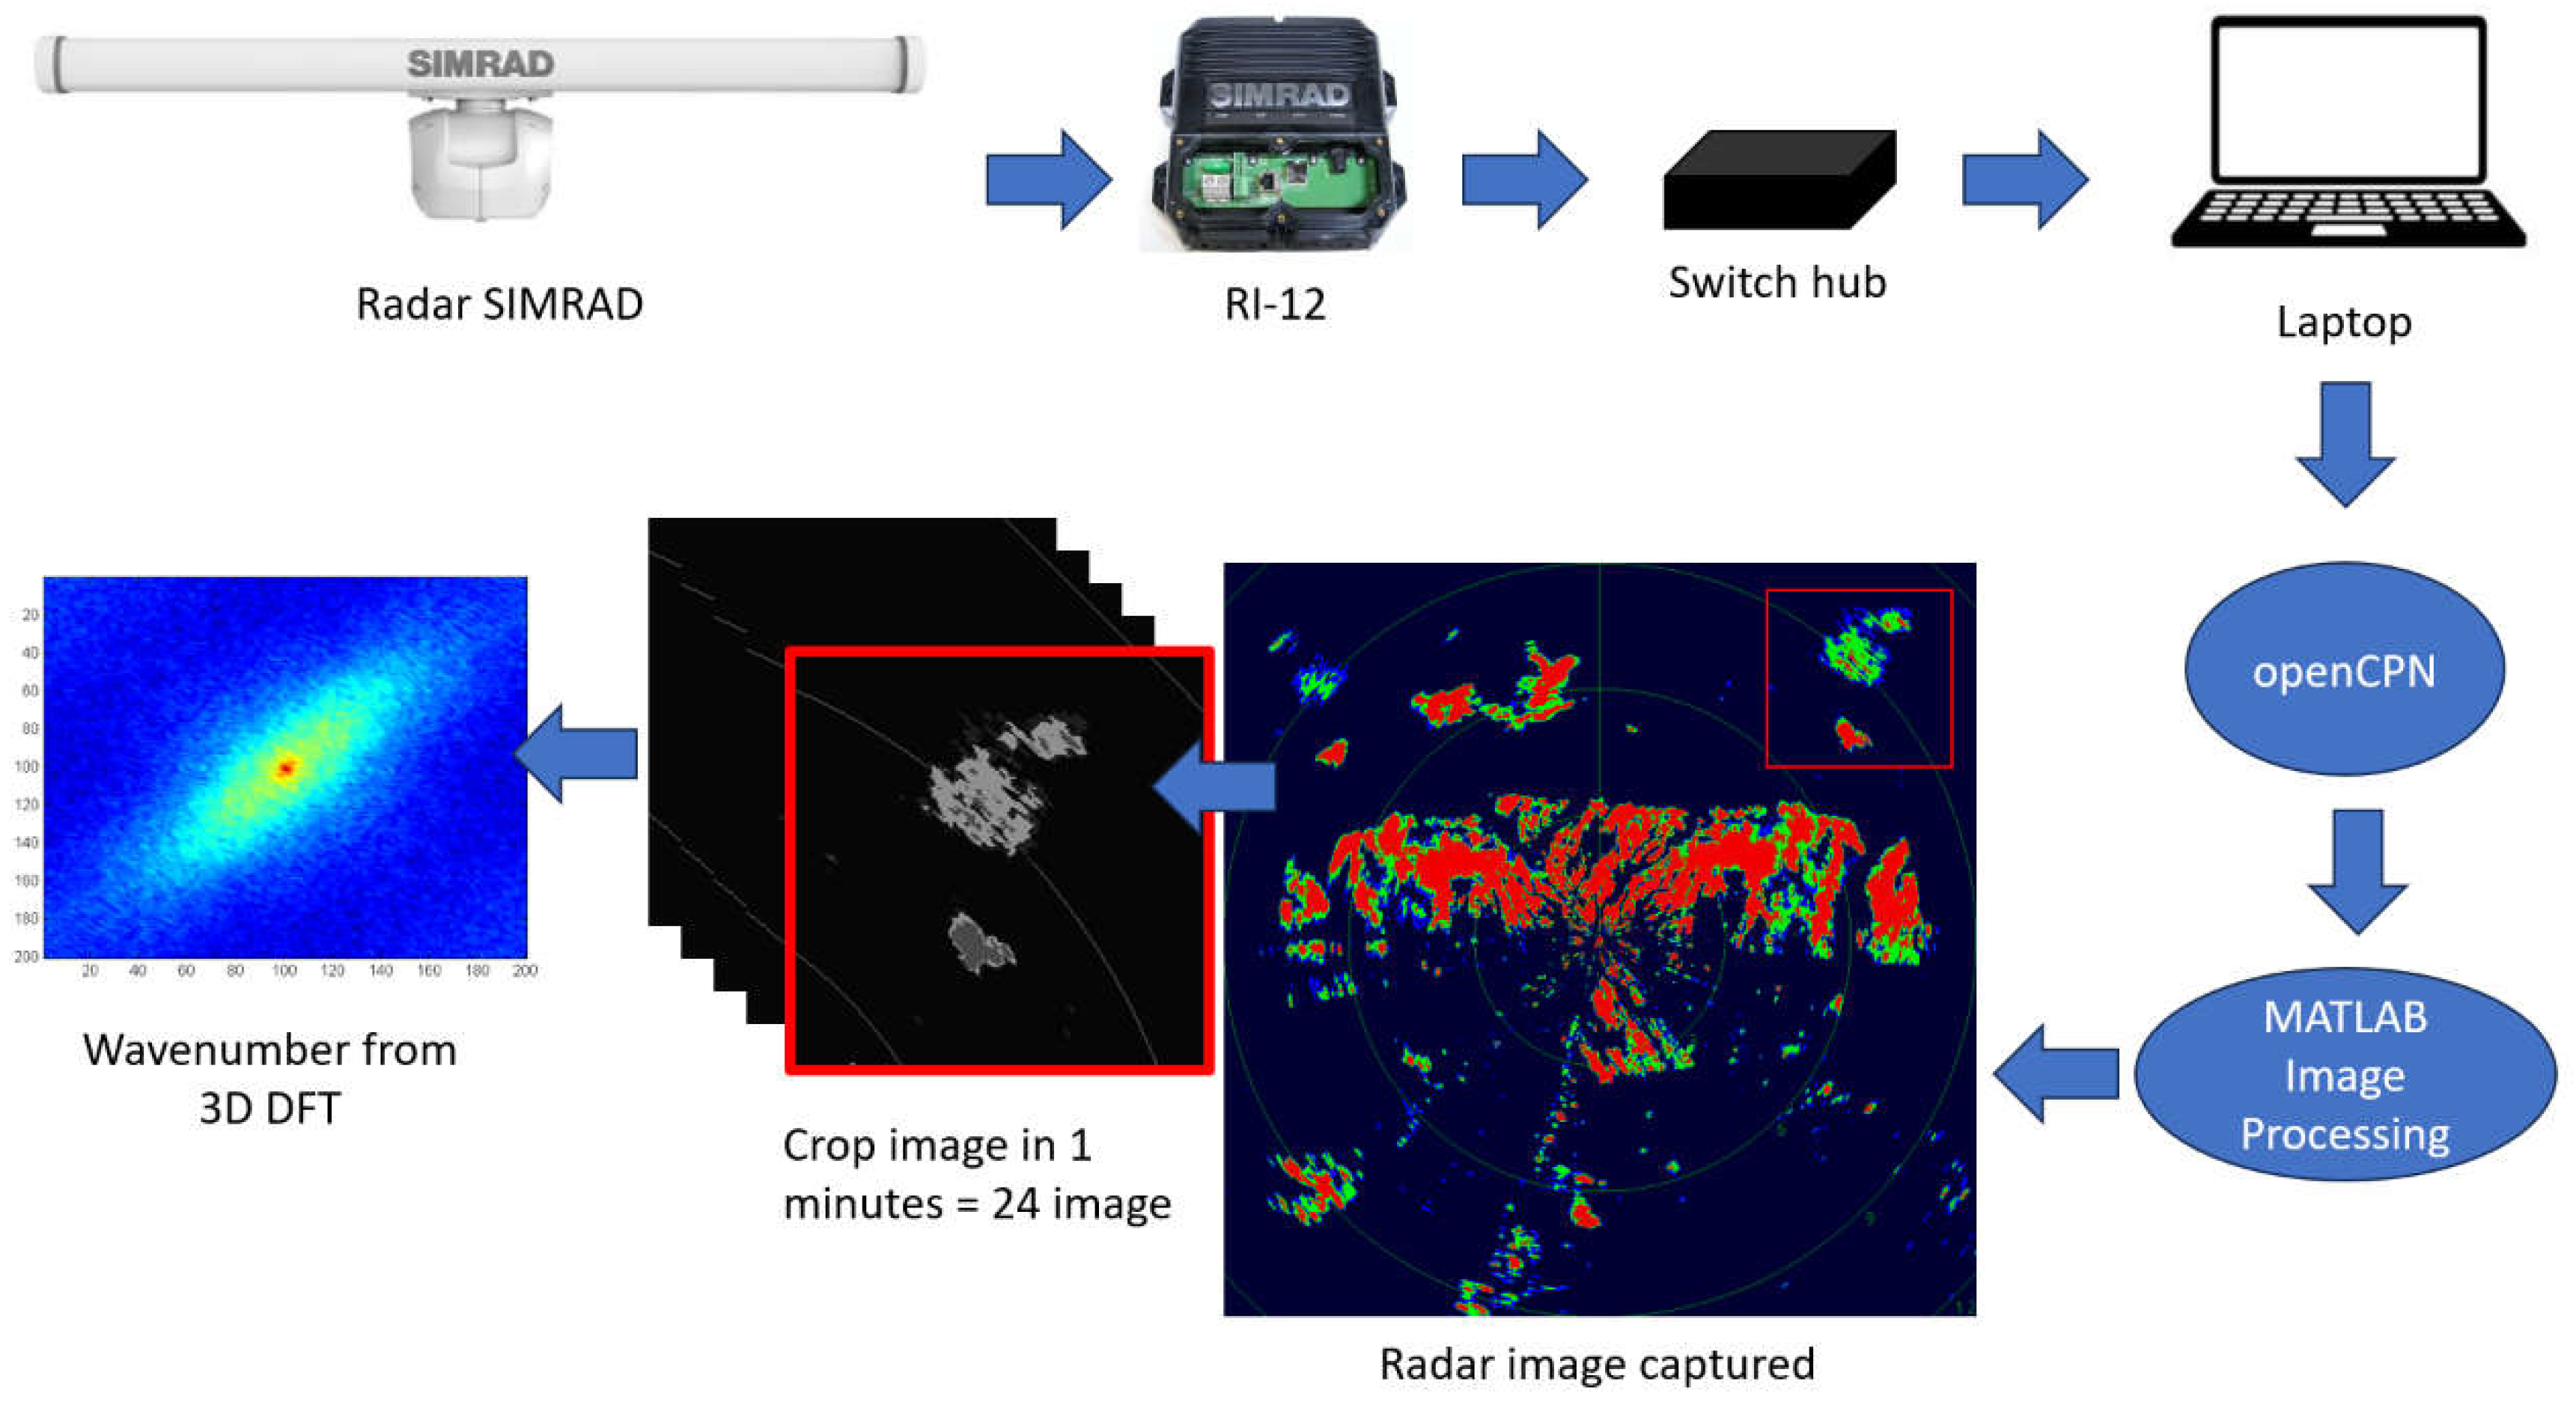
Figure 11.
Power Percentage (%) of the transmitting angle The Compressed Pulse Radar [Personal Documents].
Figure 11.
Power Percentage (%) of the transmitting angle The Compressed Pulse Radar [Personal Documents].
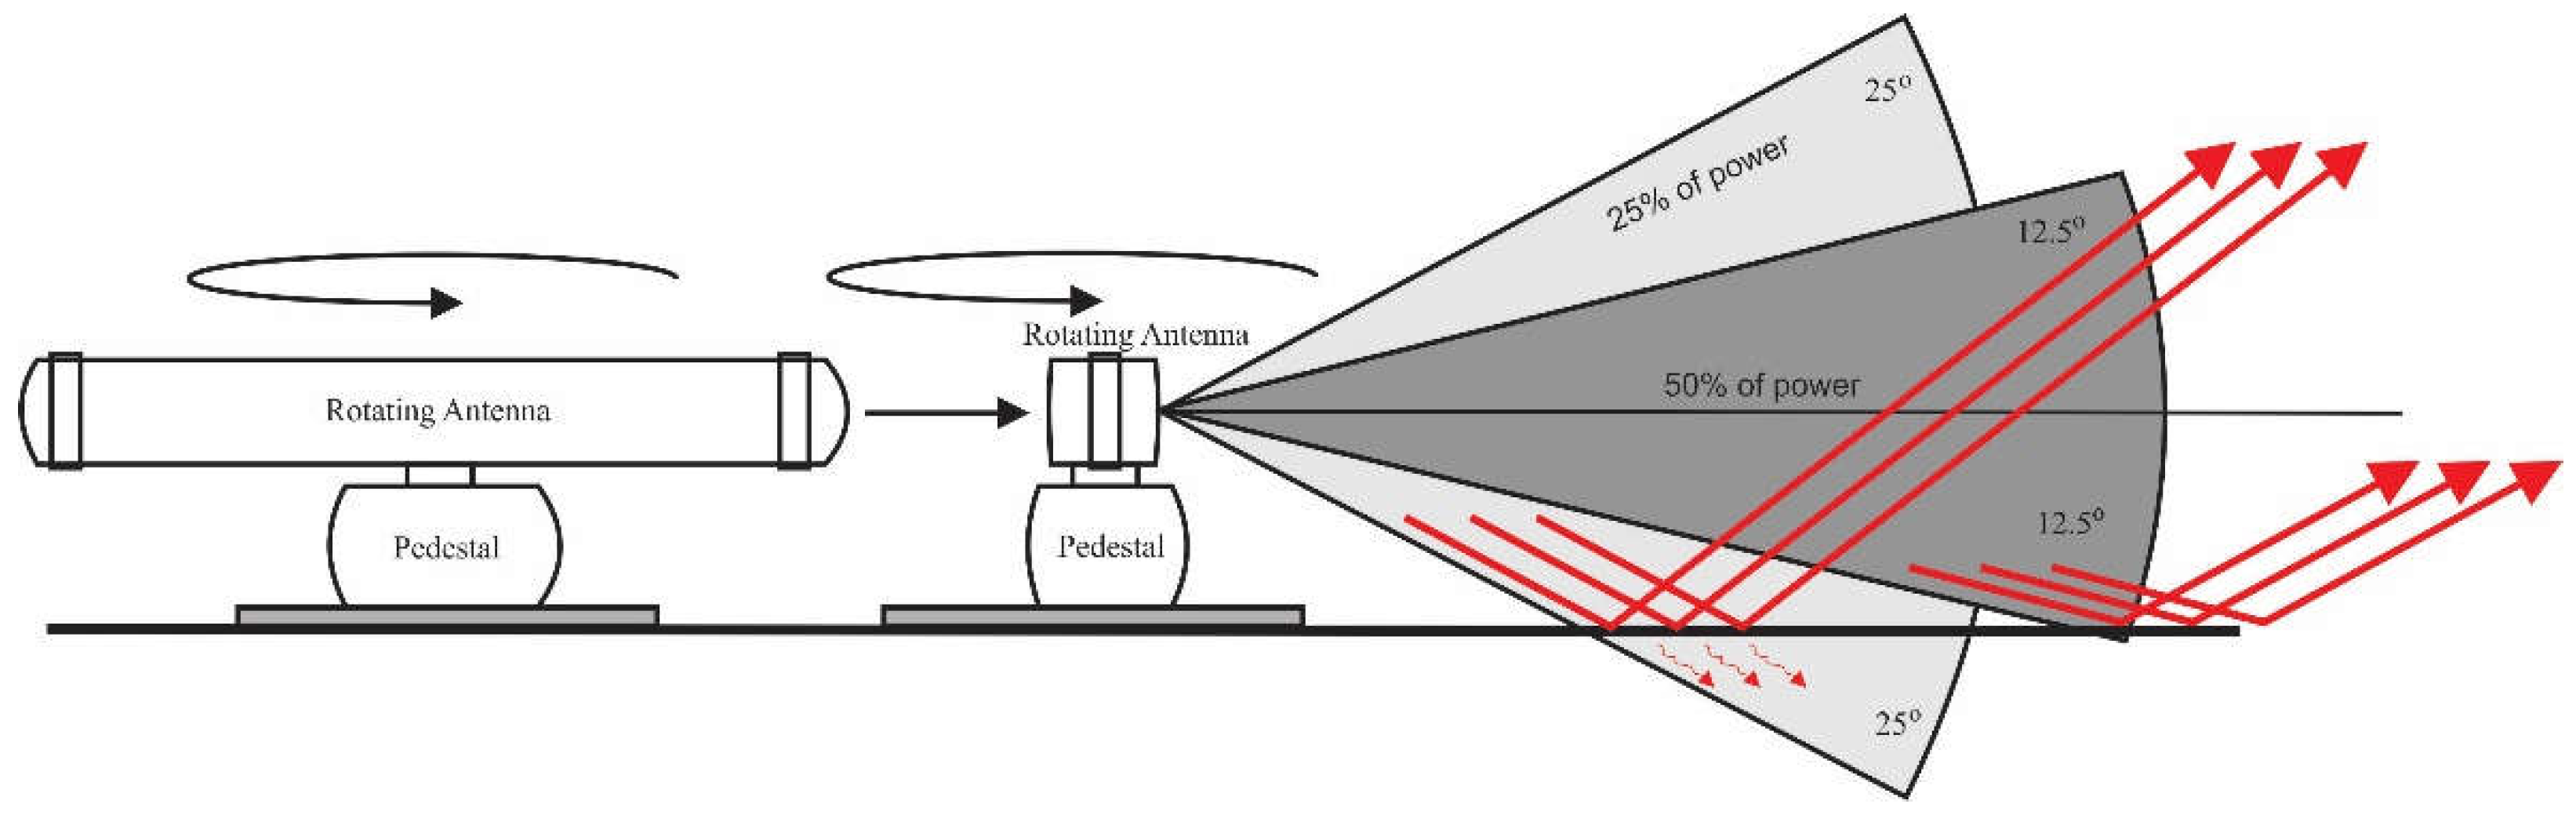
Figure 13.
Input Noise Power of Radar.
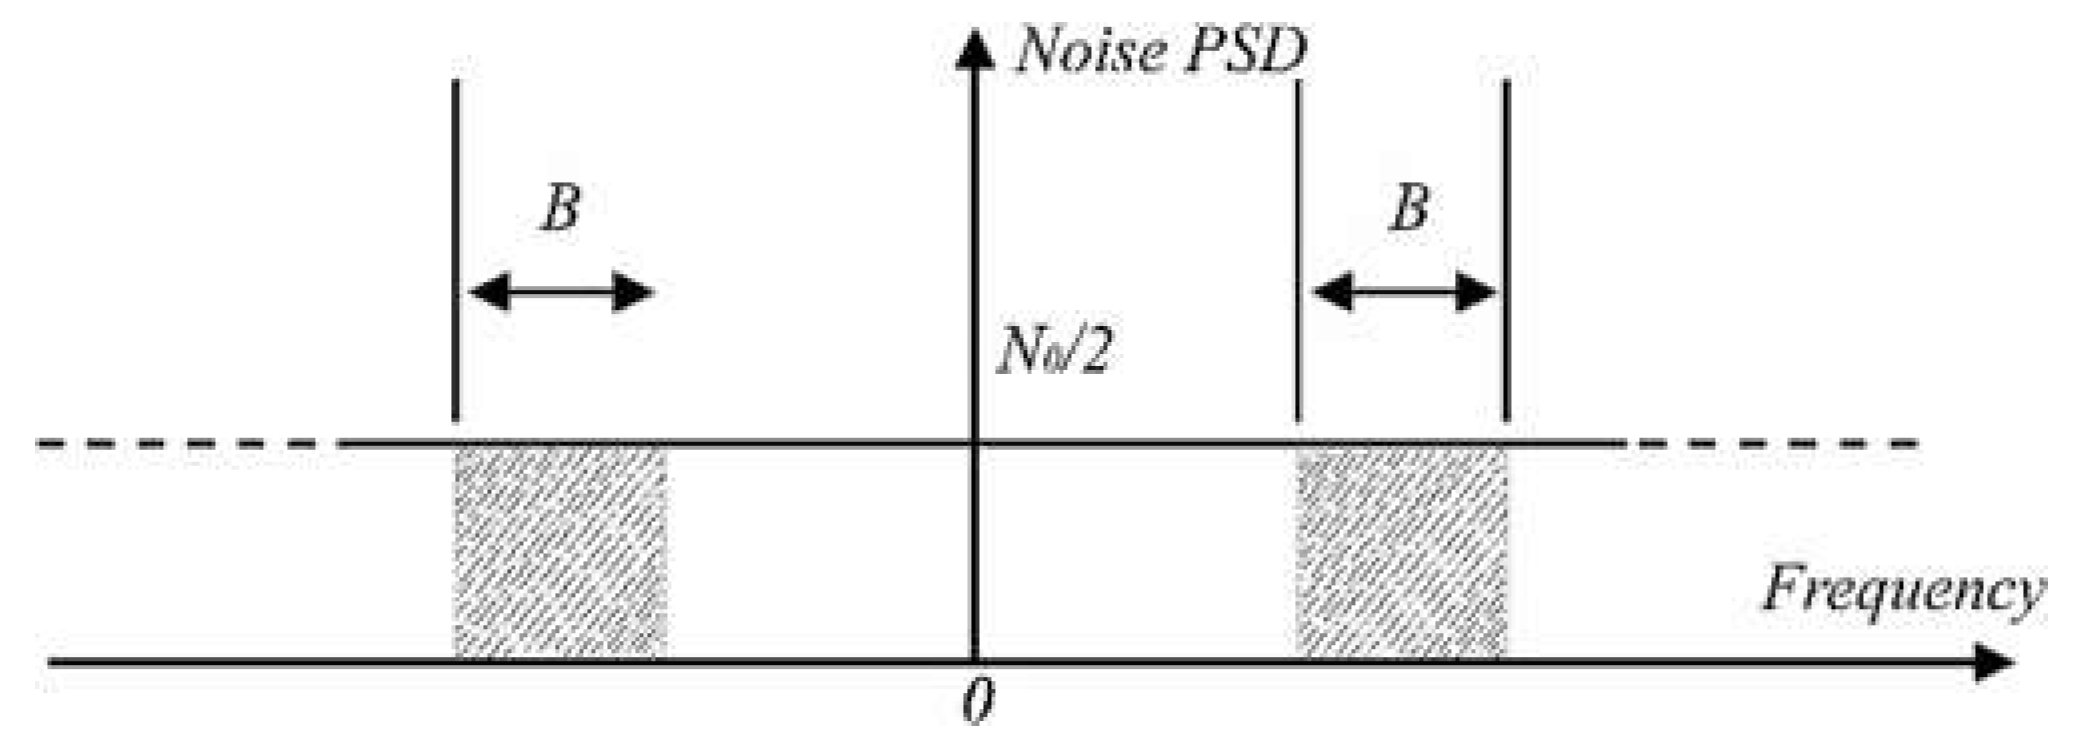
Figure 14.
Transmitted or Received Signals Radar with SNR 60 dB with MATLAB Code.
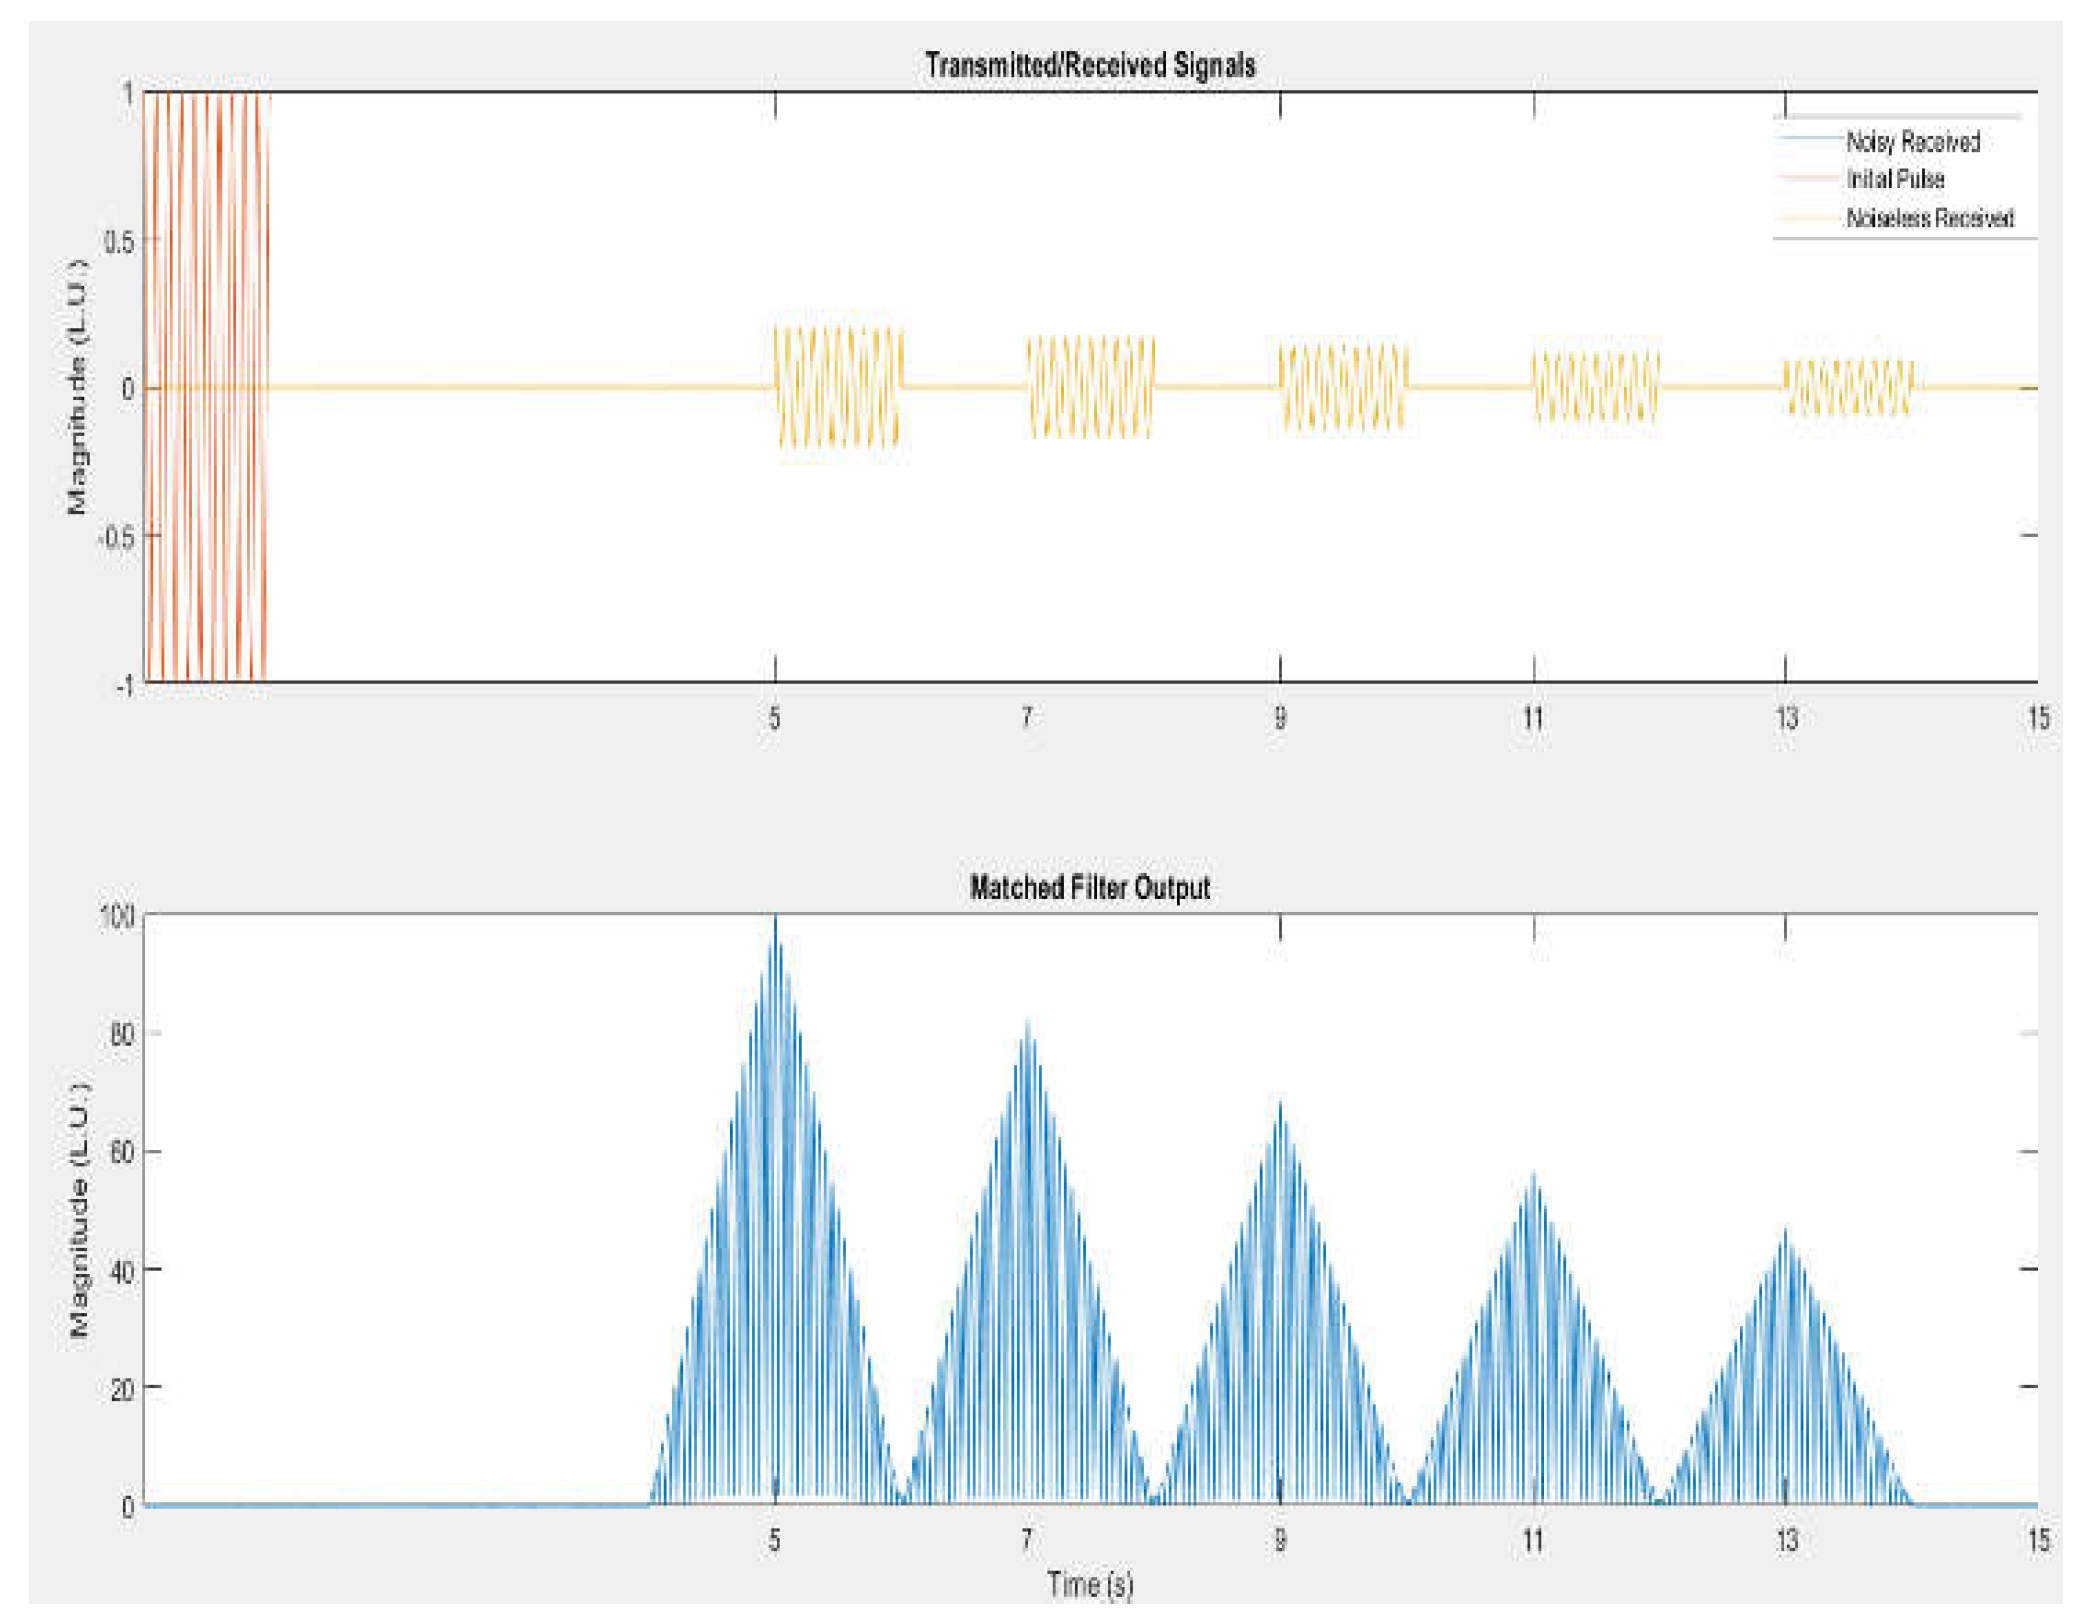
Figure 15.
Tide and Wave sea synchronization process using SBE 26plus and SIMRAD.
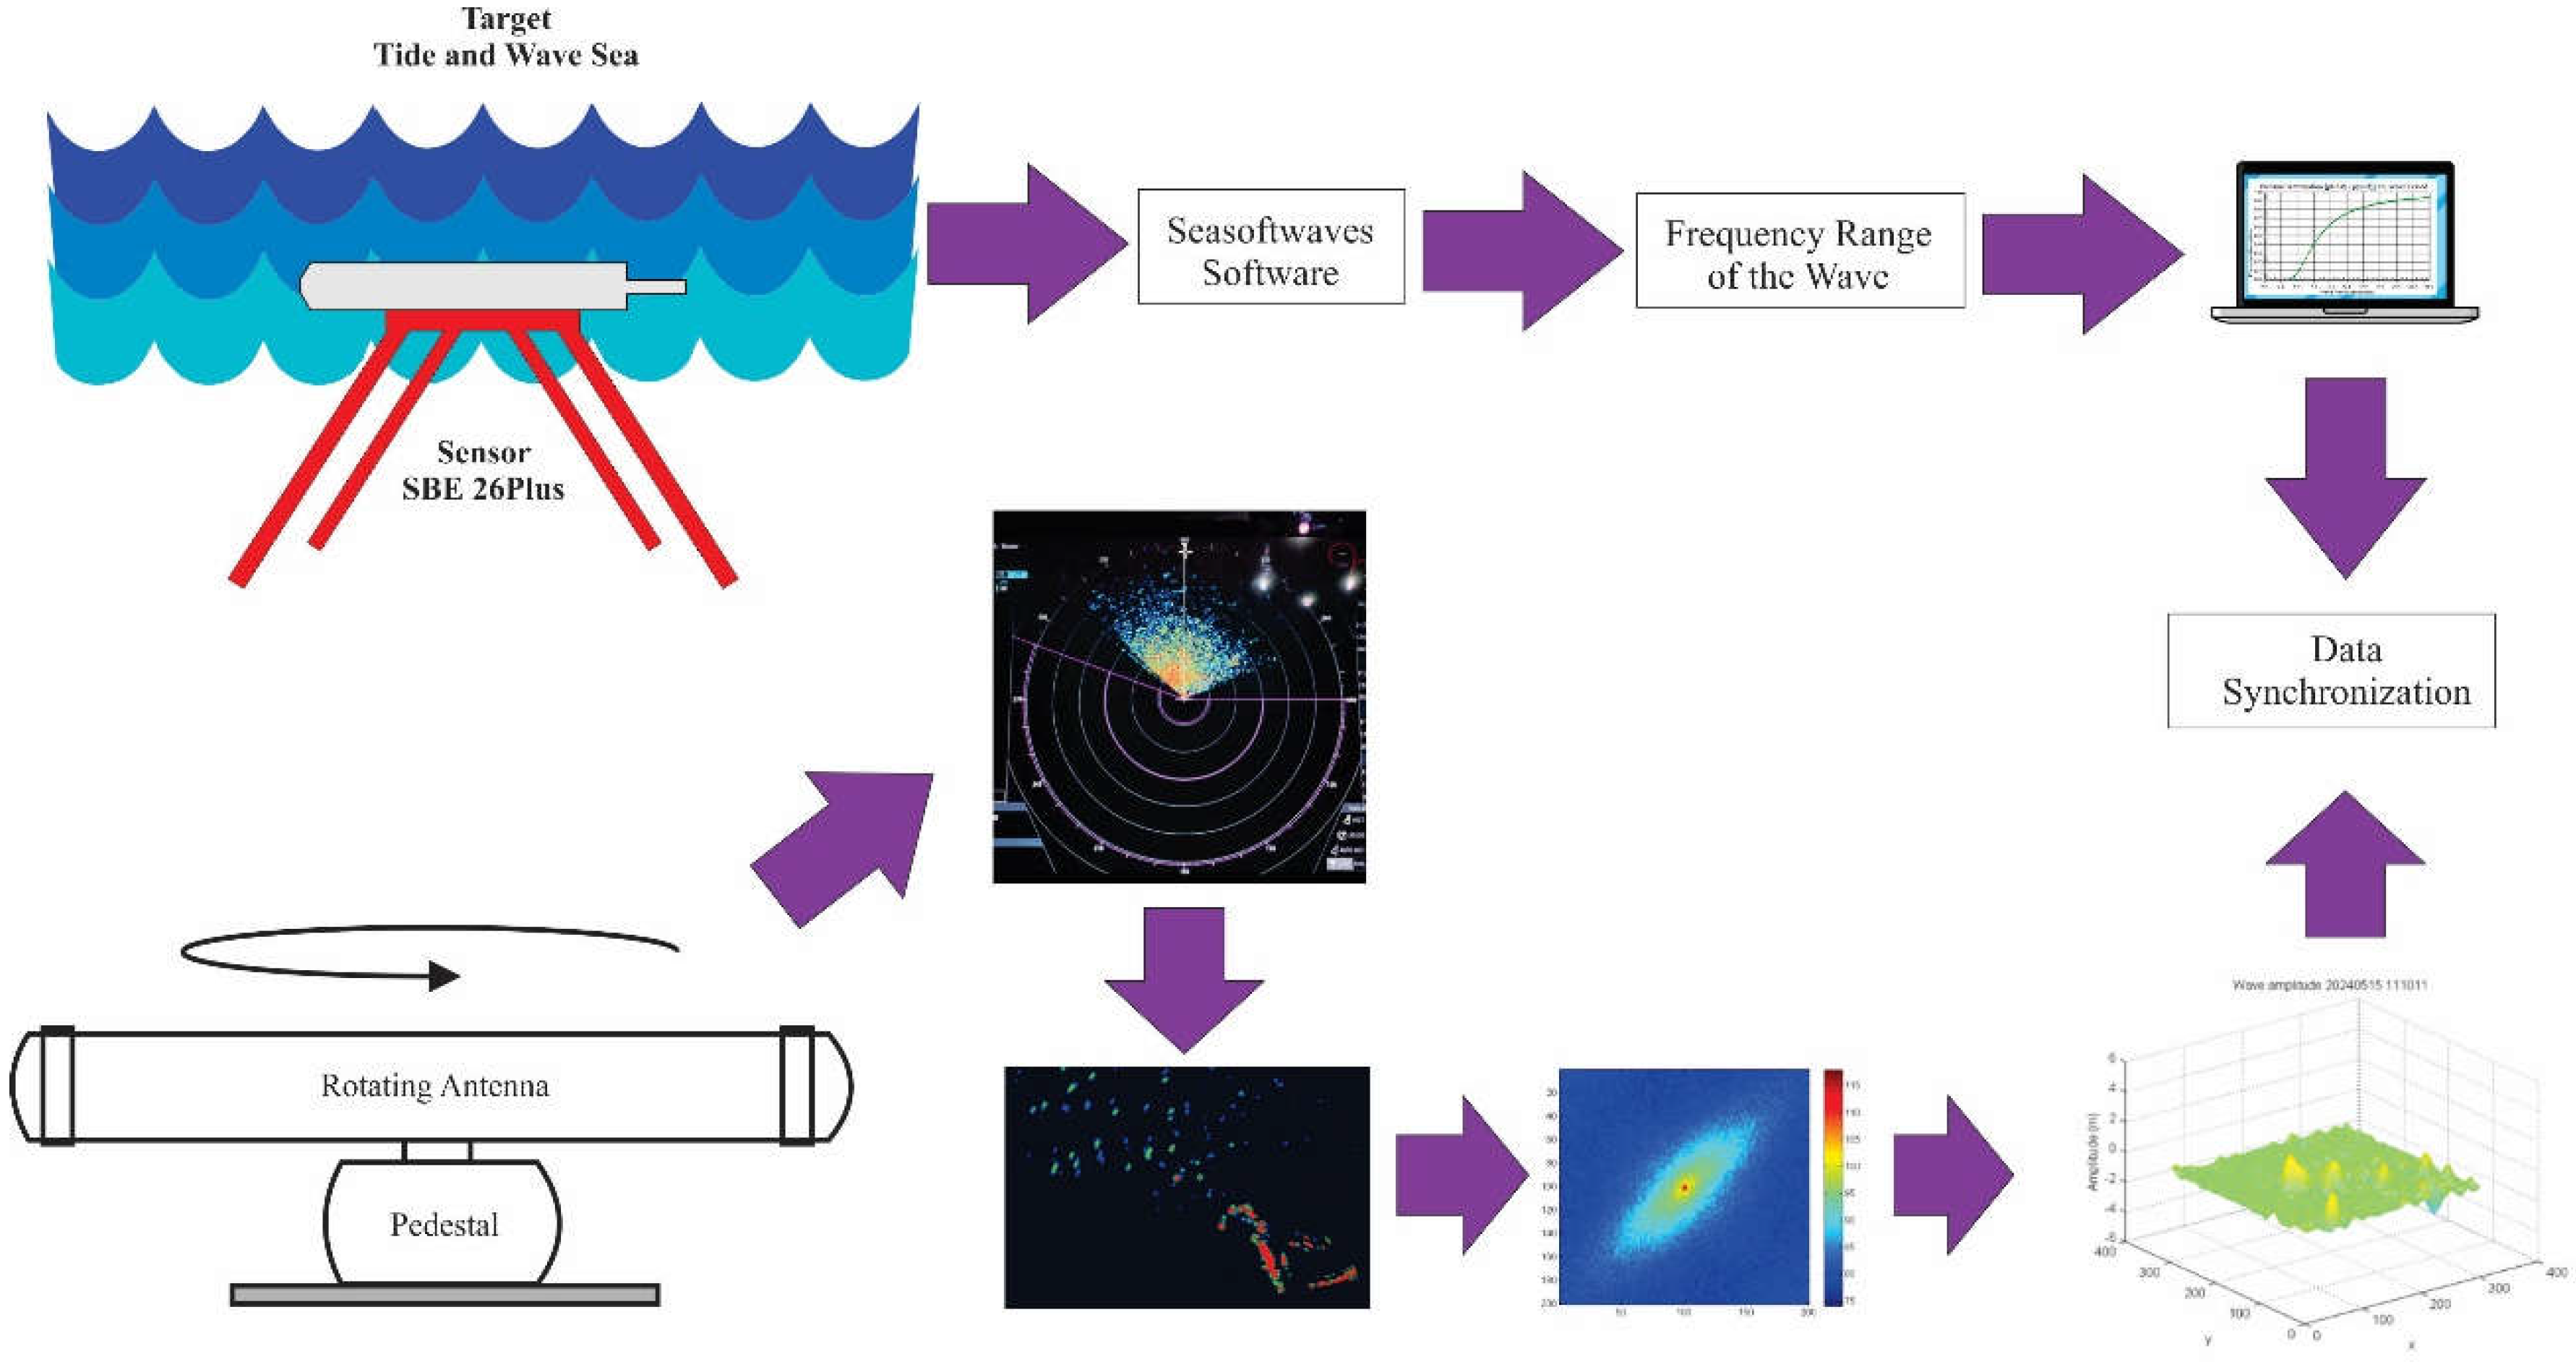
Figure 16.
Block diagram of the Coastal Radar Concept.
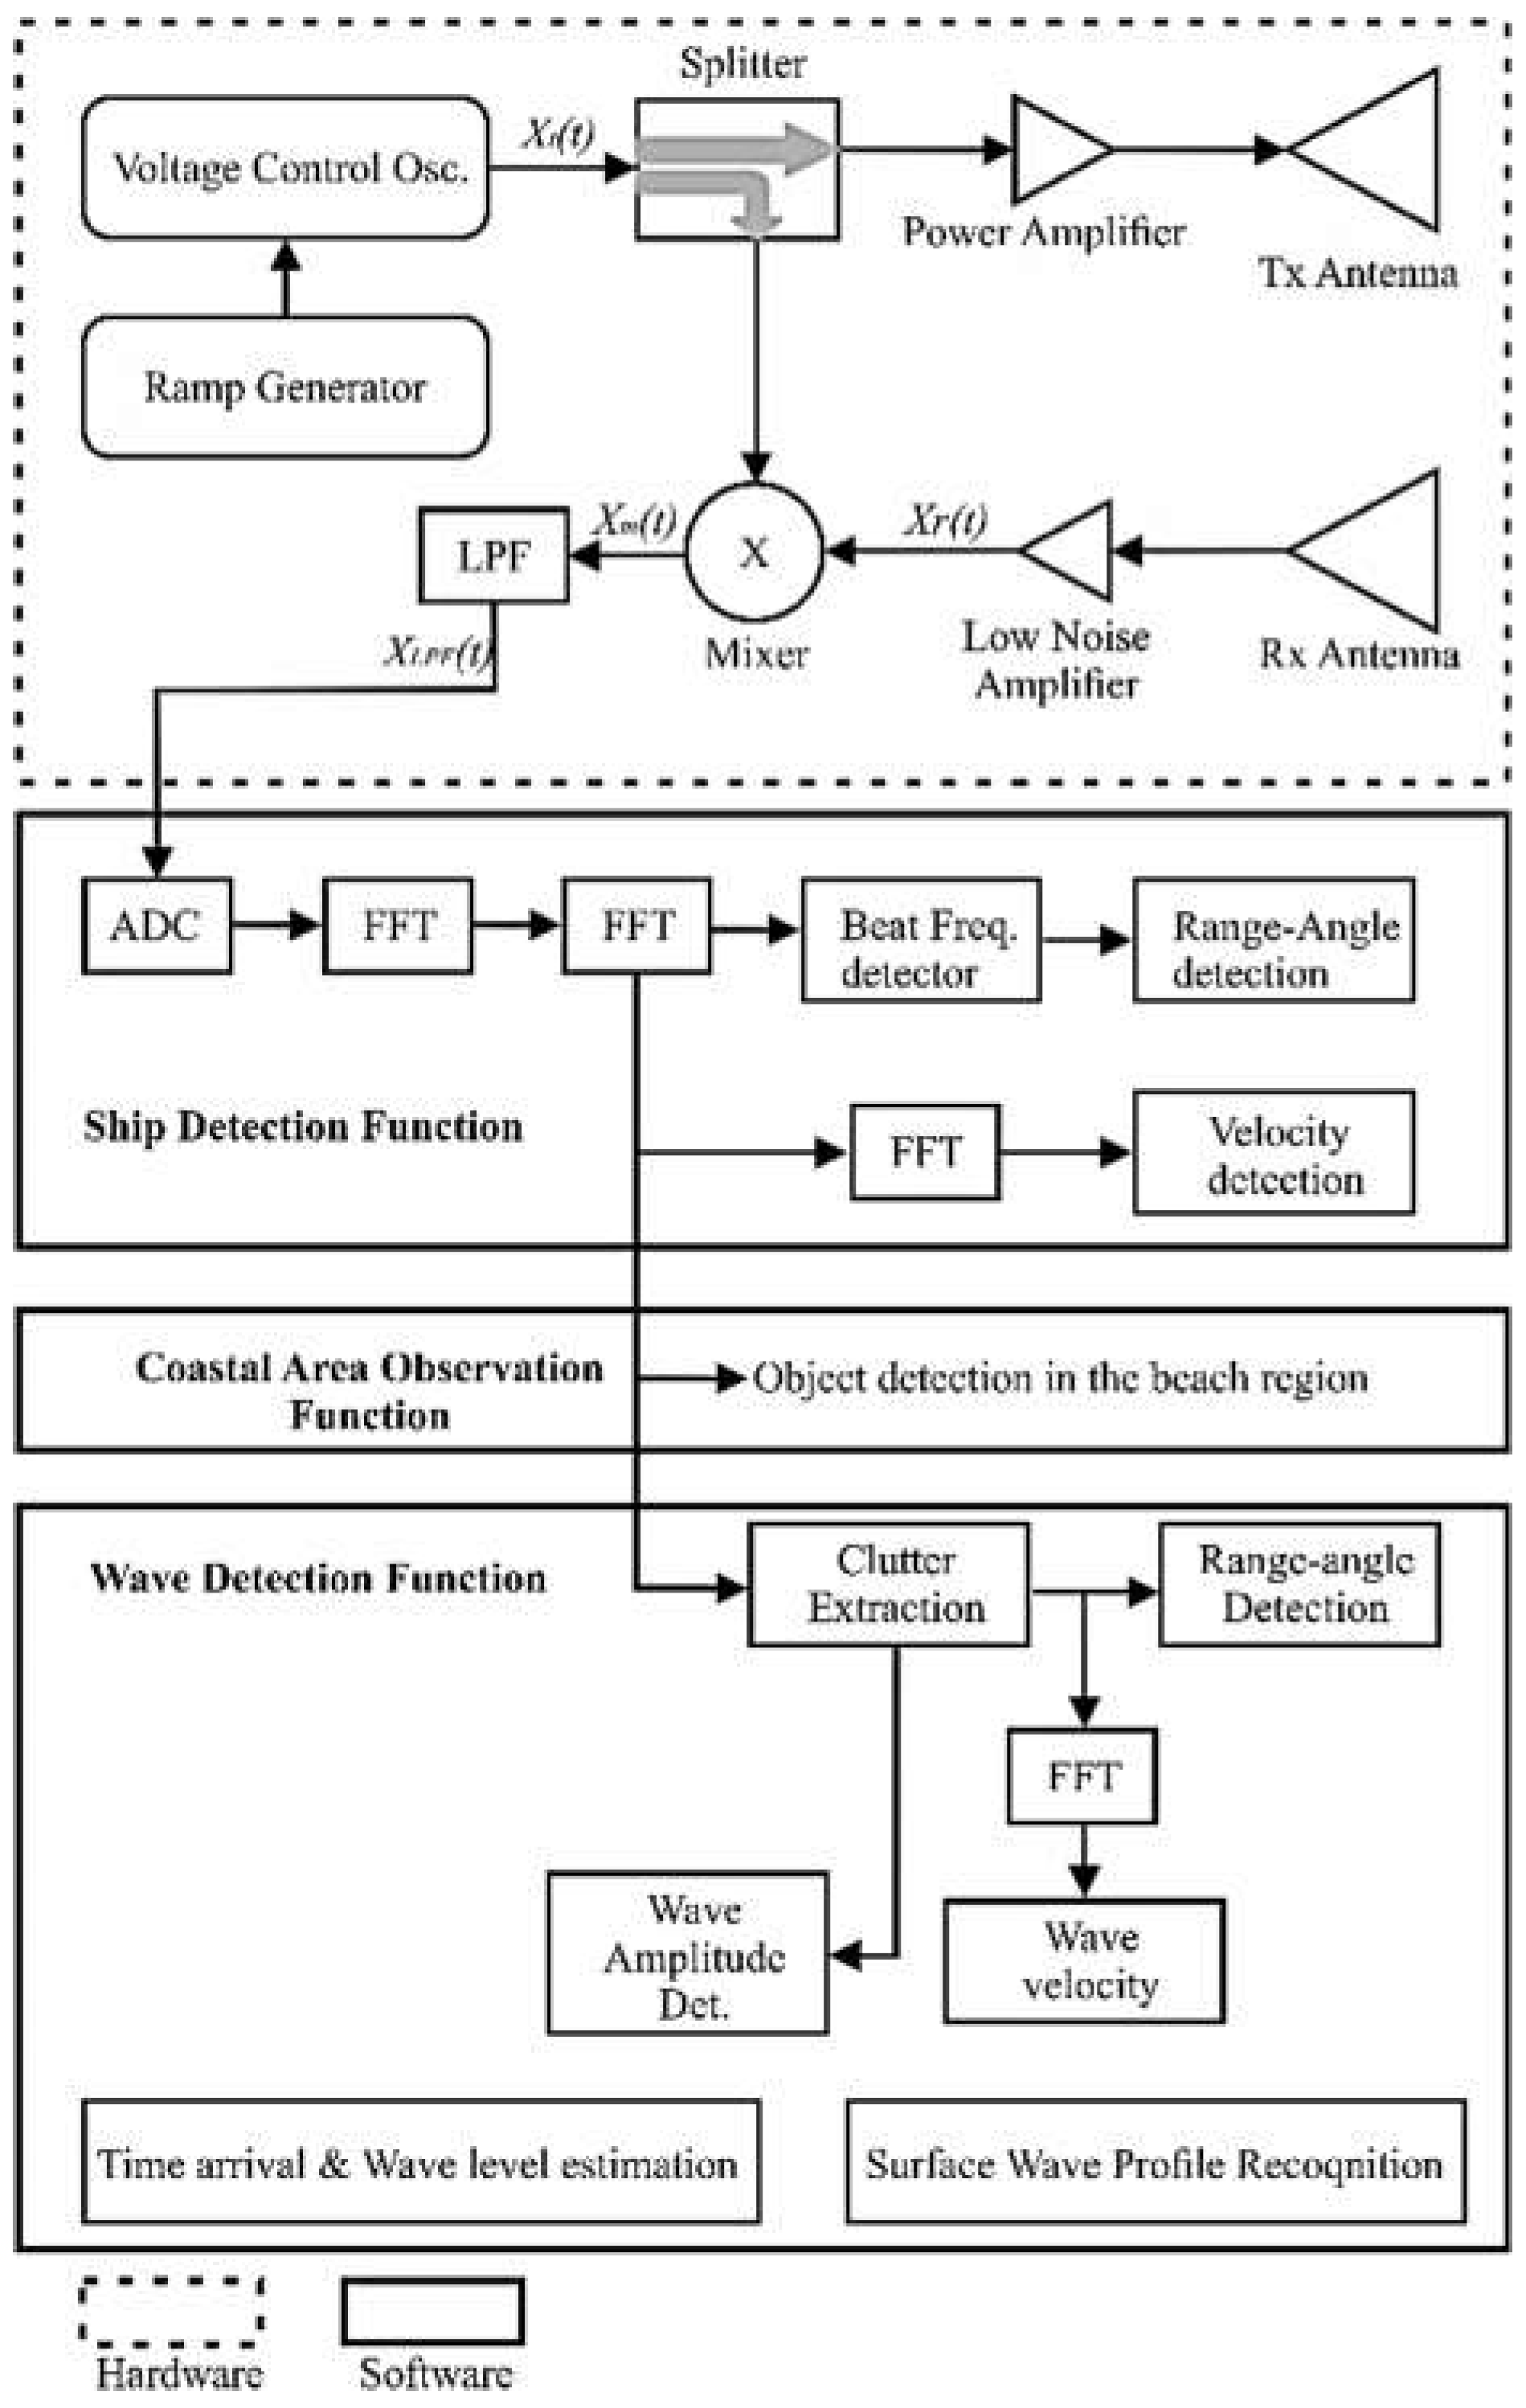
Figure 17.
Live Beach Detection.
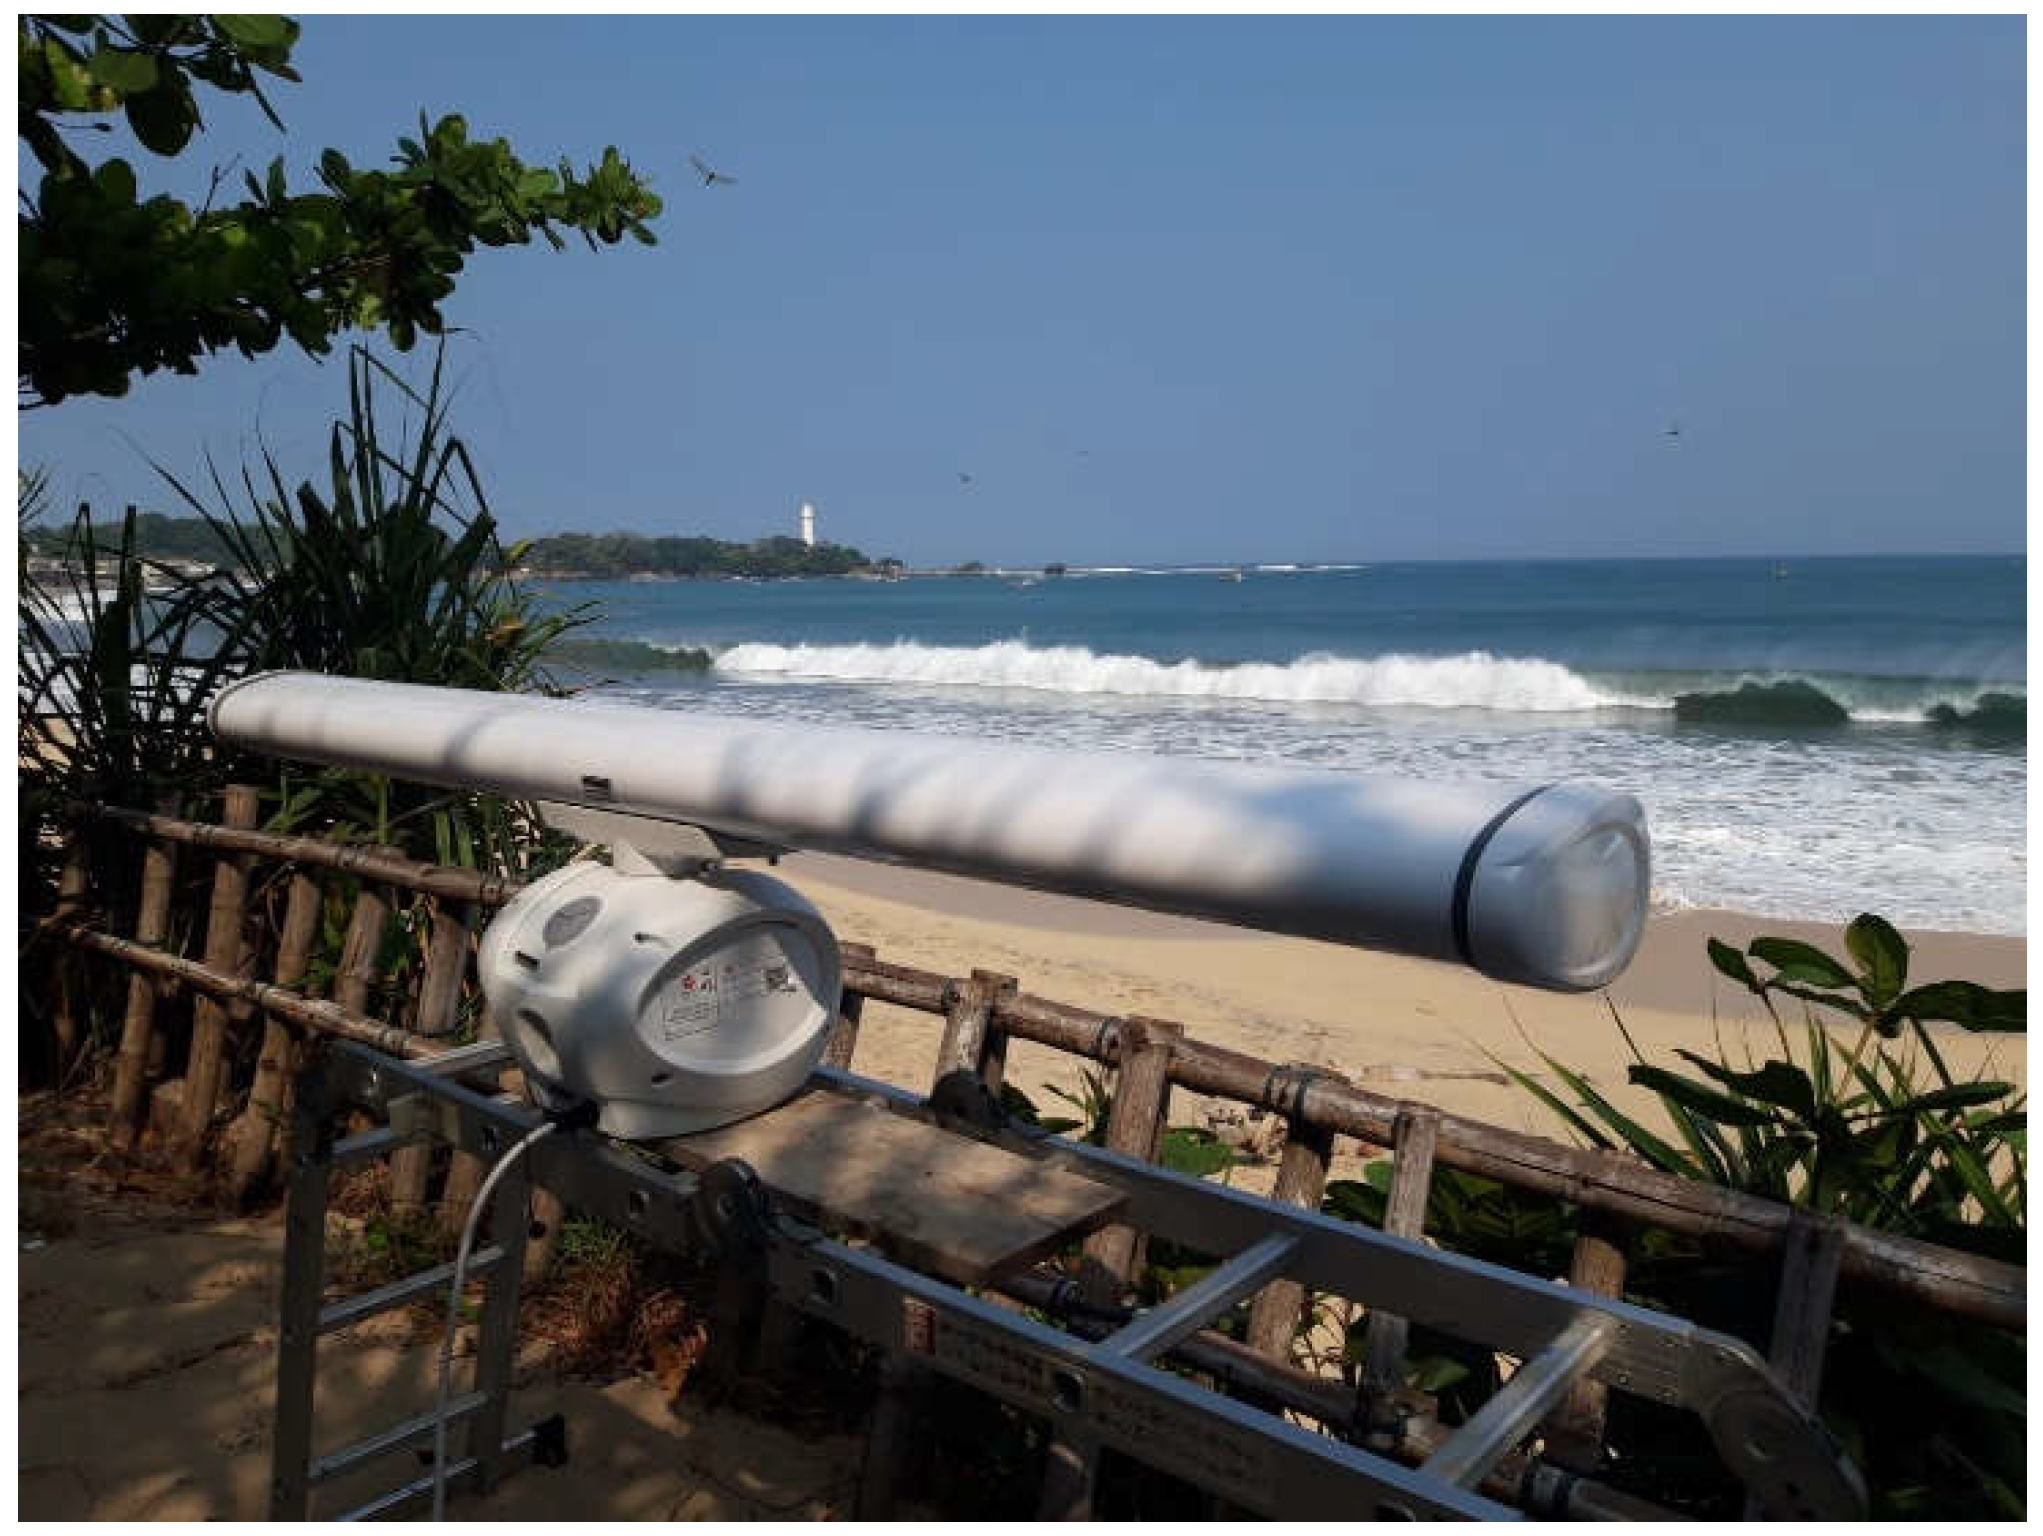
Figure 18.
Sea objects detected by SIMRAD in real-time.
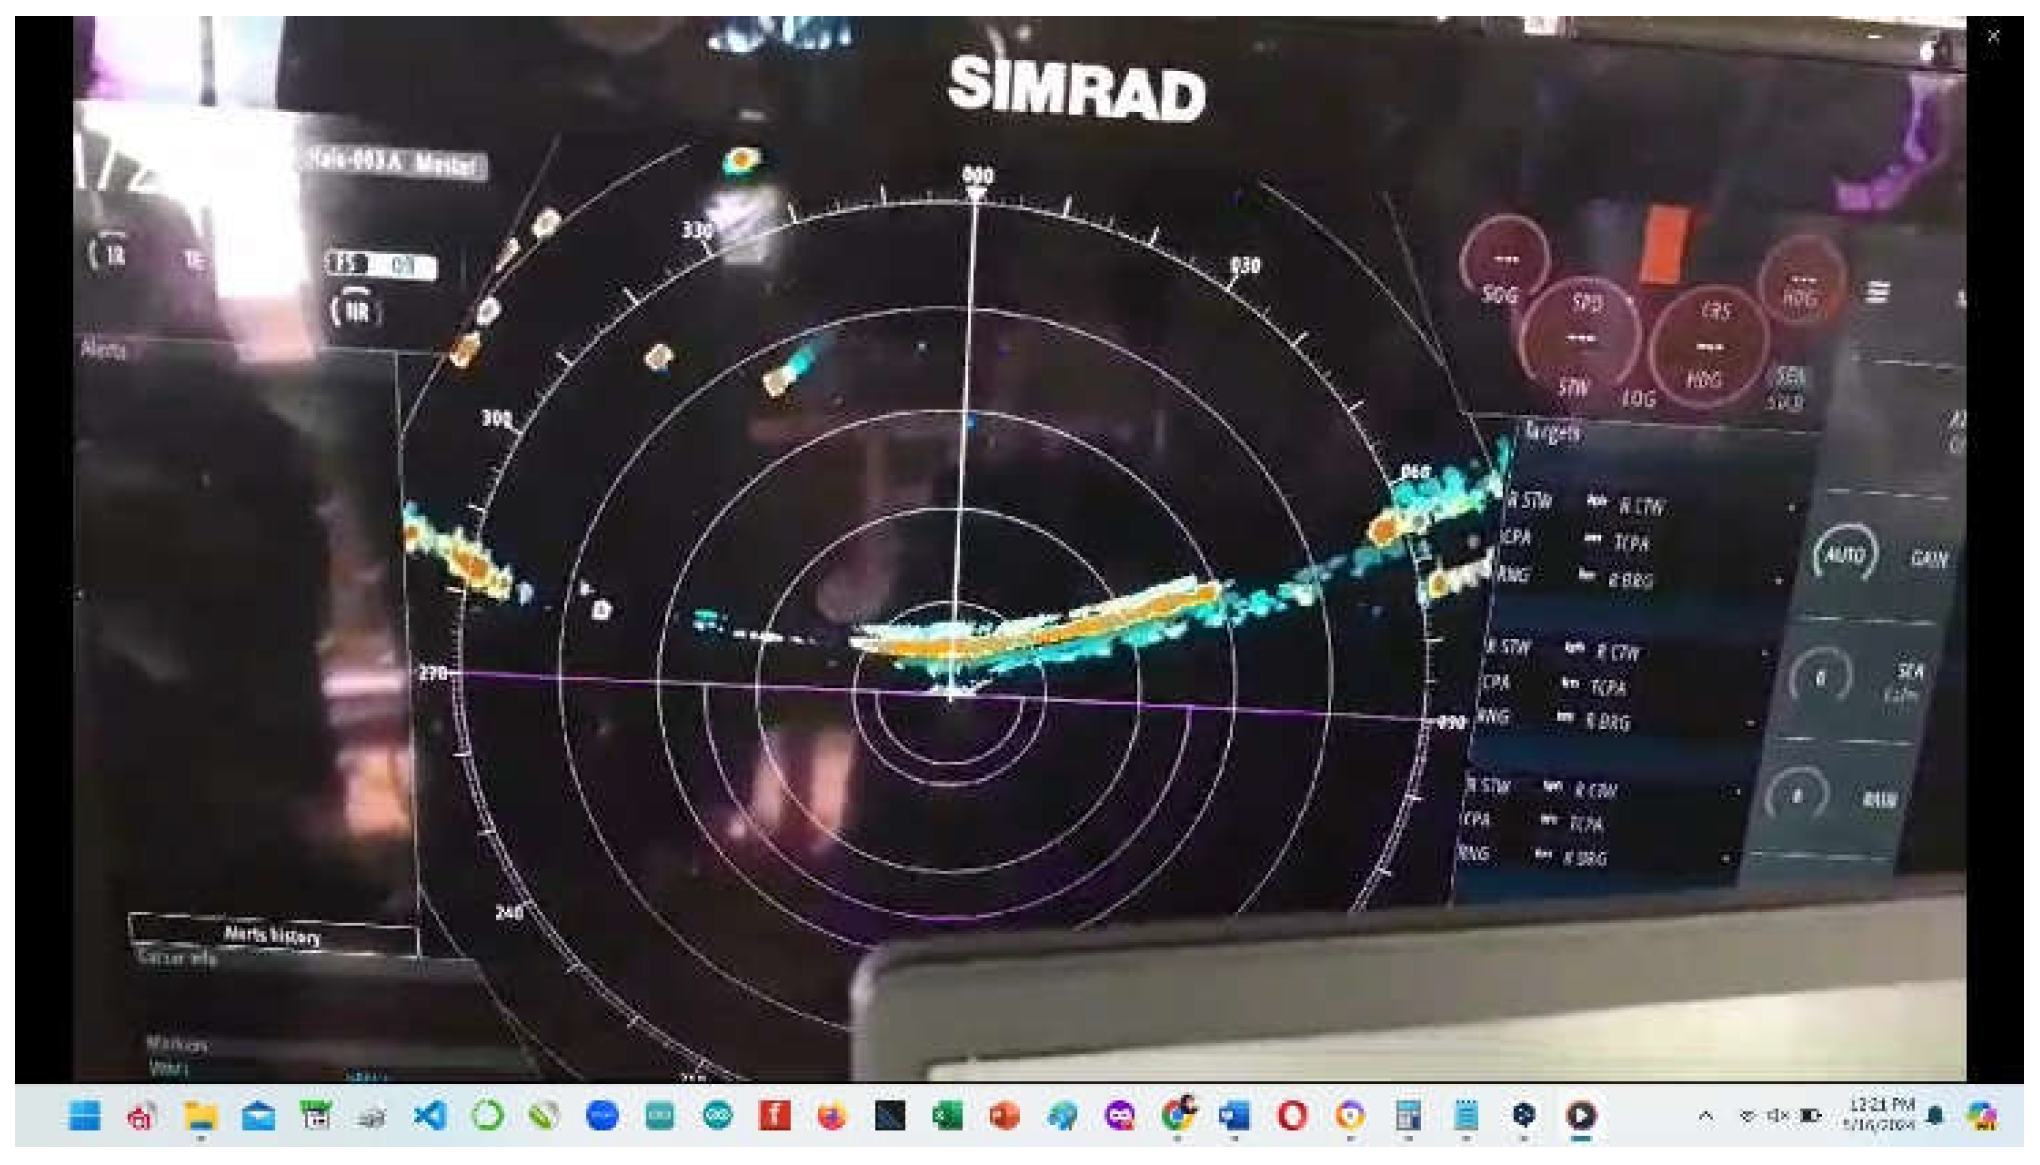
Figure 19.
Measurement results using an Oscilloscope show the same voltage of 2 Volts DC at different times (a) 1 ms, (b) 4 ms, (c) 2.5 s. [Real Measurement].
Figure 19.
Measurement results using an Oscilloscope show the same voltage of 2 Volts DC at different times (a) 1 ms, (b) 4 ms, (c) 2.5 s. [Real Measurement].
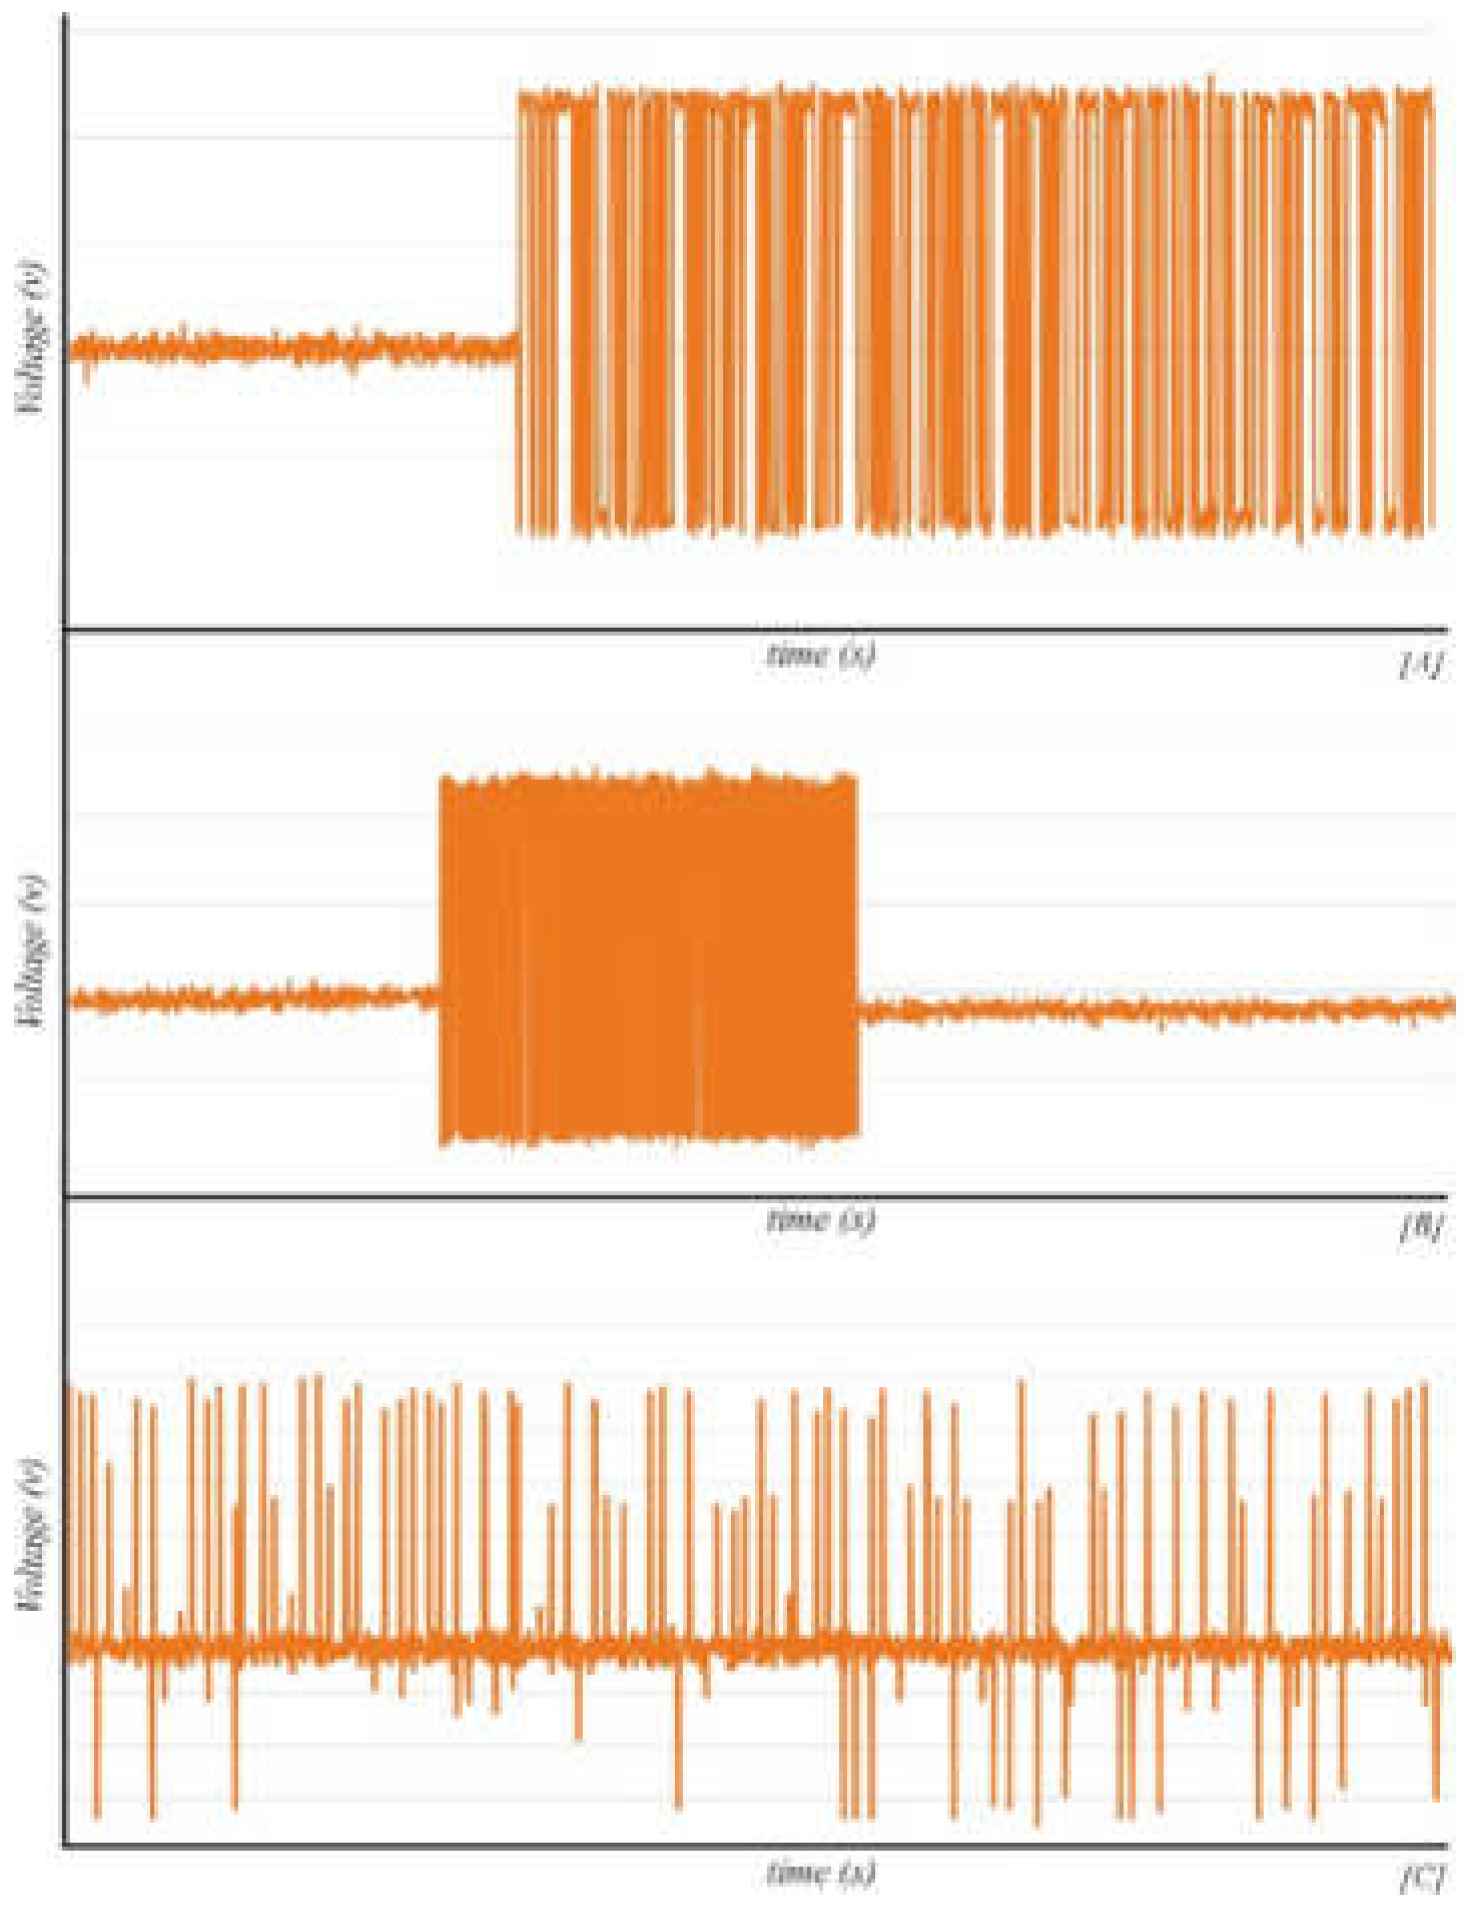
Figure 20.
Testing in Pin 1 (Tx) SIMRAD Radar use Signal Analyzer [Personal Data].
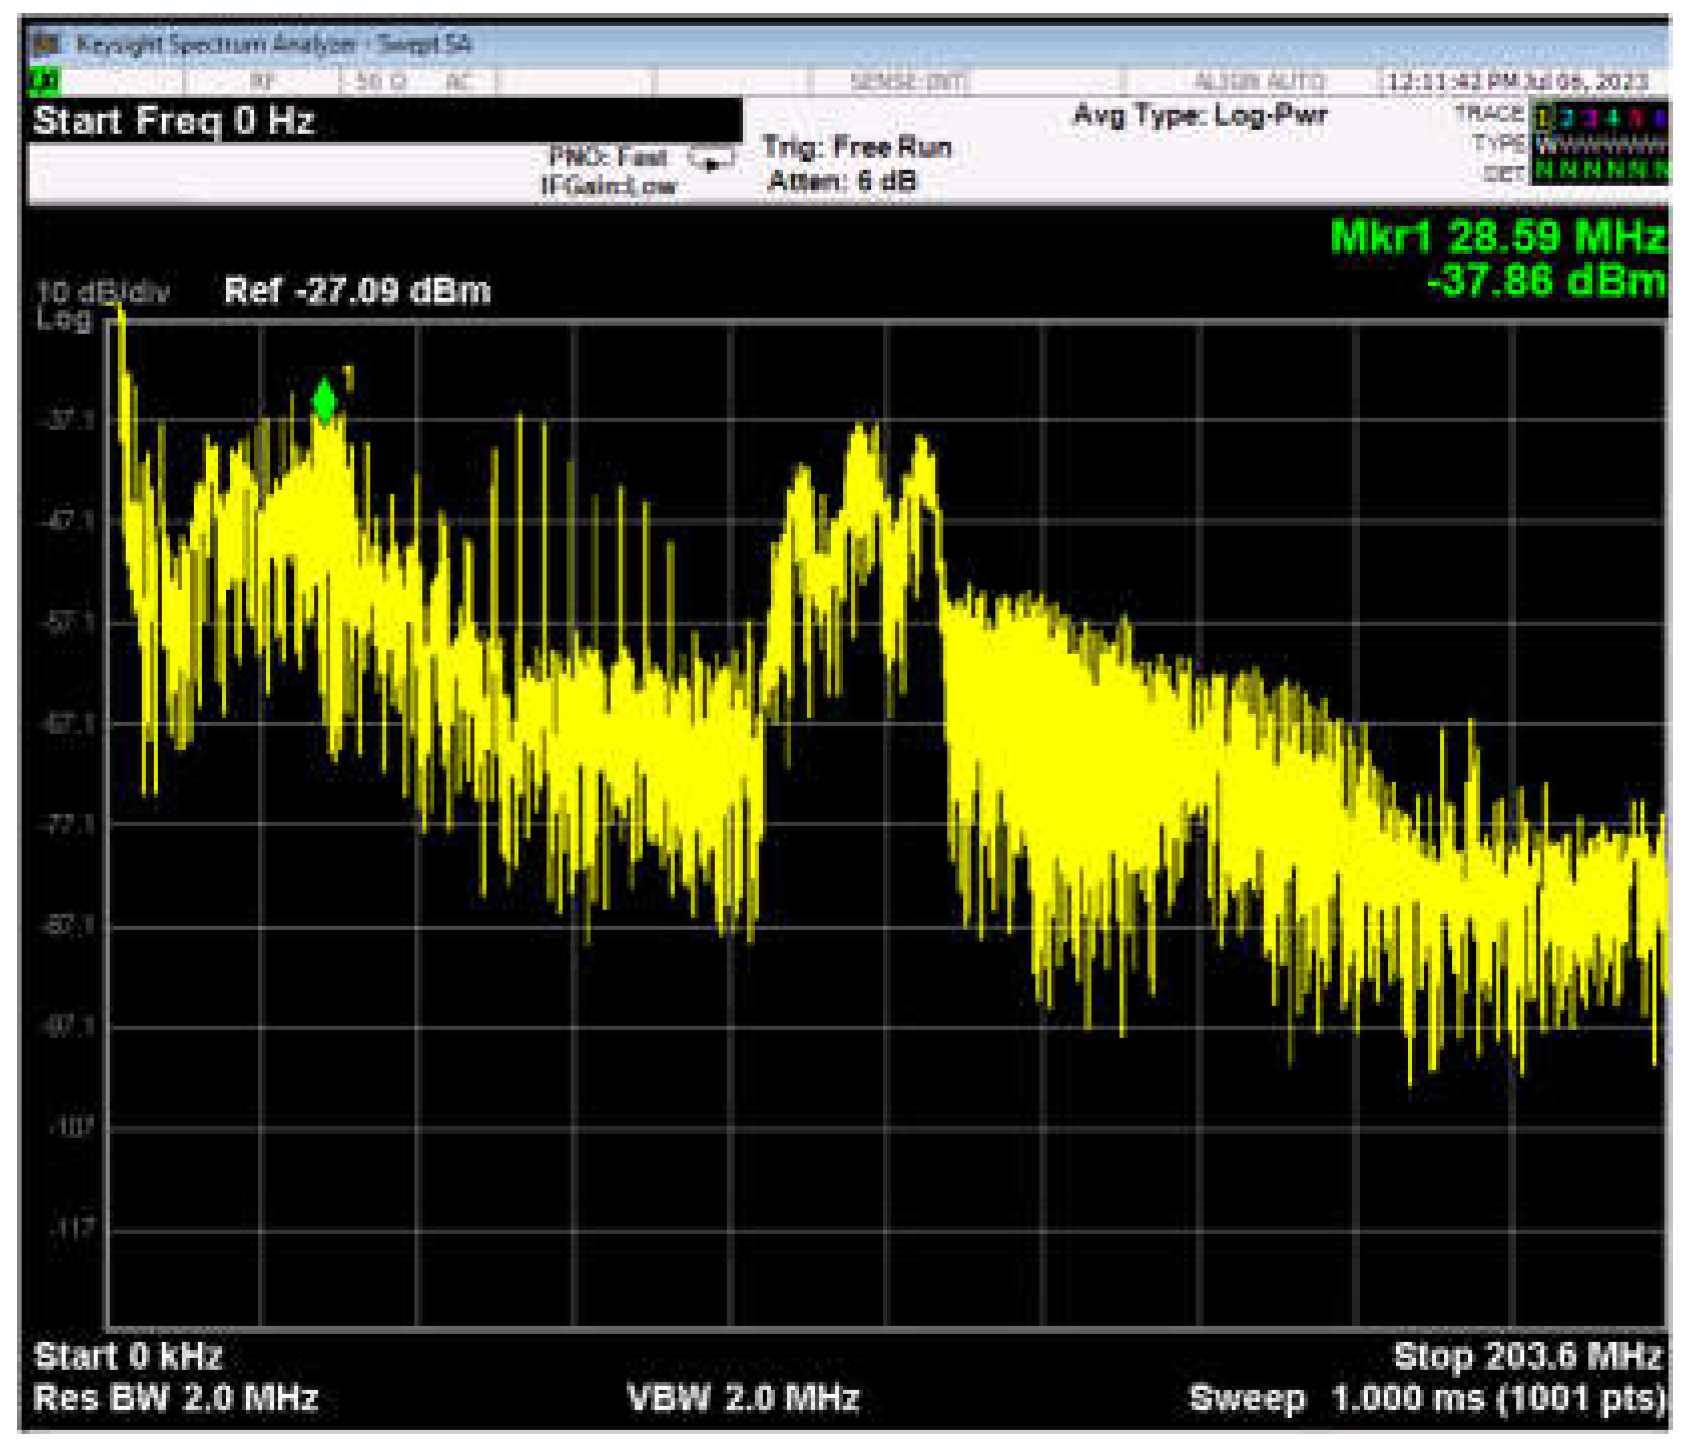
Figure 21.
Testing in Pin 2 SIMRAD Radar uses Signal Analyzer [Personal Data].
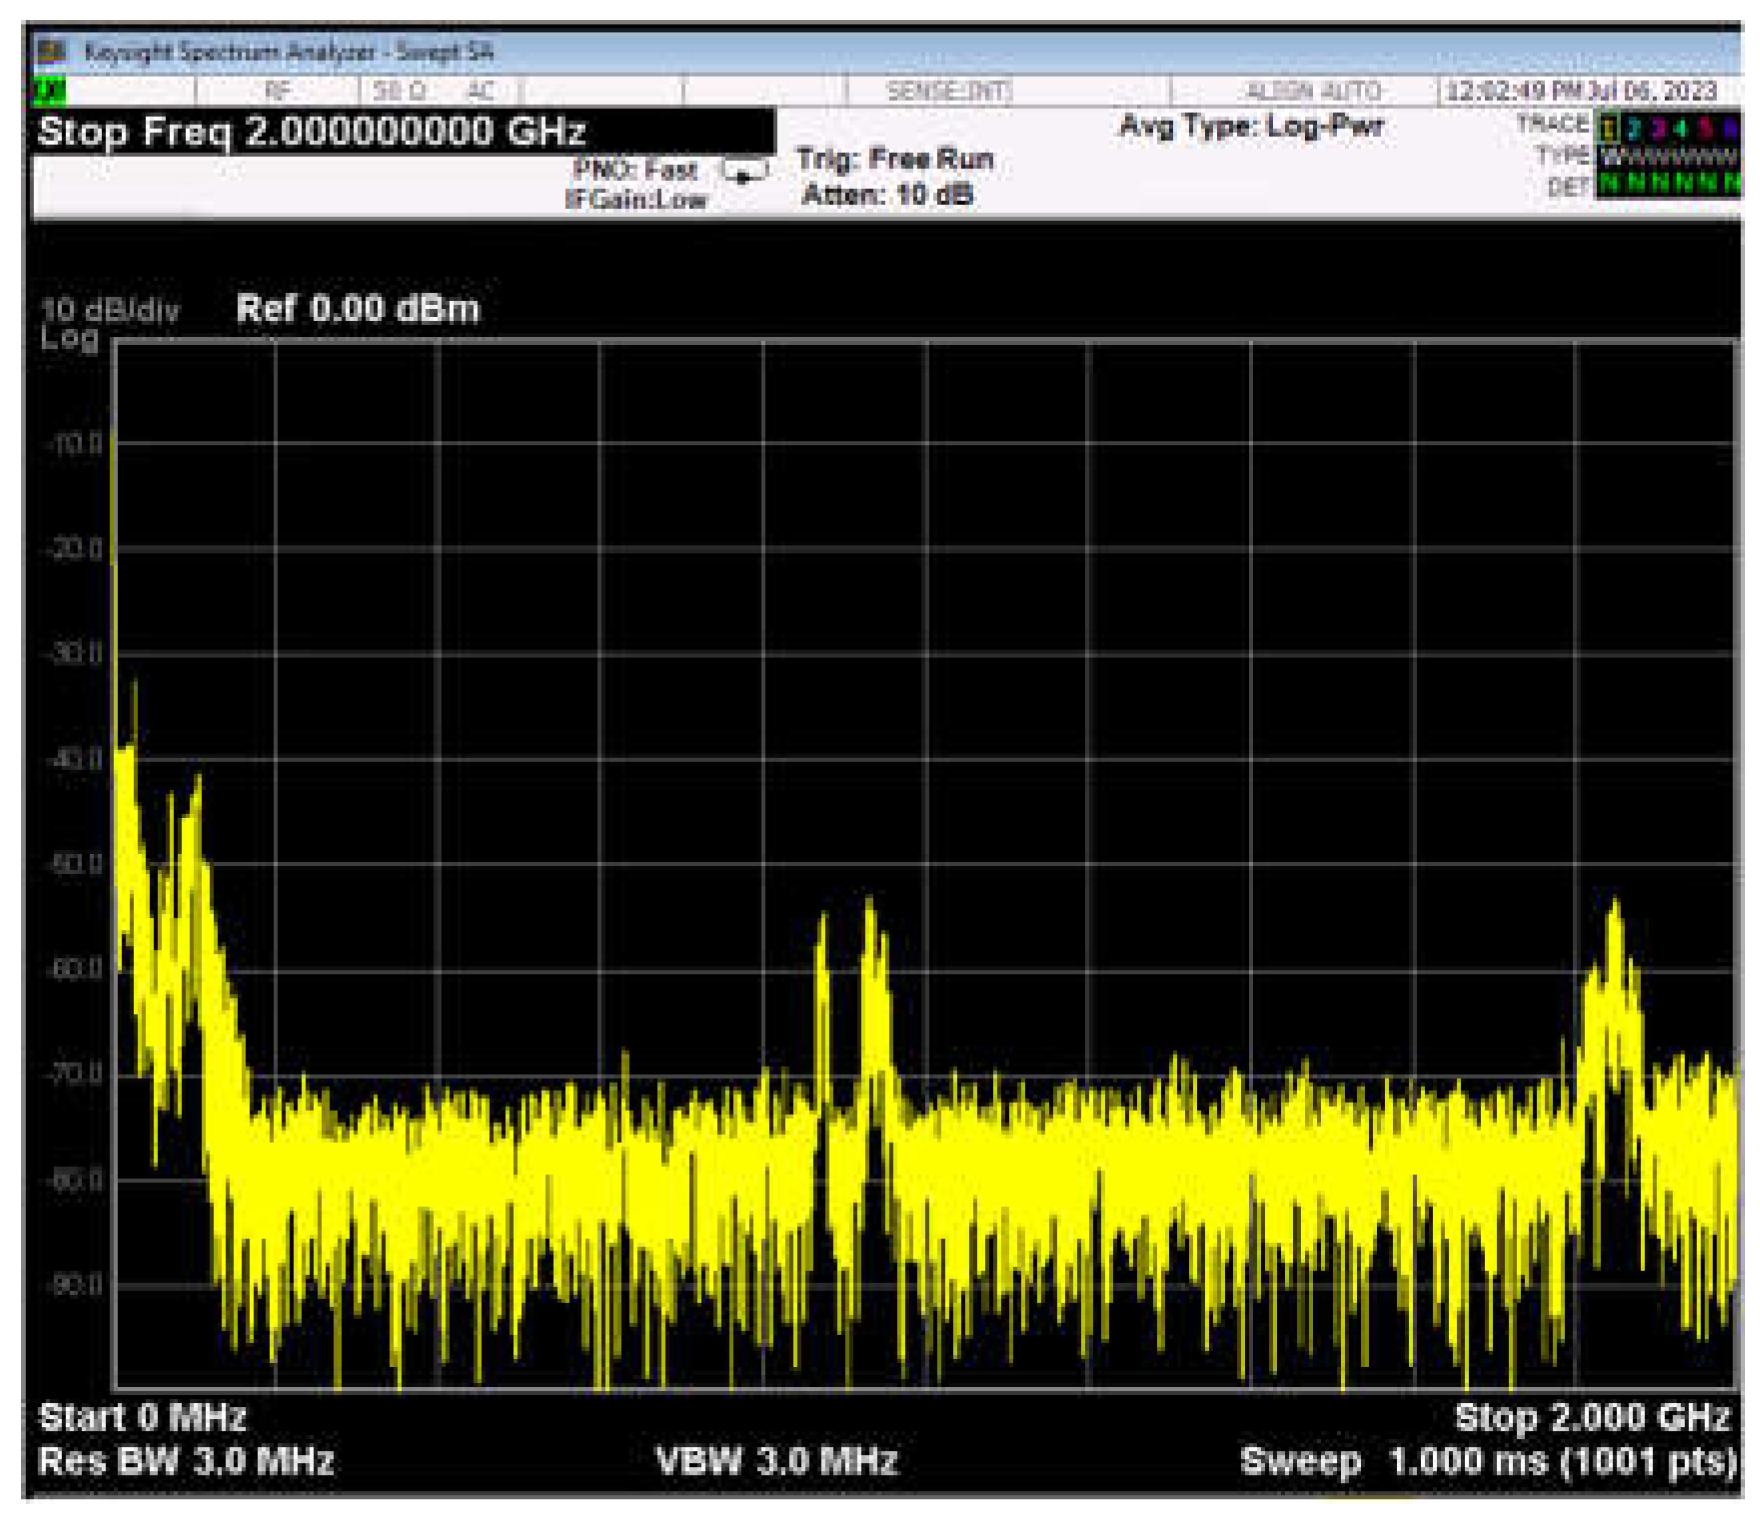
Figure 22.
Testing in Pin 3 SIMRAD Radar uses Signal Analyzer [Personal Data].
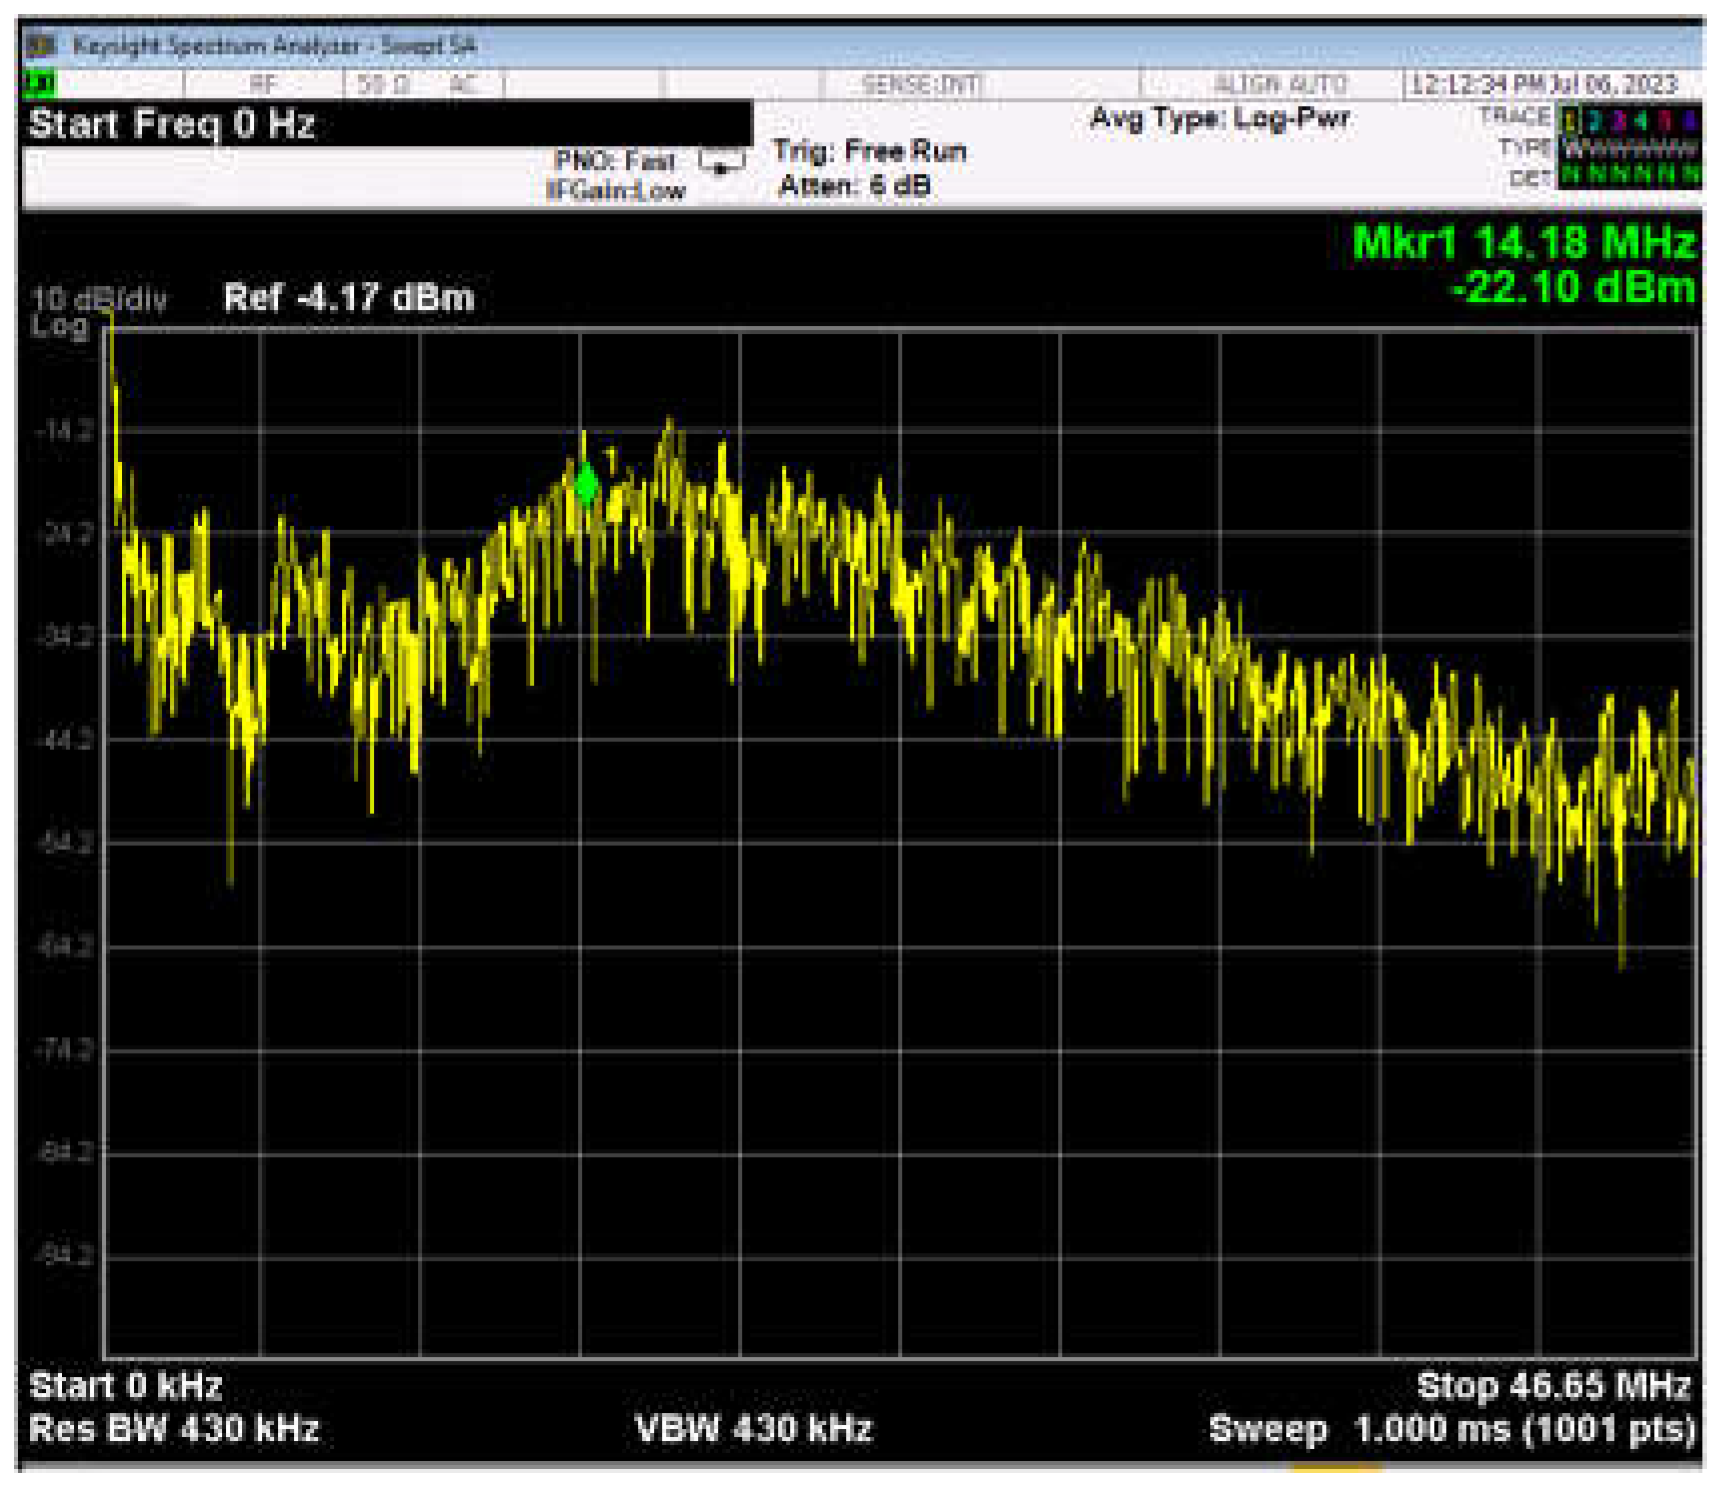
Figure 23.
Testing in Pin 4 SIMRAD Radar uses Signal Analyzer [Personal Data].
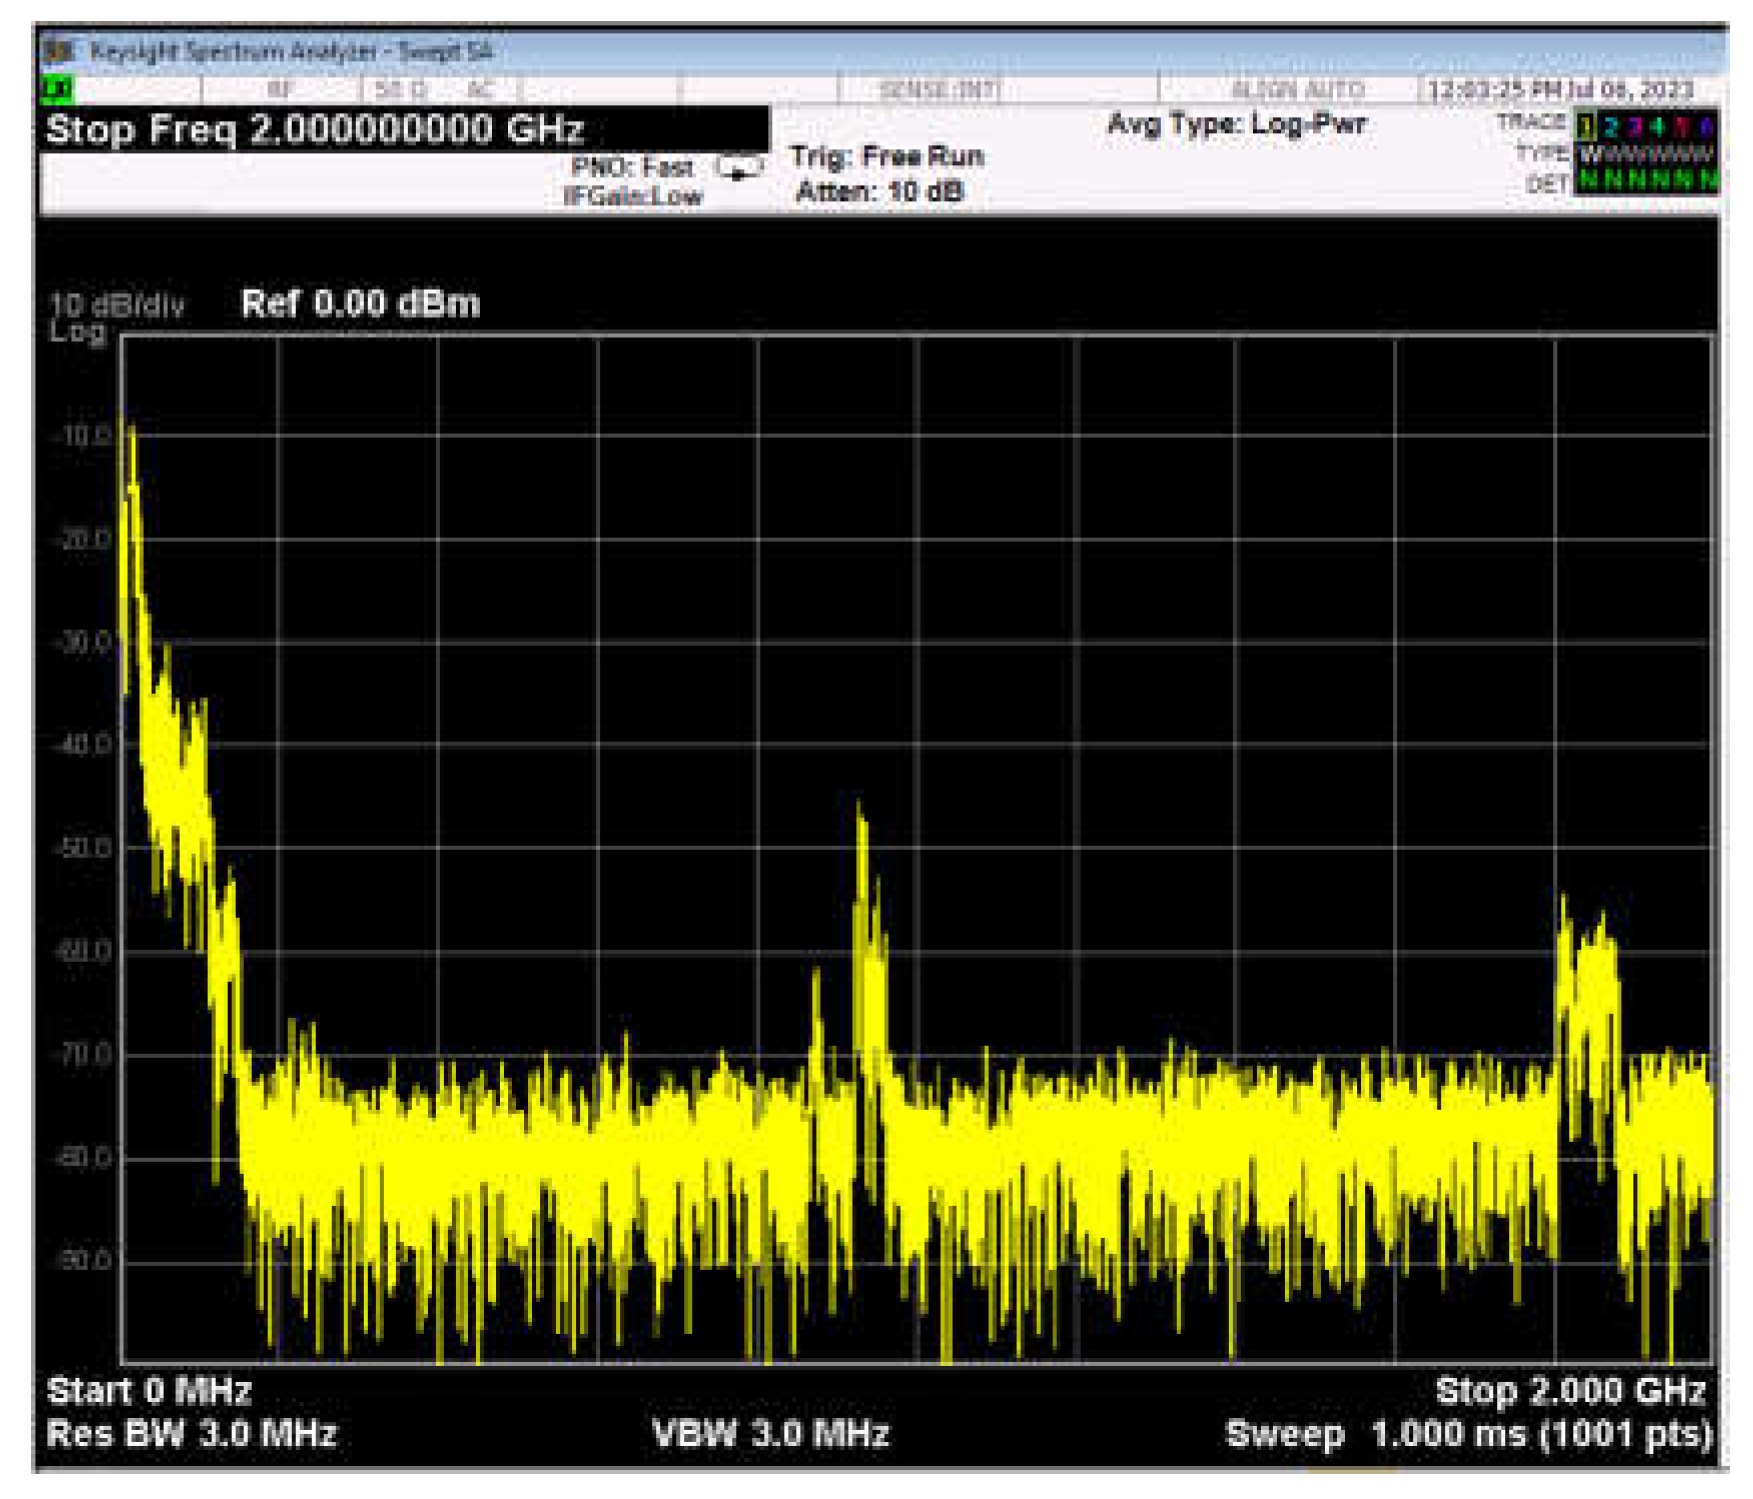
Figure 24.
Testing in Pin 5 SIMRAD Radar uses Signal Analyzer [Personal Data].
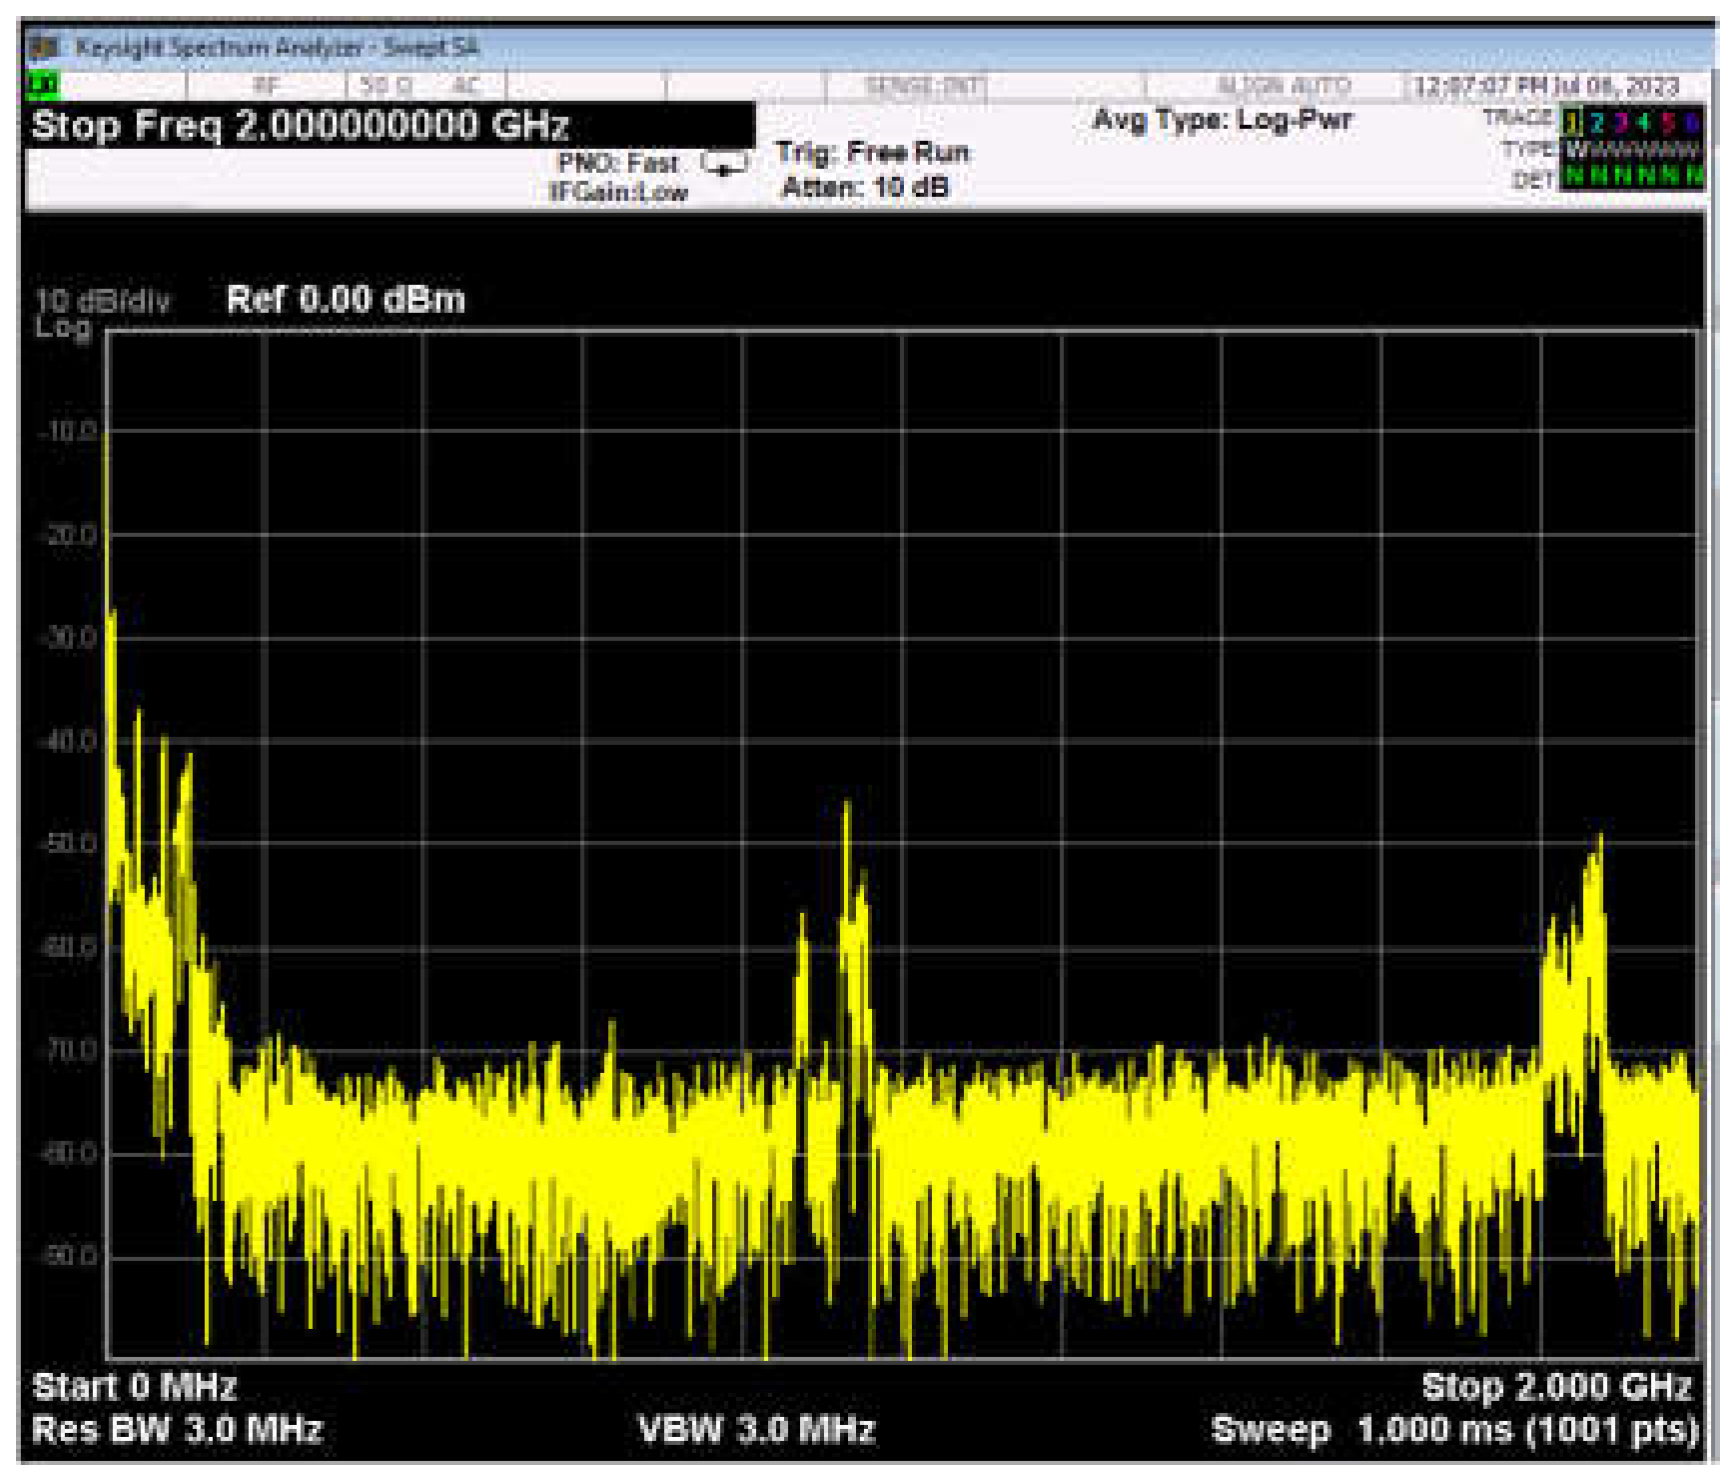
Figure 25.
Display of Compressed Signal Radar when detecting objects around it, based on the datasheet this Radar can detect objects up to >130 Km. The development is sea Clutter which is the primary object detection for Tsunami data and Sea Wave rise information [Personal Data].
Figure 25.
Display of Compressed Signal Radar when detecting objects around it, based on the datasheet this Radar can detect objects up to >130 Km. The development is sea Clutter which is the primary object detection for Tsunami data and Sea Wave rise information [Personal Data].
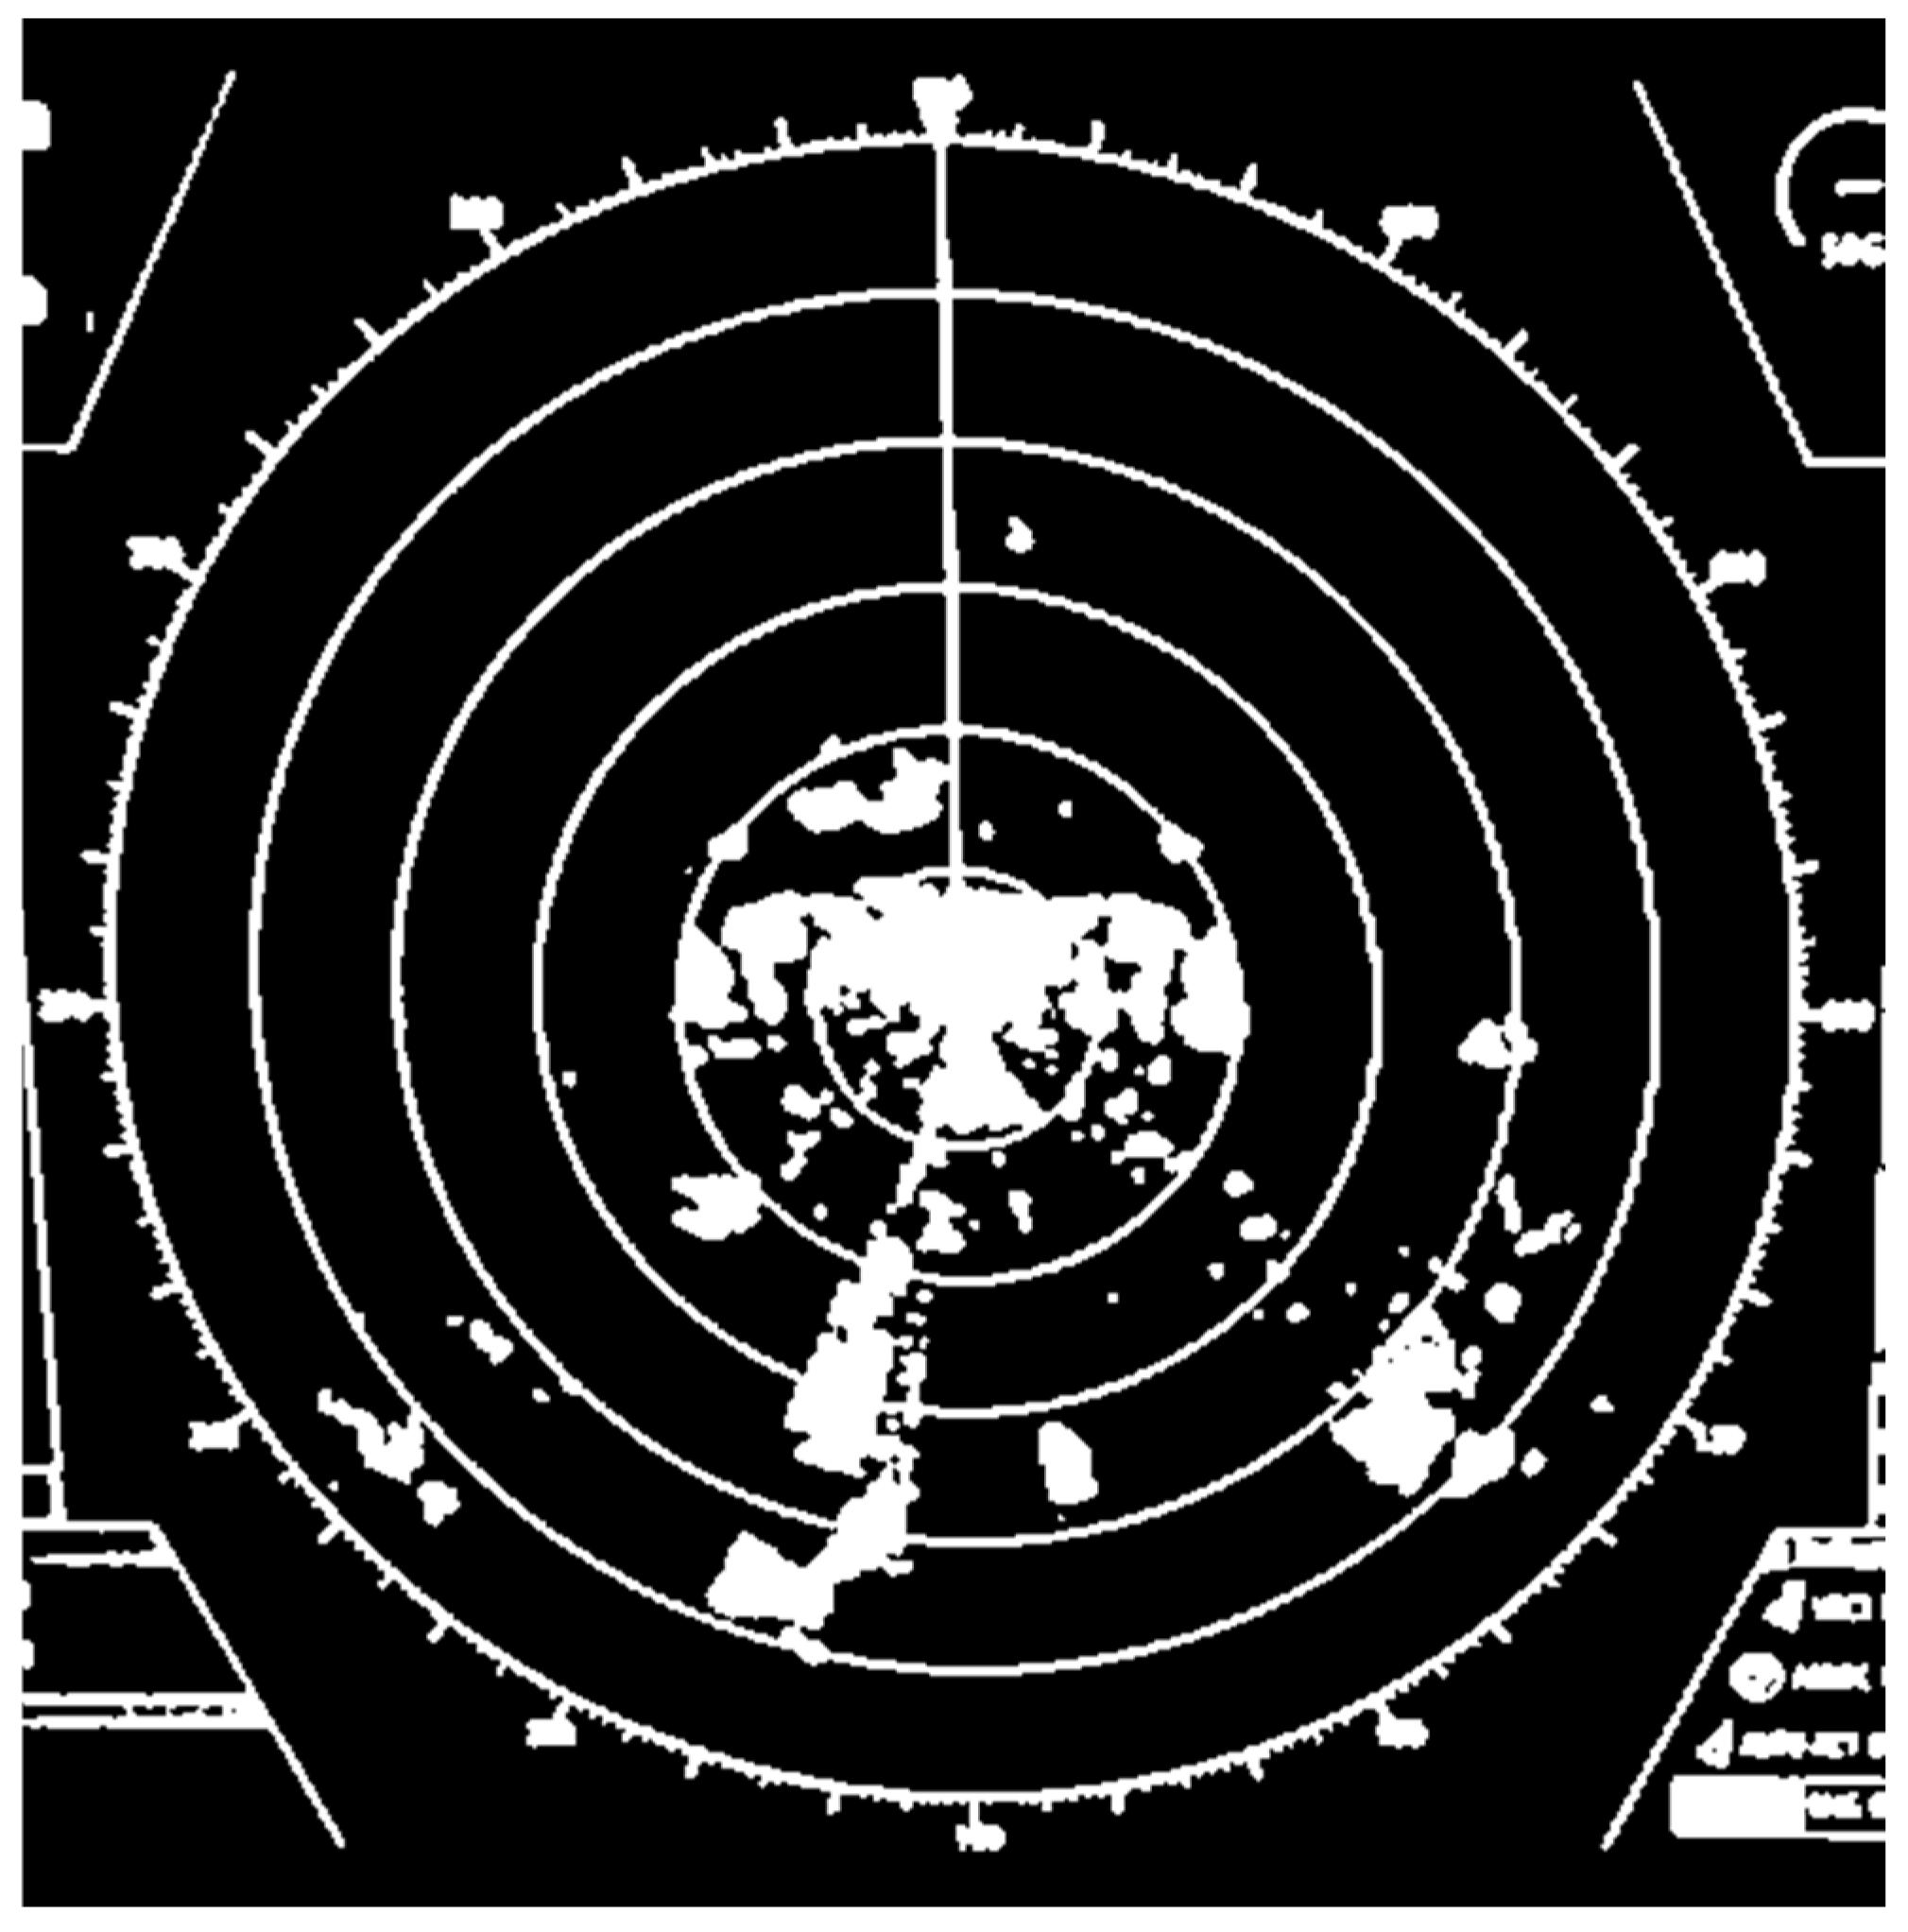
Figure 26.
Taking target data several times from Compressed Noise Radar to produce specific results, analyze, and get the final result which is Noise specific to Sea Waves [Personal Data].
Figure 26.
Taking target data several times from Compressed Noise Radar to produce specific results, analyze, and get the final result which is Noise specific to Sea Waves [Personal Data].
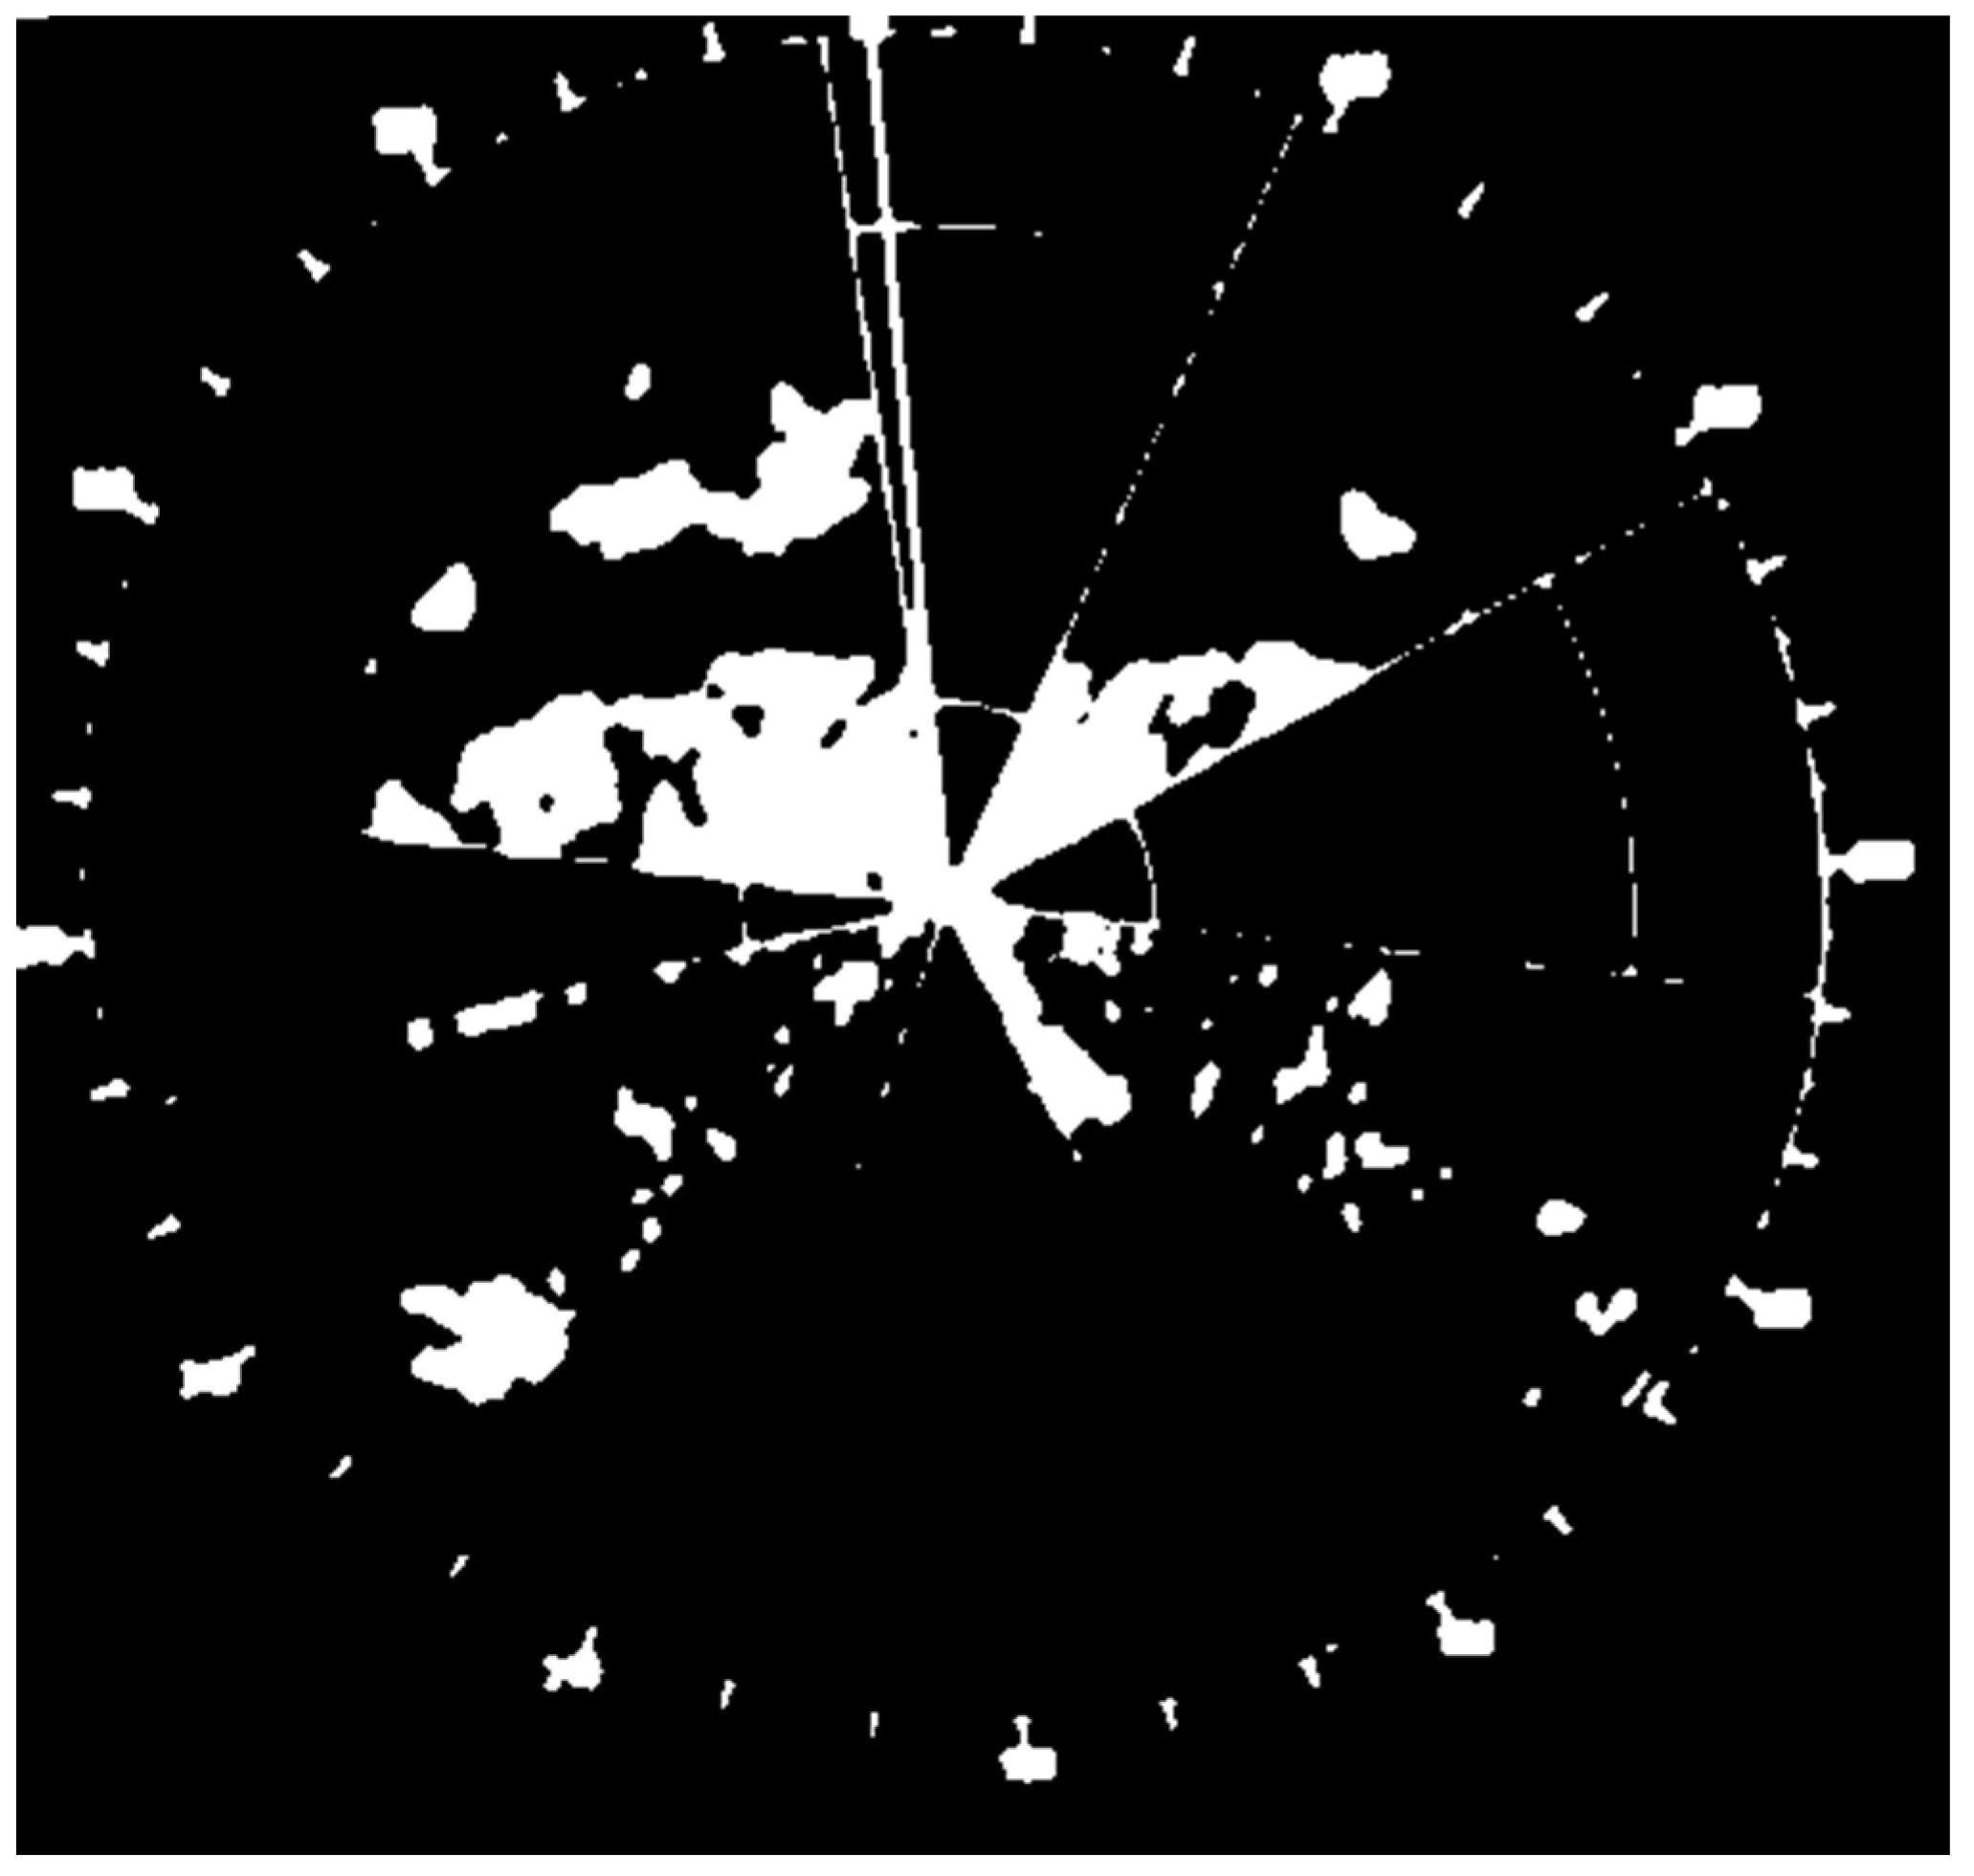
Figure 27.
Original SIMRAD Radar detected Object or Test 1.
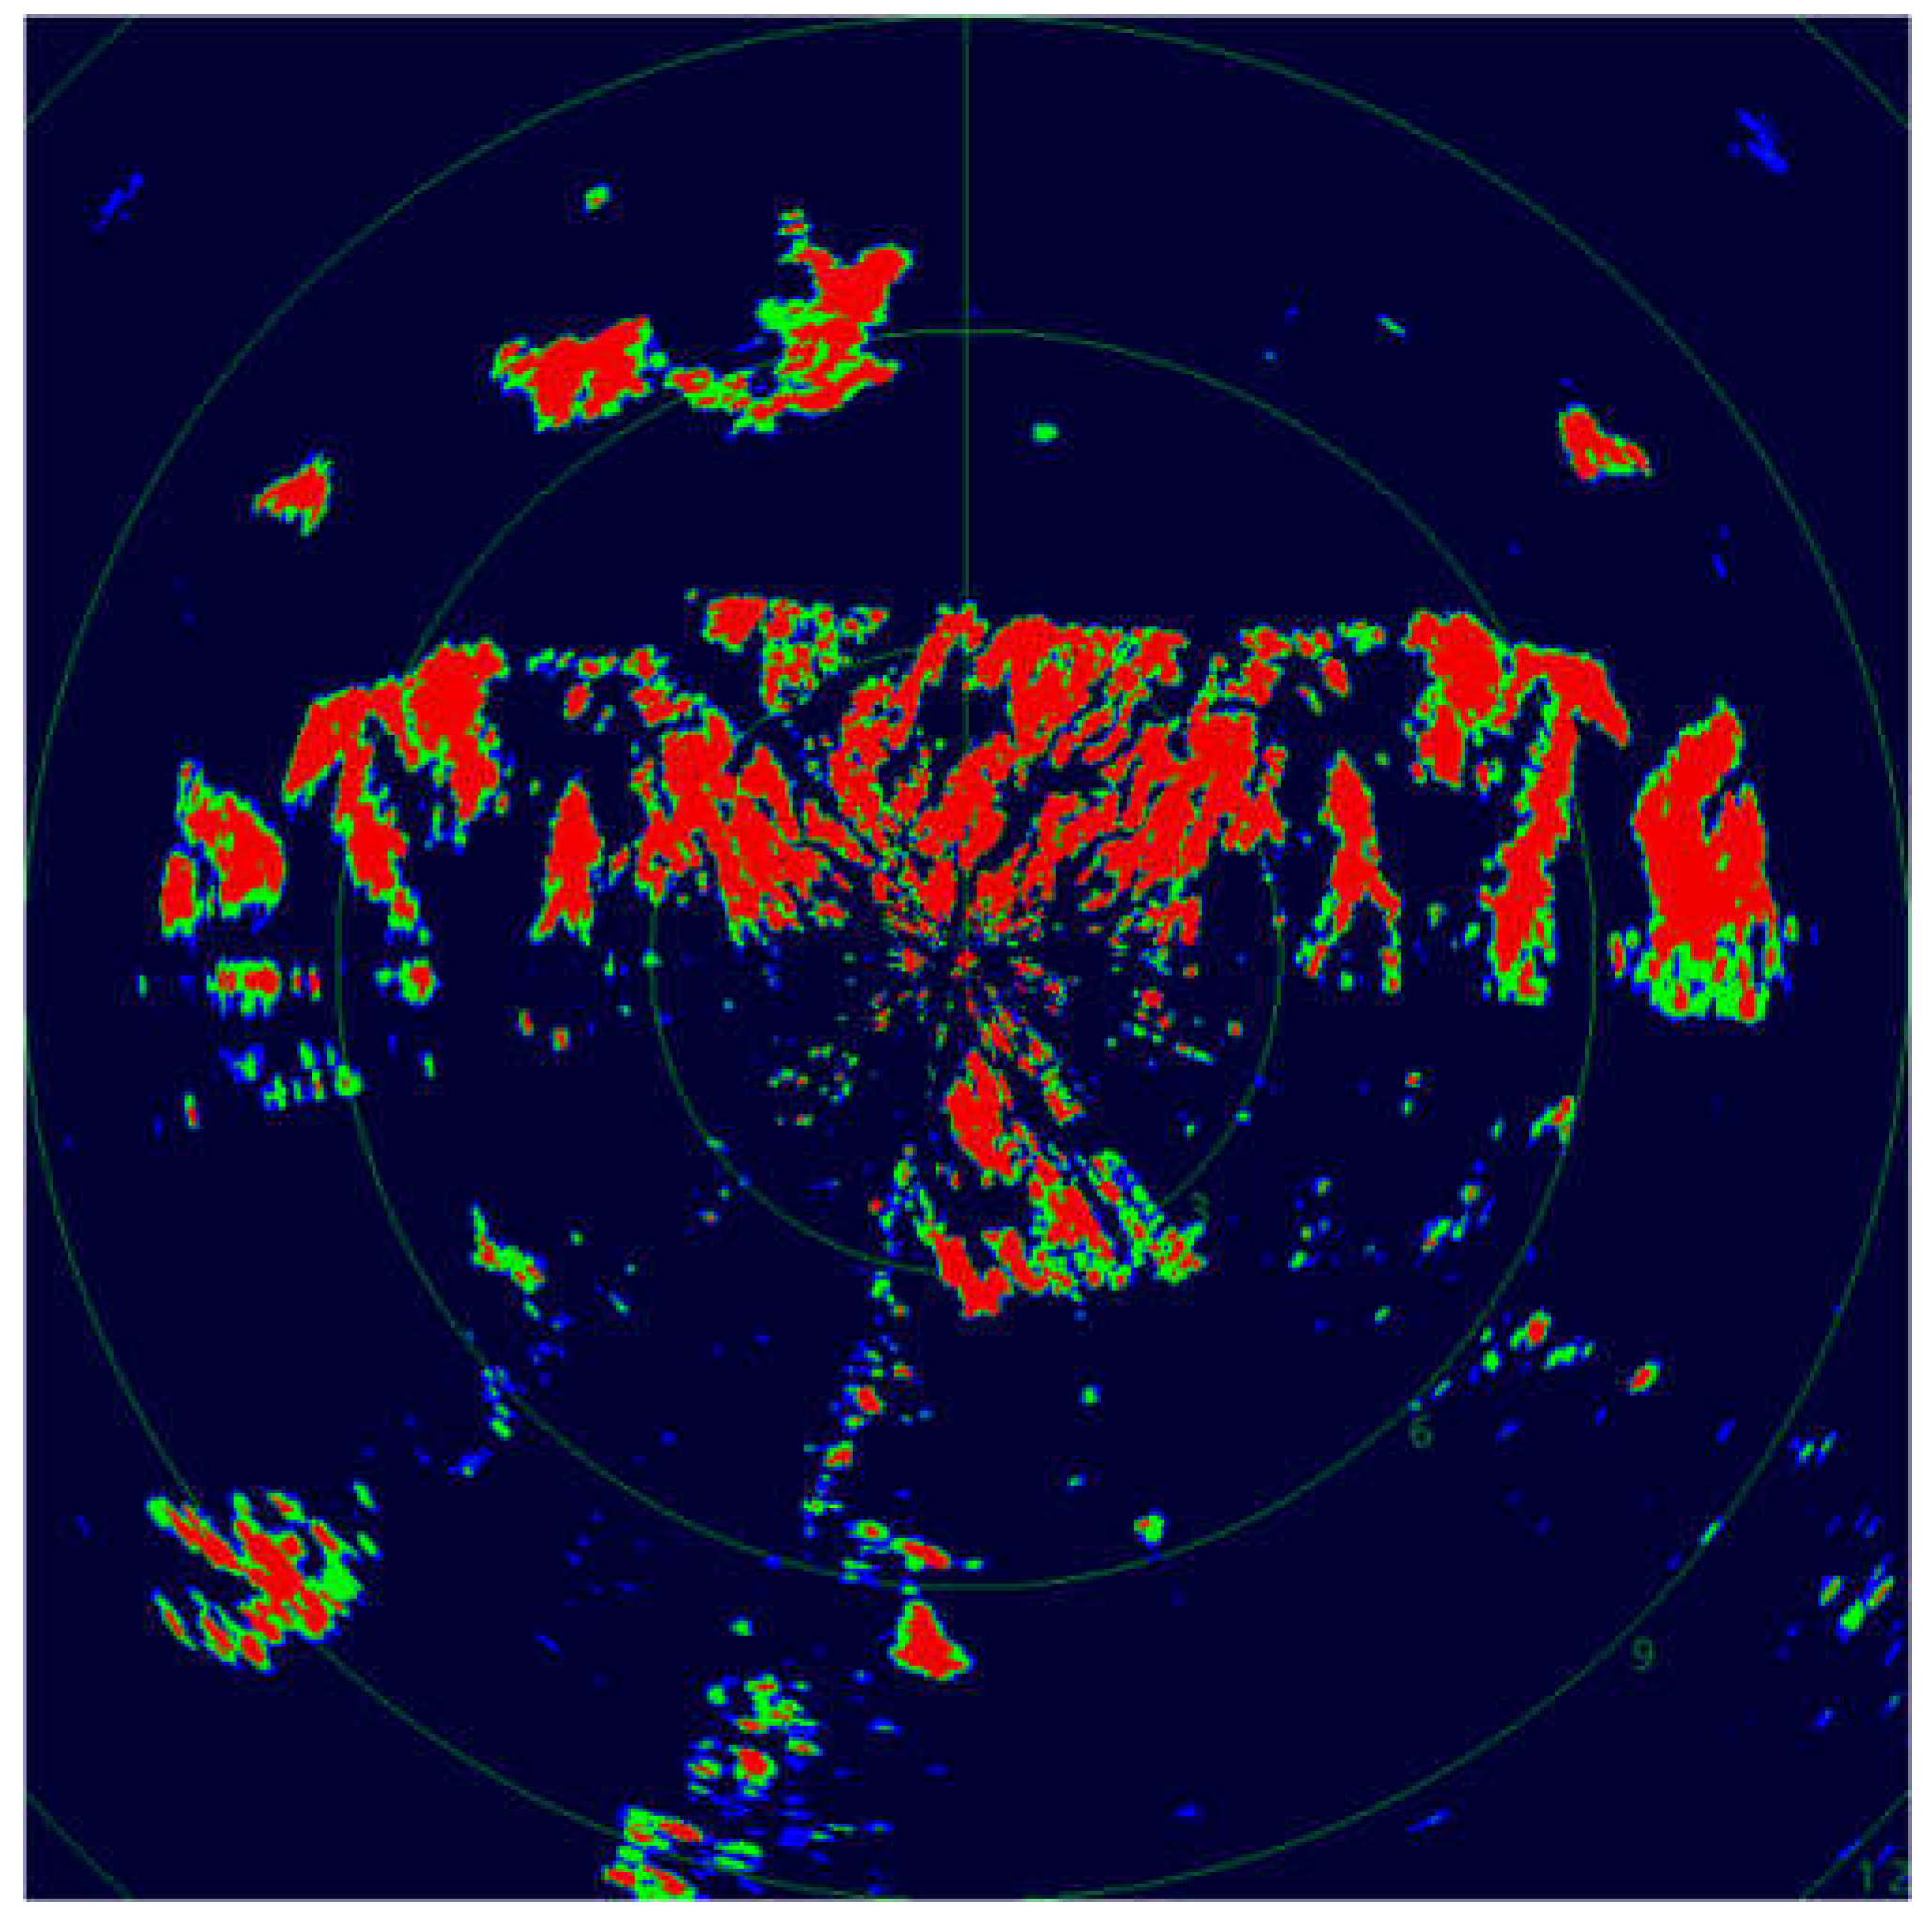
Figure 28.
Original SIMRAD Radar detected Object or Test 2.
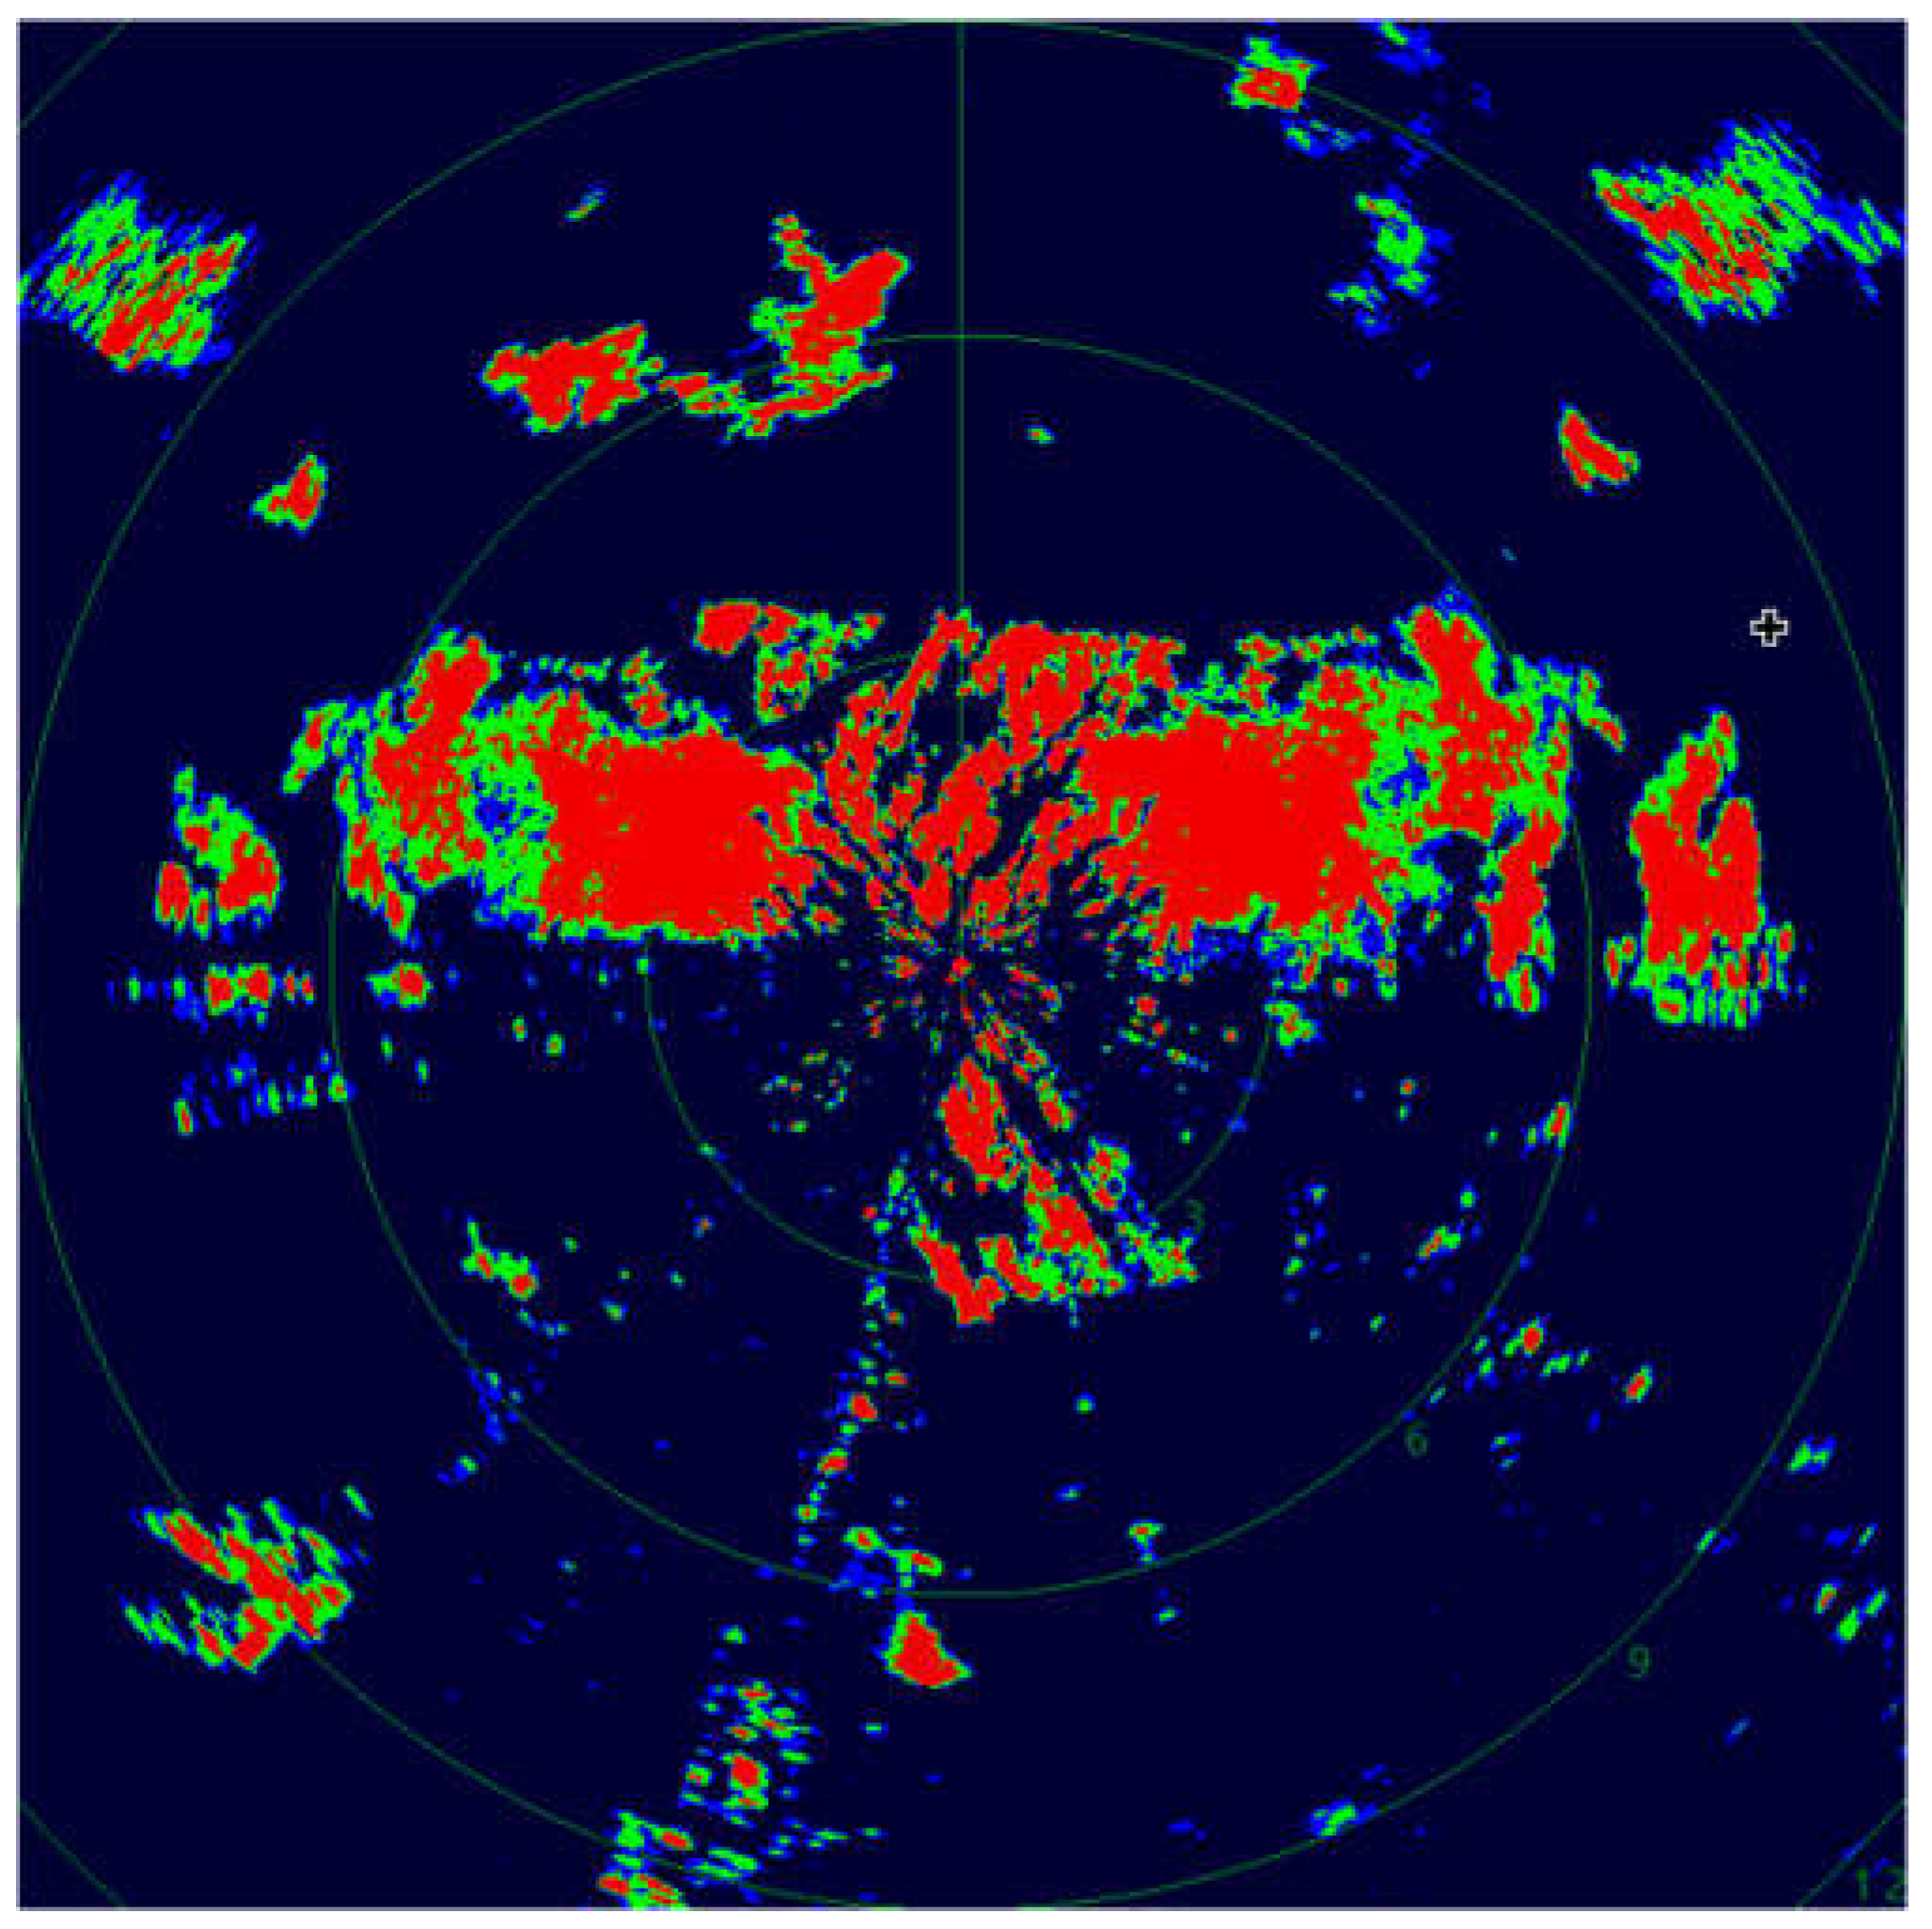
Figure 29.
Example of ocean wave detection 1 to be processed into MATLAB Image Processing.
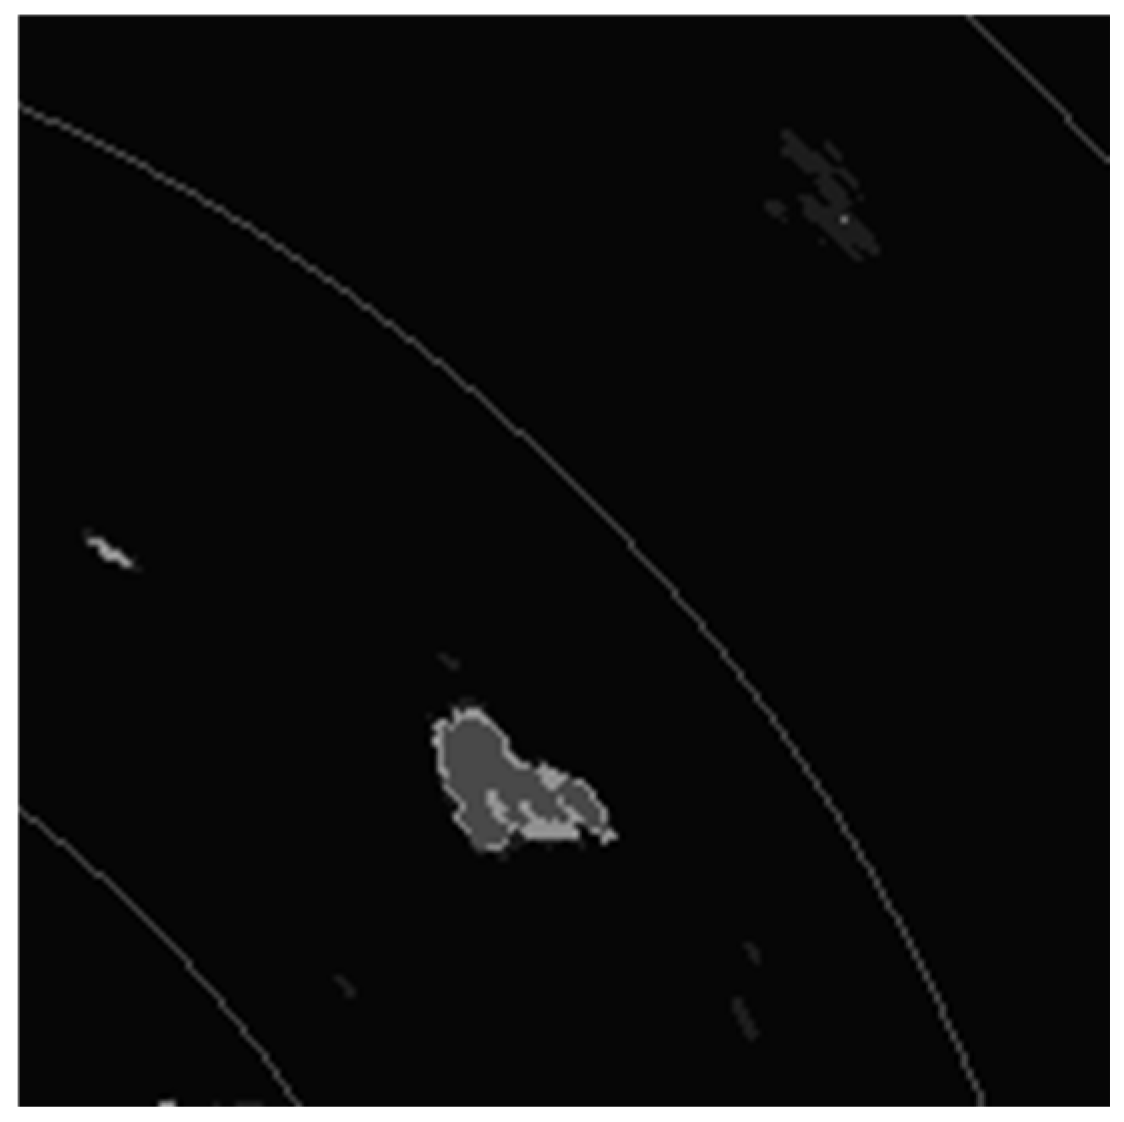
Figure 30.
Ocean wave 1 Detection example to be processed into Image Processing MATLAB, Color processing and identification of wave height or wave level.
Figure 30.
Ocean wave 1 Detection example to be processed into Image Processing MATLAB, Color processing and identification of wave height or wave level.
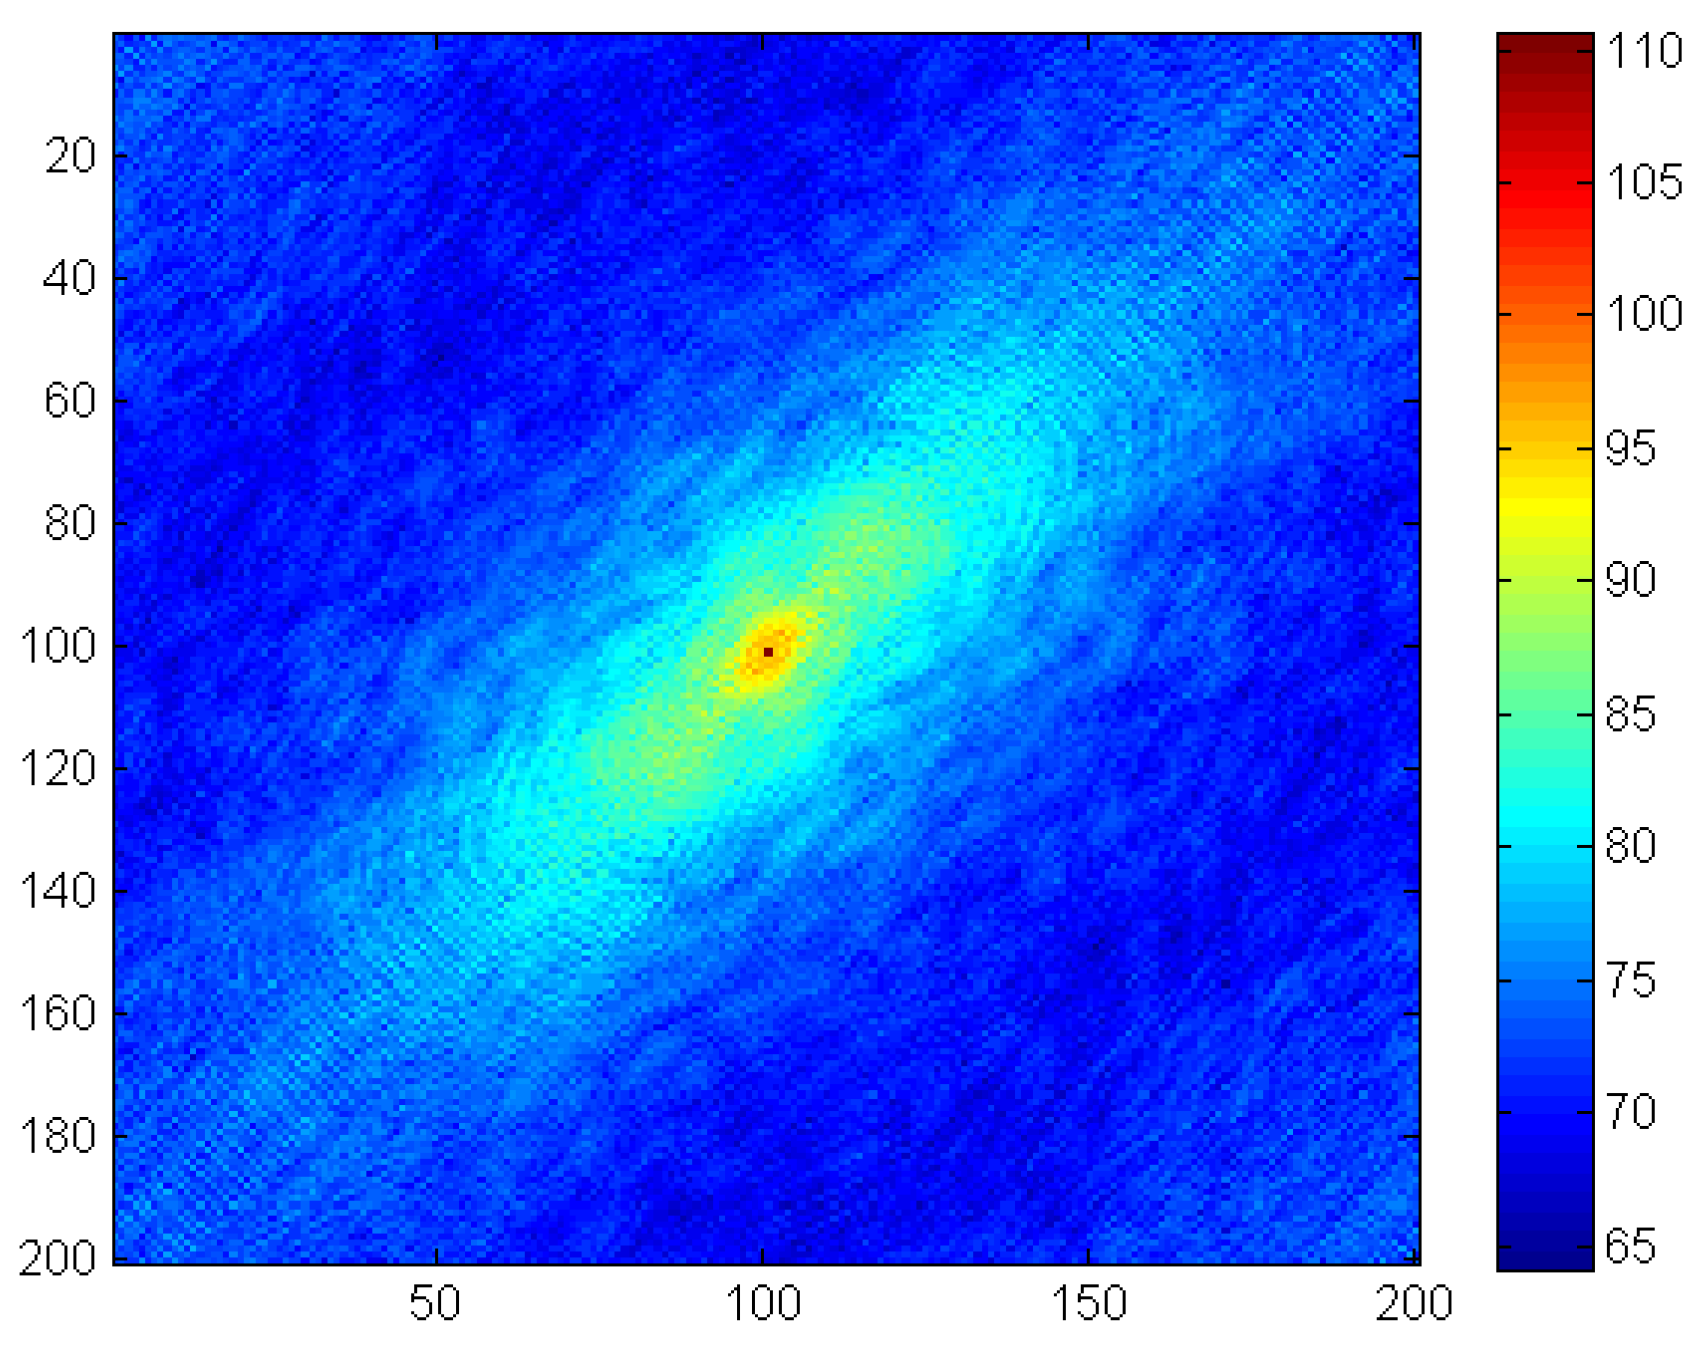
Figure 31.
Ocean wave 2 Detection example to be processed into Image Processing MATLAB.
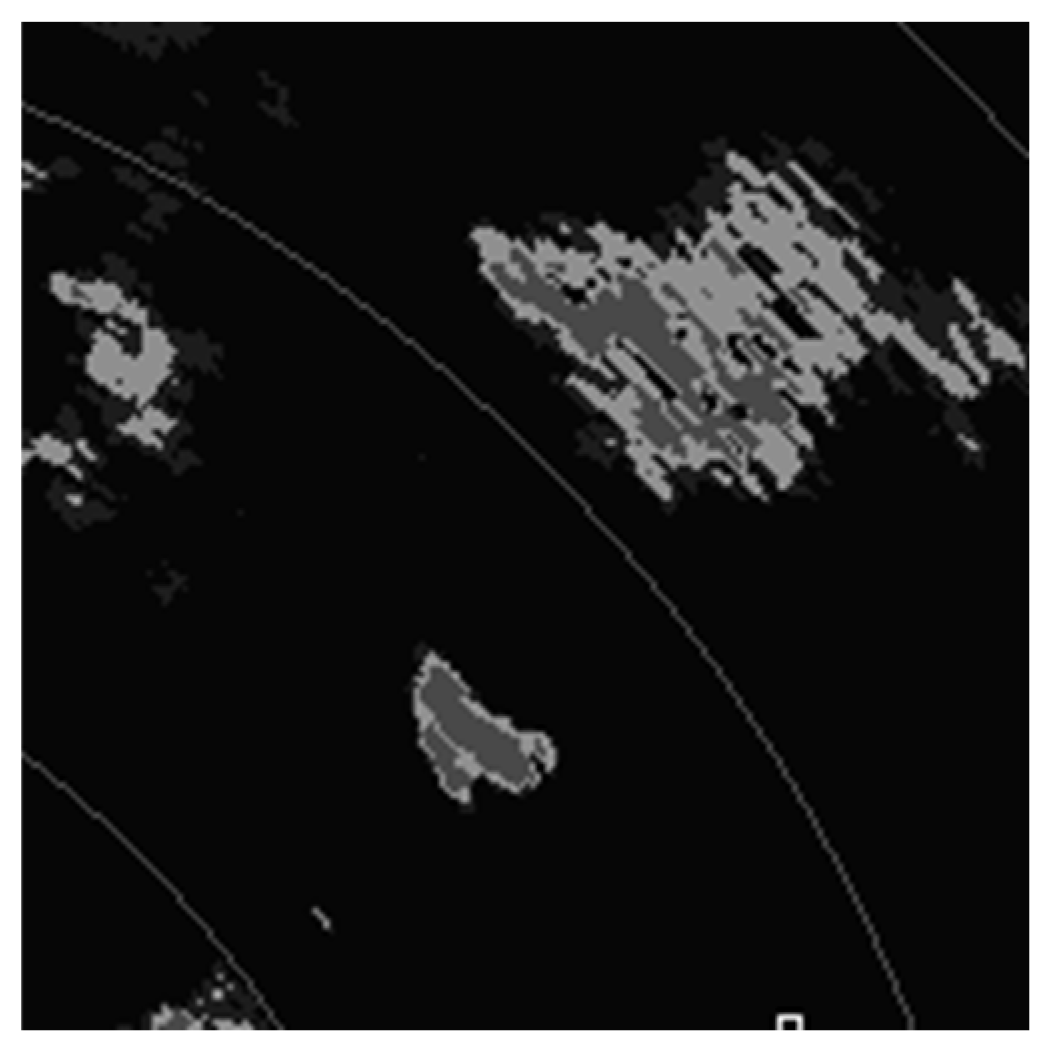
Figure 32.
Ocean wave 2 Detection example to be processed into Image Processing MATLAB, Color processing and identification of wave heights or wave levels.
Figure 32.
Ocean wave 2 Detection example to be processed into Image Processing MATLAB, Color processing and identification of wave heights or wave levels.
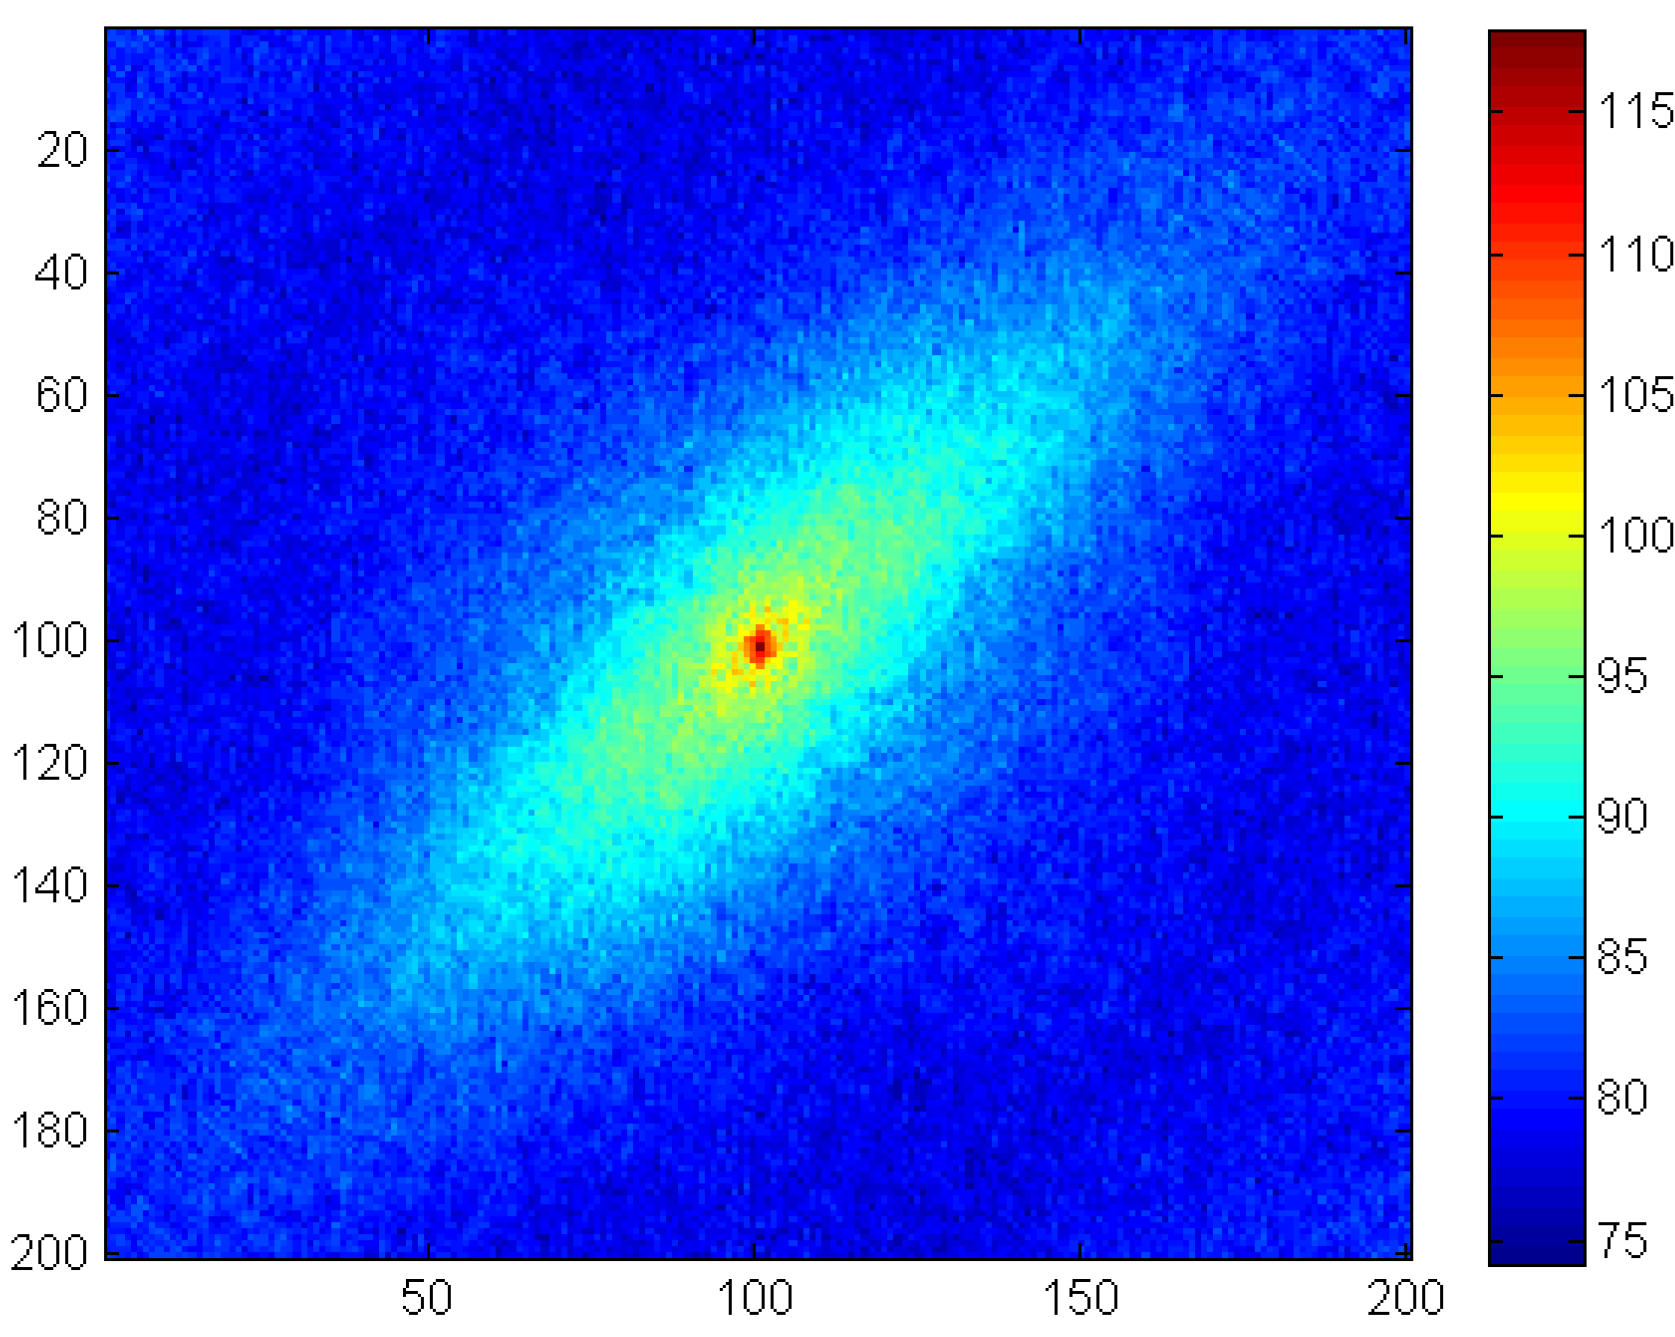
Figure 33.
Real-time sampling of radar images.
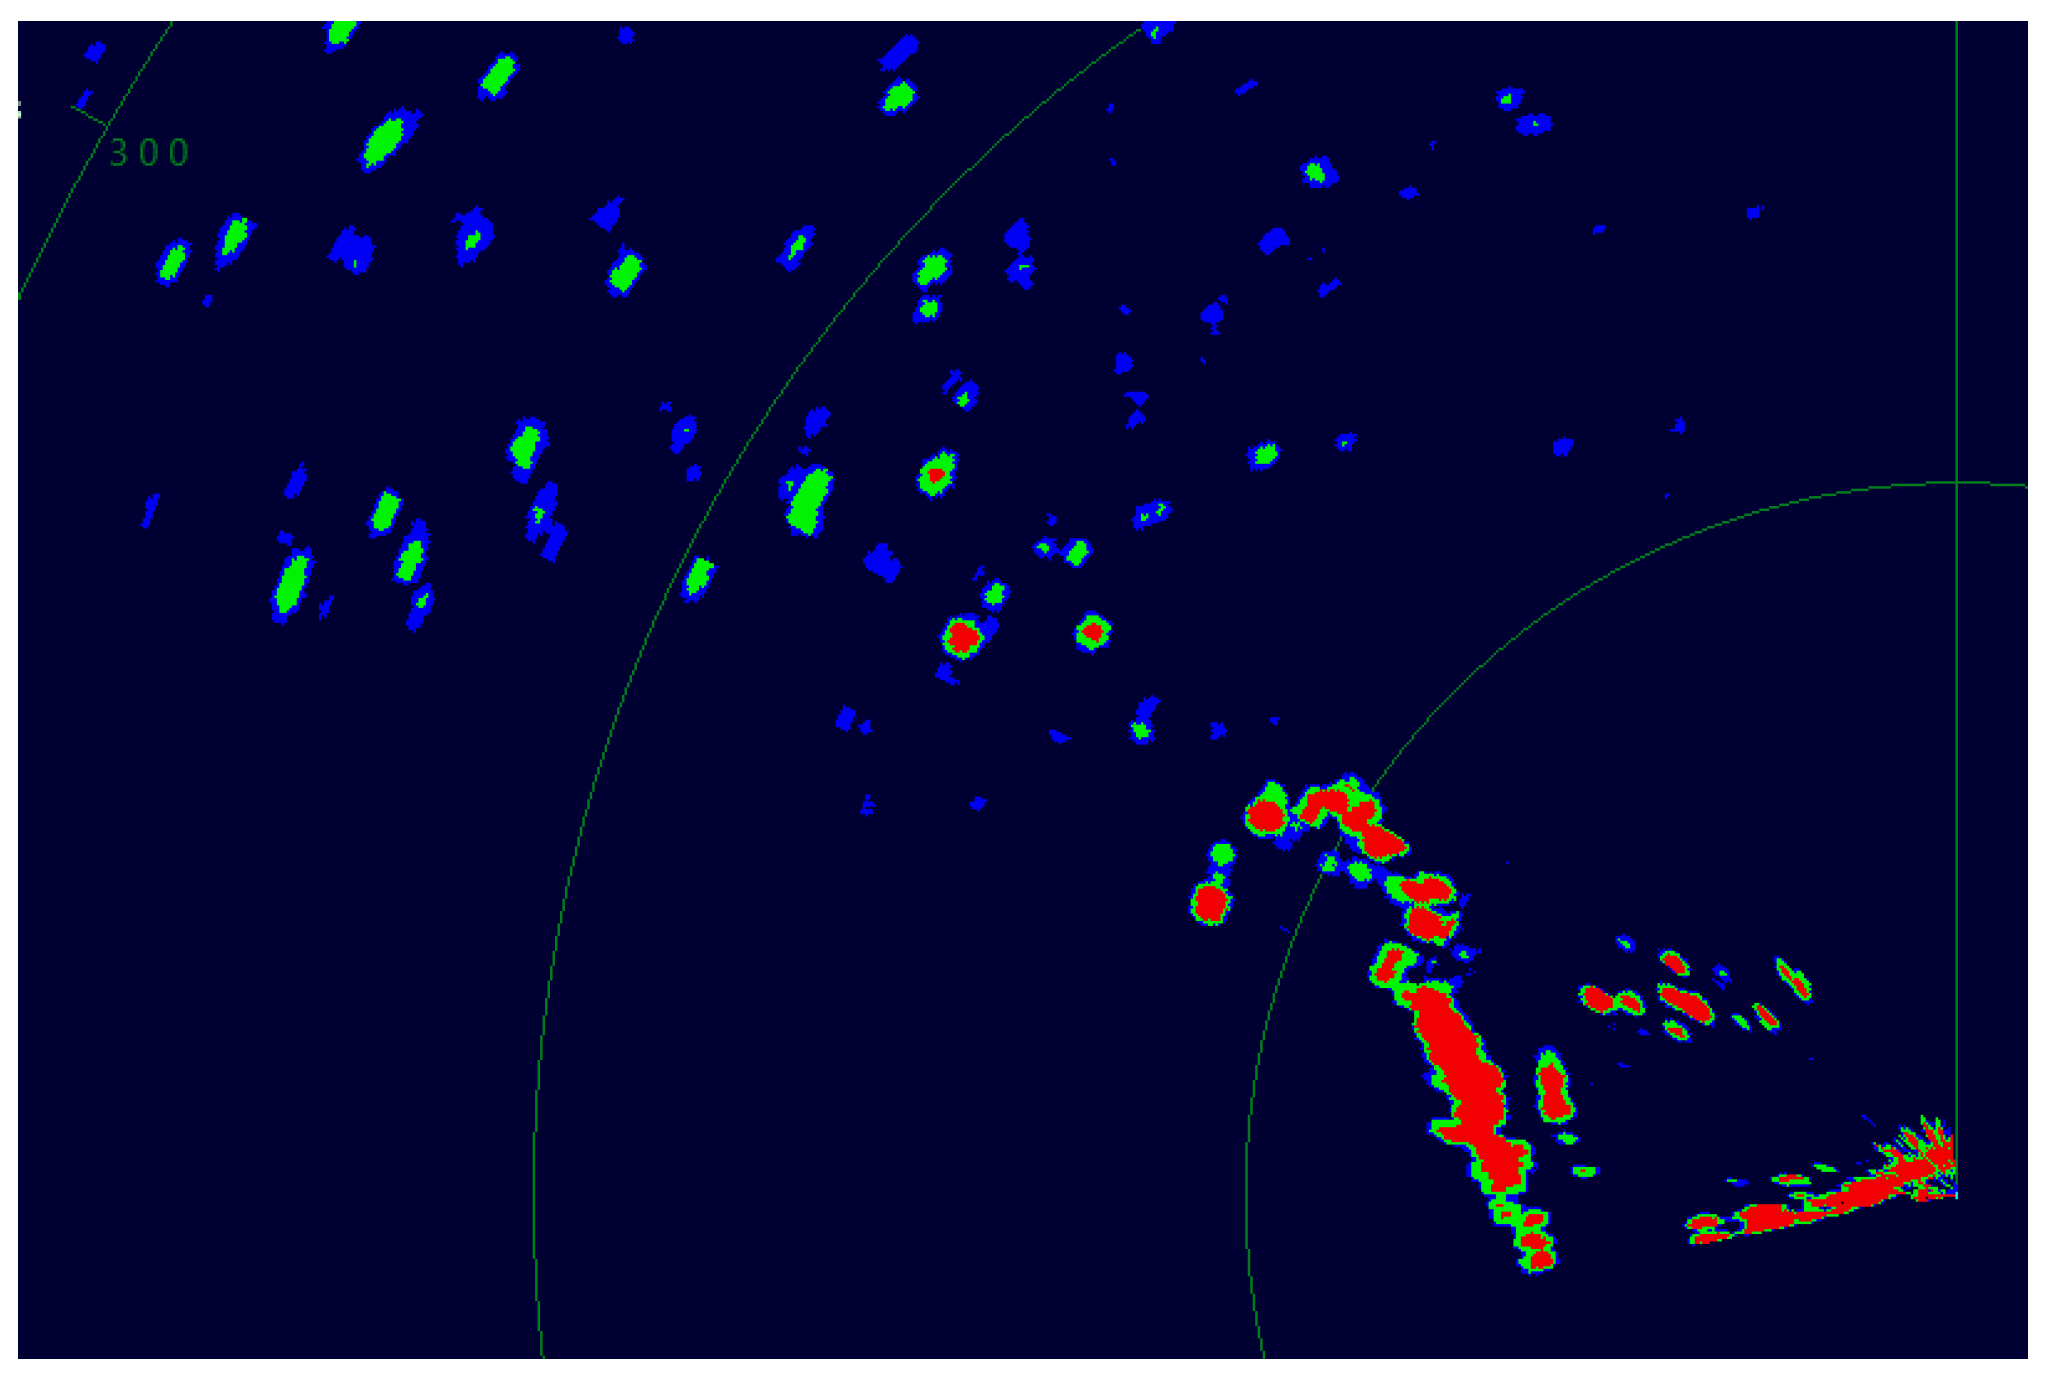
Figure 34.
Crop image 300x300 pixel result.
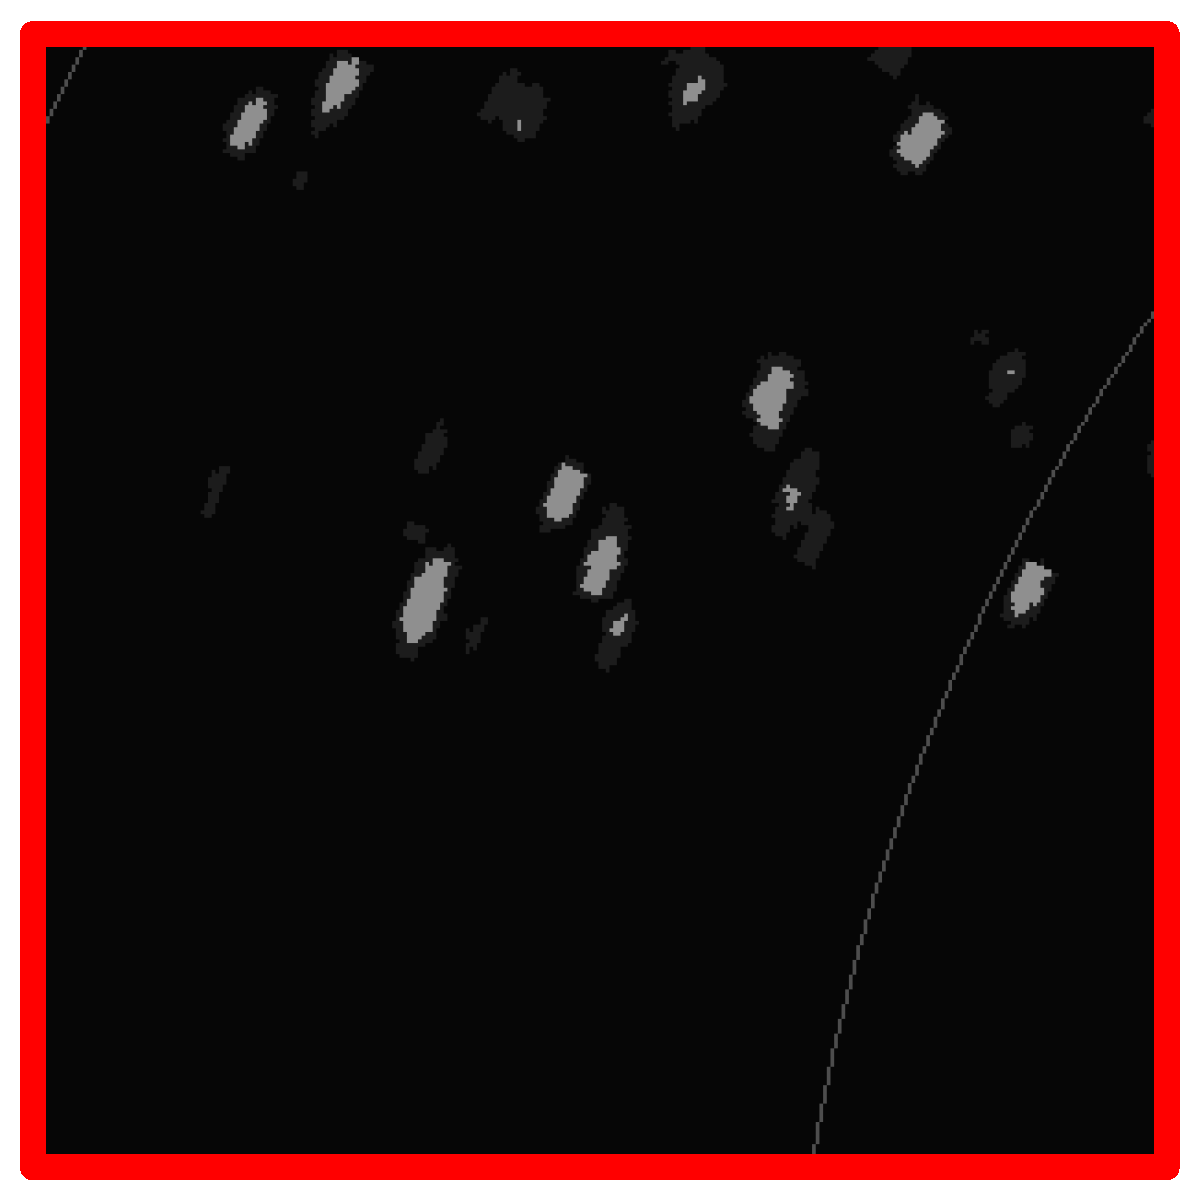
Figure 35.
Wave Amplitude result 1.
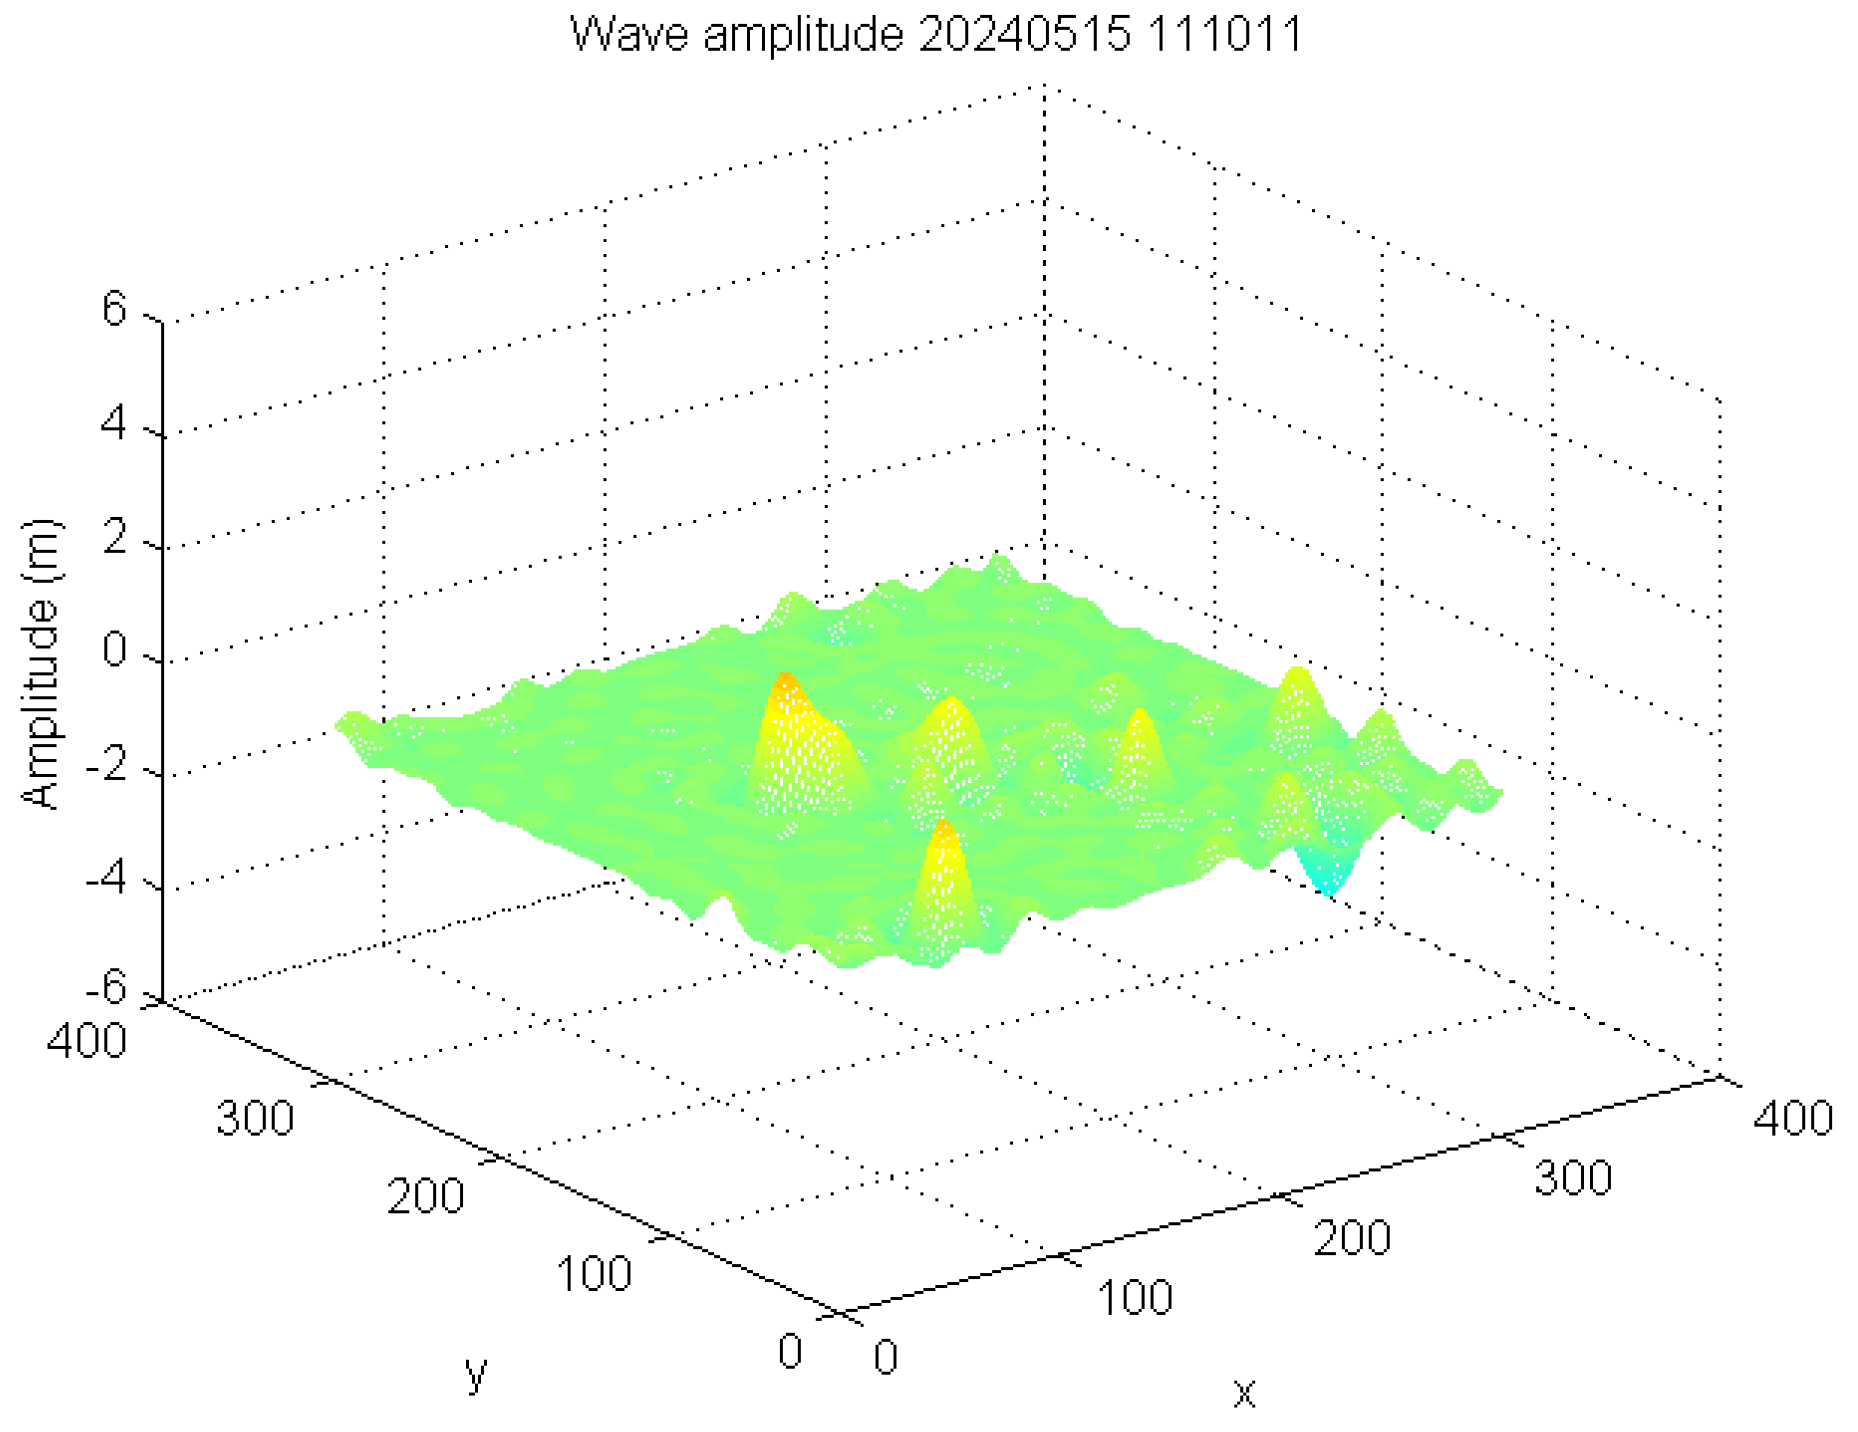
Figure 36.
Crop image 300x300 pixel result from another object in sea.
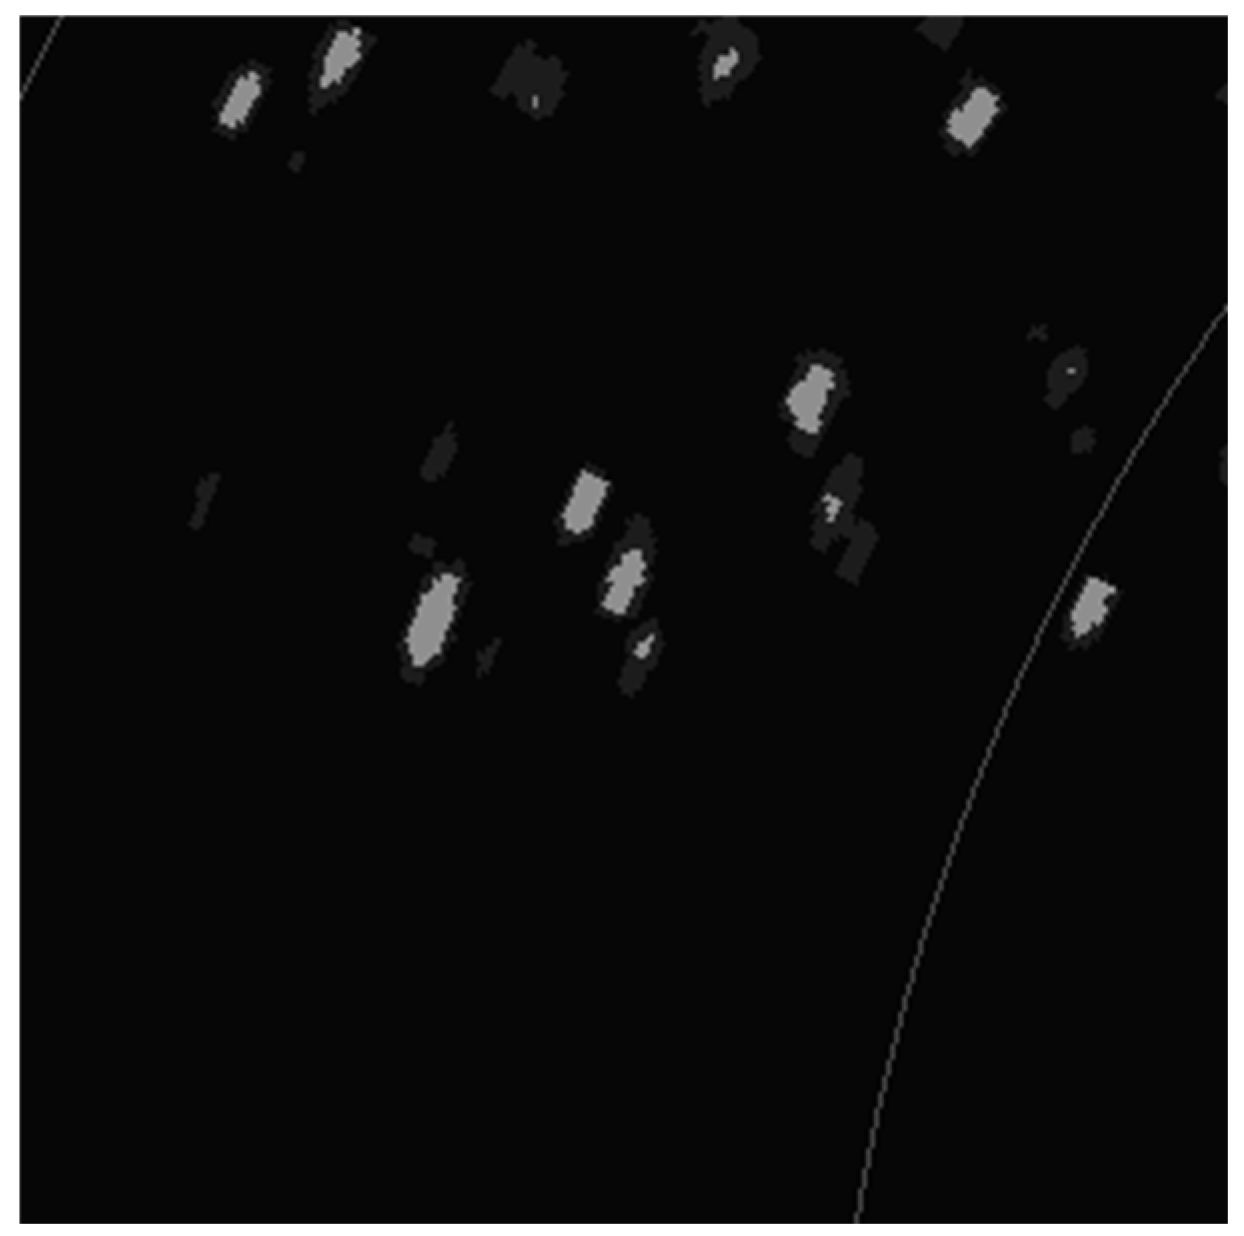
Figure 37.
Wave Amplitude result 2.

Figure 38.
Crop image 300x300 pixel result from Specific object in the sea.
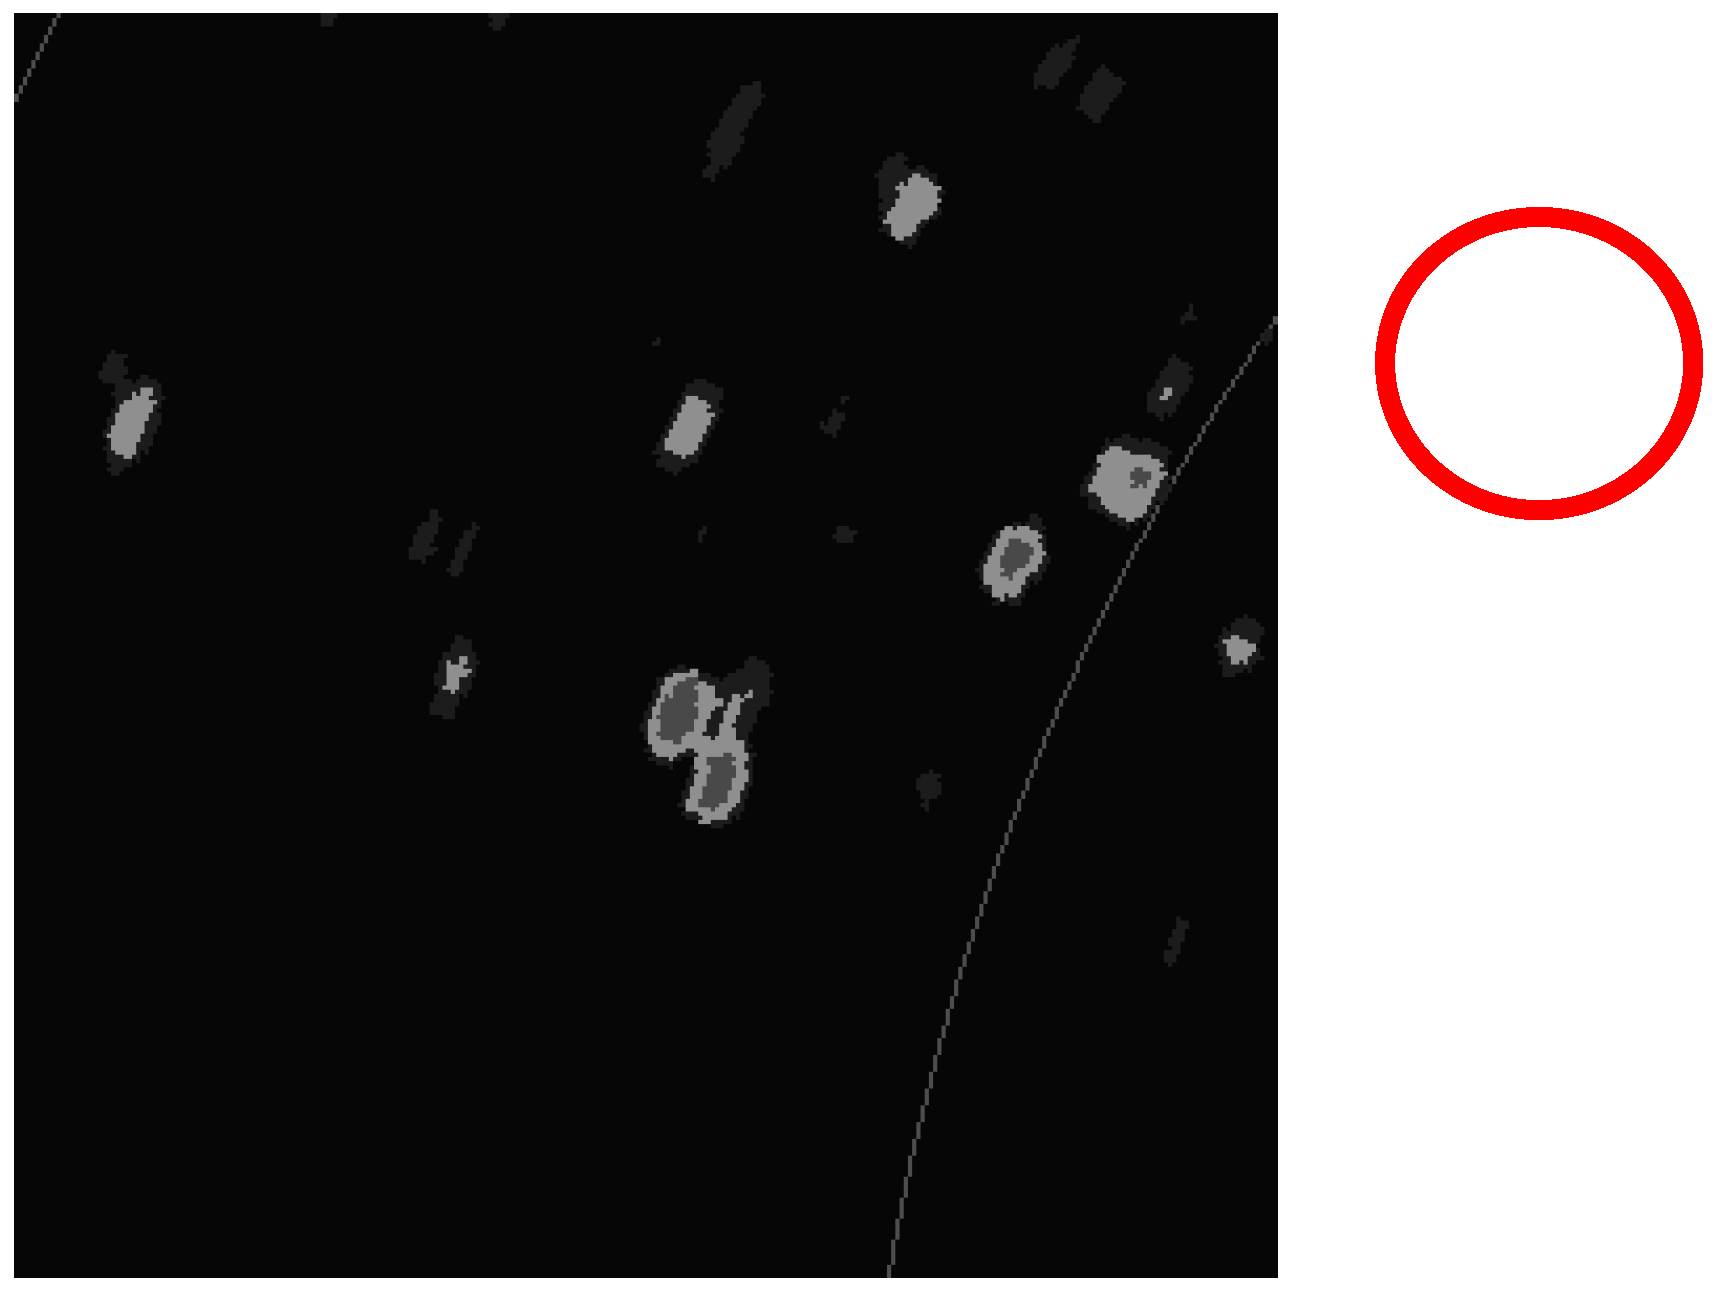
Figure 39.
Wave Amplitude Result 3.

Figure 40.
Tide Time Series plot from SBE 26Plus, pressure and time ratio or Date/Time.
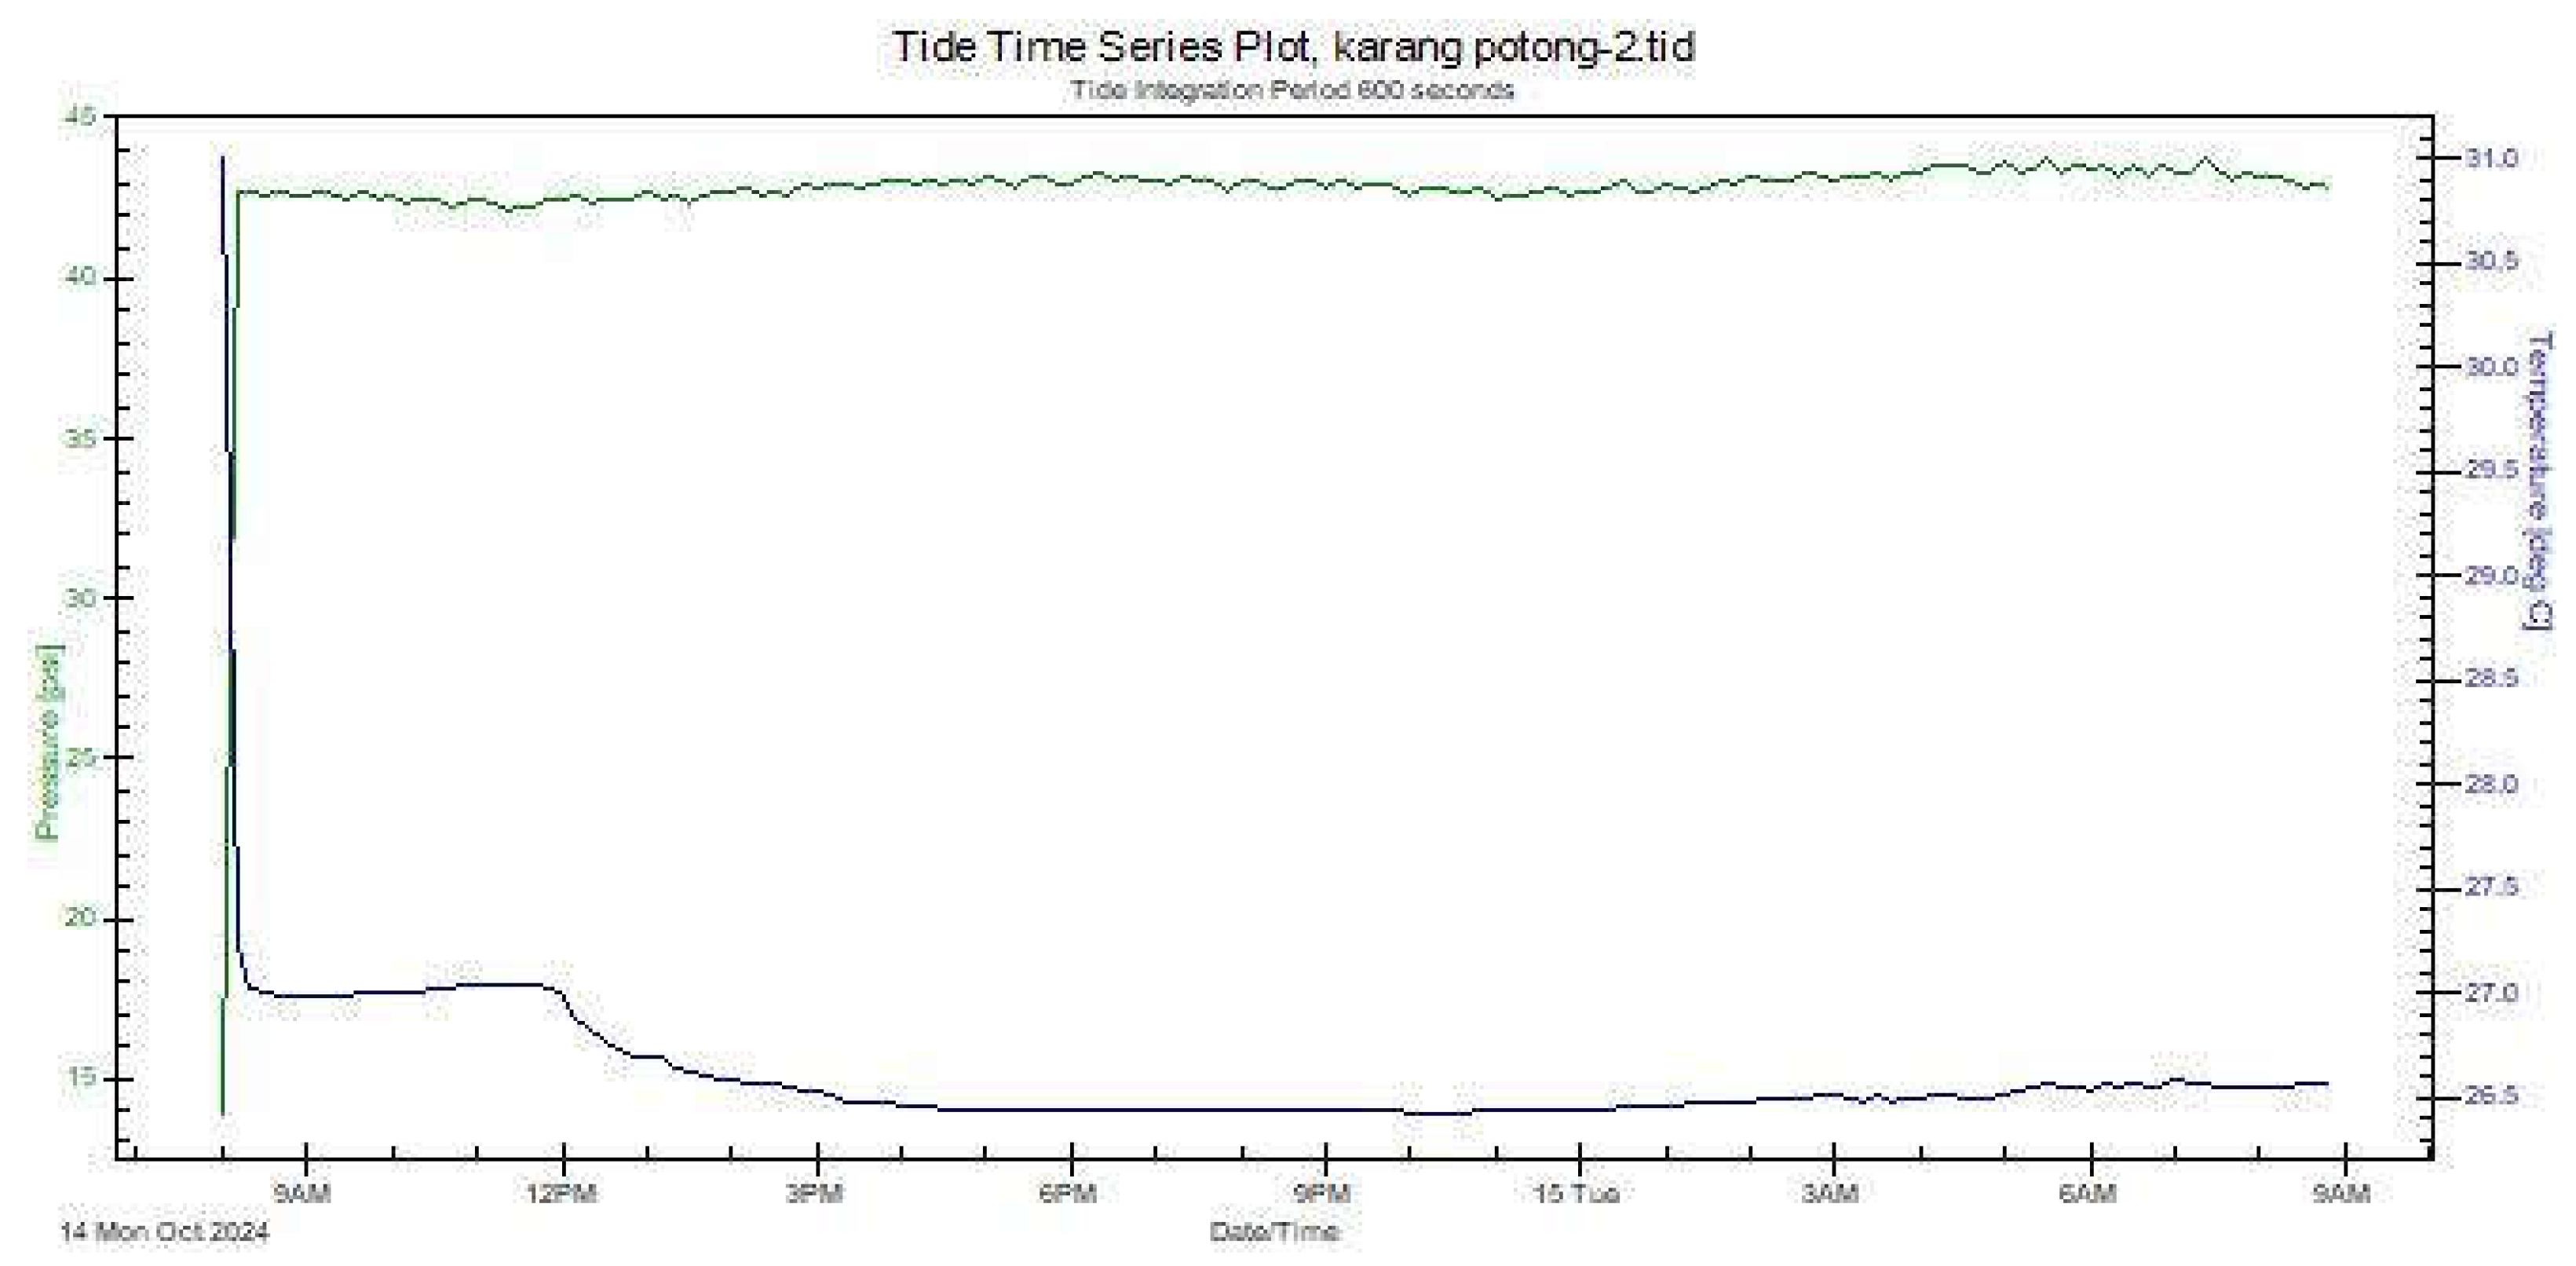
Figure 41.
Wave Time Series Plot, comparison of Subsurface pressure (psi) and time (seconds).
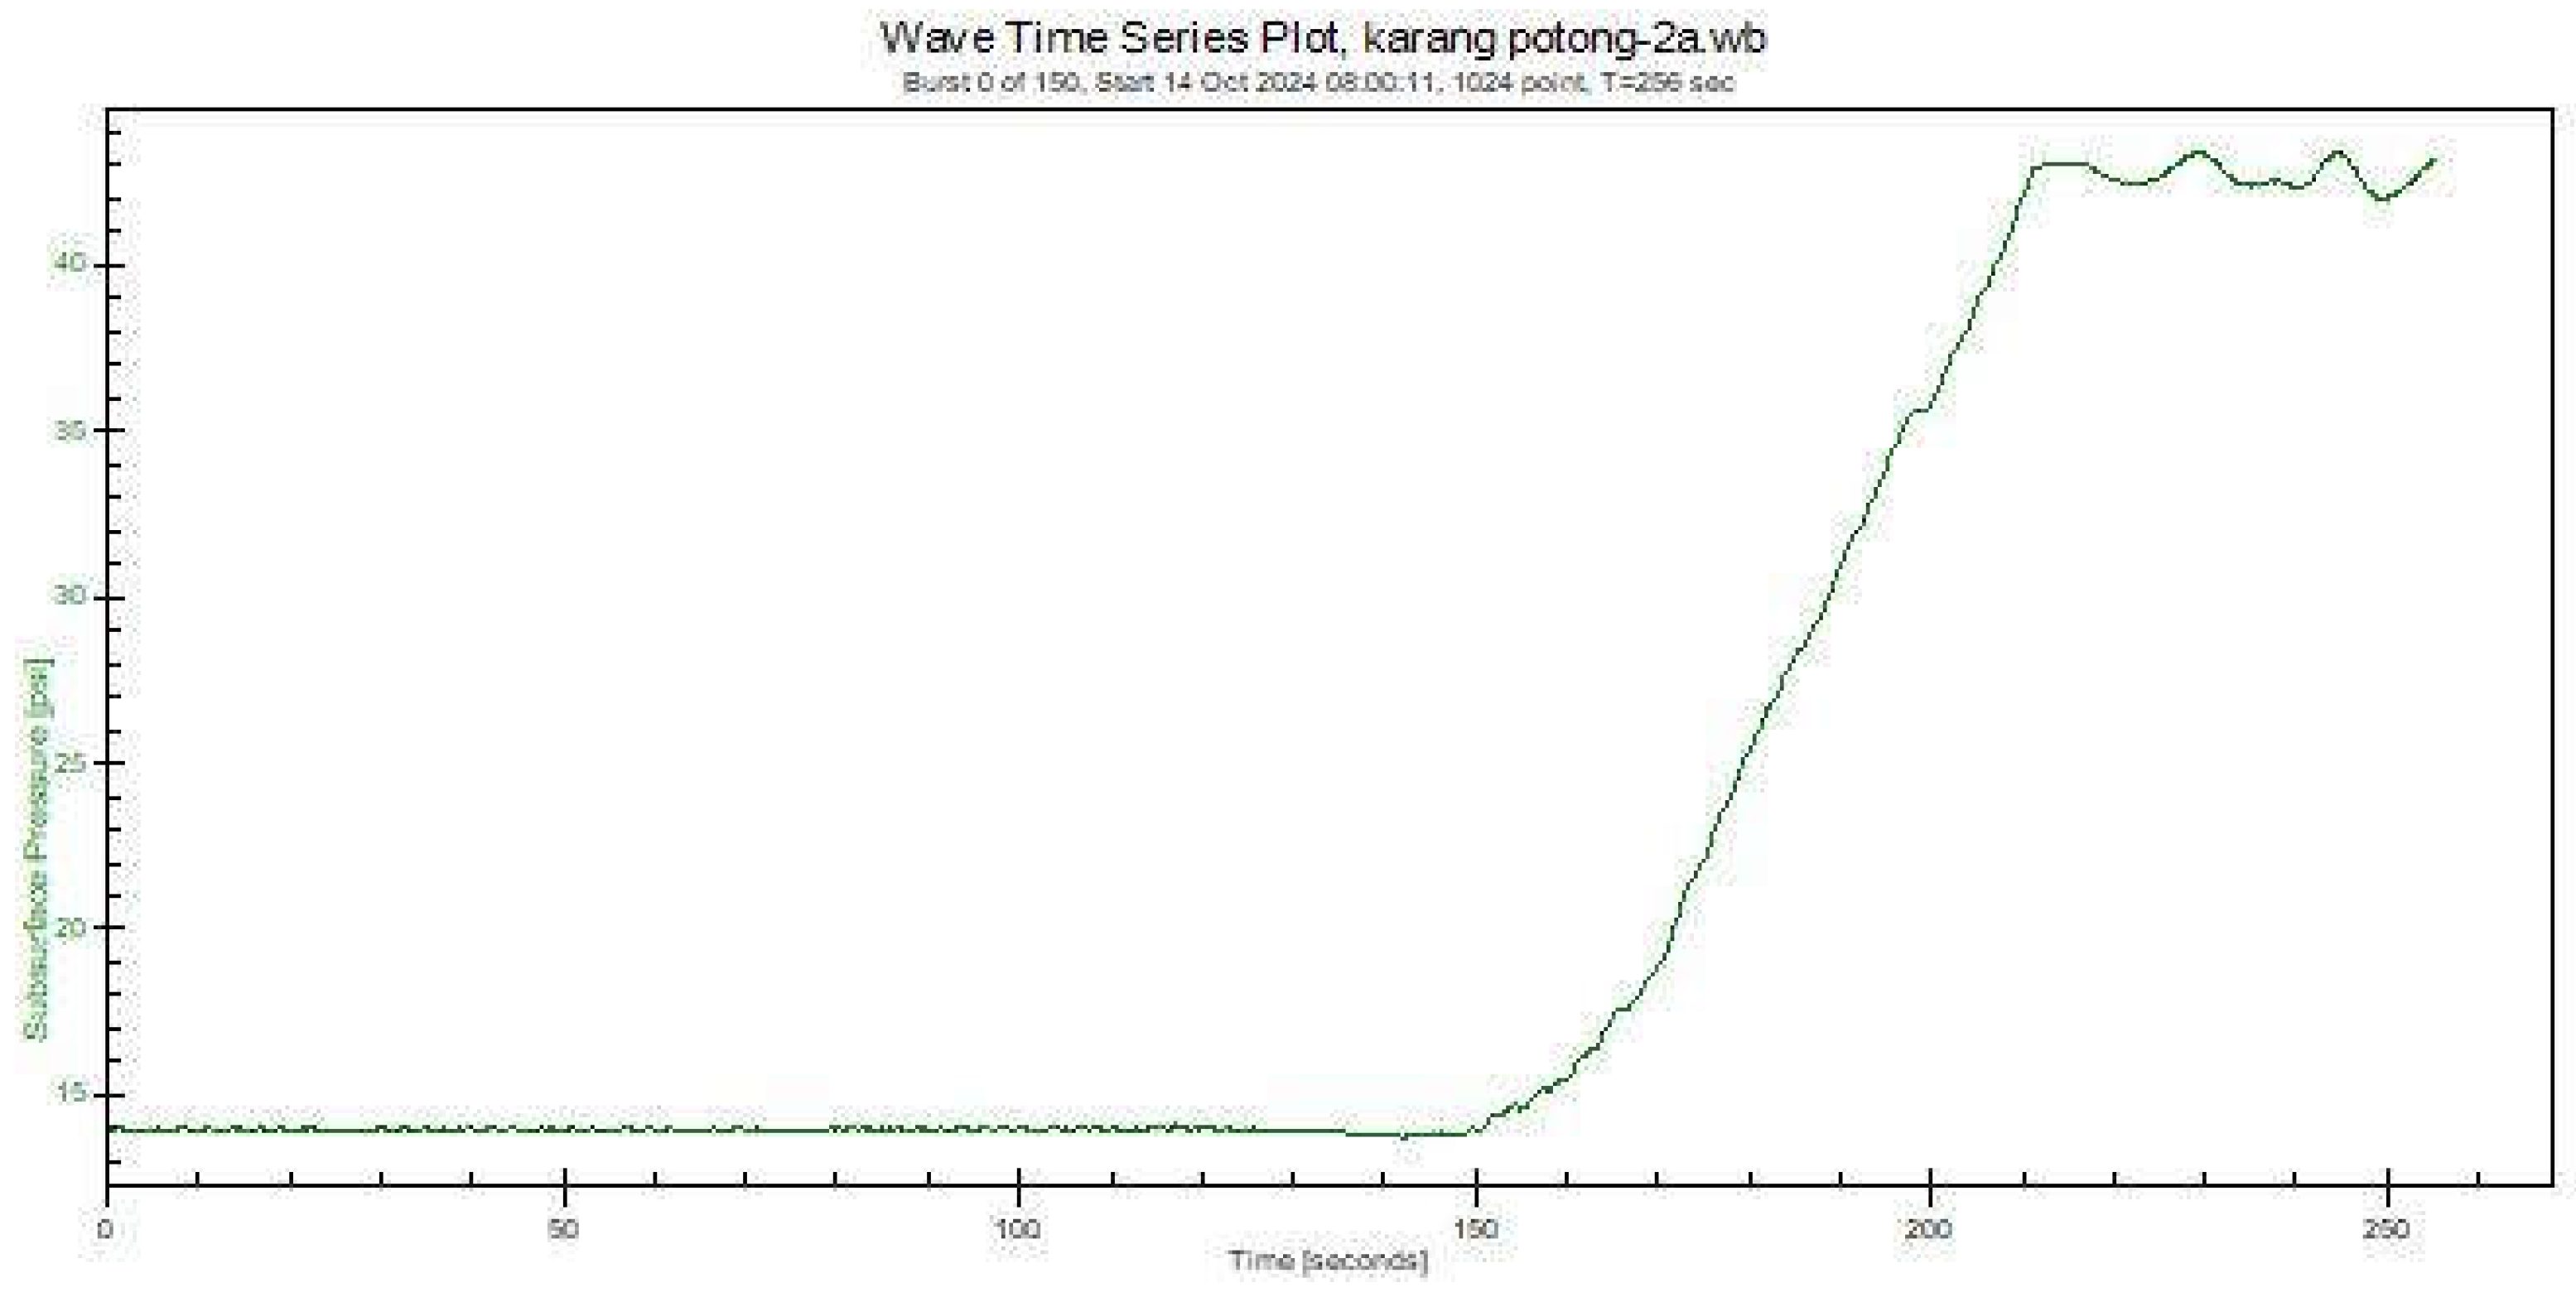
Figure 42.
Wave Time Series burst Plot, Subsurface Pressure (Psi), and Time (Second).
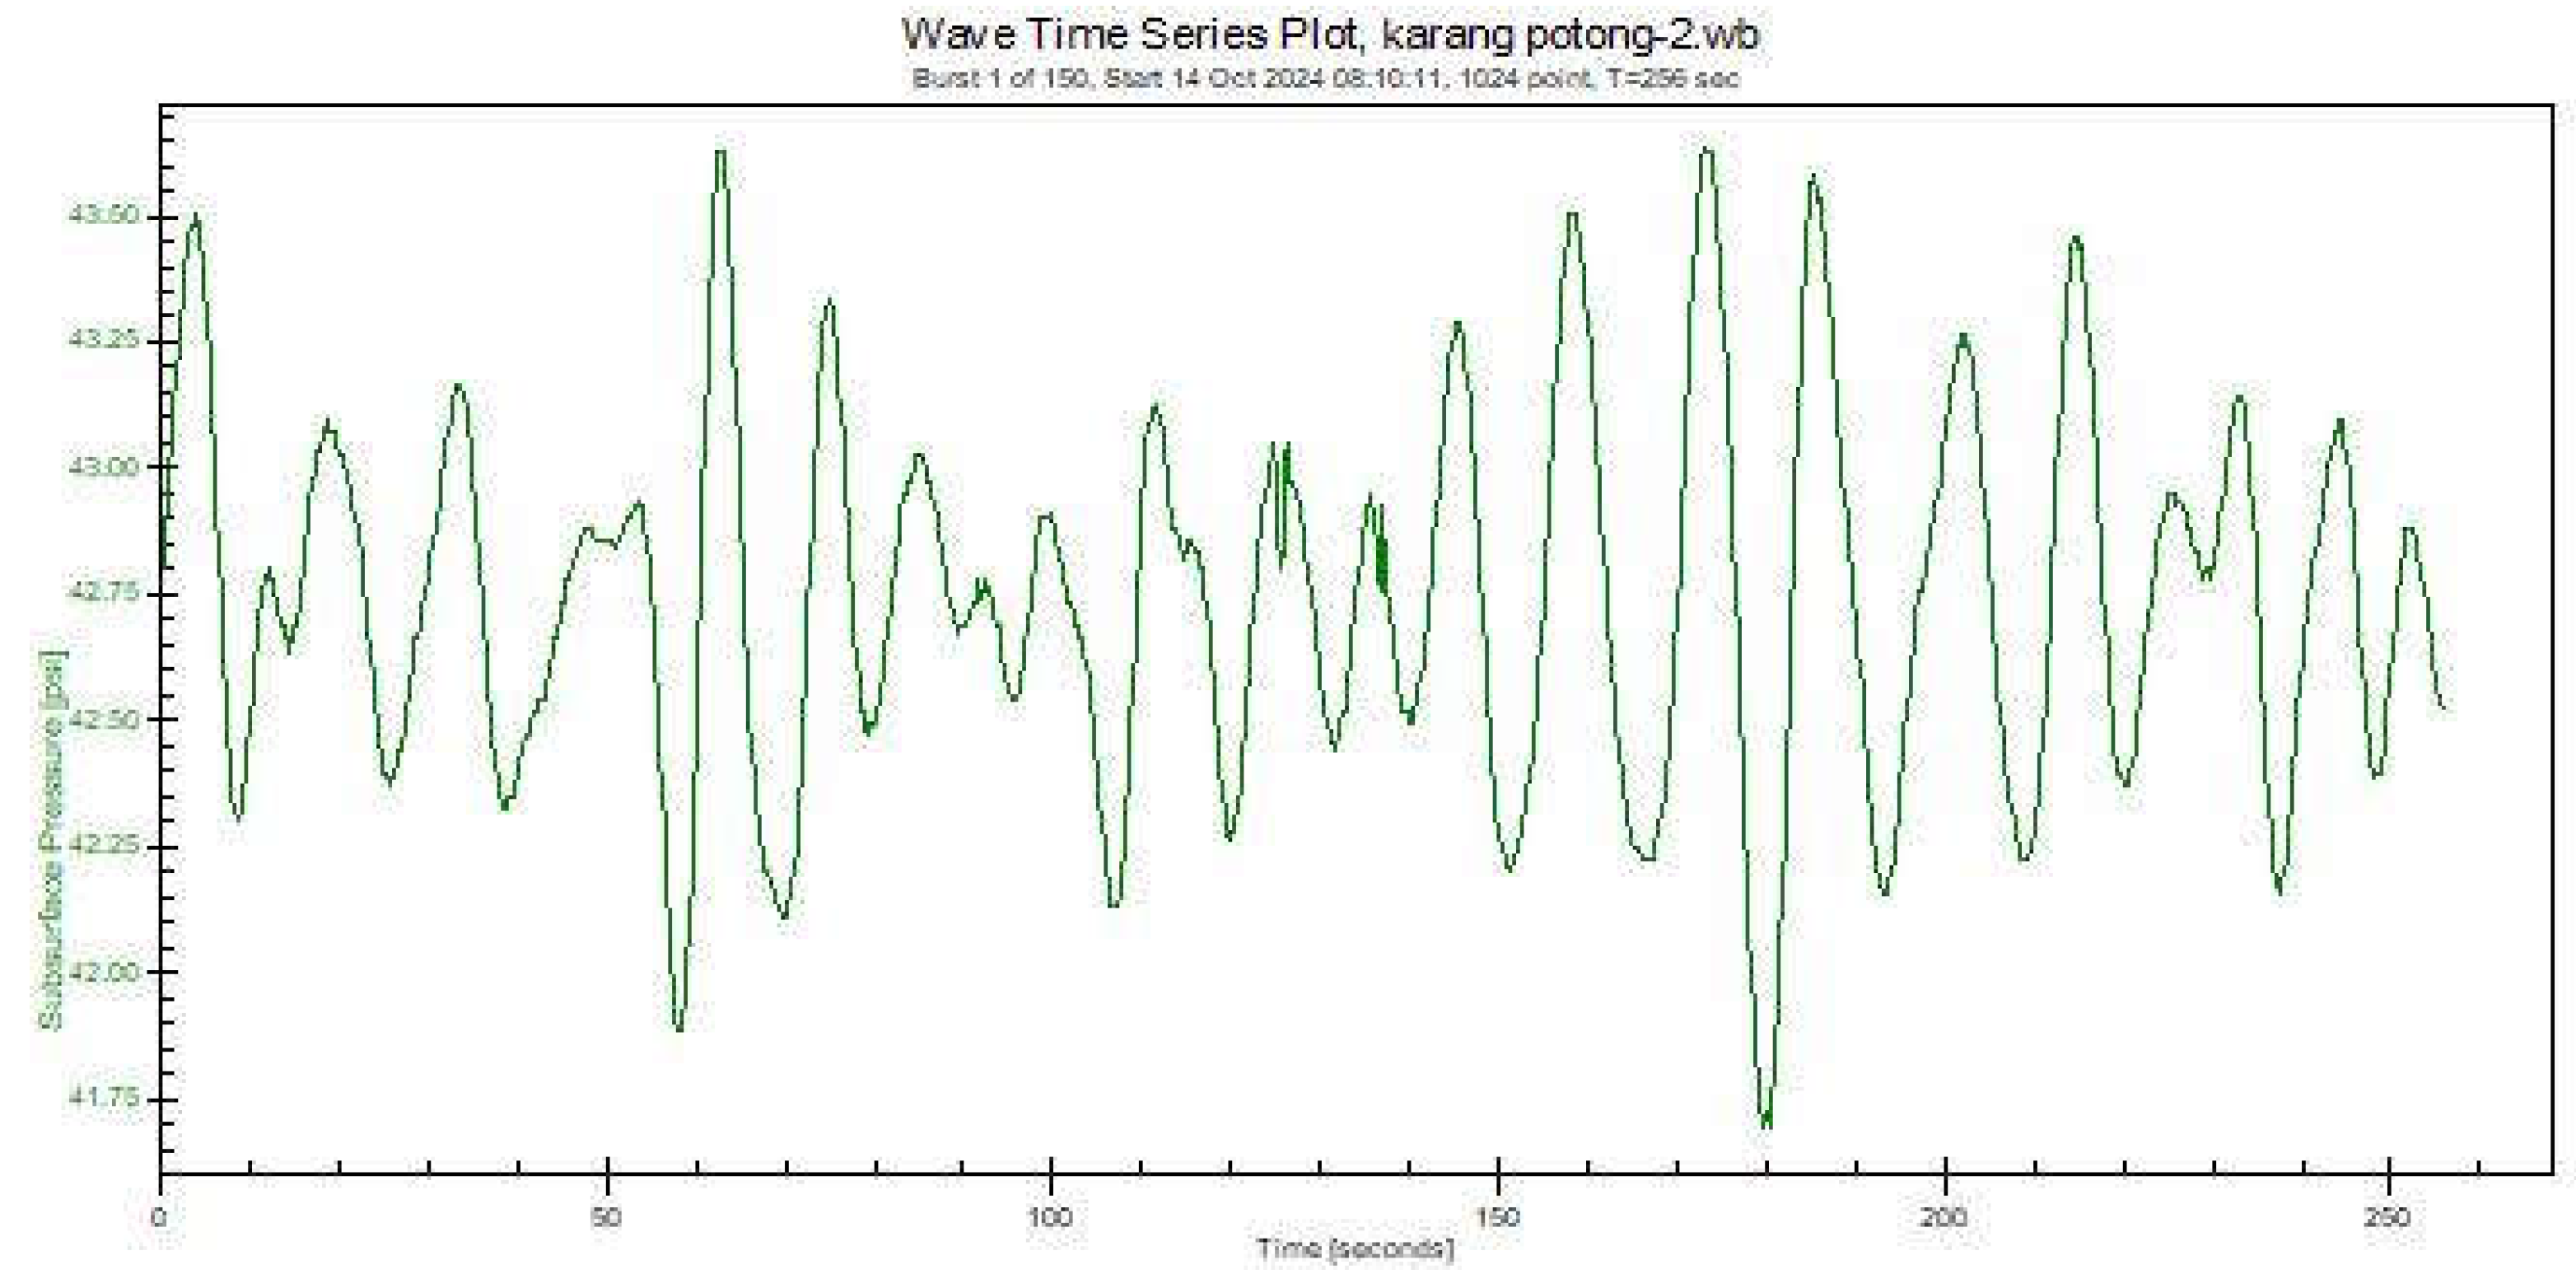
Figure 43.
SIMRAD’s real-time observation of ocean wave changes.
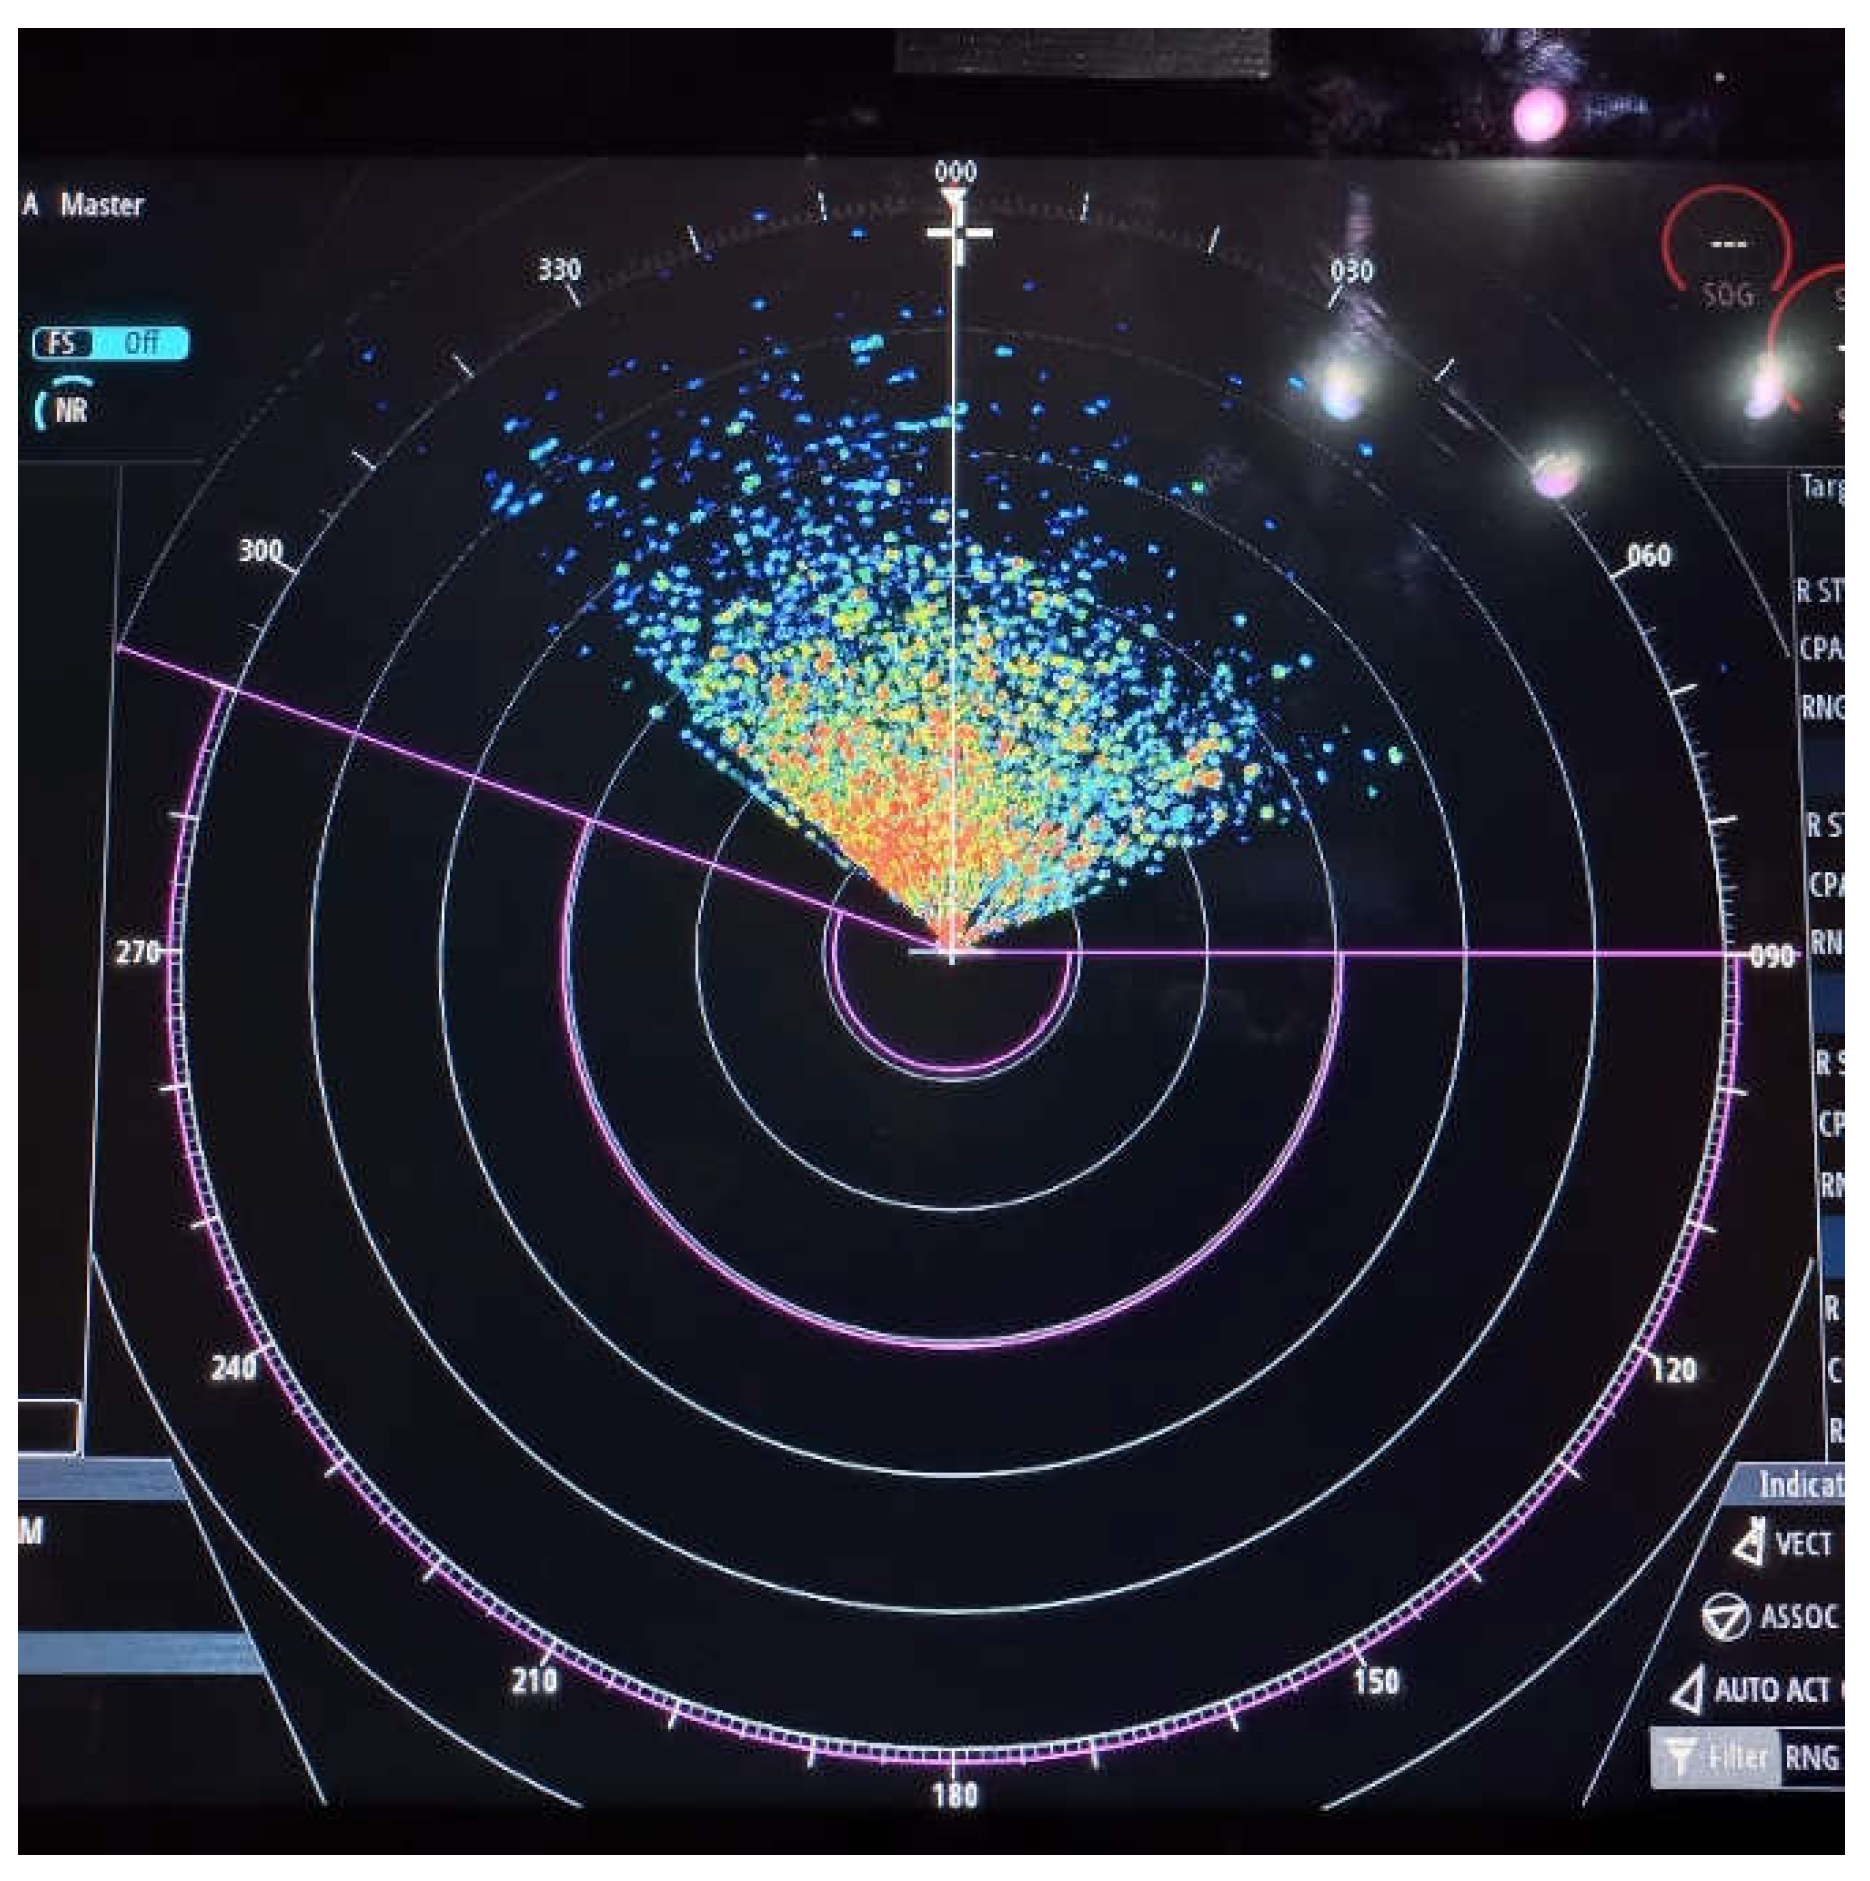
Table 1.
Type of Radar.
| Radar Type | Frequency (GHz) | Wavelength (mm) |
|---|---|---|
| S-band | 2.9-3.2 | 10-12 |
| C-band | 4-8 | 5-7 |
| X-band | 8-12 | 3-4 |
| K-band | 18-27 | 1,7-2,4 |
| W-band | 75-110 | 4-5 |
Disclaimer/Publisher’s Note: The statements, opinions and data contained in all publications are solely those of the individual author(s) and contributor(s) and not of MDPI and/or the editor(s). MDPI and/or the editor(s) disclaim responsibility for any injury to people or property resulting from any ideas, methods, instructions or products referred to in the content. |
© 2024 by the authors. Licensee MDPI, Basel, Switzerland. This article is an open access article distributed under the terms and conditions of the Creative Commons Attribution (CC BY) license (http://creativecommons.org/licenses/by/4.0/).
Copyright: This open access article is published under a Creative Commons CC BY 4.0 license, which permit the free download, distribution, and reuse, provided that the author and preprint are cited in any reuse.


