Submitted:
06 November 2024
Posted:
07 November 2024
You are already at the latest version
Abstract
This study evaluates the impact of different irrigation scenarios on the yield of quinoa (Chenopodium quinoa) in the Chilean Altiplano. The research was conducted in Ancovinto, Tarapacá, Chile, using "Pandela" quinoa seeds. Four irrigation treatments were implemented: rainfed (T0), and irrigation at 100% ETc (T1), 66% ETc (T2), and 33% ETc (T3). Various climatic variables, soil moisture content, and agromorphological parameters were measured. Results indicated that rainfed conditions (T0) led to higher dry matter production in roots, stems, leaves, and panicles at the end of the growth cycle compared to irrigated treatments. Leaf Area Index (LAI) was also higher in rainfed conditions during the flowering stage, demonstrating the crop's adaptability to adverse water conditions. Plants under rainfed conditions reached greater heights and showed higher harvest indices (HI) and grain yield than those under irrigation. Water Use Efficiency (WUE) was significantly higher in rainfed conditions, suggesting more effective water utilization under water scarcity. The results obtained show that quinoa plants under traditional management (rainfed) exhibited the best response in the measured growth, development, and production variables, leading to higher production and harvest rates. Additionally, these was greater efficiency in water use, equivalent to 15,87 and 12,7 times that of the 100% and 33% ETc treatments, respectively. These findings highlight the quinoa's remarkable adaptability to harsh hydric conditions and the efficiency of traditional rainfed farming practices in the Altiplano.
Keywords:
Quinoa
; Irrigation Scenarios
; Altiplano
; Chile
; Water Use Efficiency
; Dry Matter Production
; Leaf Area Index
; Harvest Index
1. Introduction
There exists a growing global concern about the impact the average high temperature increase may have on the quinoa farming. Agriculture on the Chilean Altiplano frequently lacks the necessary resources to face climate risks, due to the lack of meteorological information to manage agroclimatic variability, especially in rainfed production systems [1].Olivera [2]researched how climate change may affect the income of organic quinoa producers under these anthropogenic global change conditions, he concluded that the adaptation farmer capacity is key to improve the cultivation productivity. Aguilar and Jacobsen [3] report that, given the natural climate variability of Peruvian Altiplano, producers diversify quinoa planting in different agroecological areas, and they implement rotational cropping system with potatoes, cañiwa, beans, and barley to minimize losses.
Geerts et al. [4] developed a strategy to identify optimal agroclimatic areas for quinoa cultivation, considering factors such as evapotranspiration, rain season length, interseasonal severity droughts, and frost risks. This strategy requires a solid weather network with over a decade of data. Regarding the low temperature, Bois et al. [5] found that quinoa may experience delays in germination at temperature below 2° C, with a base temperature between -1,9 and 0,2 °C, and extreme temperature during flowering may affect significantly grain yield.
Hydric scenarios are crucial for understanding how water availability will impact quinoa cultivation in the Chilean Altiplano, a region characterized by its arid climate and strong reliance on rainfed agricultural systems. In the context of climate change, variability in precipitation and extreme events, such as droughts and heavy rainfall, are expected to affect water availability and, consequently, agricultural yields. Scenarios with limited water availability may reduce productivity, as quinoa, while resilient, requires a minimum level of moisture to achieve optimal yield [4]. Conversely, in situations with excessive rainfall, there is a risk that precipitation could lead to fungal diseases, negatively impacting grain quality [5].
Analyzing different hydric scenarios enables the identification of optimal conditions for quinoa cultivation, underscoring the importance of proper water management in rainfed systems. Implementing supplementary irrigation during critical periods of water deficit could enhance productivity, while techniques for sowing and rainwater harvesting and the use of more drought-tolerant quinoa varieties present viable alternatives to strengthen the adaptive capacity of farmers in the Chilean Altiplano [2].
The objective of this research was to quantify the effect of different hydric scenarios on quinoa yield.
2. Materials and Methods
2.1. Definition of the Study Site
The study was conducted in Ancovinto, a town or settlement located in the commune of Colchane, in the altiplano of Region of Tarapacá, Chile (Figure 1). This area, located at an average altitude of 3.750 m.a.s.l. [6], is characterised by its particular weather conditions, including a summer precipitation regime (December to April) with a rain average of 119 mm between the years 1976 and 2023 (Figure 2), and a daily thermal oscillation that varies between 26,4° C in summer (December to March) and 26,1 °C in winter (June to August)[7]
2.2. Vegetal Material
For the study, quinoa seeds were selected, the “Pandela” ecotype (Figure 3), they are typical of Chilean Altiplano, and they specifically adapted to the Tarapacá climate and edaphic conditions.
2.3. Climate Data
Climate data was obtained from HOBO meteorological station, U30 model, it was specifically installed for the Project “Impact of localized irrigation on the production of highland quinoa in Ancovinto, commune of Colchane, Region of Tarapacá”.
2.4. Climate Variables
In order to calculate the potential evapotranspiration (ET0) (See Table 1),the following climate variables were monthly registered, according to the methodology established by Allen et al.[8]: maximum and minimum temperature (°C), relative air humidity (%), wind velocity 2 meters above ground (m/s), sun radiation (W/m²) and precipitation (mm).
2.5. Experimental Design
The study was structured using a completely randomized block design (see Equation 1), selected to minimize experimental variations and to ensure that the differences observed in plant responses were attributable exclusively to the treatments applied.
In this experimental framework, quinoa seeds were planted at a density of 40 plants per square meter. Three irrigation treatments were applied, in addition to a treatment that corresponds to the ancestral management of quinoa cultivation in the Chilean altiplano (rainfed), which is based on the contribution of water from precipitations. These irrigation treatments were established with the purpose of evaluating their impact on the growth and development of quinoa in comparison with the control treatment. The model formula is presented below:

Table 2.
Irrigation treatments (percentage based on fully irrigated crop according to crop evapotranspiration).
Table 2.
Irrigation treatments (percentage based on fully irrigated crop according to crop evapotranspiration).
| Treatment | % ETc | Applied mm |
| T0 | rainfed | 127 = 127 L/m2 |
| T1 (control) | 100 | 576 = 576 L/m2 |
| T2 | 66,6 | 423 = 423 L/m2 |
| T3 | 33,3 | 275 = 275 L/m2 |
In order to evaluate the impact of irrigation treatments on crop development and productivity, a localized irrigation system was implemented, composed of 16mm polyethylene tubing with integrated self-compensating drippers delivering 2 L h⁻¹. For treatment T1 (100 % ETc), three dripper lines were installed per plot; for treatment T2 (66.6 % ETc), two dripper lines were installed per plot; and for treatment T3 (33.3 % ETc), a single dripper line was installed. In the case of T0 (rainfed), the plots did not have integrated dripper lines, depending exclusively on the natural summer precipitation at the study site.
2.6. Analysis of Physicochemical Parameters
A physicochemical analysis of the soil at the study site was carried out considering the parameters of structure, texture, organic matter (%) and volumetric moisture content (%) (Table 3).
2.8. Soil Moisture Measurement
Electromagnetic type moisture sensors, models GS1, GS3 and EC-5 of the METER brand, were installed to measure soil moisture at 30 cm depth in all treatments. The data collected were recorded in a METER datalogger model EM-50.
2.9. Normalized Difference Vegetation Index (NDVI) Measurement
Two METER model SRS-NDVI spectral reflectance sensors, connected to a METER model EM-50 datalogger, were installed to measure the normalized difference vegetation index (NDVI) during the growing season in the treatments with extreme water levels: T0 (dry land) and T1 (100% ETc).
2.9. Water Accounting and Productivity
A Woltmann type TECNIDRO volumetric meter with a measurement error of 2% was installed to measure the volume of water applied in the irrigation treatments, and water productivity was determined using the following expression:
where WUE = water use efficiency
2.10. Analysis of Agromorphological Parameters
Dry matter production in leaves, stem, and root was measured using the method described by Brahmakshatriya and Donker [10]. Leaf area index was determined using a METER ceptometer model ACCUPAR LP-80, and plant height was measured every 15 days, from the phenological stage of 4 true leaves until quinoa grain maturity.
Yield per hectare was calculated as a function of the number of grains per plant, planting density and area of the research site. The harvest index (HI) was determined using the Hühn [11]equation, which is described below:
3. Results and Discussion
3.1. Analysis of Climatic Variables in the Study Sites
The study was carried out in the ecological zone known as Altiplano (3500 m. a. s. l.), which is characterized by low rainfall and a wide thermal oscillation between day and night, with temperatures that fall below freezing during the night and strong winds during the day. During the winter (June to September), temperatures are extremely low, which makes farming in open fields impracticable [12].
During the period of the study, the maximum average temperature climbed to 19 °C, while the minimum average temperature fell to 3.5°C. The average relative humidity ranged from 28.9 % to 69.6 %, with average wind speeds of 2.2 m s-1. Average radiation of 260 W * m-2. During the investigation period, 2 days of precipitation were recorded in December (13.8 mm), 11 days in January (40.2 mm), 17 days in February (78.8 mm) and 3 days in March (8.2 mm), totaling 127 mm (see Figure 4).
3.2. Volumetric Water Content (VWC) of the Soil at the Research Location
Figure 5 shows the volumetric soil of water content (VWC) and rainfall (mm) over time for the different irrigation treatments in the quinoa cultivation. Precipitation peaks in early February is the highest with 62%, concentrating in early February, decreasing significantly in March and April. As for the VWCW, the rainfed treatment presents a considerably low VWC, starting around 10% and gradually decreasing to about 2% towards the end of the observation period belonging to maturity/senescence stage. The treatment of T3 (33% ETc) maintains an intermediate VWC, ranging between 10% and 15% throughout the period. For the T2 treatment (66% ETc), the VWC is higher than in T3, ranging between 15% and 20%. Finally, treatment T1 (100% ETc) shows a higher VWC than treatments T2 and T3, reaching maximum peaks of up to 25% and generally remaining above 20% for most of the time.
At the end of pasty grain stage, the crop coefficient (Kc) reduces to its final value, significantly lowering irrigation requirements. During the last week, irrigation was completely suspended, which explains the decrease in VWC across all irrigation treatments.
3.2. Dry matter Production of Leaf, Stem, Root, Leaf Area Index and Height of Quinoa Plants
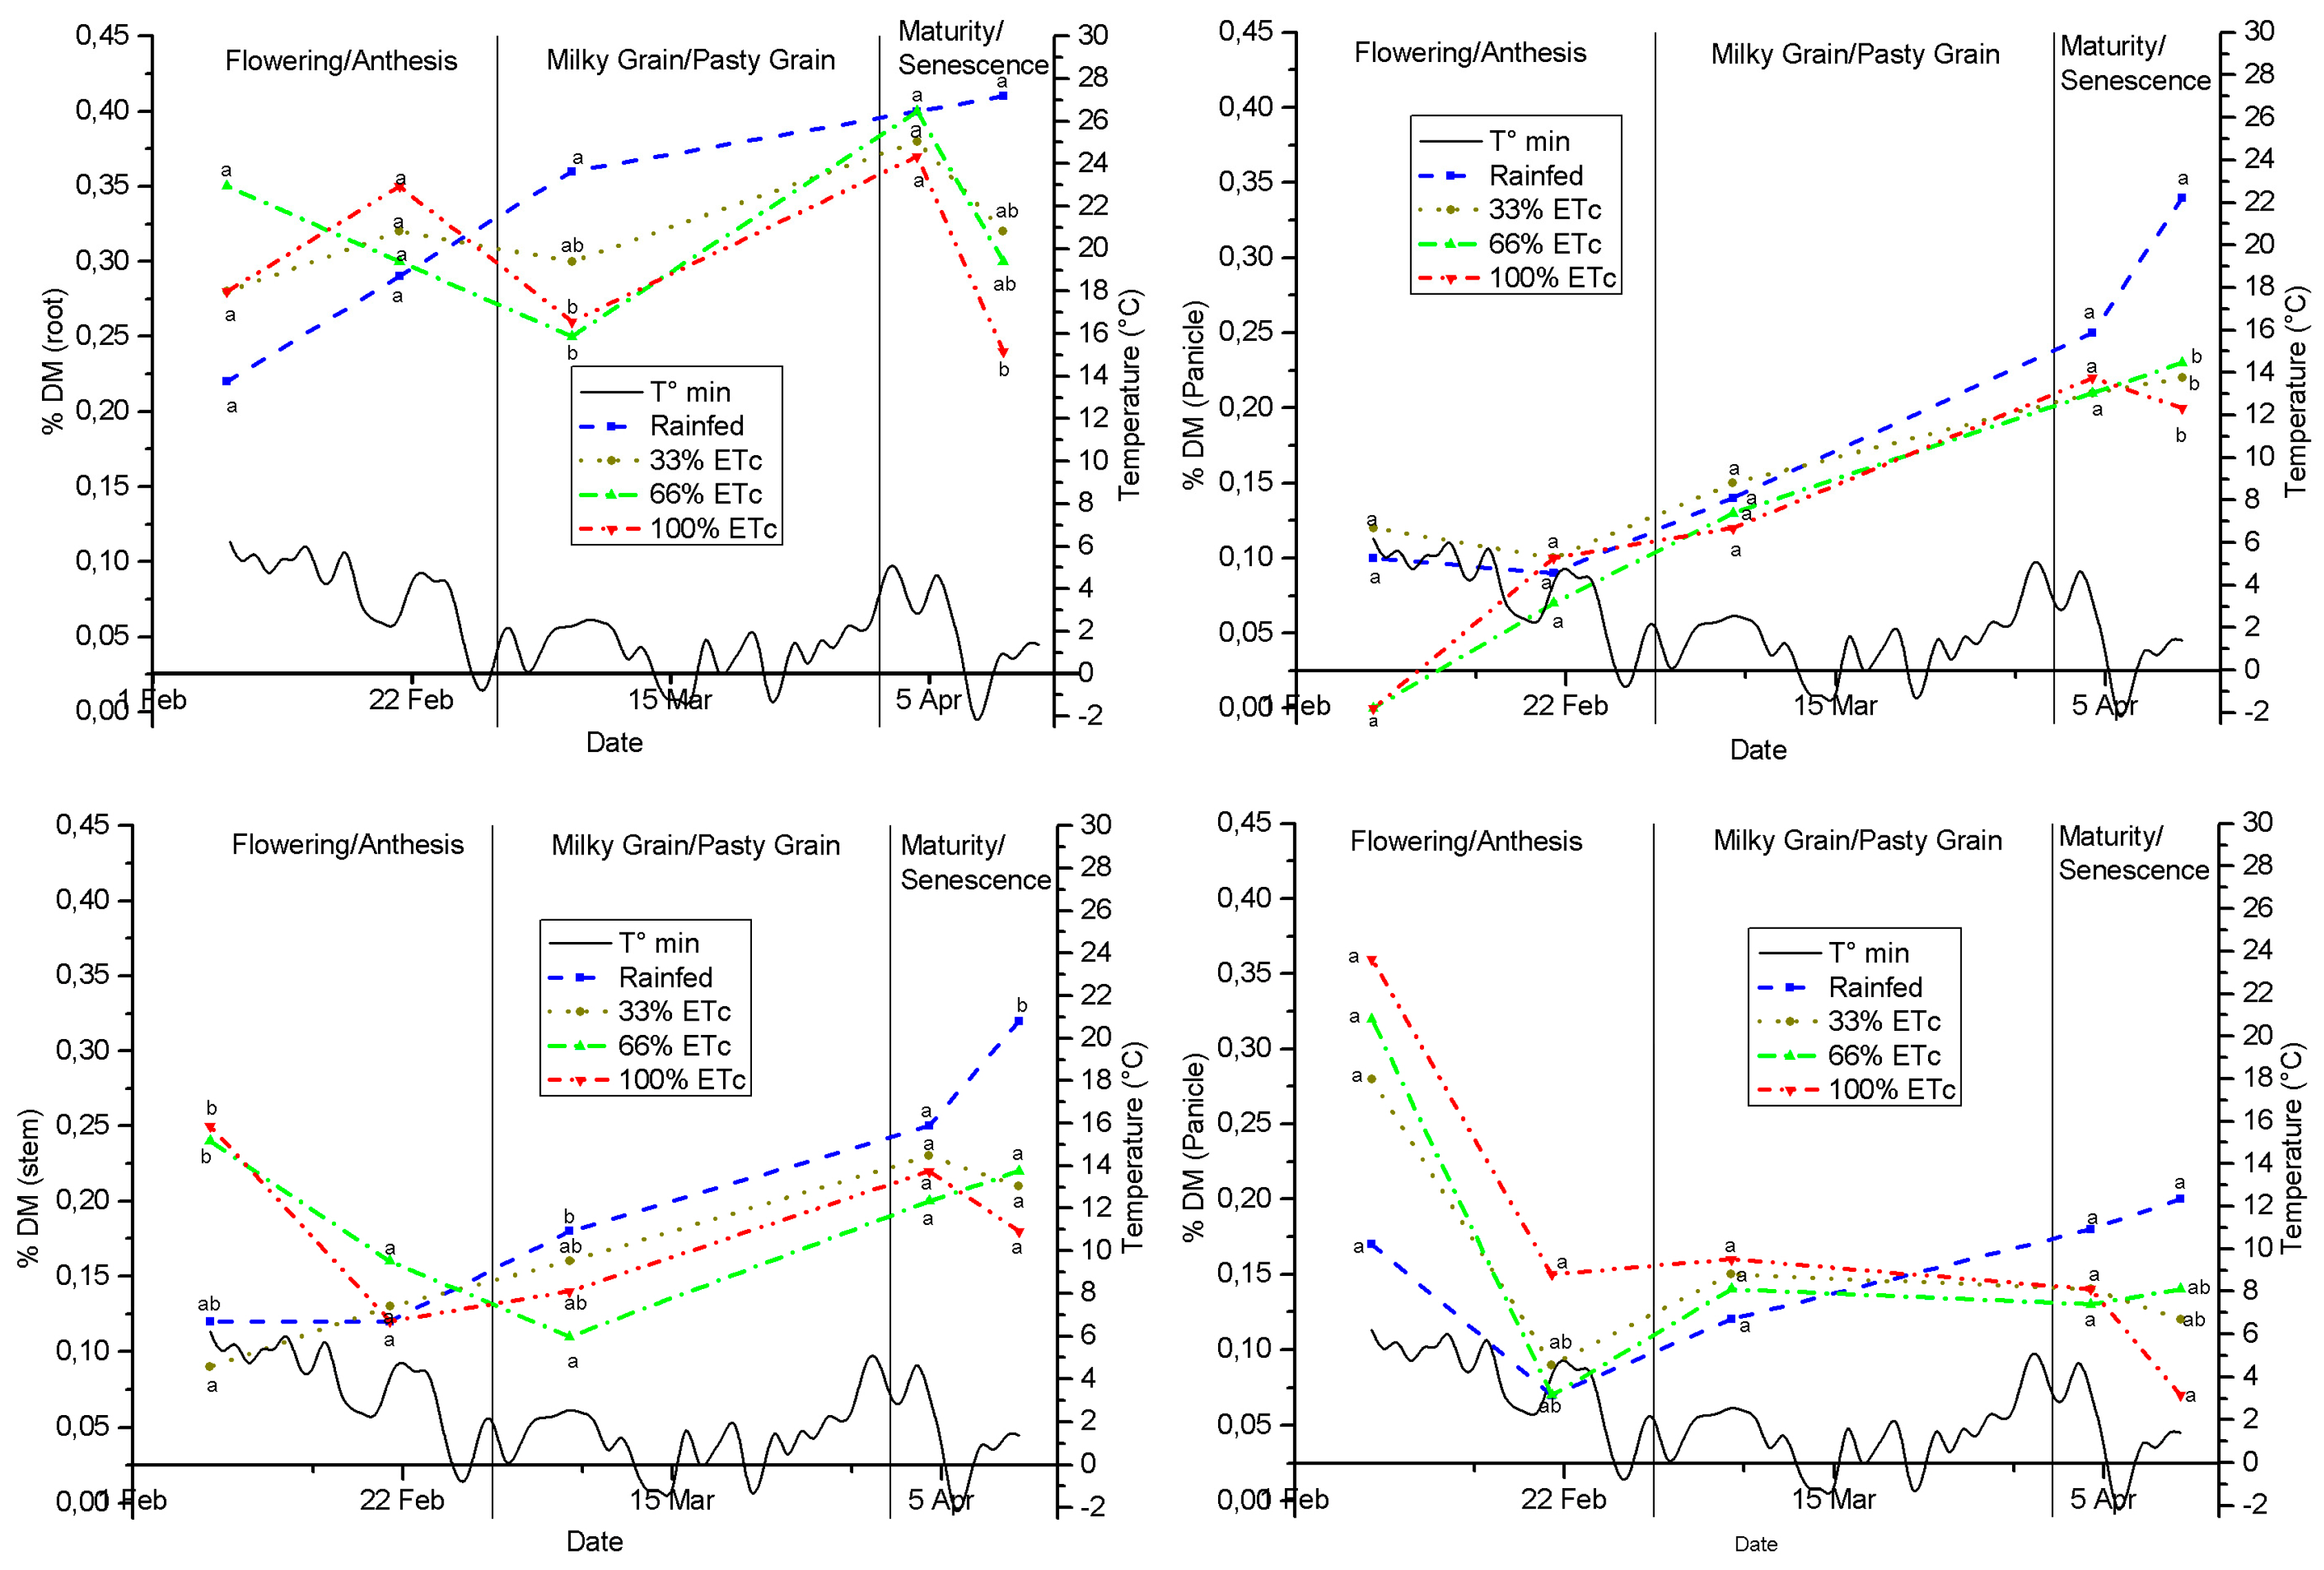
Figure 6 presents the dry matter (DM) production in roots, stem, leaves and panicle of the quinoa cultivation. At 42 days after sowing (DAS), corresponding to the flowering/anthesis phenological stage, the DM production in roots is higher in the T2 treatment (66% ETc) compared to the other treatments. Nevertheless, from 70 DAS, in the phenological stage of milky grain/pasty grain, the T0 treatment (rainfed) shows superior production of DM on roots until the end of the cultivation cycle. A similar behavior is observed in stem DM production, where treatments T1 (100% ETc) and T2 (66% ETc) outperform T3 (33% ETc) and T0 (rainfed) at 42 DAS, during the flowering/anthesis phase. However, at 70 DAS, at the milky grain/grain pasture stage, T0 (rainfed) exceeds the other treatments until the end of the cultivation cycle.
Regarding DM production in leaves, treatments T1 (100% ETc), T2 (66% ETc) and T3 (33% ETc) exceeded T0 (rainfed) at 42 DAS, during flowering/anthesis. Nevertheless, as well as DM production in root and stem, an increase in DM production in leaves was observed towards the end of the cultivation cycle, at 98 DAS, in the maturity/senescence phase, for the T0 (rainfed) treatment. DM production in panicle follows a similar pattern to the one observed for the other parameters, with higher production in treatments T0 (rainfed) and T3 (33% ETc) at 42 DAS, during flowering/anthesis. This behavior changes at the end of the cultivation cycle, where an increase in DM production is observed in the T0 treatment (rainfed) compared to the other treatments, at 98 DAS, corresponding to the phenological stage of maturity/senescence.
In terms of leaf DM, T1 (100% ETc), T2 (66% ETc) and T3 (33% ETc) are superior to T0 (rainfed) at 40 DAS, during flowering/anthesis. Just as in root and stem DM production at 98 DAS, at the maturity/senescence stage, an increase in leaf DM production was observed towards the end of the cultivation cycle for T0 (rainfed). DM production in panicle follows a pattern similar to the one observed for the other parameters, with higher production in the T0 (rainfed) and T3 (33% ETc) treatments at 40 DAS, during flowering/anthesis. This behavior changed at the end of the cultivation cycle, where an increase in DM production was observed in T0 (rainfed) compared to the other treatments, at 98 DAS, corresponding to the phenological stage of maturity/senescence.
During the grain filling/pasty grain stage, a total of 9 frost days were recorded. This observation suggests the hypothesis that the application of watering in irrigation treatments could reduce the hardiness and flexibility of quinoa plants, making them more susceptible to damage by low temperatures, as reported by Olave et al. [13]. In their study, conducted in the 2017-2018 season with a white quinoa ecotype and supplemental irrigation, they reported that plants grown under rainfed conditions (ancestral management) produced higher biomass and grains per plant compared to those that received supplemental irrigation, although no significant difference in grain diameter was found. Similarly, Jacobsen et al. [14] concluded that higher leaf water content may increase susceptibility to freezing damage compared to those with lower water content. In research developed by Hirich et al. [15] in Morocco, carried out from November 1 (autumn) to March 15 (winter), the results showed that there were no differences in dry matter (DM) production when water stress was applied to the quinoa cultivation at different phenological stages, even when it was irrigated at 100% of the water demand. This shows the remarkable plasticity of quinoa to water stress, demonstrating its ability to supercool and avoid ice formation at low temperatures, which is directly related to tissue water content.
However, Jacobsen et al. [16] point out that a high-water content may limit this capacity, increasing the risk of damage by freezing. In the same line, Cocozza et al. [17] describe that quinoa plants with a higher water content presented a lower capacity for osmotic adjustment, which may increase their vulnerability to the cold, given that osmotic adjustment is crucial for protection against low temperature damage.
Figure 6.
Percentage of leaf, stem, root and panicle dry matter in quinoa cultivations under different irrigation regimes. Means with a common letter are not significantly different (p > 0.05).
Figure 6.
Percentage of leaf, stem, root and panicle dry matter in quinoa cultivations under different irrigation regimes. Means with a common letter are not significantly different (p > 0.05).
For the analysis of the leaf area index (LAI) of the quinoa cultivation, the Friedman multiparametric test was used to normalize the values obtained in the four measurement dates. Figure 7 shows that, in the flowering/anthesis phase, treatments T0 (rainfed) and T3 (33.33% ETc) have a higher LAI compared to T1 (100% ETc) and T2 (66.66% ETc). In March, a decrease in LAI of T0 (rainfed), attributable to the occurrence of a frost, thereafter, reaching its maximum value. During the milky grain/pasty grain phase, the LAI of T0 (rainfed) doubles in relation to the irrigated treatments. In March, a decrease in T0 (rainfed) LAI is observed, mainly due to the occurrence of a frost, reaching its maximum value in this period. In the maturity/senescence phase, T0 (rainfed) doubles in relation to the irrigated treatments. Then, in late March, at maturity/senesce phase, the LAI of T0 (rainfed) decreases, without showing statistical differences with the irrigation treatments (Figure 7).
These results indicate that the quinoa cultivation is highly adapted to the adverse water conditions of the Altiplano, which is comparable with the research conducted by Hirich et al. [18], where plants subjected to water stress in the vegetative phase showed a higher LAI and a higher LAI of T0 (rainfed) than plants exposed to water stress in the vegetative phase.
3.3. Plant Height
The quinoa plants of the dry treatment (T0) reached a height of 33 cm at harvest, which represents 37% more than the watered treatments, which recorded an average height 11 cm less than T0, as shown in Figure 8. This response is consistent with the results obtained in dry biomass production and the LAI in the treatments evaluated.
It is important to mention that during the whole trial the quinoa cultivation did not receive fertilizer inputs at any stage of the plant’s development cycle, as shown in Table 3, the organic matter in the soil was very low, with a concentration of less than 2% (normal value), which could explain the low average height in all treatments. In addition, Xie et al. [19] determined that low temperatures significantly reduce growth, particularly in shoot height and biomass accumulation. These environmental conditions also promote greater accumulation of soluble sugars in the plants and cause changes in the metabolic pathways to cope with cold stress.
In this study, it was found that plant height in the rainfed treatment (T0) during all phenological phases of quinoa was greater than the irrigation treatments, associated with the hardiness and plasticity of the plants, showing statistically significant differences (Figure 8). This is likely related to the lower soil moisture content. The plants can withstand low low temperatures due to various adjustment mechanisms associated with reduced stomatal conductance and photosynthetic adjustment, which help maintain a positive water balance, thereby preserving turgor and resistance to cold [16,20]. These factors can also produce changes in quinoa gene expression, increasing the production of soluble acids and sugars such as sucrose, which contributes to osmoregulation and maintenance of reactive oxygen species (ROS) homeostasis [19].
3.4. Harvest Index (HI) and Production
The highest harvest index (HI) was recorded in the rainfed treatment (T0) with a value of 0.39, while the treatment with 33% ETc (T3) presented the lowest HI, with a value of 0.23. In the same way, the statistical differences between the four treatments are not significant (Figure 9).
These results are similar to those obtained by Rodriguez et al. [21], where irrigation close to 100% of ETc and plant densities between 4 and 100 plants per m2 resulted in an HI between 0.2 and 0.5.
Quinoa grain production of the Pandela ecotype in the locality of Ancovinto, for the evaluated treatments, varied between 1.62 Mg ha-¹ in the rainfed treatment and 0.09 Mg ha-¹ in the treatment with 66% ETc (Figure 10). Fuentes F. et al.[22] mentioned that the productions obtained for the Pandela ecotype in Ancovinto (Highland of Colchane) under rainfed conditions are between 1.5 and 1.8 Mg ha-¹, which is similar to the results obtained in this study.
A plausible explanation as to why quinoa plants grown in a rainfed production system show higher production or productivity compared to plants subjected to irrigation treatments can be found in the study by Pathan et al. [23]. This author points out that quinoa, under drought conditions, can develop a more extensive root system and improve its water use efficiency, features that are beneficial for its survival under water and cold stress conditions. These adaptations allow the plant to increase its tolerance to cold by maintaining cell function and integrity during temperatures below 0 °C.
3.5. Normalized Difference Vegetation Index (NDVI)
The T0 treatment (rainfed) reached a maximum NDVI value of 0.18 during the flowering/anthesis phenological phase, higher than the one recorded by T1 (100% ETc), whose specific value is shown in Figure 11. This phenomenon has been observed in other studies; for example, Hinojosa et al. [24] reported that, under water stress conditions, quinoa plants maintain a higher physiological activity, resulting in higher NDVI values. However, in the maturity/senescence phase, T1 (100% ETc) reached a value of 0.17, while T0 (rainfed) recorded a lower value of 0.13.
During all phenological phases, except at maturity/senescence, the Pandela ecotype plants grown under rainfed system (T0) presented higher consistent NDVI index. This pattern is consistent with the results obtained for other growth and development parameters analyzed.
3.6. Water Use Efficiency (WUE)
For the water use efficiency (WUE) parameters, the rainfed treatment (T0) showed a value of 1.27 kg/m³, significantly higher than the irrigated treatments. Treatments T1 (100% ETc), T2 (66% ETc) and T3 (33% ETc) showed a significantly lower WUE, with values of 0.08 kg/m³, 0.04 kg/m³ and 0.1 kg/m³ respectively, with no significant differences among them. This indicates that water is used more efficiently in quinoa cultivation when water resources are scarce, while different irrigation levels do not significantly improve the WUE.
This finding is coherent with that reported by Geerts et al. [25], who indicate that deficit irrigation is only effective when at least 55% of basic water requirements are met, demonstrating that quinoa can maintain acceptable water use efficiency under deficit irrigation conditions, albeit with lower performance. Similarly, Gehan et al. [26] mention in their study that WUE in quinoa increases significantly with reduced irrigation, suggesting that moderate irrigation (80% ad 60% of ETc) may be more efficient in terms of water use (Figure 12).
4. Conclusions
In this research, the cultivation of quinoa was evaluated by comparing traditional management (rainfed) based on utilizing soil moisture which reached a maximum VWC of 13% during the phenological stage of flowering and anthesis due to contributions from summer rains int the Ancovinto highlands, with three treatments where additional water was provided through irrigation at 100%, 66%, and 33% of ETc. During the same phenological stage, soil reached VWC levels of 25%, 22.5% and 20%, respectively.
The results show that quinoa plants under traditional management (rainfed) exhibited the best response in measured variables of growth, development, and production, leading to higher production and harvest indices, as well as greater WUE, equivalent to 15.87 and 12.7 times those of the treatments at 100% and 33% of ETc. Throughout the quinoa crop cycle, from January to April, the average minimum temperature was 3,9°C. the quinoa plants under traditional management (rainfed) demonstrated greater tolerance to these adverse atmospheric conditions compared to irrigated plants, which, despite having better water conditions, showed increased sensitivity to these conditions.
Consequently, quinoa plants under traditional management showed better adaptation to adverse temperature and soil moisture conditions in the Chilean highlands, displaying greater adaptability and plasticity compared to plants that received additional water through irrigation. The results of this research are nor directly applicable to quinoa cultivation in other ecological zones, as they must be evaluated accordingly. In case of the Chilean highlands, it is essential to determine the interaction between soil water content and average minimum temperatures during the crop cycle, as well as the potential impact of increasing organic matter inputs to support soil moisture retention, provide nutrients, and mitigate the presence of salts and metalloids.
Funding
This research was partially funded by Agencia Nacional de Investigación y Desarrollo (ANID, Chile) grant Fondecyt 11090020 to MFL, Instituto Antártico Chileno (INACH) RT_08-18 grant to MFL and MIC, ANID-STINT PCI Chile-Suecia CS2018-7929 grant to MIC and MFL, and project RED21992 Sistema articulado de investigación en cambio climático y sustentabilidad de zonas costeras de Chile.
Conflicts of Interest
The authors declare no conflicts of interest.
References
- Valdivia, C.; Thibeault, J.; Gilles, J.L.; García, M.; Seth, A. Climate trends and projections for the Andean Altiplano and strategies for adaptation. Adv. Geosci. 2013, 33, 66–77. [Google Scholar] [CrossRef]
- Olivera, E.B. Impacto económico del cambio climático en cultivo de quinua ( chenopodium quinoa willd ) orgánica en la región del Altiplano : un enfoque Ricardiano Impact economic of climate change on crop of organic quinua in the Altiplano Region : a Richardian approac. 2021, 23, 236–243. [CrossRef]
- Aguilar, P.C.; Jacobsen, S. Cultivation of Quinoa on the Peruvian Altiplano Cultivation of Quinoa on the Peruvian Altiplano. 2006, 37–41. [CrossRef]
- Geerts, S.; Raes, D.; Garcia, M.; Del Castillo, C.; Buytaert, W. Agro-climatic suitability mapping for crop production in the Bolivian Altiplano: A case study for quinoa. Agric. For. Meteorol. 2006, 139, 399–412. [Google Scholar] [CrossRef]
- Bois, J.F.; Winkel, T.; Lhomme, J.P.; Raffaillac, J.P.; Rocheteau, A. Response of some Andean cultivars of quinoa (Chenopodium quinoa Willd.) to temperature: Effects on germination, phenology, growth and freezing. Eur. J. Agron. 2006, 25, 299–308. [Google Scholar] [CrossRef]
- Instituto Nacional de Estadisticas (INE) Censo. Gob. Chile 2002, 4–9.
- CIDERH Observatorio del Agua.
- Allen, R.G.; Pereira, L.; Raes, D.; Smith, M. Crop evapotranspiration-Guidelines for computing crop water requirements-FAO Irrigation and drainage paper 56. 1998, 56, 323.
- Choquecallata, J.; Valcher, J.; Fellmann, T.; Imaña, E. Evapotranspiración Maxima del Cultivo de la Quinua por Lisimetría y su relación con la Evapotraspiración Potencial en el Altiplano Boliviano. In Proceedings of the Congreso Internacional sobre Cultivos Andinos; Morales, D., Vacher, J., Eds.; La Paz, Bolivia, 1991; pp. 63–67.
- Brahmakshatriya, R.D.; Donker, J.D. Five Methods for Determination of Silage Dry Matter. J. Dairy Sci. 1971, 54, 1470–1474. [Google Scholar] [CrossRef]
- Hühn, M. Comments on the Calculation of Mean Harvest Indices. J. Agron. Crop Sci. 1990, 165, 86–93. [Google Scholar] [CrossRef]
- Sarricolea Espinoza, P.; Romero Aravena, H. Variabilidad y cambios climáticos observados y esperados en el Altiplano del norte de Chile. Rev. Geogr. Norte Gd. 2015, 169–183. [Google Scholar] [CrossRef]
- Olave, J.; Sanchez-Monje, M.; Aguilera, J.; Araya, P. Riego Suplementario del Cultivo de la Quinua en el Altiplano de la Región la de Tarapacá; UNAP – Uni.; Iquique, 2019; ISBN 978 956 302 110 - 3.
- Jacobsen, S.; Monteros, C..; Christiansen, J.; Bravo, L.; Corcuera, L.; Mujica, Á. Plant responses of quinoa (Chenopodium quinoa Willd.) to frost at various phenological stages. Eur. J. Agron. 2004, 22, 131–139. [CrossRef]
- Hirich, A. Effects of Deficit Irrigation using Treated Wastewater and Irrigation with Saline Water on Legumes, Corn and Quinoa Crops. Res. Unit Hortic. Prod. 2017, 1, 70. [Google Scholar] [CrossRef]
- Jacobsen, S.E.; Monteros, C.; Corcuera, L.J.; Bravo, L.A.; Christiansen, J.L.; Mujica, A. Frost resistance mechanisms in quinoa (Chenopodium quinoa Willd.). Eur. J. Agron. 2007, 26, 471–475. [Google Scholar] [CrossRef]
- Cocozza, C.; Pulvento, C.; Lavini, A.; Riccardi, M.; D’andria, R.; Tognetti, R. Effects of Increasing Salinity Stress and Decreasing Water Availability on Ecophysiological Traits of Quinoa (Chenopodium quinoa Willd.) Grown in a Mediterranean-Type Agroecosystem. J. Agron. Crop Sci. 2013, 199, 229–240. [Google Scholar] [CrossRef]
- Kaoutar, F.; Abdelaziz, H.; Ouafae, B.; Redouane, C.A.; Ragab, R. Yield and Dry Matter Simulation Using the Saltmed Model for Five Quinoa (Chenopodium Quinoa) Accessions Under Deficit Irrigation in South Morocco. Irrig. Drain. 2017, 66, 340–350. [Google Scholar] [CrossRef]
- Xie, H.; Wang, Q.; Zhang, P.; Zhang, X.; Huang, T.; Guo, Y.; Liu, J.; Li, L.; Li, H.; Qin, P. Transcriptomic and Metabolomic Analysis of the Response of Quinoa Seedlings to Low Temperatures. Biomolecules 2022, 12. [Google Scholar] [CrossRef] [PubMed]
- Jensen, C.; Jacobsen, S.-E.; Andersen, M..; Núñez, N.; Andersen, S..; Rasmussen, L.; Mogensen, V. Leaf gas exchange and water relation characteristics of field quinoa (Chenopodium quinoa Willd.) during soil drying. Eur. J. Agron. 2000, 13, 11–25. [Google Scholar] [CrossRef]
- Rodriguez, J.P.; Ono, E.; Abdullah, A.M.S.; Choukr-Allah, R.; Abdelaziz, H. Cultivation of Quinoa (Chenopodium quinoa) in Desert Ecoregion. 2020, 145–161. [CrossRef]
- Fuentes, F.; Maughan, P.; Jellen, E.R. Diversidad genetica y recursos geneticos para el mejoramiento de la quinoa (Chenopodium quinoa Willd.) (Genetic diversity and genetic resources for quinoa breeding). Rev. Geográfica Valparaíso 2009, 42, 20–33. [Google Scholar]
- Pathan, S.; Ndunguru, G.; Clark, K.; Ayele, A.G. Yield and nutritional responses of quinoa (Chenopodium quinoa Willd.) genotypes to irrigated, rainfed, and drought-stress environments. Front. Sustain. Food Syst. 2023, 7, 1–11. [Google Scholar] [CrossRef]
- Hinojosa, L.; Kumar, N.; Gill, K.S.; Murphy, K.M. Spectral reflectance indices and physiological parameters in Quinoa under contrasting irrigation regimes. Crop Sci. 2019, 59, 1927–1944. [Google Scholar] [CrossRef]
- Geerts, S.; Raes, D.; Garcia, M.; Vacher, J.; Mamani, R.; Mendoza, J.; Huanca, R.; Morales, B.; Miranda, R.; Cusicanqui, J.; et al. Introducing deficit irrigation to stabilize yields of quinoa (Chenopodium quinoa Willd.). Eur. J. Agron. 2008, 28, 427–436. [Google Scholar] [CrossRef]
- Gehan, G.; Abdel-Ghany-Nagdy, H. Impact of Soil Heat Flux on Water Use of Quinoa. Ann. Agric. Sci. Moshtohor 2019, 57, 1025–1034. [Google Scholar]
Figure 1.
Research Site location in Anconvinto, Commune of Colchane, Region of Tarapaca, Chile.
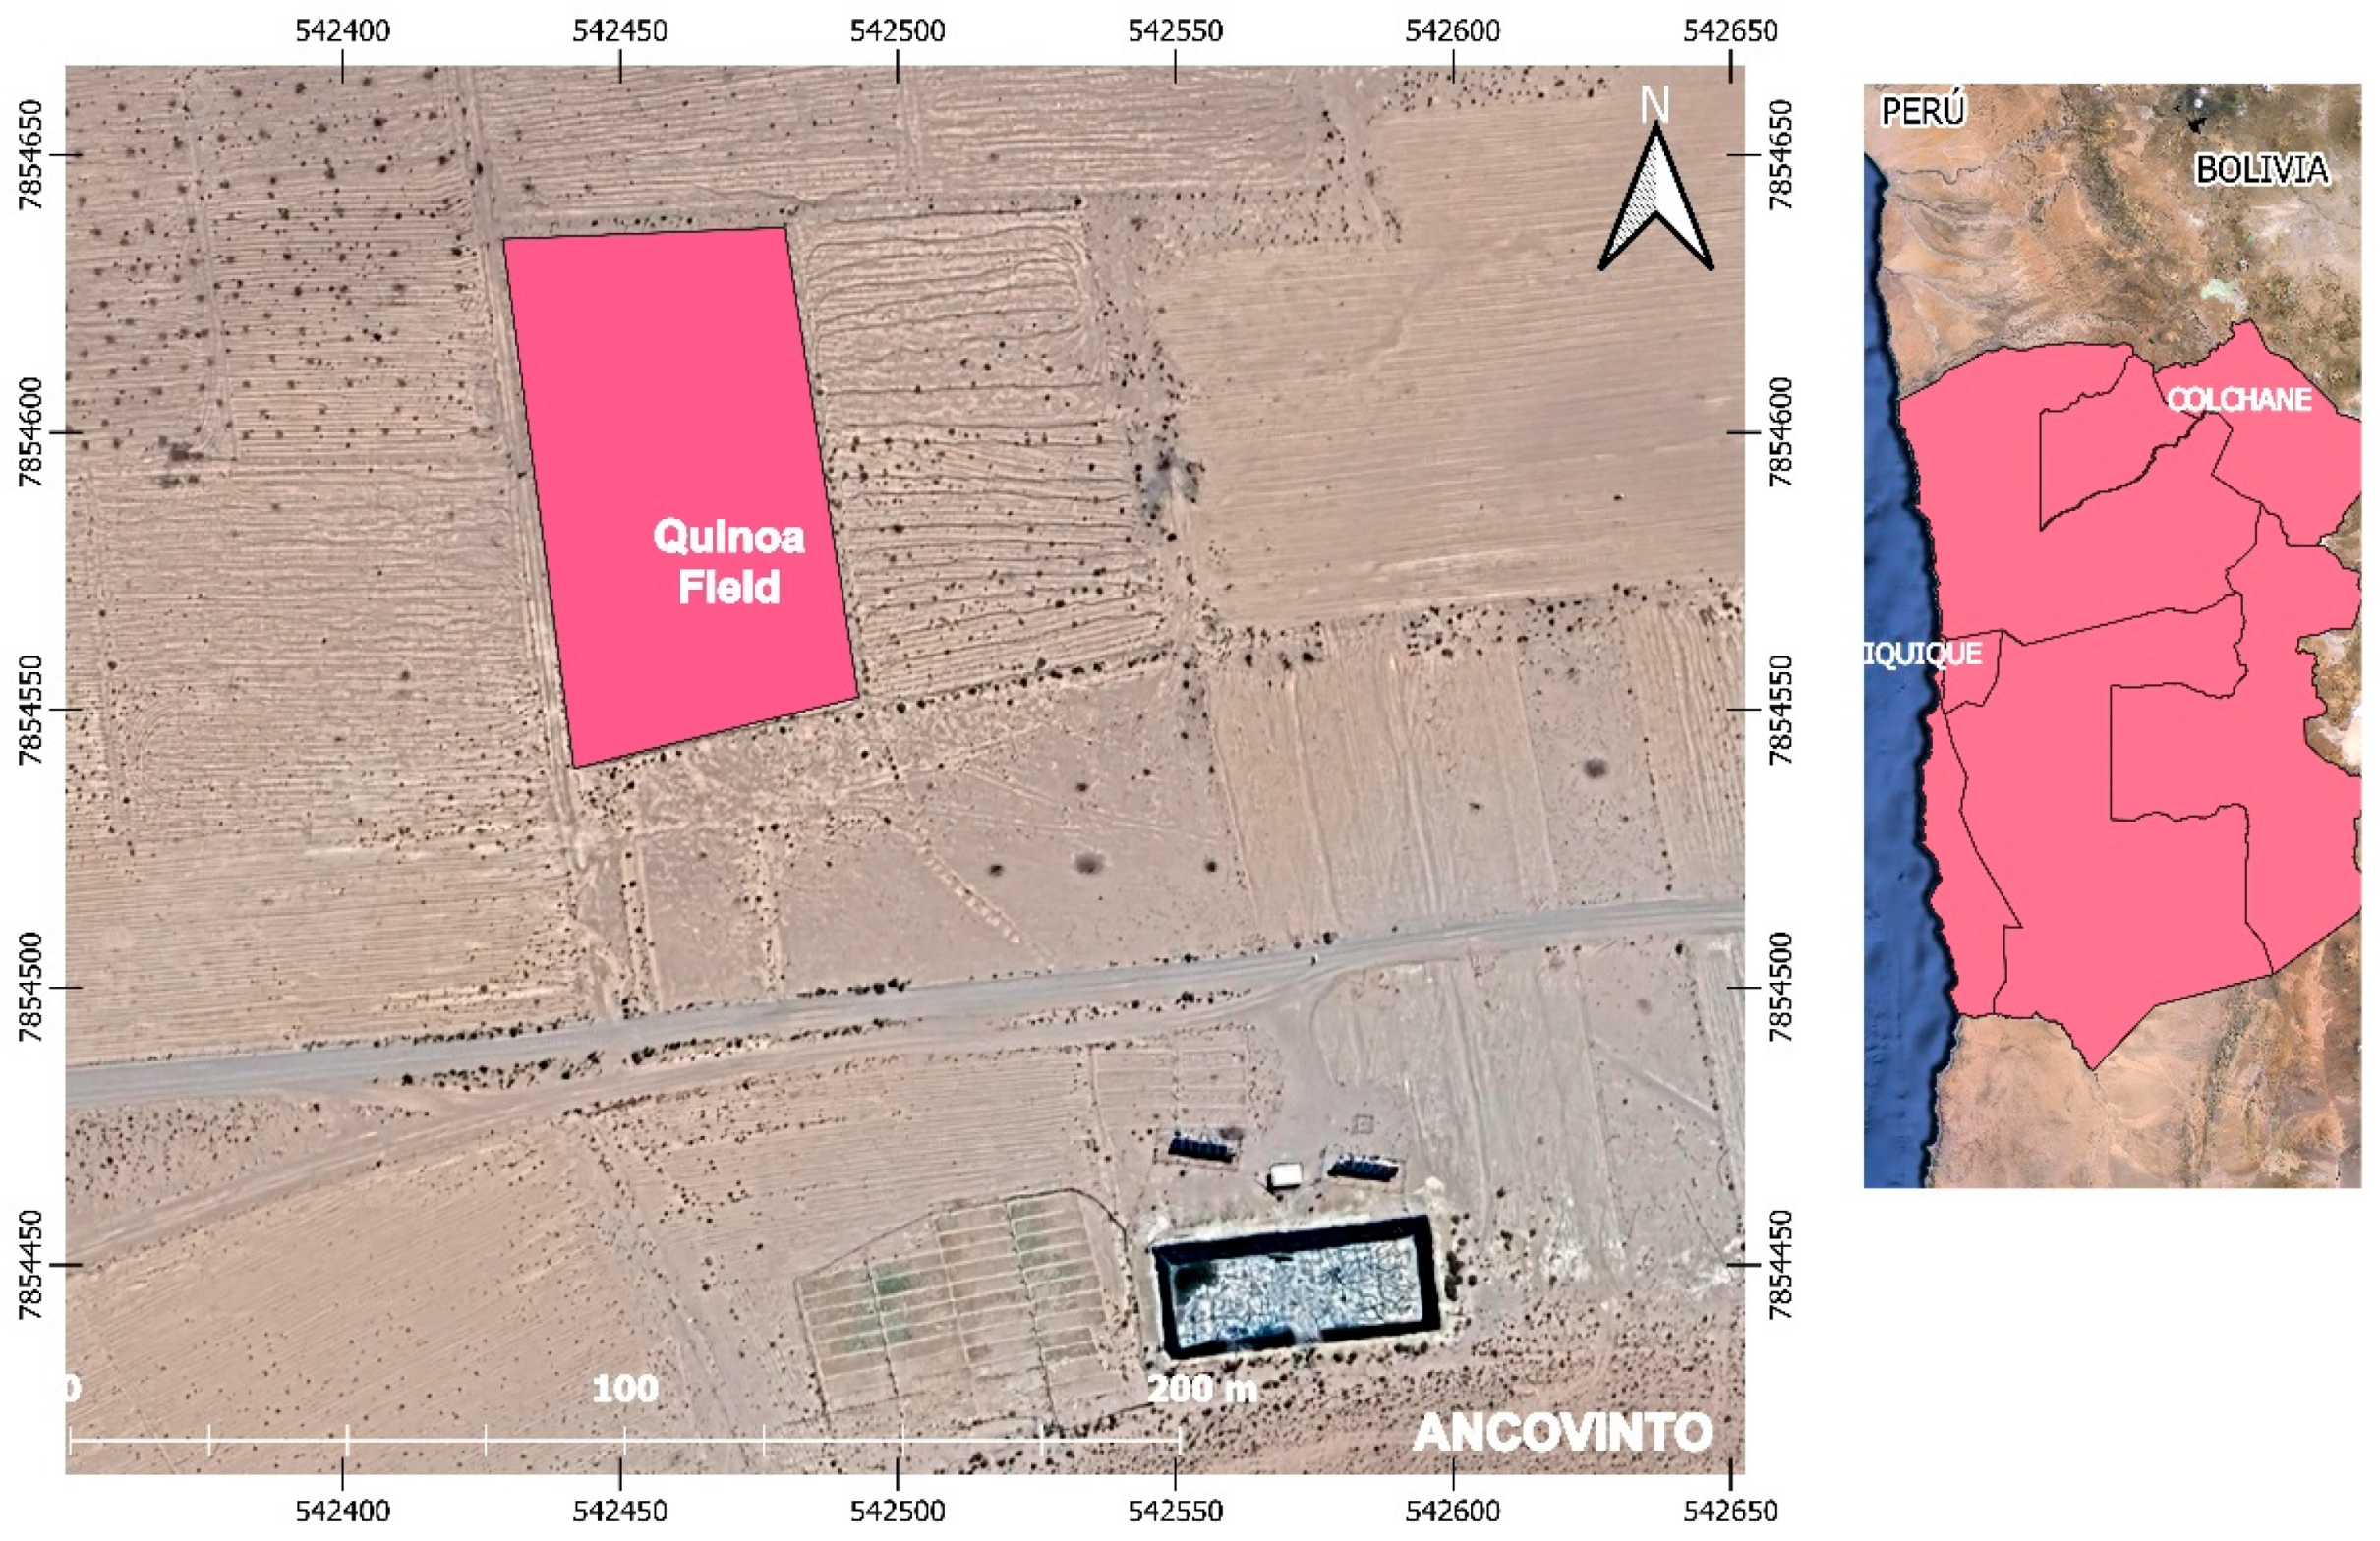
Figure 2.
Yearly precipitation in the Commune of Colchane. Own elaboration based on Dirección General de Agua data (DGA Chile).
Figure 2.
Yearly precipitation in the Commune of Colchane. Own elaboration based on Dirección General de Agua data (DGA Chile).
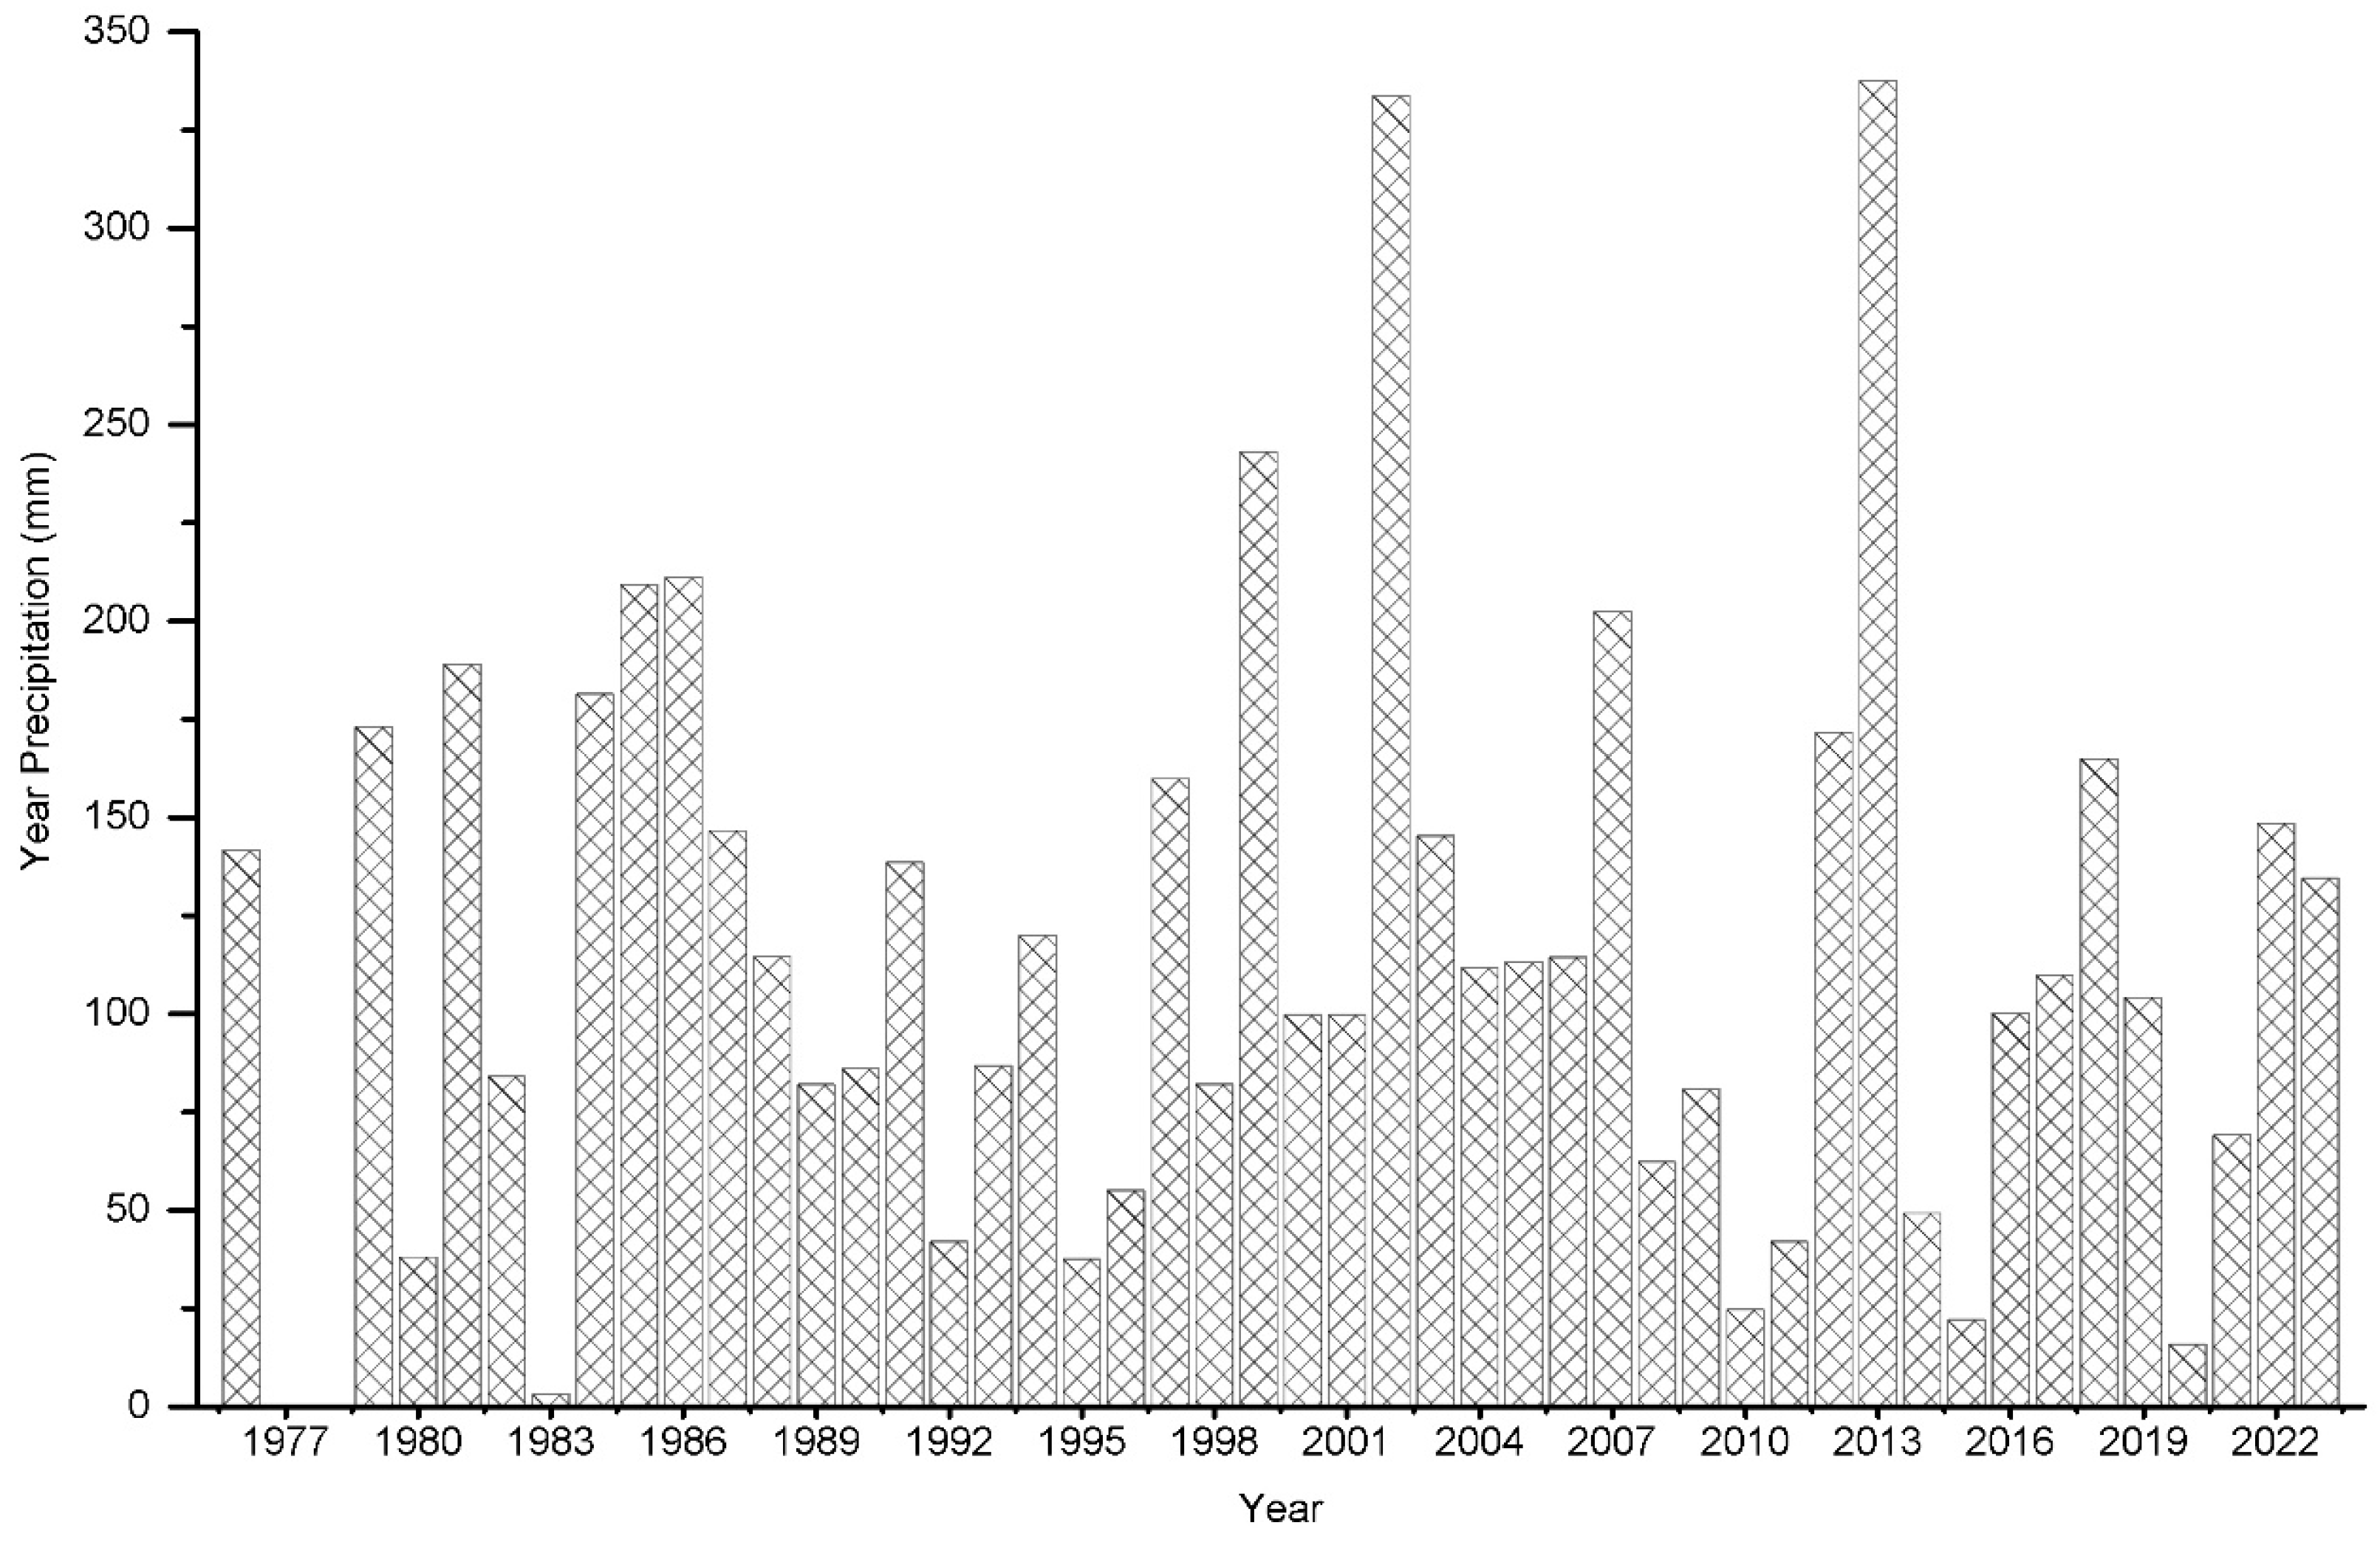
Figure 3.
Quinoa seeds “Pandela” ecotype, Ancovinto. Chile.
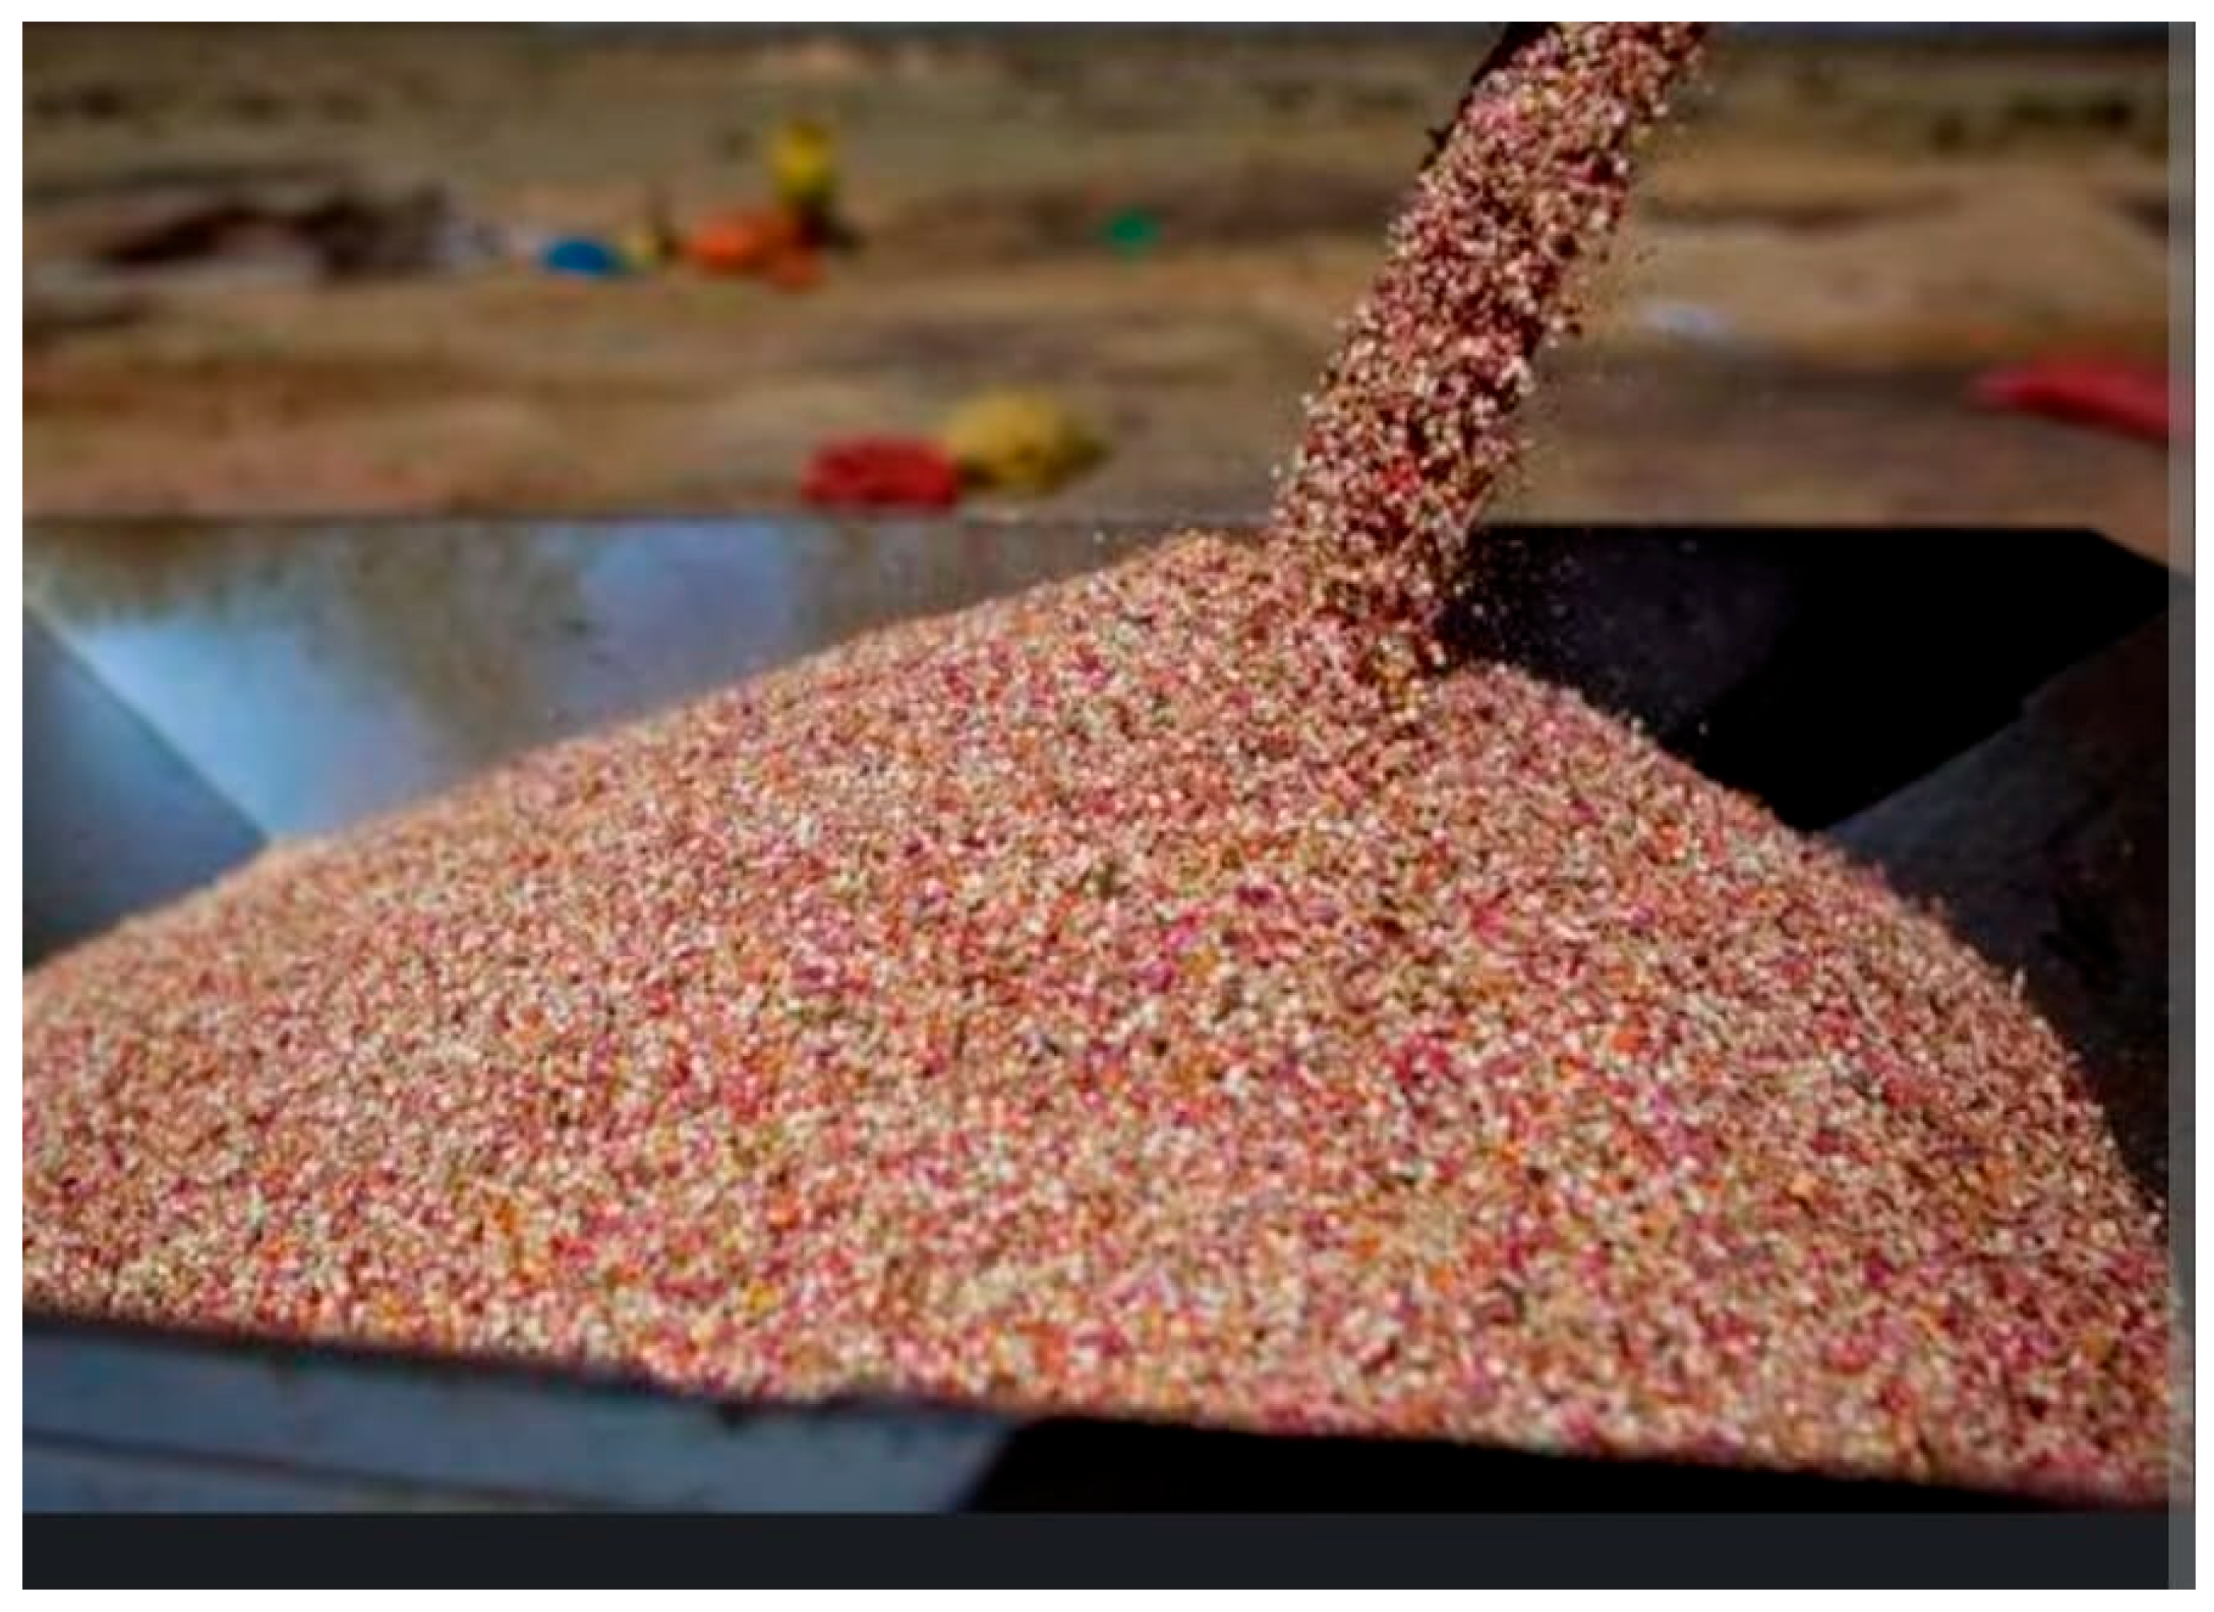
Figure 4.
Climatic variables in the Altiplano of the Region of Tarapacá during the study.
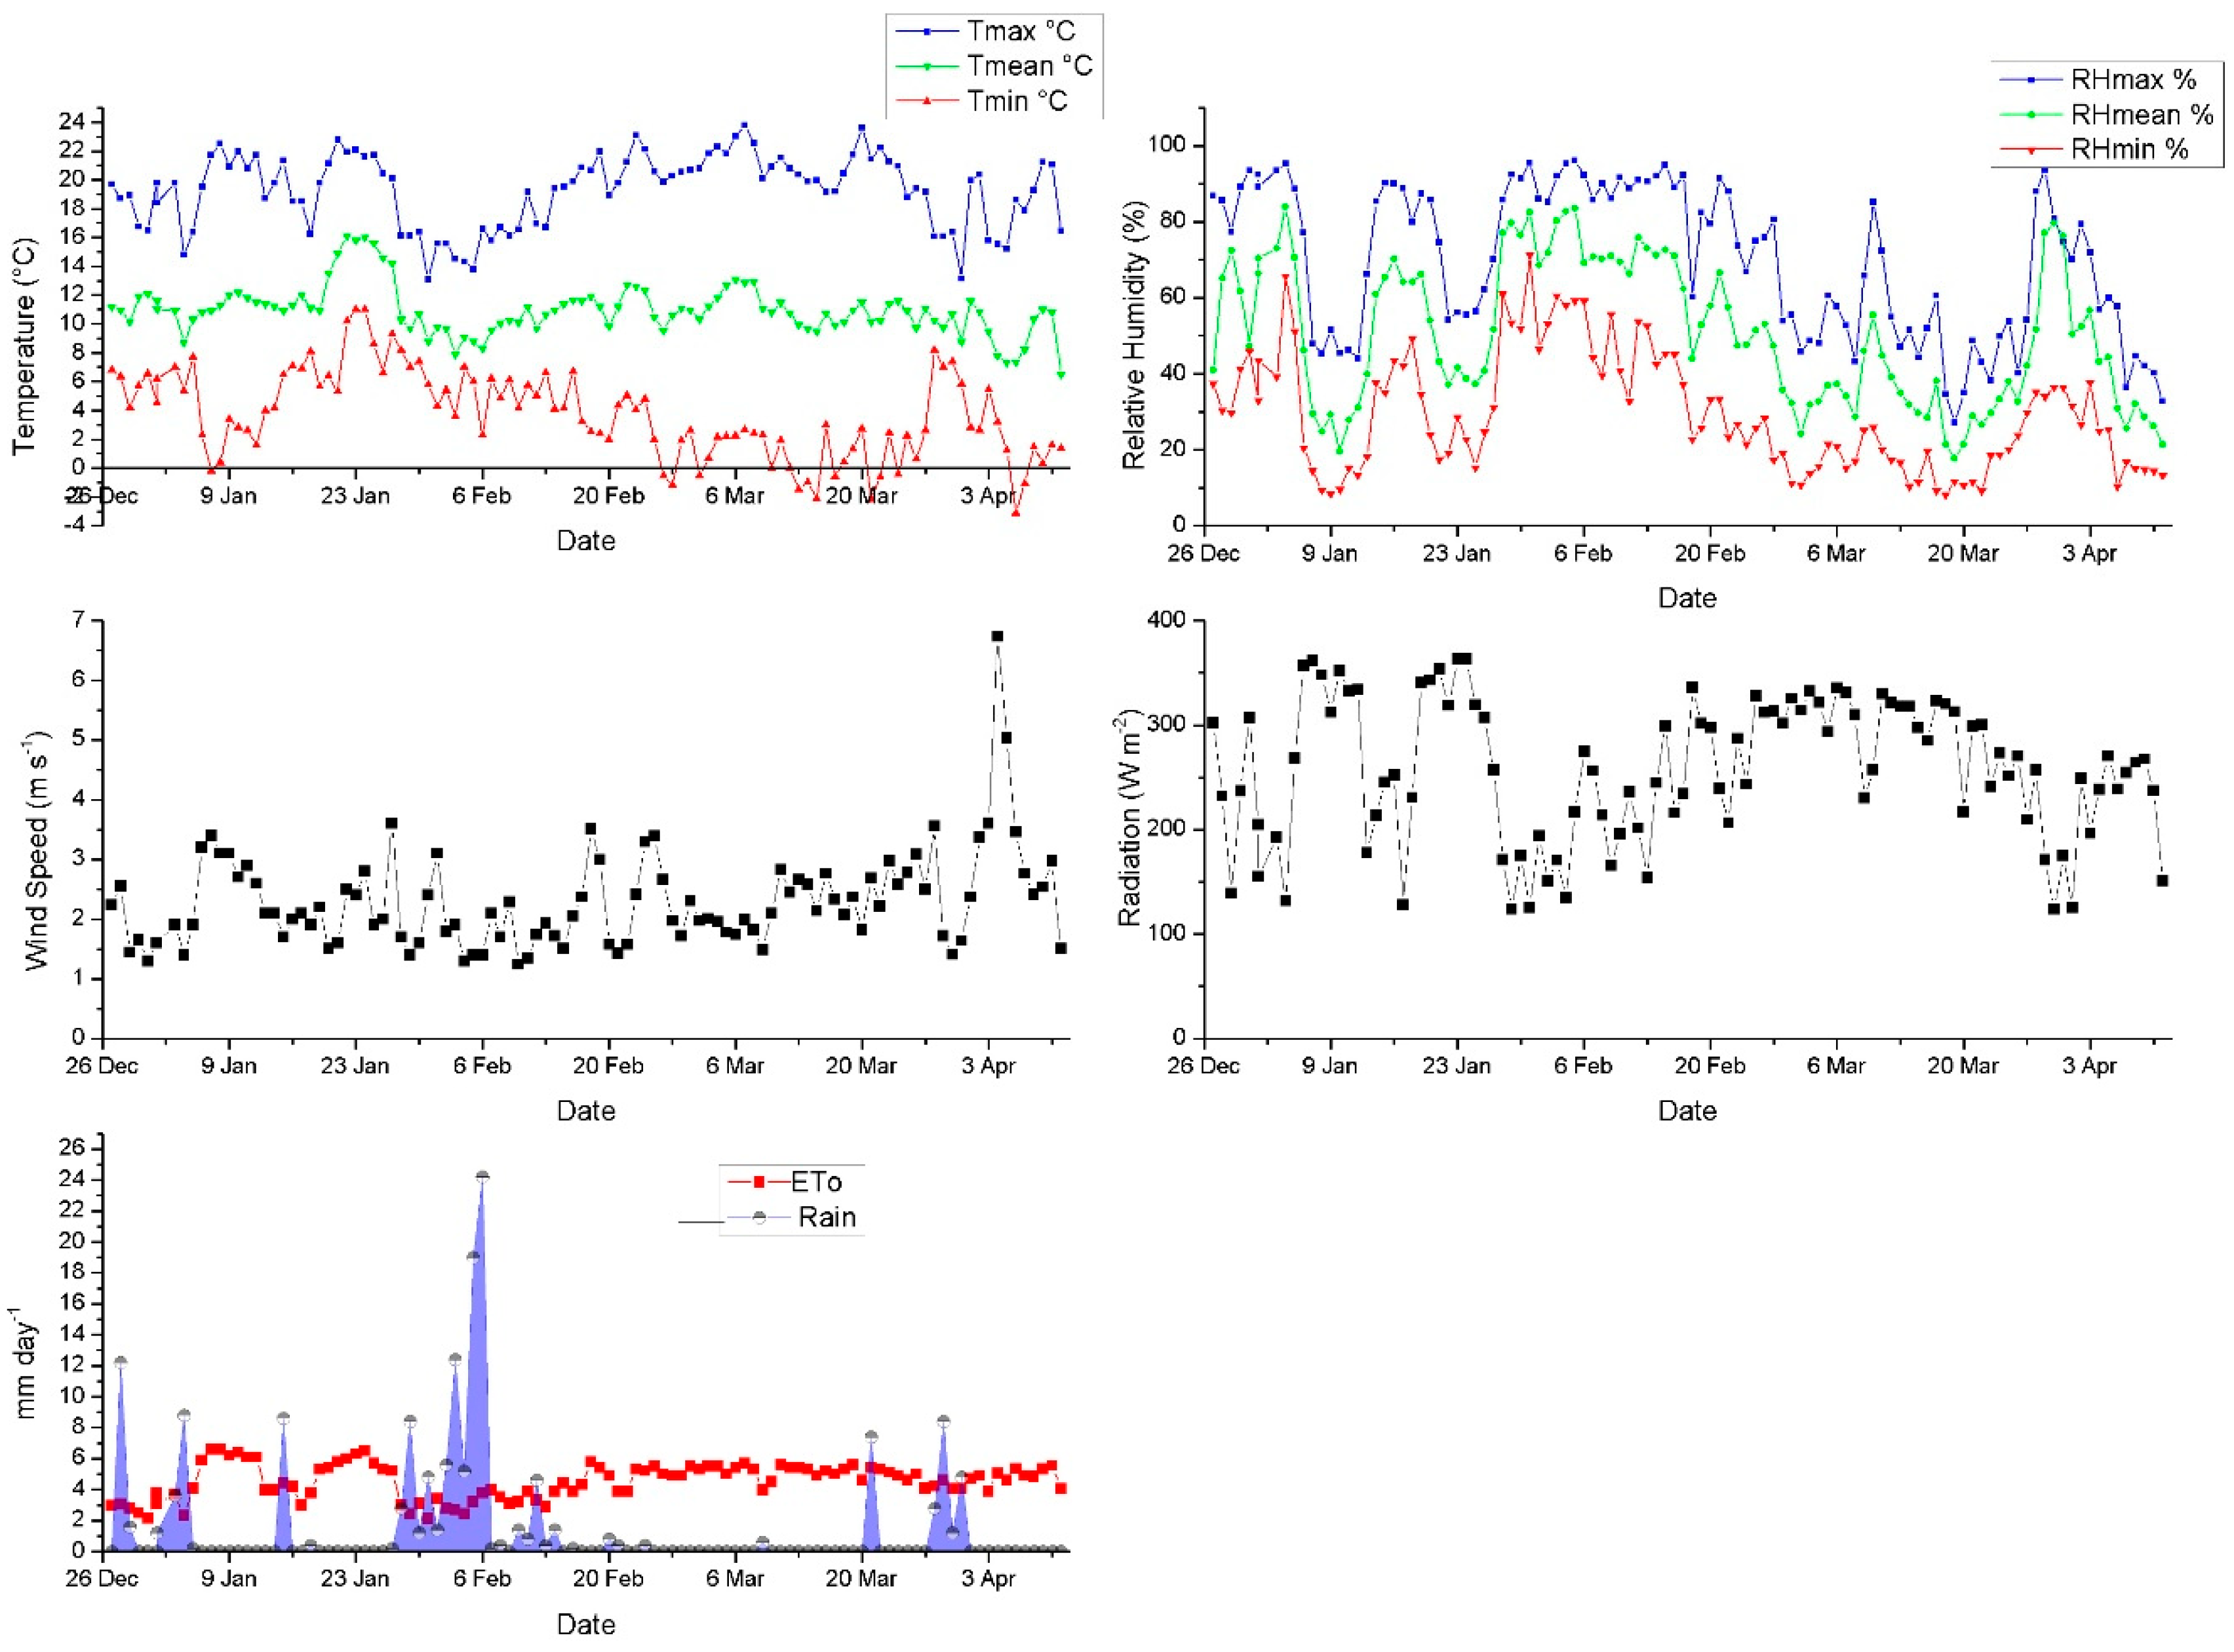
Figure 5.
Volumetric soil water content at 30 cm for 100% ETc, 66% ETc, 33% ETc and rainfed. In addition, rainfall during the study period is presented.
Figure 5.
Volumetric soil water content at 30 cm for 100% ETc, 66% ETc, 33% ETc and rainfed. In addition, rainfall during the study period is presented.
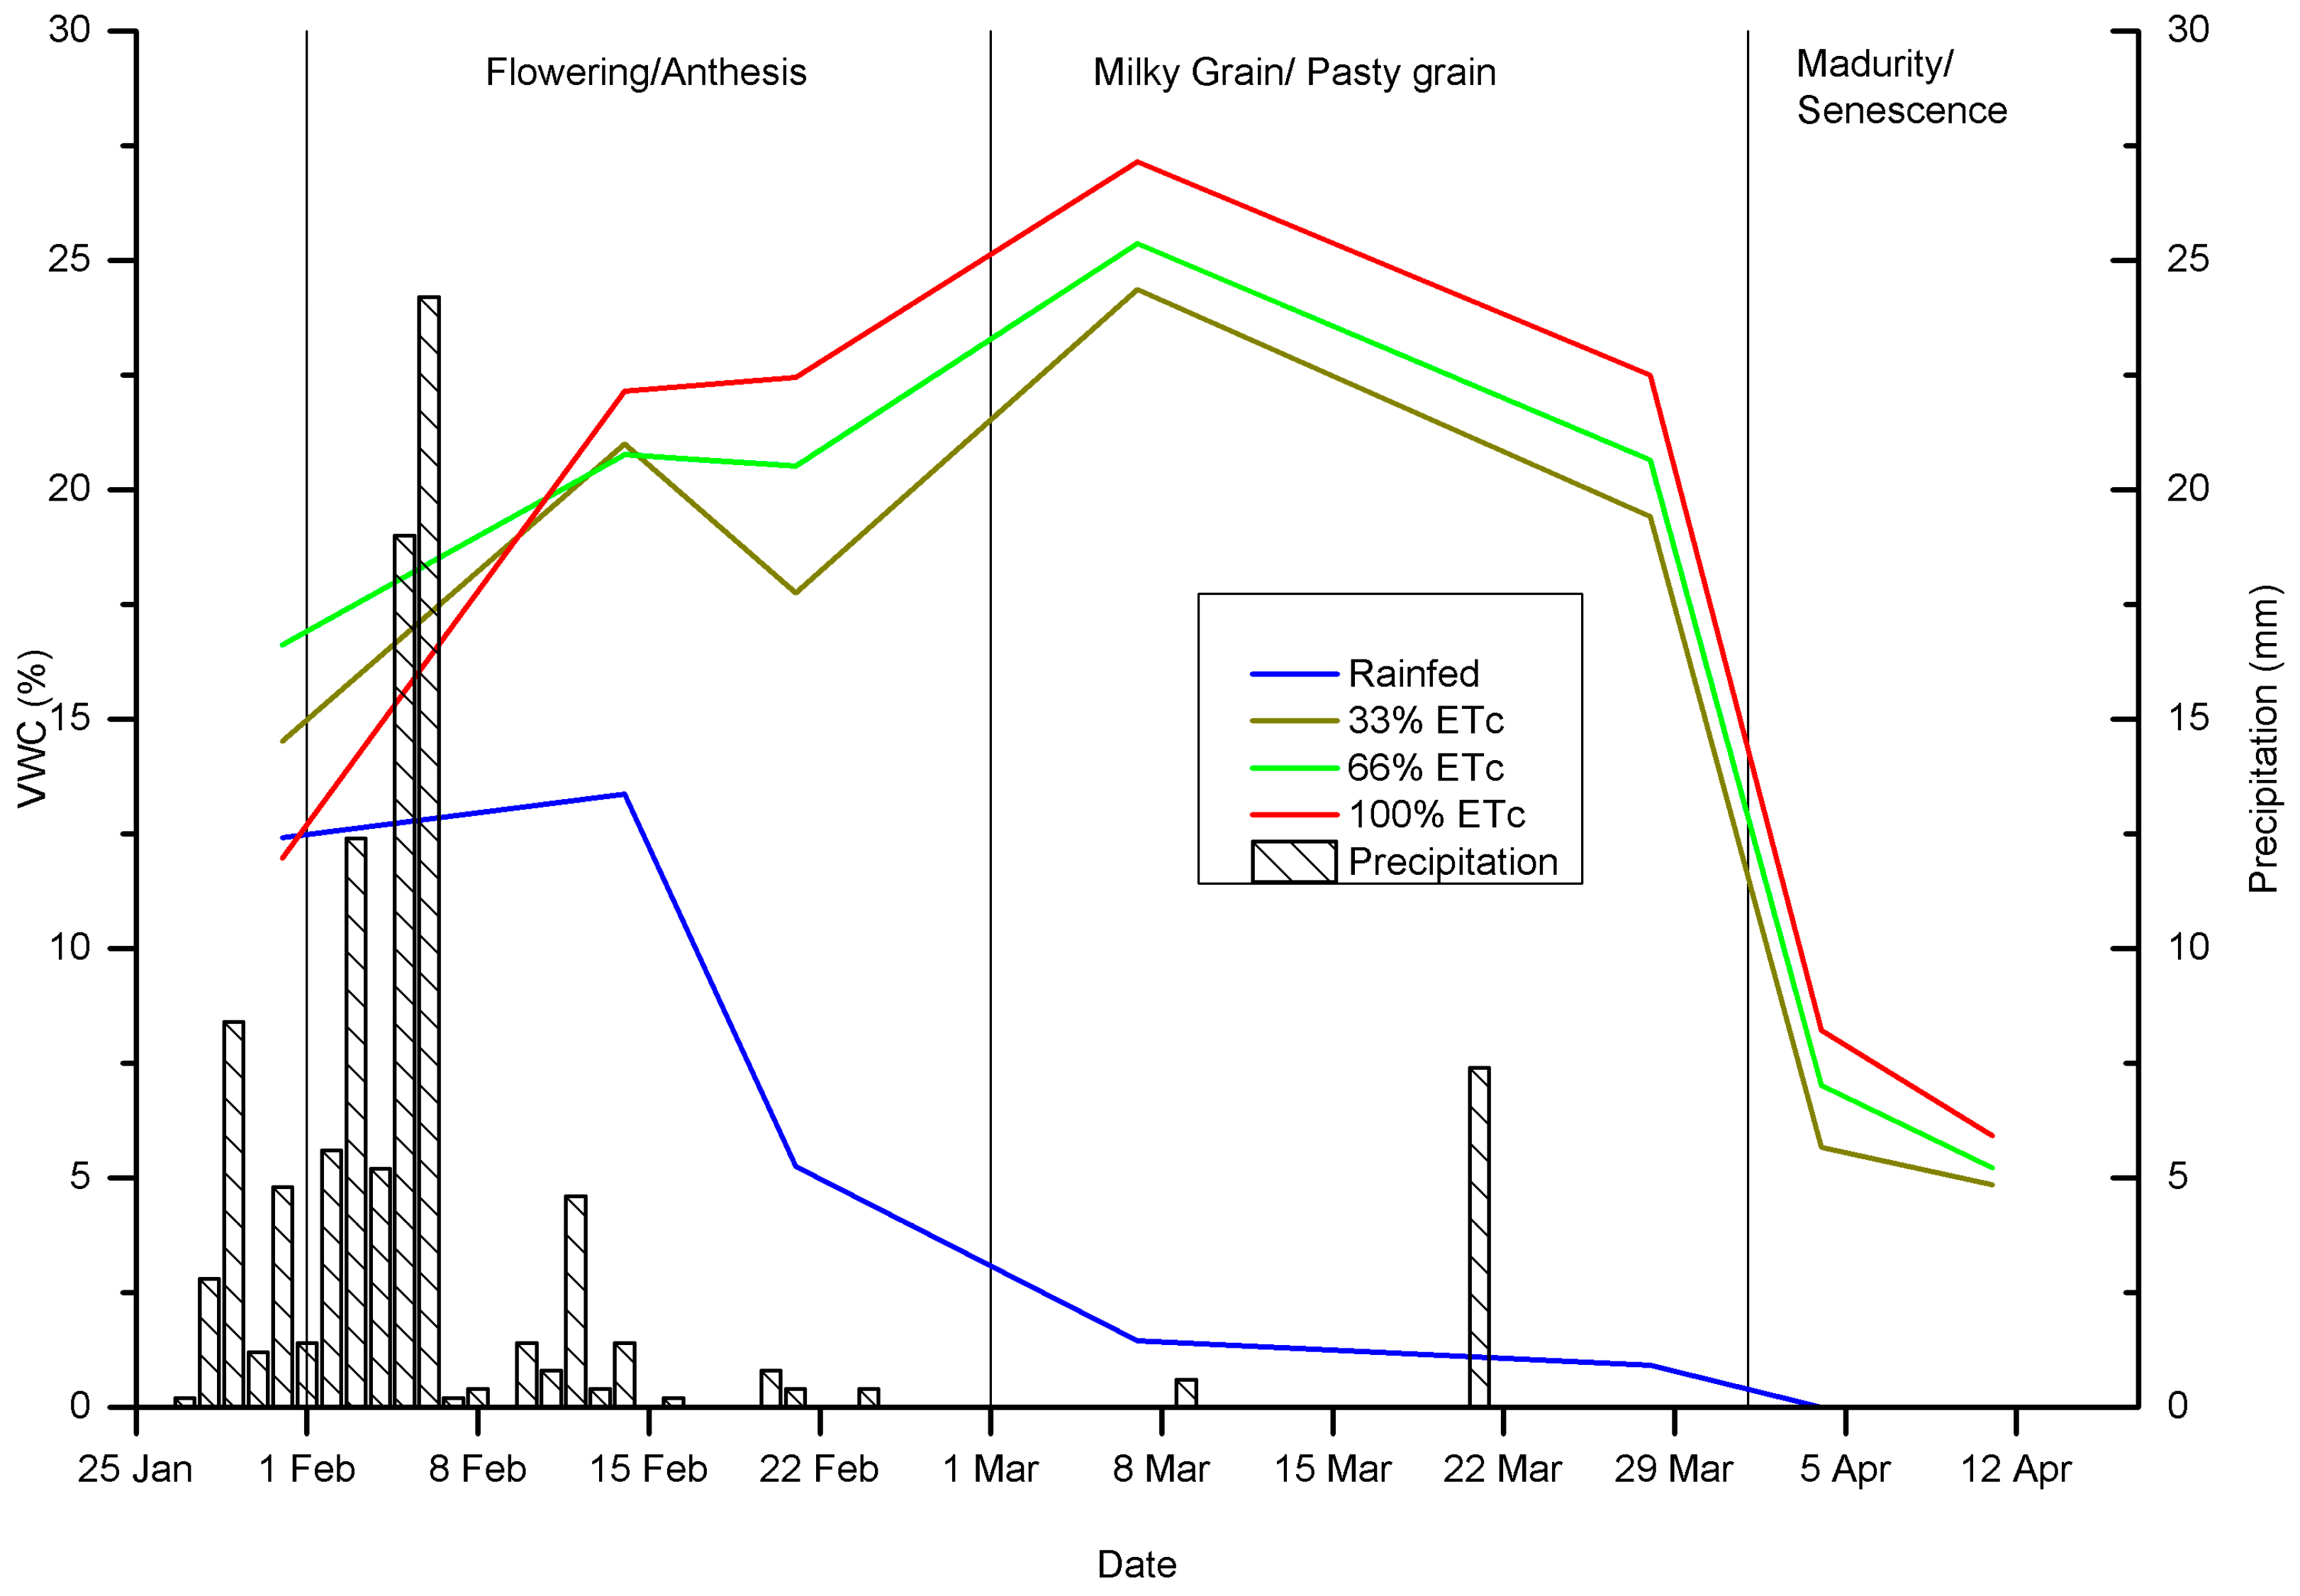
Figure 7.
Leaf area index for the quinoa cultivation under different irrigation regimes. Averages with the same letter are not significantly different (p > 0.05).
Figure 7.
Leaf area index for the quinoa cultivation under different irrigation regimes. Averages with the same letter are not significantly different (p > 0.05).
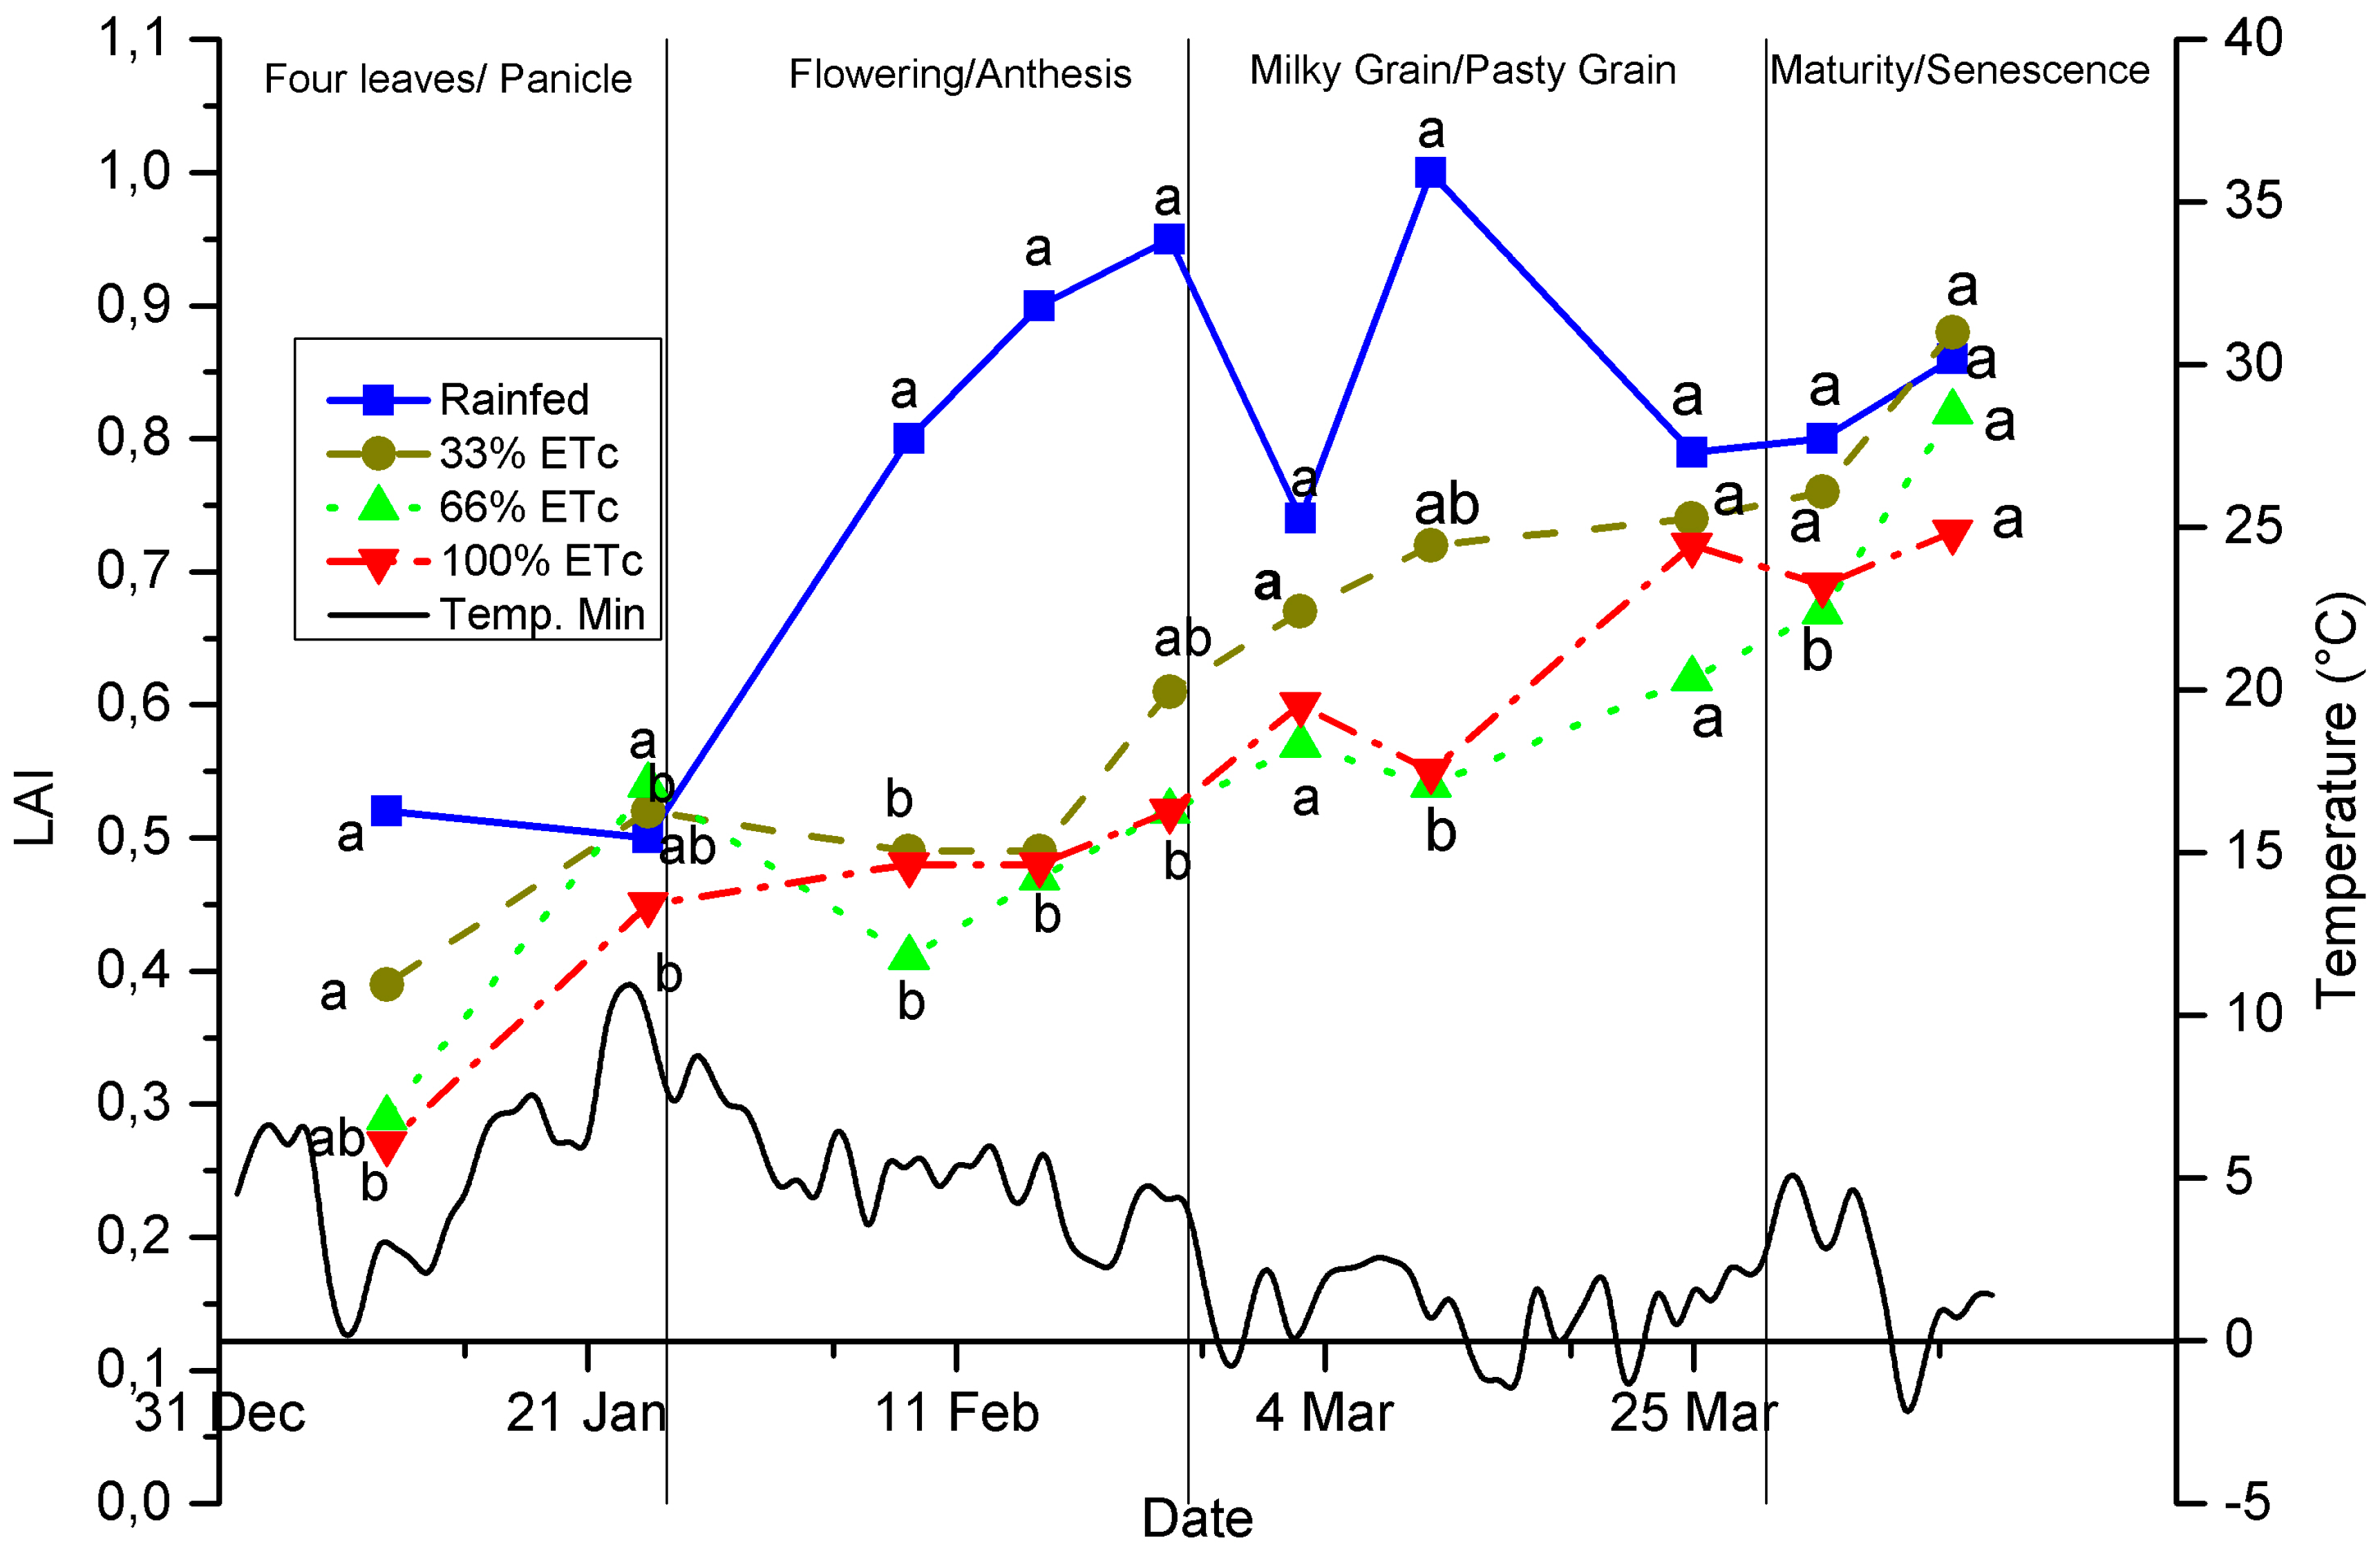
Figure 8.
Plant height for quinoa cultivation under different irrigation regimes. Means with a common letter are not significantly different (p > 0.05).
Figure 8.
Plant height for quinoa cultivation under different irrigation regimes. Means with a common letter are not significantly different (p > 0.05).
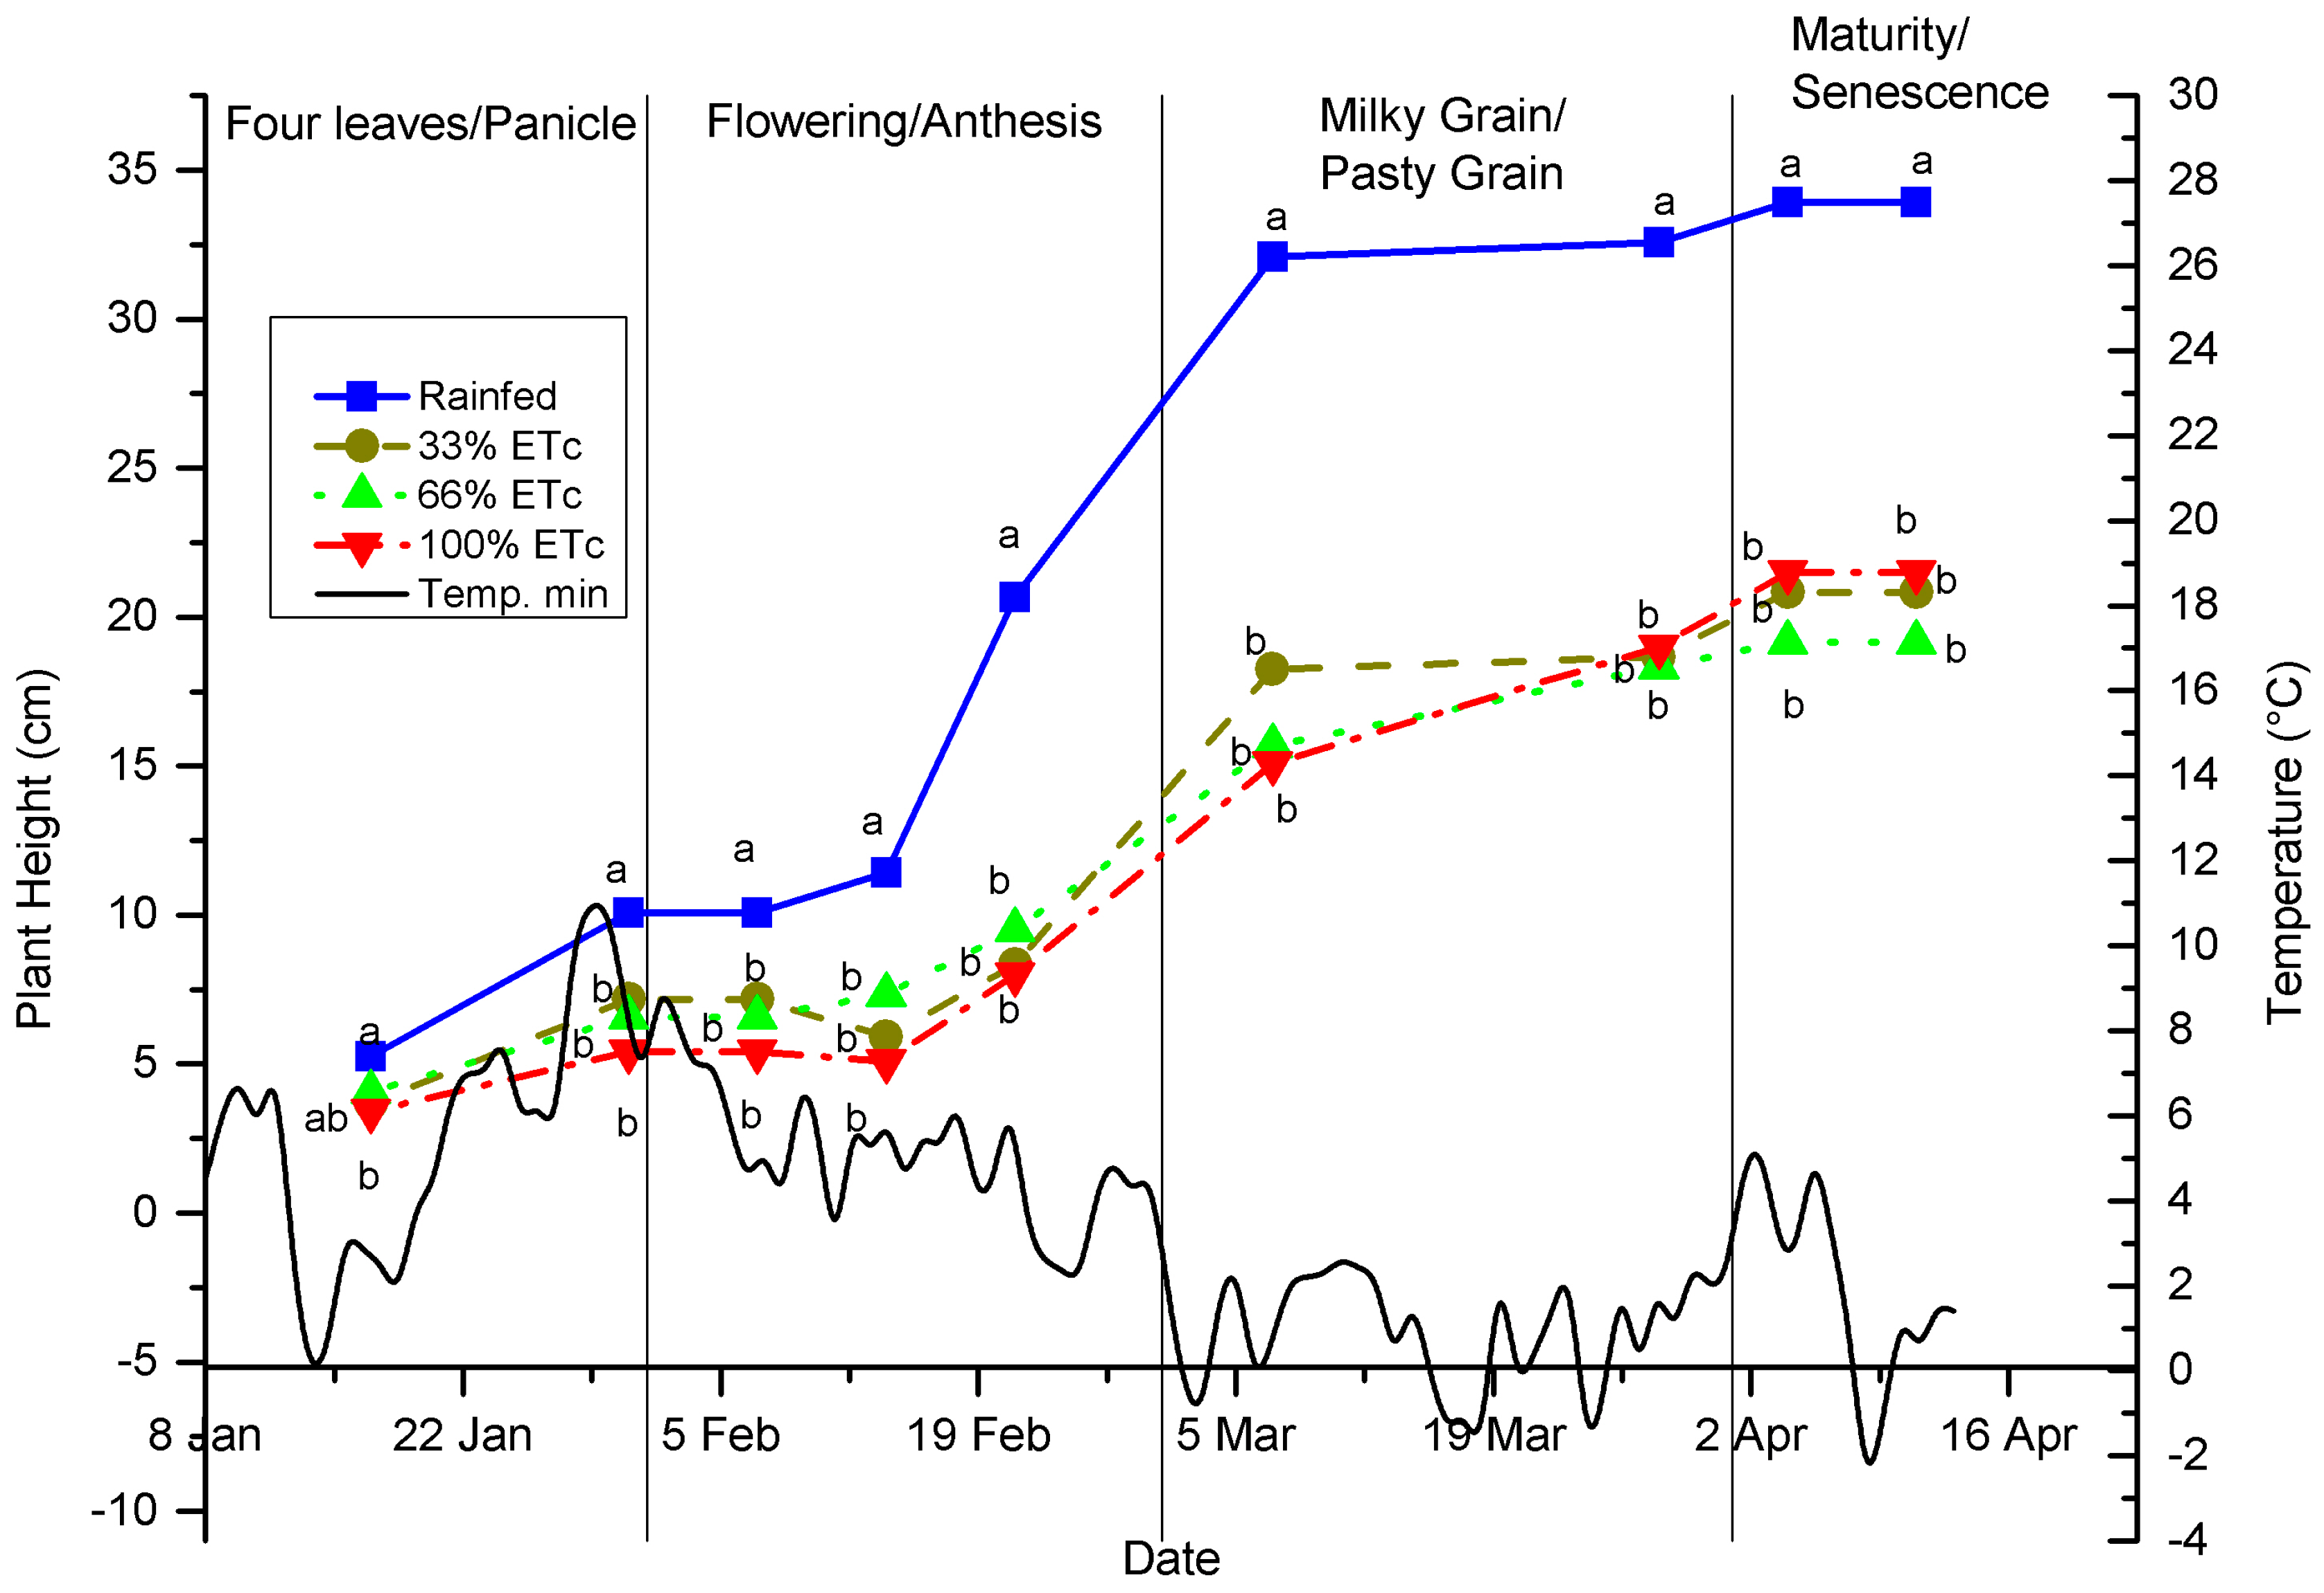
Figure 9.
Harvest index (HI) for quinoa cultivation under different irrigation regimes.
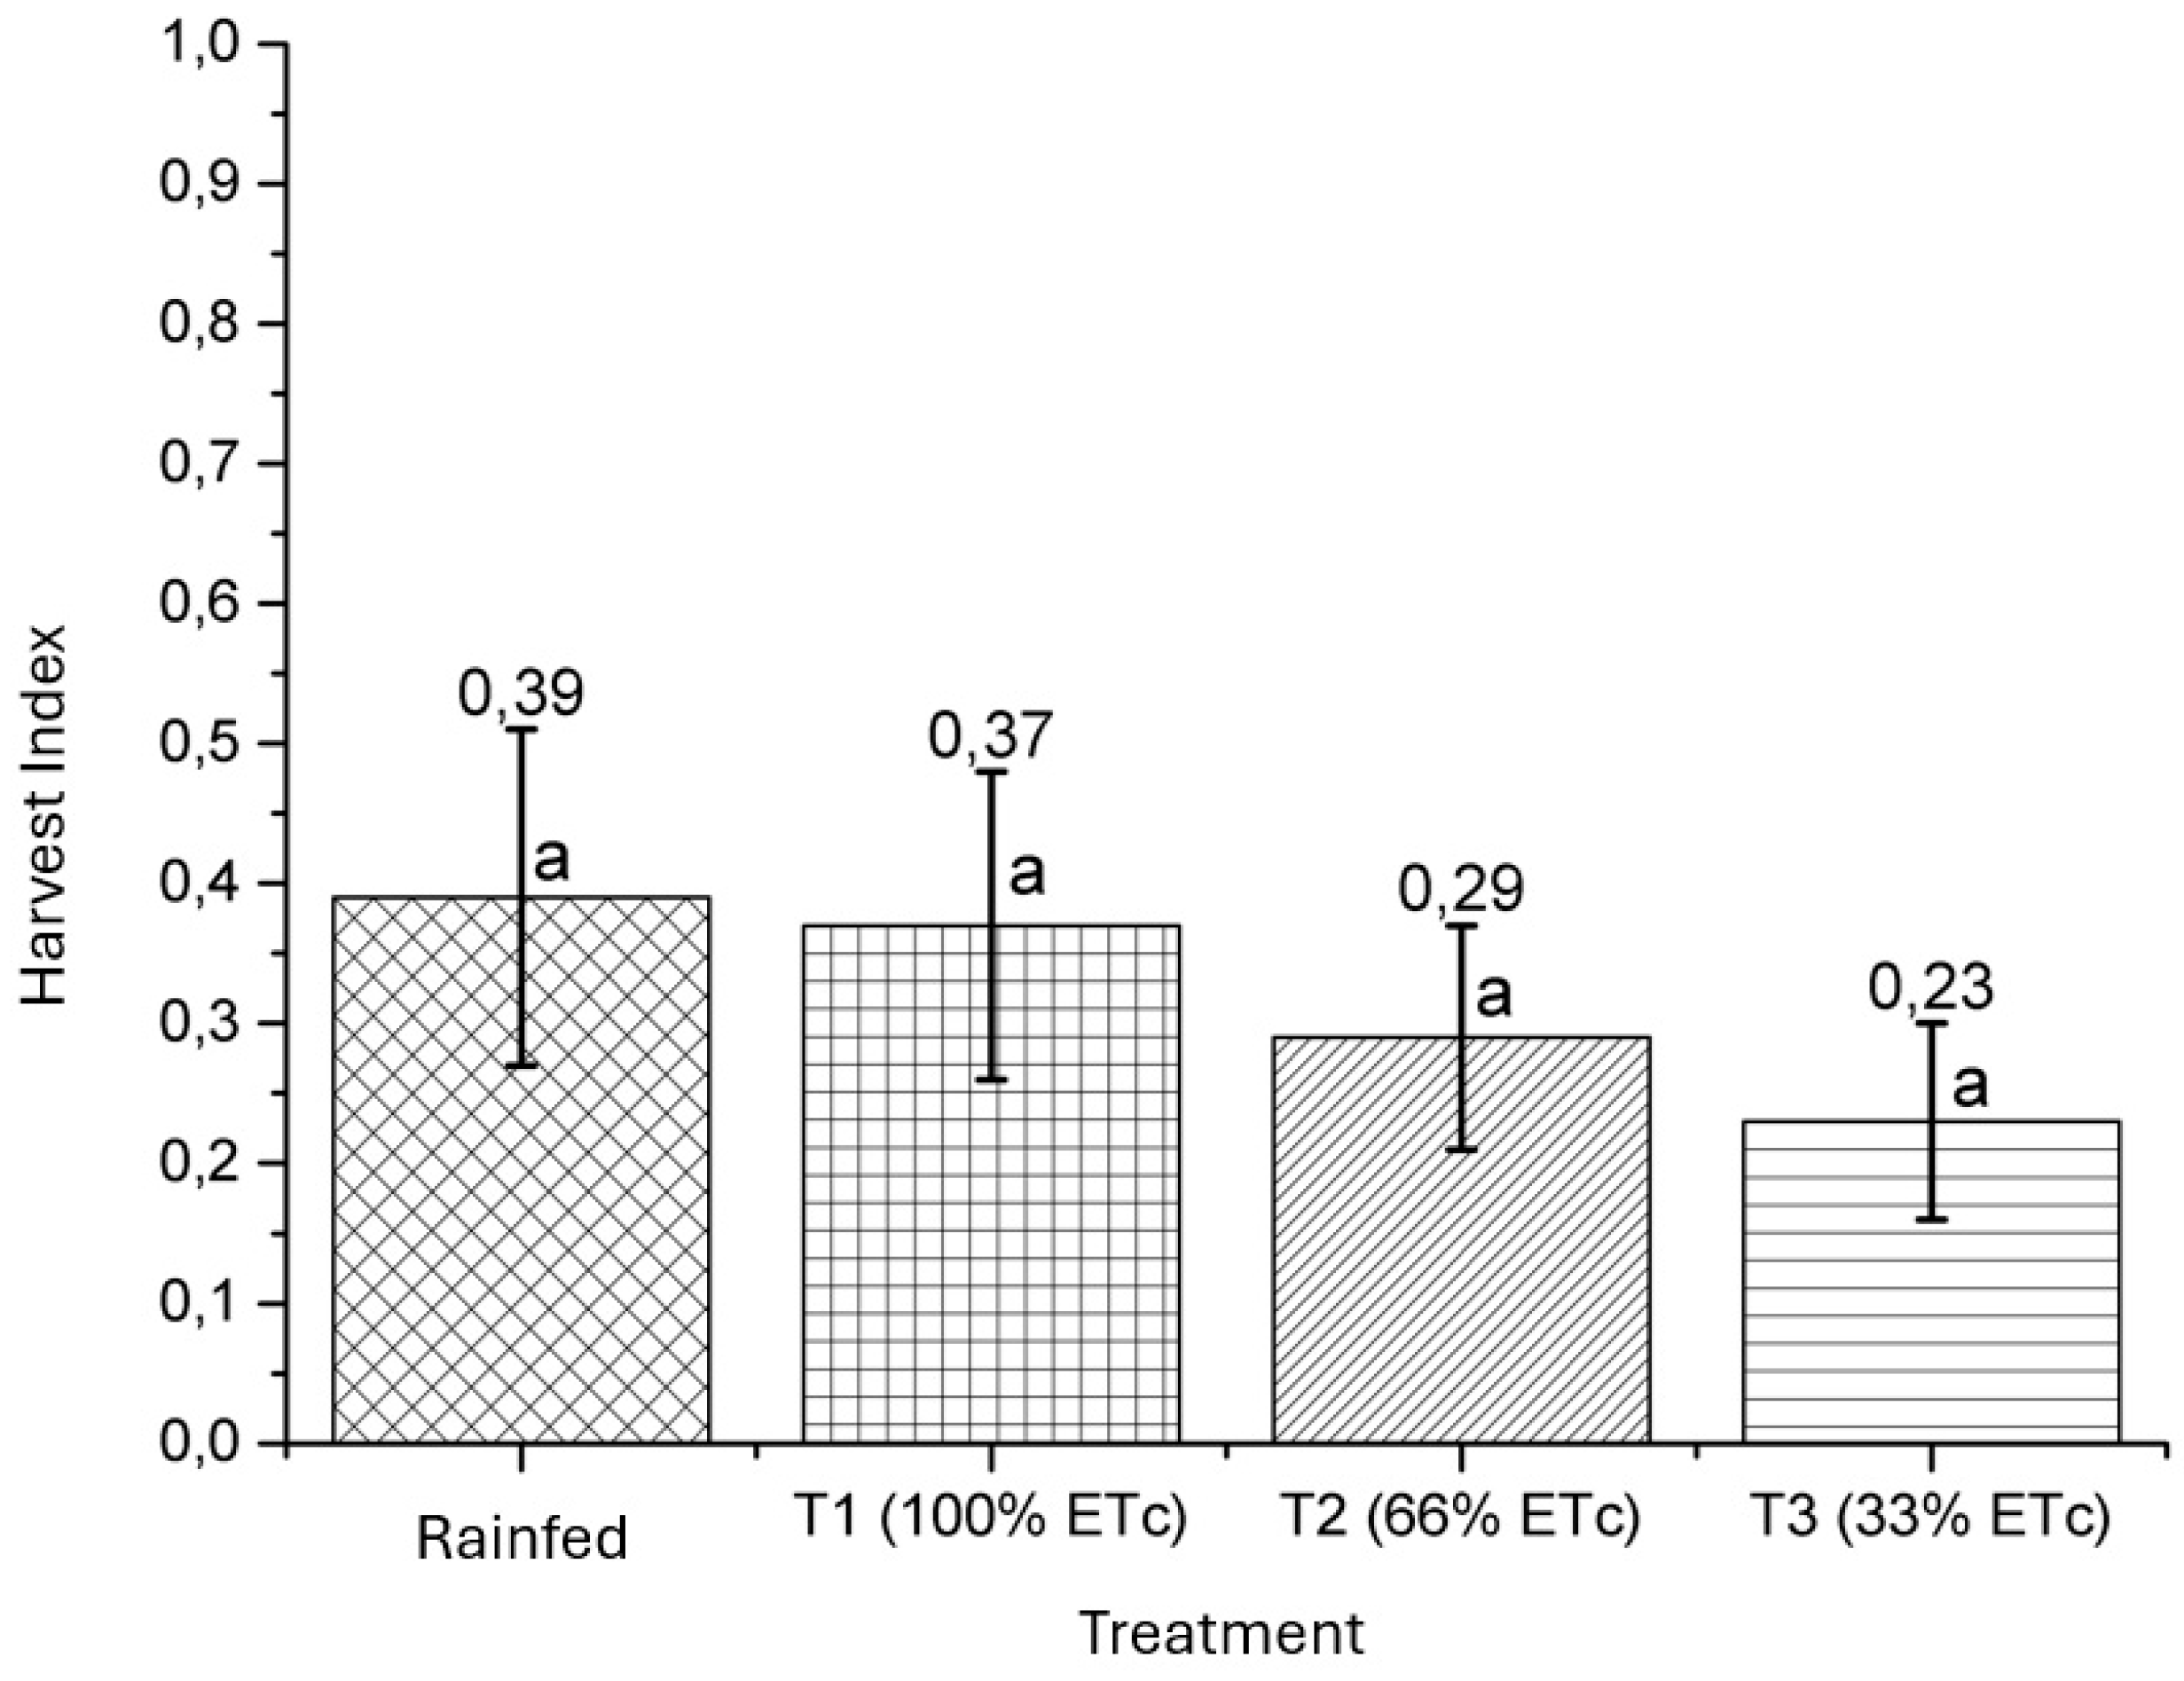
Figure 10.
Performance for quinoa cultivation under different irrigation regimes.
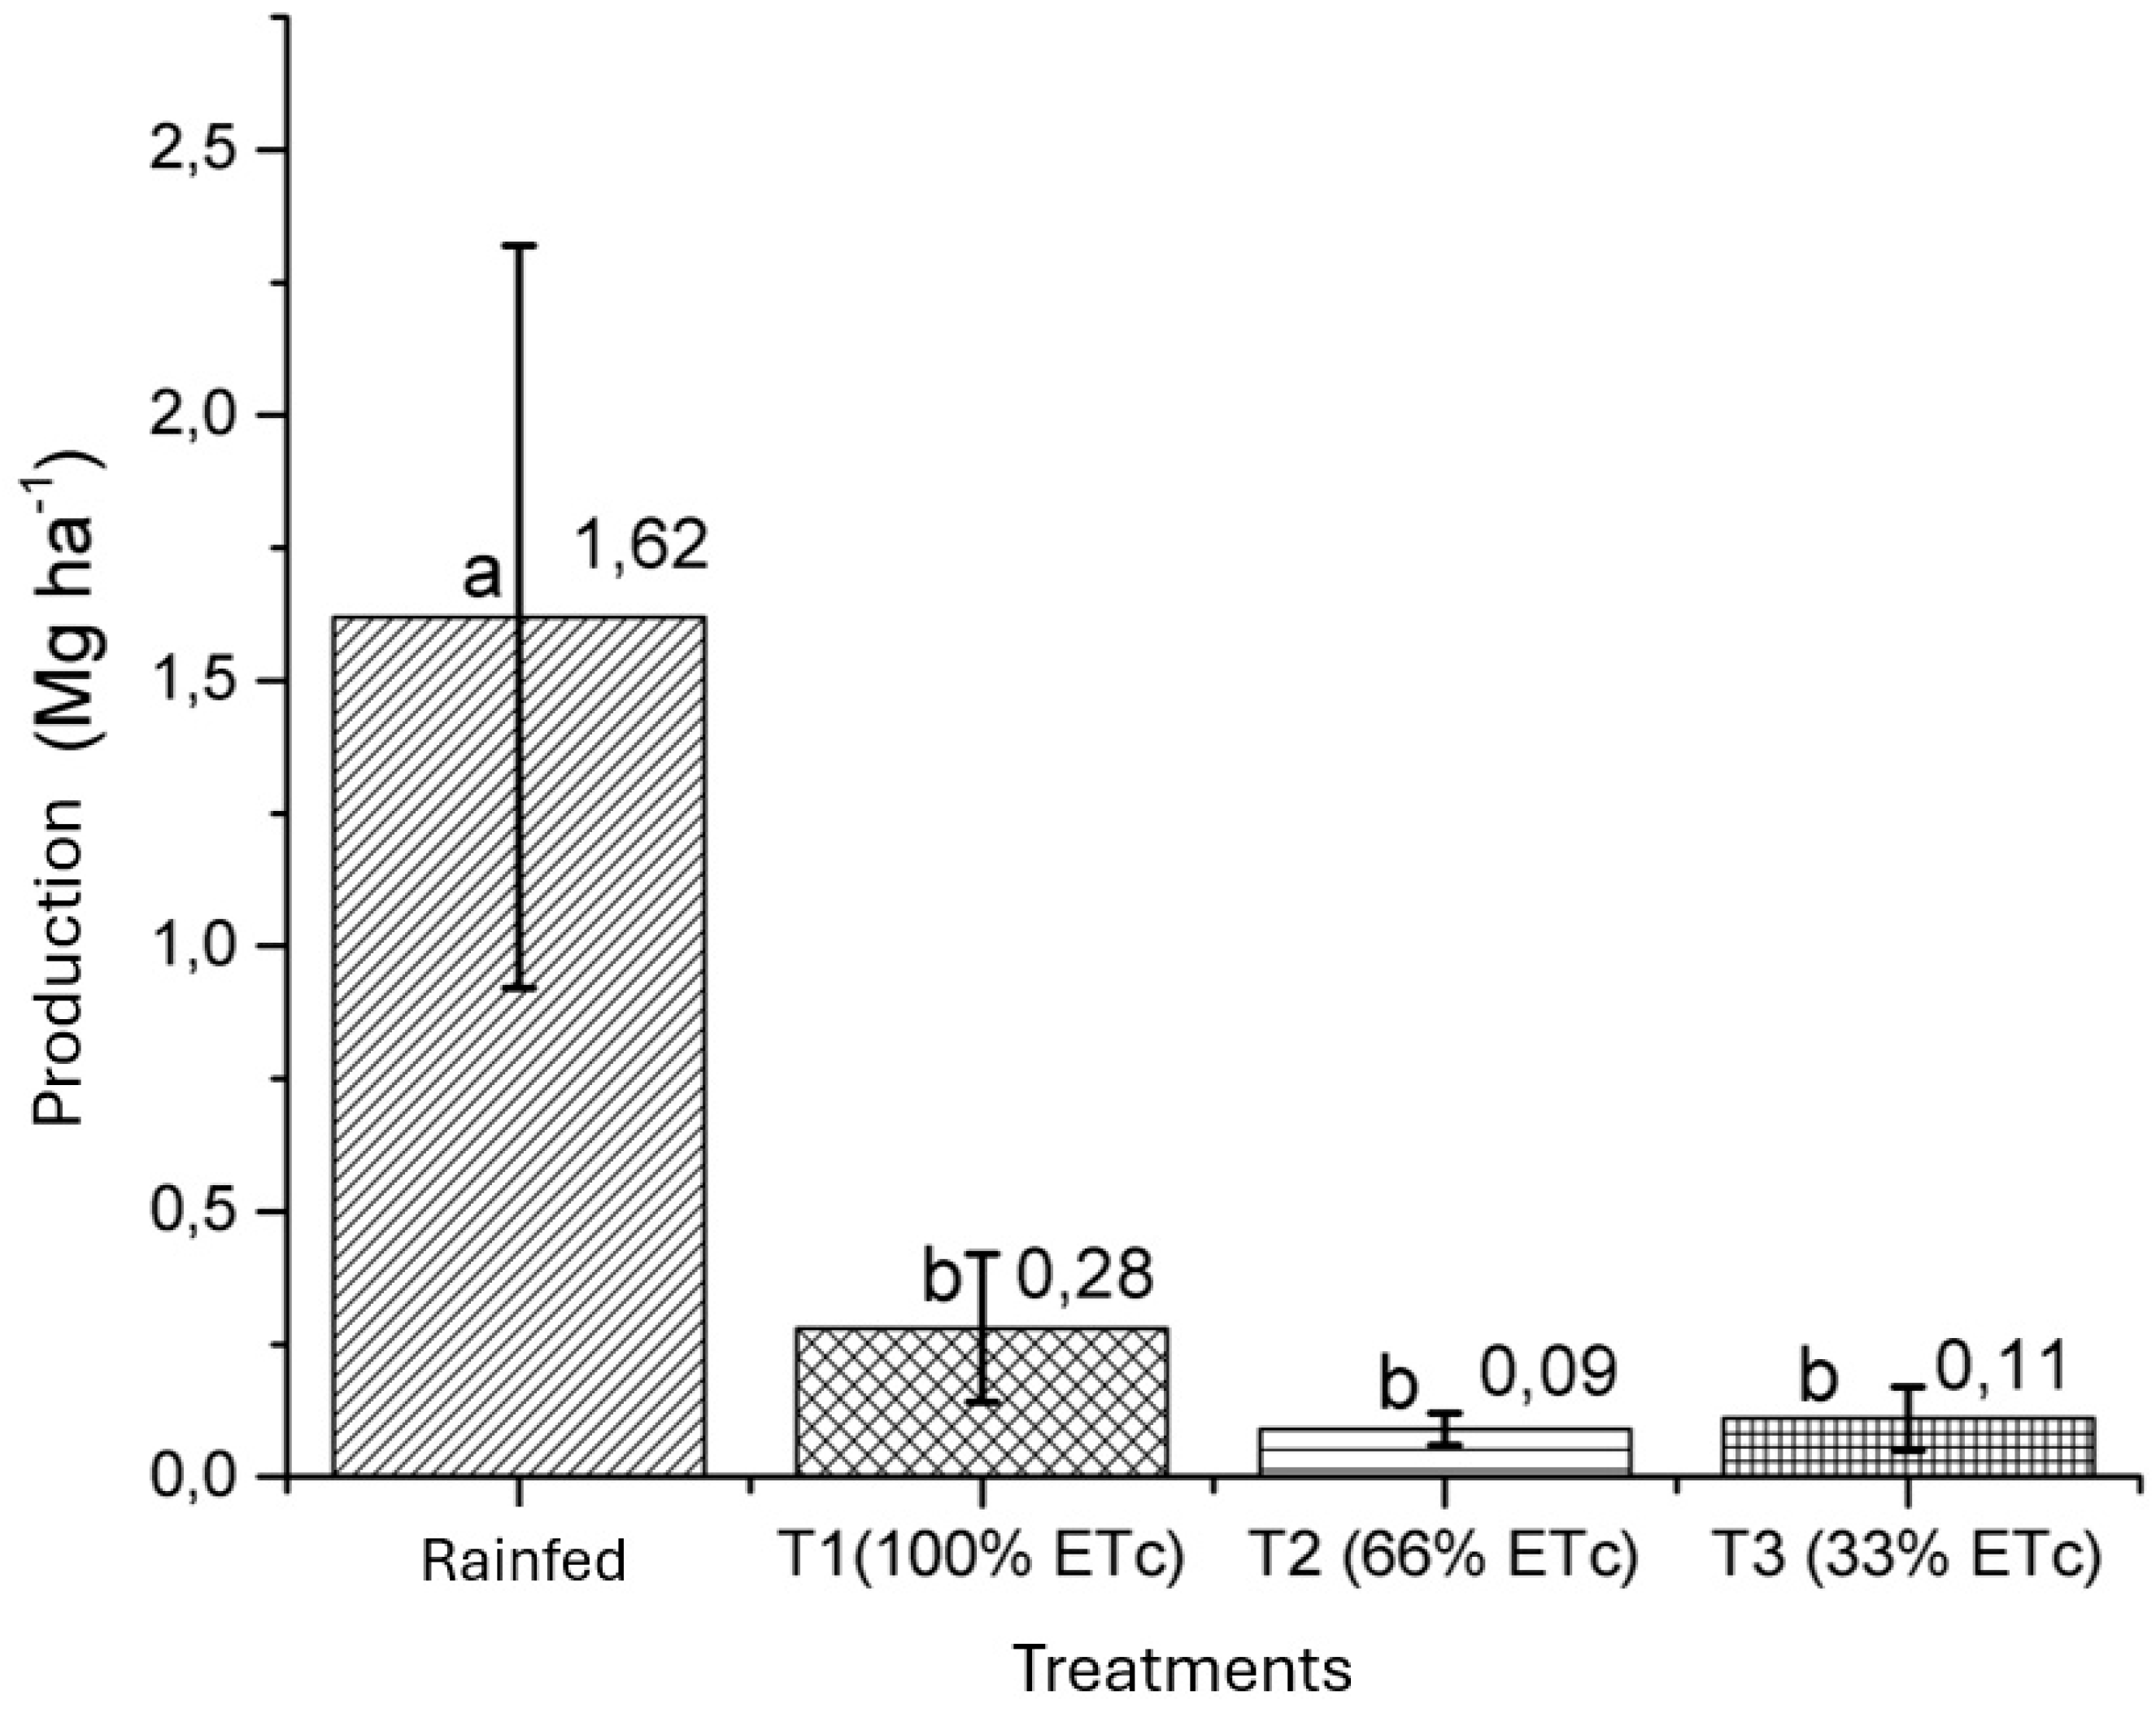
Figure 11.
Normalized difference vegetation index (NDVI) for the quinoa cultivation for rainfed and T1(100 % ETc).
Figure 11.
Normalized difference vegetation index (NDVI) for the quinoa cultivation for rainfed and T1(100 % ETc).
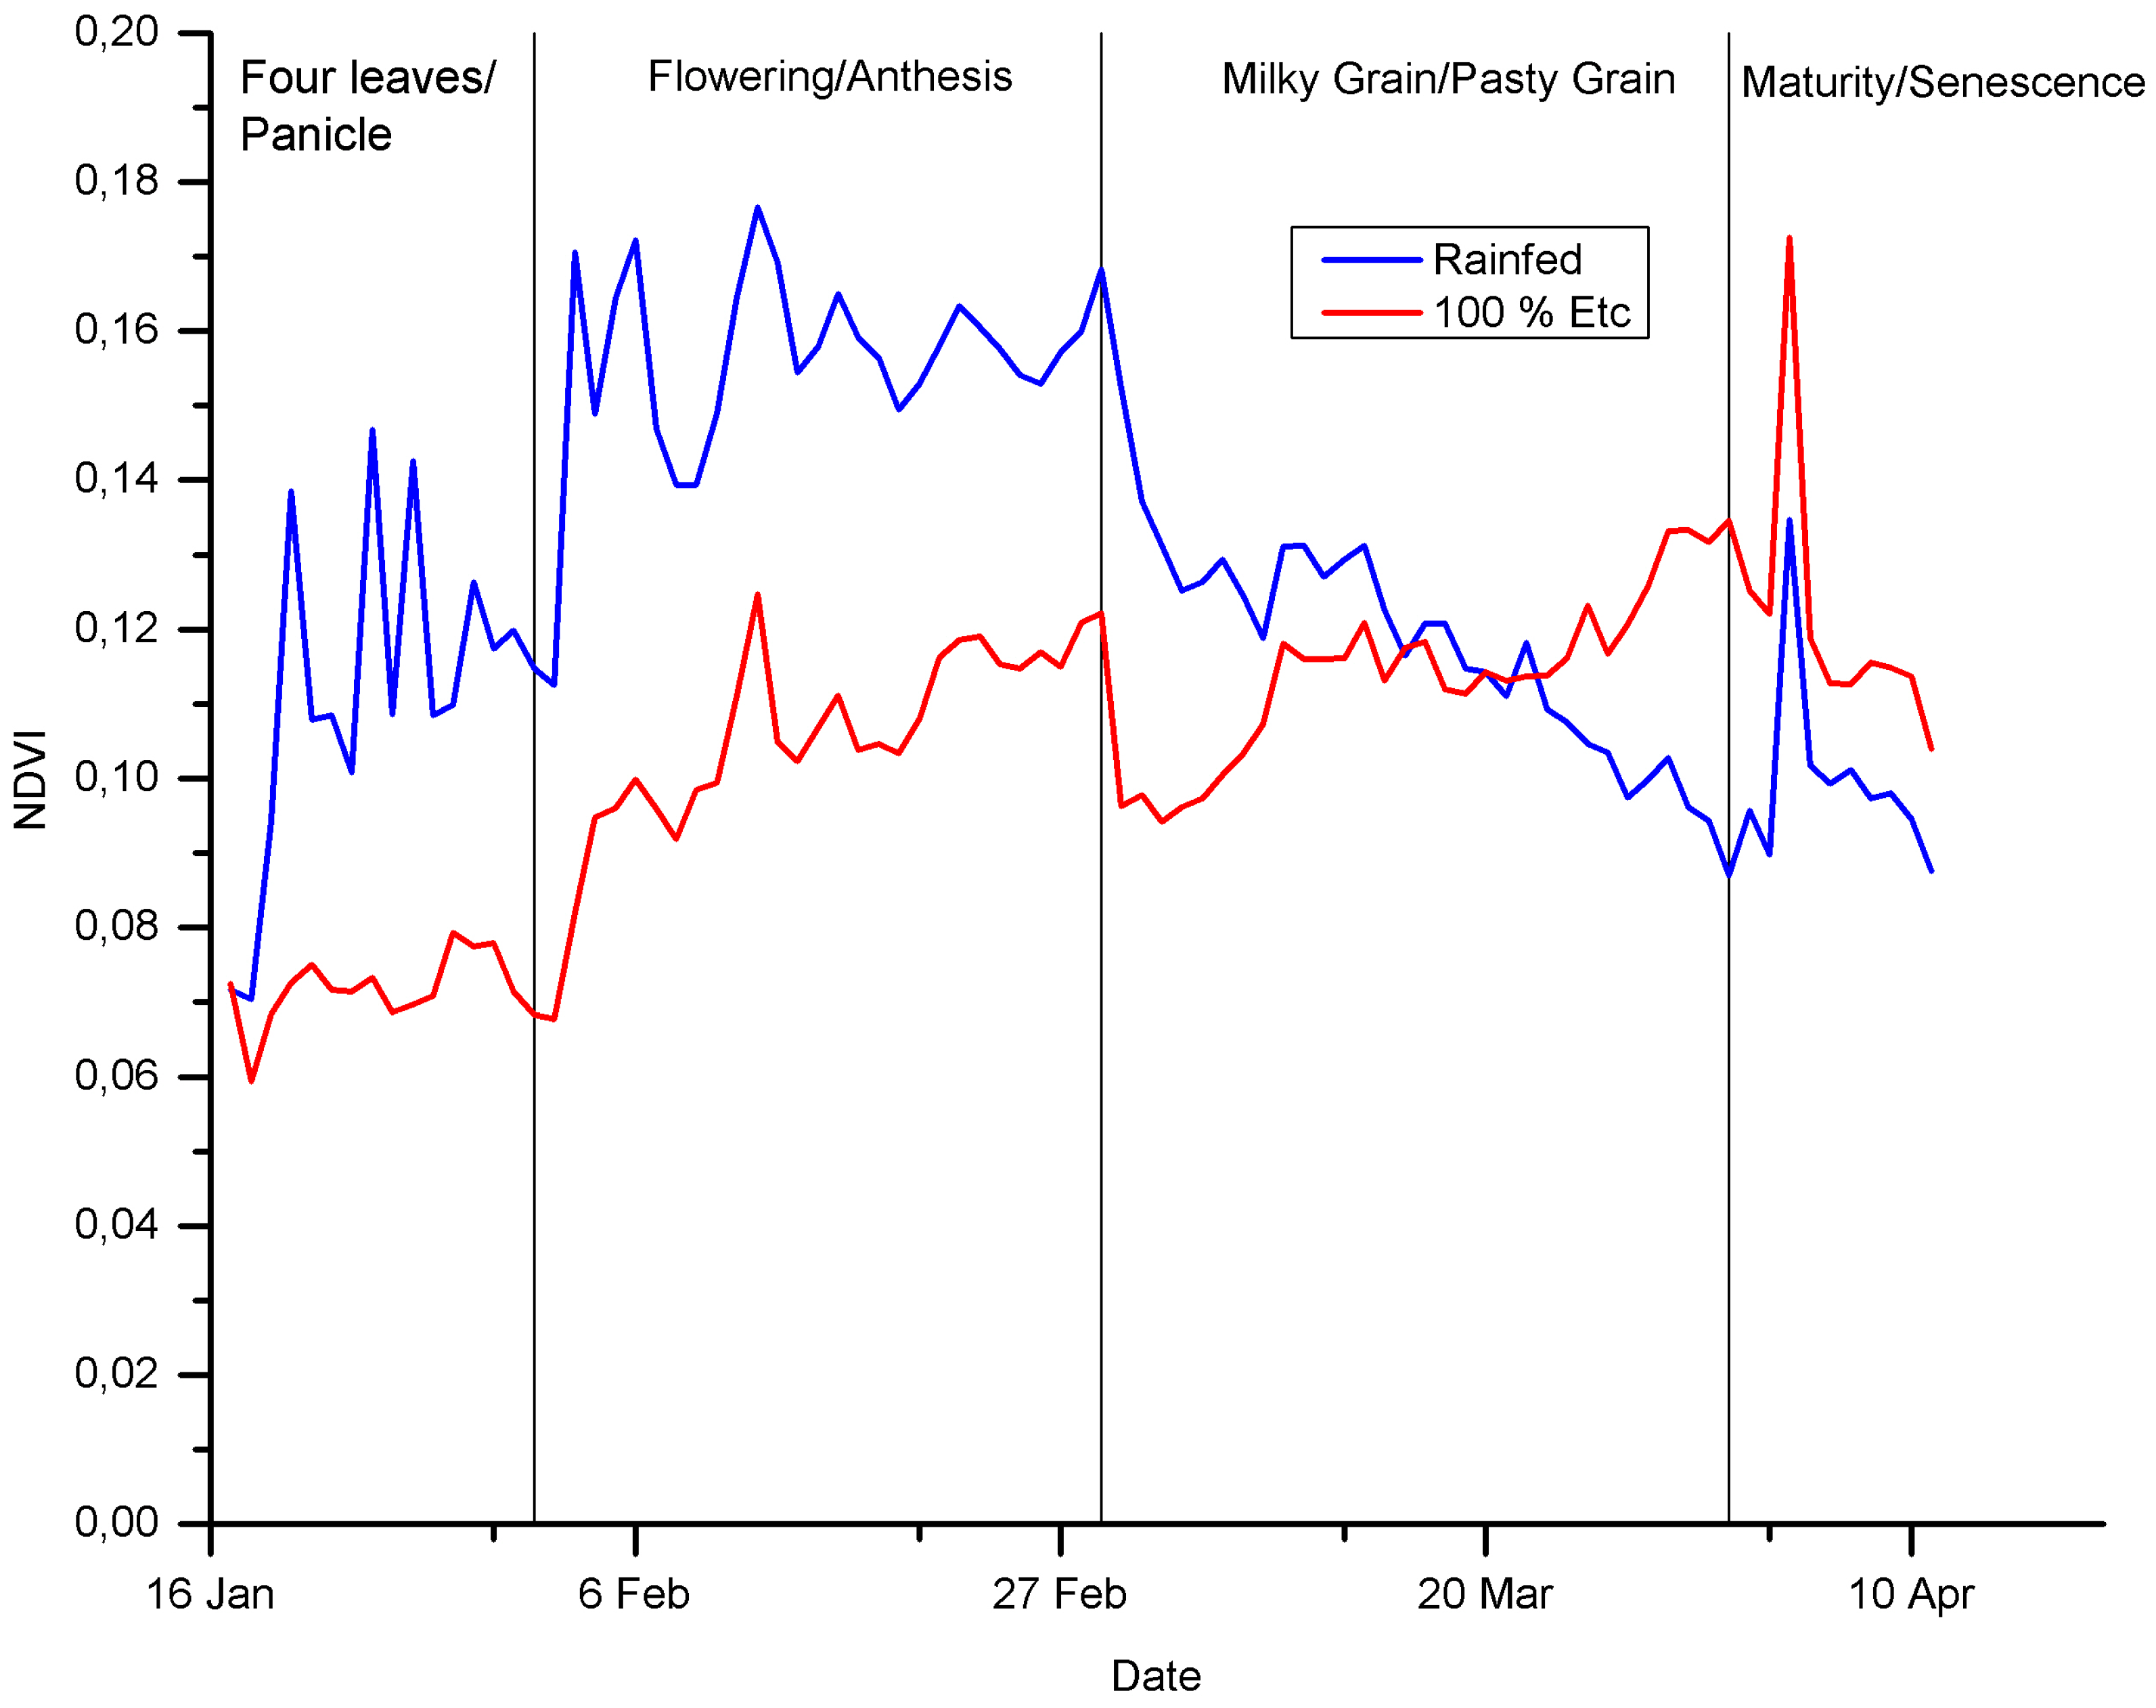
Figure 12.
Water use efficiency (WUE) for quinoa cultivation under different irrigation regimes.
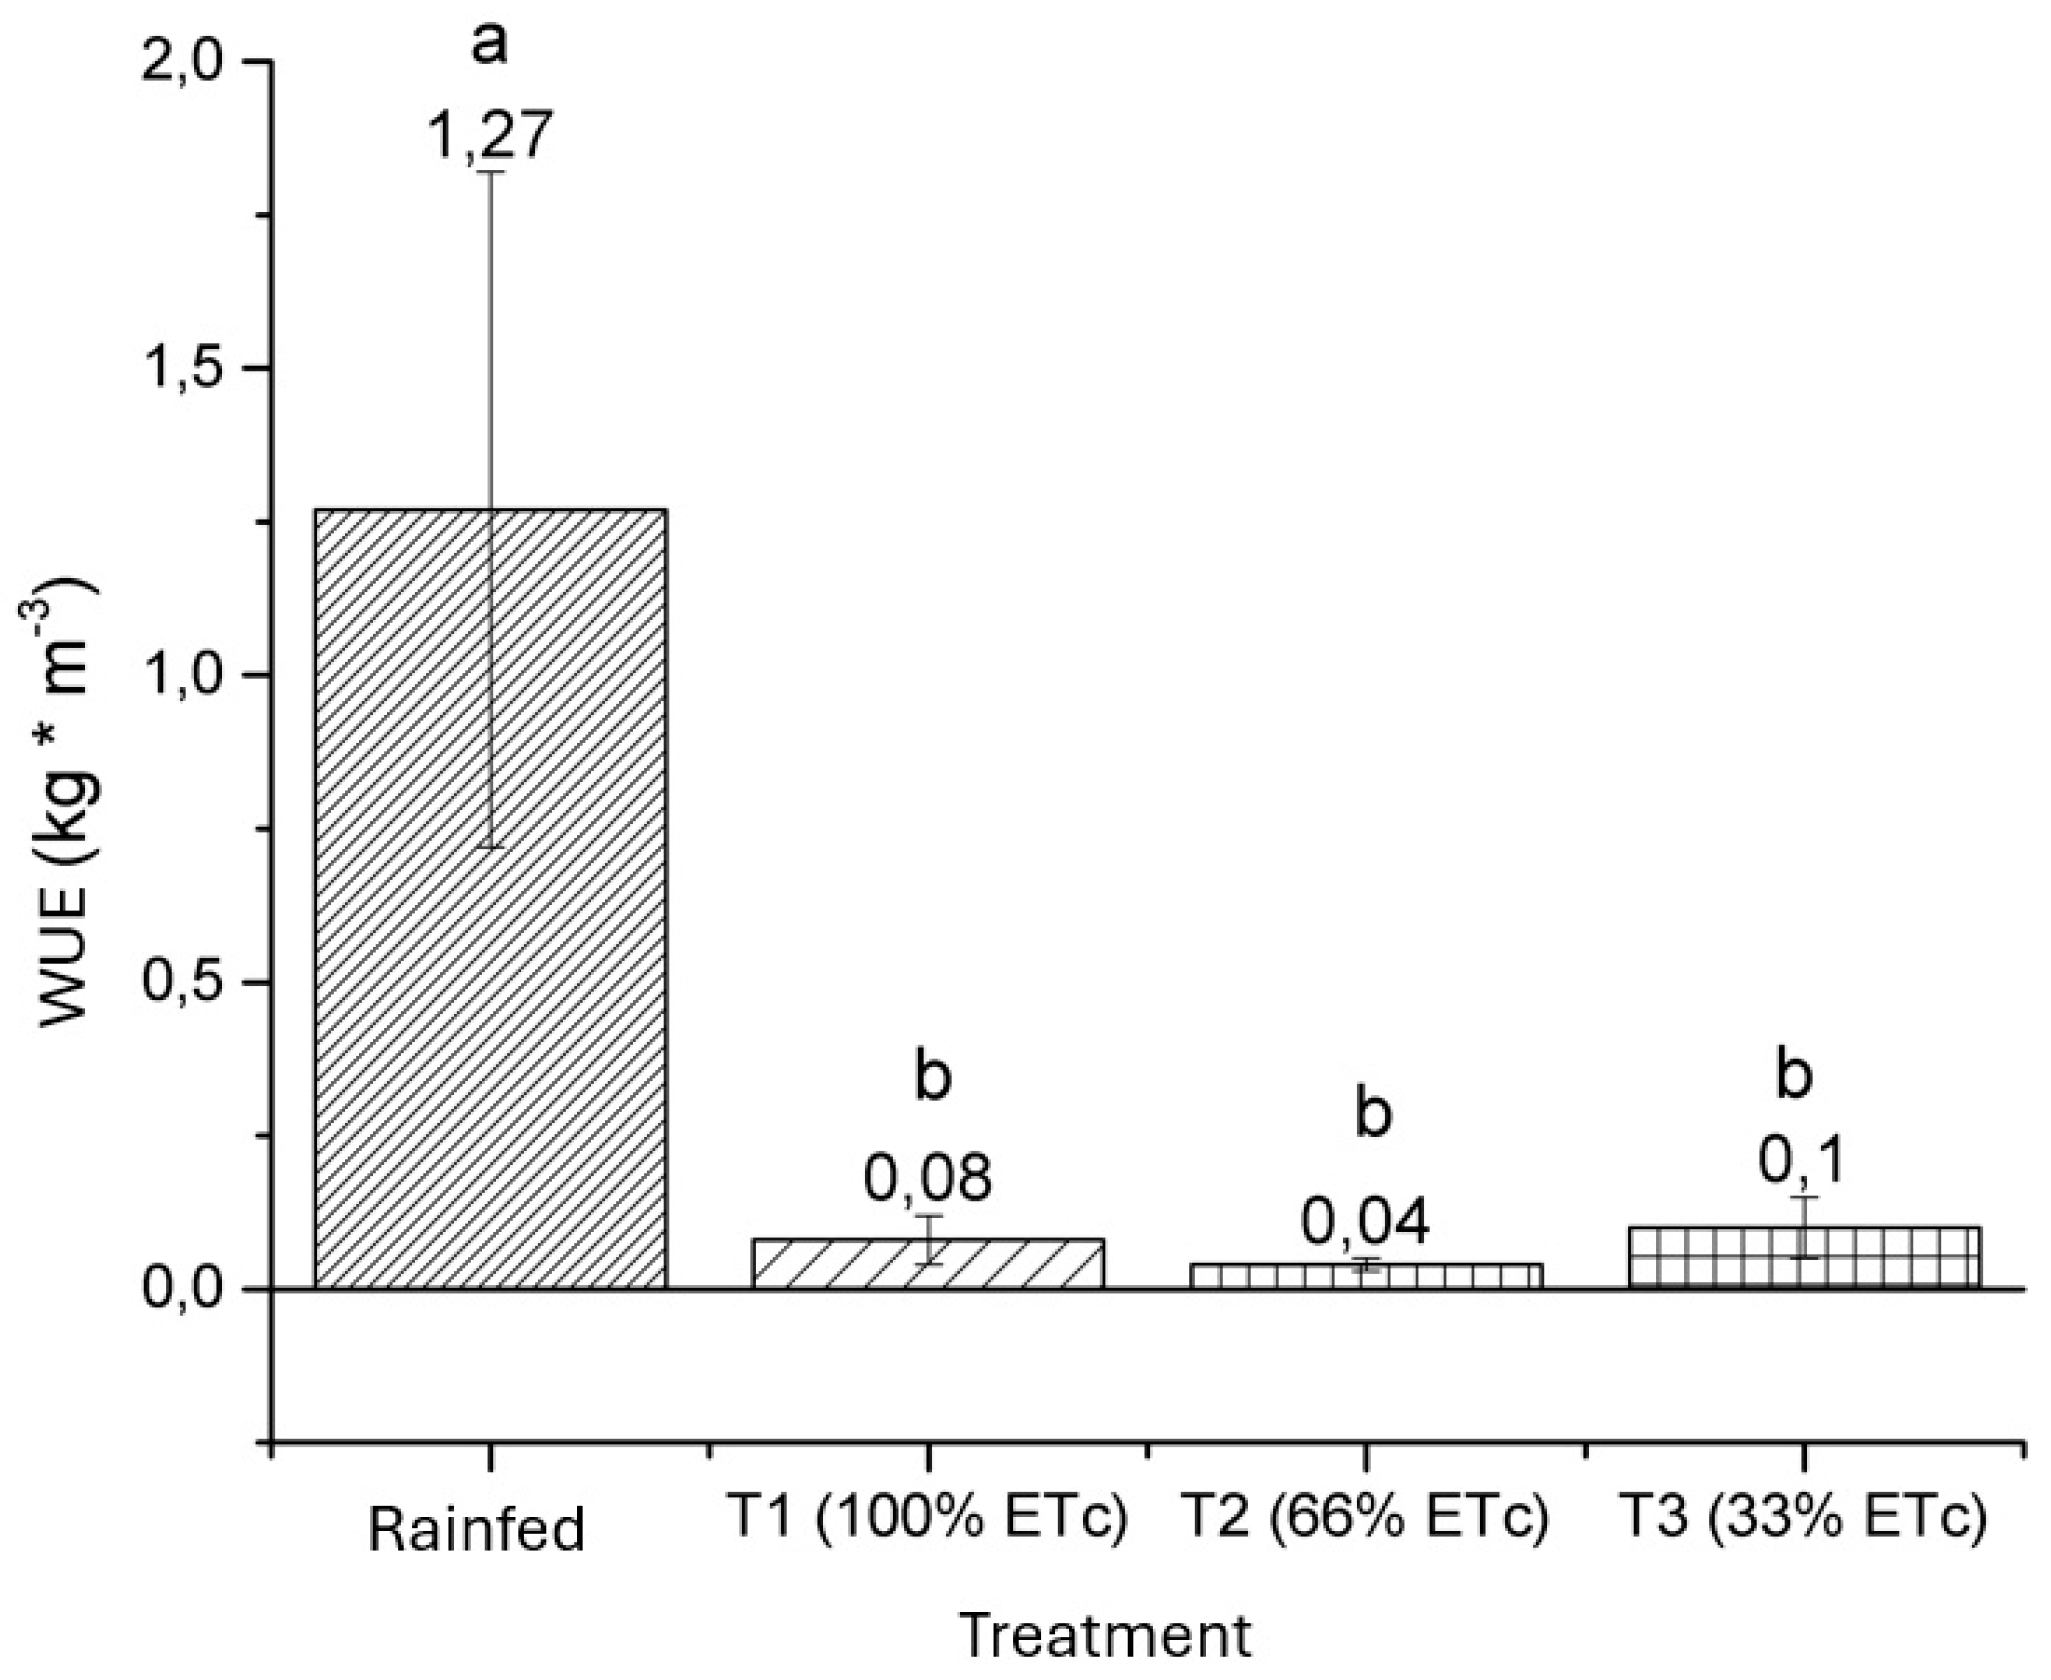
Table 1.
Potential evapotranspiration and quinoa growing in the location of Ancovinto, Commune of Colchane, Region of Tarapacá, Chile. .
Table 1.
Potential evapotranspiration and quinoa growing in the location of Ancovinto, Commune of Colchane, Region of Tarapacá, Chile. .
| 2018-2019 | Daily ET0 (mm/day) | Kc* | Daily ETc (mm/day) | Phenological Phase* |
| December -January | 4,7 | 0,58 | 2,7 | Four true leaves |
| January | 4,7 | 0,63 | 3,0 | Panicle initiation |
| January | 4,7 | 0,73 | 3,4 | Panicle |
| January | 4,7 | 0,90 | 4,2 | Flowering beginning |
| February | 4,1 | 1,01 | 4,1 | Flowering or anthesis |
| February | 4,1 | 1,08 | 4,4 | Flowering or anthesis |
| March | 5,1 | 1,14 | 5,8 | Milky grain beggining |
| March | 5,1 | 1,00 | 5,1 | Milky grain end |
| April | 5,0 | 0,78 | 3,9 | Mushy grain |
*: Value according to Choquecallata et al. (1991).
Table 3.
Physicochemical parameters present in the research site in the area of Ancovinto.
| Area | Textural type | Depth | Organic matter* | Bulk density | Clay | Silt | Sand | Field capability | Permanent wilting point | Available moisture** |
| (cm) | (%) | (%) | (%) | (%) | a -0,01Mpa (vol.%) | a -1,55MPa (vol.%) | (peso) (%) | |||
| Ancovinto | Sandy loam | 0-30 | 0,51 | 1,76 | 14 | 13 | 73 | 10,5 | 5,2 | 5,3 |
Source: own elaboration based on Agrolab laboratory analysis Ner 191120-125. *. Below 2% of organic matter is considered low. **. A content below 10% of available moisture is considered low.
Disclaimer/Publisher’s Note: The statements, opinions and data contained in all publications are solely those of the individual author(s) and contributor(s) and not of MDPI and/or the editor(s). MDPI and/or the editor(s) disclaim responsibility for any injury to people or property resulting from any ideas, methods, instructions or products referred to in the content. |
© 2024 by the authors. Licensee MDPI, Basel, Switzerland. This article is an open access article distributed under the terms and conditions of the Creative Commons Attribution (CC BY) license (http://creativecommons.org/licenses/by/4.0/).
Copyright: This open access article is published under a Creative Commons CC BY 4.0 license, which permit the free download, distribution, and reuse, provided that the author and preprint are cited in any reuse.


