1. Introduction
With the development of the times, the trend of global warming is getting more and more intense, and the challenges brought by climate change have become the focus of global attention. In order to alleviate the environmental problems caused by global warming, countries according to their own national conditions respectively put forward the "carbon peak" and "carbon neutral" development strategy carbon peak target [
1]; The European Union has already achieved peak carbon in 2000 and carbon neutrality in 2050; the United States will achieve net-zero emissions by 2050 [
2,
3,
4,
5]; and China will achieve peak carbon by 2030 and carbon neutrality by 2060 [
6,
7,
8,
9]. Against this background, the electric vehicle industry has flourished and become one of the important ways to reduce carbon emissions and promote green development [
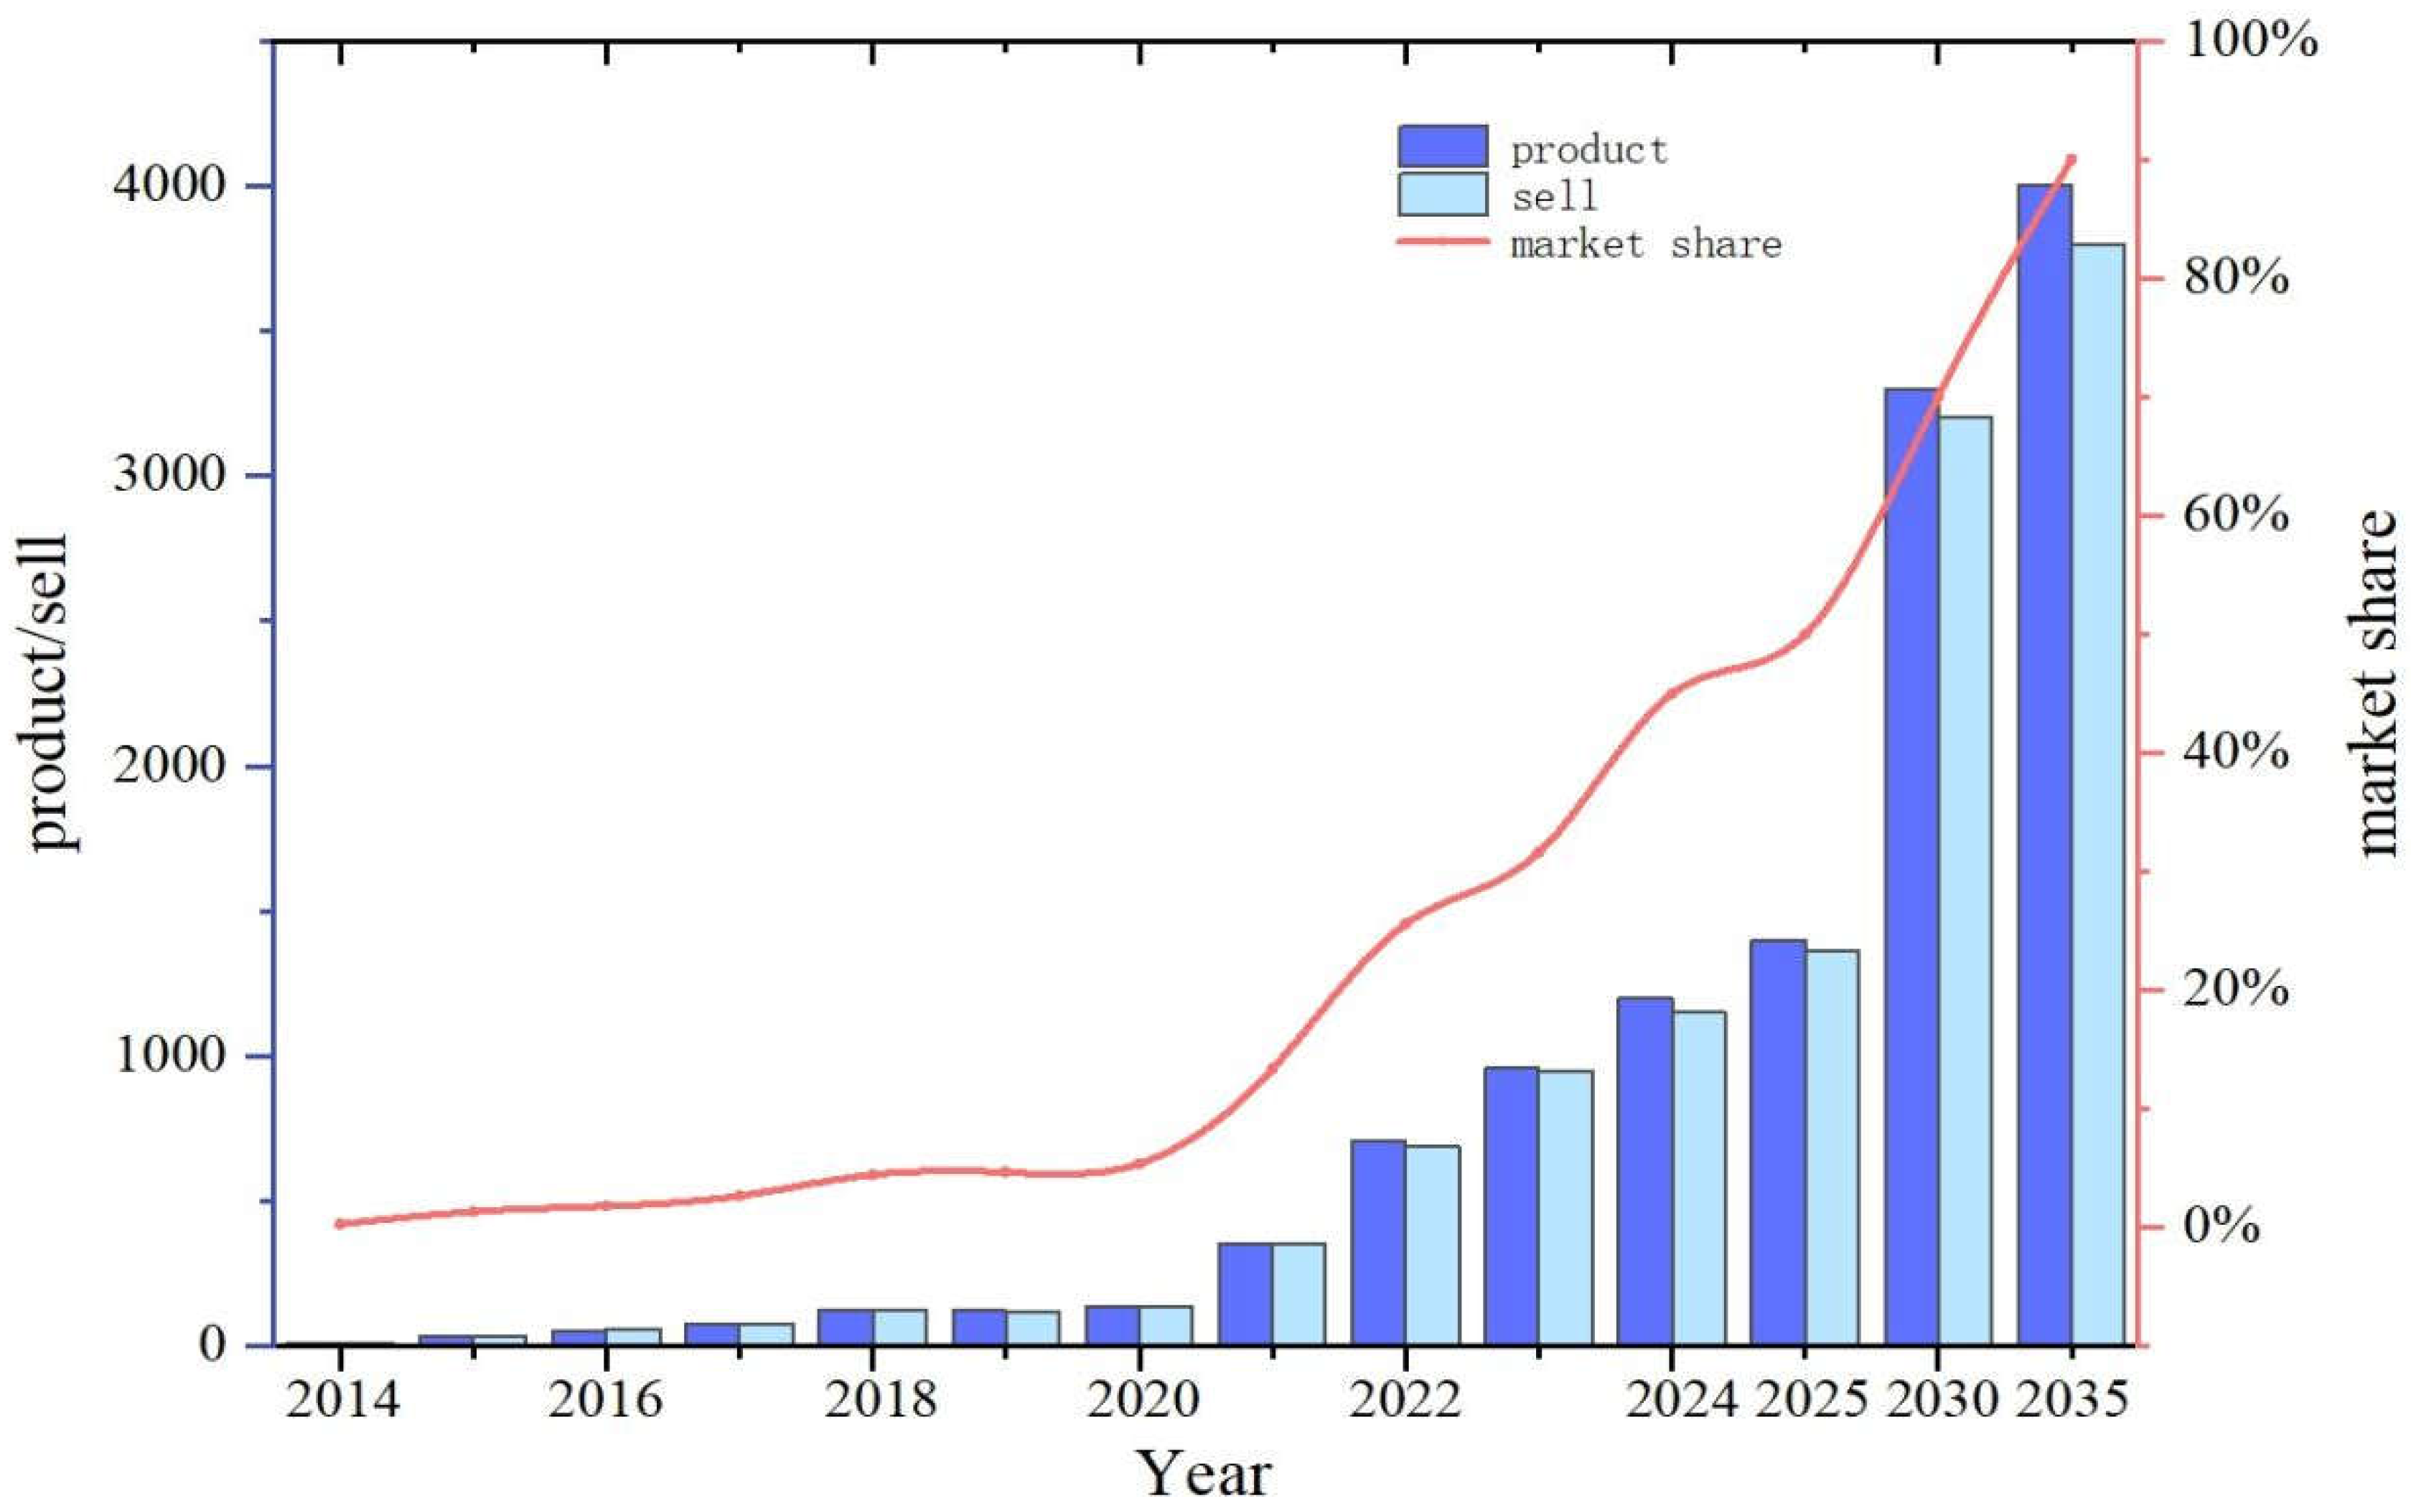
10]. The following
Table 1 and
Figure 1 shows the data and forecasts of China's new energy vehicle production, Sales and market share for the last 10 years and the next 10 years.
Power batteries play a crucial role in the popularization of electric vehicles. Lithium batteries have become the main choice of batteries for new energy vehicles due to their high energy density, low self-discharge rate, and long service life. Among them, ternary lithium batteries (NCM) and lithium iron phosphate batteries batteries (LFP) dominate the lithium battery market [
11]. By the end of 2022, ternary lithium batteries (NCM) accounted for 60% of the global electric vehicle battery market, while the use of lithium iron phosphate batteries (LFP) batteries has increased significantly, with their market share growing from 6% in 2020 to 30% in 2022. The large-scale production and widespread use of batteries has also brought new challenges, namely that the production process generates a large amount of emissions that have a huge impact on the environment and resources, which has led to the need for countries to find reasonable solutions in the face of the dual pressures of environmental protection and resource utilization.
When studying the environmental impacts of lithium iron phosphate batteries (LFP) and lithium ternary (NCM) batteries, a number of factors need to be considered, including energy consumption in the production process, sustainability of material sources, and battery life. lithium iron phosphate batteries (LFP) batteries offer significant advantages in terms of environmental friendliness due to their relatively simple chemical composition (iron and phosphorus). They do not contain rare or toxic metals, are relatively abundant in material resources, and produce less pollution during production. In addition, lithium iron phosphate batteries (LFP) batteries typically have a longer lifetime and can withstand more charge/discharge cycles, reducing the need for resources and the generation of waste.
In contrast, lithium ternary (NCM) batteries do better in energy density and performance, but their production process involves the use of rare metals and toxic substances such as nickel and cobalt. The mining and refining of these metals can have a significant impact on the environment, and the recycling process for the batteries is therefore more complex and expensive.The high energy density of NCM batteries provides longer range and better performance, but the environmental costs cannot be ignored.
In order to deal with this problem, The modelling of 1kWh lithium ternary battery (NCM) and 1KWh lithium iron phosphate batteries (LFP)are established in this paper based on the Life Cycle Assessment (LCA) [
12,
13,
14,
15,
16], and the impacts of ternary lithium batteries and lithium iron phosphate batteries batteries on resources and the environment in the process of raw material acquisition and battery assembly production are investigated carefully.
The environmental impacts of different energy sources in the battery production process vary significantly. The carbon emission factors of the four power generation methods are shown in
Table 2.
Thermal power, as a traditional way of generating electricity, usually uses fossil fuels such as coal or natural gas, whose carbon dioxide and other pollutants released during the combustion process have a negative impact on the environment. In contrast, hydro power, as one of the clean energy sources, utilizes the principle of hydroelectricity generation and does not produce direct greenhouse gas emissions, so its environmental impact is quite low. Wind power and solar power, as representatives of renewable energy sources, produce almost no greenhouse gas emissions and pollutant releases and are highly environmentally friendly. In this study, four power generation structures (thermal, hydro, wind, and solar) are substituted into the production process of power batteries to investigate the impact of energy on the environment.
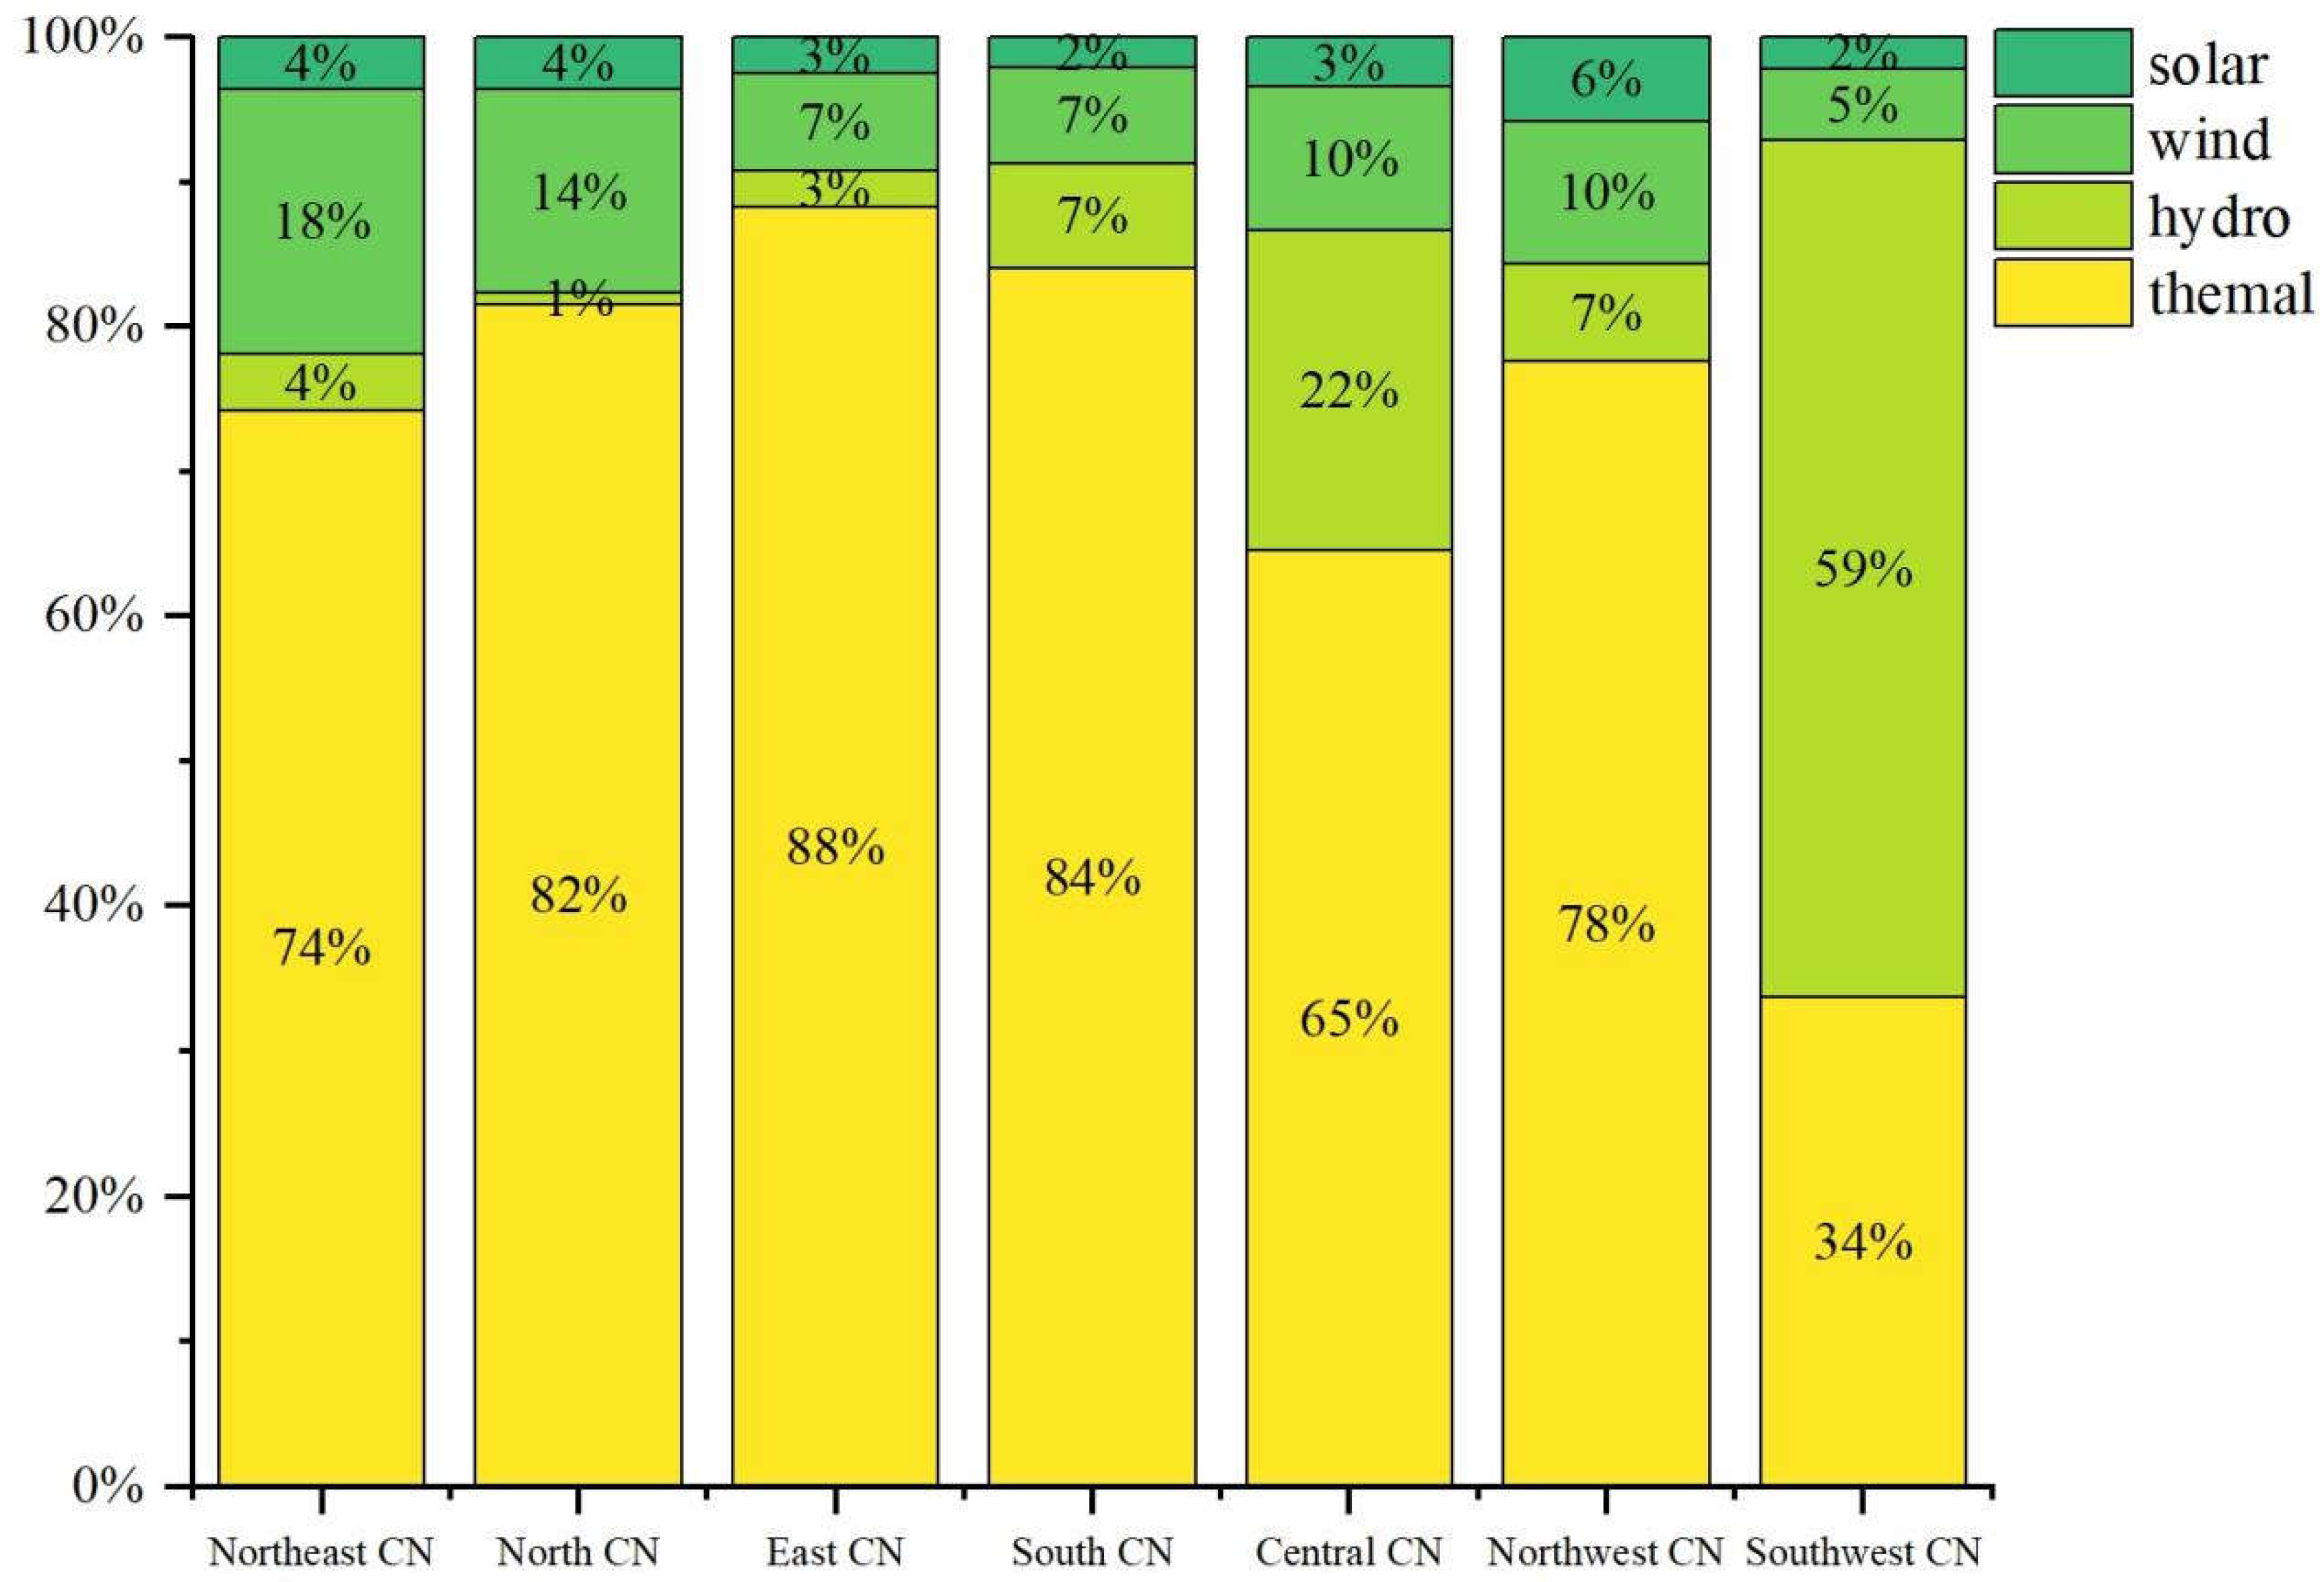
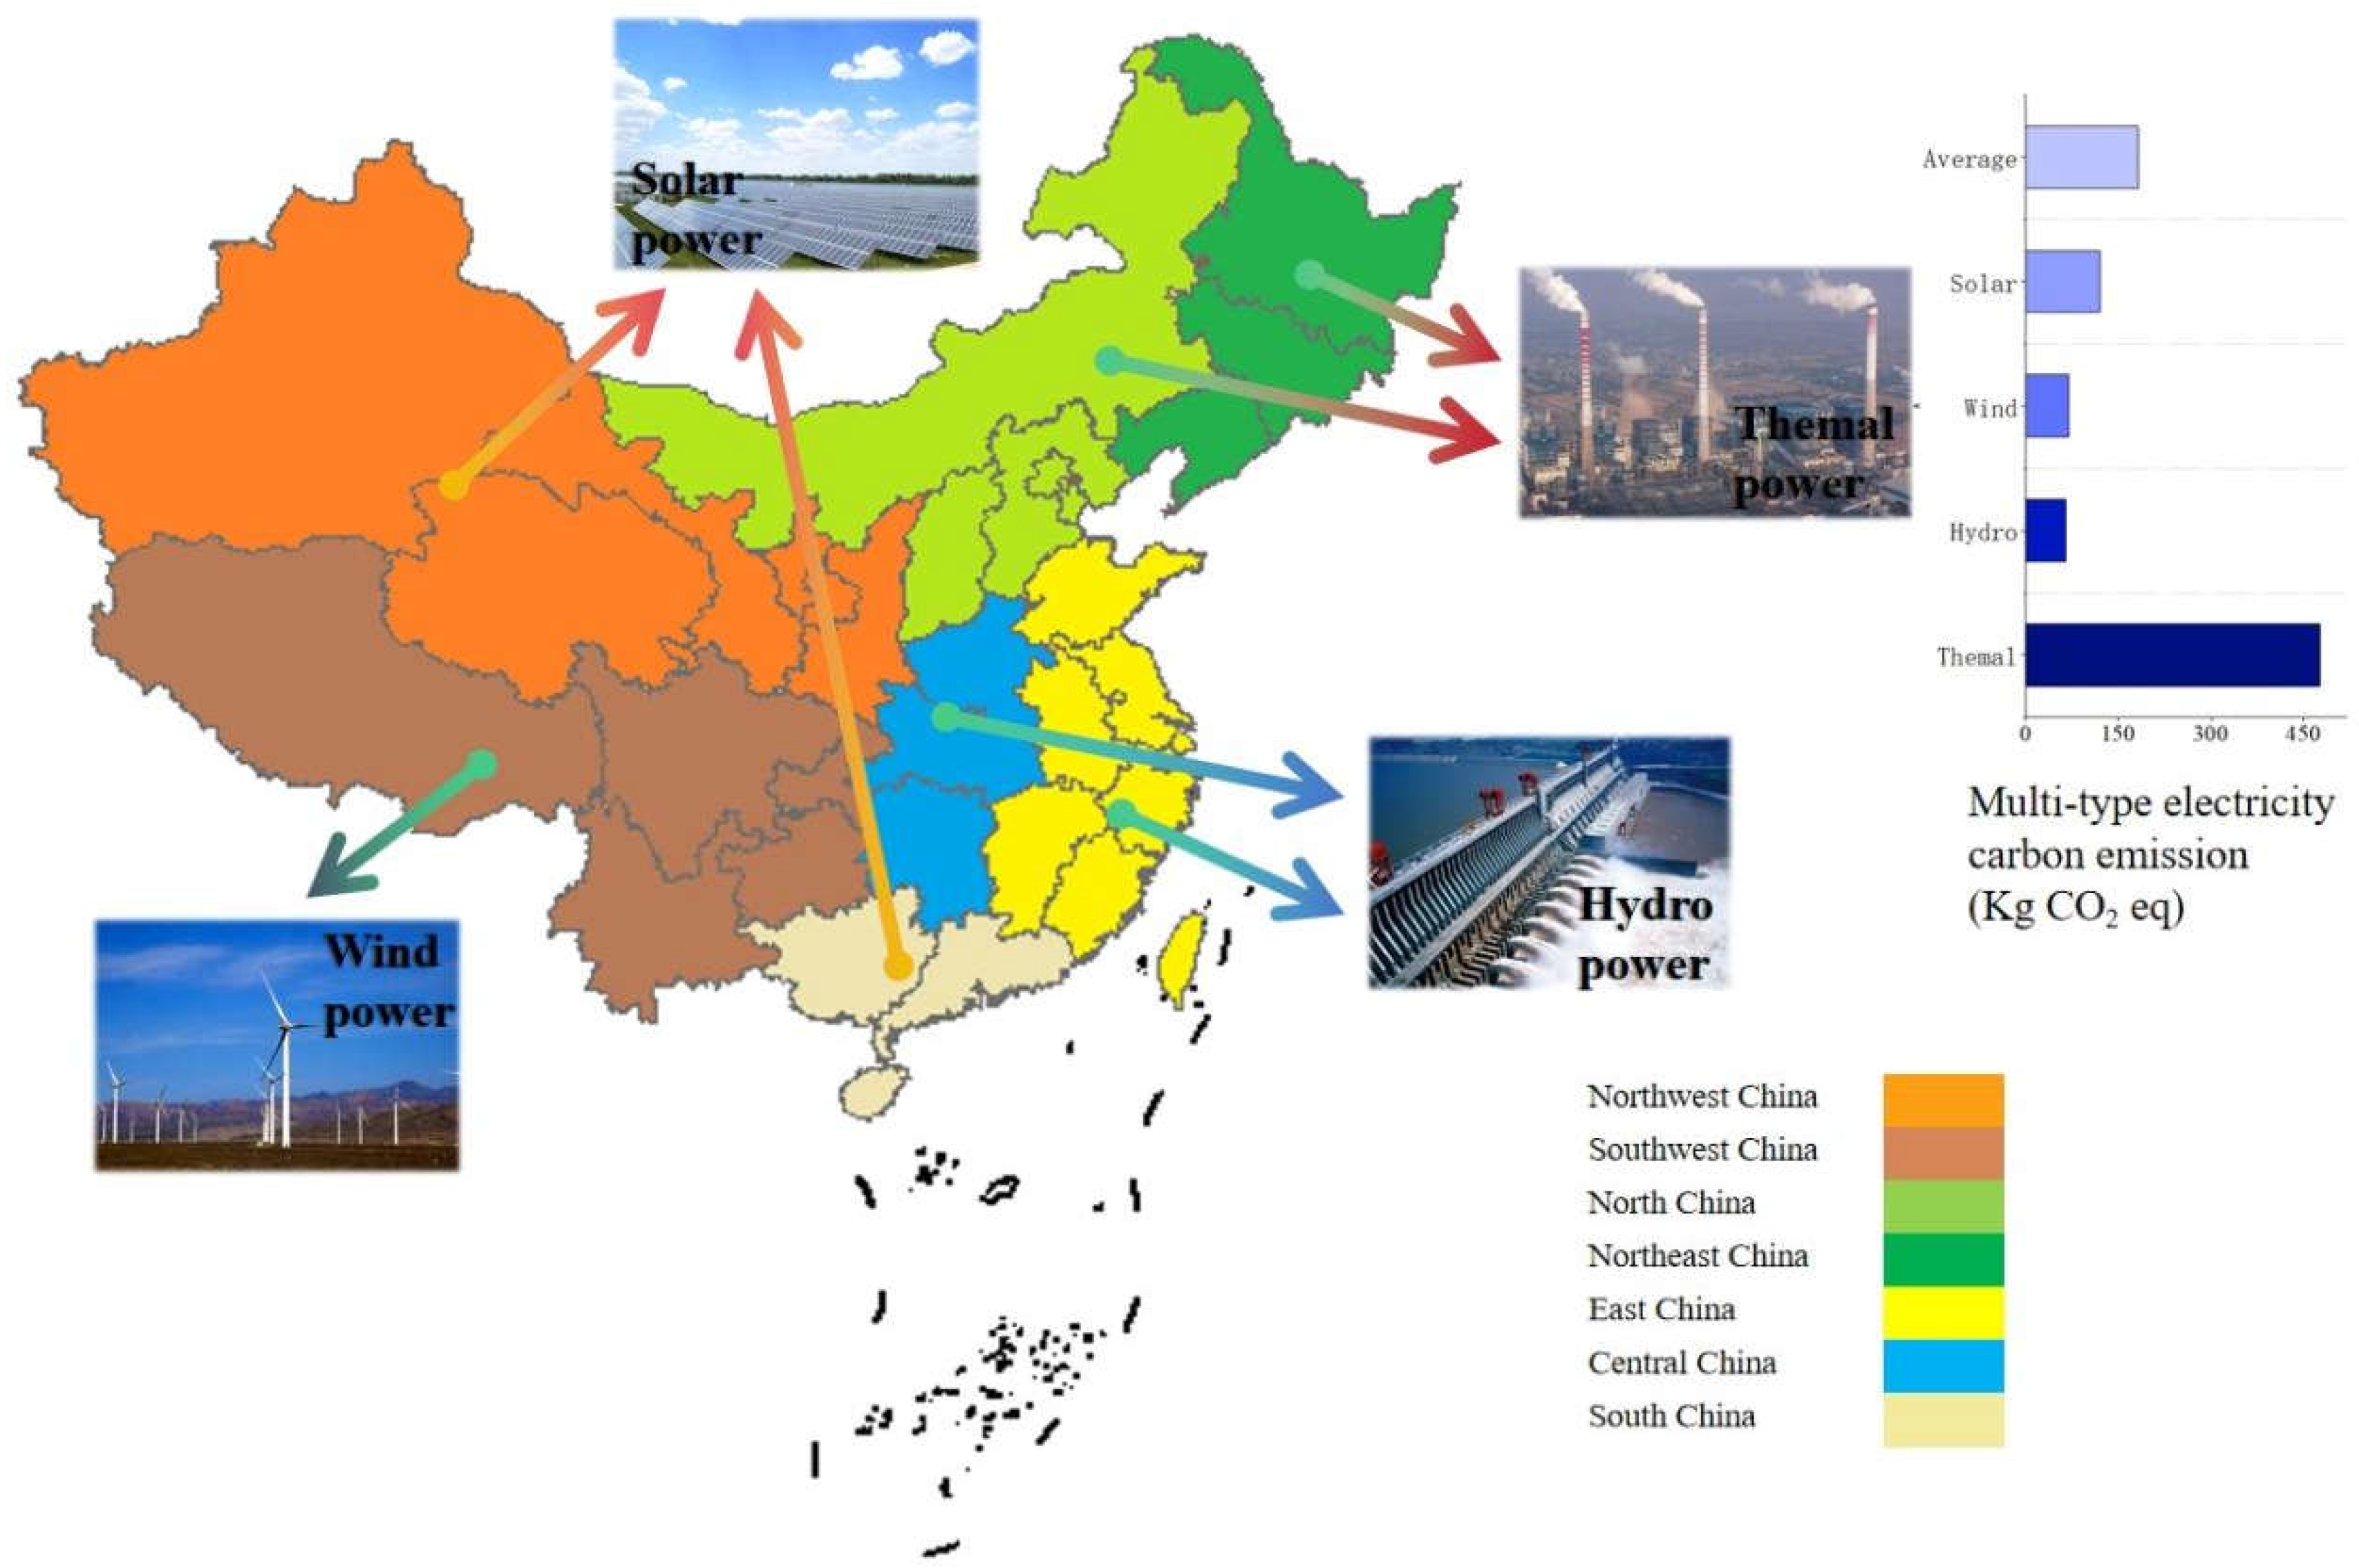
Different regions in China show obvious regional differences in energy structure and power generation methods [
17]. The power generation structure of each region is shown in
Figure 2.
With large coal reserves and good quality, the Northeast and North China regions are important energy bases for thermal power generation. It provides stable power support for the regional economy. However, the large amount of thermal power generation also leads to a large amount of carbon dioxide emissions and environmental pollution problems such as water and soil pollution. Due to its geographical location and level of economic development, East China has a relatively diversified energy mix, including thermal power and hydro power, which is increasing year by year. East China has many rivers and lakes that provide abundant resources for hydro power generation, such as the Qingshan Hydro Power Station in Jiangxi Province and the Qingshan Hydro Power Station in Jiangsu Province, both of which provide a large amount of green energy for local production and life. Central China also relies on coal and natural gas, but some areas have also developed hydro power, such as the Three Gorges Dam in Hubei. As one of the world's largest hydro power plants, the Three Gorges Dam is able to provide about 100 billion kilowatt-hours of electricity annually, which plays a key role in reducing coal use and increasing the share of clean energy. South China performs better in terms of environmental friendliness due to its favourable climatic conditions, more extensive development of wind and solar power, and higher proportion of clean energy. Southwest China occupies an important position in China's wind power sector. The highlands and mountainous terrain of Southwest China provide superior natural conditions for wind power generation, especially in the Sichuan Basin, the Yunnan Plateau, and the mountainous regions of Guizhou. As a clean energy source, wind power has a significant role to play in reducing greenhouse gas emissions and dependence on traditional fossil energy sources. Northwest China is an ideal region for the development of solar power in China due to its unique geographical and climatic conditions. With their vast lands and high altitudes, and long hours of sunshine, these regions have very high potential for solar energy resources. China has established several large-scale solar solar (PV) power plants in Qinghai and Xinjiang, which have become one of the important solar power generation bases in China and the world. In this study, China is divided into seven regions - Northeast China, North China, East China, South China, Central China, Northwest China and Southwest China - based on its regional characteristics. The power generation structure of each region is substituted into the production chain to analyse the environmental impact of carbon emissions from the electricity sources used for the production of EV batteries, respectively.
In the process of modern social development, water pollution, soil pollution, atmospheric pollution has caused widespread concern. Battery production process pollutants directly lead to the destruction of the ozone layer, battery production stage of industrial wastewater produced in the water nitrogen, phosphorus and other nutrient salts in the water to rise leading to eutrophication of the water body and serious ecological pollution, this paper focuses on the ozone depletion, eutrophication loss, Eco-toxicity loss of the environmental impact of the production of power batteries to carry out an in-depth analysis.
Through this structural, regional and segmental analysis,a clear reference for the future industrial layout of power batteries is designed and the sustainability and green development of the battery industry is promoted. This research not only provides ideas for producers to improve their manufacturing processes, but also contributes an important part to the realization of global climate goals and environmental objectives.
2. Method
2.1. Definition of Objective and Scope
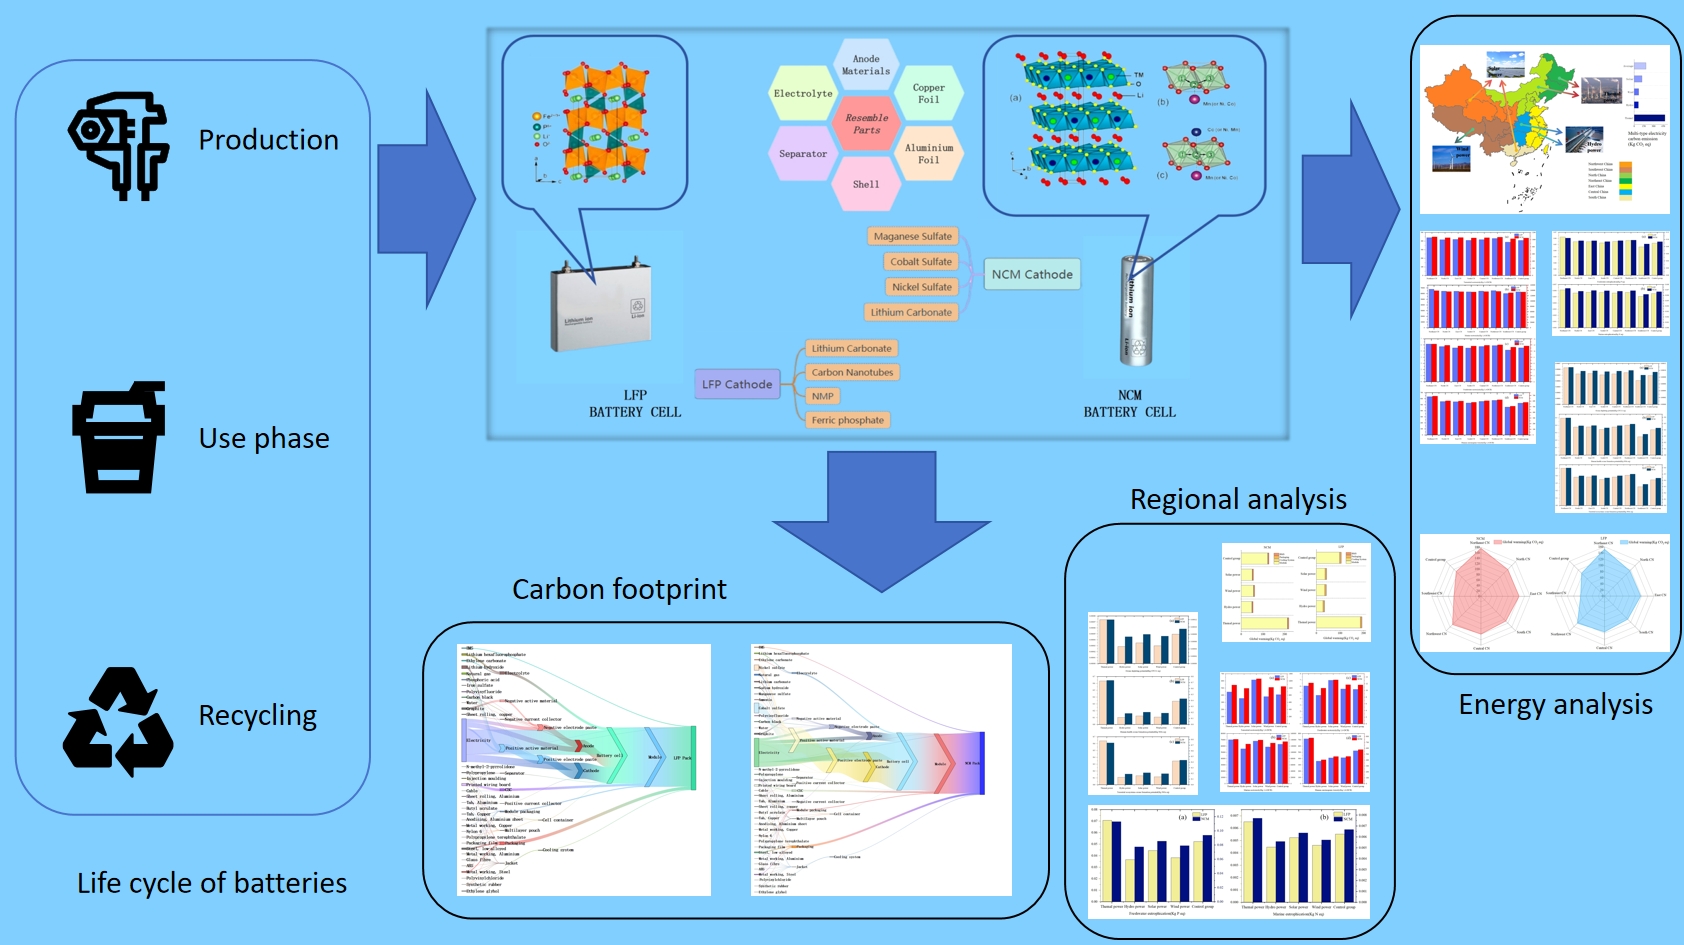
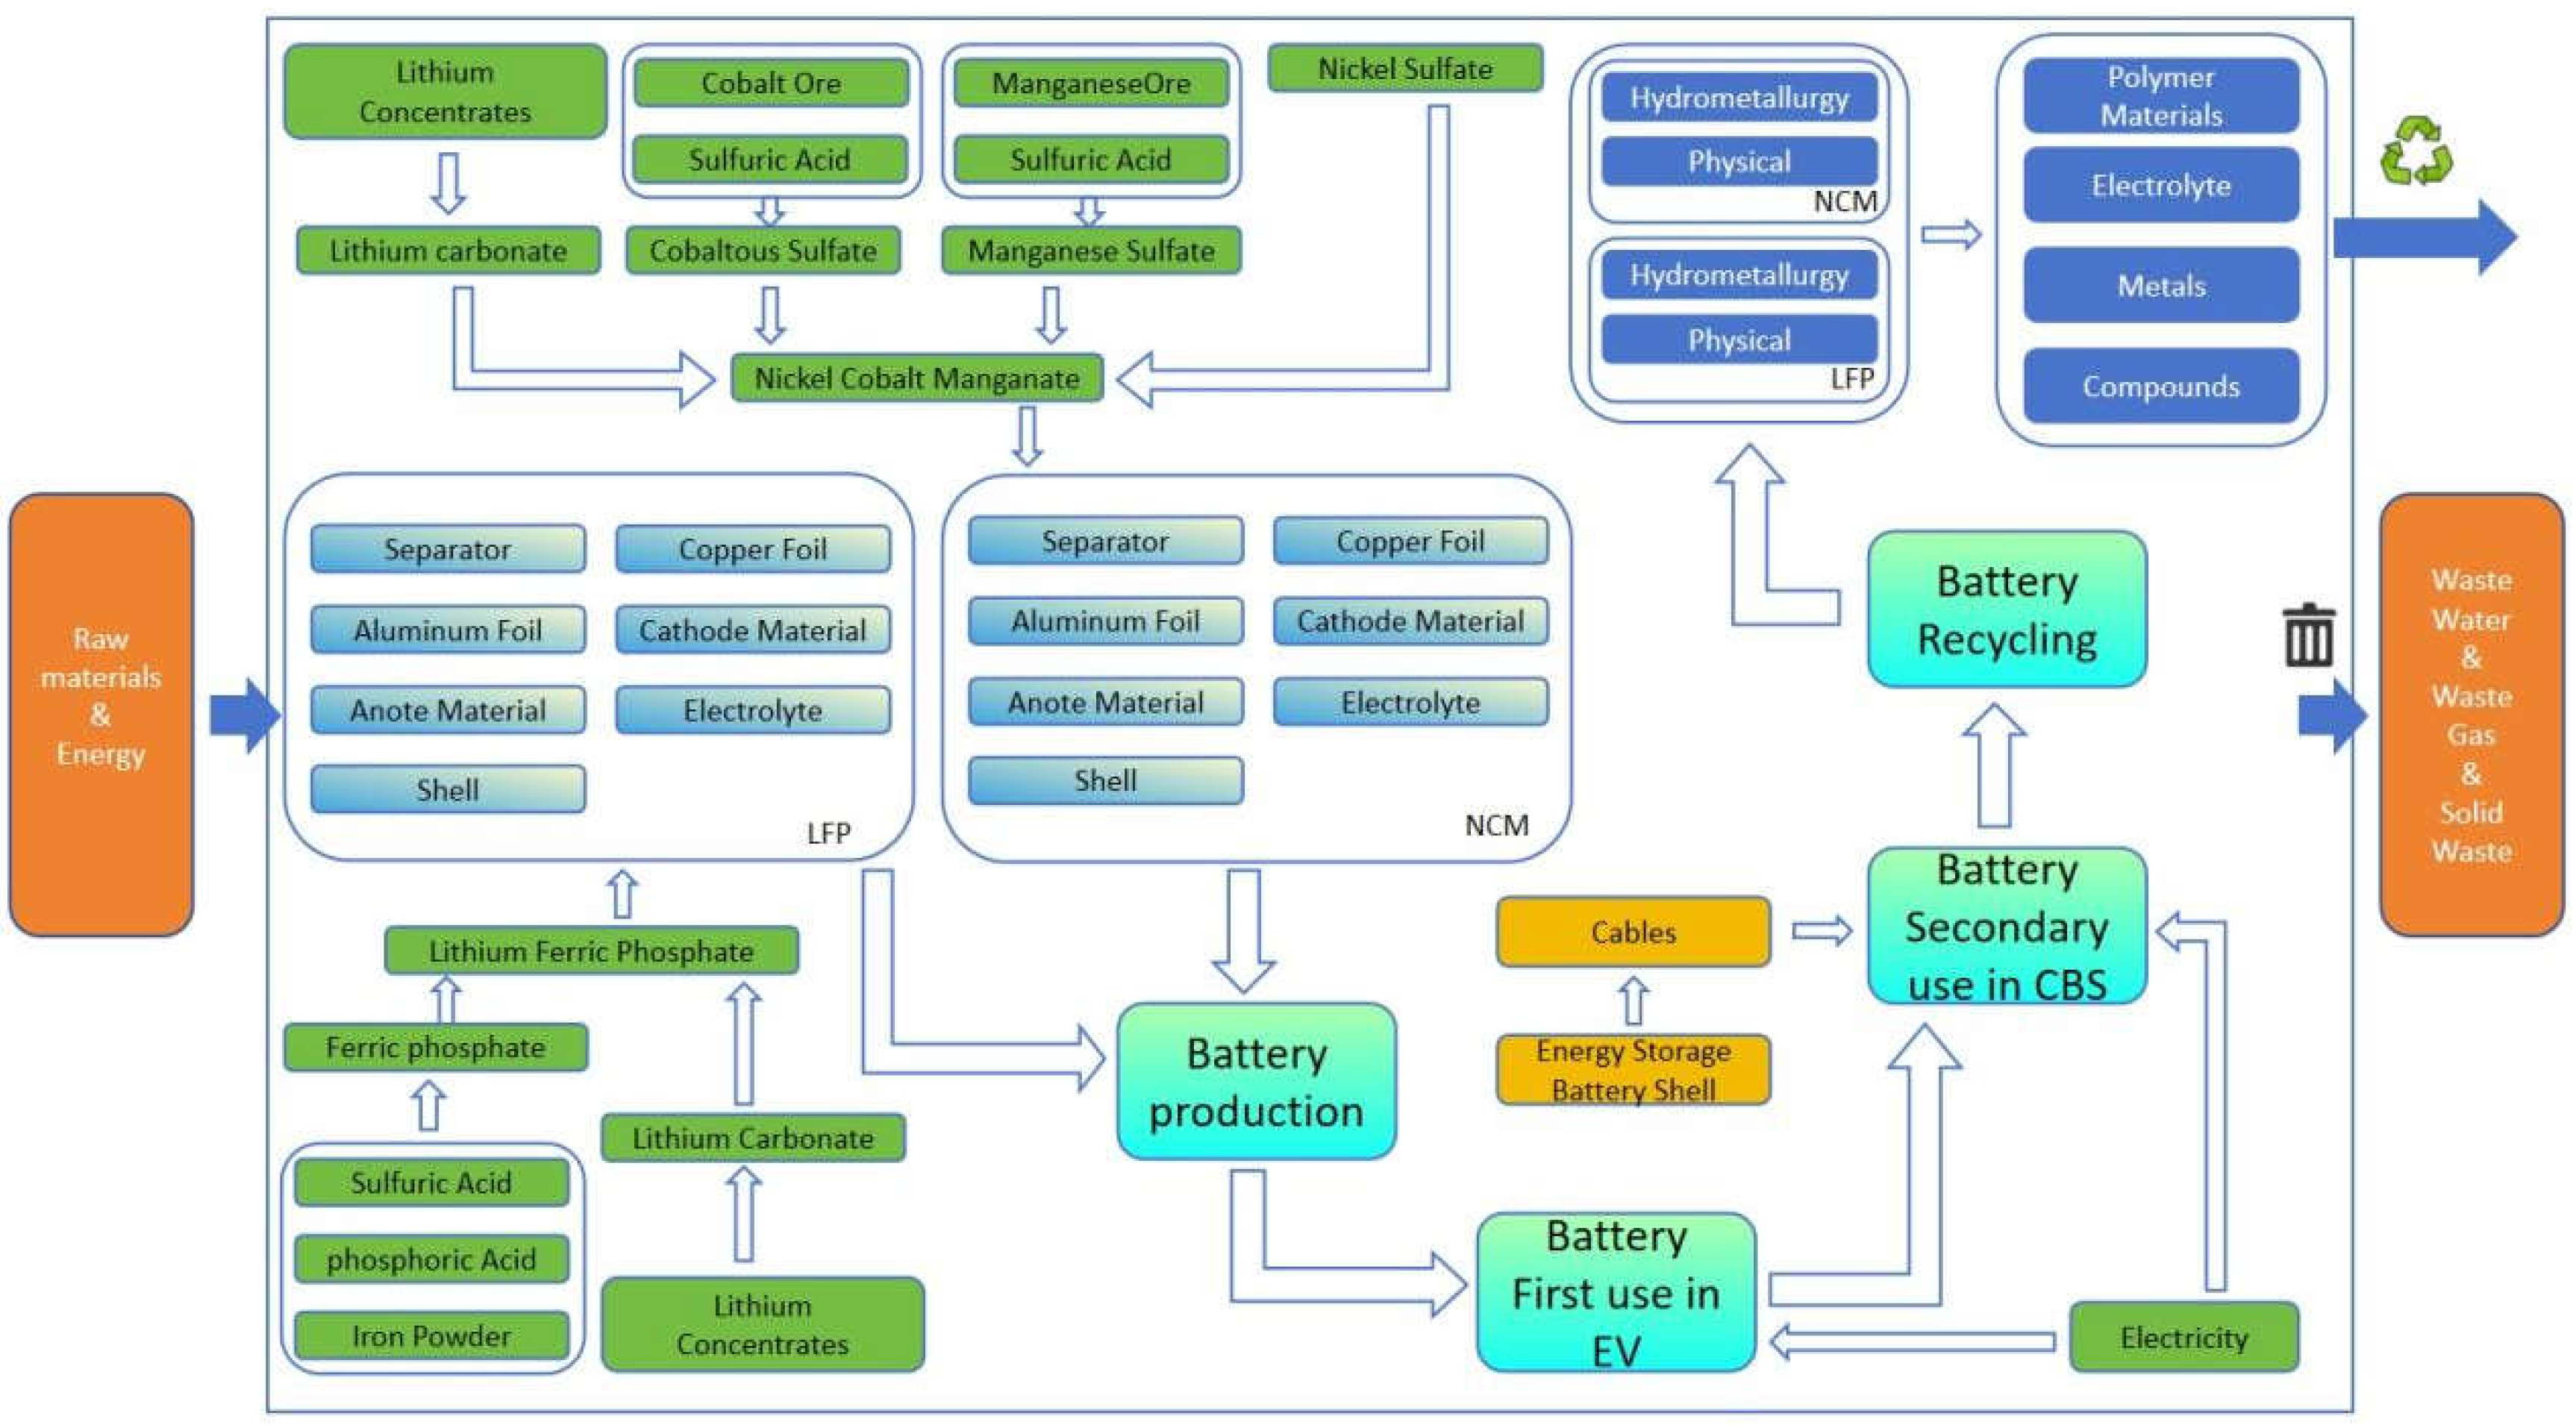
The objective of this study is to establish a life cycle assessment (LCA) model based on lithium iron phosphate batteries (LFP) and lithium ternary (NCM) batteries, and to comprehensively compare and analyse the differences between the two types of batteries in terms of resource utilization and environmental impacts.The definition of the life cycle system boundaries of the LFP and NCM batteries is illustrated in
Figure 3, which demonstrates the entire process from the raw material acquisition, to the production of the power battery, to the subsequent use of the recycling stage. process. The study focuses on analyzing the impacts on resources and the environment through different sources of electricity used for production (thermal power, hydro power, wind power and solar power) respectively. Meanwhile, considering the regional division of China,it is divided into seven regions in this study: Northeast, North, East, South, Central, Northwest, and Southwest, and the impacts of electricity used for the production of power batteries on the environment and human body in each region are analyzed separately [
18,
19]. In the study, both NCM and LFP batteries are investigated with 1 kWh monomer, and the mileage of electric vehicles is 200,000 km [
20,
21,
22].
2.2. Life Cycle Inventory Analysis
In the life cycle inventory analysis phase, this study uses a variety of real data sources, including data provided by local enterprises, previous research results, industry statistical yearbooks, and publicly available data from government regulations and standards. In addition, the back-end data are mainly based on SimaPro 9.0 software and the built-in Ecoinvent 3.5 database. Data use is divided into three segments:
(1) Raw material acquisition and battery assembly production process: Constructing LCA models for LFP and NCM power batteries.
(2) Power sources in the production process: Substitute different power generation sources (thermal power, hydro power, wind power and solar power) into the production process of power batteries, and analyse their impacts on resources and the environment.
(3) Power analysis by regional division in China: Substitute the power generation structure of each region into the production process of power batteries, and analyse its impact on resources and the environment.
In order to ensure the accuracy and representativeness of the data,careful and rigorous organization and analysis, extracted relevant and representative data are carried out, and LCA models of all aspects of the life cycle of LFP and NCM batteries are constructed .
2.2.1. Power Cell Production
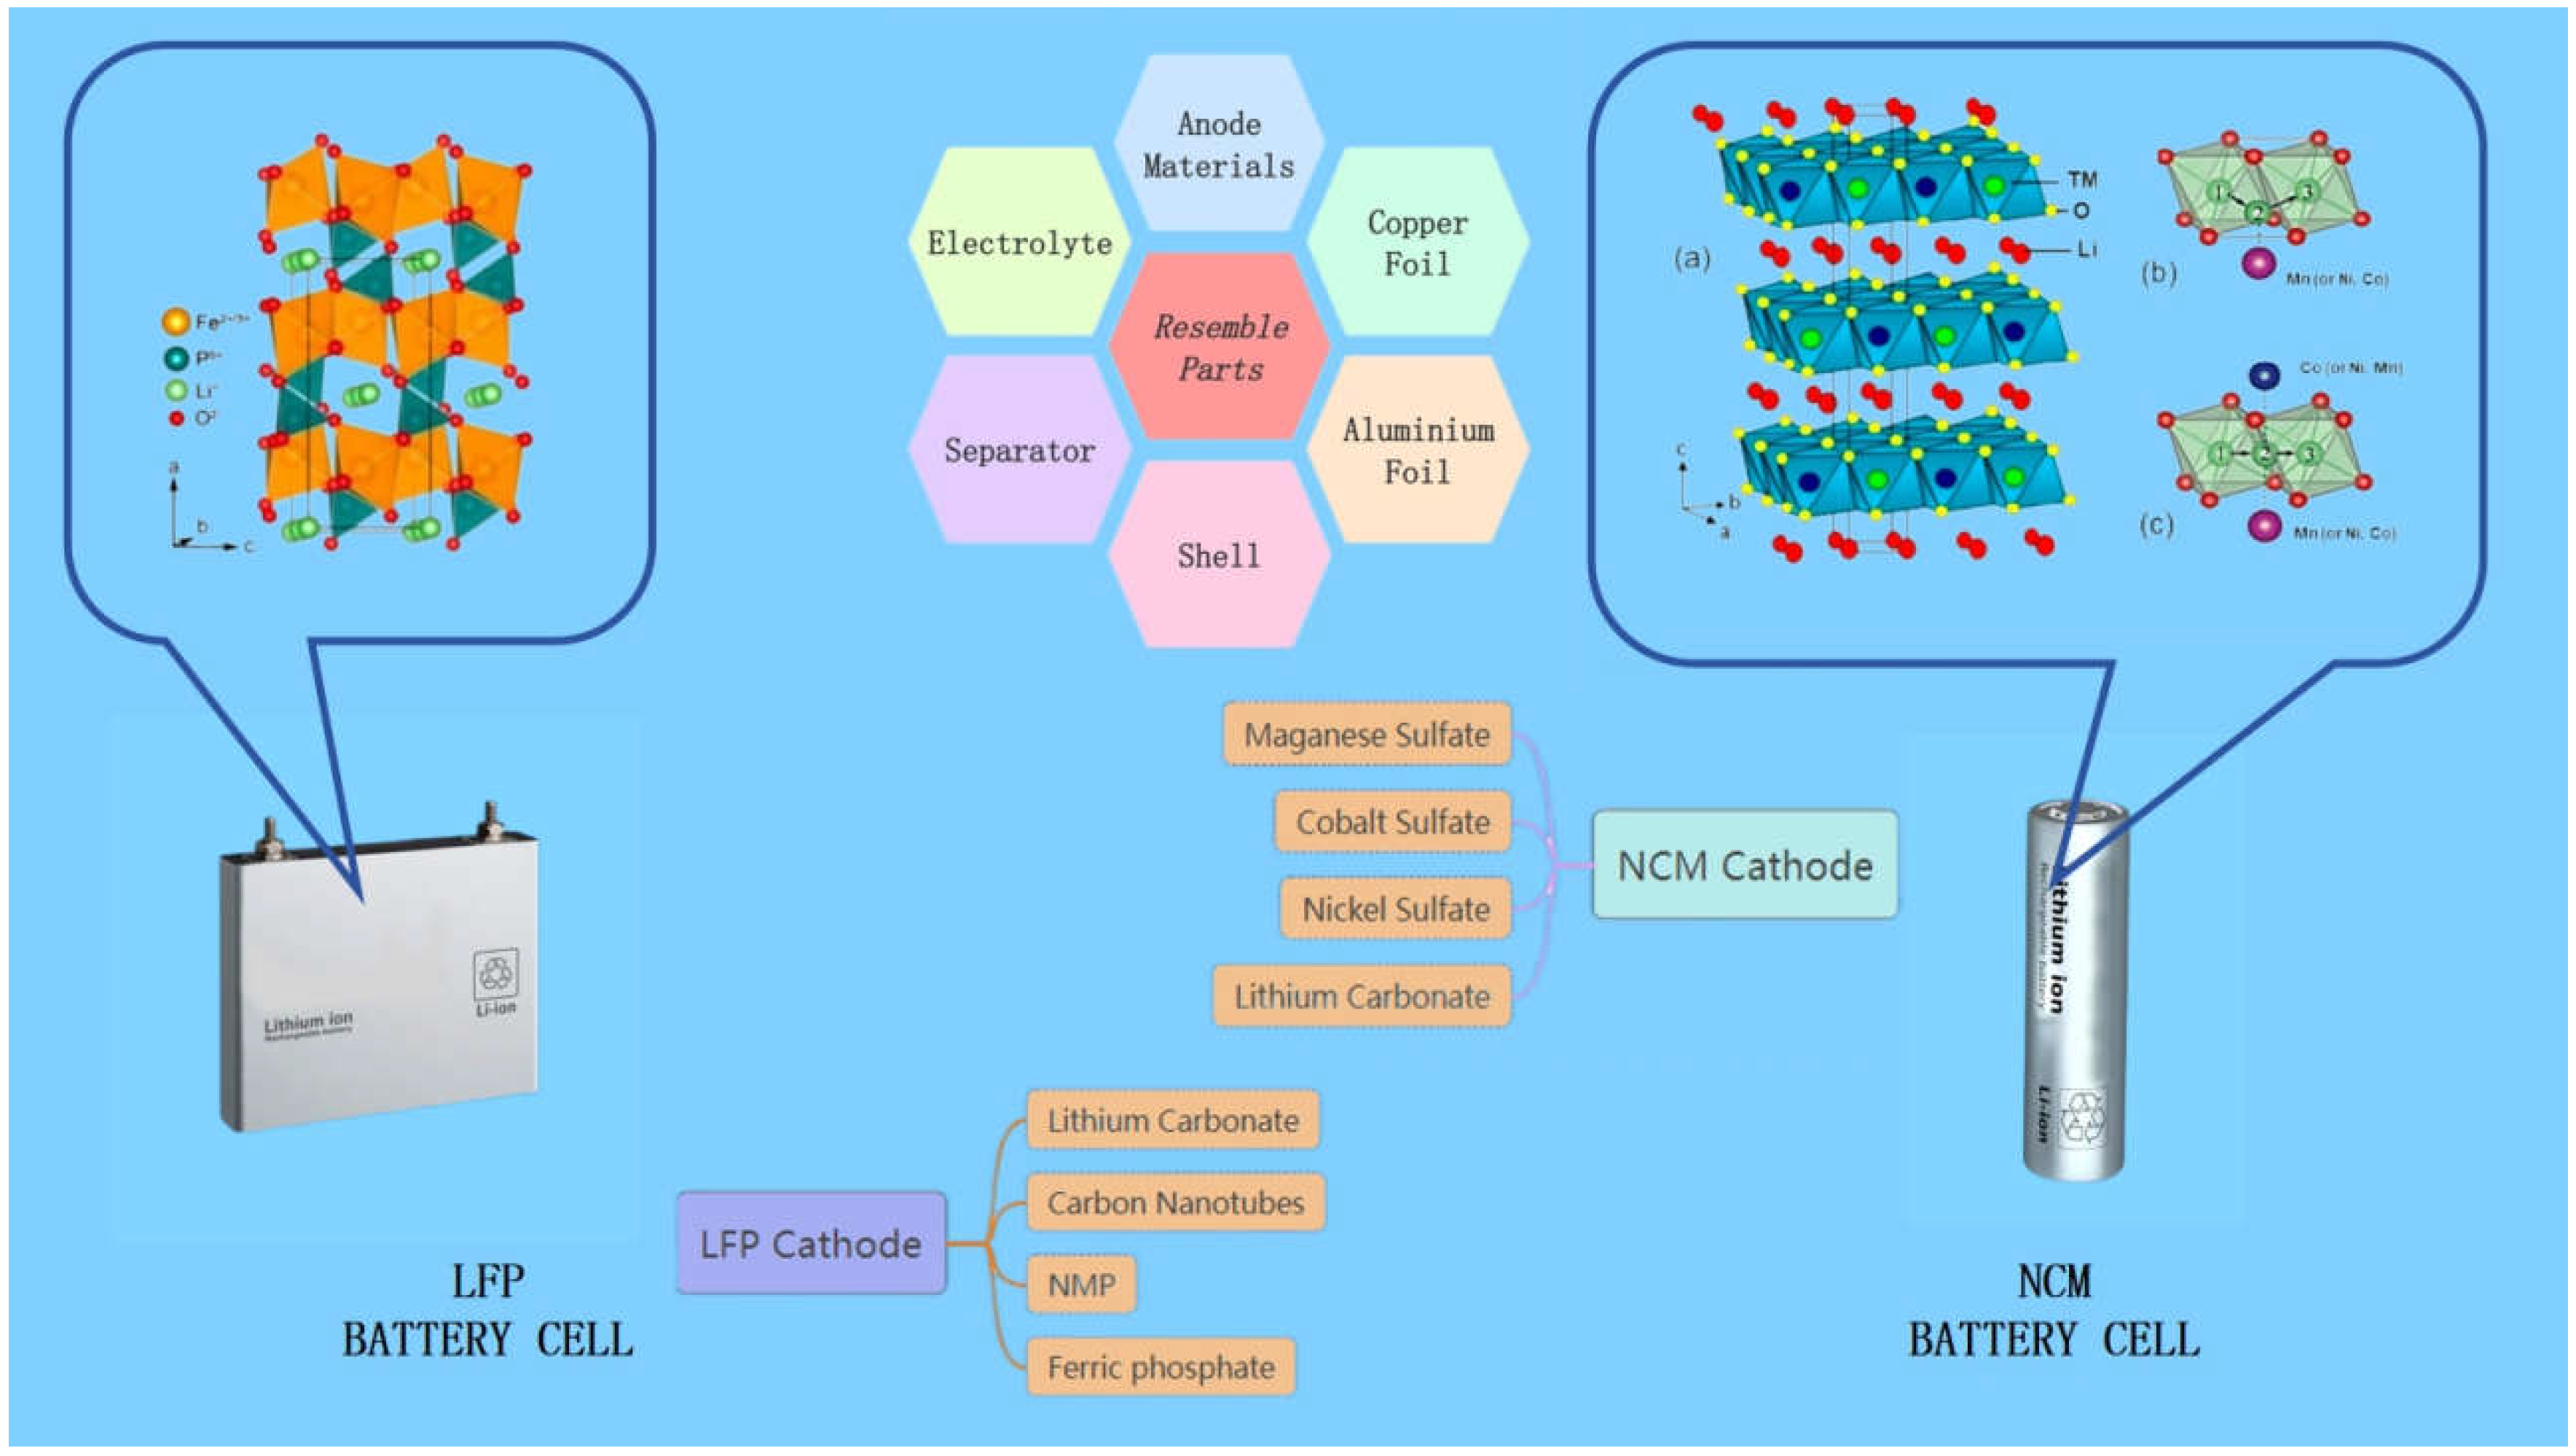
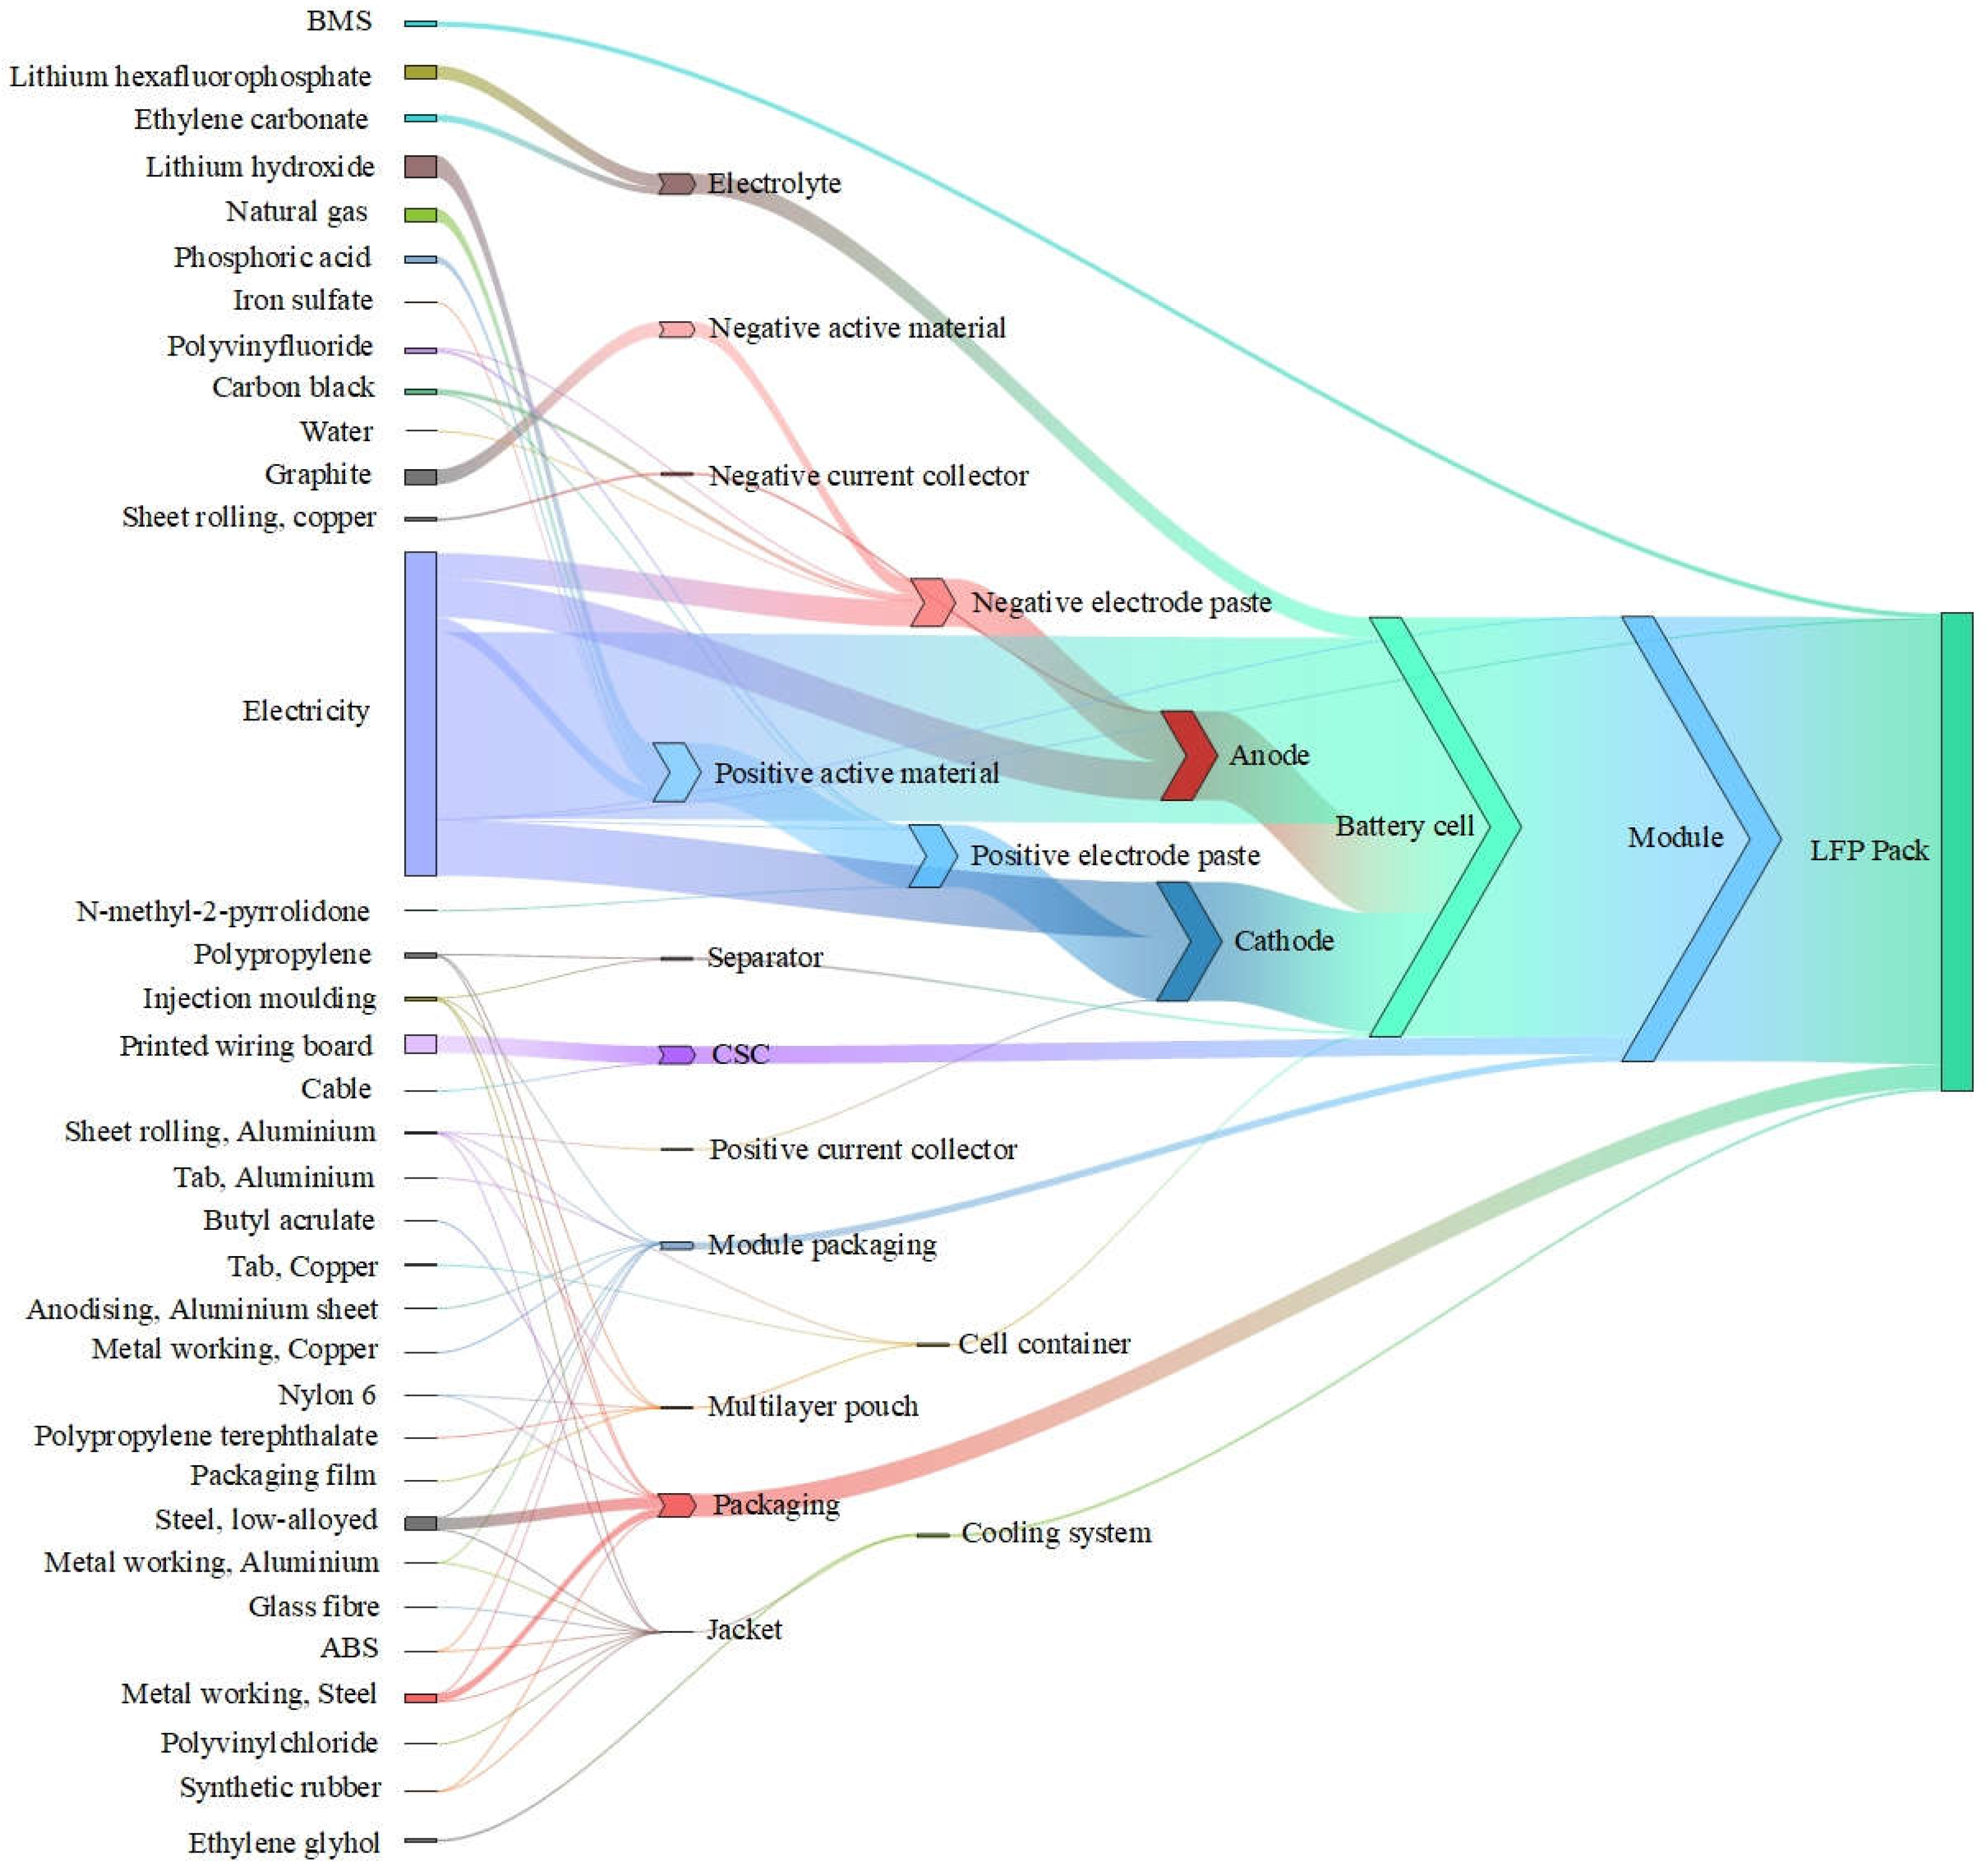
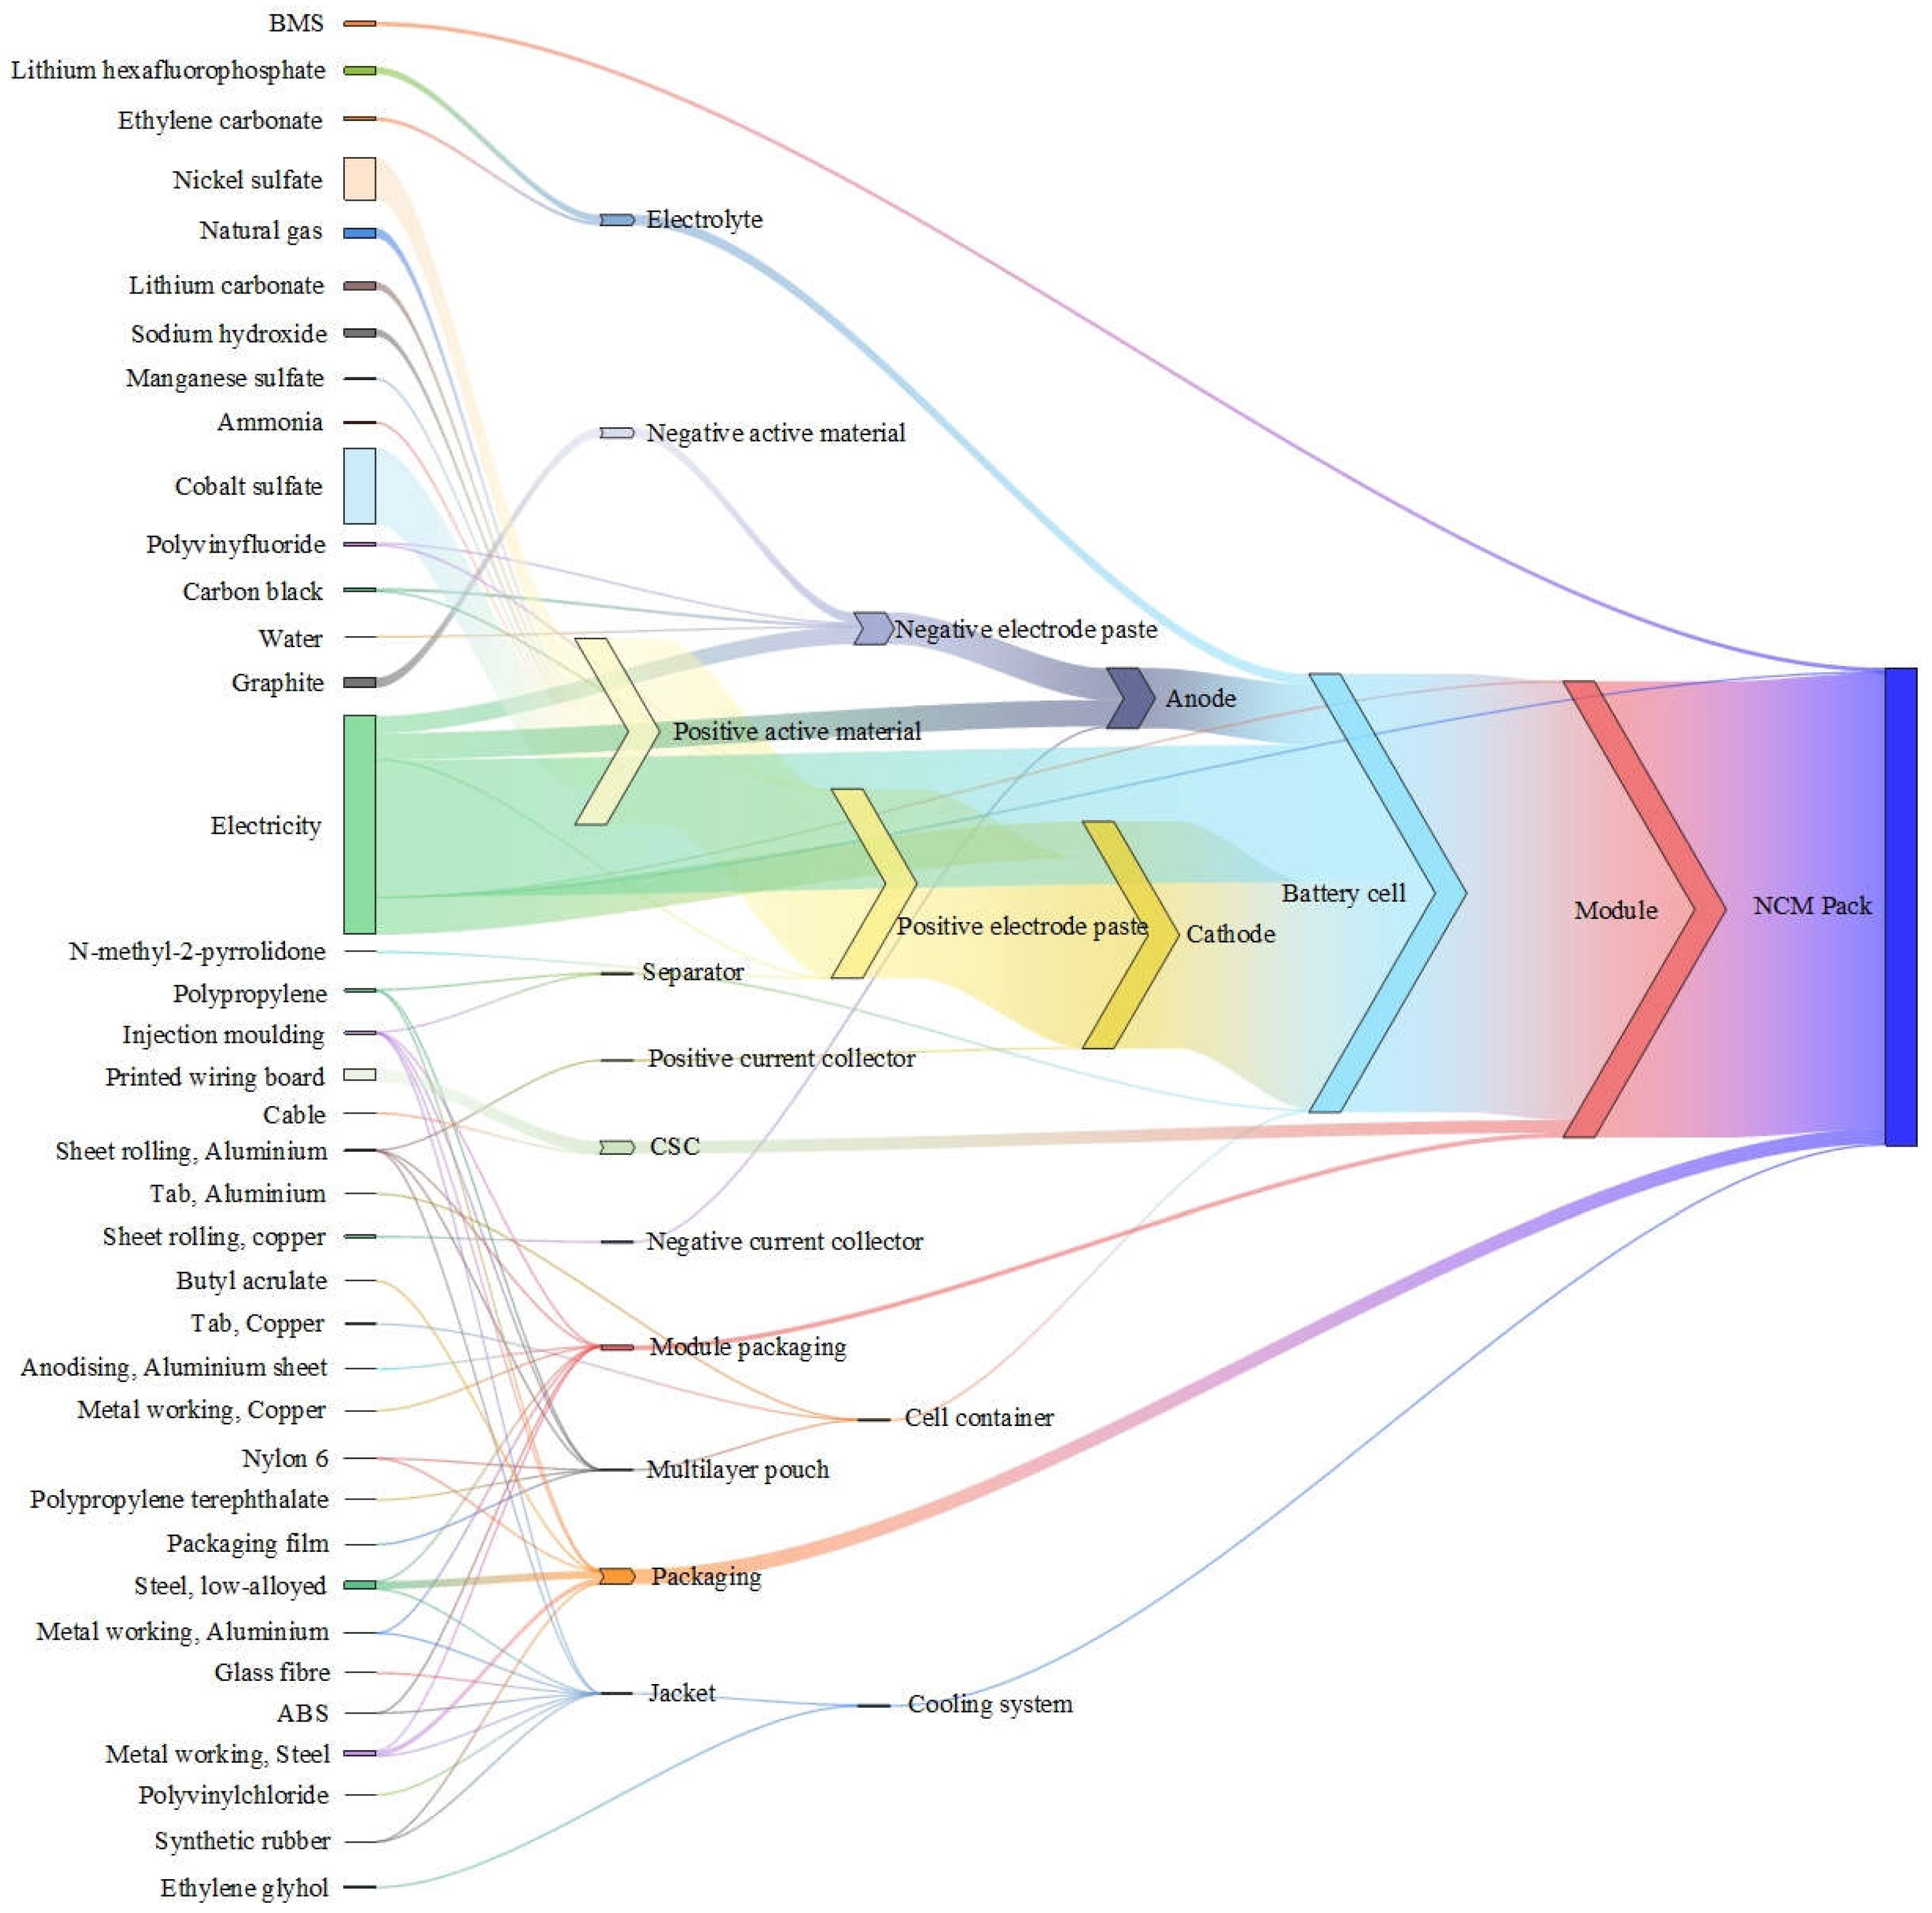
The life cycle inventory analysis of the battery production phase covers data on materials required, energy consumed and emissions during raw material extraction, component manufacturing, and battery assembly and moulding.NCM and LFP batteries are modularly grouped according to the LCA requirements as shown in
Figure 4.The production processes of LFP and NCM batteries are mostly similar in China, covering similar anode, copper foil, aluminium foil, diaphragm, electrolyte and casing components. While the cathode has its own unique composition, the cathode of the LFP battery is made of olivine structure, which is mainly made of iron phosphate and lithium carbonate materials, ensuring the safety and stability of the battery [
23]. In contrast, the cathode of NCM batteries consists of ternary precursors of nickel, cobalt, and manganese metals, sulphate, and lithium carbonate, which form a hexagonal crystal layer structure of the α-NaFeO2 type, a structure that provides high energy density and excellent charging performance [
23,
24,
25]. In addition, the energy structure in production is calculated, including the power structure, material mass and energy flow in China. All materials and energy used in the production process are kept proportional to the functional unit of the product. Detailed inventory data can be found in background data S1-S25. These data cover all aspects of the process from the extraction of mineral resources, the transport and processing of raw materials, the manufacture of the battery components up to the completion of the final battery assembly, ensuring that the entire life cycle is covered in full detail.
Numerous theoretical formulas are involved in the battery manufacturing process, and this study mainly uses the following important formulas as the basis to provide theoretical support for the life cycle model.The symbols involved in the operations of the following formulas are shown in
Table 3.
The theoretical capacity of the electrode material, i.e. assuming that all lithium ions in the material are involved in the electrochemical reaction The value of the capacity that can be provided is calculated by the following formula:
LiFePO4 Molar mass 157.756 g/mol and its theoretical capacity is:
Ternary materials NCM(1:1:1)(Li;Ni;1/3Co;1/3Mn;1/3O2) has a molar mass of 96.461g/mol and a theoretical capacity is:
In the graphite anode, lithium embedded in the maximum amount of lithium, the formation of lithium-carbon inter-layer compounds, that is, six carbon atoms combined with a Li. 6 C molar mass of 72.066 g/mol, the maximum theoretical capacity of graphite is:
These calculated values are the theoretical gram capacity, and to ensure that the material structure is reversible and the actual lithium ion de-embedding coefficient is less than 1, the actual gram capacity of the material is calculated by the formula:
Battery design capacity is the theoretical maximum amount of power that a battery can store and release under specific conditions, battery design capacity:
The N/P ratio is the mass ratio of the negative electrode (Negative electrode, N) to the positive electrode (Positive electrode, P) material in a battery. This ratio is critical to the performance and safety of the battery, and the formula for calculating the N/P ratio:
The N/P ratio of graphite negative electrode type batteries should be greater than 1.0, generally at 1.04-1.20, which is mainly for safety design.However, when the N/P is too large, the irreversible capacity loss of the battery leads to low battery capacity and lower battery energy density.
Finally, mass/volume energy density is an important indicator for evaluating the performance of batteries, which expresses the energy stored per unit mass of the battery. The formula is:
Mass energy density formula:
Volumetric energy density formula:
In this study,the mass energy density formula is chosen to evaluate battery performance.
Combining the background data and the above formulas, the mass energy density of LFP is about 95Wh/Kg, and the mass energy density of NCM is about 120Wh/Kg, and this result is attached together with the background data.
2.3. Life Cycle Impact Assessment
In the life cycle assessment stage, this study conducted a comprehensive assessment study of the battery's life cycle based on the ISO 14040 standard [27,28,29], with a special focus on the carbon footprint of the battery in the production stage. Product modelling is done using Simapro 9.0 software, and the carbon footprint and environmental impact evaluation is done using the ReCiPe2016 methodology [29,30].The ReCiPe2016 assessment methodology consists of 18 environmental indicators, which are categorized into three main categories, namely, atmospheric impacts, water impacts, and terrestrial impacts, in order to assess in detail the impacts on resources and the environment over the life cycle of the battery.
Through these detailed assessments and comparisons, this study not only provides a comprehensive and systematic analysis of the resource and environmental impacts of LFP and NCM batteries under different production conditions, but also provides valuable references and guidance for the sustainable development and green transformation of the future electric vehicle power battery industry.
3. Results and Discussion
3.1. Carbon Footprint Results
The full-cycle carbon emissions of batteries are concentrated in the production phase. Complex production processes and significant energy consumption in the production stage make the full-cycle carbon footprint of batteries ambiguous. This study provides a detailed investigation of the carbon footprint of the battery production phase based on the IPCC 100a methodology. In order to show more clearly the carbon emissions of the battery structure and major component types, this study explores the flow direction of carbon footprints in the production stage of power batteries based on module division. The carbon emission intensity and carbon footprint trend diagrams of NCM and LFP batteries are established, as shown in
Figure 5 and
Figure 6.
Generally speaking,the carbon emissions in the battery production process mainly come from energy consumption, raw material acquisition and production process emissions.The overall carbon emissions of NCM batteries are significantly higher than those of LFP batteries, mainly due to the high energy consumption and heavy carbon footprint of nickel, cobalt, and manganese mining and processing in NCM batteries. lithium iron phosphate batteries, which is used in LFP batteries, has a lower carbon emission during refining and production, whereas nickel and cobalt in NCM batteries result in a higher carbon emission. Although electricity consumption during manufacturing is one of the main sources of carbon emissions for both types of batteries, the use of different materials in the manufacturing of the batteries leads to large differences in overall carbon emissions.
3.2. Energy Analysis
The sources of electricity used in the production process are classified into five types: control (based on a China-wide power generation mix, with thermal, hydro, wind, and solar weighted according to a specific ratio), solar, wind, hydro, and thermal. These different sources of electricity are used to perform energy analyses for the production of the two battery types, LFP and NCM, respectively, and the related graphs are plotted.7, 8, 9, and 10.These graphs show the comparative environmental impacts of the different energy types in the production of the two battery types.
3.2.1. Carbon Emission Analysis
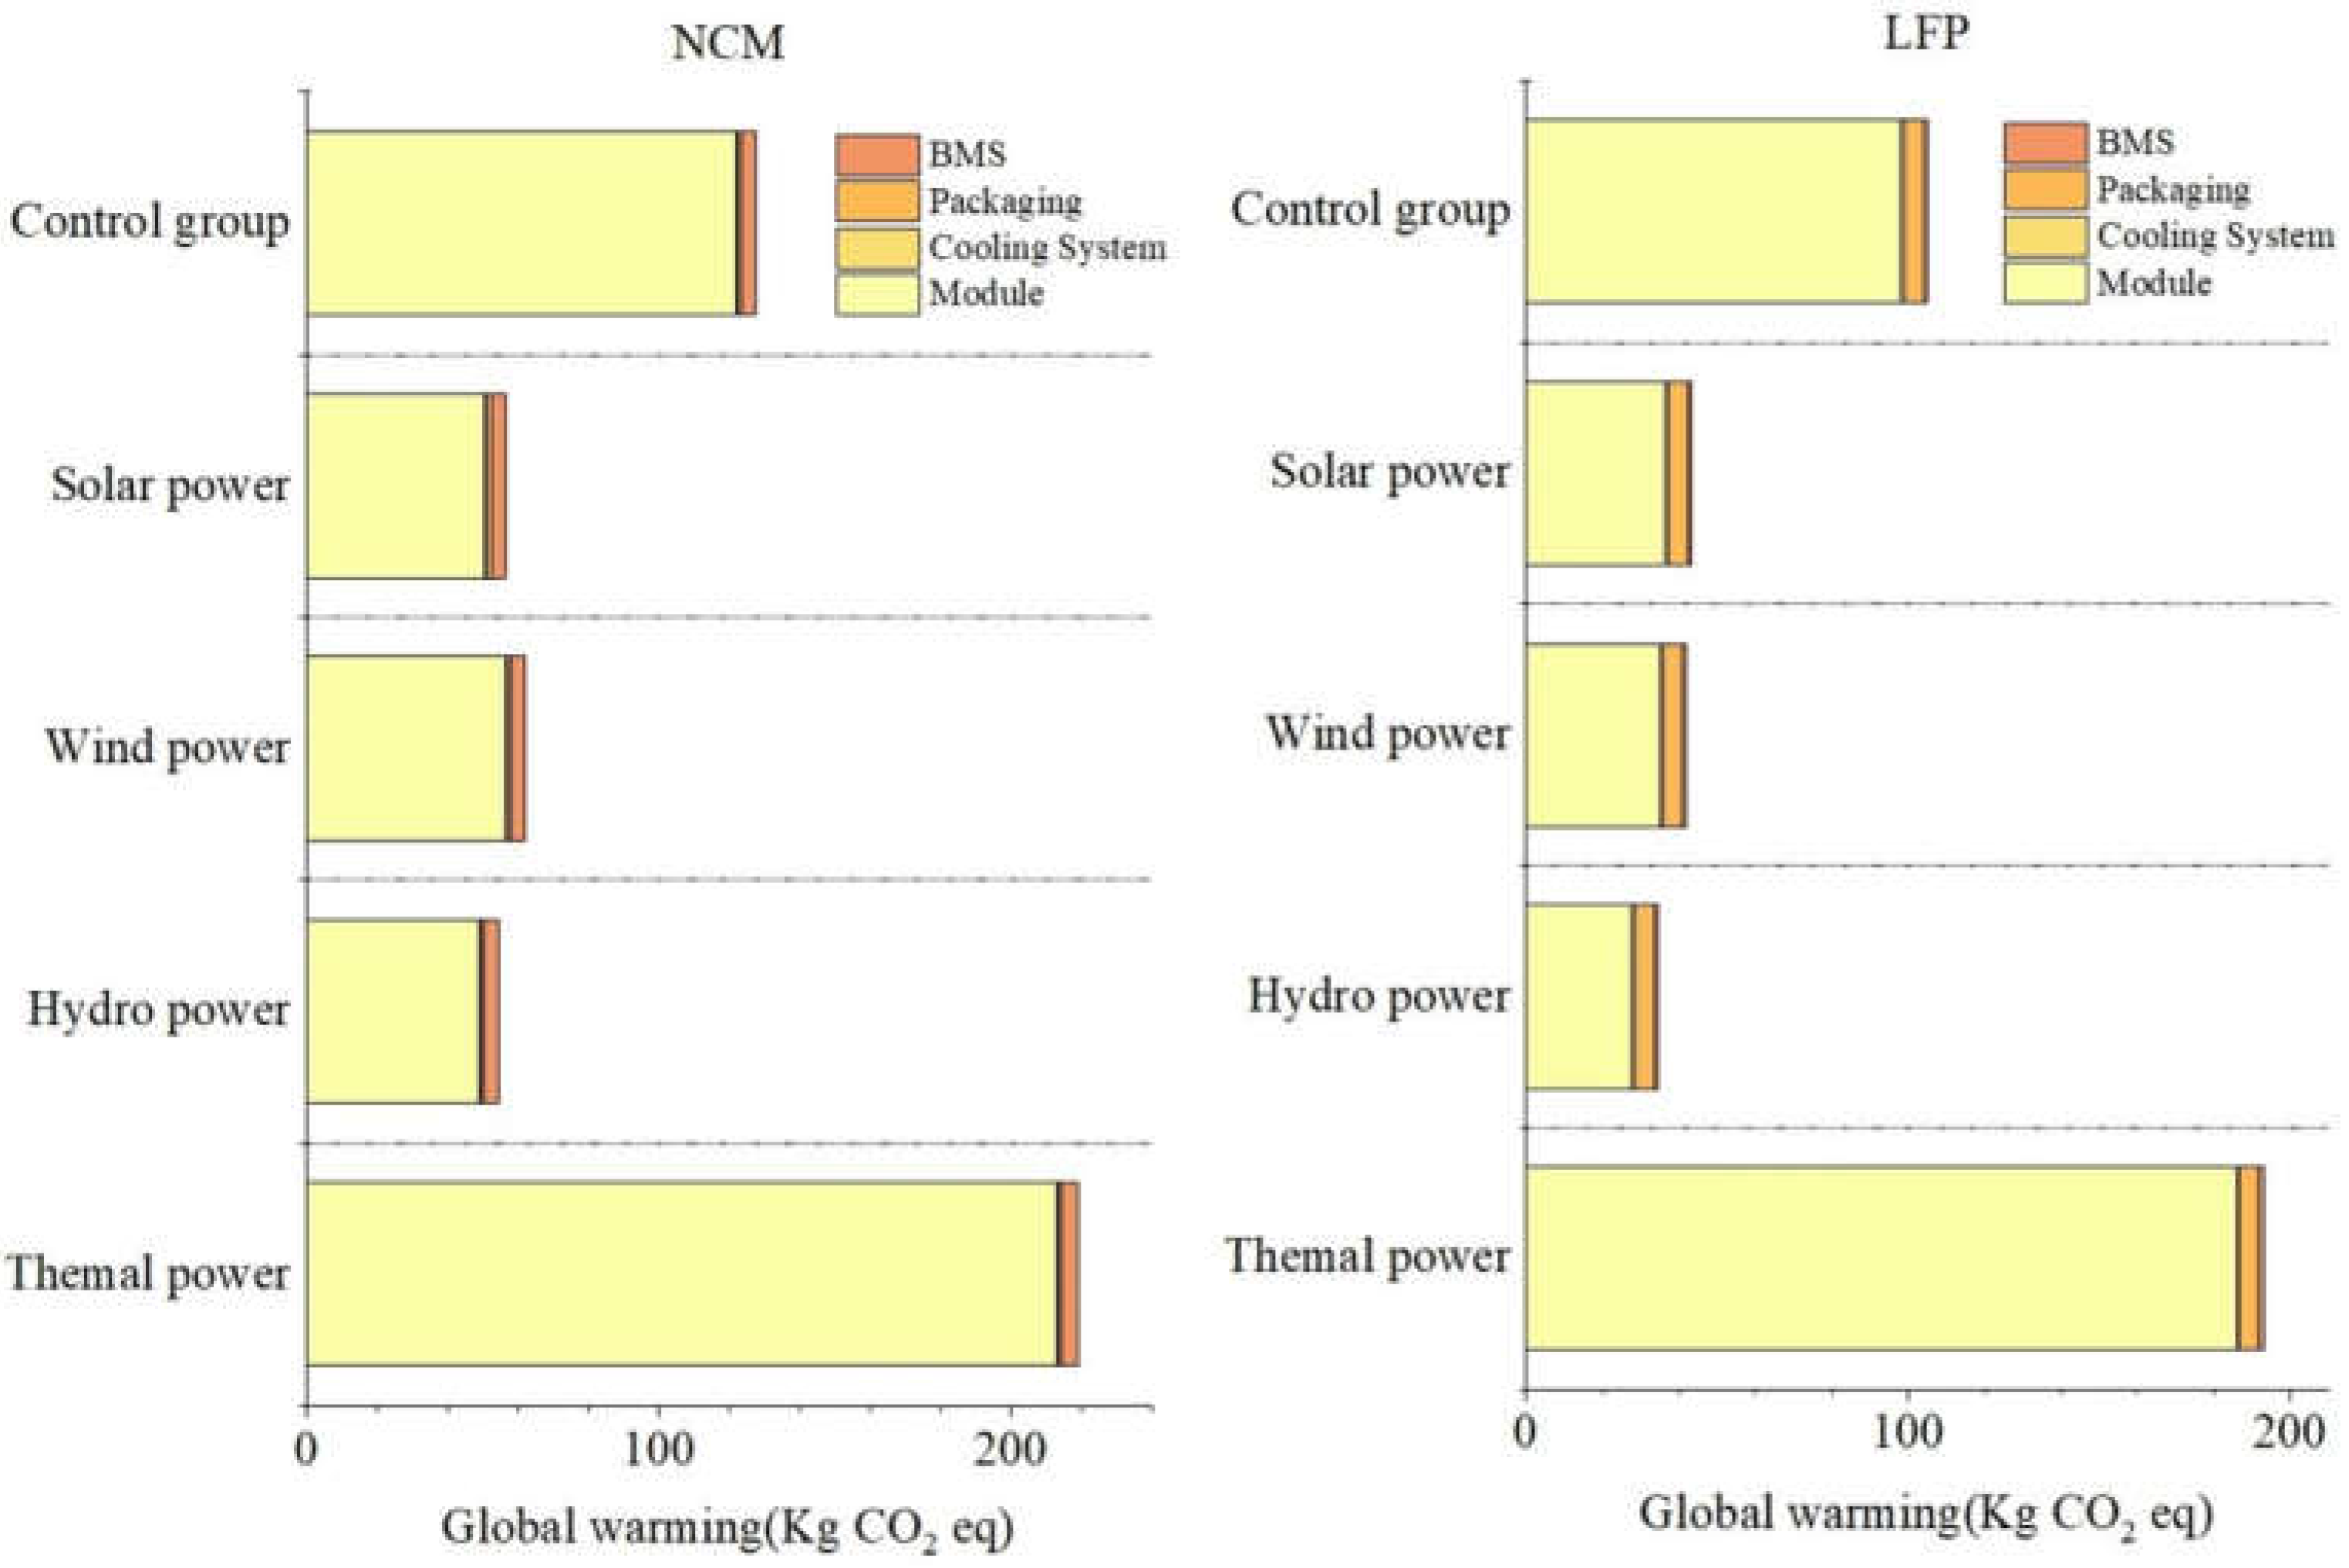
With
Figure 7, the factors that influence global warming are classified into three categories:
(1) Effect of battery type on global warming potential:
The global warming potentials of LFP and NCM batteries do not differ significantly across energy types, with similar overall trends. This suggests that the choice of battery type for production has little to do with global warming potential when carbon emissions are taken into account, and that the main factor affecting carbon emissions is the source of electricity.
(2) The effect of energy type on global warming potential:
Thermal electricity has the highest global warming potential for both battery types, followed by the control (control) group, which also has a high global warming potential. Solar, wind and hydroelectric power have relatively low global warming potentials, significantly lower than thermal and control. This indicates that the use of solar, wind and hydroelectric power can significantly reduce the global warming potential, suggesting that clean energy has significant advantages in reducing carbon emissions.
(3) Contribution of each component to global warming potential:
Of all energy types, the battery module part contributes the most to the global warming potential, accounting for the majority of the share. The battery module section, which includes the integration of positive and negative electrode materials, electrolytes and excipients, is the most energy-intensive part of the battery production process. Relatively small contributions are made by the battery management system (BMS), packaging and cooling systems, but the energy consumption and other environmental resource issues caused by the use of materials in these sections still require attention and optimization.
In summary, the use of clean energy sources such as solar, wind and hydro power can significantly reduce carbon emissions and is an effective way to achieve low-carbon production. By improving the power generation mix and reducing the proportion of thermal power generation, China can move more quickly towards the goal of carbon peaking and carbon neutrality. In addition, this provides a more environmentally friendly solution for power battery production and promotes the sustainable development of the battery industry.
In future development, it is recommended that clean energy be vigorously promoted and applied, and that the proportion of solar, wind and hydro energy in the power generation structure be increased. At the same time, all aspects of battery production should be optimized to improve the efficiency of energy use, reduce unnecessary energy consumption and further reduce carbon emissions in the production process. It is only through open-sourcing and cutting costs, comprehensive governance and strategic planning that the challenges posed by global warming can be overcame and the goals of green and sustainable development can be truly realized.
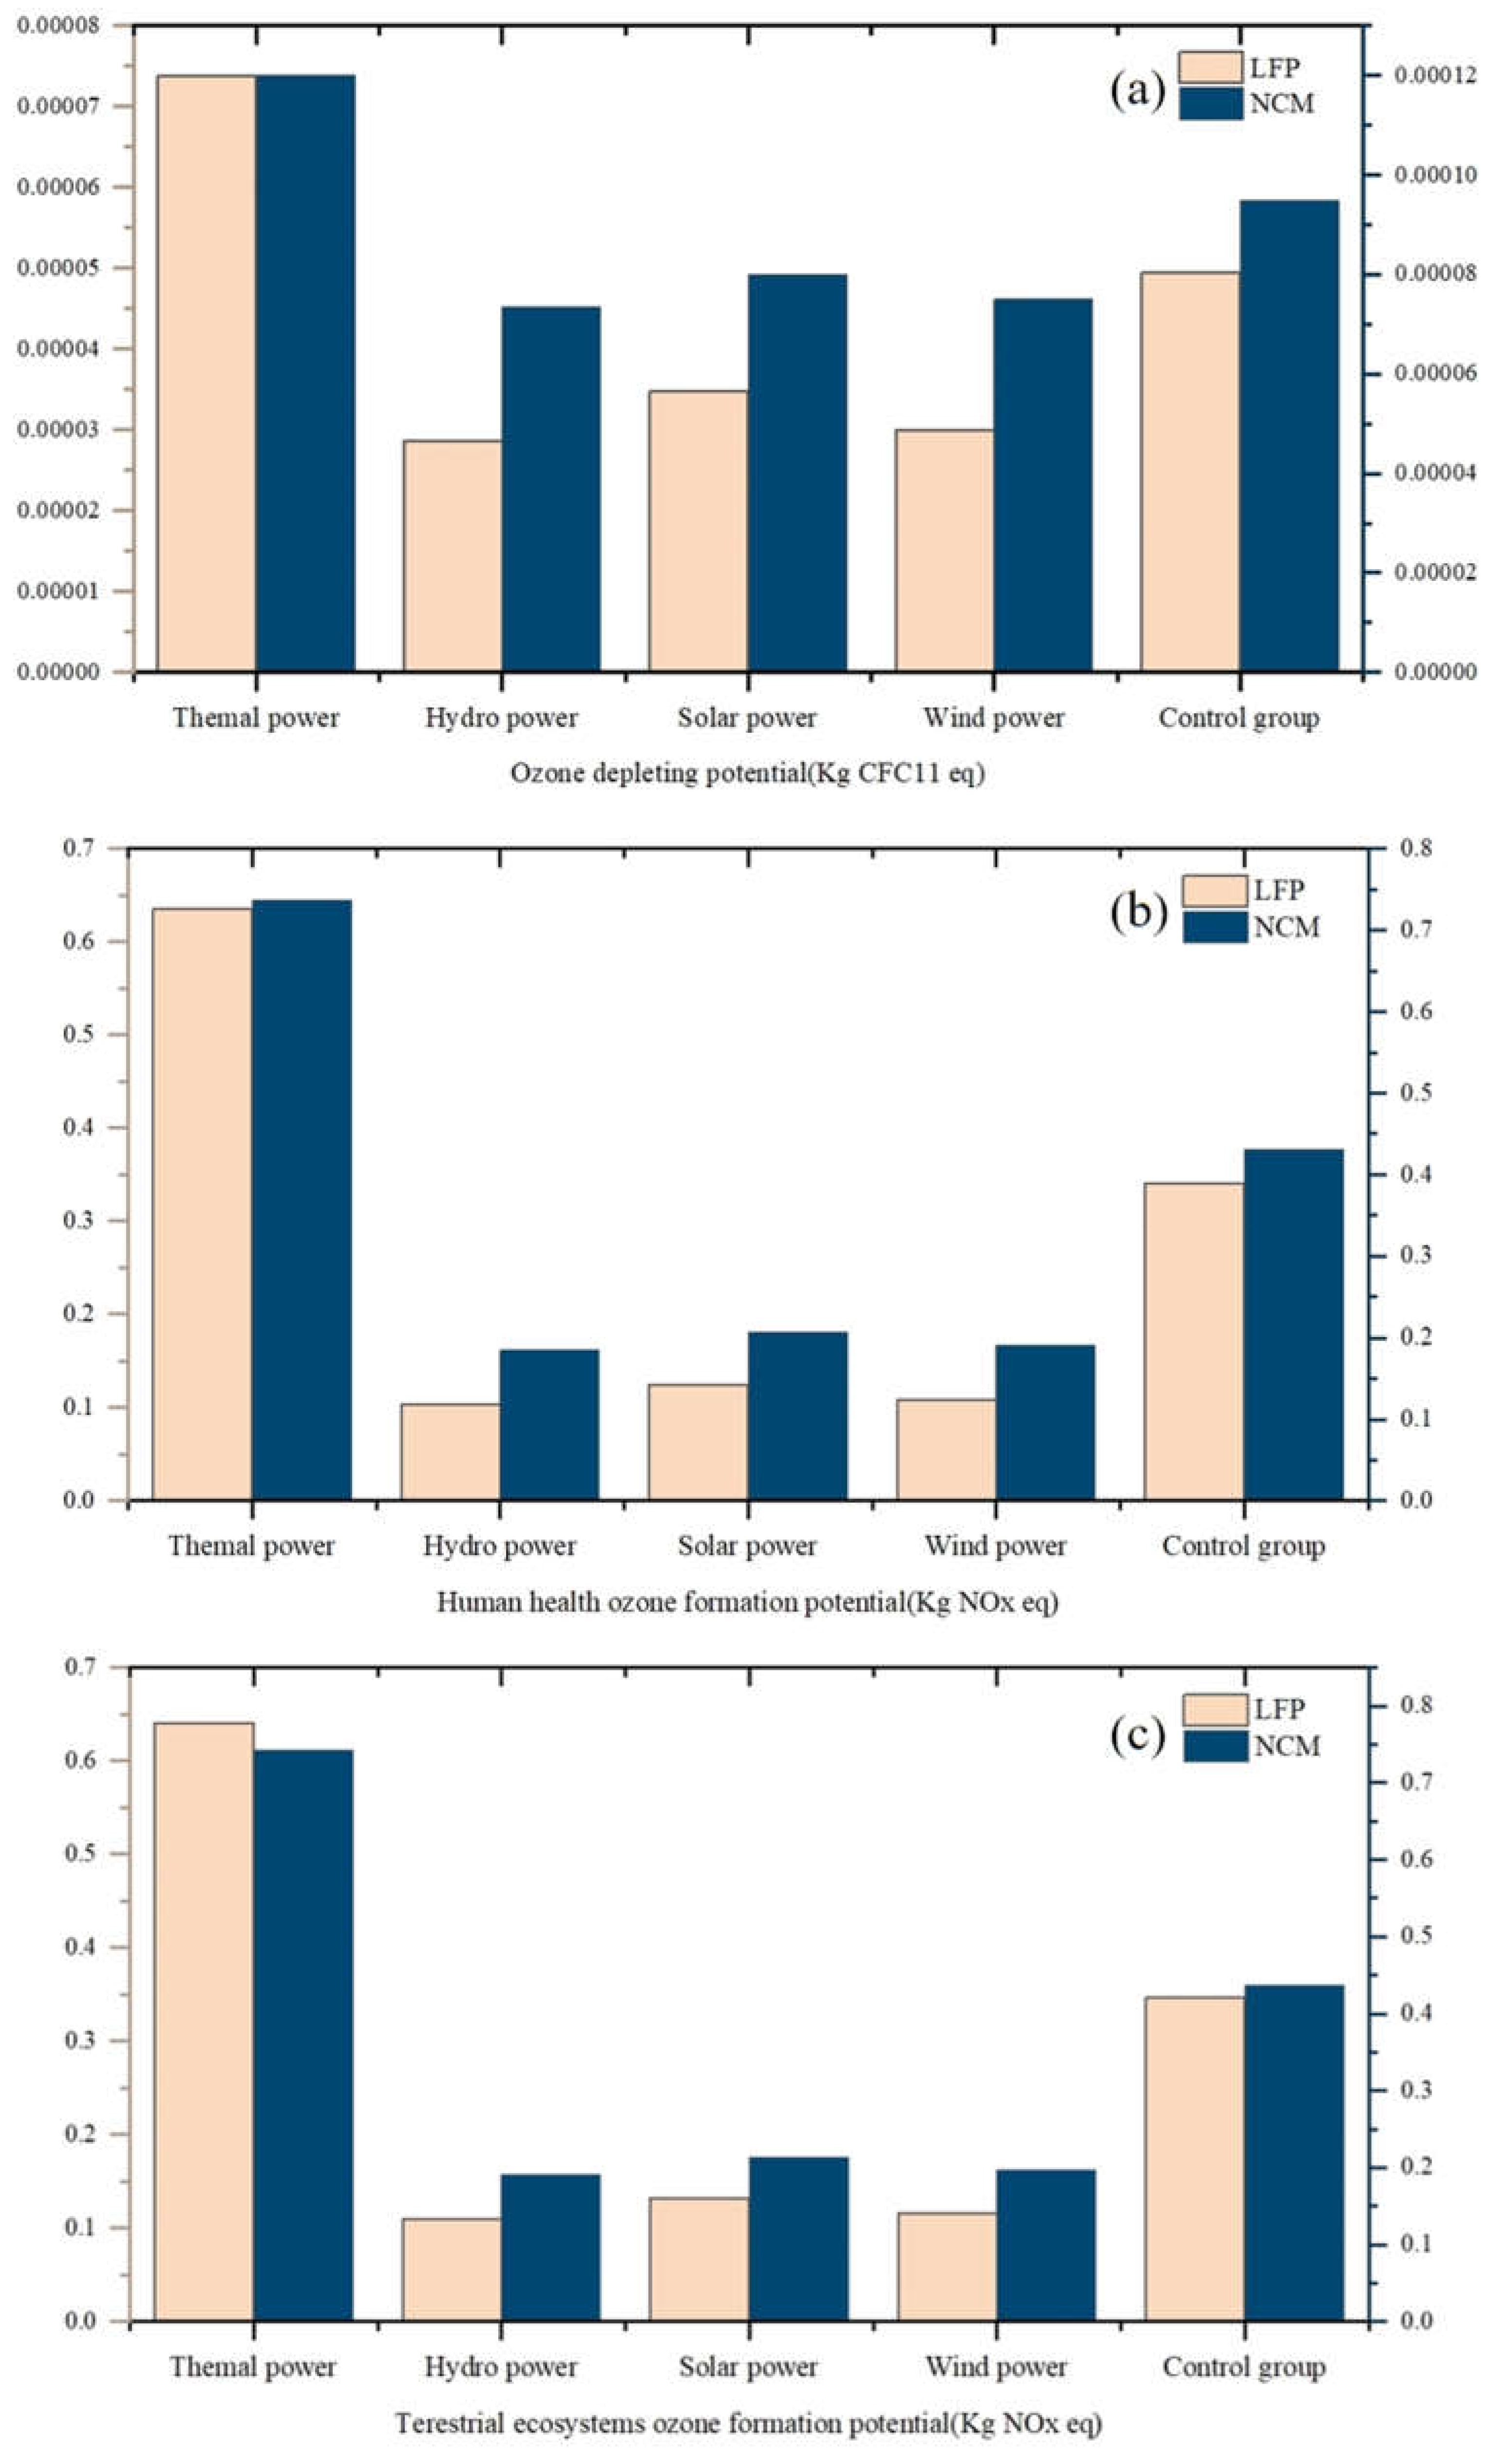
3.2.2. Analysis of Ozone Depletion
This study investigates the impact of two battery life cycle activities on the ozone layer based on the ozone depletion potential (ODP), human health ozone formation potential (HOFP) and terrestrial ecosystem ozone formation potential (EOF P) metrics in the ReCiPe evaluation methodology. The comparison in
Figure 8 clearly shows the different performance of different battery types (LFP and NCM) and different energy types (thermal, hydro, solar and wind) in terms of ozone depletion and formation potential.
Overall, thermal power has the highest ozone impact potential of the four energy types, with significantly higher values than the other energy types for both ozone depletion potential and ozone formation potential. In particular, the thermal power data using NCM batteries showed a higher ozone impact potential than the thermal power data using LFP batteries in all three aspects of ozone depletion and formation.
In contrast, hydro power, solar and wind power have lower data compared to thermal power, suggesting that these clean energy sources have significant advantages in reducing ozone layer depletion and are effective in mitigating negative environmental impacts. Notably, the data for NCM batteries is higher than that of LFP batteries in all metrics, suggesting that while NCM batteries may be superior in performance, they also have a greater environmental impact and pose a more significant environmental challenge. This reminds us that while pursuing high-performance battery technologies, their potential impact on the environment need to be considered and a balance between performance and environmental protection should be found.
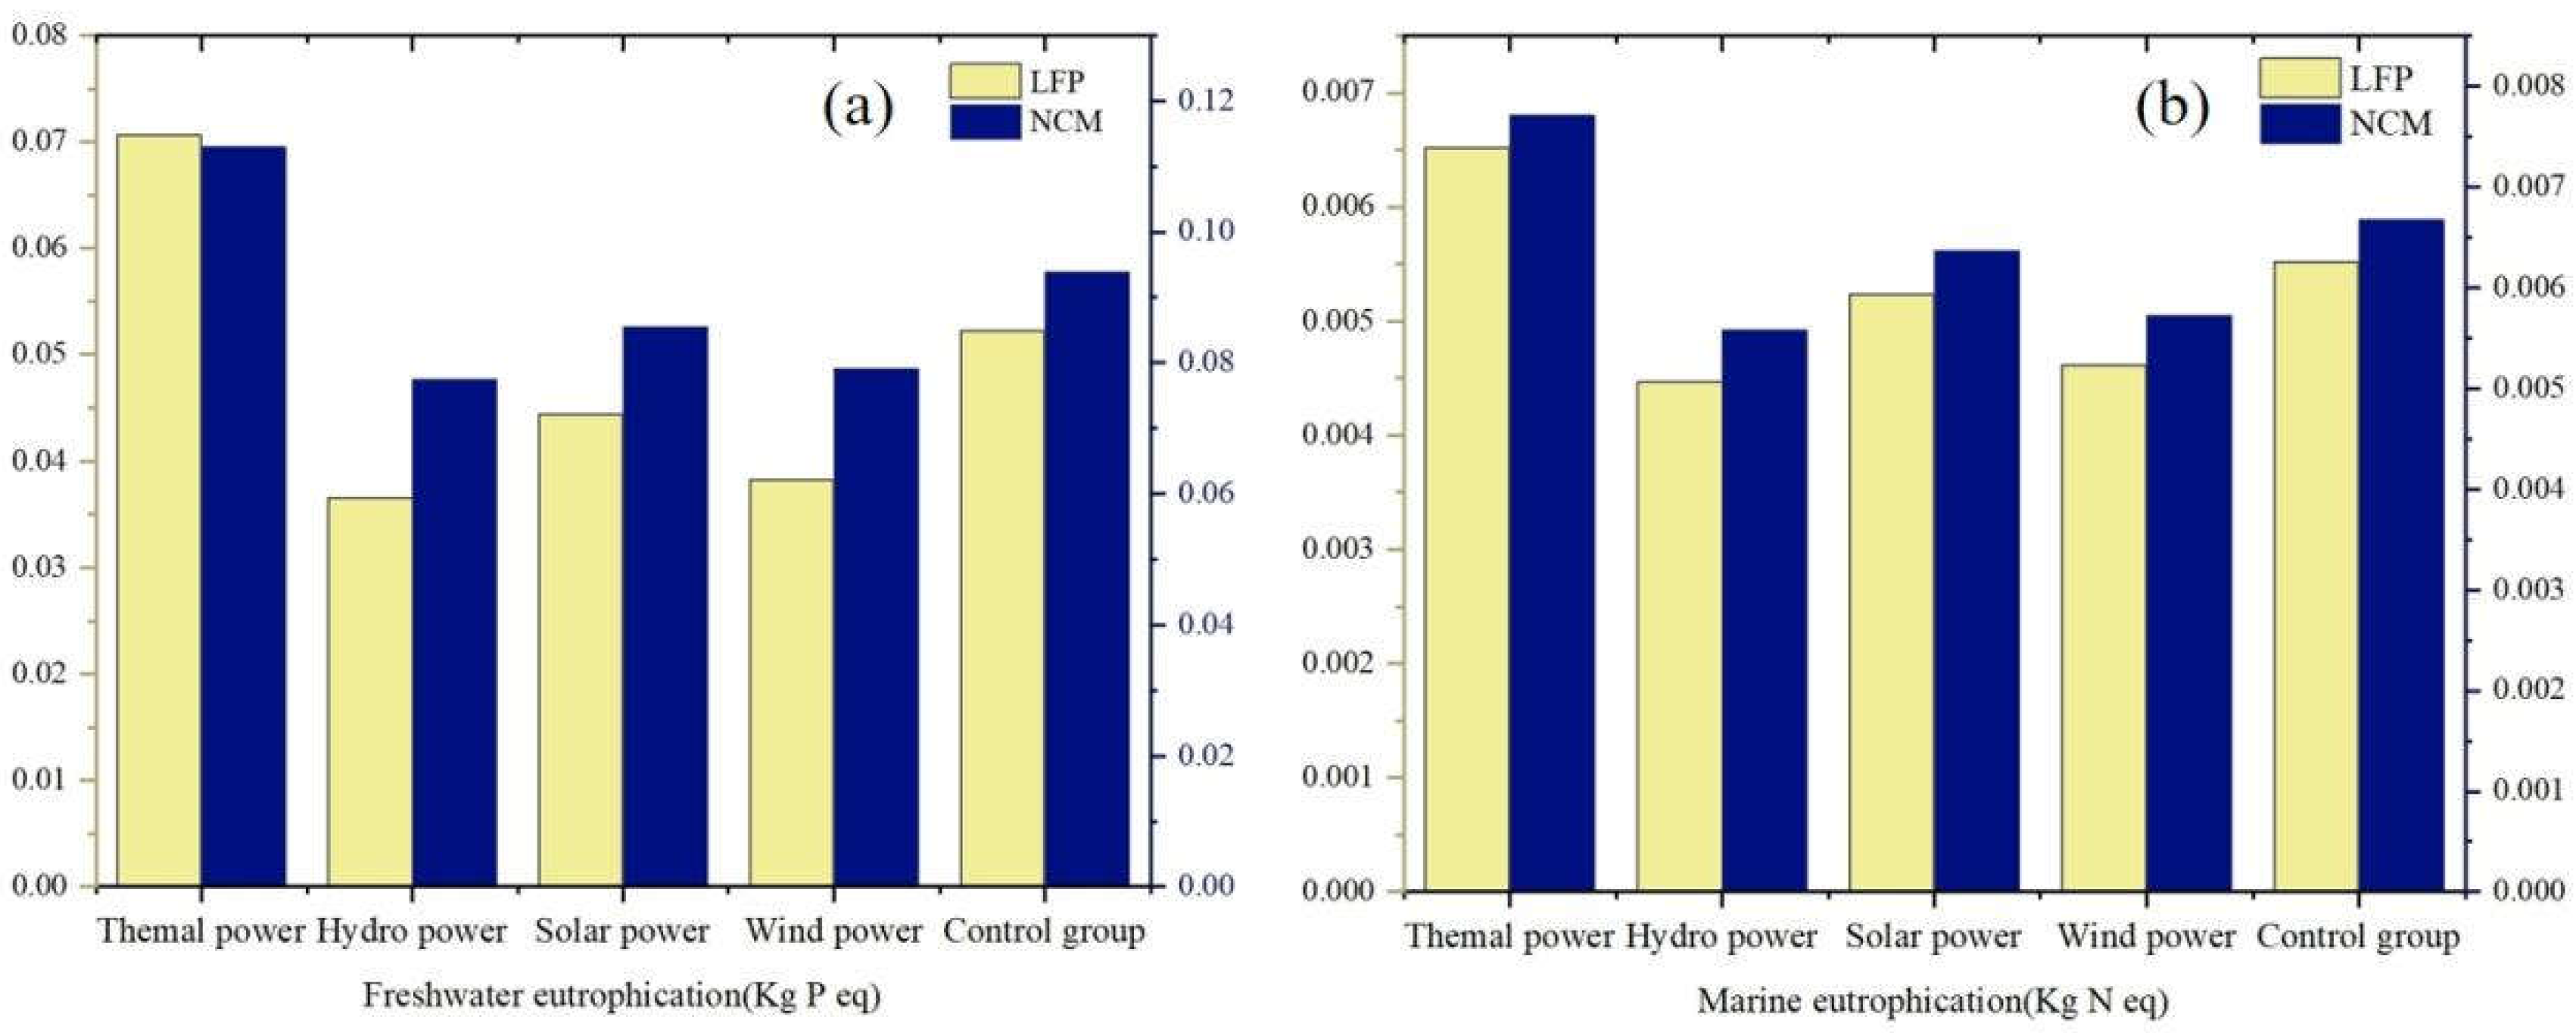
3.2.3. Eutrophication Depletion Analysis
In this study, an eutrophication study based on freshwater eutrophication potential (FEP) and marine eutrophication potential (MEP) is conducted to investigate the effects of LFP and NCM batteries on water bodies. With the two graphs in
Figure 9,the different performances of different battery types (LFP and NCM) and different energy types (thermal, hydro, solar and wind)can be clearly seen in terms of freshwater and marine eutrophication potential. This detailed comparison gives us a comprehensive picture of the impact of the two battery types and the four energy types on the water environment.
Overall, thermal power has the highest impact on eutrophication of the four energy types, with significantly higher values for both freshwater eutrophication potential and marine eutrophication potential. In particular, the data for thermal power with NCM batteries are significantly higher than those for thermal power with LFP batteries for both freshwater and marine eutrophication potential, suggesting a greater negative impact on the aquatic environment.
In contrast, hydro, solar and wind power have lower figures compared to thermal power, indicating that these clean energy sources have a significant advantage in reducing nitrogen and phosphorus emissions and are effective in mitigating water pollution. Especially when using LFP batteries, the data of clean energy sources are further reduced, demonstrating their better performance in terms of environmental protection. It is worth noting that the data of NCM batteries are higher than those of LFP batteries in all indicators, which indicates that LFP batteries are more friendly to the water resource environment and are more suitable for use in application scenarios with higher environmental requirements.
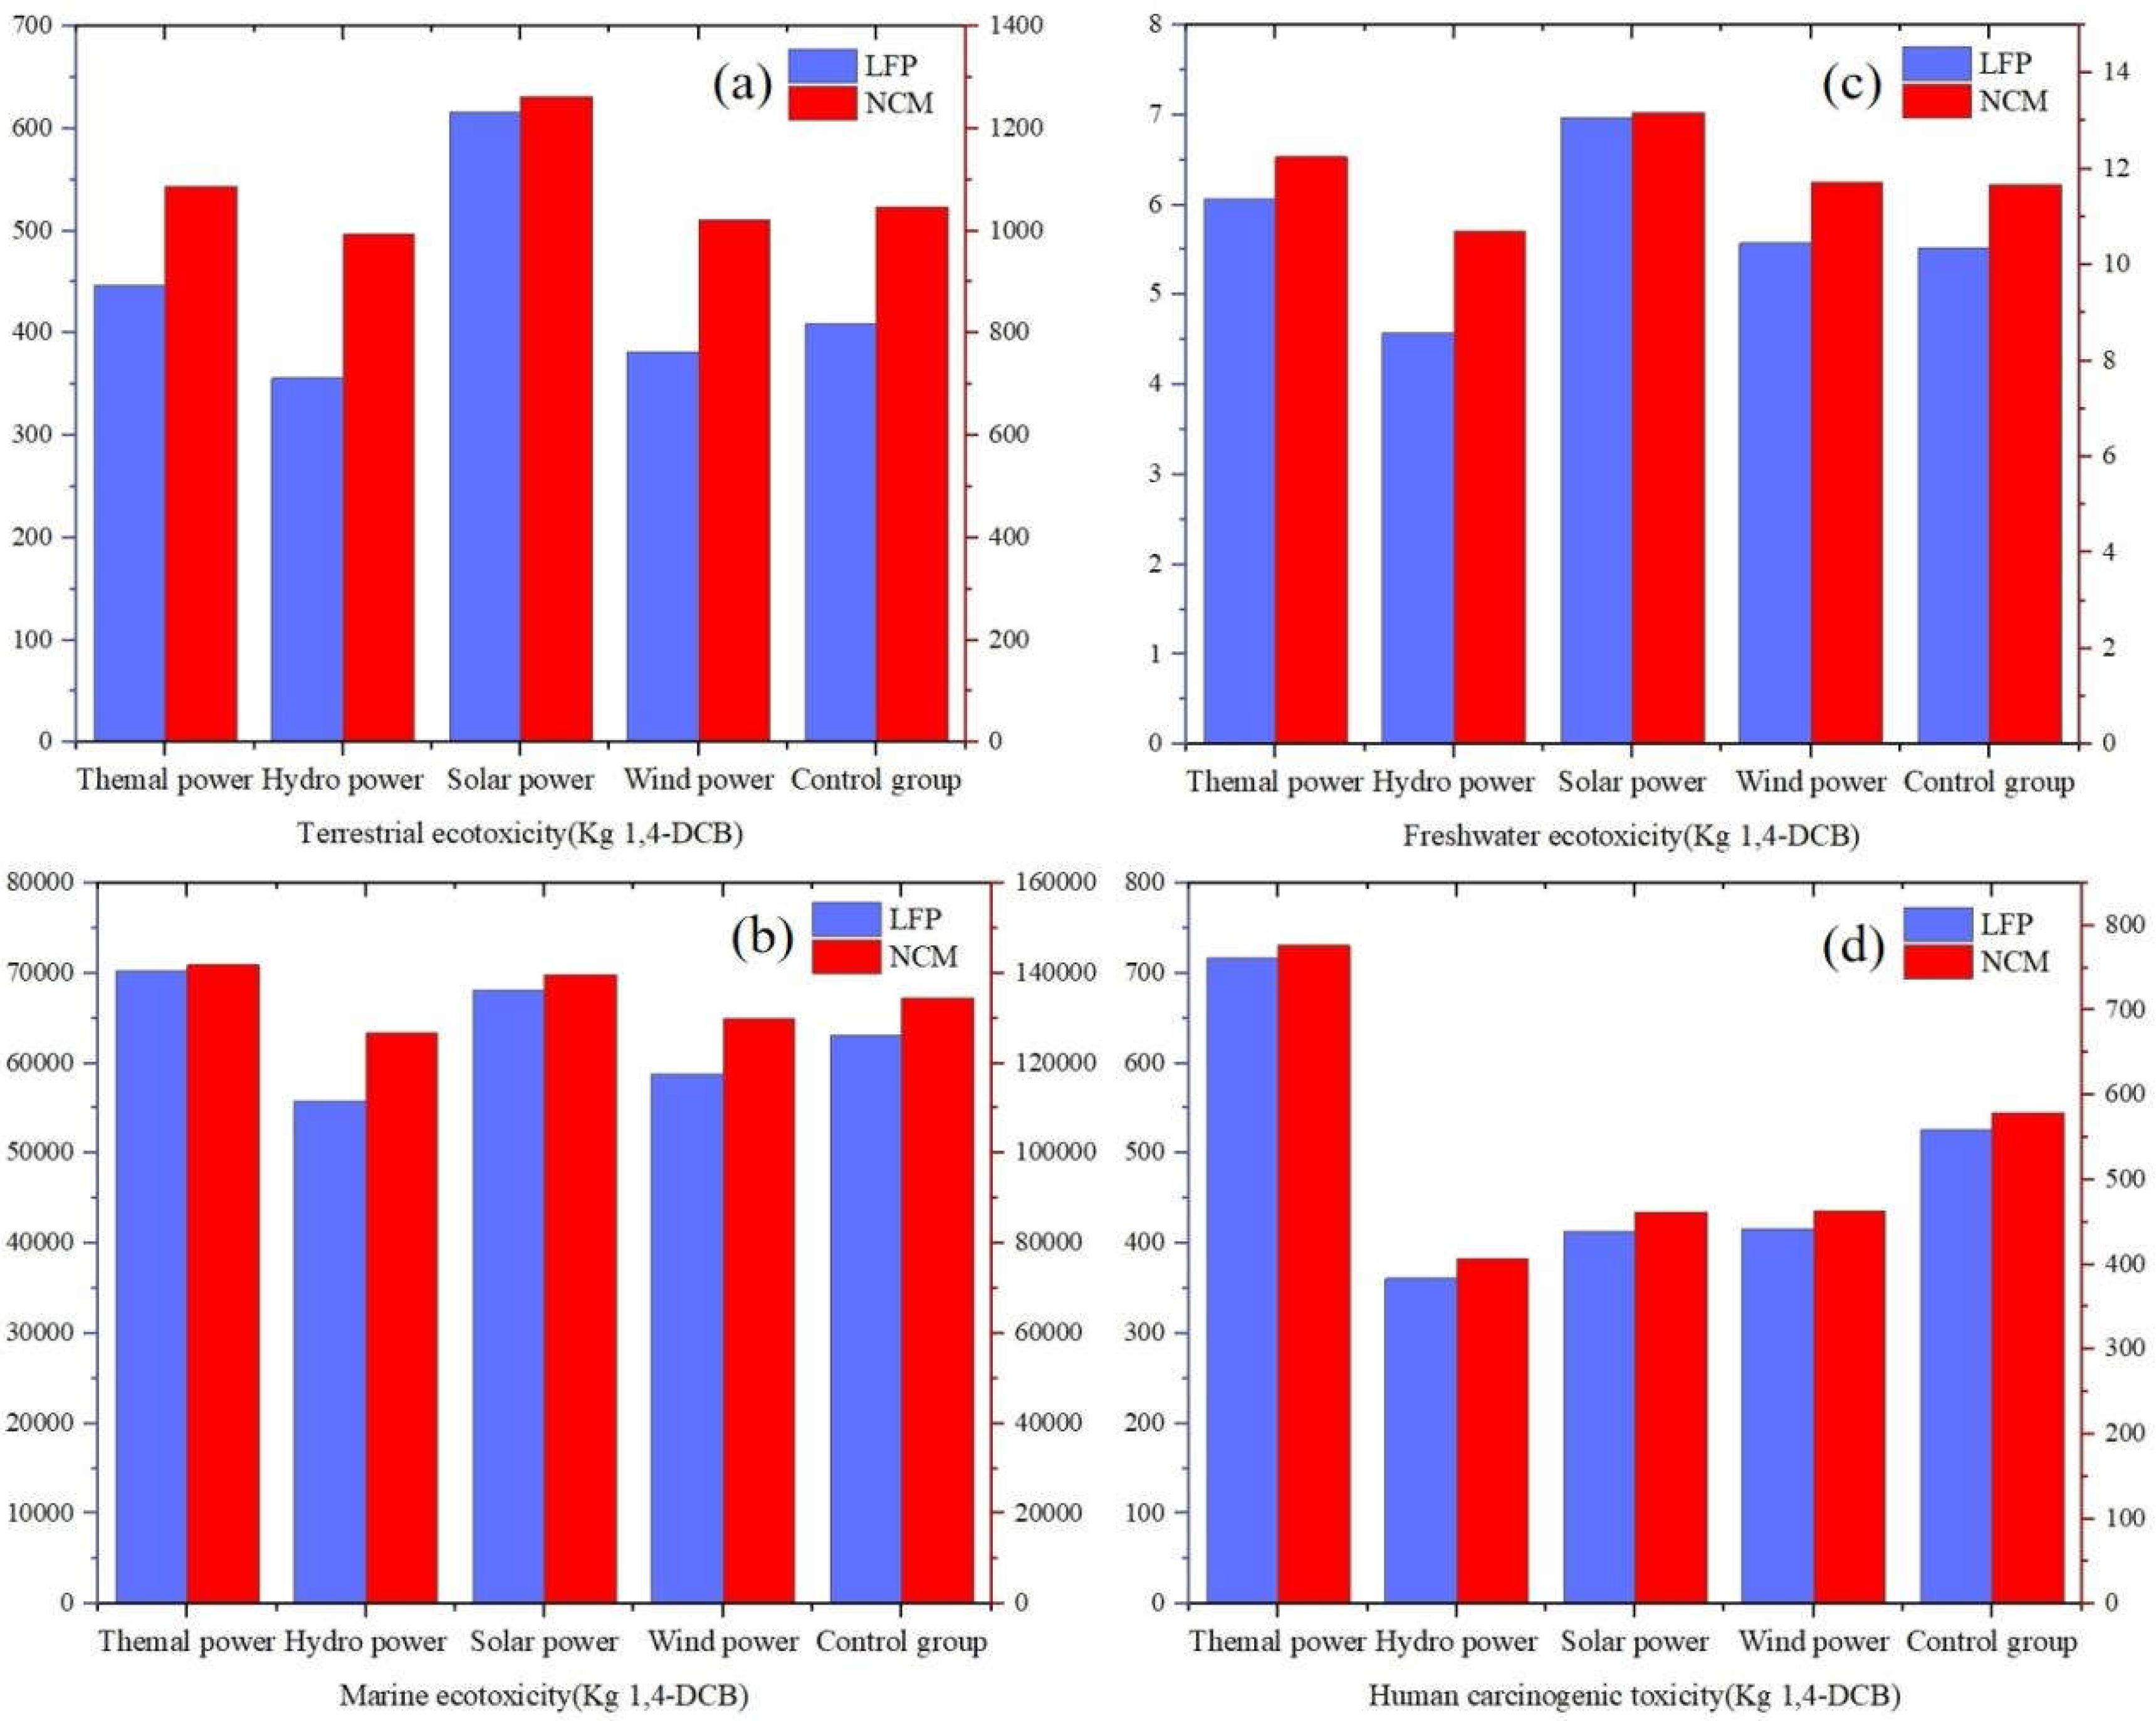
3.2.4. Eco-Toxicity Loss Analysis
In this study, the water eco-toxicity potential is divided into freshwater eco-toxicity potential (FETP) and marine eco-toxicity potential (METP), human eco-toxicity is mainly investigated as human carcinogenicity toxicity potential (HTPc), and terrestrial eco-toxicity is investigated based on terrestrial eco-toxicity potential (TETP). These graphs in
Figure 10 allow us to see how different energy types behave in terms of terrestrial eco-toxicity, marine eco-toxicity, freshwater eco-toxicity and human carcinogenicity. This gives us a comprehensive understanding of the potential impacts of each energy type on environmental resources and human health.
In terms of terrestrial eco-toxicity and freshwater eco-toxicity, solar power show higher values, mainly due to the use of toxic heavy metals (e.g., lead, cadmium) and other harmful chemicals (e.g., silicofluorocarbons) in the manufacturing process of solar cells, as well as the potential contamination of soils and bodies of water by improper recycling of panels at the end of the solar energy life cycle. In terms of marine eco-toxicity, the four energy types have a relatively even distribution of values and show similar levels of environmental impact. In terms of human carcinogenic eco-toxicity, the values for thermal power are much higher than those of the other three energy types, indicating that the use of clean energy is also beneficial to human health. Among them, the values of NCM batteries are higher than those of LFP batteries, showing greater eco-toxicity, which indicates that NCM batteries need to be strictly controlled during the production process and the emission of pollutants should be strictly controlled to minimize their impact on the environment.
3.3. Regional Analyses
In this study, China is divided into seven regions based on the principle of regional division in China: Northeast, North, East, South, Central, Northwest and Southwest.The power generation structure of each region are substituted into the production process of power batteries, account for the carbon emission in the production process, explore the impact of producing power batteries in each region on the resources and the environment, and
Figure 11,
Figure 12,
Figure 13,
Figure 14 and
Figure 15 are drawn based on the data. Through this regional analysis, it is possible to analyze which region's power generation structure has the smallest impact on the environment in the production of power batteries, so as to provide a scientific basis and optimization scheme for the future layout and development of the power battery industry in China. The layout and development of power battery industry provides scientific basis and optimization scheme, and promotes the green transformation and sustainable development of battery industry.
3.3.1. Analysis of Carbon Emissions
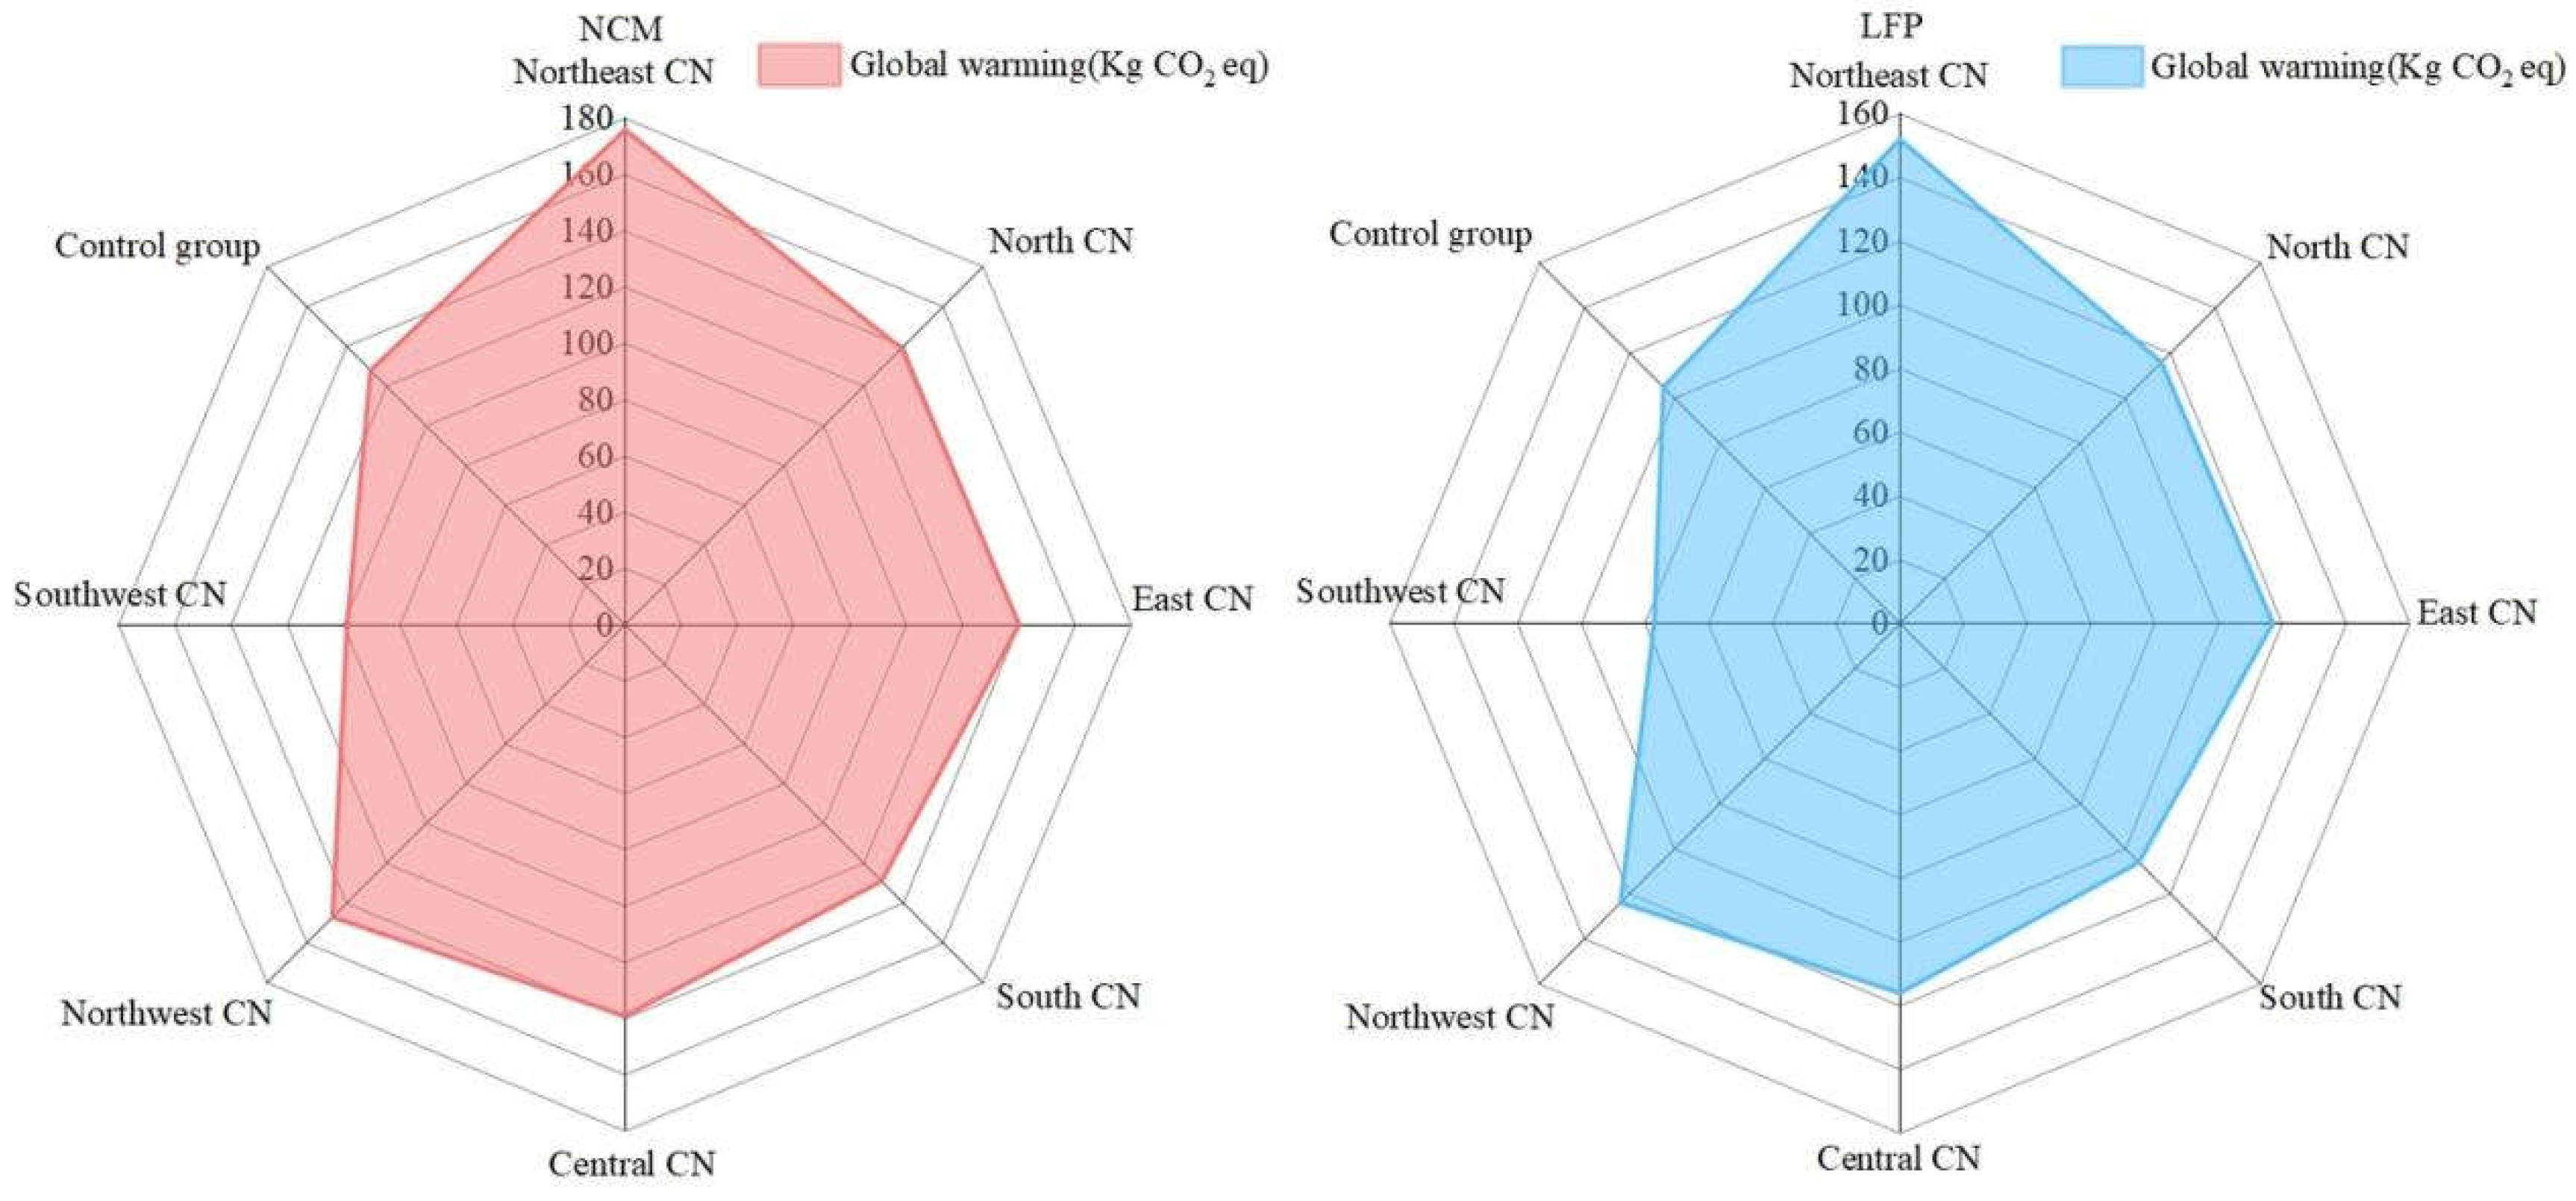
In order to clearly see the characteristics and bias of the energy generation structure in each region.A regional power generation map of China are made by mapping the regional division of China with the dominant form of power generation in each region to assess the global warming potential of different regions in producing the two battery types, LFP and NCM, and the results are shown in
Figure 11 [
11].
Carbon emissions from power battery production in each region are modelled according to regional energy characteristics, as shown in
Figure 12, and the factors affecting carbon emissions area classified into three categories:
(1) General trends:
The overall trend of the global warming potentials of the two types of power cells, LFP and NCM batteries, is similar in all regions. The Northeast region has the highest global warming potential, which is close to 200 kg eq CO2 equivalent, while the global warming potentials of other regions are relatively low and more evenly distributed. This suggests that the regional energy mix has a significant effect on the global warming potential.
(2) Impact of battery type on regions:
The global warming potentials of the LFP and NCM batteries do not differ significantly from region to region, and the overall shapes and trends are very similar. This means that one of the main carbon emission differences is due to the different types of materials used in the production of the two batteries, and that the NCM battery has a higher overall carbon emission than the LFP battery due to the use of more energy-intensive materials for its production, provided that the same regional power generation structure strategy is used.
(3) Regional differences:
Northeast and North China have the highest global warming potential, which may be due to the region's major reliance on thermal power generation, resulting in higher carbon emissions. Regions such as East China also have higher global warming potentials, but significantly lower than Northeast and North China. In contrast, regions such as Northwest, Central, Southwest, and South China have relatively low global warming potentials with a more balanced distribution. These regions may have made greater use of clean energy sources such as hydro power, wind power and solar power, thereby reducing carbon emissions.
In summary, although the differences in the effects of LFP and NCM battery types on global warming potential are not significant, the differences in global warming potential in different regions are significant. These results indicate that Southwest China, due to its abundant wind power resources, Central China, due to its abundant hydro power resources, and Southern China, due to its abundant solar resources, have lower carbon emissions compared to the national average, effectively mitigating carbon emissions caused by electricity consumption in the battery production process. In contrast, the north-eastern and northern regions have significantly higher levels of carbon emissions, suggesting that these regions are more reliant on thermal power generation.
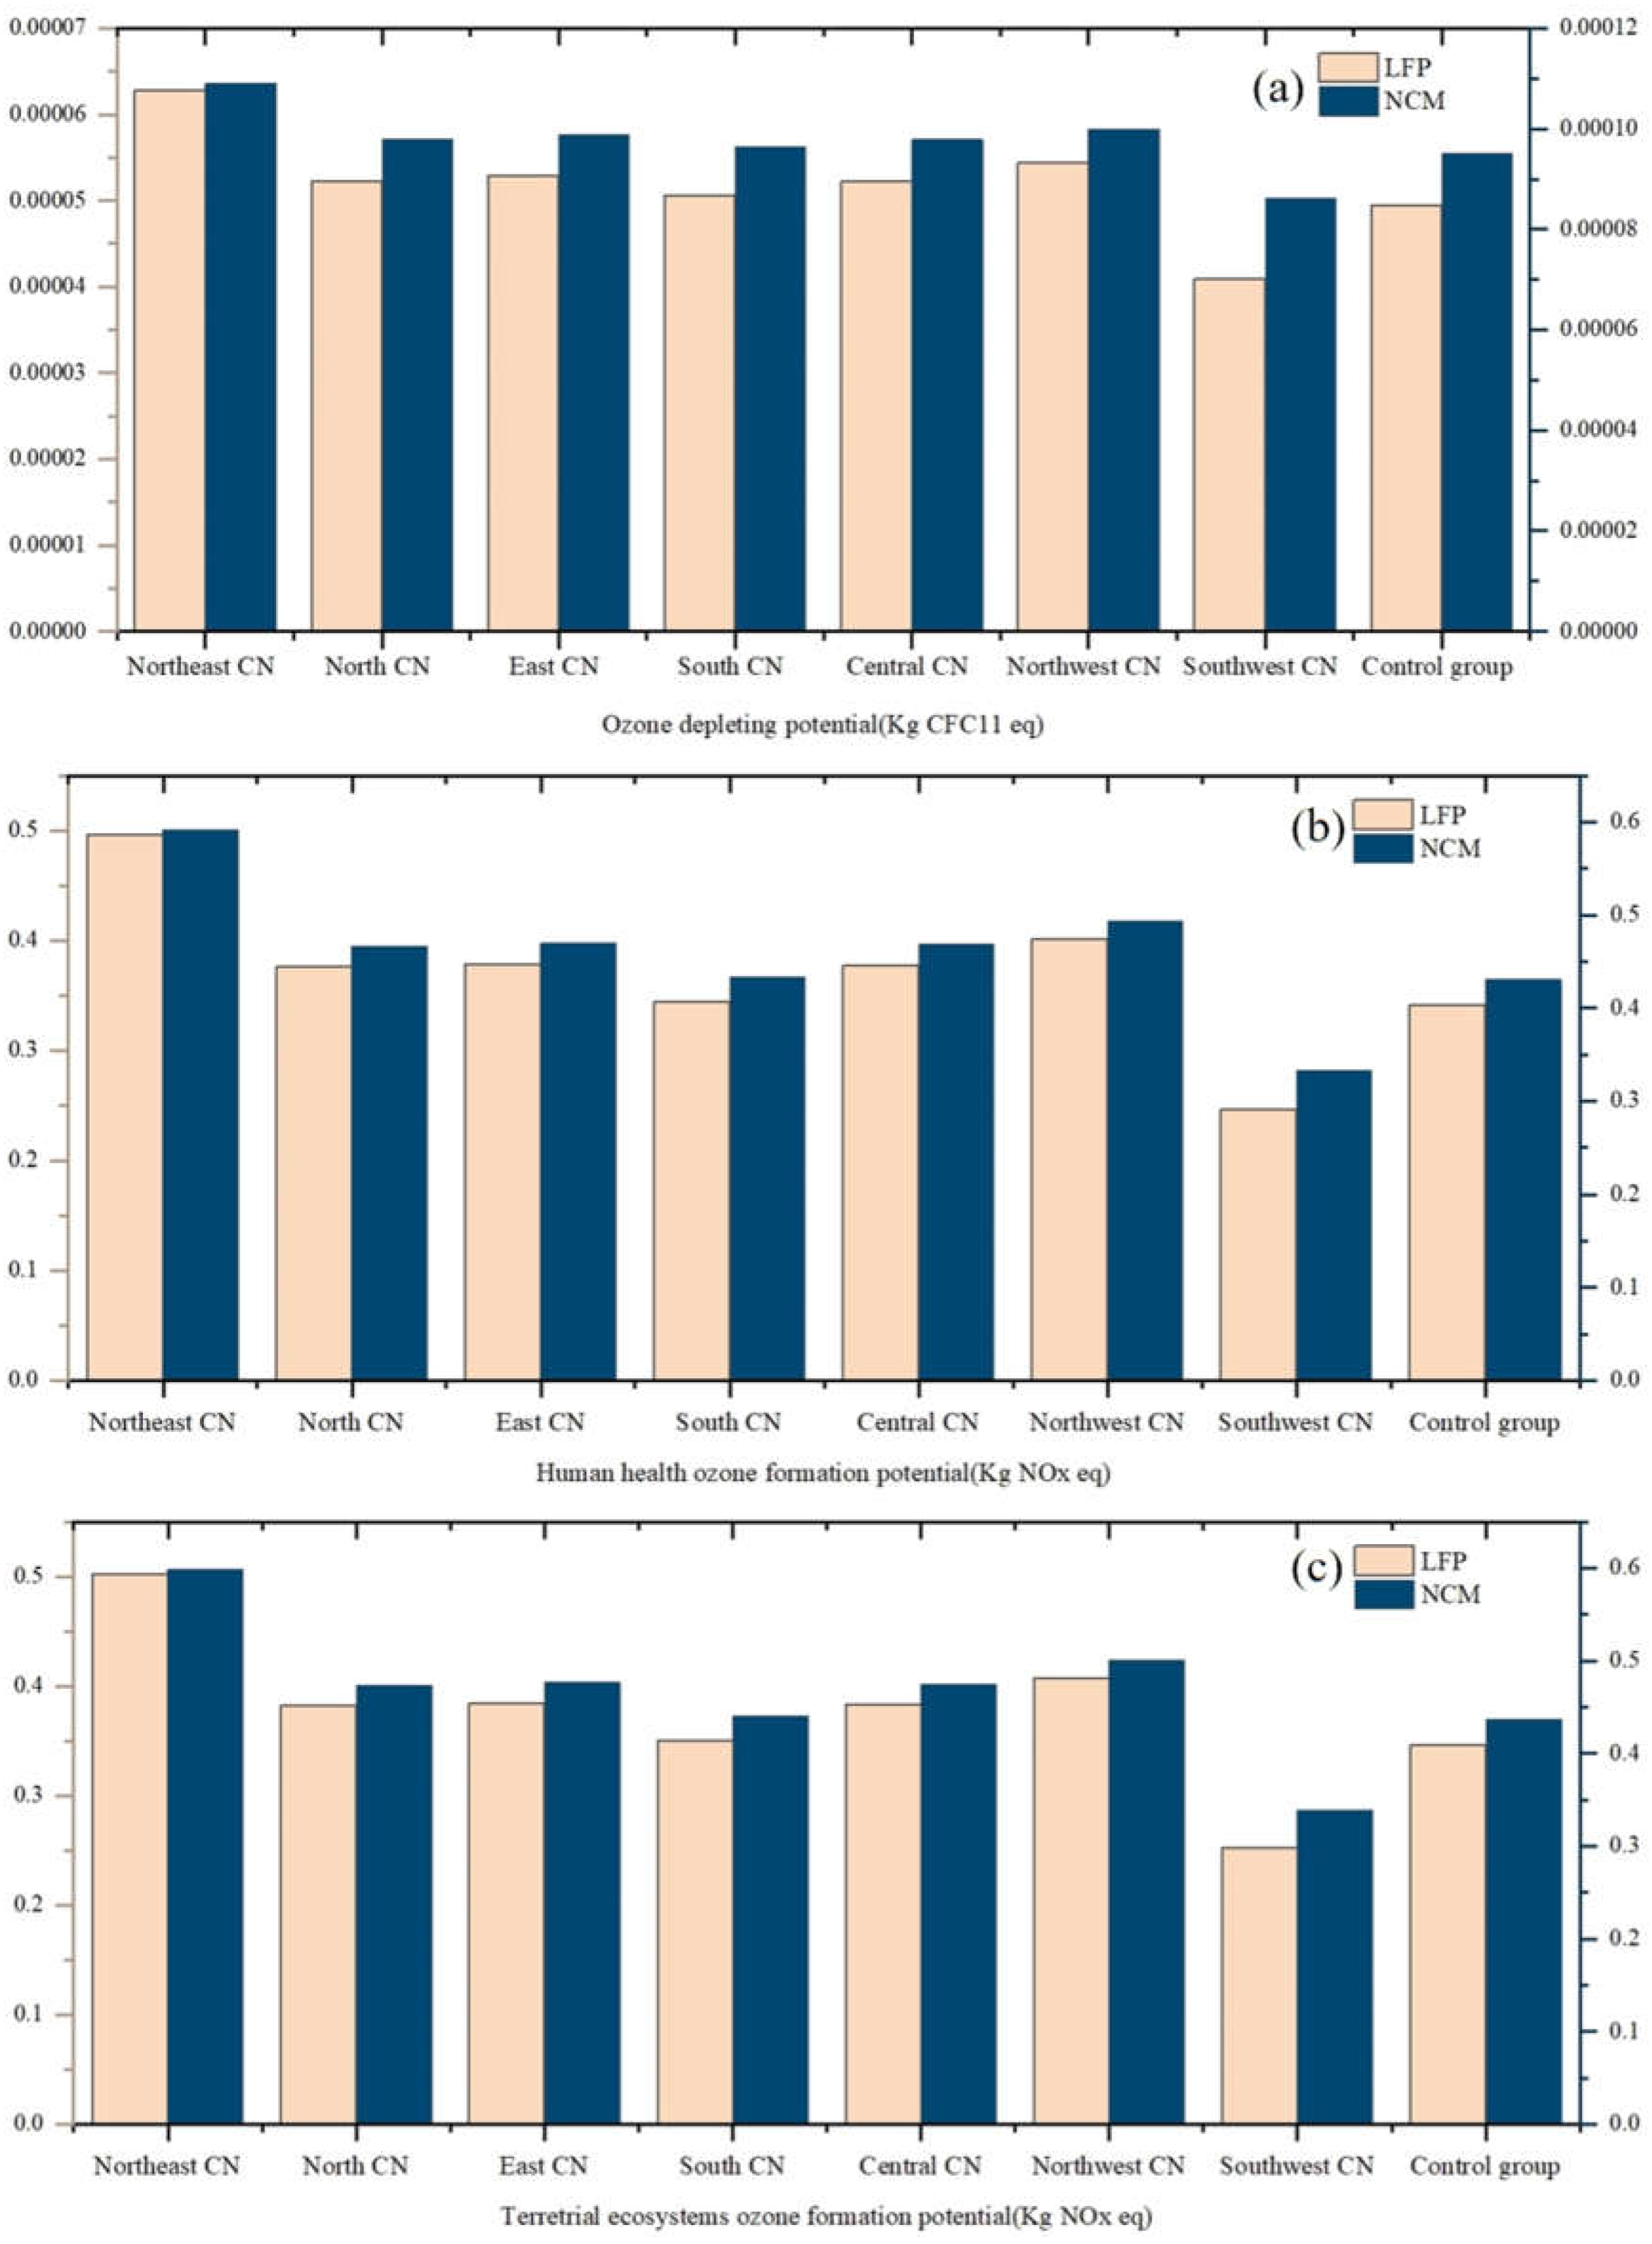
3.3.2. Ozone Depletion Analysis
This section examines the impact of the two battery life cycle activities on the ozone layer based on the ozone depletion potential (ODP), human health ozone formation potential (HOFP), and terrestrial ecosystem ozone formation potential (EOFP) metrics from the ReCiPe evaluation methodology. By comparing the three graphs in
Figure 13, it can be seen that the ozone depletion potential of the NCM battery is higher than that of the LFP battery in almost all regions. The difference is particularly significant in the Northeast, which, when linked to the regional characteristics of power generation, suggests that the use of thermal power as the main mode of power generation can have a serious impact on the ozone layer. At the same time, the ozone formation potential of terrestrial ecosystems is also slightly higher for NCM batteries than for LFP batteries in most regions, suggesting a greater negative impact on ecosystems.
Similar to the ozone formation potential of terrestrial ecosystems, the human health ozone formation potential of NCM cells is also higher than that of LFP cells in most regions. This means that the use of NCM batteries not only has a greater ozone formation potential for ecosystems, but also poses a greater potential threat to human health. Overall, the data for NCM batteries are higher than LFP batteries for all ozone depletion and formation potential factors, suggesting that while NCM batteries may be superior in performance, they also have a greater negative impact on the environment.The environmentally friendly nature of LFP batteries gives them an even greater advantage in applications that require stringent environmental protection, and therefore with environmental impact considerations, LFP batteries may be the more desirable choice.
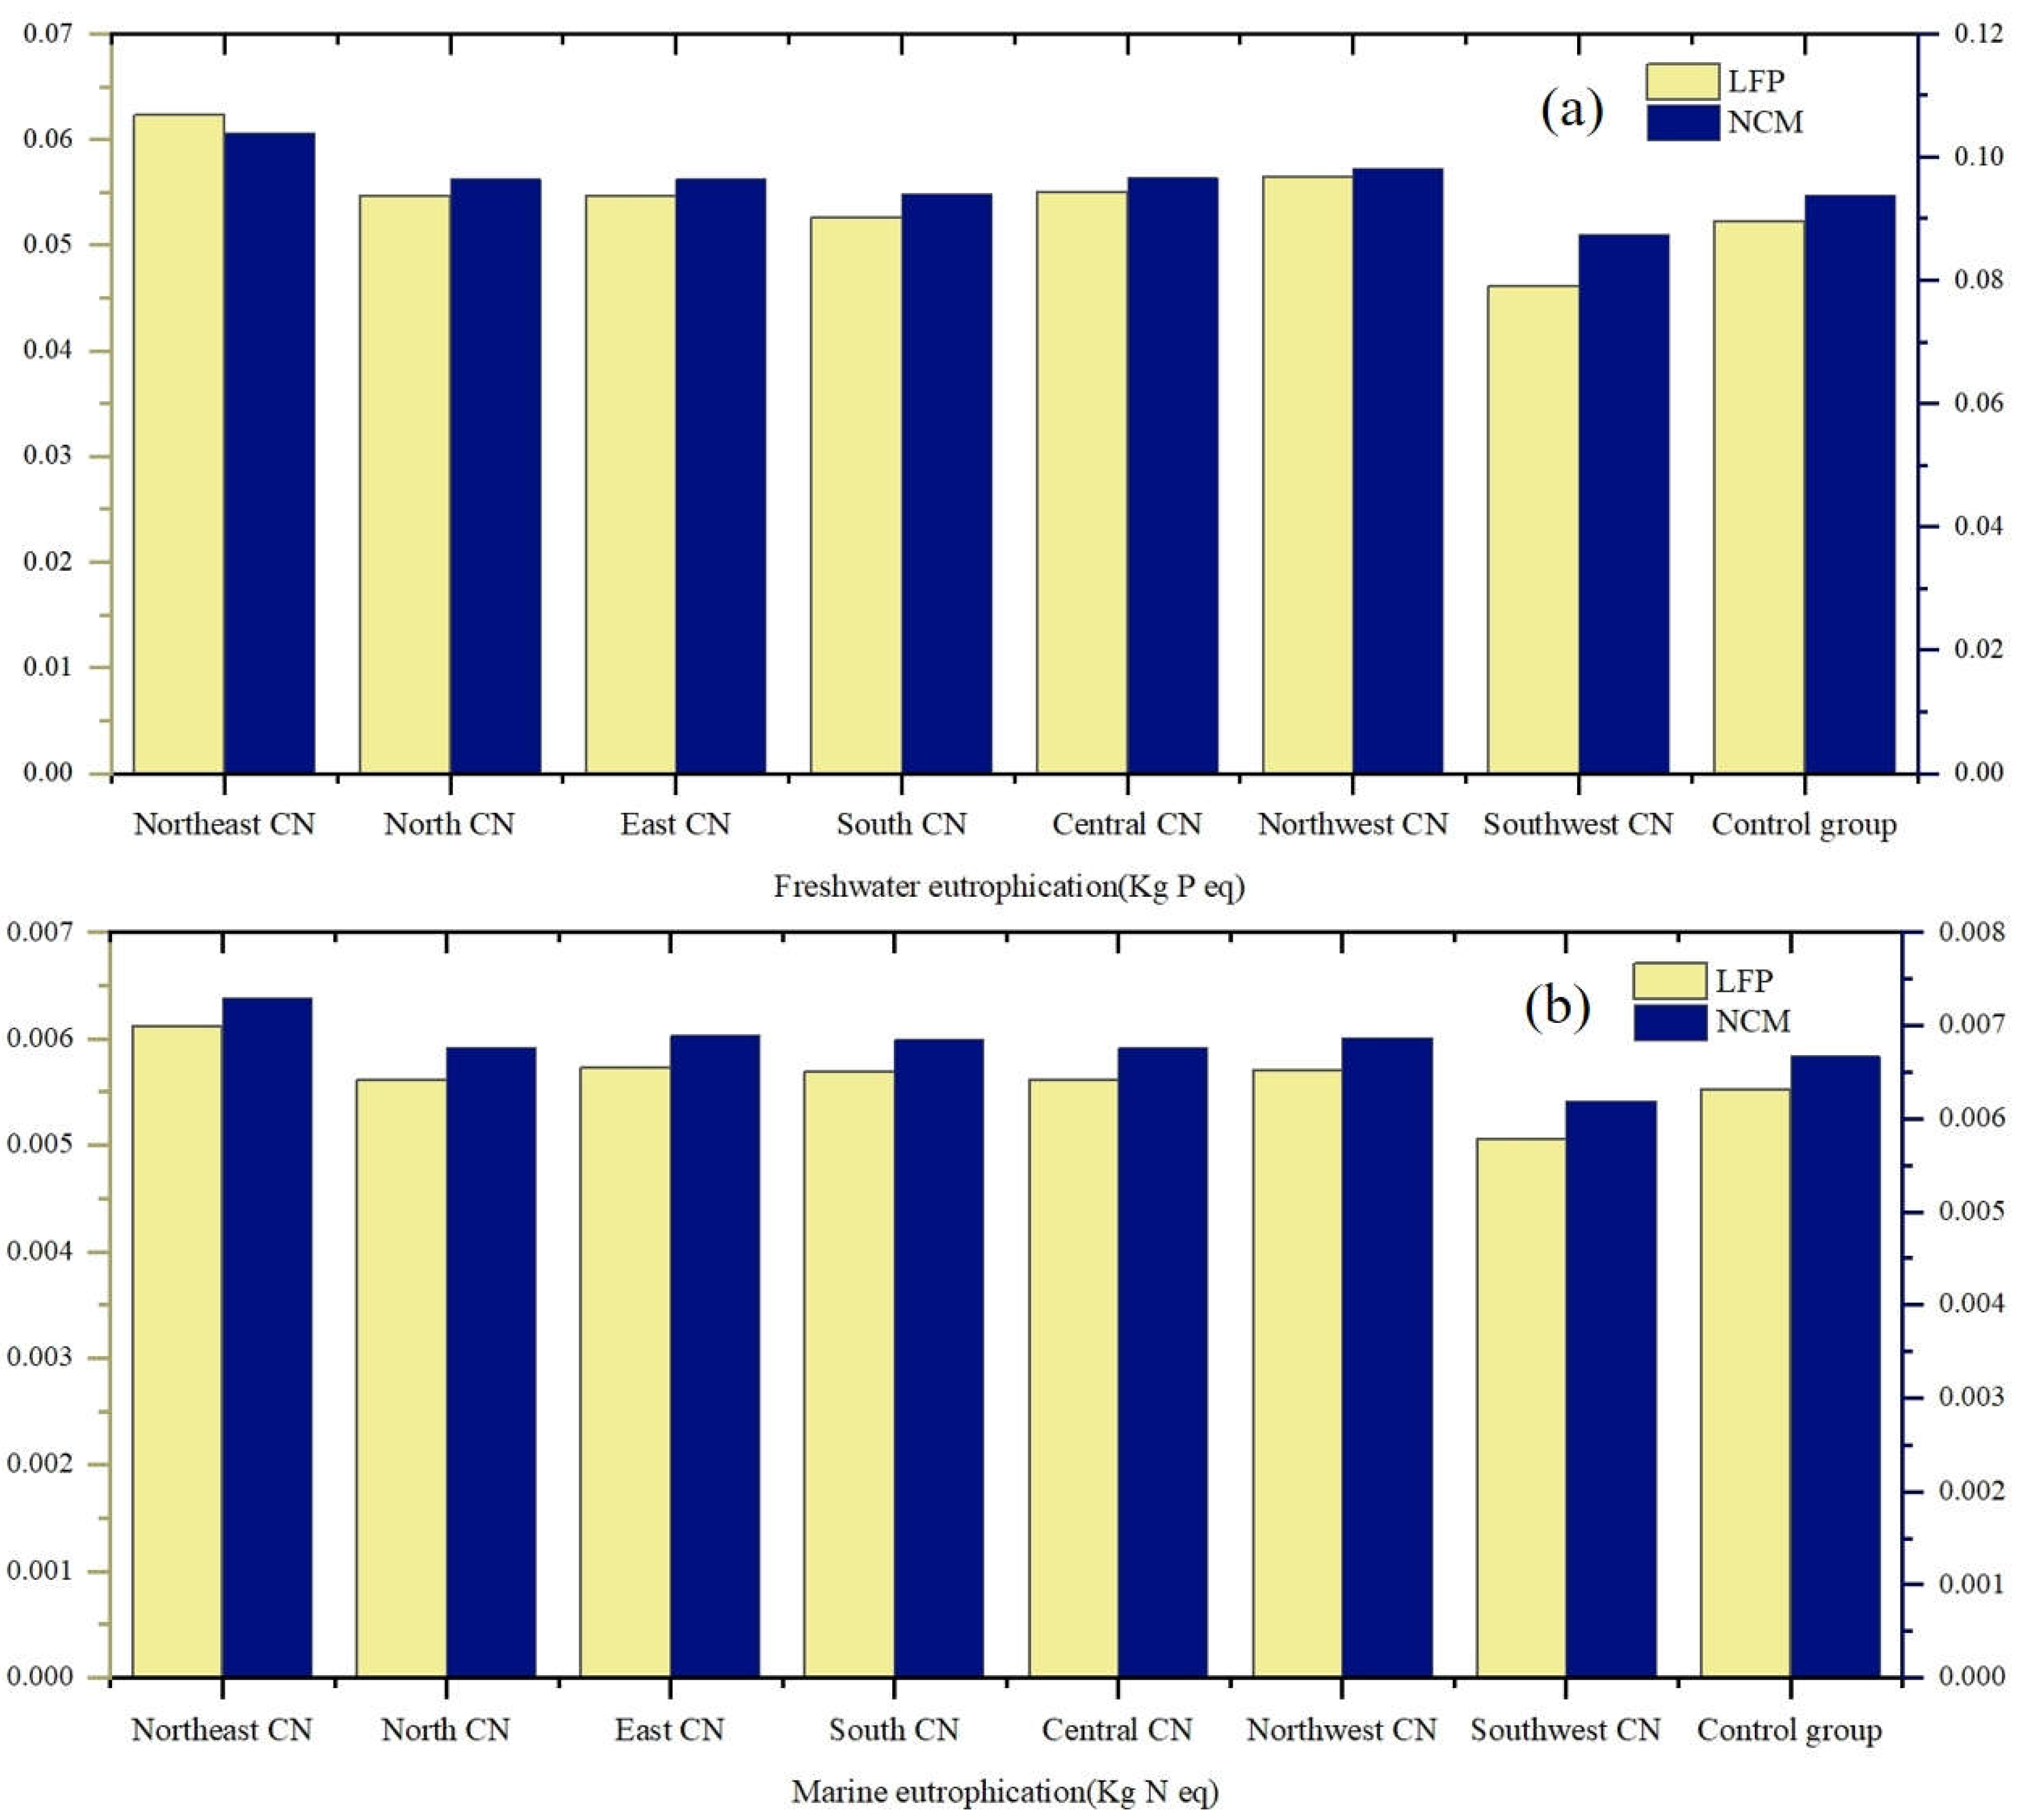
3.3.3. Eutrophication Depletion Analysis
This part of the eutrophication study based on Freshwater Eutrophication Potential (FEP) and Marine Eutrophication Potential (MEP) explores the effects of LFP and NCM cells on the water column. By comparing the two graphs in
Figure 14, the eutrophication potential of NCM cells on the water body environment is higher than that of LFP cells in most of the regional factors can be clearly seen. This suggests that while NCM batteries may be superior in performance, they also have a greater negative impact on the water environment. In almost all regions, both freshwater eutrophication potential and marine eutrophication potential are higher for NCM cells than for LFP cells. In addition, NCM batteries also showed higher values for marine eutrophication potential, implying that the toxic and hazardous materials in NCM have a greater negative impact on marine ecosystems.
In contrast, the eutrophication potential of LFP batteries is relatively low in these regions, particularly in the southern, central, north-western and south-western regions, where the freshwater and marine eutrophication potential of LFP batteries is significantly lower than that of NCM batteries. This performance highlights the advantages of LFP batteries in reducing water pollution, making them better performers in terms of environmental friendliness.
From the environmental point of view, LFP batteries are obviously more friendly to the water environment. Therefore, when considering the impact of the water environment, LFP batteries may be a more desirable choice.
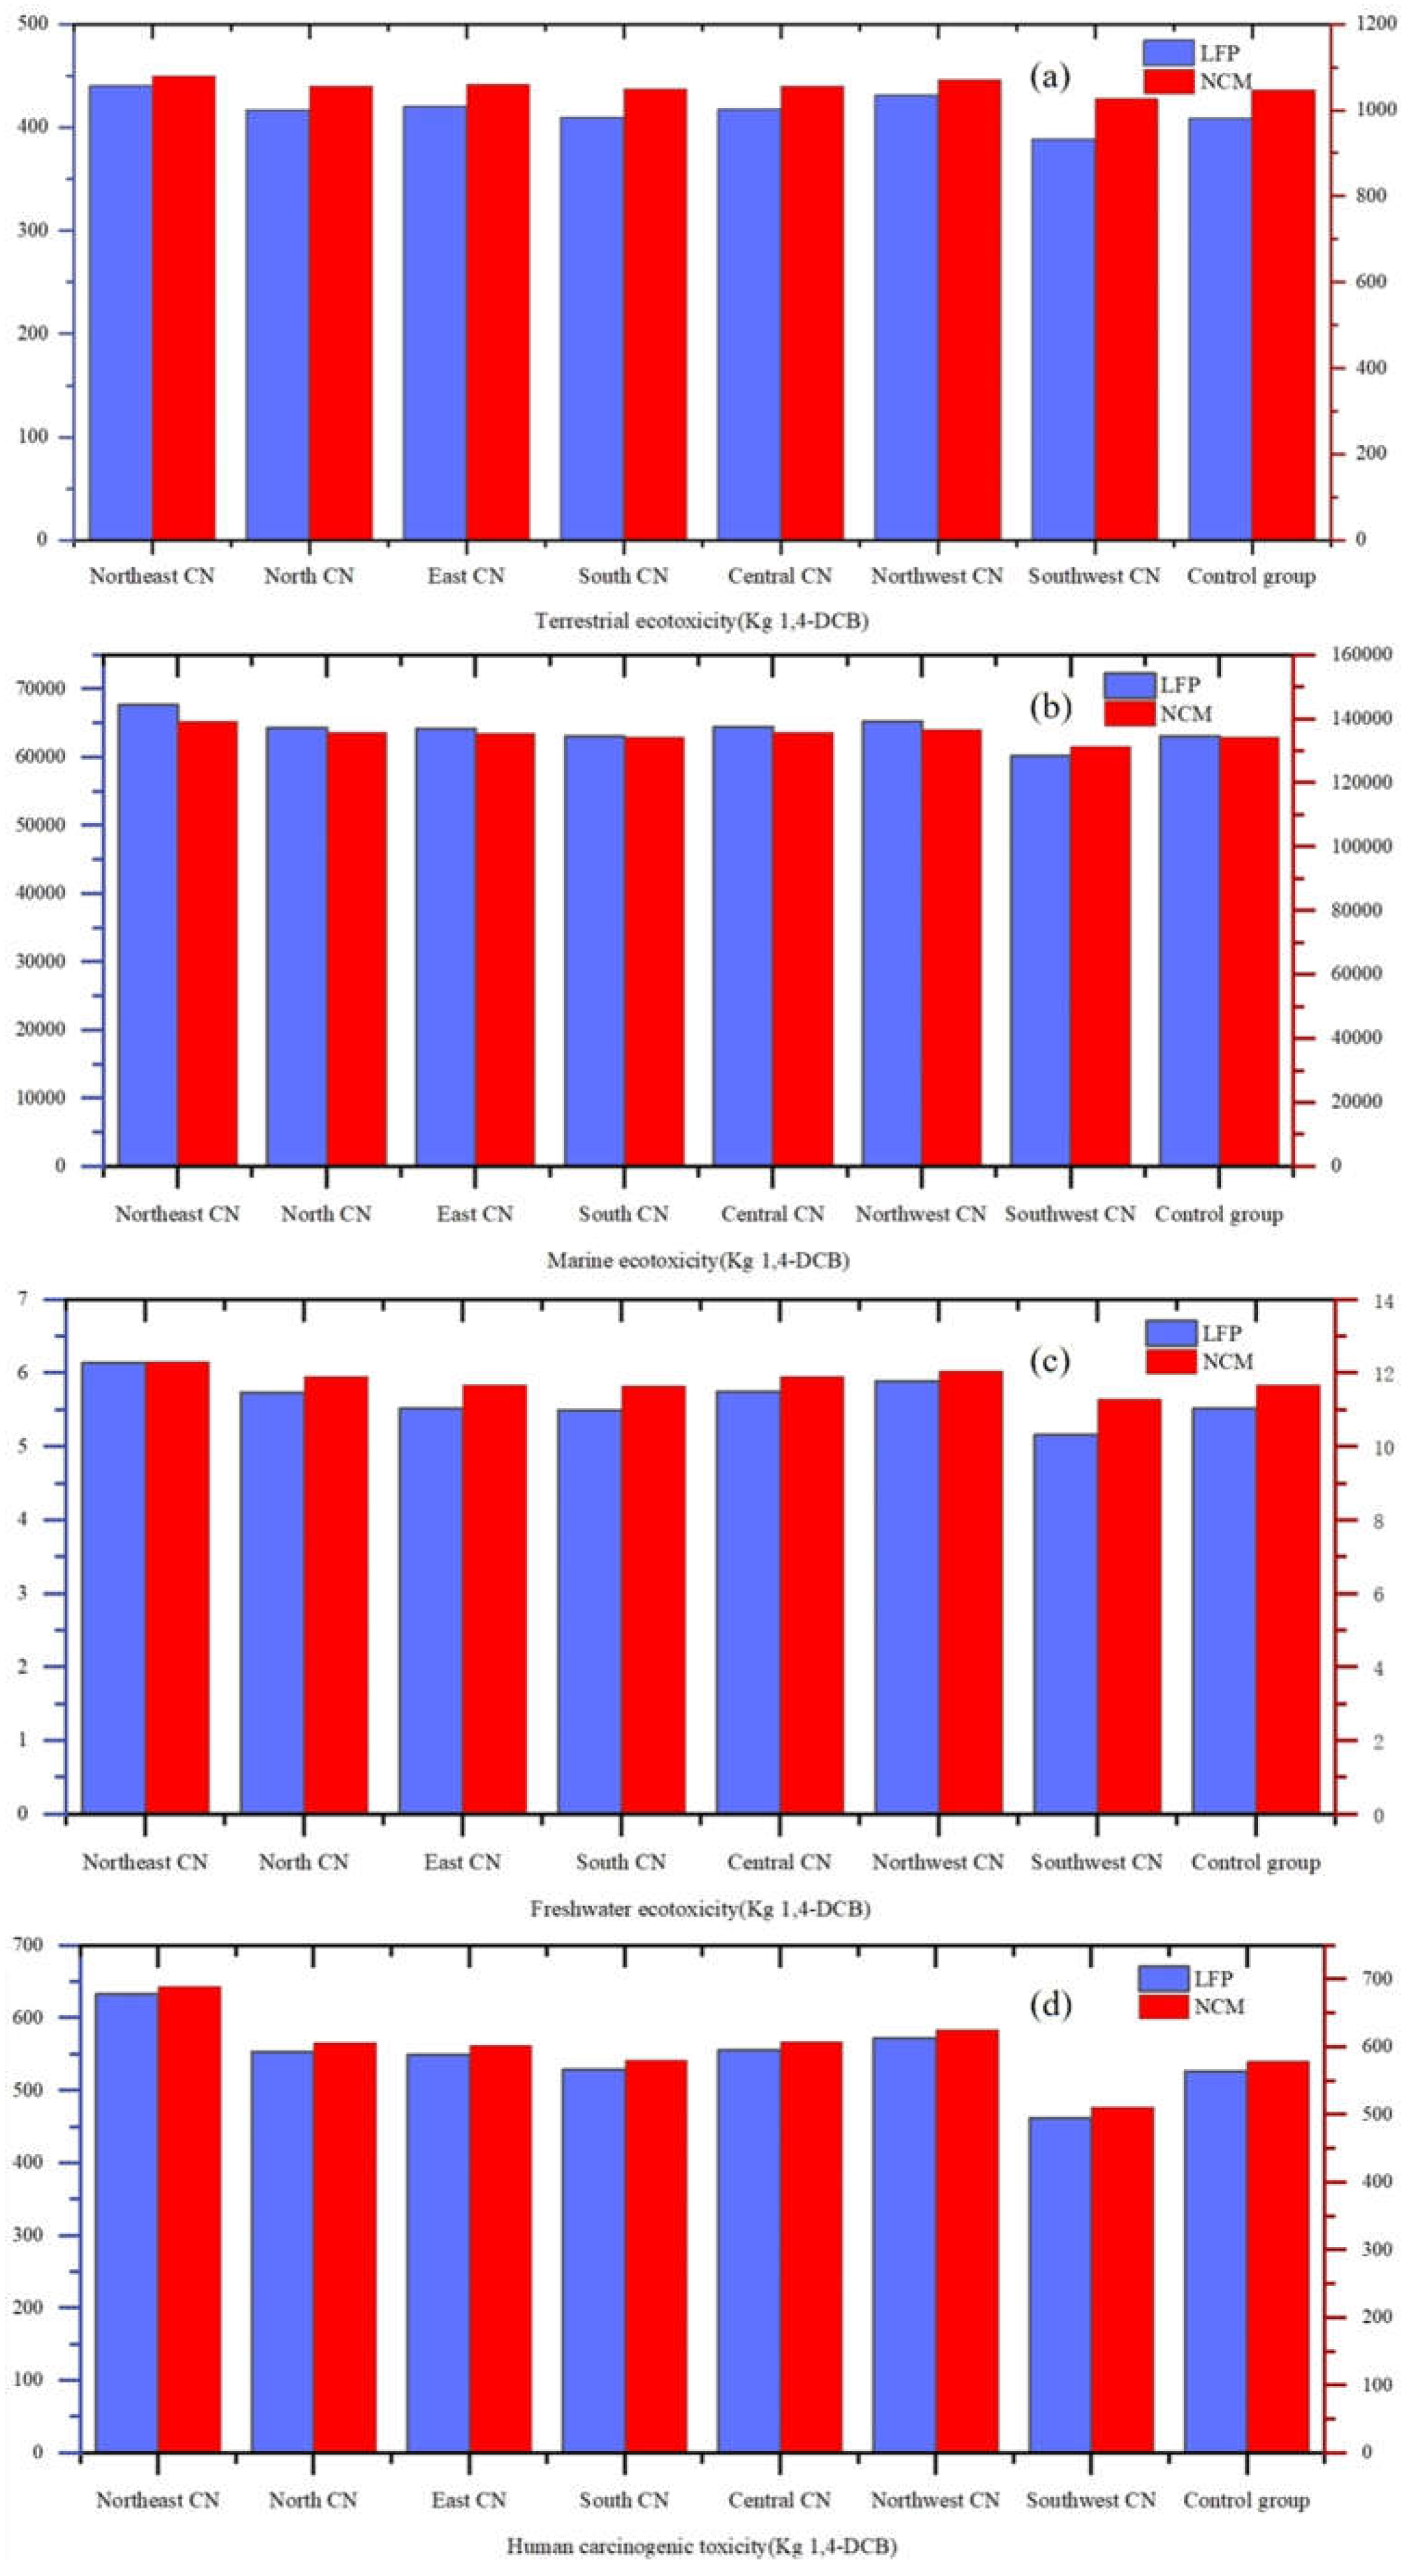
3.3.4. Eco-Toxicity Analyses
In this study, the water eco-toxicity potential is divided into freshwater eco-toxicity potential (FETP) and marine eco-toxicity potential (METP), human eco-toxicity is mainly investigated as human carcinogenicity toxicity potential (HTPc), and terrestrial eco-toxicity is investigated based on terrestrial eco-toxicity potential (TETP). By comparing the four charts in
Figure 15, it can be found that the differences between regions are not significant in terrestrial, marine and freshwater ecosystem toxicity accounting, and the differences in the values mainly depend on the type of battery. Specifically, NCM batteries have higher values than LFP batteries for all eco-toxicity and human carcinogenicity. This suggests that while NCM batteries may be superior in performance, they also have greater negative ecological impacts, particularly in terrestrial, marine and freshwater ecosystems.
In contrast, LFP batteries show more environmentally friendly and safer characteristics in terms of environmental impact. Whether in terms of reducing terrestrial eco-toxicity, marine eco-toxicity, freshwater eco-toxicity and human carcinogenic toxicity, LFP batteries show lower values, proving that they have less negative impact on the environment.
Such results are a reminder that when choosing a battery type, it is important to consider not only its performance advantages, but also to comprehensively assess its potential impact on the environment. Although NCM batteries may have greater advantages in some performance metrics, their higher eco-toxicity and human carcinogenic toxicity suggest that their potential threat to the environment and health cannot be ignored. On the contrary, LFP batteries are more suitable as environmentally friendly energy solutions due to their lower environmental toxicity.
4. Conclusion
The production of electric vehicle batteries has a significant environmental impact. In this study, the environmental impacts of 1kWh NCM and LFP batteries are evaluated and compared by means of a component life cycle model: NCM batteries have a high energy density but consume more resources and have a higher environmental impact, while LFP batteries have a slightly lower energy density but consume fewer resources and are more environmentally friendly. However, whether it is NCM or LFP batteries, the negative impacts on the resource environment and human health caused by the waste produced and the energy used in the production process cannot be ignored.
To mitigate these impacts, clean energy sources such as solar, wind and water should be widely used to reduce dependence on fossil fuels and lower CO2 emissions. Future battery production needs to comprehensively utilize clean energy, optimize site selection to reduce carbon emissions, and promote the green development of the industry chain. Improving energy efficiency and adopting low-carbon raw materials and technologies are also key to reducing environmental impact.
The green transformation of the battery industry is critical to achieving the national carbon peaking and carbon neutrality goals. Increasing the use of clean energy and optimizing production processes can help reduce environmental pollution and promote sustainable economic and social development.
In summary, increasing clean energy use and optimizing production processes can significantly reduce the environmental impacts of EV battery production and support the environmental and sustainable development of the industry. This study provides a reference for policy makers, enterprises and research institutions to promote the green transformation of the battery industry.
Supplementary Materials
The following supporting information can be downloaded at the website of this paper posted on Preprints.org.
CRediT Authorship Contribution Statement
Ruiqi Feng is the first author who built the assessment model and wrote the original manuscript; Wei Guo is the corresponding author who guided the ideas and revised the manuscript; Chenjie Zhang is involved in the revision of the manuscript; Yuxuan Nie is associated with the model building and data analysis.
Acknowledgments
This work was supported by financial support from the National Natural Science Foundation of China Youth Fund [NO.51605356], the 111Project [B17034], and the Innovative Research Team Development Program of the Ministry of Education of China [No. IRT_17R83], the Fundamental Research Funds for the Central Universities [WUT: 2019Ⅲ112CG], National Key R&D Program of China [No. 2018YFB1106700].
Declaration of Interests
The authors declare that they have no known competing financial interests or personal relationships that could have appeared to influence the work reported in this paper.
References
- Du, X. (2023). Thoughts on strategies and paths to achieve carbon peaking and carbon neutrality in China [Editorial Material]. Frontiers in Energy, 17(3), 324-331. [CrossRef]
- He, B., Yuan, X., Qian, S., & Li, B. (2023). Carbon Neutrality: A Review [Review]. Journal of Computing and Information Science in Engineering, 23(6), Article 060809. [CrossRef]
- Liu, M., Wu, J., Lang, Z., & Meng, X. (2023). Long-term energy-environment-economic programming under carbon neutrality target: a study on China's regional energy transition pathways and CO2 mitigation strategies. Energy Sources Part B-Economics Planning and Policy, 18(1), Article 2229321. [CrossRef]
- Liu, X. (2023). The impact of China's high-quality development of energy on carbon neutrality. Energy Reports, 9, 2665-2675. [CrossRef]
- Zhan, J., Wang, C., Wang, H., Zhang, F., & Li, Z. (2024). Pathways to achieve carbon emission peak and carbon neutrality by 2060: A case study in the Beijing-Tianjin-Hebei region, China. Renewable & Sustainable Energy Reviews, 189, Article 495. Sustainable Energy Reviews, 189, Article 113955. [CrossRef]
- Dai, F., Kahrl, F., Gordon, J. A., Perron, J., Chen, Z., Liu, Z., Yu, Y., Zhu, B., Xie, Y., Yuan, Y., Hu, Y., & Wu, Y. (2023). US-China coordination on carbon neutrality: an analytical framework. Climate Policy, 23(7), 929-943. [CrossRef]
- Morris, J., Chen, Y. h. H., Gurgel, A., Reilly, J., & Sokolov, A. (2023). NET ZERO EMISSIONS OF GREENHOUSE GASES BY 2050: ACHIEVABLE AND AT WHAT COST?[; Early Access]. Climate Change Economics. [CrossRef]
- Tang, W., Mai, L., & Li, M. (2023). Green innovation and resource efficiency to meet net-zero emission. Resources Policy, 86, Article 104231. [CrossRef]
- Zickfeld, K., Macisaac, A. J., Canadell, J. G., Fuss, S., Jackson, R. B., Jones, C. D., Lohila, A., Matthews, H. D., Peters, G. P., Rogelj, J., & Zaehle, S. (2023). Net-zero approaches must consider Earth system impacts to achieve climate goals. Nature Climate Change, 13(12), 1298-1305. [CrossRef]
- Arvidsson, R., Svanstrom, M., Sanden, B. A., Thonemann, N., Steubing, B., & Cucurachi, S. (2024). Terminology for future-oriented life cycle assessment: review and recommendations [Review]. International Journal of Life Cycle Assessment, 29(4), 607-613. [CrossRef]
- T. Feng, W. Guo, Q. Li, Z. Meng, W. Liang, Comparative life cycle assessment of sodium-ion and lithium iron phosphate batteries batteries in the context of carbon neutrality. Journal of Energy Storage, 32: 885-889. Journal of Energy Storage, 32: 885-889. [CrossRef]
- Peters, J. F. (2023). Best practices for life cycle assessment of batteries [Editorial Material]. Nature Sustainability, 6(6), 614-616. [CrossRef]
- Bulut, M., & Özcan, E. (2024). How to build a state-of-the-art battery energy storage market? Challenges, opportunities, and future directions. Journal of Energy Storage, 86,. Article 111174. [CrossRef]
- Parsons, D. (2007). The environmental impact of disposable versus re-chargeable batteries for consumer use. International Journal of Life Cycle Assessment, 12(3), 197- 203. [CrossRef]
- Picatoste, A., Justel, D., & Mendoza, J. M. F. (2022). Circularity and life cycle environmental impact assessment of batteries for electric vehicles: Industrial challenges, best practices and research guidelines. Renewable & Sustainable Energy Reviews, 169, Article 112941. [CrossRef]
- Simaitis, J., Allen, S., & Vagg, C. (2023). Are future recycling benefits misleading? Prospective life cycle assessment of lithium-ion batteries. Journal of Industrial Ecology, 27(5), 1291- 1303. [CrossRef]
- Guo, W., Feng, T., Li, W., Hua, L., Meng, Z. H., & Li, K. (2023). Comparative life cycle assessment of sodium-ion and lithium iron phosphate batteries batteries in the context of carbon neutrality. Journal of Energy Storage, 72 Journal of Energy Storage, 72 , Article 108589. [CrossRef]
- Tang, W., Xu, S., Zhou, X., Yang, K., Wang, Y., Qin, J., Wang, H., & Li, X. (2023). Meeting China's electricity demand with renewable energy over Tibetan Plateau [Editorial Material]. Science Bulletin, 68(1), 39-42. [CrossRef]
- Xiang, M.-Y., Wang, S., Lu, L.-H., Zhang, N., & Bai, Z.-H. (2023). Synergistic Paths of Reduced Pollution and Carbon Emissions Based on Different Power Demands in China [English Abstract;]. Huan jing ke xue= Huanjing kexue, 44(7), 3637-3648. [CrossRef]
- Zhu, G., Huan, H., Yu, D., Guo, X., & Tian, Q. (2023). Selective Recovery of Lithium from Spent Lithium-Ion Batteries [Review]. Progress in Chemistry, 35(2), 287-301. [CrossRef]
- Jin, S., Mu, D. Y., Lu, Z., Li, R. H., Liu, Z., Wang, Y., Tian, S., & Dai, C. S. (2022). A comprehensive review on the recycling of spent lithium-ion batteries: Urgent status and technology advances. Journal of Cleaner Production, 340, Article 130535. Article 130535. [CrossRef]
- Ma, L. W., Xi, X. L., Zhang, Z. Z., & Lyu, Z. (2022). Separation and Comprehensive Recovery of Cobalt, Nickel, and Lithium from Spent Power Lithium-Ion Batteries. Minerals, 12(4), Article 425. [CrossRef]
- de Biasi, L., Schwarz, B., Brezesinski, T., Hartmann, P., Janek, J., & Ehrenberg, H. (2019). Chemical, Structural, and Electronic Aspects of Formation and Degradation Behaviour on Different Length Scales of Ni-Rich NCM and Li-Rich HE-NCM Cathode Materials in Li-Ion Batteries [Review]. Advanced Materials, 31(26), Article 1900985. [CrossRef]
- Ellis, B. L., Lee, K. T., & Nazar, L. F. (2010). Positive Electrode Materials for Li-Ion and Li-Batteries [Review]. Chemistry of Materials, 22(3), 691-714. [CrossRef]
- Ellis, B. L., & Nazar, L. F. (2012). Reply to Comment on "Positive Electrode Materials for Li-Ion and Li-Batteries" [Editorial Material]. Chemistry of Materials, 24(11), 2244-2245. [CrossRef]
- Finkbeiner, M., Inaba, A., Tan, R. B. H., Christiansen, K., & Klüppel, H. J. (2006). The new international standards for life cycle assessment:: ISO 14040 and ISO 14044. International Journal of Life Cycle Assessment, 11(2), 80-85. International Journal of Life Cycle Assessment, 11(2), 80-85. [CrossRef]
- Klöpffer, W. (2012). The critical review of life cycle assessment studies according to ISO 14040 and 14044. International Journal of Life Cycle Assessment, 17(9), 1087-1093 . [CrossRef]
- Pryshlakivsky, J., & Searcy, C. (2013). Fifteen years of ISO 14040: a review. Journal of Cleaner Production, 57, 115-123. [CrossRef]
- Huijbregts, M. A. J., Steinmann, Z. J. N., Elshout, P. M. F., Stam, G., Verones, F., Vieira, M., Zijp, M., Hollander, A., & van Zelm, R. (2017). ReCiPe2016: a harmonised life cycle impact assessment method at midpoint and endpoint level. International Journal of Life Cycle Assessment, 22(2),. 138-147. [CrossRef]
- Dekker, E., Zijp, M. C., van de Kamp, M. E., Temme, E. H. M., & van Zelm, R. (2020). A taste of the new ReCiPe for life cycle assessment: consequences of the updated impact assessment method on food product LCAs. international Journal of Life Cycle Assessment, 25(12), 2315-2324. [CrossRef]
Figure 1.
New Energy Vehicle Production,Sale and Market share 2014-2035 (10,000 units).
Figure 1.
New Energy Vehicle Production,Sale and Market share 2014-2035 (10,000 units).
Figure 2.
Percentage of China's power generation by region.
Figure 2.
Percentage of China's power generation by region.
Figure 3.
System boundary of LFP and NCM cells.
Figure 3.
System boundary of LFP and NCM cells.
Figure 4.
Composition of NCM and LFP cells.
Figure 4.
Composition of NCM and LFP cells.
Figure 5.
Carbon footprint of LFP battery production stage.
Figure 5.
Carbon footprint of LFP battery production stage.
Figure 6.
Carbon footprint of NCM cell production stage.
Figure 6.
Carbon footprint of NCM cell production stage.
Figure 7.
Comparison of carbon emissions from battery production processes.
Figure 7.
Comparison of carbon emissions from battery production processes.
Figure 8.
Comparison of ozone layer impacts, (a)ozone depletion potential, (b)human health ozone formation potential, (c)terrestrial ecosystem ozone formation potential.
Figure 8.
Comparison of ozone layer impacts, (a)ozone depletion potential, (b)human health ozone formation potential, (c)terrestrial ecosystem ozone formation potential.
Figure 9.
Comparison of eutrophication effects in water bodies, (a) freshwater eutrophication potential, (b) marine eutrophication potential.
Figure 9.
Comparison of eutrophication effects in water bodies, (a) freshwater eutrophication potential, (b) marine eutrophication potential.
Figure 10.
Comparison of eco-toxicity effects, (a)terrestrial eco-toxicity potential, (b)marine eco-toxicity potential, (c)freshwater eco-toxicity potential, (d)human carcinogenicity potential.
Figure 10.
Comparison of eco-toxicity effects, (a)terrestrial eco-toxicity potential, (b)marine eco-toxicity potential, (c)freshwater eco-toxicity potential, (d)human carcinogenicity potential.
Figure 11.
Mainstream power generation in China by region [
11].
Figure 11.
Mainstream power generation in China by region [
11].
Figure 12.
Comparison of carbon emissions from battery production processes.
Figure 12.
Comparison of carbon emissions from battery production processes.
Figure 13.
Comparison of ozone layer impacts, (a)ozone depletion potential, (b)human health ozone formation potential, (c)terrestrial ecosystem ozone formation potential.
Figure 13.
Comparison of ozone layer impacts, (a)ozone depletion potential, (b)human health ozone formation potential, (c)terrestrial ecosystem ozone formation potential.
Figure 14.
Comparison of eutrophication effects in water bodies, (a)freshwater eutrophication potential, (b)marine eutrophication potential.
Figure 14.
Comparison of eutrophication effects in water bodies, (a)freshwater eutrophication potential, (b)marine eutrophication potential.
Figure 15.
Comparison of eco-toxicity effects, (a)terrestrial eco-toxicity potential, (b)marine eco-toxicity potential, (c)freshwater eco-toxicity potential, (d)human carcinogenicity potential.
Figure 15.
Comparison of eco-toxicity effects, (a)terrestrial eco-toxicity potential, (b)marine eco-toxicity potential, (c)freshwater eco-toxicity potential, (d)human carcinogenicity potential.
Table 1.
New Energy Vehicle Production,Sale and Market share 2014-2035 (10,000 units).
Table 1.
New Energy Vehicle Production,Sale and Market share 2014-2035 (10,000 units).
| |
Year |
2014 |
2015 |
2016 |
2017 |
2018 |
2019 |
2020 |
| EVs |
Product |
7.85 |
34.05 |
51.6 |
79.4 |
127.2 |
124.2 |
136.6 |
| Sale |
7.48 |
33.11 |
60.7 |
77.7 |
125.6 |
120.6 |
136.7 |
| Market share |
0.3% |
1.35% |
1.81% |
2.69% |
4.47% |
4.68% |
5.40% |
| Year |
2021 |
2022 |
2023 |
2024 |
2025 |
2030 |
2035 |
| Product |
354.5 |
705.8 |
958.7 |
1200 |
1400 |
3300 |
4000 |
| Sale |
352.1 |
688.7 |
949.5 |
1150 |
1360 |
3200 |
3800 |
| Market share |
13.4% |
25.6% |
31.6% |
45.0% |
50% |
70% |
90% |
Table 2.
Carbon emission factors for the whole life cycle of power generation .
Table 2.
Carbon emission factors for the whole life cycle of power generation .
| methods |
numerical value/(g/(kW-h)) |
average value/(g/(kW-h)) |
| Thermal power |
Coal |
838.6, 810.0, 973.4 |
874.0 |
| Gas |
522.4, 420.0, 392.0 |
444.8 |
| Oil |
710.0 |
710.0 |
| Hydro power |
3.3, 12.8, 3.5, 25.8, 18.5, 22.2 |
15.1 |
| Wind power |
28.6, 17.8, 31.4, 2.7 |
20.1 |
| Solar power |
92.0, 119.4, 28.8, 50.0 |
72.5 |
Table 3.
Table of symbols and units.
Table 3.
Table of symbols and units.
| Parameter name |
Notation |
Unit |
| Theoretical (gram) capacity |
Ctheoretical
|
mAh/g |
| Actual (gram) capacity |
Cactual
|
mAh/g |
| Faraday's constant |
F |
C/mol |
| Molecular weight |
M |
g/mol |
| Lithium quantity |
nLi
|
mol |
| Li-ion removal coefficient |
µLi
|
Dimensionless,less than one |
| Battery design capacity |
Qdesign
|
mAh |
| Coating layer density |
Γcoating
|
g/m2
|
| Proportion of active substance |
Pactive
|
Dimensionless,less than one |
| Gram capacity of active substance |
Cactive
|
mAh/g |
| Electrode coating area |
A |
m2
|
| N/P ratio |
RN/P
|
Dimensionless,less than one |
| Gram capacity of negative active substance |
Cnegative
|
mAh/g |
| Density of negative surface |
Γnegative
|
g/m2
|
| Content ratio of negative active substance |
Pnegative
|
Dimensionless,less than one |
| Gram capacity of positive active substance |
Cpositive
|
mAh/g |
| Density of positive surface |
Γpositive
|
g/m2
|
| Content ratio of positive active substance |
Ppositive
|
Dimensionless,less than one |
| Battery mass energy density |
Γmass
|
Wh/kg |
| Battery volumetric energy density |
Γvolume
|
Wh/L |
| Battery capacity |
Q |
mAh |
| Battery mass |
m |
kg |
| Battery volume |
V |
L |
| Battery voltage |
U |
V |
|
Disclaimer/Publisher’s Note: The statements, opinions and data contained in all publications are solely those of the individual author(s) and contributor(s) and not of MDPI and/or the editor(s). MDPI and/or the editor(s) disclaim responsibility for any injury to people or property resulting from any ideas, methods, instructions or products referred to in the content. |
© 2024 by the authors. Licensee MDPI, Basel, Switzerland. This article is an open access article distributed under the terms and conditions of the Creative Commons Attribution (CC BY) license (http://creativecommons.org/licenses/by/4.0/).