
Submitted:
06 November 2024
Posted:
08 November 2024
You are already at the latest version
Abstract
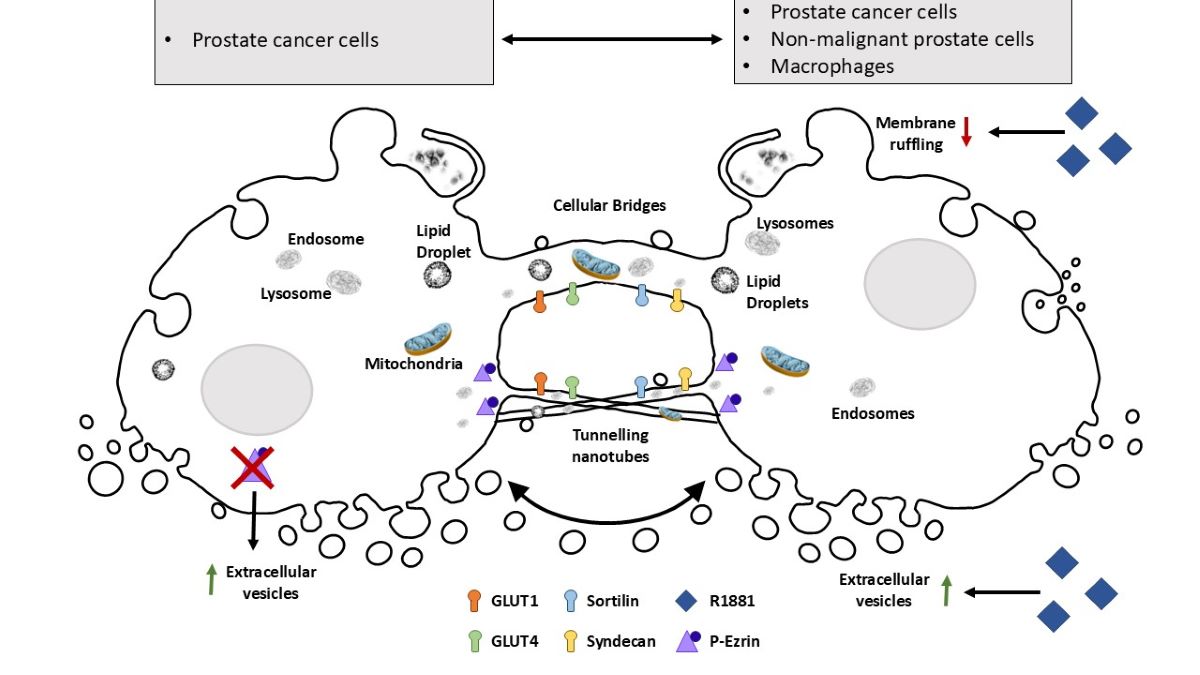
Prostate cancer (PCa) pathogenesis relies on intercellular communication, which can involve tunneling nanotubes (TNTs) and extracellular vesicles (EVs). TNTs and EVs have been reported to transfer critical cargo involved in cellular function and signalling, prompting us to investigate the extent of organelle and protein transfer in PCa cells and the potential involvement of the androgen receptor. Using live cell imaging microscopy, we observed extensive formation of TNTs and EVs operating between PCa, non-malignant and immune cells. PCa cells were capable of transferring lysosomes, mitochondria, lipids and endoplasmic reticulum as well as syndecan-1, sortilin, Glut1 and Glut4. In mechanistic studies, androgen sensitive PCa cells exhibited changes in cell morphology when stimulated by R1881 treatment. Overexpression assays of a newly designed androgen receptor (AR) plasmid revealed its novel localization in PCa cellular vesicles, which were also transferred to neighbouring cells. Selected molecular machinery, thought to be involved in intercellular communication, was investigated by knockdown studies and Western blotting/immunofluorescence/scanning electron microscopy (SEM). PCa TNTs and EVs transported proteins and organelles, which may contain specialist signalling, programming and energy requirements that support cancer growth and progression. This makes these important intercellular communication systems ideal potential targets for therapeutic intervention.
Keywords:
Prostate Cancer (PCa)
; tunneling nanotubes (TNTs)
; extracellular vesicles (EVs)
; cellular bridges
; androgen receptor (AR)
; Ezrin
1. Introduction
Prostate cancer is the second most common form of cancer in males worldwide, and the incidence of this disease is predicted to double globally by 2040 [1]. Currently there are over 1.4 million new cases of prostate cancer diagnosed globally each year, and more than 330 000 deaths [2]. The androgen receptor (AR) nuclear transcription factor pathway is pivotal for prostate cancer development and progression, where binding of testosterone to the AR activates downstream signalling cascades to regulate cancer cell proliferation, survival, and differentiation [3,4,5]. The dependence of prostate cancer on androgen biology and it’s role in disease progression and metastasis makes targeting AR signalling a cornerstone of prostate cancer therapeutic intervention [6]. However, this is far from curative and it is important to gain a better understanding of AR biology, its effects on cancer growth/progression and, importantly, how it is involved in critical cancer cell intercellular communication pathways.
It is becoming increasingly evident that intercellular communication is a critical process supporting prostate cancer cell differentiation and dissemination [7,8,9]. Tunnelling nanotubes (TNTs) and extracellular vesicles (EVs) are emerging as key mediators of intercellular communication, which cancer cells may utilise respectively for direct short-range transfer of constituents/information or for transfer over longer distances. While TNTs and EVs are well recognised entities, the molecular mechanisms controlling their biogenesis and cargo transport are less well defined, particularly in prostate cancer cell biology.
TNTs represent dynamic cellular membrane protrusions (50-200 nm diameter) that can facilitate direct cell-to-cell communication between distant cells (10-200 µm) and be stabilised to form more substantive cellular bridges (1-20 µm diameter) [10]. Within the tumour microenvironment this may enable the transfer of diverse cargo that includes proteins, metabolic substrates, such as lipids and sugars, genetic material, cytosolic signalling machinery, as well as whole organelles between neighbouring cancer cells and non-malignant cells [11]. While the molecular mechanisms governing TNT formation are yet to be discovered, evidence is emerging to suggest a role for cytoskeletal rearrangements and molecular interactions in their genesis [12]. Indeed, ezrin and other actin binding proteins have increased expression in prostate cancer and may play a critical role in linking membrane to cytoskeletal microfilaments [13] and TNT formation. TNTs have been postulated to have a role in prostate cancer pathogenesis, including promoting tumour heterogeneity, facilitating the dissemination of oncogenic signals, and mediating therapeutic resistance [14,15]. TNT and cellular bridge-mediated transfer of organelles and other cell constituents may contribute to cancer progression by energy transfer, aiding immune evasion and be directly involved in the subversive modification of the tumour microenvironment [14].
EVs may also serve as key mediators of inter-cellular communication in prostate cancer, facilitating the exchange of molecular cargo and programming over longer distances. As a generic descriptor for exosomes, nano-vesicles, micro-vesicles and other vesicular carriers that are small, membrane-bound compartments released from cells, EVs can transport biomolecules, cytosolic constituents, nucleic acids, metabolic substrates and other organelles [16]. EVs can be derived from either endosomes or the cell surface and can be detected in a range of biological fluids making them attractive targets for non-invasive cancer diagnosis and monitoring [17,18]. Extracellular vesicle-mediated communication is thought to be important in prostate cancer progression, with EVs being implicated in modulating tumour-stromal interactions, immune function, facilitating metastatic spread and conferring resistance to therapy [19,20,21].
Inter-cellular communication within the prostate cancer microenvironment plays a crucial role in disease progression and therapeutic response. Tunnelling nanotubes, cellular bridges and EVs represent potential mechanisms by which cells exchange information or resources, to influence tumour growth, metastasis, and treatment resistance. Understanding the intricate interplay between these pathways and the androgen receptor signalling cascade is paramount for developing diagnostic strategies and targeted therapies to implement personalized management for patients with prostate cancer. Here we have investigated the dynamics of TNT/cellular bridge and EV formation in prostate cancer cells, visualised the organelle cargo and exchange of AR between cancer and non-malignant cells and examined some of the molecular machinery that may be involved in TNT/EV biogenesis.
2. Materials and Methods
2.1. Cell Culture
Human prostate cell lines PNT1a (#95012614), LNCaP (#89110211), 22RV1 (#05092802) and PC 3 (#90112714) were obtained from the European Collection of Authenticated Cell Cultures (ECACC) via CellBank Australia (NSW, Australia), while PWR-1E (CRL11611), DU145 (HTB-81) and pancreatic BxPC-3 cells (CRL1687) were obtained from the American Type Culture Collection (ATCC) via InVitro Technologies (VIC, Australia). THP-1 monocyte cells were also procured from InVitro Technologies (VIC, Australia). PNT1a, LNCaP, 22RV1, BxPC-3 and THP-1 cells were maintained in RPMI 1640 medium (Gibco®, Thermo Fisher Scientific Australia Pty Ltd., VIC, Australia), the PC 3 cell line was maintained in Ham’s F12K medium (Gibco®), and the DU145 cell line was cultured in MEM with 1 mM sodium pyruvate and 2 mM L-glutamine, all supplemented with 10% (v/v) foetal bovine serum (FBS; Moregate Biotech Pty Ltd., QLD, Australia). PWR-1E cells were cultured in Keratinocyte Serum Free Media (Gibco®). Cell culture media were replenished every three days and cells sub-cultured at ~80 % confluency. Cell cultures were maintained at 37°C with 5 % CO2. The cell lines were authenticated by short tandem repeat profiling and were tested to be negative for mycoplasma contamination using MycoAlert Mycoplasma detection kit (Lonza Bioscience). For all experiments, cells were seeded at densities calculated to reach ~70 % confluency at the experimental end-point (typically, PNT1a; 5.6 × 10³ cells/cm², PWR-1E; 9.2 × 10⁴ cells/cm², LNCaP; 2.8 × 10⁴ cells/cm², 22RV1; 1.75 x 10⁴ cells/cm², PC 3; 1.3 × 10⁴ cells/cm², DU145; 1.2 × 10⁴ cells/cm², THP-1; 1 x 10⁵ cells/cm²). THP-1 monocytes were activated and matured to macrophages at the time of seeding by the addition of 40 ng/mL phorbol-12-myristate-13-acetate (PMA; Sigma) in DMSO to the cell culture medium. For co-culture experiments, cells were differentially stained or transfected as per relevant protocol below, mixed in a 1:1 ratio and seeded for 48 h before downstream applications.
2.2. Plasmid Construction and DNA Transfection
Cells were transfected with LAMP1-GFP and -RFP DNA plasmids as previously described [22]. LAMP1 plasmids were designed to contain LAMP1 (NCBI Reference Sequence NP_005552.3) with GFP N-terminally tagged. pcDNA3.1_AR-mCherry plasmid was designed to contain Homo sapiens androgen receptor (AR), transcript variant 1 (NCBI Reference Sequence NM_000044.4), whereby the stop codon was removed and continued with mCherry fusion tag to preserve both the 3’ and 5’ UTR (Figure S1). The required plasmids transcript was produced, sequenced and subcloned into the pcDNA3.1 vector by GeneART (Life Technologies). AR-mCherry was transfected into cells 24 h post-seeding with approximately 250 ng DNA/cm2 surface area using Lipofectamine 2000 (Life Technologies) as per the manufacturer’s instructions. CellLight Bacmam 2.0 transfections for Actin-GFP and PM-RFP were conducted via manufacter’s instructions (additional information in Table 1).
2.3. Fluorescent labelling
To stain cell plasma membrane (CellMask), mitochondria (Mitotracker), ER (ERtracker), lipids (BODIPY), and lysosomes (Lysotracker), cell culture media were changed to serum free medium and cells stained as per manufacturer’s instructions (additional information in Table 1). For differential DiO/DiD labelling, cells were trypsinised, washed in PBS and 5 µL of DiD or DiO added per 1 mL of cell suspension. Cells were incubated with dye for 20 min at 37°C with gentle inversion every 5 min, then centrifuged and washed with warm cell culture medium twice before seeding.
2.4. Immunofluorescence
Live cells were fixed with 4% paraformaldehyde (PFA) in PBS containing 4% (w/v) sucrose for 10 min, then washed and subsequently blocked/permeabilised with 5% (w/v) bovine serum albumin (BSA) (Sigma) and 0.05 % (w/v) saponin (Sigma) for 1 h at room temperature (RT). Cells were then incubated with primary antibody (see Table 1) in block overnight at 4°C with gentle agitation, washed and further incubated with AlexaFluor conjugated secondary antibody and Hoechst for 1 h at RT. Coverslips were mounted on slides using Prolong Glass Antifade (P36980; Thermo Fisher).
2.5. Confocal Microscopy and Live Cell Imaging
Fluorescence microscopy was performed using a Nikon A1+ confocal microscope (Nikon, Tokyo, Japan) equipped with a LU-N4/LU-N4S 4-laser unit (403, 488, 561 and 638 nm), using a Plan Apo λ 60× oil-immersion objective lens (1.4 N.A.) at 1.2 AU pinhole with NIS Elements software (v4.5, Nikon). Each experiment was repeated three times, with the images of ten cells captured per replicate. Imaging was performed using resonant scanner at 512-pixel resolution, piezo z-stage, 2× line averaging with 3× zoom (0.14 μm/px) and 18 z-steps of 0.4 μm were imaged, with 100 3D frames obtained (~2.5 min per cell). Live cell imaging was captured with either Galvano scanner at 2048 or 512-pixel resolution, piezo z-stage, 1 x zoom (0.15 μm/px), for 1 h and 30 min with no delay.
2.4. Androgen Treatment
Cell culture medium was replaced with fresh RPMI supplemented with 10% charcoal stripped FBS (Gibco) and LNCaP cells cultured for 24 h at 37°C with 5% CO². 10nM synthetic dihydrotestosterone (DHT) (R1881; Sigma-Aldrich Pty Ltd., NSW, Australia), or vehicle (0.01% v/v ethanol (EtOH)), was added to the culture medium and the cells incubated with vehicle or R1881 for either 48 h before imaging, or added immediately during live cell imaging capture.
2.5. Scanning Electron Microscopy
DU145 cells were seeded onto glass coverslips, rinsed in PBS, then fixed in 2.5% glutaraldehyde + 4% paraformaldehyde in PBS for 1 h. Cells were then rinsed with PBS and treated with 1% Osmium Tetroxide for 1 h, followed by a rinse in PBS. Cells were then dehydrated in a graded series of EtOH and critical point dried (CPD) using a Tousimis 931 CPD (Tousimis, United States). Coverslips were mounted on stubs using carbon tabs, then platinum coated. Scanning electron microscopy was performed on the XL30 FEG SEM (Phillips, Netherlands).
2.6. Protein Extraction and Quantification
Cells were washed with ice cold PBS (ThermoFisher Scientific; catalog #10010023), then scraped in 200 µL of RIPA Buffer (ThermoFisher Scientific; Catalog #89901) with inhibitor cocktail (ThermoFisher Scientific; HALT™ Catalog #). Cells were syringed with a 26G needle 3-4 times and the cell lysate was centrifuged at 10 000 x G for 10 min at 4°C. Supernatant was kept at -30°C until required. Protein concentration of lysates was quantified using PierceTM BCA Protein Assay Kit (23225, ThermoFisher Scientific) as per the manufacturer’s instructions.
2.7. Western Blotting
10 µg of cell extract protein was vortexed and centrifuged at 10 000 x G for 10 min, boiled in NuPAGE® LDS sample buffer with reducing agent for 5 min at 95°C and loaded onto a 10% Bolt Gel (Life Technologies). The gel was electrophoresed for 45 min at a constant 130V (400 mA) and transferred to a polyvinylidene fluoride (PVDF) membrane using an iBlot Transfer Stack and iBlot Western transfer system (Life Technologies) as per manufacturer’s instructions. The transfer membrane was left to air dry and then rehydrated with methanol and rinsed in distilled water. Total protein was detected by incubating the membranes in REVERT Total Protein Stain (LiCor) for 5 min at RT, with gentle rocking. The membranes were then washed twice with REVERT Total Protein Wash Solution (LiCor), rinsed in distilled water and immediately imaged on the Odyssey Clx (LiCor). The membranes were then incubated in REVERT Total Protein Stain Reversal (926-11010, LiCor) for 5 min at RT with gentle rocking, washed in distilled water and blocked by incubation in either 3% BSA TBS-T or Odyssey Blocking Buffer (LiCor) for 1 h at RT. Primary antibodies were incubated overnight at 4°C in sealed plastic and gently rotated. The membranes were washed three times in TBS-T for 4 min at RT. Secondary antibody (IRDye 680RD or IRDye 800CW) was incubated in the dark for 1 h at RT with gentle rocking. Membranes were rinsed in distilled water and imaged on an Odyssey Clx (LiCor). All protein expression was normalised to total protein.
2.8. siRNA Knockdown
SMARTpool ON-TARGETplus siRNA was purchased from DharmaCon Inc. (GE Lifesciences, NSW, Australia: EZR (L-017370-00-0005); RDX (L-011762-00-0005); MSN (L-011732-00-0005); Non-targeting Pool (DHA-D-001810-10-05); GAPDH Control Pool (DHA-D-001830-10-05). Sterile coverslips (size) were inserted into a 6 well plate. Cells were seeded at approximately 1x10⁵ cells/cm² and reverse transfected using Lipofectamine® RNAiMax (Life Technologies) per manufacturer’s instruction with 25 nM siRNA for 48 h. Cells were washed in ice cold PBS and coverslips were removed and prepped for scanning electron microscopy as above. The remaining cells were prepped for protein extraction as above.
2.9. Cell Viability Assay
Cell culture media was replenished at 1/10 volume of Resazurin (BioReagent, CAS 62758-13-8, Sigma-Aldrich) and the cells then incubated at 37°C for 2-4 h. The plate was subsequently read on an Enspire Plate reader (Perkin Elmer).
2.10. Statistical analysis
Visual representation and data analysis were performed using GraphPad Prism 10 (version 10.01.00). Kruskal-wallis test was performed.
3. Results
3.1. Prostate cancer cells communicate via tunnelling nanotubes and extracellular vesicles
To investigate TNTs and EVs as modes of intercellular communication between prostate cancer cells, 22Rv1 or DU145 cells were labelled with different dyes or transfected with fluorescently tagged proteins to visualise cellular constituents using confocal microscopy and live cell imaging. TNTs were observed as actin-positive protrusions from the plasma membrane (Figure 1, 3). 22Rv1 cells transfected with CellLight BacMam actin-GFP were co-cultured with differentially labelled 22Rv1 cells either transfected with CellLight BacMam PM-RFP or Lamp1-RFP DNA plasmid. TNTs were observed protruding from and connecting with the differentially labelled sub-populations of cells and the subsequent TNT conduits contained fluorescent signal from both actin-GFP and PM-RFP (Figure 1A and Video S2). Lamp1-RFP positive EVs were observed rolling along the external face of the plasma membrane of adjacent actin-GFP positive 22Rv1 cells (Figure 1B and Video S3). Cellular content transfer was observed between differentially labelled cells as indicated by co-fluorescence (yellow; Fig 1A and 1B). Vesicular budding/release and TNT interactions were observed in DU145 cells stained with CellMask PM dye (Figure 1C and Video S4). The movement of a vesicle along a TNT was visualised using CellMask™ membrane stain and involved the coordination of two TNTs and EV transit between the two adjacent 22Rv1 prostate cancer cells (Figure 1D).
3.2 Communication between prostate cancer cells and non-malignant cells or macrophages
22Rv1 prostate cancer cells and PNT1a non-malignant prostate cells transiently expressing respectively Lamp1-GFP and -RFP were co-cultured and imaged (Figure 2A). GFP-positive TNTs were observed originating from prostate cancer cells and initiating contact with non-malignant PNT1a cells. Intracellular transfer of material from prostate cancer cells to PNT1a cells was observed by yellow co-fluorescence (Figure 2A, merged image 1). This exchange was also observed between LNCaP and PNT1a cells (Figure S5). Tunnelling nanotubes/cell bridges were also formed between co-cultured PC-3 prostate cancer cells labelled with lipophilic DiD (red) dye and THP-1 macrophages labelled with DiO (green) (Figure 2B). There was a significant bidirectional exchange of lipophillic label between PC-3 cells and THP-1 macrophages as evident by the yellow fluorescence in TNTs, EVs and each cell type (Figure 2C and D). In live cell images co-fluorescence was observed within the EVs and showed movement of the internal contents (Video S6). TNTs/cell bridges between the cell types were observed connecting and breaking over time frames from live imaging capture (Figure 2B and Video S6). Of particular note, structures resembling cell bridges (shorter and wider connections) were observed to extend into longer and thinner connections that resembled TNTs (Figure 2B and Video S6).
3.3 Prostate cancer cells transfer intracellular contents and organelles via TNTs/cellular bridges
To characterise TNT/cellular bridge cargo transport between cells, 22Rv1 cells were labelled with F-actin cytoskeletal stain and either Lysotracker lysosomal stain (Figure 3A and Video S7), Mitotracker mitochondrial stain (Figure 3B and Video S8), ER tracker endoplasmic recticulum (ER) stain (Figure 3C and Video S9) or BODIPY stained lipid droplets (Figure 3D and Video S10). Using live cell imaging, the transport of this organelle cargo to neighbouring cells was observed via F-actin positive TNT/cellular bridges (Figure 3A-3D). Importantly, bidirectional transport of either Lysotracker or actin stained vesicles (Lysotracker red one direction and green actin in the opposite direction) within a TNT/cell bridge was observed between 22Rv1 cells (Figure 3A). Mitochondria were also observed undergoing bidirectional traffic between cells (data not shown). Using immunofluorescent labelling, the membrane associated proteins Syndecan-1 and Sortilin, plus the glucose transporters GLUT1 and GLUT4, were observed inside/associated with TNT/cellular bridge structures connecting prostate cancer cells (in PC-3, LNCaP, LNCaP and 22Rv1 cells, respectively) (Figure 3F).
3.4 R1881 treatment stimulated changes in the cell surface morphology of LNCaP prostate cancer cells
Given the importance of the AR in normal cell growth and its critical role in the progression of prostate cancer, we investigated potential cell morphology changes induced by treatment with the synthetic androgen R1881 on androgen-sensitive LNCaP cells. In androgen deprived cells, SEM revealed structures resembling membrane ruffles on LNCaP cells (Figure 4A and 4D(i)), which changed after the addition of R1881, resulting in a smoother membrane surface topography (Figure 4B and 4D(ii)-4D(iii)). In response to R1881 treatment, immediate changes in membrane morphology including membrane blebbing were observed, which resolved after approximately 8 min post-treatment (Figure 4. . Interestingly, the morphological changes could be visualised by SEM during a fixed time chase, whereby extracellular vesicles docked to the cell surface appeared to be increased and membrane ruffling again appeared to be reduced after R1881 treatment (Figure 4D).
3.5 Androgen receptor localisation and transport
Following our observation that R1881 treatment induced changes in membrane and vesicular topography, we transfected LNCaP cells with a uniquely designed AR plasmid (Figure S1) to investigate the receptor transport and its localisation. The presence of the AR-mCherry protein at the correct size was confirmed post-transfection via Western blot, with AR negative BxPC-3 cells as a comparison (Figure S11). AR-mCherry was observed in association with vesicular structures through out LNCaP cells and was transported between cells in vesicles transiting along TNTs/cellular bridges (Figure 5A). Vesicular associated AR-mCherry was also observed within 22Rv1 prostate cancer cells (Figure S12A). Co-culture experiments between non-malignant PNT1a cells transfected with actin-GFP, and 22Rv1 cells transfected with AR-mCherry (Figure 5B) revealed that AR-mCherry was transferred to neighbouring cells. AR transport was also observed between LNCaP and PNT1a cells (Figure S12B). Extracellular docking of AR-mCherry positive vesicles onto LNCaP cells was observed (Figure 5C).
3.6 Ezrin phosphorylation and cellular localisation is altered following R1881 treatment
Ezrin is involved in plasma membrane and actin crosslinking, and is localised at the site of tunnelling nanotube initiation, prompting us to investigate ezrin and it’s functionally redundant protein family members moesin and radixin, and their role in modulating cell surface morphology in prostate cancer cells. Ezrin and moesin expression was reduced in androgen sensitive LNCaP and 22Rv1 prostate cancer cell lines compared to androgen sensitive non-malignant PWR-1E prostate cells (Figure 6A and 6B). Ezrin is activated and phosphorylated in the presence of R1881 [23]. Although R1881 treatment did not significantly effect ezrin protein expression (Western blot; Figure 6C), immunofluorescence showed cellular localisation of ezrin protein was altered in PWR-1E and LNCaP cells with R1881 treatment increasing its membrane localisation (Figure 6D and 6E). Moesin and radixin expression did not change with R1881 treatment (Figure S13).
3.7 Ezrin knockdown alters prostate cancer cell surface morphology
Using androgen insensitive DU145 prostate cancer cells, which have higher endogenous ezrin expression (Figure 6A), we knocked down ezrin and observed cells under SEM to investigate the effect on TNT and EV morphology. Ezrin knockdown in DU145 cells induced a significant alteration in surface morphology, with the increased appearance of vesicular structures on the plasma membrane (Figure 7B) compared to control untreated DU145 cells (Figure 7A), which was confirmed via Western blot analysis (Figure 7C). Cells appeared to adopt an apoptotic like phenotype with vesicular protrusions evident on the cells, but the cell viability was not altered (Figure 7D).
4. Discussion
While EVs and TNTs/cellular bridges are well recognised modes of inter-cellular communication [24,25], there has been limited investigation of these conduits for cellular resources and information transfer in the context of prostate cancer pathogenesis. We provide evidence that TNTs/cellular bridges and EVs are commonly observed in prostate cancer cells and may facilitate intercellular communication. Here we provide evidence of dynamic, real time interactions which prostate cancer cells appear to use to communicate with surrounding cancer cells and to modulate and exploit other cells that reside within their microenvironment [26].
Prostate cancer cells establish and utilise a dynamic network of cargo exchange that contributes to intercellular communication, resource sharing/sequestering and metabolic reprogramming. TNTs/cellular bridges and EVs were observed transferring cellular contents, critical organelles and other protein cargo involved in, for example, biosynthesis, intracellular transport, signalling, energy sensing/storage and degradation. Notably, these interactions involved the bidirectional transfer of various organelles and cargo within singular TNTs/cellular bridges, and included mitochondrial and endosomal-lysosomal compartments. While TNTs and EVs are thought to be independent modes of intercellular communication, EVs were observed interacting with and moving along the external side of TNTs/cellular bridges. This suggests that EVs can be captured by intercellular connections and may direct cargo to specific sites of interaction. Indeed, it is not currently known whether EVs have to use specific docking sites to facilitate exchange. Interestingly, we also observed prostate cancer cells interacting with other cell types, indicating that the information and resource exchange network is not just restricted to interactions between cancer cells. Considerable work is required to establish the functional consequences of these transmission networks, but metabolic programming and the transfer of primary resources to drive cancer progression would appear highly likely [27].
Dynamic formation and breakage of TNTs was observed between cells, which has been previously postulated to involve donating and accepting membrane proteins and lipids [28]. We also observed short cellular bridge structures extend into longer connections that ultimately resembled TNTs. In addition, long TNT structures were observed probing the surrounding environment or interacting with other cells to form stable connections. While some reports have referred to TNTs as a cell culture phenomenon, we have observed TNTs between circulating tumour cells (CTCs) and also involving immune cells (Ward et al, publication in preparation). Here we demonstrated that prostate cancer TNTs/cellular bridges contain critical integral membrane proteins, presumably by providing continuity between the plasma membrane of different cells and enabling the internal and external transfer of membrane and protein constituents. Sortilin, a sorting receptor which controls trans-Golgi transport into the vesicular compartments within cells network [29], and Syndecan-1, a transmembrane proteoglycan involved in cell proliferation, migration and cell-matrix interactions [30,31], were both present in TNTs. These biomarkers have recently been implicated in prostate cancer pathogenesis and have been established as components of the primary pathogenesis, which can be used to facilitate diagnosis and prognosis [32,33]. Prostate cancer cells therefore establish a communication and exchange network that is integrally linked to the pathogenic process.
Metabolic reprogramming is crucial to sustaining the energy demands of prostate cancer development and progression, which is equally important for adapting to a changing microenvironment (e.g. during migration or the metastatic cascade) [34]. In normal prostate growth, zinc accumulation inhibits mitochondrial aconitase to limit Krebs cycle metabolism and the main energy source for ATP production is provided by glycolysis [35]. However prostate cancer cells have been shown to adapt to the rapidly changing microenvironment conditions and instead utilise fatty acids produced by lipogenesis to produce cellular energy. Mitochondrial energy production is exploited by prostate cancer cells at different stages of growth/progression (e.g. to produce ATP and generate excess ROS during early cancer development), but prostate cancer cells also have a propensity for glycolysis even in the presence of oxygen (Warburg effect) [35,36,37]. This critical aspect of metabolic programming is fundamental in prostate cancer biology and likely involves adapting to different environmental conditions such as hypoxia, by changing metabolism to enable progression and survival. Here we showed the capacity for prostate cancer cells to transfer organelles that are involved in energy sensing and production including mitochondria, lipid droplets and endosomes/lysosomes, which were transported via TNTs/cellular bridges and EVs. The glucose transport receptors, GLUT1 and GLUT4, were also observed within TNTs and EVs, which also has implications for glucose uptake and cellular metabolism. TNTs/cellular bridges and EVs are likely to support the dynamic changes in energy metabolism required for rapid cellular division, adapting to hypoxic conditions and for transitioning between different environments during cancer cell metastasis.
We have previously demonstrated altered endosome-lysosome biogenesis and expression of vesicular trafficking machinery in prostate cancer [22,38]. With this evidence and here, the import and export of mitochondria through TNTs and cellular bridges, it is not unreasonable to postulate that prostate cancer cells can also transfer mitochondria in EVs. The delivery of mitochondria, which may also be pre-programmed, would enable recipient cells to acquire an advantageous energy supply or to adapt surrounding cells to a specific metabolic phenotype. Mitochondrial transfer via TNTs has been implicated in increasing aerobic respiration in recipient cells supporting this concept [39]. Changing the expression of glucose transporters and other metabolic machinery could also augment these metabolic profiles, which may promote accelerated progression through the cell cycle, providing an opportunity to grow exponentially and potentially introduce further mutations into cells. This concept not only applies to neighbouring prostate cancer cells, the immediate tumour microenvironment, but importantly include immune cells that rely on specific metabolic control. TNT/cellular bridge modification of the local microenvironment and EV access to stromal cells, blood vessels and distal tissue is likely to be critical during metastasis and to generate a premetastatic niche. Combining metabolic signatures and programming with the transfer of ER, lipid droplets, endosomes and lysosomes is likely to enable specific changes in biosynthesis, provide lipid for membrane and hormone production, transfer aberrant signalling and change degradative potential in target cells.
The biology of the AR has been integrally linked to metabolic reprogramming and transcriptional changes in prostate cancer, and here we show an association of this critical receptor with endosomes-lysosomes and its intra- and intercellular transport. Androgen receptor activity is in part responsible for maintaining prostate metabolism and therefore any alterations to the receptor, including splice variants, can have significant implications to the metabolic profile of prostate cancer cells. We have previously shown that androgen treatment can impact on glucose uptake in LNCaP prostate cancer cells, by inducing an upregulation of sortilin and GLUT1 [32]. There are other organelles and proteins that can also actively contribute to the metabolic activity of the prostate epithelium, including mitochondria, endoplasmic reticulum, syndecan, sortillin and glucose transport proteins such as GLUT4. The role of AR in controlling transcription and translation of critical metabolic and trafficking machinery is important and therefore its transfer between cancer cells and other cells adds another dimension to this critical cell biology.
The significance of AR in prostate cancer biology has been well documented and as a result, multiple therapies target this important pathway. Under normal physiological conditions full-length AR is thought to reside within the cytoplasm prior to its activation, however our study indicates that a significant amount of AR may reside in association with endosome-lysosome vesicles within the cell. AR overexpression plasmids [40] have consistently lacked the canonical full length human AR mRNA which contains a considerable 3’ UTR that controls RNA stability, translation, cellular trafficking and localization [41]. As this may have significant implications when investigating cellular localisation and transport we developed a new plasmid that contained all of the appropriate regulatory regions of the AR mRNA. AR signalling relies on its transfer to the nucleus and whilst important in biological processes of both normal and cancerous conditions, the mechanistic process of AR trafficking within cells has yet to be determined. Our study shows a mode of transport both prior to and immediately after R1881 treatment, which may provide an alternate target for therapies. Androgens can activate both a rapid and late response pathway in the AR signalling cascade, with the former dependent on the Raf-1-MEK pathway [42], resulting in upregulation of pro-survival, proliferation, and metastatic gene expression; pathways that contribute to key hallmarks of cancer. The transfer of the AR to neighbouring cells and to distal sites, may therefore modulate the surrounding and distant microenvironment to promote the metastatic cascade.
ERM proteins have the capacity to interact with and connect the plasma membrane to filamentous actin [43], and actin-like filaments are found in TNTs [44] and EVs [45,46]. Ezrin is an androgen regulated gene [23] and suggested as a target for cancer diagnosis and therapy due to its involvement in cancer progression, metastasis and patient survival cancers [47]. This prompted us to investigate the involvement of ERM proteins in TNT and EV formation. In contrast to previous reports, we showed that ezrin had reduced expression in prostate cancer cells compared to non-malignant cells, albeit with variable expression between different prostate cancer cell lines. Importantly, androgen treatment stimulated the localisation of ezrin to the plasma membrane, whereby it may be fulfilling it’s role to link actin and the plasma membrane. The knockdown of ezrin had a profound effect on DU145 prostate cancer cells, inducing morphological changes and the appearance of EV like structures at the cell surface. There were also marked differences in moesin expression in androgen sensitive (low) to androgen independent cell lines (high) indicating a response to AR activity. The dynamic balance between ERM proteins and links with the cytoskeleton may be a critical component for regulating EV and TNT formation, thereby controlling either membrane protrusions or vesicular formation at the cell surface.
5. Conclusions
The direct connection of the cytoplasm for two cells is a fundamental system for cellular cross talk and the exchange of contents, which forms part of an intricate network of communication. Exchange of messages in a paracrine fashion is also key to information and cellular content transfer and involves EVs that can facilitate longer range transfer. This transport and communication system enables the exchange of organelles, cytokines, chemokines, growth factors, nutrients, raw materials, energy, cytoskeletal structural elements, and signalling messages. We show that prostate cancer cells transport an extensive array of organelle cargo and protein/membrane constituents between cancer cells as well as other cell types. The dynamics of this process when visualised by real time live cell imaging reveals a complex interplay and mixing of cellular contents. Paramount in this exchange, is our unique visualisation of AR intercellular traffic, which has profound significance due to the known consequences of androgen biology in cancer progression and response to treatment. The mechanisms regulating TNT and EV biology and the transport of cargo are yet to be fully elucidated but clearly the link between cytoskeletal protein machinery and cell membranes is an important focus for future investigation.
Supplementary Materials
The following supporting information can be downloaded at the website of this paper posted on Preprints.org. Figure S1. Annotated plasmid DNA gene map for pcDNA3.1_AR-mCherry. Figure S2. Live cell imaging video of co-cultured 22Rv1 prostate cancer cells differentially labelled with either actin (green) or CellMask™ Plasma Membrane (PM) stain (red). Figure S3. Live cell imaging video of differentially labelled 22Rv1 cells expressing Lamp1-RFP and actin-GFP co-cultured together. Figure S4. Live cell imaging video of DU145 cells stained with CellMask™ PM dye showing vesicle budding and TNT connection. Figure S5. Representative confocal images of LNCaP prostate cancer cells labelled with Lamp1-GFP (green) co-cultured with PNT1a non-malignant cells labelled with Lamp1-RFP (red). Figure S6. Live cell imaging video of THP-1 macrophages labelled with DiO (green) co-cultured with PC-3 prostate cancer cells labelled with DiD (red). Figure S7. Live cell imaging video showing 22Rv1 cells expressing fluorescently tagged F-actin and stained with LysoTracker Red. Figure S8. Live cell imaging video showing 22Rv1 cells expressing fluorescently tagged F-actin and stained with Mitotracker Red. Figure S9. Live cell imaging video showing 22Rv1 cells expressing fluorescently tagged F-actin and stained with ER tracker Red. Figure S10. Live cell imaging video showing 22Rv1 cells expressing fluorescently tagged F-actin and stained with BODIPY. Figure S11. Confirmation of AR expression plasmid construct via western blot of AR in AR negative BXPC-3 pancreatic cell lines, and 22Rv1 prostate cancer cells either non-transfected or transfected with AR-mCherry. Figure S12. Representative live cell images of (A) AR-mCherry associated with extracellular vesicles in 22Rv1 cells and (B) LNCaP cells expressing AR-mCherry co-cultured with PNT1a cells transfected with actin-GFP. Figure S13. RDX and MSN protein expression are not affected by R1881 treatment. Endogenous Radixin and Moesin protein were detected by Western blot post R1881 treatment and corresponding signal quantified by normalising to total protein stain.
Author Contributions
The project was conceptualized by DAB, JKH, IRDJ and JJO’L. Planning and drafting of the manuscript and content by JKH and DAB with specific input from IRDJ, JL, CM and RW. The specific data collection involved two main streams of cell biology provided by JKH and JL, with input from IRDJ, BDN, CM and RW. Concepts involving TNTs were developed in discussions with DAB, JKH, IRDJ, MPW, JJO’L, BDN, CM and RW. Concepts involving EVs and data from: DAB, JKH, IRDJ, BDN and CM. Additional data for EM from RW (in consultation with Dr Isabel Morrow). Clinical and AR specific input from JJO’L and LMB. The final manuscript was edited by all authors.
Funding
This study was funded by industry (Envision Sciences Pty Ltd). JKH is supported by a university of South Australia Postgraduate Award (USAPA).
Acknowledgments
The authors wish to acknowledge and thank Dr Juan S. Bonifacino, of the Neurociences and Cellular and Structural Division, NIH for provision of DNA plasmids. The authors also thank Dr. Isabel Morrow for assistance and advice generating SEM imaging, Paul Moretti from Centre for Cancer Biology, UniSA, for assistance and guidance for DNA plasmid confirmation and Dr Jess Logan of UniSA for her invaluable support. Special thanks is also extended to Prof Des Williams of UniSA for conducting final draft feedback.
Conflicts of Interest
The authors declare no conflicts of interest.
References
- James, N.D., et al., The Lancet Commission on prostate cancer: planning for the surge in cases. Lancet, 2024. 403(10437): p. 1683-1722. [CrossRef]
- International, W.C.R.F. Prostate Cancer Statistics. 2023 [cited July 22, 2024].
- Feng, Q. and B. He, Androgen Receptor Signaling in the Development of Castration-Resistant Prostate Cancer. Frontiers in Oncology, 2019. 9. [CrossRef]
- Pisano, C., et al., Interactions between androgen receptor signaling and other molecular pathways in prostate cancer progression: Current and future clinical implications. Crit Rev Oncol Hematol, 2021. 157: p. 103185. [CrossRef]
- Lonergan, P.E. and D.J. Tindall, Androgen receptor signaling in prostate cancer development and progression. J Carcinog, 2011. 10: p. 20. [CrossRef]
- Westaby, D., et al., A New Old Target: Androgen Receptor Signaling and Advanced Prostate Cancer. Annual Review of Pharmacology and Toxicology, 2022. 62(1): p. 131-153. [CrossRef]
- Kang, J., et al., Tumor microenvironment mechanisms and bone metastatic disease progression of prostate cancer. Cancer Lett, 2022. 530: p. 156-169. [CrossRef]
- Henrich, S.E., et al., Prostate cancer extracellular vesicles mediate intercellular communication with bone marrow cells and promote metastasis in a cholesterol-dependent manner. Journal of Extracellular Vesicles, 2020. 10(2). [CrossRef]
- Probert, C., et al., Communication of prostate cancer cells with bone cells via extracellular vesicle RNA; a potential mechanism of metastasis. Oncogene, 2019. 38(10): p. 1751-1763. [CrossRef]
- Gurke, S., J.F.V. Barroso, and H.-H. Gerdes, The art of cellular communication: tunneling nanotubes bridge the divide. Histochemistry and Cell Biology, 2008. 129(5): p. 539-550. [CrossRef]
- Melwani, P.K. and B.N. Pandey, Tunneling nanotubes: The intercellular conduits contributing to cancer pathogenesis and its therapy. Biochimica et Biophysica Acta (BBA) - Reviews on Cancer, 2023. 1878(6). [CrossRef]
- Dagar, S., et al., Tunneling nanotubes and related structures: molecular mechanisms of formation and function. Biochem J, 2021. 478(22): p. 3977-3998. [CrossRef]
- Bretscher, A., D. Reczek, and M. Berryman, Ezrin: A protein requiring conformational activation to link microfilaments to the plasma membrane in the assembly of cell surface structures. Journal of Cell Science, 1997. 110(24): p. 3011-3018. [CrossRef]
- Padmanabhan, S., et al., Tunneling Nanotubes: Implications for Chemoresistance. 2024, Springer International Publishing. p. 353-373. [CrossRef]
- Lou, E., et al., Cellular and Molecular Networking Within the Ecosystem of Cancer Cell Communication via Tunneling Nanotubes. Frontiers in Cell and Developmental Biology, 2018. 6. [CrossRef]
- Van Niel, G., G. D'Angelo, and G. Raposo, Shedding light on the cell biology of extracellular vesicles. Nature Reviews Molecular Cell Biology, 2018. 19(4): p. 213-228. [CrossRef]
- Pang, B., et al., Extracellular vesicles: the next generation of biomarkers for liquid biopsy-based prostate cancer diagnosis. Theranostics, 2020. 10(5): p. 2309-2326. [CrossRef]
- Liu, J., et al., Extracellular Vesicles in Liquid Biopsies: Potential for Disease Diagnosis. BioMed Research International, 2021. 2021: p. 1-17. [CrossRef]
- Grimaldi, A.M., M. Salvatore, and C. Cavaliere, Diagnostic and prognostic significance of extracellular vesicles in prostate cancer drug resistance: A systematic review of the literature. Prostate Cancer Prostatic Dis, 2023. 26(2): p. 228-239. [CrossRef]
- Halin Bergström, S., et al., Extracellular Vesicles from Metastatic Rat Prostate Tumors Prime the Normal Prostate Tissue to Facilitate Tumor Growth. Scientific Reports, 2016. 6(1): p. 31805. [CrossRef]
- Akoto, T. and S. Saini, Role of Exosomes in Prostate Cancer Metastasis. International Journal of Molecular Sciences, 2021. 22(7): p. 3528. [CrossRef]
- Nturubika, B.D., et al., Altered expression of vesicular trafficking machinery in prostate cancer affects lysosomal dynamics and provides insight into the underlying biology and disease progression. British Journal of Cancer, 2024. [CrossRef]
- Chuan, Y.-C., et al., Androgen Induction of Prostate Cancer Cell Invasion Is Mediated by Ezrin. Journal of Biological Chemistry, 2006. 281(40): p. 29938-29948. [CrossRef]
- Mittal, R., et al., Cell communication by tunneling nanotubes: Implications in disease and therapeutic applications. J Cell Physiol, 2019. 234(2): p. 1130-1146. [CrossRef]
- Tkach, M. and C. Théry, Communication by Extracellular Vesicles: Where We Are and Where We Need to Go. Cell, 2016. 164(6): p. 1226-1232. [CrossRef]
- Shiao, S.L., G.C.-Y. Chu, and L.W.K. Chung, Regulation of prostate cancer progression by the tumor microenvironment. Cancer Letters, 2016. 380(1): p. 340-348. [CrossRef]
- Ahmad, F., M.K. Cherukuri, and P.L. Choyke, Metabolic reprogramming in prostate cancer. Br J Cancer, 2021. 125(9): p. 1185-1196. [CrossRef]
- Turos-Korgul, L., et al., Tunneling Nanotubes Facilitate Intercellular Protein Transfer and Cell Networks Function. Frontiers in Cell and Developmental Biology, 2022. 10. [CrossRef]
- Canuel, M., et al., Sortilin mediates the lysosomal targeting of cathepsins D and H. Biochem Biophys Res Commun, 2008. 373(2): p. 292-7. [CrossRef]
- Stepp, M.A., et al., Syndecan-1 and Its Expanding List of Contacts. Advances in Wound Care, 2015. 4(4): p. 235-249. [CrossRef]
- Szatmári, T., et al., Syndecan-1 in Cancer: Implications for Cell Signaling, Differentiation, and Prognostication. Disease Markers, 2015. 2015: p. 1-13. [CrossRef]
- Lazniewska, J., et al., Dynamic interplay between sortilin and syndecan-1 contributes to prostate cancer progression. Scientific Reports, 2023. 13(1). [CrossRef]
- Martini, C., et al., Aberrant protein expression of Appl1, Sortilin and Syndecan-1 during the biological progression of prostate cancer. Pathology, 2023. 55(1): p. 40-51. [CrossRef]
- Huang-Doran, I., C.Y. Zhang, and A. Vidal-Puig, Extracellular Vesicles: Novel Mediators of Cell Communication In Metabolic Disease. Trends Endocrinol Metab, 2017. 28(1): p. 3-18. [CrossRef]
- Edgerton, L.B., et al., Design, Synthesis, and Efficacy of Novel Trojan Horse Compounds Targeting Metabolic Vulnerabilities in Prostate Cancer. 2024, Cold Spring Harbor Laboratory. [CrossRef]
- Wang, X. and H.H. Gerdes, Transfer of mitochondria via tunneling nanotubes rescues apoptotic PC12 cells. Cell Death & Differentiation, 2015. 22(7): p. 1181-1191. [CrossRef]
- Guan, F., et al., Mitochondrial transfer in tunneling nanotubes—a new target for cancer therapy. Journal of Experimental & Clinical Cancer Research, 2024. 43(1). [CrossRef]
- Johnson, I.R.D., et al., Altered Endosome Biogenesis in Prostate Cancer Has Biomarker Potential. Molecular Cancer Research, 2014. 12(12): p. 1851-1862. [CrossRef]
- Luz-Crawford, P., et al., Mesenchymal stem cell repression of Th17 cells is triggered by mitochondrial transfer. Stem Cell Research & Therapy, 2019. 10(1). [CrossRef]
- Georget, V., et al., Trafficking of the androgen receptor in living cells with fused green fluorescent protein-androgen receptor. Mol Cell Endocrinol, 1997. 129(1): p. 17-26. [CrossRef]
- Likos, E., et al., The androgen receptor messenger RNA: what do we know? RNA Biology, 2022. 19(1): p. 819-828. [CrossRef]
- Peterziel, H., et al., Rapid signalling by androgen receptor in prostate cancer cells. Oncogene, 1999. 18(46): p. 6322-6329. [CrossRef]
- Neisch, A.L. and R.G. Fehon, Ezrin, Radixin and Moesin: key regulators of membrane–cortex interactions and signaling. Current Opinion in Cell Biology, 2011. 23(4): p. 377-382. [CrossRef]
- Rustom, A., et al., Nanotubular highways for intercellular organelle transport. Science, 2004. 303(5660): p. 1007-10. [CrossRef]
- Nawaz, M. and F. Fatima, Extracellular Vesicles, Tunneling Nanotubes, and Cellular Interplay: Synergies and Missing Links. Frontiers in Molecular Biosciences, 2017. 4. [CrossRef]
- Holliday, L.S., L.P. Faria, and W.J. Rody, Jr., Actin and Actin-Associated Proteins in Extracellular Vesicles Shed by Osteoclasts. Int J Mol Sci, 2019. 21(1). [CrossRef]
- Kawaguchi, K. and S. Asano, Pathophysiological Roles of Actin-Binding Scaffold Protein, Ezrin. International Journal of Molecular Sciences, 2022. 23(6): p. 3246. [CrossRef]
Figure 1.
TNTs and EVs mediate intercellular communication. (A) Representative live cell images of co-cultured 22Rv1 prostate cancer cells differentially labelled with either actin (green) or CellMask™ Plasma Membrane (PM) stain (red). Merged and individual channel images of a highlighted region of interest are shown at one time frame. (B) Representative live cell images of differentially labelled 22Rv1 cells expressing Lamp1-RFP and actin-GFP co-cultured together. Individual frames at different time points of a highlighted region of interest are shown. (C) Pictorial representation of vesicle budding and staged release (1-5) from a DU145 cell stained with CellMask™ PM dye. Image created from the overlay and merge of area of interest from frames captured at time points 1; 8 s, 2; 96 s, 3; 161 s, 4; 249 s, 5; 379 s. (D) Live cell images showing individual frames at different time points of 22Rv1 prostate cancer cells labelled with CellMask™ PM stain.
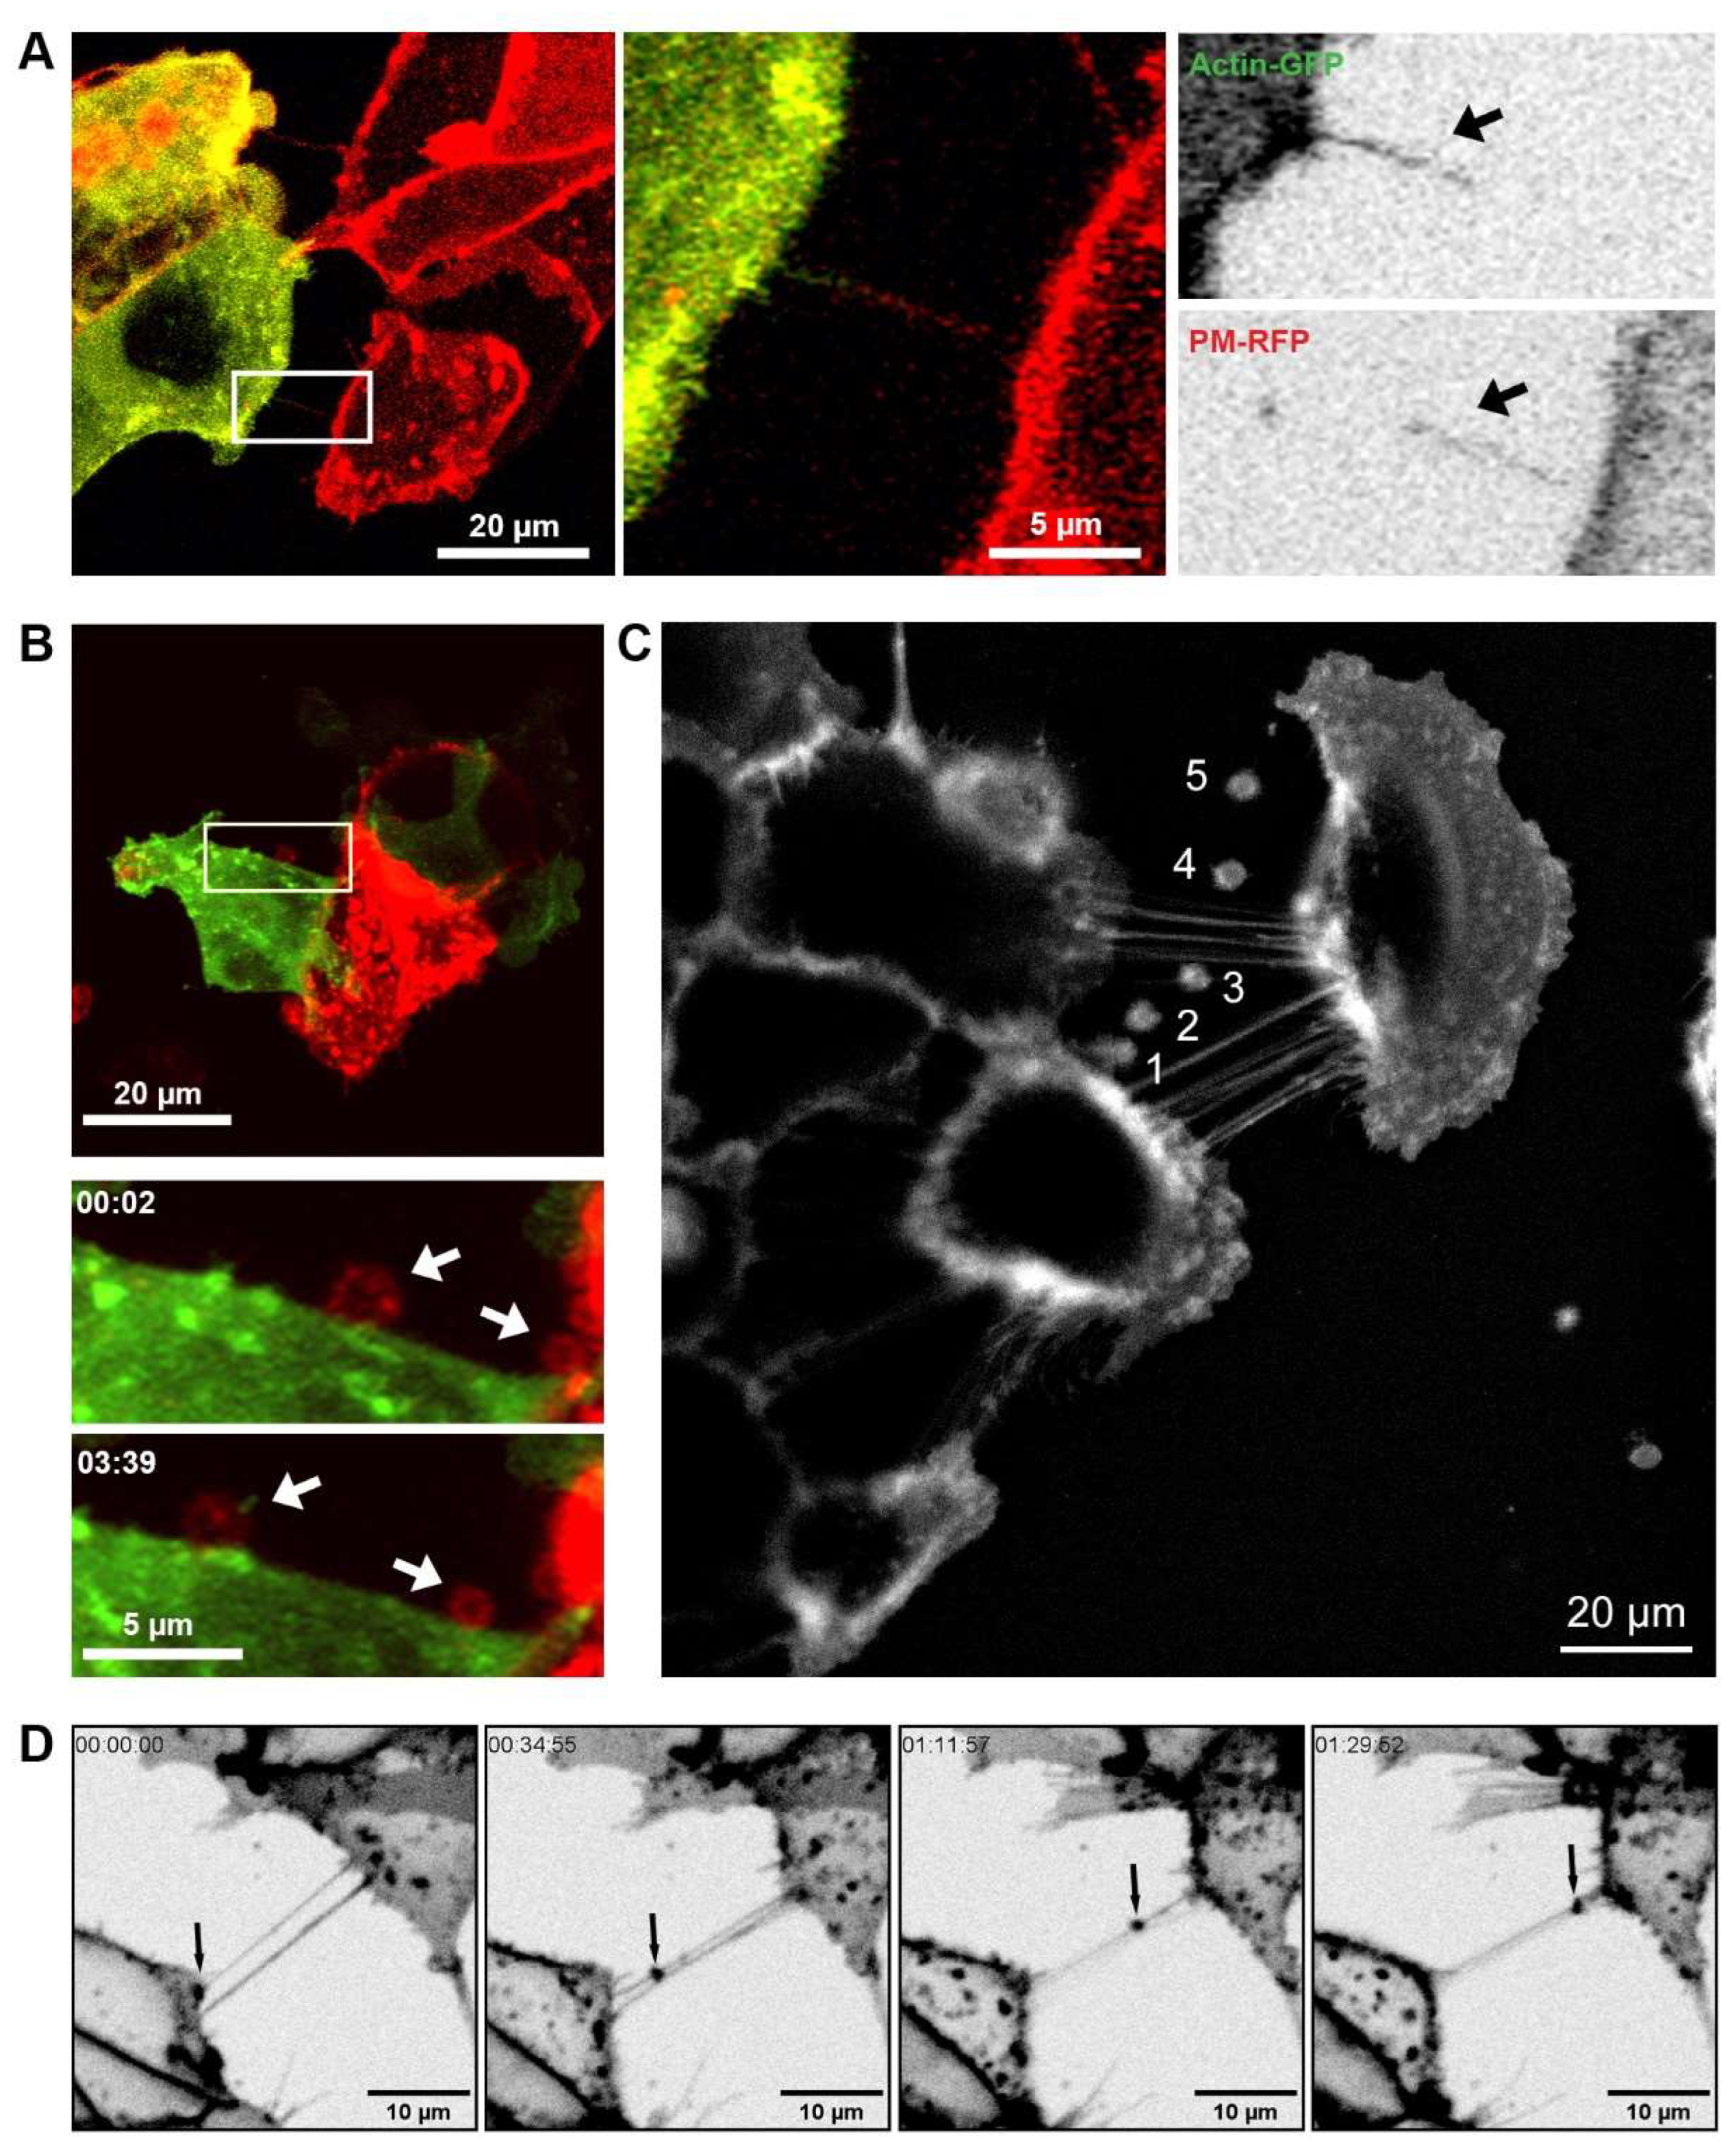
Figure 2.
Communication between prostate cancer cells and non-malignant cells or macrophages. (A) Representative confocal images of 22Rv1 prostate cancer cells labelled with Lamp1-GFP (green) co-cultured with PNT1a non-malignant cells labelled with Lamp1-RFP (red). Merged and individual channel images of two highlighted regions of interest shown. (B) Representative live cell micrographs of THP-1 macrophages labelled with DiO (green) co-cultured with PC-3 prostate cancer cells labelled with DiD (red). Individual frames at different time points of two highlighted regions of interest are shown.
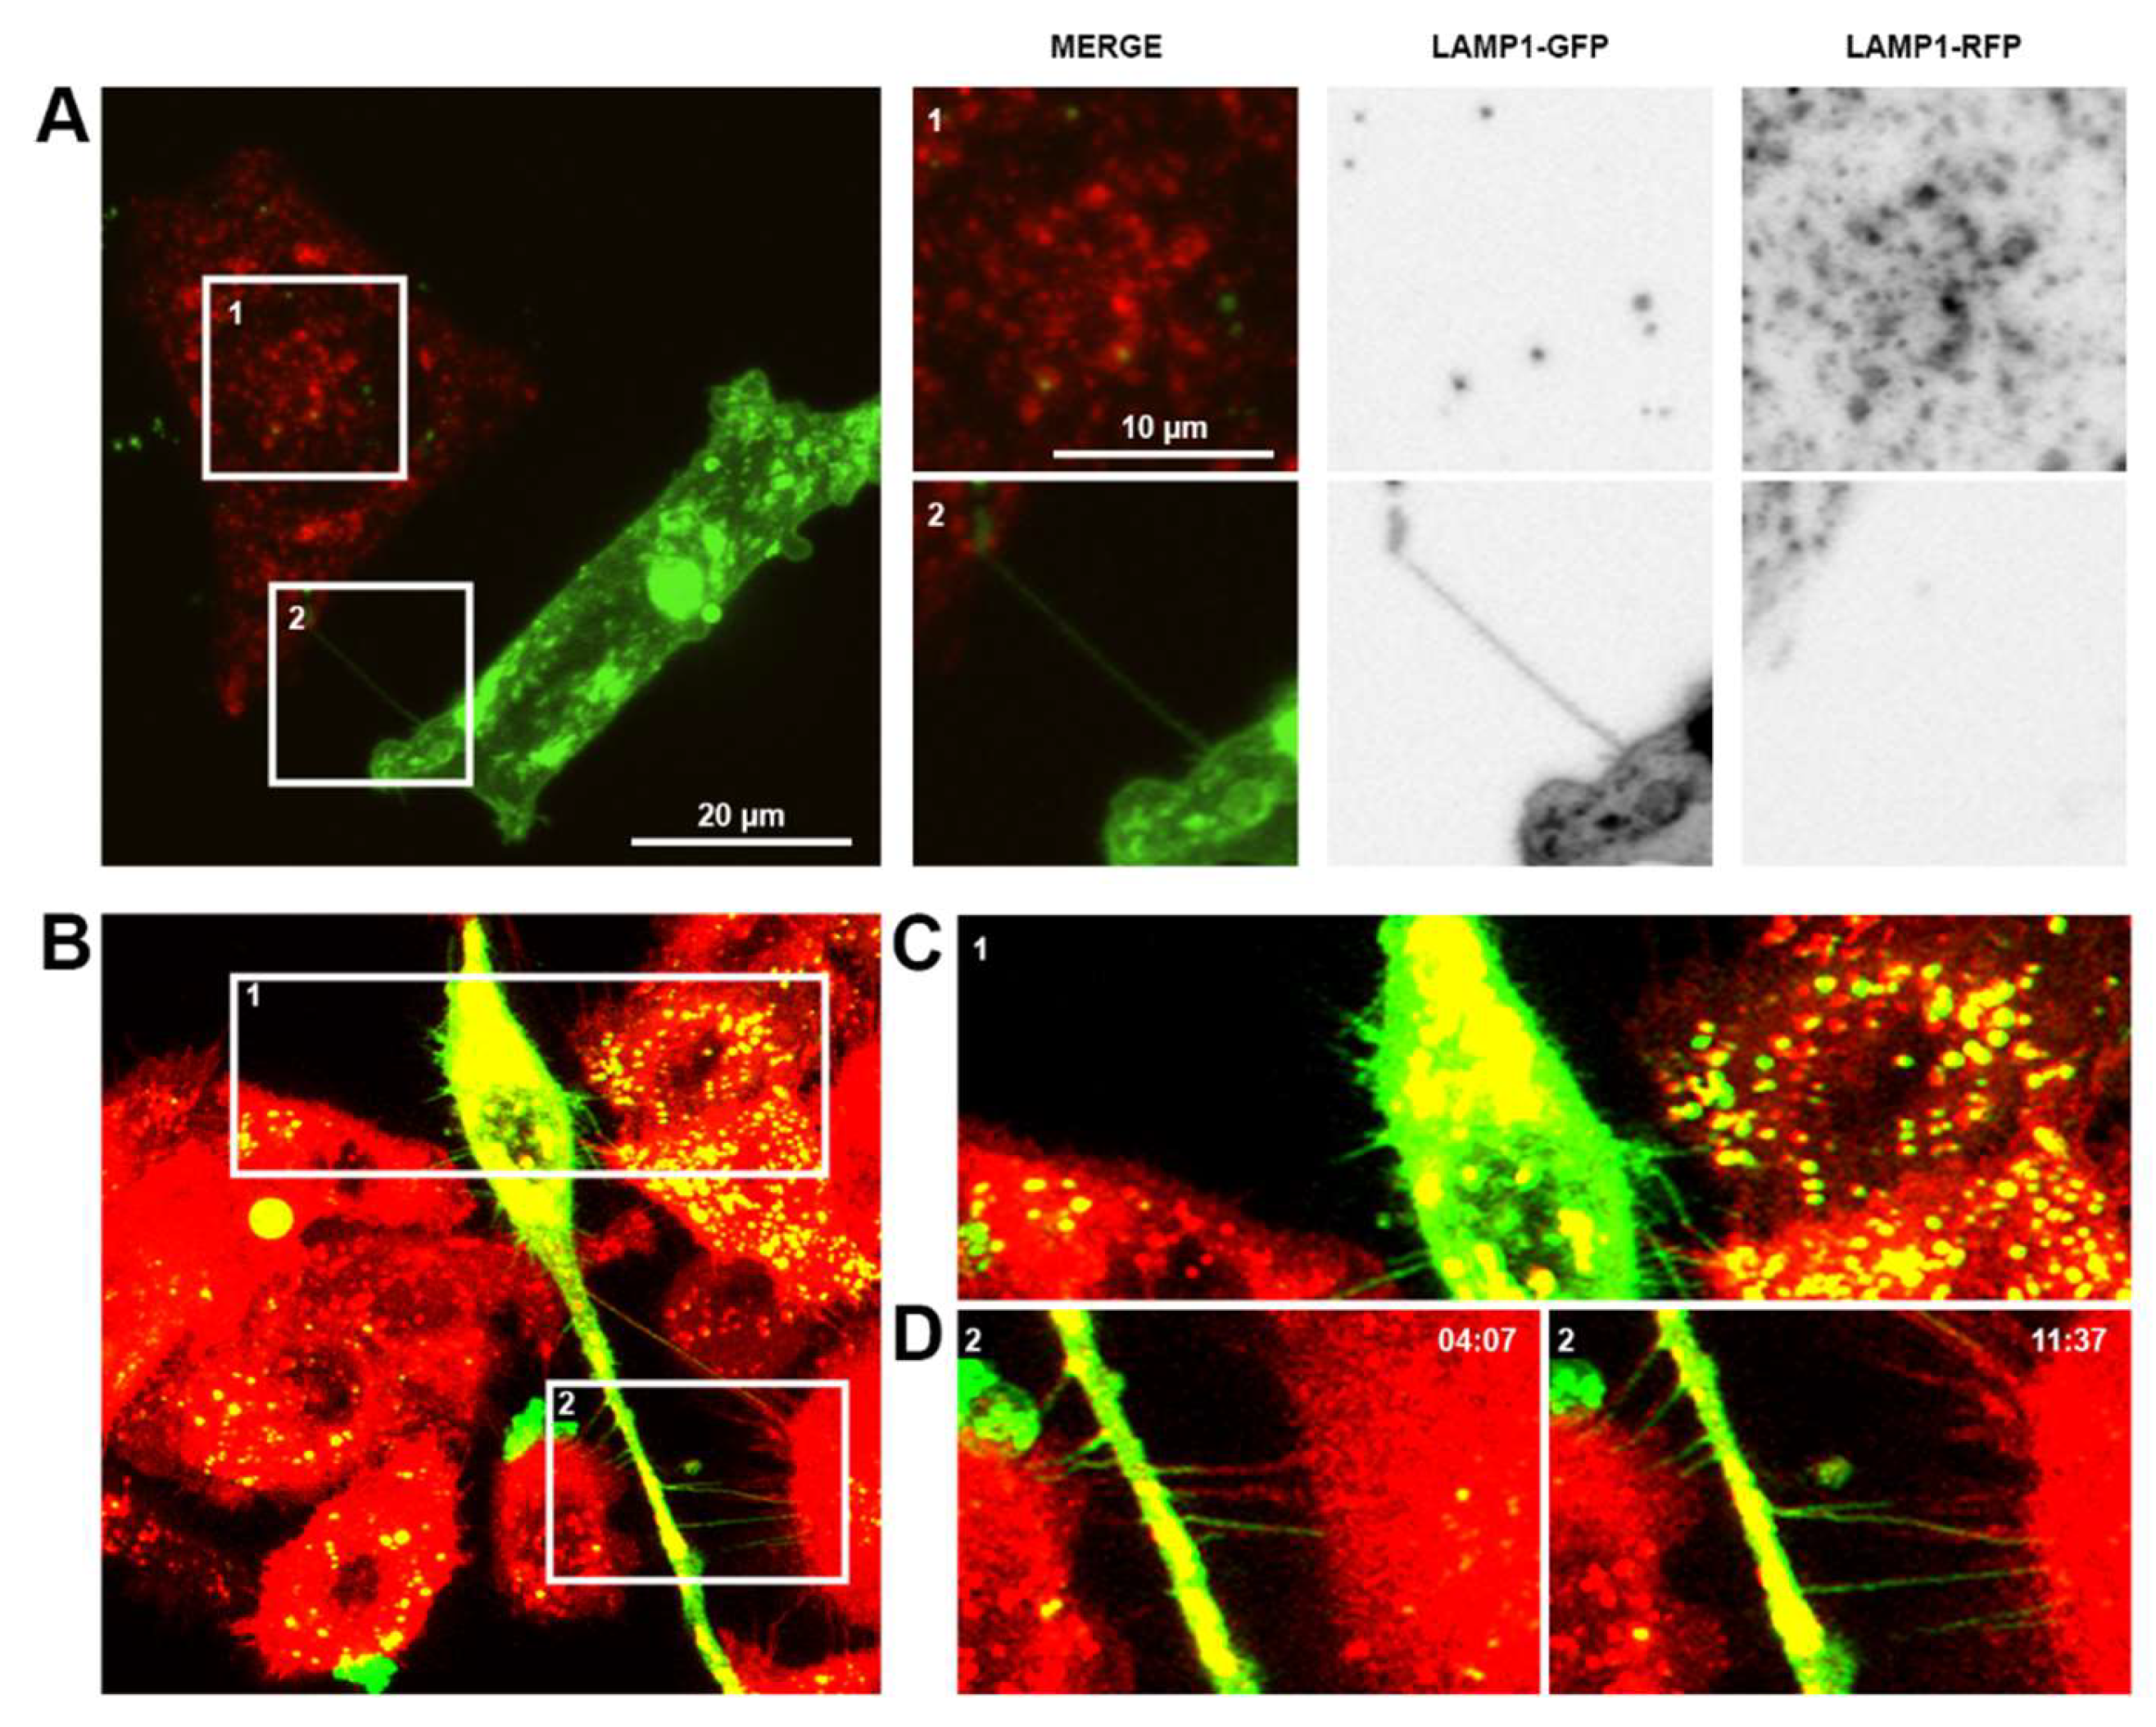
Figure 3.
Vesicular compartments/organelles and protein transfer between prostate cancer cells via TNTs/cellular bridges. Representative images showing 22Rv1 cells expressing fluorescently tagged F-actin and stained with LysoTracker Red (A), Mitotracker Red (B), BODIPY (C) and ER tracker Red (D). The highlighted region of interest (ROI) shows individual frames cropped from areas at different time points. (E) Representative confocal images of prostate cancer cell lines showing immunolabelling of Syndecan-1, Sortilin, GLUT1 and GLUT4 detected in TNTs/cellular bridges.
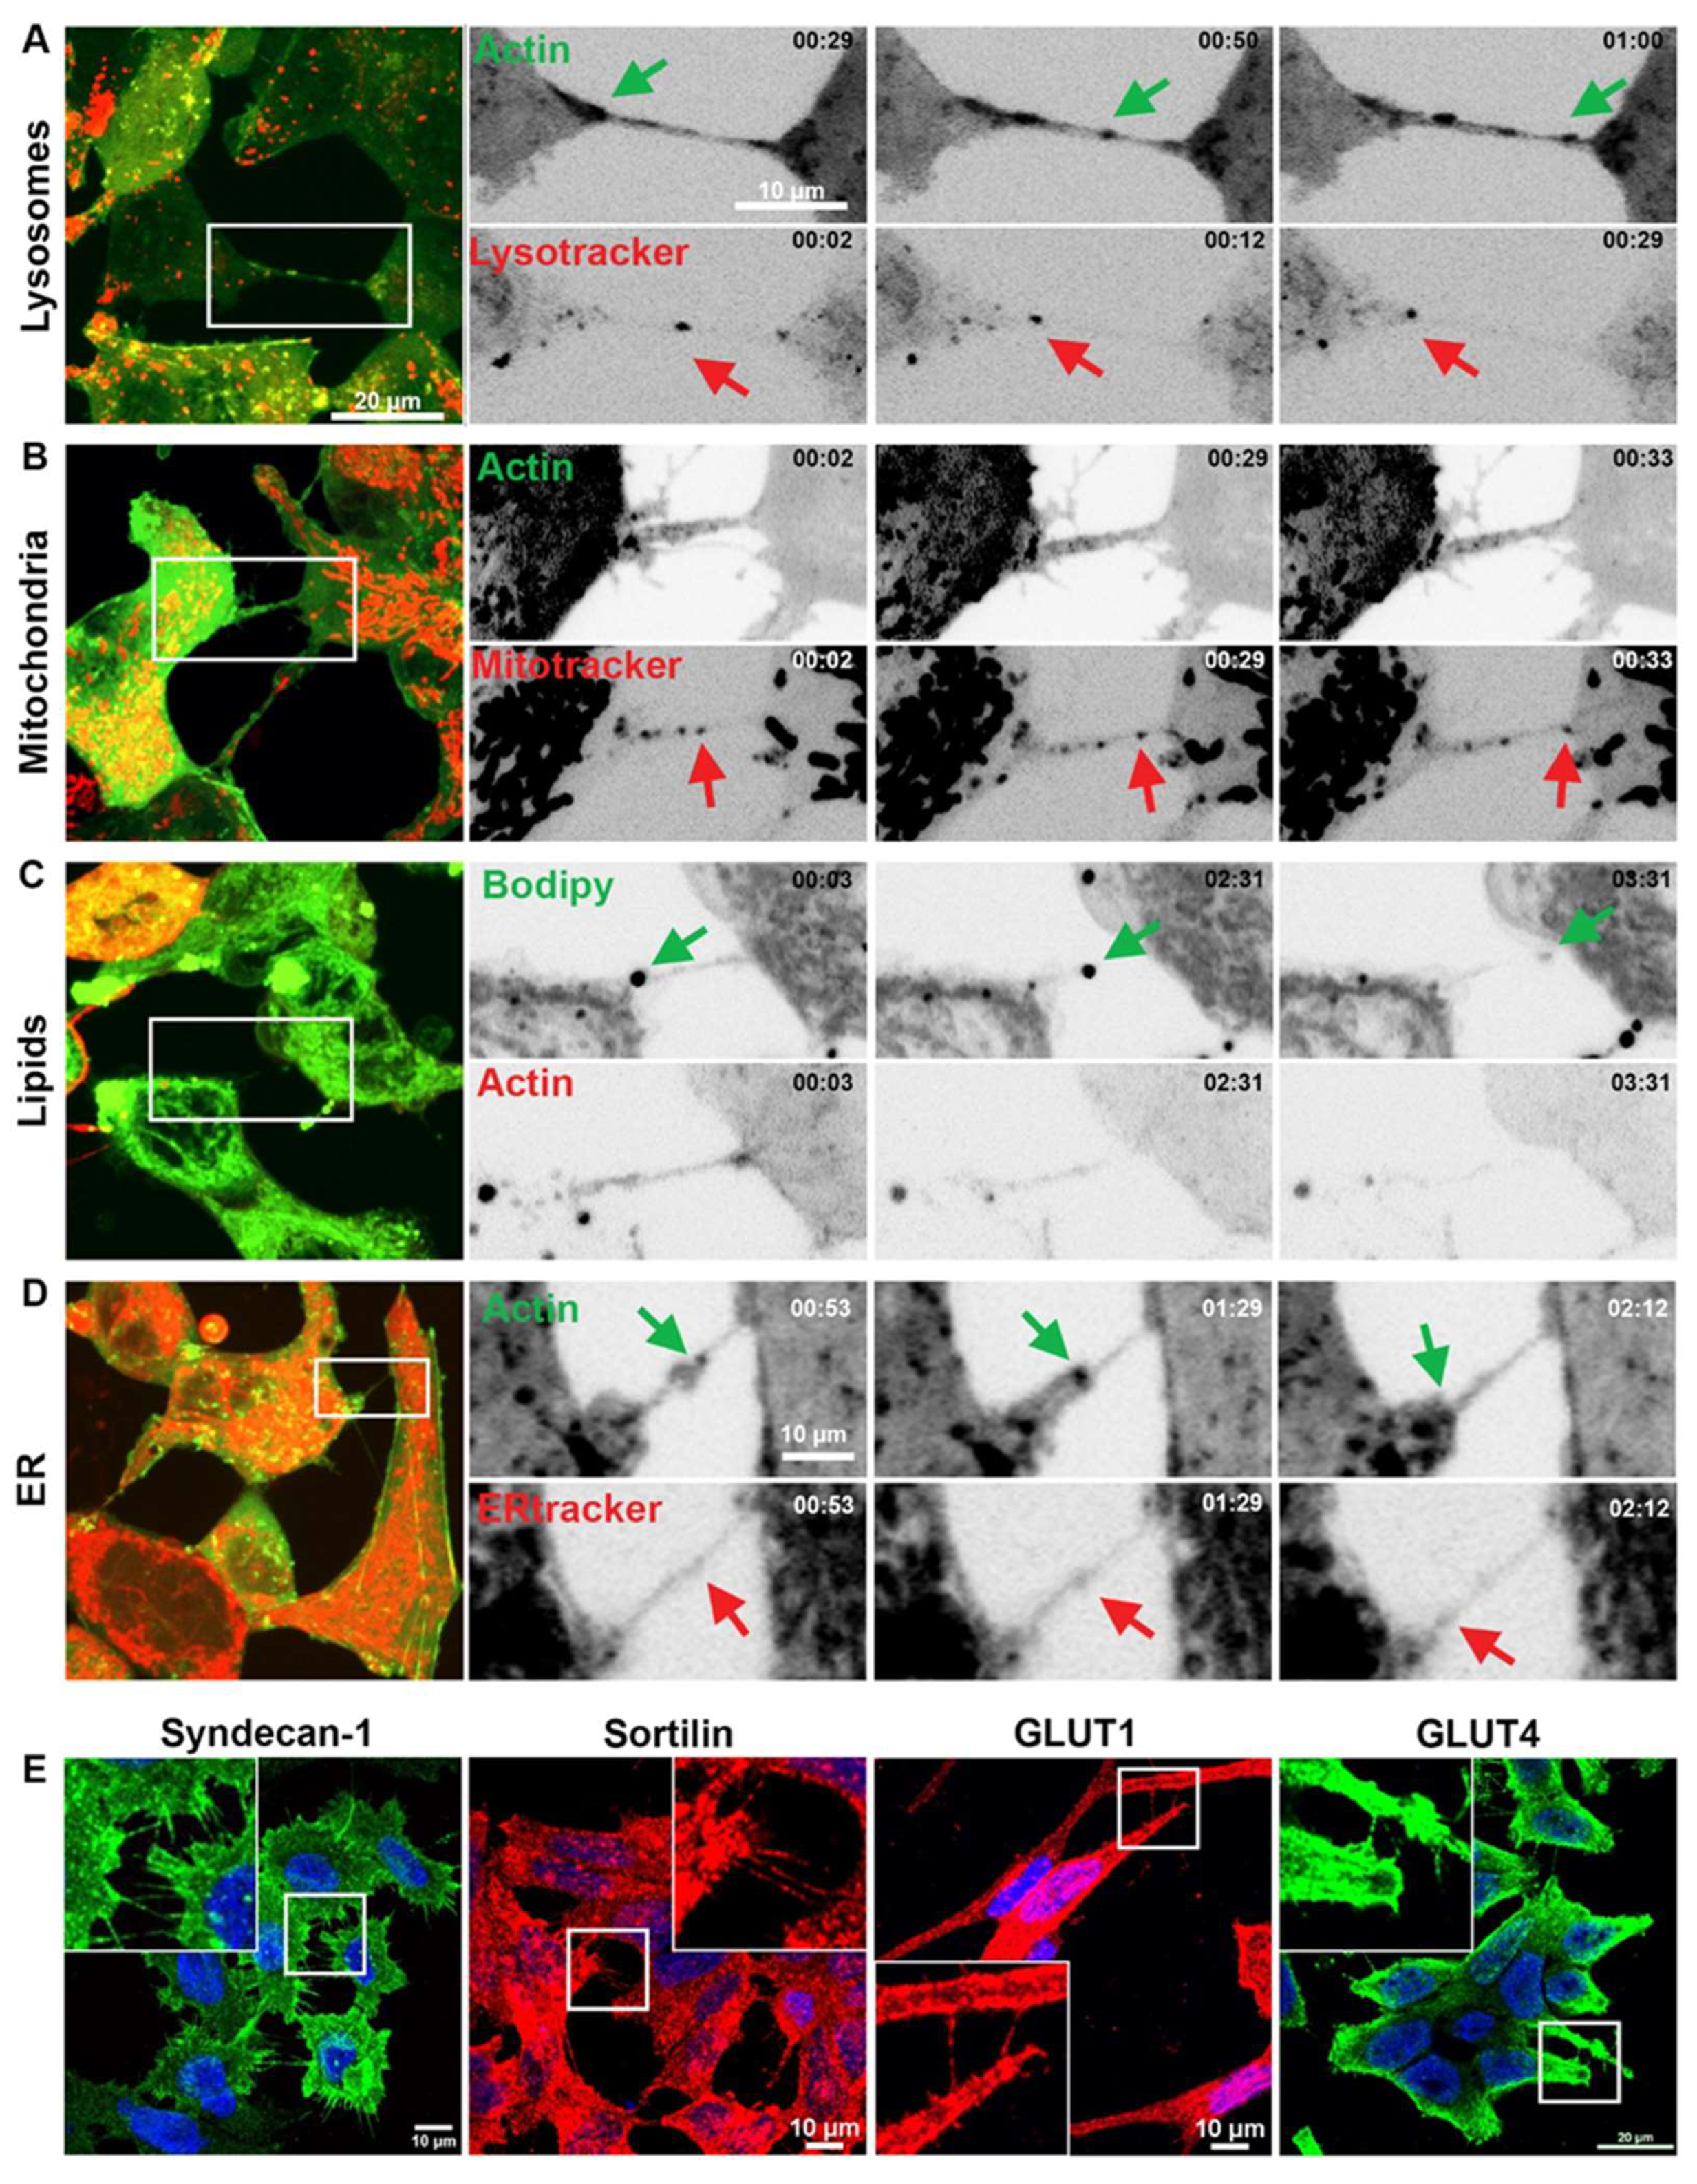
Figure 4.
R1881 treatment induced cell surface morphology changes to LNCaP prostate cancer cells. Representative scanning electron microscopy (SEM) micrographs of LNCaP prostate cancer cells treated with (A) vehicle or (B) 10 nM R1881. (C) Brightfield live cell images of LNCaP cells immediately after treatment with R1881. Representative frames at individual time points shown. (D) Representative SEM micrographs of LNCaP prostate cancer cells treated with (i) vehicle, (ii) 10 nM R1881 for 5 min or (iii) for 20 mins.
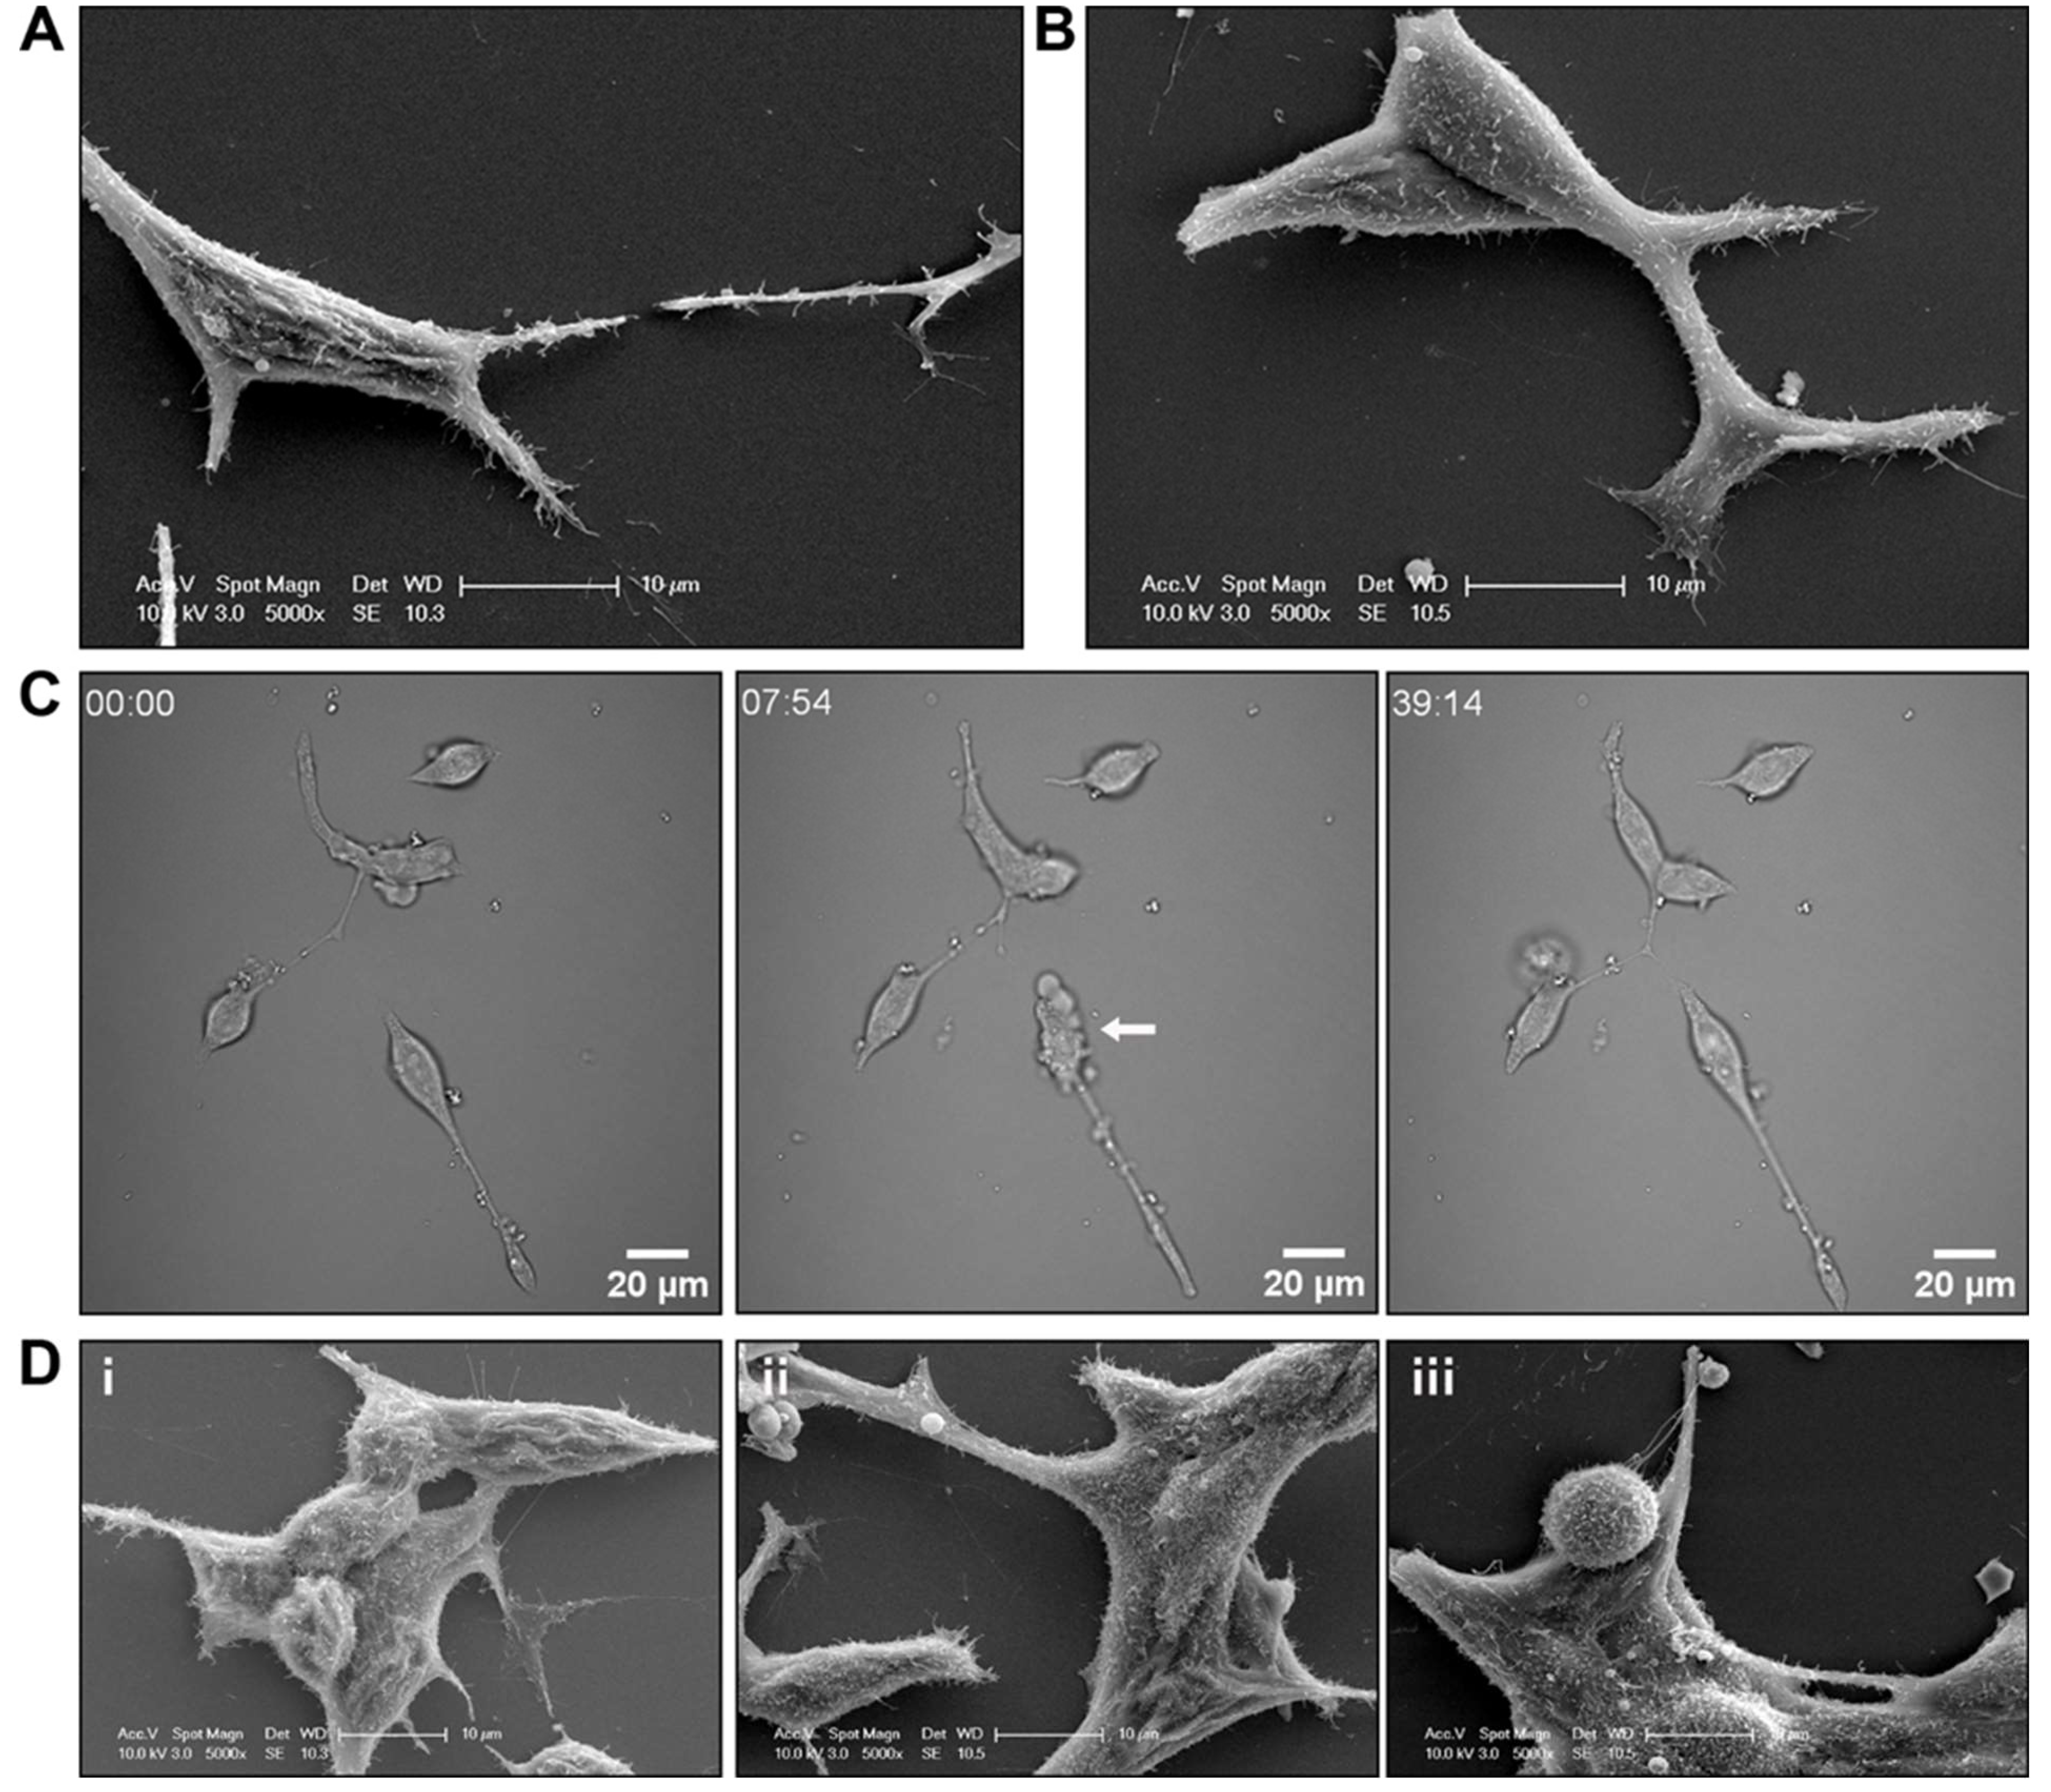
Figure 5.
Androgen receptor (AR) co-localises within vesicular structures for intra- and intercellular transport. (A) Merged brightfield and AR-mCherry fluorescence showing AR in vesicles within LNCaP cells and within TNTs/cellular bridges. (B) Representative confocal images of PNT1a cells transfected with actin-GFP and 22Rv1 cells transfected with AR-mCherry (C) Brightfield live cell images of LNCaP cells transfected with AR-mCherry immediately after treatment with R1881. Representative frames at individual time points shown.
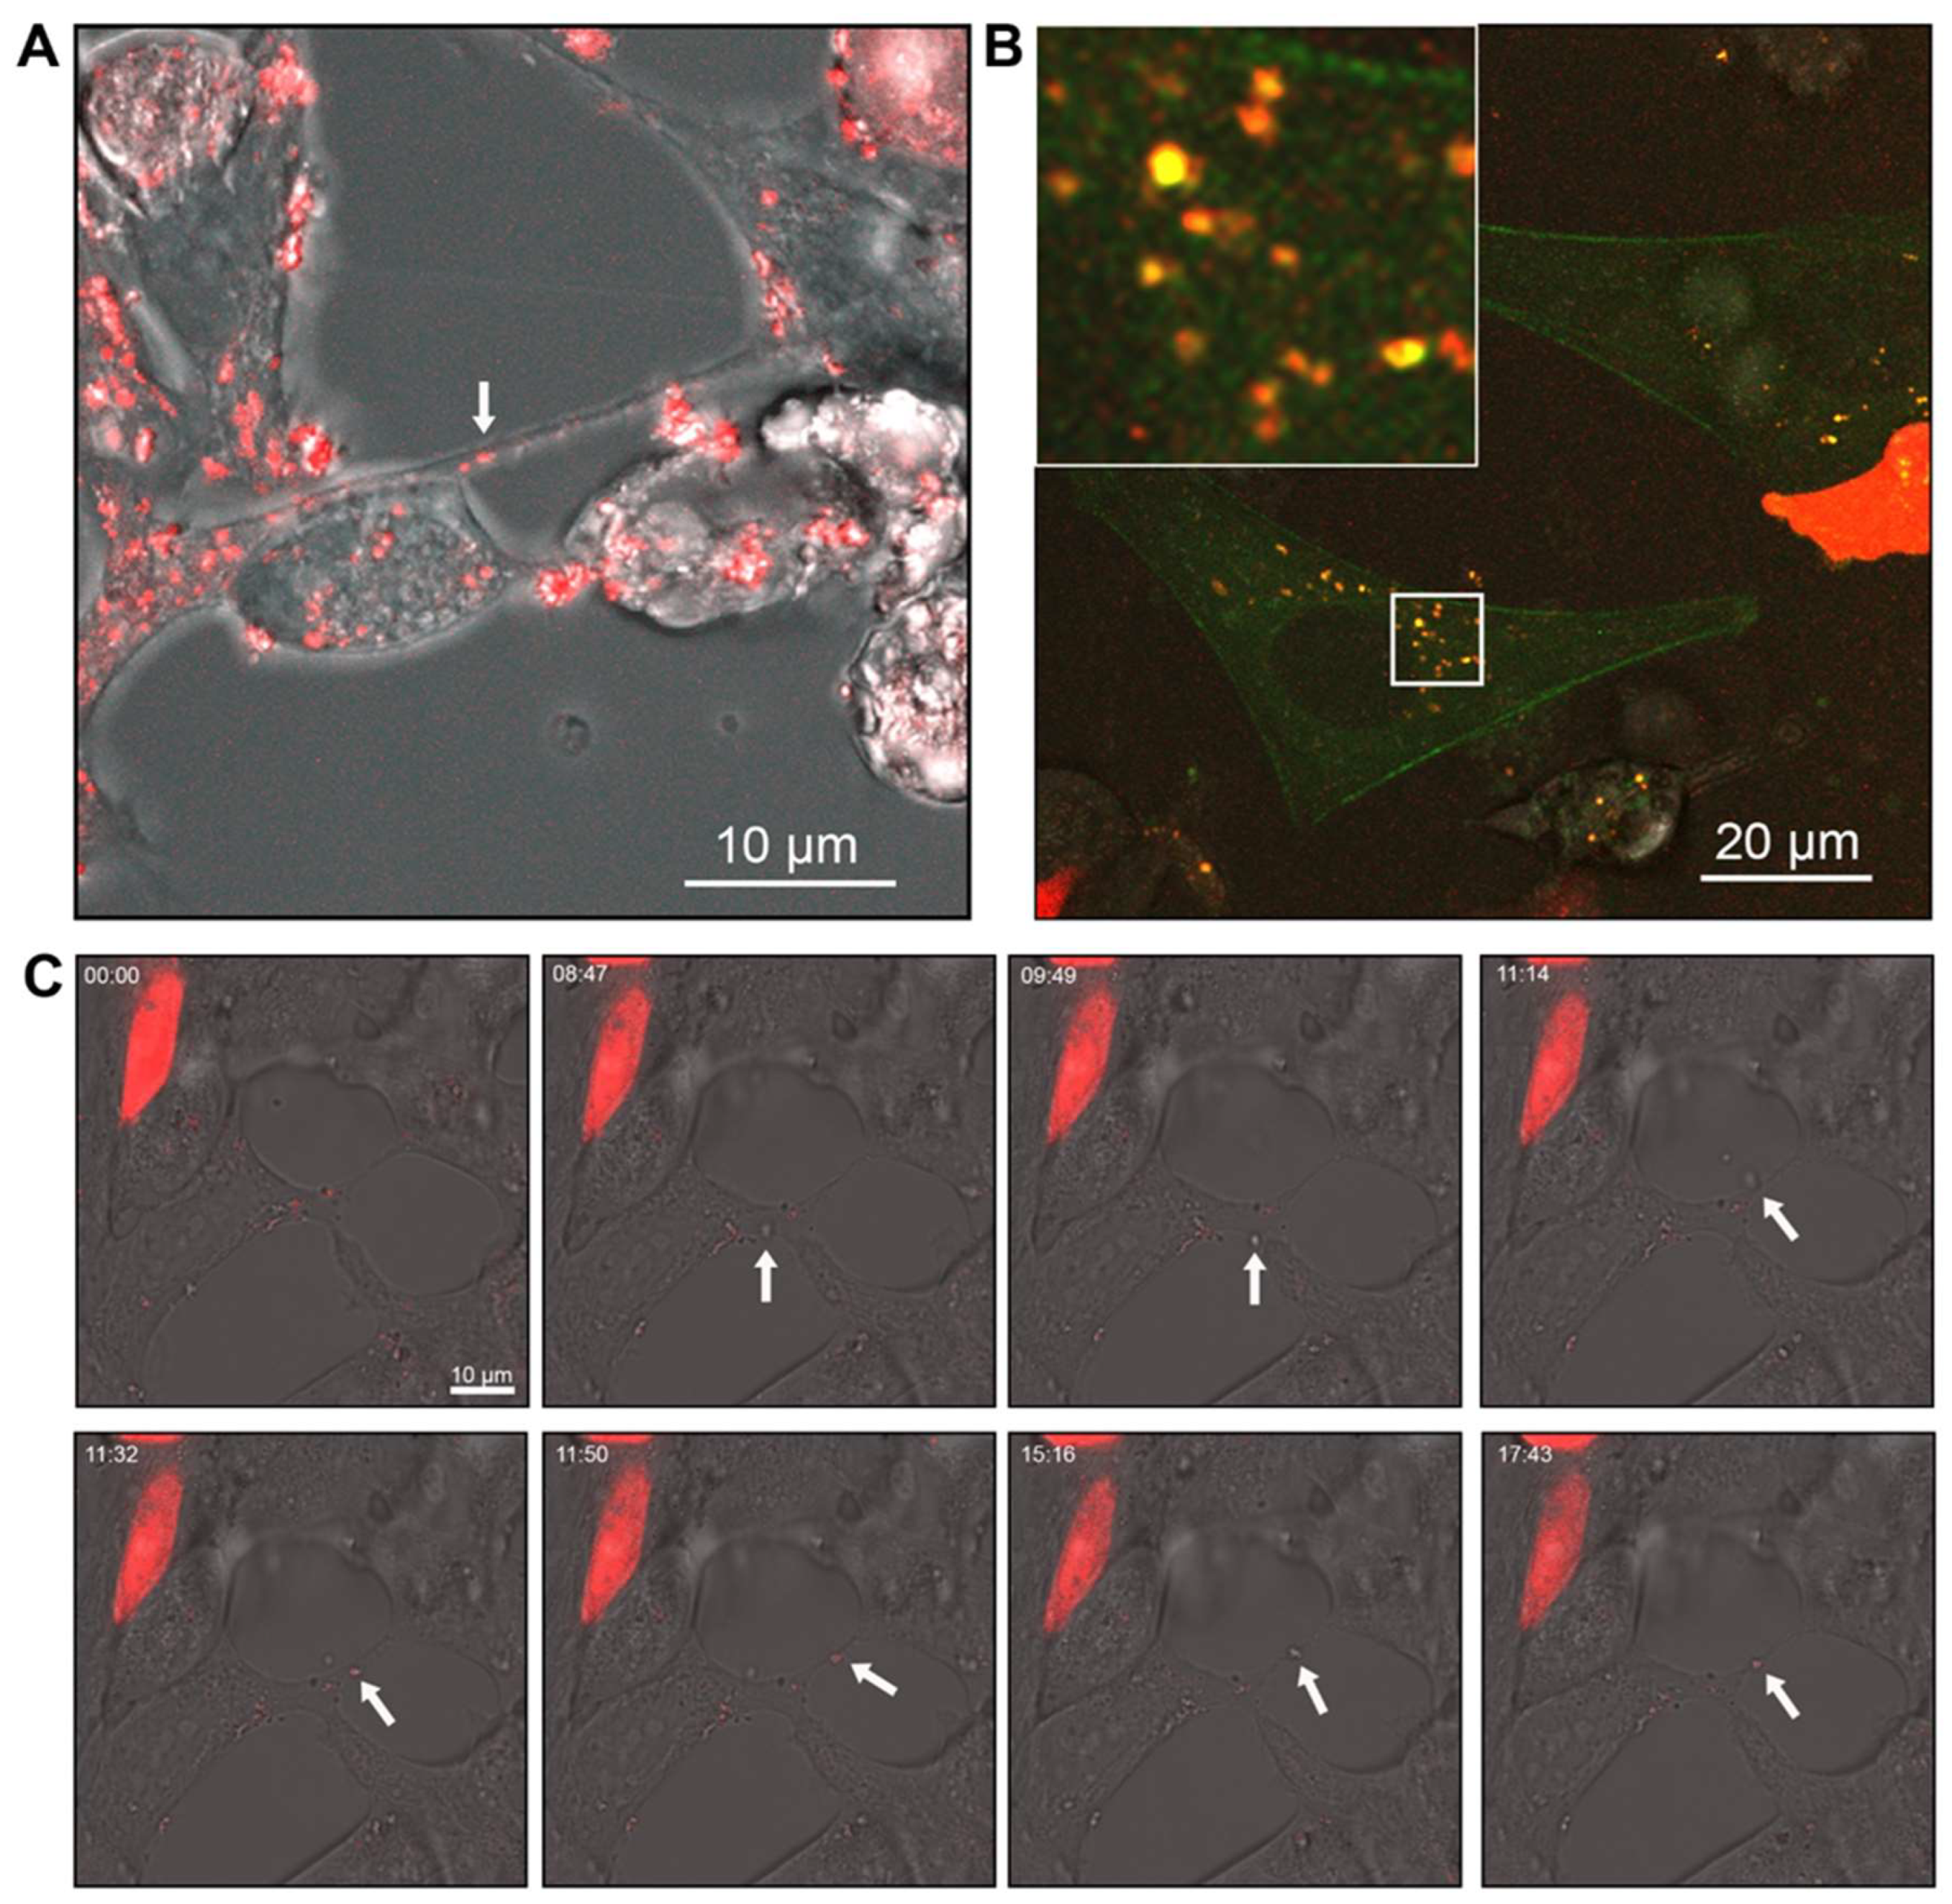
Figure 6.
Prostate cell line ERM protein expression and localisation. (A) Endogenous expression of ezrin, radixin and moesin (ERM) in prostate cell lines detected by Western blotting. The signal was quantified by normalising to total protein. (B) Representative confocal microscopy images characterising ERM expression and localisation in prostate cell lines. (C) Western blot of prostate cell lines showing expression of ERM with either vehicle (0.01% v/v EtOH) or 10nm R1881 treatment for 48 h. Signal quantified by normalising to total protein. (D) Representative confocal images of PWR-1E and LNCaP cells treated with 10nM R1881 or vehicle and labelled with pan-EZR antibody. (E) Representative confocal images of PWR-1E and LNCaP cells treated with R1881 or vehicle and labelled with phosphorylated-EZR antibody.
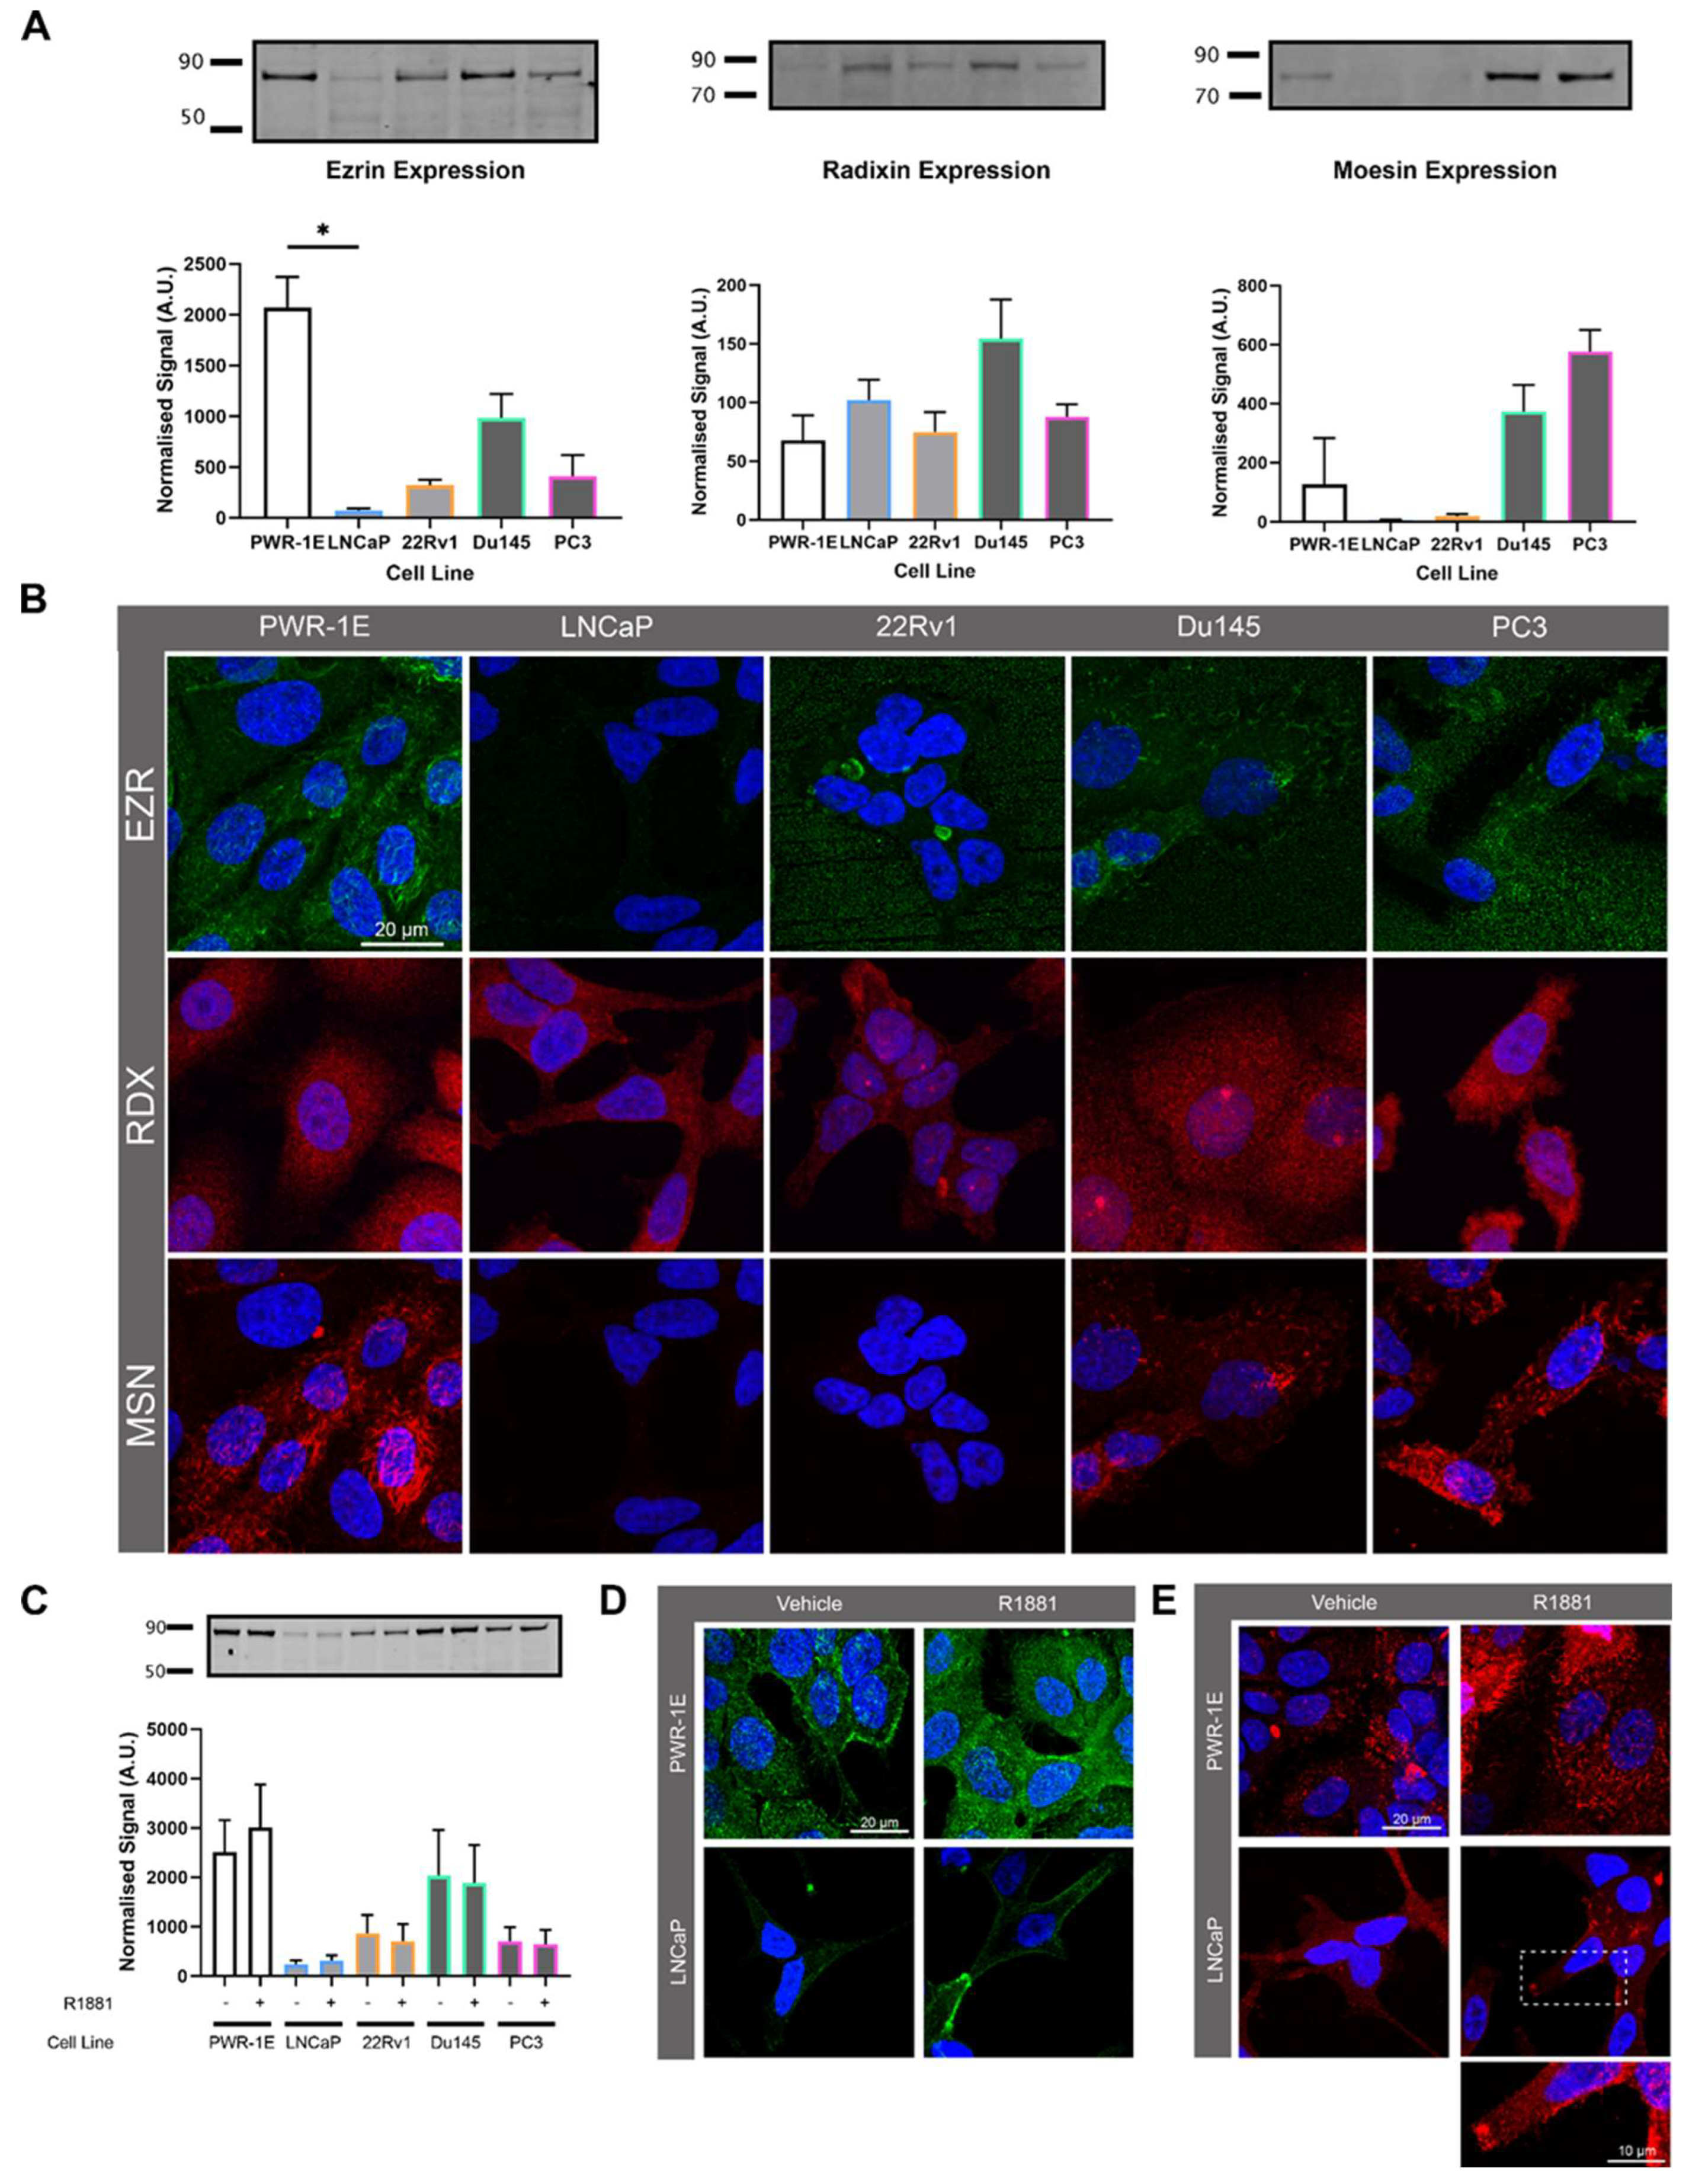
Figure 7.
Knockdown of ezrin alters cell surface morphology but does not induce cell death. Representative scanning electron microscopy (SEM) images of DU145 cells with (A) control scramble siRNA and (B) ezrin siRNA knockdown. (C) Western blot of DU145 cell lysates following siRNA knockdown. (D) Cell viability values following siRNA knockdown. NT; no transfection, Scr; control scramble siRNA, GAPD; glyceraldehyde-3-phosphate dehydrogenase (GAPDH) control siRNA, EZR; ezrin, RDX; radixin, MSN; moesin.
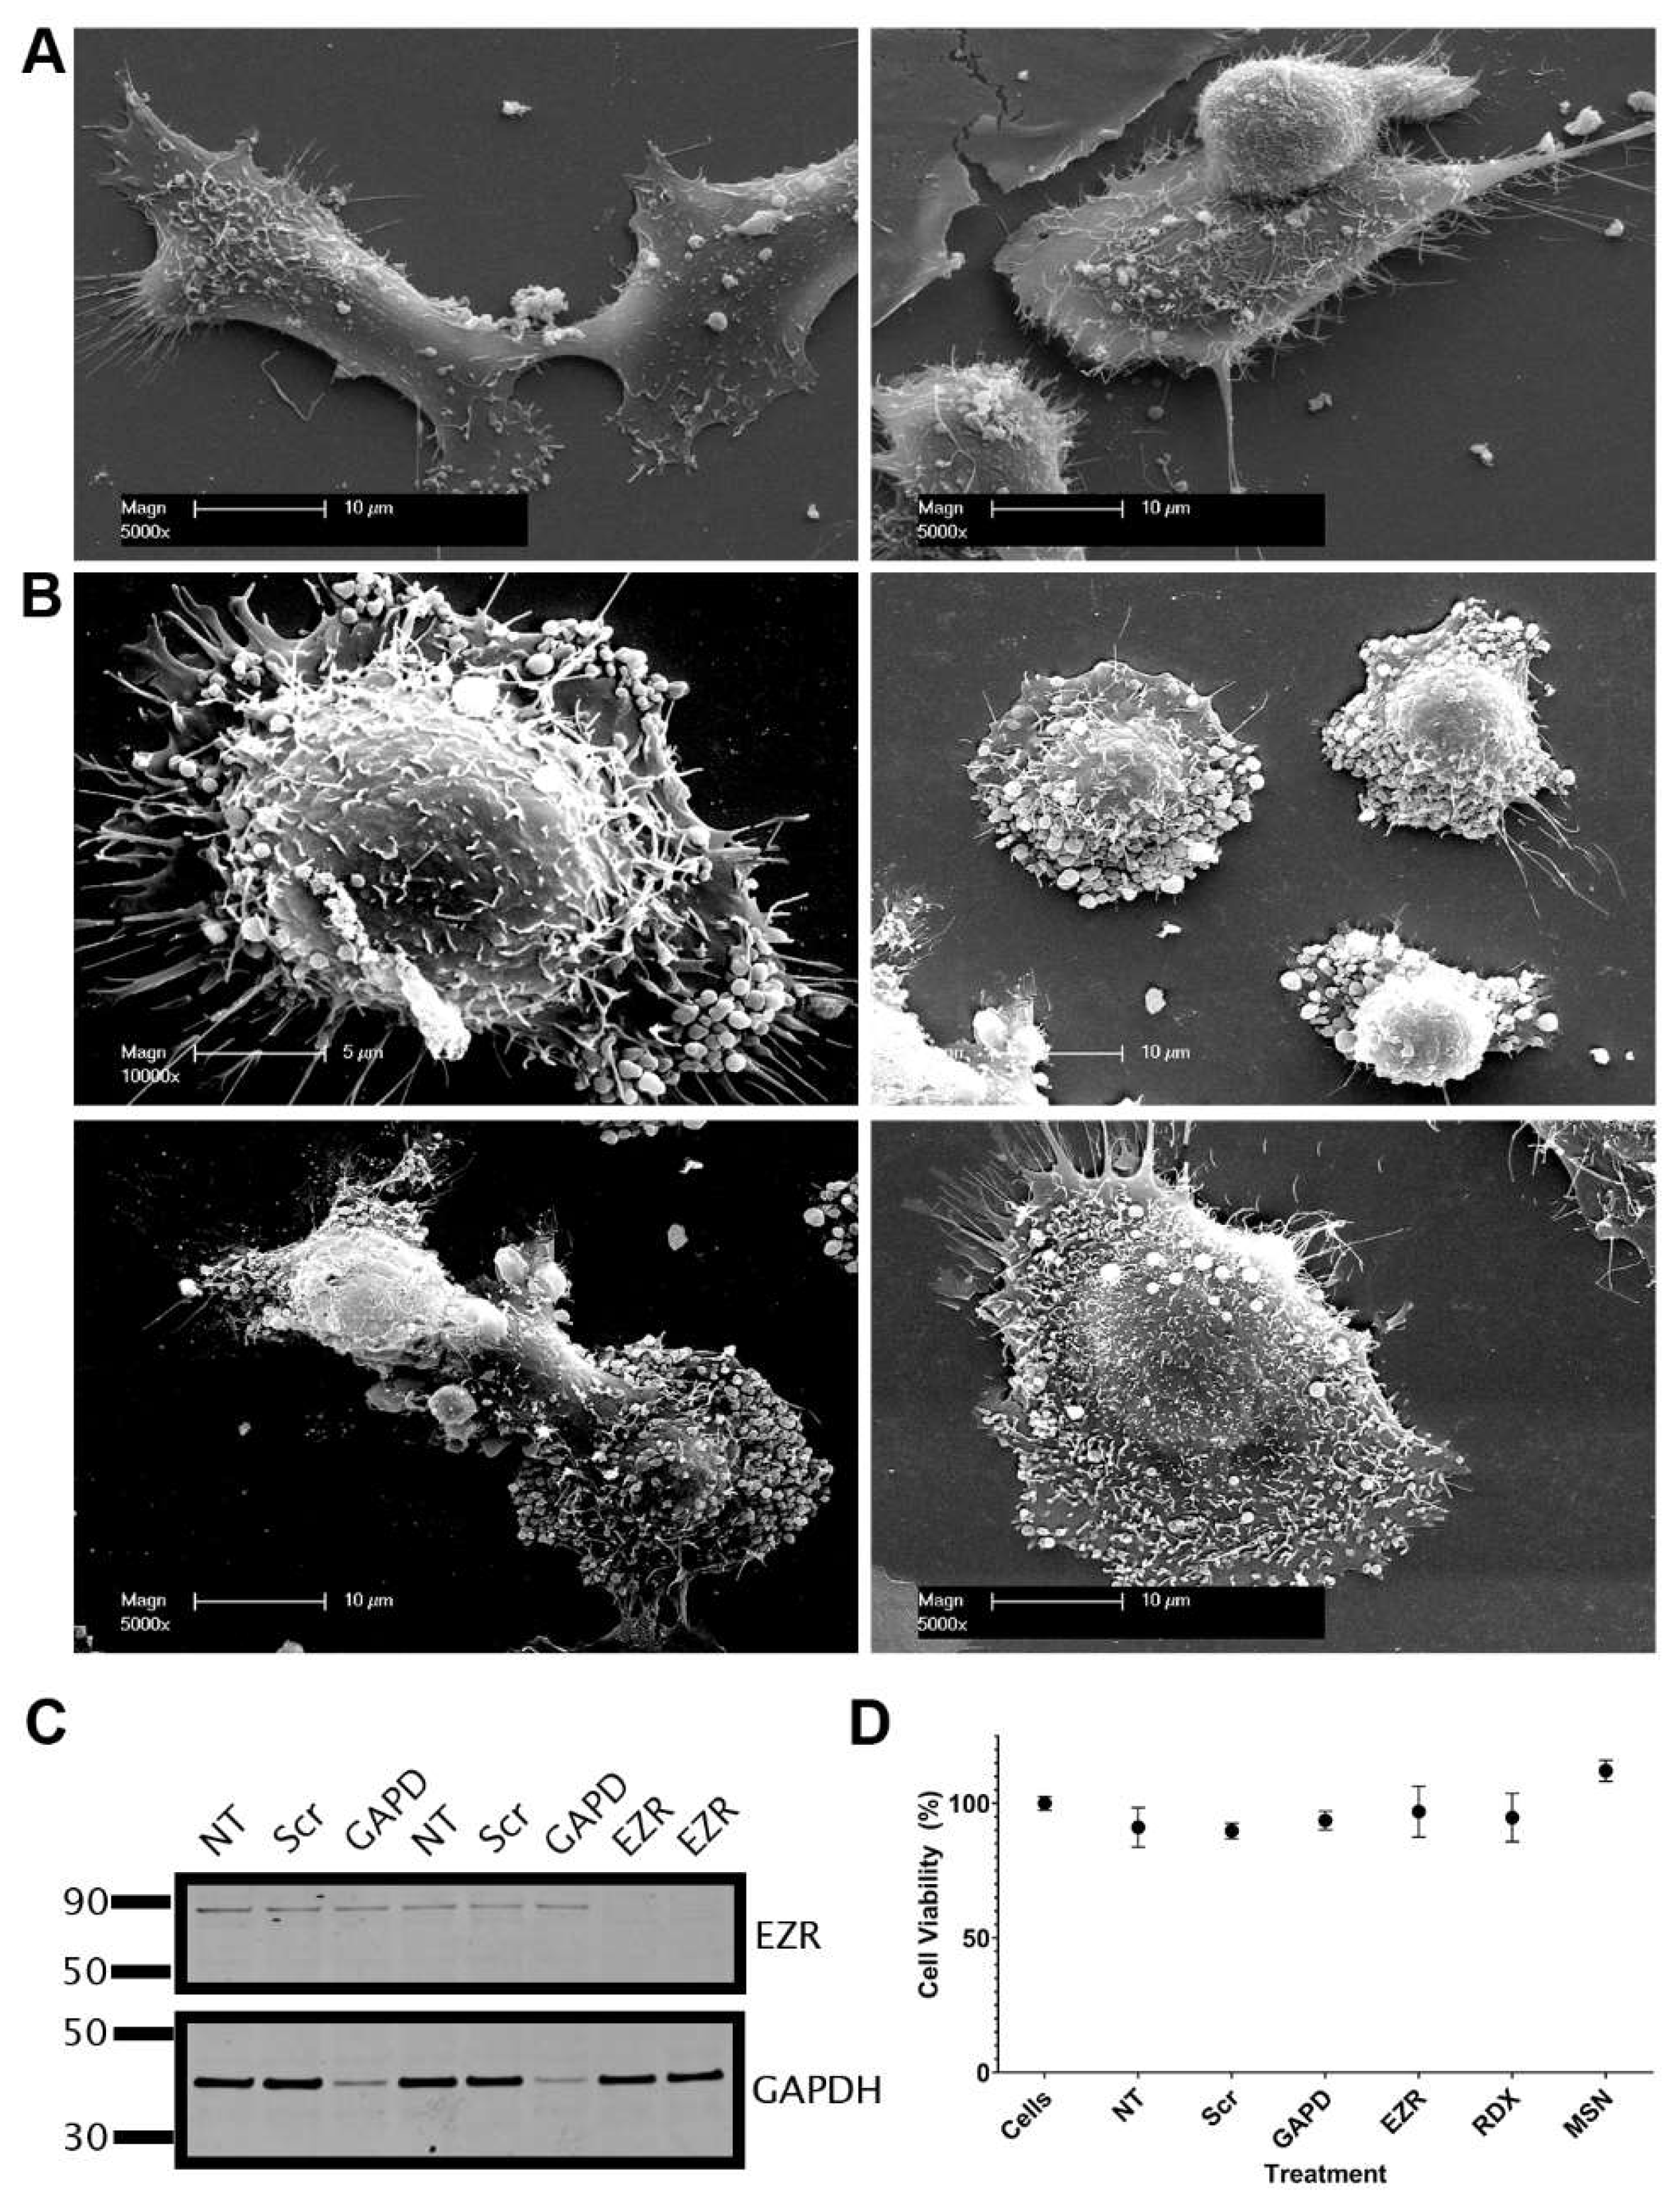

Table 1.
Commercial Antibody and Imaging Reagents. RT; room temperature, OBB; Odyssey Blocking Buffer.
Table 1.
Commercial Antibody and Imaging Reagents. RT; room temperature, OBB; Odyssey Blocking Buffer.
| Reagent | Catalogue # | Company | Stain | IF | Western Blot |
|---|---|---|---|---|---|
| Cellmask™ Plasma Membrane-RFP Stain | C10046 | ThermoFisher | 1:1000, 30 m, 37°C | ||
| CellLight™ Plasma Membrane-RFP BacMam 2.0 | C10608 | ThermoFisher | |||
| CellLight™ Actin-GFP BacMam 2.0 | C10582 | ThermoFisher | |||
| Vybrant™ DiO Cell-Labeling Solution | V22886 | ThermoFisher | 1:200, 20 m, 37°C | ||
| Vybrant™ DiD Cell-Labeling Solution | V22887 | ThermoFisher | 1:200, 20 m, 37°C | ||
| LysoTracker RED DND-99 | L7528 | ThermoFisher | 1:1000, 30 m, 37°C | ||
| MitoTracker® Red CMXRos | M7512 | ThermoFisher | 1:1000, 30 m, 37°C | ||
| ER-Tracker™ Red | E34250 | ThermoFisher | 1:1000, 30 m, 37°C | ||
| BODIPY® 493/503 | D43922 | ThermoFisher | 1:1000, 30 m, 37°C | ||
| Anti-Ezrin mouse antibody | ab4069 | abcam | 1:500 overnight, 4°C | 1:500, overnight, 4°C OBB |
|
| Anti-Radixin rabbit antibody | 2636S | Cell Signalling/NEB Australia | 1:500 overnight, 4°C | 1:500, overnight, 4°C 3% BSA |
|
| Anti-Moesin rabbit antibody | 3150S | Cell Signalling/NEB Australia | 1:500 overnight, 4°C | 1:500, overnight, 4°C 3% BSA |
|
| Anti-pEzrin rabbit antibody | 3726S | Cell Signalling/NEB Australia | 1:1000, overnight, 4°C |
||
| Anti-AR rabbit antibody | ab108341 | abcam | 1:1000, overnight, 4°C |
1:1000, overnight, 4°C 3% BSA |
|
| Anti-GAPDH mouse HRP conjugated antibody | G9295 | Sigma-Aldrich | 1:10 000, 1 h, RT | ||
| Anti-Sortilin mouse antibody | ab16640 | abcam | 1:1000, overnight, 4°C |
||
| Anti-Syndecan-1 mouse antibody | ab34164 | abcam | 1:250, overnight, | ||
| 4°C | |||||
| Anti-GLUT1 mouse antibody | ab40084 | abcam | 1:100, overnight, 4°C | ||
| Anti-GLUT4 mouse antibody | ab35826 | abcam | 1:250, overnight, 4°C | ||
| Anti-rabbit AlexaFluor 647 conjugated secondary antibody | a31573 | Thermofisher | |||
| 1:1000, 1 h, RT | |||||
| Anti-mouse AlexaFluor 488 conjugated secondary antibody | a21202 | Thermofisher | |||
| 1:1000, 1 h, RT | |||||
| Hoechst | 33342 | Thermofisher | |||
| Rabbit IRDye 800CW IgG secondary antibody | 926-32211 | LiCor | 1:10 000, 1 h, RT | ||
| Mouse IRDye 680RD IgG secondary antibody | 926-68070 | LiCor | 1:10 000, 1 h, RT | ||
Disclaimer/Publisher’s Note: The statements, opinions and data contained in all publications are solely those of the individual author(s) and contributor(s) and not of MDPI and/or the editor(s). MDPI and/or the editor(s) disclaim responsibility for any injury to people or property resulting from any ideas, methods, instructions or products referred to in the content. |
© 2024 by the authors. Licensee MDPI, Basel, Switzerland. This article is an open access article distributed under the terms and conditions of the Creative Commons Attribution (CC BY) license (http://creativecommons.org/licenses/by/4.0/).
Copyright: This open access article is published under a Creative Commons CC BY 4.0 license, which permit the free download, distribution, and reuse, provided that the author and preprint are cited in any reuse.


