Submitted:
06 November 2024
Posted:
07 November 2024
You are already at the latest version
Abstract
This paper examines the quantitative structure–inhibitory activity relationship of 15-lipoxygenase (15-LOX) in sets of 100 homo- and heterocyclic compounds using GUSAR2019 software. Statistically significant valid models were built to predict the IC50 parameter. A combination of MNA- and QNA-descriptors with three whole molecular descriptors (topological length, topological volume, and lipophilicity) was used to develop 18 statistically significant valid consensus QSAR models. These compounds had varying degrees of inhibition of the catalytic activity of 15-LOХ: the range of variation in the pIC50 value was 3.873. The satisfactory coincidence between the theoretically calculated and experimentally determined pIC50 values for compounds TS1, TS2 and 1–8 suggests the potential use of models M1–M18 for virtual screening of virtual libraries and databases to find new potentially efficient inhibitors of 15-LOX.
Keywords:
inhibitors of 15‐lipoxygenase
; 15‐LOX
; QSAR models
; GUSAR 2019 program
; QNA descriptors
; MNA descriptors
; structure–activity relationships
1. Introduction
Lipoxygenases (EC 1.13.11.12, LOX) are oxidoreductases with iron or manganese as a cofactor and are the most important enzymes in biological systems. They are found in mammals, plants, fish, mosses, bacteria, yeasts, corals, algae, and fungi [1,2,3,4,5,6,7,8,9,10,11,12,13]. LOXs catalyze the oxidation of free and esterified polyunsaturated fatty acids (PUFAs) containing one or more (1Z, 4Z)-penta-1,4-diene systems into hydroperoxides [1,14], which are then metabolized into various signaling compounds such as leukotrienes and lipoxins in animals [15,16], prostaglandin-like molecules in corals [8], volatile substances of green leaves [17,18,19], jasmonic acids in plants [20,21], and lactones in microorganisms [22]. The LOX superfamily is classified based on their regiospecificity into 5-, 8-, 9-, 10-, 12-, 13-, 15-, fusion-, mini- and Mn-LOX. The specificity of LOXs affects the number of the carbon atom in the PUFA molecule which is attacked by an oxygen molecule followed by the formation of hydroperoxides [2]. Subsequently, the hydroperoxides formed are converted into ketones, aldehydes and alcohols by other enzymes [3]. Of the 10 LOX types mentioned above, 5-, 8-, 9-, 10-, 12-, 13-, 15- LOXs are the so-called classic LOXs. Among these classical LOXs, 9- and 13-LOXs are the most important enzymes in plants while 5-, 12- and 15-LOX are predominantly found in animals [2,23]. The catalytic center of all the six families of classical LOXs (5-, 8-, 9-, 10-, 12-, 13-, and 15-LOX) contains "non-heme" iron Fe(III) in activated state [1]. The mechanism of PUFA oxidation under the action of LOXs has been extensively studied and described in the scientific literature, e.g. in [24,25,26].
The relevance of the search for 15-LOX inhibitors is due to the pathophysiological effect of the products of oxidative metabolism of PUFAs under the action of this enzyme on the organism of animals and humans. Thus, arachidonic acid metabolites formed with participation of 15-LOX in various types of cells and organs of animals and humans are involved in the development of many diseases, including atherosclerosis, hypertension, diabetes, obesity and neurodegenerative disorders [27,28,29]. In addition, 15 LOX inhibitors have been shown to be more efficient than COX inhibitors in suppressing the growth of epithelial cancer cells, regardless of the expression status of each enzyme [28,30].
To date, several types of inhibitors of the catalytic activity of LOX are known: antioxidants and free radical acceptors (a); chelating agents (b); non-competitive redox inhibitors (c); and combinations of chelators and reducing agents (d) [31]. All of these are used in biochemistry and in the food industry to regulate the PUFA metabolism under the action of LOX isoforms. However, most of these bioactive agents are 5-LOX inhibitors. Compared to 5-LOX inhibitors, the 15-LOX inhibitors are covered much less in scientific literature. Therefore, the search for 15-LOX inhibitors is an urgent task for the medical and pharmaceutical chemistry. It should be noted that soybean 15-LOX (15-sLOX) has been used as a model for 5-hLOX due to their similarity in structure and mechanism of action [32,33].
Currently, QSAR/QSPR methods are actively used in the development of lead compounds and drugs based on them. These methods make it possible to solve a wide range of important tasks: 1) unbiased search for potential bioactive compounds in virtual librari es; 2) extension of the scope of application of active components of known drugs; 3) evaluation of the side effects and toxicity of potential drugs and new bioactive compounds; 4) molecular design of new potentially low-toxicity bioactive compounds based on the structures of known drugs and hit compounds.
QSAR/QSPR methods allow for modeling of biological activity and physicochemical properties based on a relatively small number of structures in the training sets, which is their major advantage. The concept of these methods is based on the fundamental postulate of organic chemistry that states that the properties of chemical compounds are determined by their structures. The essence of QSAR/QSPR methods lies in the correct selection of various physicochemical and structural descriptors which allow an unbiased description of each structure of the training sets, as well as mathematical and statistical methods for building regression relationships based on the most informative descriptors. The application of QSAR approaches at the preclinical phase can significantly reduce the time and material costs in the targeted development of new potential drugs, as various researchers repeatedly noted [34,35,36,37,38,39,40,41,42,43,44,45,46]. The use of QSAR/QSPR methods to solve the above problems is widely reported in scientific literature, including research articles, scientific reviews and monographs. Every year, the well-known software packages implementing these methods are improved and new ones are developed [47,48,49,50,51,52,53,54,55,56].
Among the many QSAR/QSPR methods whose classification is based on the choice of certain types of descriptors and machine learning methods for constructing mathematical equations [34,35,36,37,38,39,40,41,42,43,44,45,46,57], 2D- and 3D-QSAR methods are the most popular. The calculation of descriptors in these methods is based on structural formulae and molecular diagrams of chemical compounds (2D-QSAR) and on potentially bioactive conformations of chemical structures (3D-QSAR) [34,36,58,59]. The choice of one of these methods depends mainly on the objectives of a particular study. 2D-QSAR methods, together with 3D to 6D-QSAR methods, can be used to model biological activity where there is a need to find compounds that can either increase or decrease the enzymatic specificity of certain proteins. The lack of reliable crystallographic data on potentially biologically active conformations of organic compounds in the active centres of proteins, such as in the case of 15-LOX inhibitors, increases the demand for 2D-QSAR methods over all other methods for modeling enzyme specificity. It should be understood that the application of 2D-QSAR methods is not limited to modeling biological activity. These methods can be successfully applied to model the physicochemical properties of organic compounds, as noted in our previous work and in the work of others.
GUSAR 2019 (General Unrestricted Structure Activity Relationships) is among the programs that allow the calculation of physicochemical and structural descriptors with subsequent selection of the most significant ones and construction of consensus QSAR/QSPR models based on them. Previous versions of this program are known such as GUSAR 2013 and GUSAR 2011 [47,48,53,60,61,62,63,64,65,66,67,68,69,70,71,72,73,74]. The demo version of the latter can be found at way2drug.com. Regardless of the version, this program has proved its worth in modeling different types of biological activity and a number of physicochemical properties (lipophilicity, biotransformation factor, antioxidant activity) in a number of heterogeneous organic compounds, as reported both by its developers and by us in previous works [60,61,62,63,67,68,69,70,71,72,73,74].
The purpose of the present work was to study the quantitative structure–activity relationship of 15-LOX inhibitors in a series of homo- and heterocyclic compounds with common structural formulae I–XVI (Figure 1) [75,76,77,78,79,80,81,82,83,84,85,86,87,88,89,90] using the GUSAR 2019 program and to build statistically significant valid prediction models for the pIC50 parameter designed to search for new potentially efficient 15-LOX inhibitors in virtual libraries and databases.
2. Results and Discussion
2.1. Prediction of the Numerical Values of the IC50 Parameter Using the GUSAR 2019 Program
As a result of QSAR modeling based on the consensus approach implemented in the GUSAR 2019 software, eighteen consensus models M1–M18 were generated. All of these models are designed to predict the numerical values of the pIC50 parameter for LOX inhibitors. The difference between these models lies in the choice of different types of descriptors and the number of partial regression relationships constructed from them. The descriptive power characteristics of these consensus models are shown in Table 1. They were automatically calculated in GUSAR 2019 software based on the comparison of experimental values of the pIC50 parameter for LOX inhibitors and its values predicted by these models. In our previous works [60,61,62,63,67,68,69,70,71,72,73,74], we explained that the coefficients of determination R2, Q2LMO, values of standard deviation SD and F criterion presented in Table 1 are averages calculated taking into account all partial regression models included in each of the Mi consensus models.
The data presented in Table 1 allow us to conclude that all the QSAR consensus models M1–M18 constructed by us feature acceptable stability, since the A parameter for them is smaller than the value of 0.3 allowed in scientific literature [44]. Consensus models M1–M3 and M10–M12 have the highest stability, as they provide small A values (A < 0.1). The SCR method was used to select the descriptors for their construction. The consensus models M7–M9 and M16–M18, which were constructed using the Both method for descriptor selection, show an acceptable level of stability (A ⩽ 0.2). The consensus models M5–M6 and M13–M15 have the lowest stability, with the exception of M4. The selection of descriptors in the construction of these models was performed using the RBF-SCR method. Thus, the data in Table 1 allow us to conclude that, in all cases, the nature of the descriptors on which the consensus models M1–M18 were built did not play a decisive role in their stability. At the same time, the method of descriptor selection was a significant factor that affected the stability of these models.
It should be noted that the statistical characteristics (average R2 (), average Q2 (), average F (), average Q2LMO(), average SD ()) whose calculation is provided by GUSAR 2019 do not allow a detailed assessment of the descriptive ability of QSAR models, while assessment of the predictive ability of QSAR models is not performed by this program at all. Therefore, metrics based on different types of R2 coefficients of determination (R2, R20, average R2m (), Q2F1, Q2F2, average R2mTSi (), CCC) were additionally used to objectively assess the descriptive and predictive ability of the M1–M18 QSAR models. In addition, metrics designed to evaluate the prediction errors of pIC50 values (RMSE, MAE, SD) were used to determine the true prediction quality index of the pIC50 parameter based on the M1–M18 models for the test sets TS1–TS2 of compounds [44,45,46,57]. The calculation of all these criteria was performed using the Xternal Validation Plus 1.2 software [91]. The formulae used in this program to calculate all the above criteria are given in Table S1 in the Supplementary Material. The same software was used to check the models for systematic errors.
The process of internal and external validation of the developed QSAR models M1–M18 was based on the structures of training sets TrS1–TrS2 and external test set TS1, respectively. In addition, the predictive ability of the M10–M18 models was evaluated using the structures of the LOX inhibitors contained in the internal test set TS2. In addition, the predictive ability of the M3, M6, M9, M12, M15 and M18 models was evaluated by comparing the experimentally determined (see Section 2.2) and calculated values of the pIC50 parameter for the structures of LOX inhibitors 1–8 contained in the test set TS3.
Table 2 and Table 3 present the threshold (maximum and minimum) values of different types of coefficients of determination and prediction errors of the pIC50 parameter for some of the QSAR models we built. These were calculated using Xternal Validation Plus 1.2 software [91] for 100% and 95% structures of the 15-LOX inhibitors contained in the training sets TrS1–TrS2 and test sets TS1–TS2, respectively. Those QSAR models for which numerical data are not available in Table 2 and Table 3 occupied an intermediate position between the maximum and minimum values for all statistical features listed in this table. The data in Table 2 and Table 3 allow an objective assessment of the range of variability of different statistical criteria characterising the descriptive and predictive ability of the M1–M18 QSAR models. Tables S2–S6 in the Supplementary Material present the full set of criteria calculated using Xternal Validation Plus 1.2 software for the TrS1–TrS2 and TS1–TS2 sets, considering both 100% and 95% of the 15-LOX inhibitor structures contained therein.
The data from Table2 allow us to conclude that all the models M1–M18 showed high predictive power.
Figure 2 how correlations between the experimental and calculated values of the pIC50 parameter for the 15-LOX inhibitors contained in the TrS1 set as an example of the high predictive power of our QSAR models M1–M9.
In this case, according to this Table2, the best descriptive ability was provided by the M4, M13, and M15 QSAR models built using RBF-SCR as the descriptor selection method. The lowest accuracy in reproducing the experimental data contained in the TrS1–TrS2 sets was demonstrated by the M2 and M10 models, in which the descriptors were selected using the SCR method. In particular, the M2 model had the smallest numerical values of different types of coefficients of determination and the largest values of prediction errors of the pIC50 parameter for the structures contained in the TrS1 set. At the same time, the M4 model showed the largest numerical values of different types of coefficients of determination and the smallest error values. This conclusion holds true for both 100% and 95% of the data contained in the TrS1 set.
The conclusions drawn from the analysis of the goodness of fit of the M10–M18 models built on the TrS2 set are less clear. For example, detailed analysis of different types of coefficients of determination and prediction errors shows small differences in the estimation of the descriptive ability of the M10–M18 models depending on the completeness of inclusion of the experimental data (100% and 95% of the data) contained in the TrS2 set. In fact, if 100% of the data in TrS2 are considered, the maximum coefficients of determination R20, R2’0, , CCC and the minimum ⊗R2m coefficient are provided by the M13 model. The same model, based on the data in the tables, is characterised by the minimum values of error and standard deviation in the prediction of the pIC50 parameter for the structures of the 15-LOX inhibitors included in the TrS2 set. The maximum value of the R2 coefficient is given by the M15 model.
If 95% data of the training set TrS2 is taken into account, the M13 model showed the best descriptive power even on the basis of a smaller set of criteria. In fact, it was characterised by the largest values of coefficients of determination such as R2, R20, and CCC, along with the minimum value of the ΔR2m coefficient. The M15 model gave the largest values of the coefficients, R2’0, mean R2m in combination with the smallest values of the RMSE, B parameter and standard deviation SD. At the same time, the minimum value of the MAE error is observed for the M14 model based on 95% data of the TrS2 training set.
The data of Table 3 and Tables S4-S6 in the Supplementary Material allow us to conclude that almost all the QSAR models built by us are characterised by moderate predictive ability and absence of systematic errors in predicting the target property for the structures of 15-LOX inhibitors contained in test sets TS1–TS2. The highest numerical values of different types of coefficients of determination in predicting the pIC50 parameter for 100% of the 15-LOX inhibitor structures contained in TS1 were demonstrated by the M14 model. The same model had the smallest value of the RMSE error. The smallest values of MAE error, SD value and B parameter for 100% of the data in the TS1 were provided by the M13 and M17 models, respectively.
The worst results for all the statistical criteria described above were observed for the M9 and M12 models. For example, the M9 model was characterised by the minimum values of the R2, R20, and CCC criteria. The M12 model gave the minimum values of the R2, R20, , and CCC criteria, while the M12 model provided the minimum values of the R2, R20, Q2F1, and Q2F2 criteria, combined with the maximum value of the RMSEP error. However, the M18 model was characterised by the maximum value of the ⊗R2m coefficient. The highest value of the MAE error in predicting the pIC50 parameter for 100% of the TS1 structures was demonstrated by the M3 model. The M5 model was gave the maximum values of the SD and B parameters.
The results of evaluating the predictive ability of QSAR models M10–M18 using 100% data of the test set TS2 were more unambiguous. The maximum values of the different types of determination coefficients along with the minimum values of the prediction errors of the pIC50 parameter in this case belonged to the M13 model. The minimum values of the determination coefficients in combination with the maximum values of the prediction errors of the pIC50 parameter for the 15-LOX inhibitors corresponded to the M11 model.
Removal of 5% of the data with the worst prediction results for pIC50 from TS1 and TS2 contributed to a slight increase in the numerical values of different types of coefficients of determination and a decrease in the numerical values of the prediction errors for this parameter. However, the changes in all the statistical criteria were not systematic when the data from both sets were manipulated in this way. In particular, after removing 5% of data from TS1, the highest numerical values of the coefficients of determination R2, R20, Q2F1, and Q2F2 and the were obtained from the M10 model. The maximum value of the R2'0 criterion in comparison of the experimental pIC50 values with the predicted ones was observed for the M1 model. The minimum values of RMSE and MAE errors based on 95% of the data of the TS1 set were shown by the M13 and M16 models, respectively. The lowest values of SD and B were shown by the M4 model.
Removing 5% of the data from the TS2 set had almost no effect on the generalizing conclusions. In this case, like in the case of 100% data in the TS2, the M13 model provided the largest numerical values of different types of coefficients of determination and the smallest values of pIC50 prediction errors for the 15-LOX inhibitors, with the exception of SD whose numerical value was the smallest for the M17 model. The minimum numerical values of different types of coefficients of determination combined with the maximum values of the pIC50 prediction errors for both 100% and 95% data in the TS2 were observed for the M11 model.
Based on analysis of the numerical values of different validation criteria presented in Table 1, Table 2 and Table 3 of this section and in Tables S2-S6 in the Supplementary Material, we can conclude that almost all the models showed high descriptive and moderate predictive power, since they met the internal and external validation criteria described in Section 2.3. It should be noted that this condition was met for both 100% and 95% of the data contained in the TrS1-TrS2 and TS1-TS2 sets.
2.2. Experimental Determination of the IC50 Parameter Against 15-LOX for Compounds 1–8
The results of the in vitro analysis of the inhibitory activity of a series of 2H-(benzo)pyran-2-one derivatives 1–8 against 15-LOX are presented in Table 4 and Figure 3.
IC50 values were determined by linear interpolation between the points closest to 50% inhibition (Figure 3).
The inhibitory activity against 15-LOX was experimentally determined for compounds 1–8. The values of semi-efficient inhibitory concentration are in the range of 24–73 μmol/l, which allows us to classify these compounds as moderate inhibitors of the enzyme.
As it can be seen from the plot (Figure 3), a sharp change in inhibitory activity was observed in a narrow concentration range for compounds 7, 8, which can serve as a basis for the assumption that the enzyme is highly sensitive to these inhibitors.
2.3. Evaluation of the predictive ability of the M3, M6, M9, M12, M15, and M18 models based on Compounds 1–8 in the Test Set TS3
Subsequently, the consensus models M3, M6, M9, M12, M15, and M18 were used to predict the numerical values of the pIC50 parameter for compounds 1–8 from the TS3 set. The results of these calculations in comparison with the experimental values of the pIC50 exp parameter and the 2·RMSEP criterion, which corresponded to 100% and 95% of the data from the TS1 and TS2 sets, respectively, for these compounds are shown in Table 5 and Table 6. In selecting the numerical values of the 2·RMSEP criterion corresponding to the M3, M6, M9, M12, M15, and M18 models for subsequent comparison with the ΔpIC50 values, which are in fact equal to the modulus of the difference between the experimental and predicted values of the pIC50 parameter, we focused on the minimum value of this parameter (see Table5). It should be noted that all the tested compounds were within the range of applicability of the M3, M6, M9, M12, M15, and M18 models. These models were selected for the prediction of the pIC50 parameter for the 15-LOX inhibitors 1–8 because each of these consensus models included 320 partial regression relationships, which makes it possible to take into account the structural characteristics of each of the tested compounds in the most objective and complete way. In addition, it was of scientific interest to explore the applicability of these models with satisfactory and worst case predictive performance, judging by the statistical criteria derived from TS1–TS2, to predict the target property for new compounds not included in the modeling.
The data in Table 5 and Table 6 allow us to conclude that almost all numerical values of pIC50 for compounds 1–8 predicted by the M3, M6, M9, M12, M15, and M18 models fall within the 95% confidence interval equal to ± 2·RMSE, i.e. the difference between the predicted and experimentally determined values of the pIC50 parameter for 15-LOX inhibitors 1–8 does not numerically exceed the minimum value of the 2·RMSEP criterion for each of the models (see Table 5 and Table 6). The M3 model showed the highest prediction error by this criterion when the pIC50 parameter was predicted for compound 4, but even in this case the difference between the experimental and theoretically predicted values of the pIC50 parameter fell within the 2·RMSEP range. However, the same model (M3) showed the smallest prediction error of the pIC50 parameter for compound 8. This demonstrates the good predictive ability and correctness of our constructed models, as well as the applicability of the GUSAR2019 program for modeling 15-LOX inhibitors.
Thus, all the QSAR consensus models M1–M18 are characterised by high descriptive and moderate predictive power when comparing experimental and predicted values of pIC50 based on TrS1 and TrS2 training sets structures, external and internal test sets TS1 and TS2, and compounds 1–8. These models can be used for virtual screening of virtual libraries and databases to search for new 15-LOX inhibitors in the series of homo- and heterocyclic compounds with common structural formulae I-XVI.
3. Research Methods
The simulation procedure was performed for the compounds whose formulas are shown in Figure 4.
3.1. The Methodology of the Computational Experiment
3.2. Formation of the Training and Test Sets
Training set TrS1 and test set TS1 were generated from the structure set S1. The structure set S1 contained 100 15-LOX inhibitors with their corresponding pIC50 values. Training set TrS2 and test set TS2 were formed based on the structures contained in training set TrS1. Figure 6 shows a scheme that clearly illustrates the strategy of forming the training and test sets TrS1–TrS2, TS1–TS2.
The pIC50 parameter for each compound included in the data set S1 (and the training TrS1–TrS2 and test sets TS1–TS2 generated from it) was calculated as the negative decimal logarithm of its corresponding IC50 value (in mol/l). Numerical IC50 values for the 15-LOX inhibitors being modelled were measured experimentally and are given in [75,76,77,78,79,80,81,82,83,84,85,86,87,88,89,90]. The complete list of organic compounds from which the data set S1 was generated with their corresponding pIC50 characteristics is presented in Table S8 in the Supplementary Material.
QSAR models M1–M9 were built using the TrS1 training set, which contained 84 structures of 15-LOX inhibitors with their corresponding values of the pIC50 parameter. To test the predictive ability of the M1-M9 models, a test set TS1 containing 16 15-LOX inhibitors with their corresponding values of the pIC50 parameter was used. Both sets were obtained by partitioning the data set S1, in which all compounds were previously ranked in ascending order of the pIC50 parameter, in 5:1 ratio. The structures were partitioned into the training set TrS1 and the test set TS1 by transferring every sixth compound from the data set S1 to TS1. The remaining 84 structures of the 15-LOX inhibitors were used to form the training set TrS1.
The TrS2 set contained 70 15-LOX inhibitors with their corresponding values of the pIC50 parameter. It was intended for constructing the QSAR models M10–M18. The validity of the QSAR models M10–M18 was tested using the TS2 set. Both sets, TrS2 and TS2, were generated on the basis of TrS1. The same principle was used to generate the training set TrS1 and the test set TS1 from the data set S1. The characteristics of the training sets TrS1, TrS2 and the test sets TS1, TS2 are shown in Table 7 and Table 8 respectively. The data in these tables indicate that the compounds of the training and test sets are fairly evenly distributed over the entire range of pIC50 variation. At the same time, the range of variation of the pIC50 parameter for the 15-LOX inhibitors included in training sets TrS1–TrS2 and test sets TS1–TS2 exceeds the ΔpIC50 value of 3 (i.e. ΔpIC50 > 3), which determines the correctness of the further QSAR modeling process [44]. In addition, as it can be seen from Figure 4, the training sets are characterised by rather a high degree of molecular diversity.
3.3. Building QSAR Models
The M1-M18 QSAR models were built on the basis of two types of substructural descriptors of atomic neighborhoods: QNA (Quantitative Neighborhoods of Atoms) and MNA (Multilevel Neighborhoods of Atoms) [47,48,53,60,61,62,63,64,65,66,67,68], and three types of whole molecule descriptors (topological length, topological volume, and lipophilicity). These types of descriptors were automatically calculated by the GUSAR 2019 program. At the same time, the QNA and MNA descriptors are unique characteristics of molecules, and their calculation is available in different versions of the GUSAR software (GUSAR 2011, GUSAR 2013, and GUSAR 2019). The ideology of calculating QNA and MNA descriptors was proposed by Professor V.V. Poroikov's research team. It is described in detail in the Appendix and in a number of articles [47,64,65,92,93,94,95,96,97]. The rather complicated mathematical apparatus used for calculating QNA descriptors complicates their physical interpretation. Therefore, they are not explicitly displayed in the section dealing with calculations.
The MNA descriptors are computed using the PASS (Prediction of Activity Spectra for Substances) algorithm [53,66], which predicts approximately 6,400 “biological activities” with an accuracy threshold of an average prediction of at least 95%. These descriptors are generated based on the structural formulae of the chemical compounds without using any pre-compiled list of structural fragments [47,53,66,92]. They are generated as a recursively defined sequence:
- Zero-level MNA descriptor for each atom is the mark A of the atom itself;
- Any next-level MNA descriptor for the atom is the substructure notation A (D1D2 … Di …), where Di is the previous-level MNA descriptor for i–th immediate neighbor of the atom A.
The neighbor descriptors D1 D2 … Di … are arranged in a unique manner. This may be, for example, a lexicographic sequence. The MNA descriptors are generated using an iterative procedure, which results in the formation of structural descriptors that include the first, second, etc. neighborhoods of each atom. The label contains not only information about the type of atom, but also additional information about whether it belongs to a cyclic or acyclic system, etc.
Three methods were used to reduce the descriptor space and select the most significant descriptors:
- Self-consistent regression (SCR) method;
- The method of combining self-consistent regression with radial basis functions (RBF-SCR);
- The Bath method, which combines the simultaneous use of SCR and RBF-SCR methods in a unique way.
All three of these unique methods were also developed by Professor Poroikov's research team and implemented in the GUSAR 2019 program for selecting the most appropriate options. A more detailed description of each method can be found in the Appendix and in the relevant papers [66].
The stability of the models was tested by using a sliding control procedure, with a 20-fold randomized release of 20% of the compounds from the training samples TS1 and TS2. Both of these procedures are automatically implemented in the GUSAR 2019 program [47,48,53,60,61,62,63,64,65,66,67,68].
Each of the eighteen final QSAR M1-M18 models was based on a consensus approach. This approach involves combining several regression equations into one model, which is done automatically based on the similarities between the equations.
Each of the final QSAR models M1-M2 and M4-M5, M7-M8, M10-M11, M13-M14, M16-M17 included 20 partial regression dependences. At the same time, the M1, M4, M7, M10, M13, and M16 models were based on QNA descriptors and three additional descriptors that describe the topological length, topological volume, and lipophilicity of the modeled 15-LOX inhibitors. The M2, M5, M8, M11, M14, and M17 models were built on a similar principle, but they were based on NA descriptors, with automatic addition of the three whole molecule descriptors described above. The M3, M6, M9, M12, M15, and M18 models each included 320 partial regression dependences. At the same time, each of these 320 particular models was built independently of each other based on the three descriptors of the entire molecule described above, with addition of the QNA or MNA descriptors.
Due to the specifics of the calculation process, which is described in detail in the Supplemental Material, QNA and MNA descriptors are not amenable to unambiguous physical interpretation. Therefore, the regression equations based on these descriptors are not explicitly displayed in the GUSAR 2019 program.
3.4. Evaluation of the Descriptive and Predictive Ability of QSAR Models
The descriptive ability of the M1-M18 models was evaluated using several metrics. These included metrics based on the coefficients of determinations R2, R20, average R2m and CCC, as well as metrics estimating errors in predicting pIC50 values (RMS error (RMSE), mean absolute error (MAE), and standard deviation (SD). The parameters of the predictive ability of the M1-M18 models also included metrics based on the coefficients of determination R2, R20, , CCC, Q2F1 and Q2F2 , as well as metrics estimating errors in predicting pIC50 values (RMS error (RMSE), mean absolute error (MAE), standard deviation (SD)).
These statistical parameters were calculated using the External Validation Plus 1.2 software for 100% and 95% of the data (to account for errors) contained in the training and test samples [100]. The Supplemental Material contains formulas for automatically calculating these criteria in this program. The internal verification of the M1-M6 models was performed using LMO cross-validation (Q2LMO), with 20% of compounds excluded from the training sets.
The threshold values of the validation criteria for the above parameters, based on which the descriptive and predictive ability of the QSAR M1-M18 models was evaluated, are presented in Table 8.
Acceptable values of different types of determination coefficients, based on R2, as well as ranges of variation in MAE and RMSD values and criterion B for assessing the descriptive and predictive ability of QSAR models M1-M18 were calculated taking the recommendations from the leading scientists in the field of QSAR modeling [44,45,46,57] into account.
Thus, the permissible range of variation for the MAE parameter was estimated considering the range of variability in the pIC50 parameter for the compounds in training sets TrS1 and TrS2, using the following formulas:
MAE < 0.1 pIC50 — if the criterion is met, then the models are characterized by a high predictive ability
MAE = [0.1; 0.15} pIC50 —if the criterion is met, then the models are characterized by a moderate predictive ability
MAE > 0.15 pIC50 — if the criterion is met, then the models are characterized by a low predictive ability
The permissible range of variation of criterion B, where B=MAE+3SD, was estimated using the formulas:
B < 0.2 pIC50 — if the criterion is met, then the models are characterized by a high predictive ability
B = [0.2; 0.25] pIC50 — if the criterion is met, then the models are characterized by a moderate predictive ability
B > 0.25 pIC50 — if the criterion is met, then the models are characterized by a low predictive ability
Additionally, the predictive ability of the QSAR M1-M18 models was evaluated by comparing the predicted pIC50 values with the experimental values of the same parameter for the new promising 15-LOX inhibitors 1-8 contained in the TS3 test set (Figure 4). These compounds were missing in the S1 data set and, accordingly, did not participate in the consensus models.
3.5. The Technique of the Biochemical Experiment to Measure Inhibitory Activity
Biological tests of inhibitors 15-LOX 1-8 (Figure 4) were performed at the Federal State Budgetary Educational Institution of Higher Education "Saratov National Research State University named after N.G. Chernyshevsky" under the supervision of Professor O.V. Fedotova [101]. The inhibition of the catalytic activity of 15-lipoxygenase by the substances studied was evaluated according to the procedure reported elsewhere [102,103,104]. Quercetin, a well-known inhibitor of 15-LOX, was employed as the positive control.
For biological tests, Lipoxidase/15-lipoxygenase (Sigma Aldrich, Germany, lyophilizate, 15 million Units, CAS Number: 9029-60-1) was used. The study was carried out in borate buffer (0.2 M, pH 9.0). Linoleic acid (Sigma Aldrich, Germany, purity ≥ 95.0%, CAS Number: 60-33-3) was used as the oxidation substrate. The activity of 15-LOG in the presence of the compounds studied was evaluated by spectrophotometric recording of changes in the concentration of 13-hydroperoxylinoleic acid, the product of oxidative transformation of linoleic acid [105], using a LEKI SS2110UV two-beam scanning spectrophotometer (CJSC LOIP, Russia).
The initial concentration of lipoxygenase in the sample was 167 U/ml. Its final concentration in the sample was 134 µM. In order to study the inhibitory activity of compounds, they were added to the sample as solutions in DMSO.
To conduct the experiment, 1400 µl of a substrate solution was placed in a cell, along with 24 µl of a sample in DMSO (for the prototype) or DMSO (for the control sample). Immediately after adding 76 µl of the enzyme solution, the timer was turned on. After 90 seconds, the optical density (λ = 234 nm) was recorded.
The activity value obtained from the control experiment was used as a baseline, or 100%, of enzyme activity. It was measured with only the enzyme solution and solvent (DMSO) present in the cell, without any active substance.
The percentage of activity inhibition by compounds 1-8 was determined as a relative decrease in the optical density of the solution, using the formula (1):
where is the optical density index of the control sample 90 seconds after the start of the reaction; is the optical density index of the sample containing the test compound 90 seconds after the start of the reaction.
The range of working concentrations of compounds 1-8 was 1-100 µM.
The IC50 values of compounds 1-8 were determined using linear interpolation between the points closest to 50% inhibition by means of Microsoft Excel 2016. Enzyme activity experiments were performed in triplicate. The values are expressed as means ±SD. Student’s t-test was employed for determination of statistical significance, using a P value of 0.05 or less as a criterion for significant inhibition.
4. Conclusion
Using the QSAR methodology implemented in the GUSAR 2019 program, a quantitative structure-inhibitory activity relationship has been found for a series of 100 15-LOX inhibitors based on a series of derivatives of phenol, resorcinol, anacardic acid, dimethoxybenzene, alkyl ester of 2-(4-isobutylphenyl)propionic acid, 1,3-diarylprop-2-yn-1-one, proline, pyrrole, alkyl ester of 2-methylfuran-3-carbonyl acid, ketoprofen, naphthalene, 1,4-di-N-oxide of quinoxaline, isoflavone, 4-hydroxy-2-(phenylmethyl)benzofuran and coumarin with general structural formulas I–XIV. These compounds had various degrees of inhibition of the catalytic activity of 15-LOX. The variation range of the pIC50 parameter was 3.873 (pIC50=3.873). Based on a combination of MNA and QNA descriptors with three whole molecule descriptors including topological length, topological volume, and lipophilicity, eighteen statistically significant and valid consensus models (M1-M18) were generated.
All models reproduced the experimental data contained in the training samples with a high degree of accuracy. Cross-validation with 20-fold deletion of 20% of the data from the training samples also showed good results. The reliability of the prediction of the pIC50 parameter based on the evaluation of this parameter for compounds of two test samples and ten subsequently experimentally studied compounds showed a moderate predictive ability of the QSAR M1-M18 models.
The satisfactory match of the theoretically calculated pIC50pred values with the experimental pIC50exp values for compounds of test sets TS1-TS2 and compounds 1-8 opens up prospects for application of M1-M18 models in virtual screening of virtual libraries and databases in the search for new potentially efficient 15-LOG inhibitors in these sources.
Supplementary Materials
The following supporting information can be downloaded at the website of this paper posted on Preprints.org.
Author Contributions
Conceptualization, V.K. and Y.Z.; methodology, V.K. and Y.Z.; software, Y.M and L.M.; validation, V.K., Y.M, and L.M; formal analysis, V.K. and Y.Z. .; investigation, V.K., Y.M, M.K. and I.K.; resources, V.K. and Y.M.; data curation, V.K. and Y.Z; writing—original draft preparation, V.K., Y.M and Y.Z.; writing—review and editing, V.K., Y.M and L.M..; visualization, Y.M, L.M, and I.K; supervision, V.K. and Y.Z.; project administration, V.K. and Y.Z; funding acquisition, V.K., Y.Mand Y.Z. All authors have read and agreed to the published version of the manuscript.
Funding
This research was funded by Russian Science Foundation, grant number 19-73-20073, https://rscf.ru/project/19-73-20073/ (accessed on 17 November 2023).
Institutional Review Board Statement
Not applicable.
Informed Consent Statement
Not applicable.
Data Availability Statement
Data are contained within the article and supplementary materials..
Conflicts of Interest
: The authors declare no conflict of interest.
References
- Joo, Y.-C., & Oh, D.-K. (2012). Lipoxygenases: Potential starting biocatalysts for the synthesis of signaling compounds. Biotechnology Advances, 30(6), 1524–1532. [CrossRef]
- Gilbert NC, Bartlett SG, Waight MT, Neau DB, Boeglin WE, Brash AR, Newcomer ME. The structure of human 5-lipoxygenase. Science. 2011 Jan 14;331(6014):217-9. PMID: 21233389; PMCID: PMC3245680. [CrossRef]
- Johannesson, M., Backman, L., Claesson, H.-E., & Forsell, P. K. A. (2010). Cloning, purification and characterization of non-human primate 12/15-lipoxygenases. Prostaglandins, Leukotrienes and Essential Fatty Acids, 82(2-3), 121–129. [CrossRef]
- Jansen, C., Hofheinz, K., Vogel, R., Roffeis, J., Anton, M., Reddanna, P., … Walther, M. (2011). Stereocontrol of Arachidonic Acid Oxygenation by Vertebrate Lipoxygenases. Journal of Biological Chemistry, 286(43), 37804–37812. [CrossRef]
- Acosta, I. F., Laparra, H., Romero, S. P., Schmelz, E., Hamberg, M., Mottinger, J. P., … Dellaporta, S. L. (2009). tasselseed1 Is a Lipoxygenase Affecting Jasmonic Acid Signaling in Sex Determination of Maize. Science, 323(5911), 262–265. [CrossRef]
- Szymanowska, U., Jakubczyk, A., Baraniak, B., & Kur, A. (2009). Characterisation of lipoxygenase from pea seeds (Pisum sativum var. Telephone L.). Food Chemistry, 116(4), 906–910. [CrossRef]
- Senger, T., Wichard, T., Kunze, S., Göbel, C., Lerchl, J., Pohnert, G., & Feussner, I. (2004). A Multifunctional Lipoxygenase with Fatty Acid Hydroperoxide Cleaving Activity from the MossPhyscomitrella patens. Journal of Biological Chemistry, 280(9), 7588–7596. [CrossRef]
- Reet Koljak, Olivier Boutaud, Bih-Hwa Shieh, Nigulas Samel and Alan R. Brash Identification of a Naturally Occurring Peroxidase-Lipoxygenase Fusion Protein Source: Science, New Series, Vol. 277, No. 5334 (Sep. 26, 1997), pp. 1994-1996.
- Mortimer, M., Järving, R., Brash, A. R., Samel, N., & Järving, I. (2006). Identification and characterization of an arachidonate 11R-lipoxygenase. Archives of Biochemistry and Biophysics, 445(1), 147–155. [CrossRef]
- Andreou, A., & Feussner, I. (2009). Lipoxygenases – Structure and reaction mechanism. Phytochemistry, 70(13-14), 1504–1510. [CrossRef]
- Bisakowski, B., Atwal, A. S., & Kermasha, S. (2000). Characterization of lipoxygenase activity from a partially purified enzymic extract from Morchella esculenta. Process Biochemistry, 36(1-2), 1–7. [CrossRef]
- Brodhun F, Feussner I. Oxylipins in fungi. FEBS J. 2011 Apr;278(7):1047-63 . Epub 2011 Feb 23. Erratum in: FEBS J. 2011 Jul;278(14):2609-10. PMID: 21281447. [CrossRef]
- Shechter, G., & Grossman, S. (1983). Lipoxygenase from baker’s yeast: Purification and properties. International Journal of Biochemistry, 15(11), 1295–1304. [CrossRef]
- Viswanath, K.K., Varakumar, P., Pamuru, R.R. et al. Plant Lipoxygenases and Their Role in Plant Physiology. J. Plant Biol. 63, 83–95 (2020). [CrossRef]
- Haeggström, J. Z., & Funk, C. D. (2011). Lipoxygenase and Leukotriene Pathways: Biochemistry, Biology, and Roles in Disease. Chemical Reviews, 111(10), 5866–5898. [CrossRef]
- Okunishi, K., & Peters-Golden, M. (2011). Leukotrienes and airway inflammation. Biochimica et Biophysica Acta (BBA) - General Subjects, 1810(11), 1096–1102. [CrossRef]
- Allmann, S.. Halitschke, R.. Schuurink, R.C. and Baldwin, I.T. (2010) Oxylipin channelling in Nicotiana attenuata: lipoxygenase 2 supplies substrates for green leaf volatile production. Plant. Cell & Environment, 33 (12), 2028-2040. [CrossRef]
- Georg von Mérey, Nathalie Veyrat, George Mahuku, Raymundo Lopez Valdez, Ted C J Turlings, Marco D'Alessandro Dispensing synthetic green leaf volatiles in maize fields increases the release of sesquiterpenes by the plants, but has little effect on the attraction of pest and beneficial insects // Phytochemistry. 2011 Oct;72(14-15):1838-47.. [CrossRef]
- Yuan, J. S., S. J. Himanen, J. K. Holopainen, F. Chen, and C. N. Stewart. 2009. Smelling global climate change: mitigation of function for plant volatile organic compounds. Trends in Ecology and Evolution 24: 323-331. 10.1016/j.tree.2009.01.012.
- Allmann, S. and Baldwin, I.T. (2010) Insects Betray Themselves in Nature to Predators by Rapid Isomerization of Green Leaf Volatiles. Science (New York, N.Y) 329(5995):1075-1078. [CrossRef]
- Mosblech A, Feussner I, Heilmann I (2009) Oxylipins: structurally diverse metabolites from fatty acid oxidation. Plant Physiology and Biochemistry Volume 47, Issue 6, June 2009, Pages 511-517. [CrossRef]
- Huang, F.-C., & Schwab, W. (2011). Cloning and characterization of a 9-lipoxygenase gene induced by pathogen attack from Nicotiana benthamiana for biotechnological application. BMC Biotechnology, 11(1), 30. [CrossRef]
- Viswanath, K. K., Varakumar, P., Pamuru, R. R., Basha, S. J., Mehta, S., & Rao, A. D. (2020). Plant Lipoxygenases and Their Role in Plant Physiology. Journal of Plant Biology. [CrossRef]
- Andreou A., Feussner I. Lipoxygenases – Structure and reaction mechanism // Phytochemistry. 2009. V. 70. P. 1504–1510.
- Upston J.M., Neuzil J., Witting P.K., Alleva R., Stocker R. Oxidation of free fatty acids in low density lipoprotein by 15-lipoxygenase stimulates nonenzymic, alpha-tocopherol-mediated peroxidation of cholesteryl esters // J. Biol. Chem. 1997. V. 272. P. 30067–30074.
- Takahashi Y., Glasgow W.C., Suzuki H., Taketani Y., Yamamoto S., Anton M., Kuhn H., Brash A.R. Investigation of the oxygenation of phospholipids by the porcine leukocyte and human platelet arachidonate 12-lipoxygenases // Eur. J. Biochem. 1993. V. 218. P. 165–171.
- Mao, F., Wu, Y., Tang, X., Wang, J., Pan, Z., Zhang, P., … Xu, W. (2017). Human umbilical cord mesenchymal stem cells alleviate inflammatory bowel disease through the regulation of 15-LOX-1 in macrophages. Biotechnology Letters, 39(6), 929–938. [CrossRef]
- Vaezi, M.A., Safizadeh, B., Eghtedari, A.R. et al. 15-Lipoxygenase and its metabolites in the pathogenesis of breast cancer: A double-edged sword. Lipids Health Dis 20, 169 (2021). [CrossRef]
- Hao Guo, Iris C. Verhoek, Gerian G. H. Prins, Ramon van der Vlag, Petra E. van der Wouden, Ronald van Merkerk, Wim J. Quax, Peter Olinga, Anna K. H. Hirsch, and Frank J. Dekker Novel 15-Lipoxygenase-1 Inhibitor Protects Macrophages from Lipopolysaccharide-Induced Cytotoxicity // Journal of Medicinal Chemistry 2019 62 (9), 4624-4637 . [CrossRef]
- Hong SH, Avis I, Vos MD, Martínez A, Treston AM, Mulshine JL. Relationship of arachidonic acid metabolizing enzyme expression in epithelial cancer cell lines to the growth effect of selective biochemical inhibitors. Cancer Res. 1999;59(9):2223–8.
- Orafaie, A., Mousavian, M., Orafai, H., & Sadeghian, H. (2020). An overview of lipoxygenase inhibitors with approach of in vivo studies. Prostaglandins & Other Lipid Mediators, 106411. [CrossRef]
- Muñoz-Ramírez A, Mascayano-Collado C, Barriga A, Echeverría J and Urzúa A (2020) Inhibition of Soybean 15-Lipoxygenase and Human 5-Lipoxygenase by Extracts of Leaves, Stem Bark, Phenols and Catechols Isolated From Lithraea caustica (Anacardiaceae). Front. Pharmacol. 11:594257. [CrossRef]
- Wecksler, A. T., Garcia, N. K., and Holman, T. R. (2009). Substrate specificity effects of lipoxygenase products and inhibitors on soybean lipoxygenase-1. Bioorg. Med. Chem. 17, 6534–6539. [CrossRef]
- Verma, J.; Khedkar, V.M.; Coutinho, E.C. 3D-QSAR in drug design-a review. J. Curr. Top. Med. Chem. 2010, 10, 95-115. [CrossRef]
- Kubinyi, H. Theory Methods and Applications. In QSAR in Drug Design; Kubinyi, H., Eds.; Kluwer/Escom: Dordrecht, Netherlands, 1993; Volume 1, pp. 759.
- Kubinyi, H. QSAR and 3D QSAR in drug design Part 1: methodology. Drug discovery today 1997, 2, 457-467. [CrossRef]
- Nantasenamat, C.; Prachayasittikul, V.; Isarankura-Na-Ayudhya, C.; Naenna, T. A Practical Overview of Quantitative Structure-Activity Relationship. EXCLI J. 2009, 8, 74- 88. [CrossRef]
- Kubinyi, H. QSAR: Hansch analysis and related approaches. In Methods and principles in medicinal chemistry; Kubinyi, H., Mannhold, R., Krogsgaard-Larsen, P., Timmerman, H., Eds.; Wiley-VCH: Weinheim, Germany, 2008; Volume 1, pp. 993.
- Baskin, I.I. Modeli rovanie «struktura – svojstvo». In Vvedenie v hemoinformatiku; Baskin, I.I., Madzhidov, T.I., Antipin, I.S., Varnek, A.A., Eds.; Nauchno-izdatel'skij centr “Akademiya estestvoznaniya”: Kazan, Russia, 2015; Volume 3, pp. 304.
- Veselovsky, A.V.; Ivanov S. Strategy of computer-aided drug design. Curr. Drug Targets-Infectious Disorders 2003, 3, 33-40. [CrossRef]
- Damale, M.G.; Harke, S.N.; Kalam Khan, F.A.; Shinde, D.B.; Sangshetti, J.N. Recent advances in multidimensional QSAR (4D-6D): a critical review J. Mini-Rev. Med. Chem. 2014, 14, 35-55. [CrossRef]
- Alexander, D.L.J.; Tropsha, A.; Winkler, D.A. Beware of R2: Simple, Unambiguous Assessment of the Prediction Accuracy of QSAR and QSPR Models. J. Chem. Inf. Model. 2015, 55, 1316-1322. [CrossRef]
- Ambure, P.; Gajewicz-Skretna, A.; Cordeiro, M.N.D.S.; Roy, K. New Workflow for QSAR Model Development from Small Data Sets: Small Dataset Curator and Small Dataset Modeler. Integration of Data Curation, Exhaustive Double Cross-Validation, and a Set of Optimal Model Selection Techniques. J. Chem. Inf. Model. 2021, 1-7. [CrossRef]
- Dearden, J.C.; Cronin, M.T.D.; Kaiser, K.L.E. How not to develop a quantitative structure-activity or structure-property relationship (QSAR/QSPR). J. SAR QSAR Environ. Res. 2009, 20, 241-266. [CrossRef]
- Roy, P.P.; Paul, S.; Mitra, I.; Roy, K. On Two Novel Parameters for Validation of Predictive QSAR Models. J. Molecules 2009, 14, 1660-1701. [CrossRef]
- Roy, K.; Ambure, P.; Kar, S. How Precise Are Our Quantitative Structure−Activity Relationship Derived Predictions for New Query Chemicals? J. ASC Omega 2018, 3, 11392-11406. [CrossRef]
- Lagunin, A.A.; Romanova, M.A.; Zadorozhny, A.D.; Kurilenko, N.S.; Shilov, B.V.; Pogodin, P.V.; Ivanov, S.M.; Filimonov, D.A.; Poroikov, V.V. Comparison of Quantitative and Qualitative (Q)SAR Models Created for the Prediction of Ki and IC50 Values of Antitarget Ingibitors. J. Front. Pharmacol. 2018, 9, 1136. [CrossRef]
- Taipov, I.A.; Khayrullina, V.R.; Khoma, V.K.; Gerchikov, A.Ja.; Zarudiy, F.S.; Bege, Kh. Virtual screening in the row of effective inhibitor of catalytic activity-A4-hydrolase. J. Vestnik Bashkir. Univ. 2012, 17, 886-891.
- Tarasov, G.P.; Khayrullina, V.R.; Gertchikov, A.Ja.; Kirlan, S.A.; Zarudiy, Ph.S. Derivatives of 4-amino-n-[2-(dietilamino) ethyl] benzamids as potentially low-toxic substances with expressed antiarrhytmic action. J. Vestnik Bashkir. Univ. 2012, 17, 1242-1246.
- Khayrullina, V.R.; Kirlan, S.A.; Gerchikov, A.Ja.; Zarudiy, F.S.; Dimoglo, A.S.; Kantor E.A. Modeling of structures of anti-inflammatory heterocyclic compounds with their toxicity. J. Baskir. Khim. Zh. 2010, 17, 76-79.
- Liu, J.; Pan, D.; Tseng, Y.; Hopfinger, A.J. 4D-QSAR analysis of a series of antifungal p450 inhibitors and 3D-pharmacophore comparisons as a function of alignment. J. Chem. Inf. Comput. Sci. 2003, 43, 2170-2179. [CrossRef]
- Scior, T.; Medina-Franco, J.L.; Do, Q.-T.; Martínez-Mayorga, K.; Yunes Rojas, J.A.; Bernard, P. How to recognize and workaround pitfalls in QSAR studies: a critical review. J. Curr. Med. Chem. 2009, 16, 4297-4313. [CrossRef]
- Lagunin, A.A.; Geronikaki, A.; Eleftheriou, P.; Pogodin, P.V. Rational Use of Heterogeneous Data in Quantitative Structure-Activity Relationship (QSAR) Modeling of Cyclooxygenase/Lipoxygenase Inhibitors. J. Chem. Inf. Model. 2019, 59, 713-730. [CrossRef]
- Roy, K.; Kar, S.; Narayan Das, R. Fundamental Concepts. In A Primer on QSAR/QSPR Modeling; Roy, K., Kar, S., Narayan Das, R., Eds.; Springer: New York, USA, 2015, pp. 129. [CrossRef]
- Dastmalchi, S.; Hamzeh-Mivehroud, M.; Sokouti, B. A Practical Approach. In Quantitative Structure–Activity Relationship; Dastmalchi, S., Hamzeh-Mivehroud, M., Sokouti, B., Eds.; CRC Press: Boca Raton, USA, 2018, pp. 115. [CrossRef]
- Roy, K. Applications in Pharmaceutical, Chemical, Food, Agricultural and Environmental Sciences. In Advances in QSAR Modeling; Roy, K., Eds.; Springer: Jackson, USA, 2017, Volume 24, pp. 555. [CrossRef]
- Roy, K.; Kar, S.; Ambure, P. On a simple approach for determining applicability domain of QSAR models. J. Chemom. Intell. Lab. Syst. 2015, 145, 22-29. [CrossRef]
- Verma, J.; Malde, A.; Khedkar, S.; Iyer, R.; Coutinho E. Local indices for similarity analysis (LISA)-a 3D-QSAR formalism based on local molecular similarity. J. Chem. Inf. Model. 2009, 49, 2695-2707. [CrossRef]
- Hopfinger, A.; Wang, S.; Tokarski, J.; Jin, B.; Albuquerque, M.G.; Madhav, P.J.; Duraiswami, C. Construction of 3D-QSAR Models Using the 4D-QSAR Analysis Formalism. J. Am. Chem. Soc. 1997, 119, 10509-10524. [CrossRef]
- Khayrullina, V.R.; Gerchikov, A.Ya.; Lagunin, A.A.; Zarudii, F.S. Quantitative Analysis of Structure−Activity Relationships of Tetrahydro-2H-isoindole Cyclooxygenase-2 Inhibitors. J. Biokhimiya 2015, 80, 74-86. [CrossRef]
- Khairullina, V.R.; Akbasheva, Y.Z.; Gimadieva, A.R.; Mustafin, A.G. Analysis of the relationship «structure-activity» in theseries of certain 5-ethyluridine derivatives with pronounced anti-herpetic activity. J. Vestnik Bashk. Univ. 2017, 22, 960-965.
- Khairullina, V.R.; Gerchikov, A.Ya.; Lagunin, A.A.; Zarudii, F.S. QSAR modeling of thymidilate synthase inhibitors in a series of quinazoline derivatives. J. Pharm. Chem. 2018, 51, 884-888. [CrossRef]
- Khairullina, V.R.; Gimadieva, A.R.; Gerchikov, A.Ja.; Mustafin, A.G.; Zaarudii, F.S. Quantitative structure–activity relationship of the thymidylate synthase inhibitors of Mus musculus in the series of quinazolin-4-one and quinazolin-4-imine derivatives. J. Mol. Graphics Modell. 2018, 85, 198-211. [CrossRef]
- Zakharov, A.V.; Lagunin, A.A.; Filimonov, D.A.; Poroikov, V.V. Quantitative prediction of antitarget interaction profiles for chemical compounds. J. Chem. Res. Toxicol. 2012, 25, 2378-2385. [CrossRef]
- Filimonov, D.A.; Zakharov, A.V.; Lagunin, A.A.; Poroikov, V.V. QNA based “Star Track” QSAR approach. SAR and QSAR Environ. J. Resolut. 2009, 20, 679-709. [CrossRef]
- Zakharov, A.V.; Peach, M.L.; Sitzmann, M.; Nicklaus, M.C. A New Approach to Radial basis function approximation and Its application to QSAR. J. Chem. Inf. Model. 2014, 54, 713-719. [CrossRef]
- Martynova, Y.Z.; Khairullina, V.R.; Biglova, Y.N.; Mustafin, A.G. Quantitative structure-property relationship modeling of the C60 fullerene derivatives as electron acceptors of polymer solar cells: Elucidating the functional groups critical for device performance. J. Mol. Graph. Model. 2019, 88, 49-61. [CrossRef]
- Martynova, Yu.Z.; Khairullina, V.R.; Gimadieva, A.R.; Mustafin, A.G. QSAR-Modeling of desoxyuridine triphosphatase inhibitors in a series of some derivatives of uracil. J. Biomed. Chem. 2019, 65, 103-113. [CrossRef]
- Martynova, Yu.Z.; Khairullina, V.R.; Nasretdinova, R.N.; Garifullina, G.G.; Mitsukova, D.S.; Gerchikov, A.Ya; Mustafin, A.G. Determination of the chain termination rate constants of the radical chain oxidation of organic compounds on antioxidant molecules by the QSPR method. J. Russ. Chem. Bull., Int. Ed. 2020, 69, 1679-1691. [CrossRef]
- Khairullina, V.; Safarova, I.; Sharipova, G.; Martynova, Y.; Gerchikov, A. QSAR Assessing the Efficiency of Antioxidants in the Termination of Radical-Chain Oxidation Processes of Organic Compounds. J. Mol. 2021, 26, 421. [CrossRef]
- Martynova, Yu.Z.; Khairullina, V.R.; Garifullina, G.G.; Mitsukova, D.S.; Zarudiy, F.S.; Mustafin, A.G. QSAR-modeling of the relationship “structure – antioxidative activity” in a series of some benzopirane and benzofurane derivatives. J. Vestnik Bashk. Univ. 2019, 24, 573-580. [CrossRef]
- Martynova, Yu.Z.; Khairullina, V.R.; Gerchikov, A.Ya; Zarudiy, F.S.; Mustafin, A.G. QSPR-modeling of antioxidant activity of potential and industrial used stabilizers from the class of substituted alkylphenols. J. Vestnik Bashk. Univ. 2020, 25, 723-730. [CrossRef]
- Khairullina, V.; Martynova, Yu.; Safarova, I.; Sharipova, G.; Gerchikov, A.; Limantseva, R.; Savchenko, R. QSPR Modeling and Experimental Determination of the Antioxidant Activity of Some Polycyclic Compounds in the Radical-Chain Oxidation Reaction of Organic Substrates. J. Mol. 2022, 27, 6511. [CrossRef]
- Khairullina, V.R.; Martynova, Yu.Z. Quantitative Structure–Activity Relationship in the Series of 5-Ethyluridine, N2-Guanine, and 6-Oxopurine Derivatives with Pronounced Anti-Herpetic Activity. J. Mol. 2023, 28, 7715. [CrossRef]
- Vinayagam J., Gajbhiye R.L., Mandal L., Arumugam M., Achari A., Jaisankar P. Substituted furans as potent lipoxygenase inhibitors: Synthesis, in vitro and molecular docking studies // Bioorganic Chemistry. – 2017. – V. 71. – P. 97-101.
- Siskou I.C., Rekka E.A., Kourounakis A.P., Chrysselis M.C., Tsiakitzis K., Kourounakis P.N. Design and study of some novel ibuprofen derivatives with potential nootropic and neuroprotective properties // Bioorganic & Medicinal Chemistry. – 2007. – V. 15, No. 2. – P. 951-961.
- Pontiki E., Hadjipavlou-Litina D. Synthesis and pharmacochemical evaluation of novel aryl-acetic acid inhibitors of lipoxygenase, antioxidants, and anti-inflammatory agents // Bioorganic & Medicinal Chemistry. – 2007. – V. 15, No. 17. – P. 5819-5827.
- Wisastra R., Ghizzoni M., Boltjes A., Haisma H.J., Dekker F.J. Anacardic acid derived salicylates are inhibitors or activators of lipoxygenases // Bioorganic & Medicinal Chemistry. – 2012. – V. 20, No. 16. – P. 5027-5032.
- Rao P.N.P., Chen Q.-H., Knaus E.E. Synthesis and biological evaluation of 1,3-diphenylprop-2-yn-1-ones as dual inhibitors of cyclooxygenases and lipoxygenases // Bioorganic & Medicinal Chemistry Letters. – 2005. – V. 15, No. 21. – P. 4842-4845.
- Doulgkeris C.M., Galanakis D., Kourounakis A.P., Tsiakitzis K.C., Gavalas A.M., Eleftheriou P.T., Victoratos P., Rekka E.A., Kourounakis P.N. Synthesis and pharmacochemical study of novel polyfunctional molecules combining anti-inflammatory, antioxidant, and hypocholesterolemic properties // Bioorganic & Medicinal Chemistry Letters. – 2006. – V. 16, No. 4. – P. 825-829.
- Burguete A., Pontiki E., Hadjipavlou-Litina D., Villar R., Vicente E., Solano B., Ancizu S., Pérez-Silanes S., Aldana I., Monge A. Synthesis and anti-inflammatory/antioxidant activities of some new ring substituted 3-phenyl-1-(1,4-di-N-oxide quinoxalin-2-yl)-2-propen-1-one derivatives and of their 4,5-dihydro-(1H)-pyrazole analogues // Bioorganic & Medicinal Chemistry Letters. – 2007. – V. 17, No. 23. – P. 6439-6443.
- Lau C.K., Belanger P.C., Scheigetz J., Dufresne C., Williams H.W.R., Maycock A.L., Guindon Y., Bach T., Dallob A.L. Synthesis and structure-activity relationships of a novel class of 5-lipoxygenase inhibitors. 2-(Phenylmethyl)-4-hydroxy-3,5-dialkylbenzofurans: the development of L-656,224 // Journal of Medicinal Chemistry. – 1989. – V. 32, No. 6. – P. 1190-1197.
- Whitman S., Gezginci M., Timmermann B.N., Holman T.R. Structure−Activity Relationship Studies of Nordihydroguaiaretic Acid Inhibitors toward Soybean, 12-Human, and 15-Human Lipoxygenase // Journal of Medicinal Chemistry. – 2002. – V. 45, No. 12. – P. 2659-2661.
- Rao P.P.N., Chen Q.-H., Knaus E.E. Synthesis and Structure−Activity Relationship Studies of 1,3-Diarylprop-2-yn-1-ones: Dual Inhibitors of Cyclooxygenases and Lipoxygenases // Journal of Medicinal Chemistry. – 2006. – V. 49, No. 5. – P. 1668-1683.
- Kontogiorgis C.A., Hadjipavlou-Litina D.J. Synthesis and Antiinflammatory Activity of Coumarin Derivatives // Journal of Medicinal Chemistry. – 2005. – V. 48, No. 20. – P. 6400-6408.
- Shobha S.V., Candadai R.S., Ravindranath B. Inhibition of Soybean Lipoxygenase-1 by Anacardic Acids, Cardols, and Cardanols // Journal of Natural Products. – 1994. – V. 57, No. 12. – P. 1755-1757.
- Khan A.N., Perveen S., Malik A., Afza N., Iqbal L., Latif M., Saleem M. Conferin, potent antioxidant and anti-inflammatory isoflavone from Caragana conferta Benth // J. Enzyme Inhib. Med. Chem. – 2010. – V. 25, No. 3. – P. 440-444.
- Jabbari A., Sadeghian H., Salimi A., Mousavian M., Seyedi S.M., Bakavoli M. 2-Prenylated m-Dimethoxybenzenes as Potent Inhibitors of 15-Lipoxygenase: Inhibitory Mechanism and SAR studies // Chemical Biology & Drug Design. – 2016. – V. 88. – P. 460-469.
- Rajić Z., Hadjipavlou-Litina D., Pontiki E., Balzarini J., Zorc B. The novel amidocarbamate derivatives of ketoprofen: synthesis and biological activity // Med. Chem. Res. – 2011. – V. 20, No. 2. – P. 210-219.
- Doulgkeris C.M., Siskou I.C., Xanthopoulou N., Lagouri V., Kravaritou C., Eleftheriou P., Kourounakis P.N., Rekka E.A. Compounds against inflammation and oxidative insult as potential agents for neurodegenerative disorders // Med. Chem. Res. – 2012. – V. 21, No. 9. – P. 2280-2291.
- Xternal Validation Plus. Available online: https://sites.google.com/site/dtclabxvplus (accessed on June 25, 2022).
- Zakharov, A.V.; Peach, M.L.; Sitzmann, M.; Nicklaus, M.C. QSAR modeling of imbalanced high-throughput screening data in PubChem. J. Chem. Inf. Model. 2014, 54, 705–712.
- Lagunin, A.; Zakharov, A.; Filimonov, D.; Poroikov, V. QSAR Modelling of Rat Acute Toxicity on the Basis of PASS Prediction. J. Mol. Informatics 2011, 30, 241-250. [CrossRef]
- Zakharov, A.V.; Lagunin, A.A.; Filimonov, D.A.; Poroikov, V.V. Quantitative structure—Activity relationships of cyclin-dependent kinase 1 inhibitors. J. Biomed. Chem. 2006, 52, 3–18.
- Filimonov, D.A.; Akimov, D.V.; Poroikov, V.V. The Method of Self-Consistent Regression for the Quantitative Analysis of Relationships Between Structure and Properties of Chemicals. Pharm. Chem. J. 2004, 38, 21–24.
- Ivanov, S.M.; Lagunin, A.A.; Filimonov, D.A.; Poroikov, V.V. Relationships between the structure and severe drug-induced liver injury for low, medium, and high doses of drugs. J. Chem. Res. Texicol. 2022, 35, 402–411.
- Lagunin, A.A.; Zakharov, A.V.; Filimonov, D.A.; Poroikov, V.V. A new approach to QSAR modelling of acute toxicity. J. SAR QSAR Environ. Res. 2007, 18, 285–298.
- Zakharov, A.V.; Varlamova, E.V.; Lagunin, A.A.; Dmitriev, A.V.; Muratov, E.N.; Fourches, D.; Kuz’min, V.E.; Poroikov, V.V.; Tropsha, A.; Nicklaus, M.C. QSAR Modeling and Prediction of Drug–Drug Interactions. J. Mol. Pharm. 2016, 13, 545–556.
- MarvinSketch. Available online: https://chemaxon.com/download/marvin-suite (accessed on 31 August 2023).
- DiscoveryStudioVisualiser. Available online: https://www.3ds.com (accessed on 31 August 2023).
- Roy, K.; Das, R.N.; Ambure, P.; Aher, R.B. Be aware of error measures. Further studies on validation of predictive QSAR models. J. Chemom. Intell. Lab. Syst. 2016, 152, 18-33. [CrossRef]
- Strashilina I.V. Zameshchennye 2n-piran-2-ony v one-pot sinteze n, o -soderzhashchikh geterosistem: avtoref. dis. … kand. khim. nauk. 02.00.03 / Strashilina Irina Vladimirovna. – Saratov, 2018. – 23 s.
- Lyckander I. M., Malterud K. E. Lipophilic flavonoids from Orthosiphon spicatus as inhibitors of 15-lipoxygenase //Acta Pharmaceutica Nordica. – 1992. – Т. 4. – №. 3. – С. 159-166.
- Malterud K. E., Rydland K. M. Inhibitors of 15-lipoxygenase from orange peel //Journal of agricultural and food chemistry. – 2000. – Т. 48. – №. 11. – С. 5576-5580.
- Lyckander, I. M. Lipophilic flavonoids from Orthosiphon spicatus prevent oxidative inactivation of 15-lipoxygenase / I.M. Lyckander, K.E. Malterud // Prostaglandins, leukotrienes and essential fatty acids. – 1996. – V. 54. – №. 4. – P. 239-246.
- Bennamane, N. & Nedjar-Kolli, B & Geronikaki, Athina & Eleftheriou, Phaedra. (2011). N-Substituted [phenyl-pyrazolo]-oxazin-2-thiones as COX-LOX inhibitors: influence of the replacement of the oxo -group with thioxo- group on the COX inhibition activity of N-substituted pyrazolo-oxazin-2-ones.. ARKIVOC. [CrossRef]
- Poroikov, V.V. Computer-aided drug design: from discovery of novel pharmaceutical agents to systems pharmacology. J. Biochem. (Moscow), Supplement Series B: Biomedical Chemistry. 2020, 14, 216–227. [CrossRef]
- Lagunin, A.A.; Rudik, A.V.; Pogodin, P.V.; Savosina, P.I.; Tarasova, O.A.; Dmitriev, A.V.; Ivanov, S.M.; Biziukova, N.Y.; Druzhilovskiy, D.S.; Filimonov, D.A.; Poroikov V.V. CLC-Pred 2.0: A Freely Available Web Application for In Silico Prediction of Human Cell Line Cyto-toxicity and Molecular Mechanisms of Action for Druglike Compounds. Int. J. Mol. Sci. 2023, 24, 1689. [CrossRef]
- Muratov, E.N.; Bajorath, J.; Sheridan, R.P.; Tetko, I.V.; Filimonov, D.; Poroikov, V.; Oprea, T.I.; Baskin, I.I.; Varnek, A.; Roitberg, A.; Isayev, O.; Curtarolo, S.; Fourches, D.; Cohen, Y.; Aspuru-Guzik, A.; Winkler, D.A.; Agrafiotis, D.; Cherkasov, A.; Tropsha, A. QSAR without borders. J. Chem. Soc. Rev. 2020, 49, 3525–3564. [CrossRef]
- Tarasova, O.A.; Urusova, A.F.; Filimonov, D.A.; Nicklaus, M.C.; Zakharov, A.V.; Poroikov, V.V. QSAR Modeling Using Large-Scale Databases: Case Study for HIV-1 Reverse Transcriptase Inhibitors. J. Chem. Inf. Mod. 2015, 55, 1388–1399. [CrossRef]
- Tarasova, O.A.; Rudik, A.V.; Ivanov, S.M.; Lagunin, A.A.; Poroikov, V.V.; Filimonov, D.A. Machine Learning Methods in Antiviral Drug Discovery. In Topics in Medicinal Chemistry; Tarasova, O.A., Rudik, A.V., Ivanov, S.M., Lagunin, A.A., Poroikov, V.V., Filimonov, D.A., Eds.; Springer: Berlin, Heidelberg, 2021, 37, P. 245-279. [CrossRef]
- Kokurkina, G.V.; Dutov, M.D.; Shevelev, S.A.; Popkov, S.V.; Zakharov, A.V.; Poroikov, V.V. Synthesis, antifungal activity and QSAR study of 2-arylhydroxynitroindoles. Eur. J Med Chem. 2011, 46, 4374–4382. [CrossRef]
- Masand, V.H.; Mahajan, D.T.; Patil, K.N.; Dawale, N.E.; Hadda, T.B.; Alafeefy, A.A.; Chinchkhede, K.D. General Unrestricted Structure Activity Relationships based evaluation of quinoxaline derivatives as potential influenza NS1A protein inhibitors. Der Pharma Chemica, 2011, 3, 517–525.
- Masand, V.H.; Devidas, T.; Mahajan, D.T.; Patil, K.N.; Hadda, T.B.; Youssoufi, M.H.; Jawarkar, R.D.; Shibi, I.G. Optimization of Antimalarial Activity of Synthetic Prodiginines: QSAR, GUSAR, and CoMFA analyses. J. Chem. Biol. Drug Des. 2013, 81, 527–536. [CrossRef]
- Khairullina, V.R.; Gerchikov, A.Ya.; Zarudii, F.S. Analysis of the relationship “structure cyclooxygenase-2 inhibitory activity” in the series of di-tret-butylphenol, oxazolone and thiazolone. J. Vestnik Bashk. Univ. 2014, 19, 417-422.
- Hildebrand, C.; Sandoli, D.; Focher, F.; Gambino, J.; Ciarrocchi, G.; Spadari, S.; Wright, G. Structure-activity relationships of N2-substituted guanines as inhibitors of HSV1 and HSV2 thymidine kinases. J. Med. Chem. 1990, 33, 203–206. [CrossRef]
- Manikowski, A.; Lossani, A.; Verri, A.; Gebhardt, B.-M.; Gambino, J.; Focher, F.; Spadari, S.; Wright, G.E. Inhibition of Herpes Simplex Virus Thymidine Kinases by 2-Phenylamino-6-oxopurines and Related Compounds: Structure-Activity Relationships and Antiherpetic Activity in Vivo. J Mol. Biochem. 2006, 48, 3919–3929. [CrossRef]
- Ivanov, A.S.; Veselovsky, A.V.; Dubanov, A.V.; Skvortsov, V.S.; Archakov, A.I. The integral platform “From gene to drug prototype” in silico and in vitro. J. Ross. Khim. Zh. 2006, 1, 18–35.
Figure 1.
General structural formulas of modeled 15-LOX inhibitors based on a series of derivatives of phenol (I), resorcinol (II), anacardic acid (III), dimethoxybenzene (IV,V), alkyl ester of 2-(4-isobutylphenyl) propionic acid (VI), 1, 3-diarylprop-2-yn-1-one (VII), proline (VIII), pyrrole (IX), alkyl ester of 2-methylfuran-3-carbonyl acid (X), ketoprofen (XI), naphthalene (XII), 1,4-di-N-oxide of quinoxaline (XIII), isoflavone (XIV), 4-hydroxy-2-(phenylmethyl)benzofuran (XV), and coumarin (XVI) [75–90].
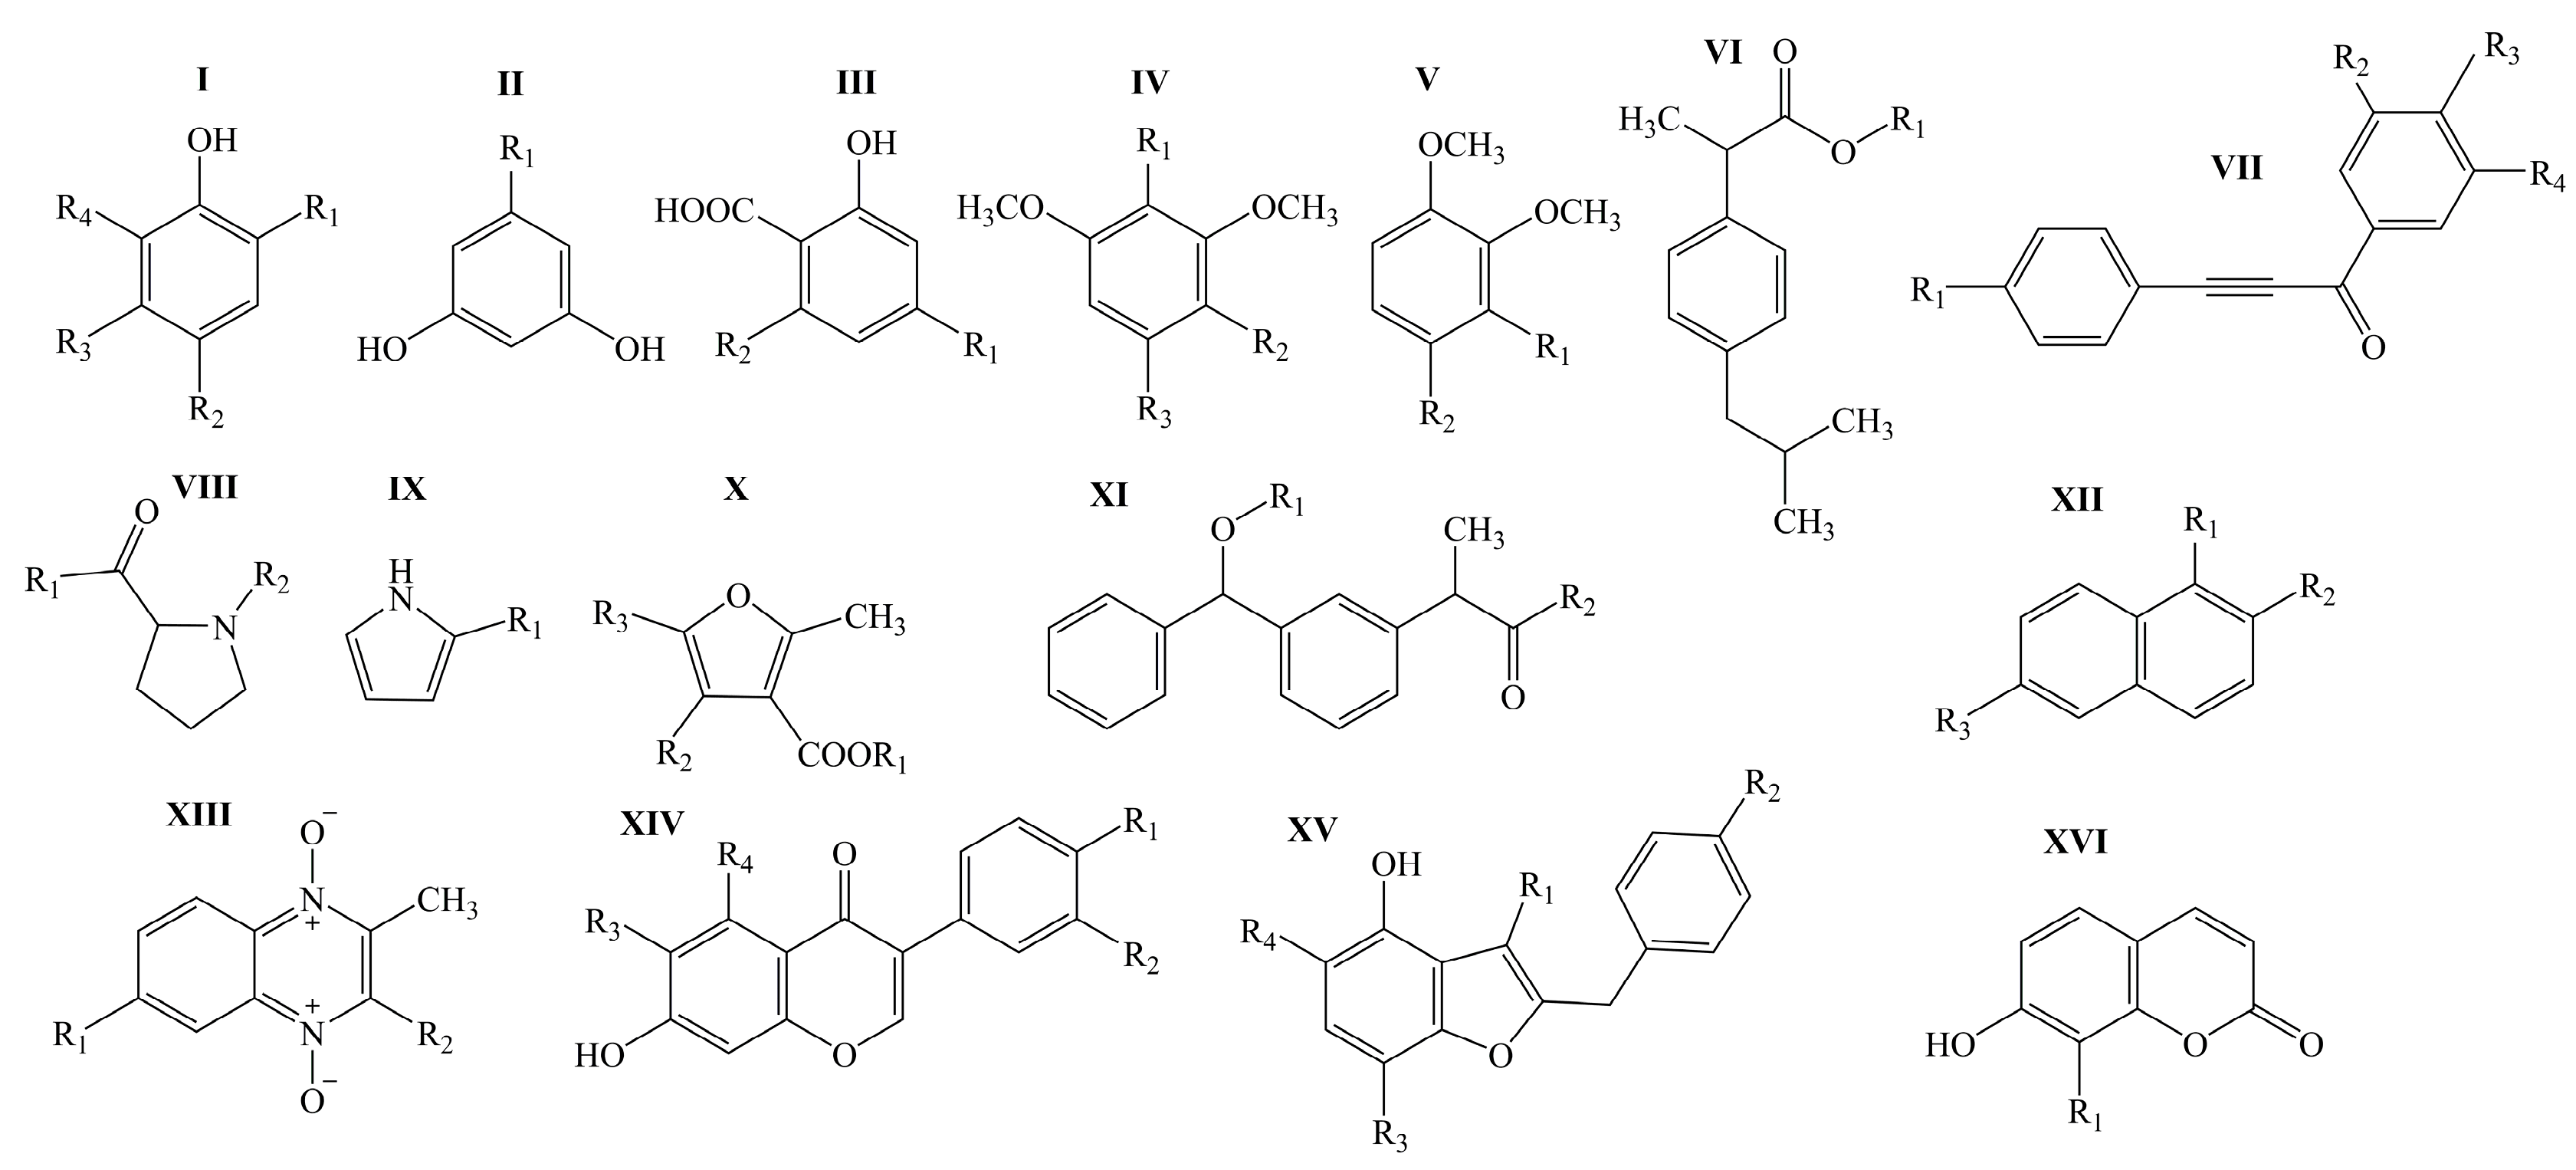
Figure 2.
Comparison of experimental pIC50 values (pIC50exp) with those predicted (pIC50pred) by models M1 to M9 for 15-LOX inhibitors contained in the training set TrS1 using three methods: SCR (a), RBF-SCR (b) and Both (c).
Figure 2.
Comparison of experimental pIC50 values (pIC50exp) with those predicted (pIC50pred) by models M1 to M9 for 15-LOX inhibitors contained in the training set TrS1 using three methods: SCR (a), RBF-SCR (b) and Both (c).
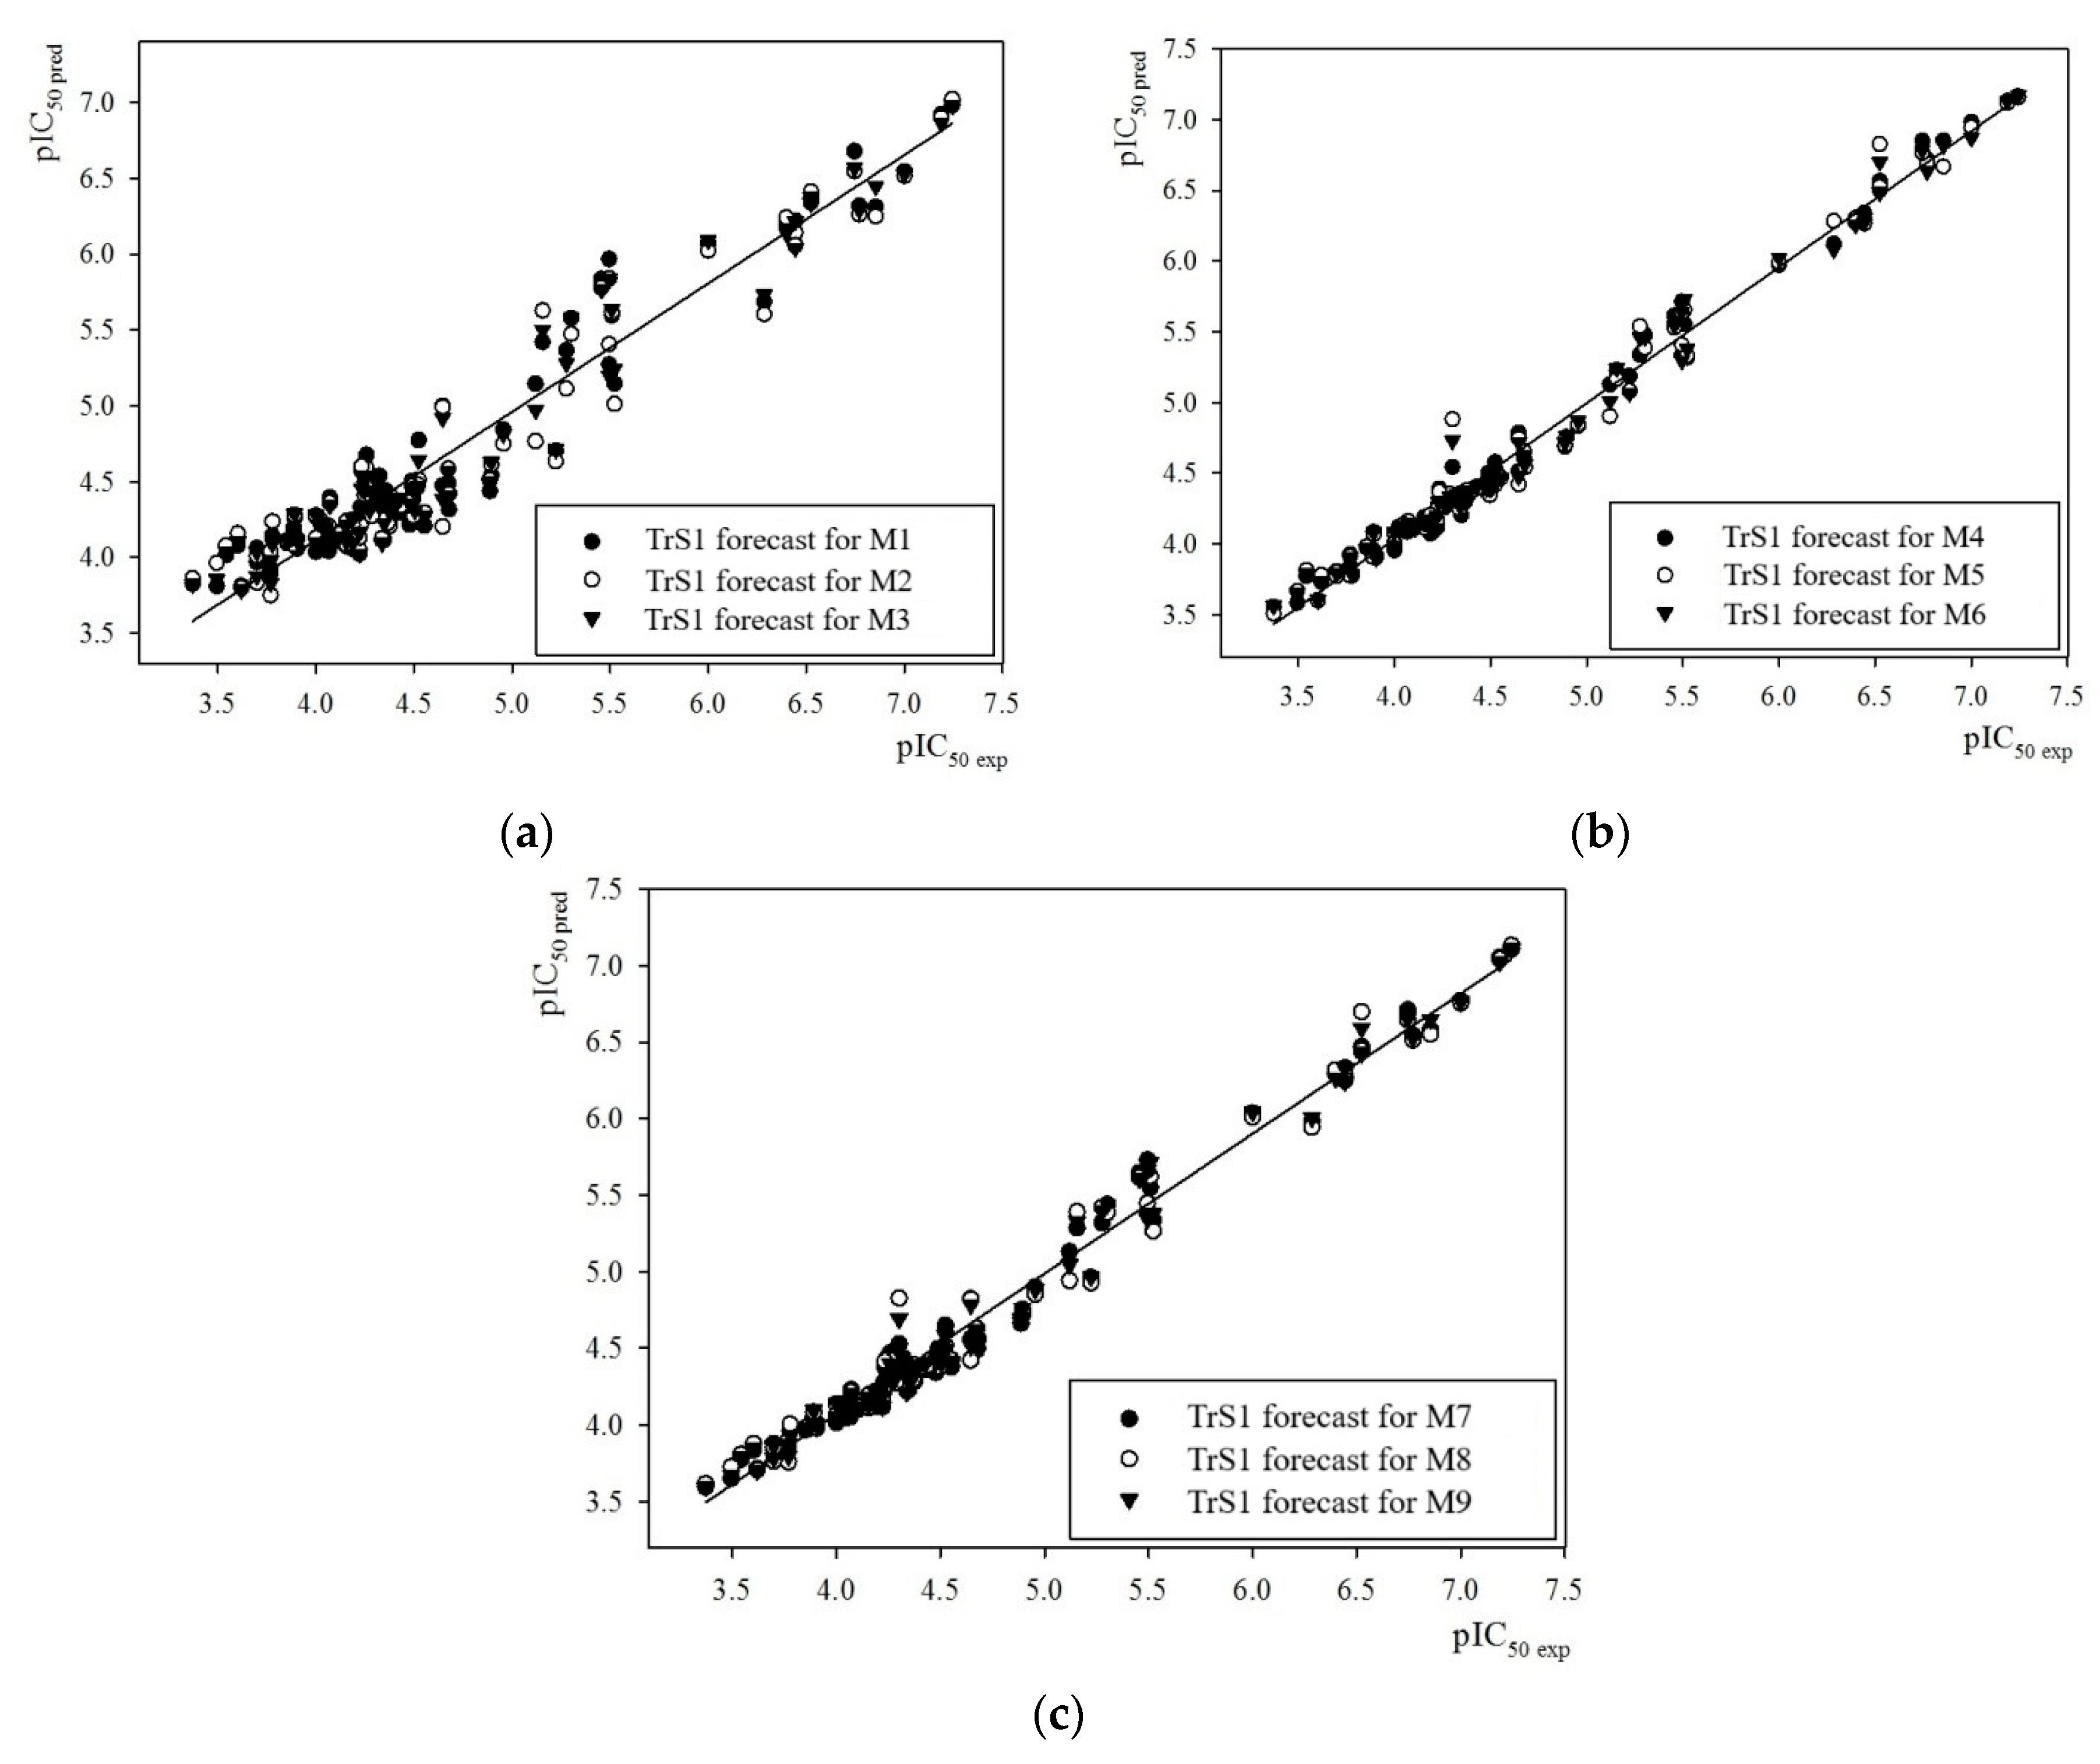
Figure 3.
Decrease in 15-LOX activity as a function of the concentration of inhibitors 1–8.
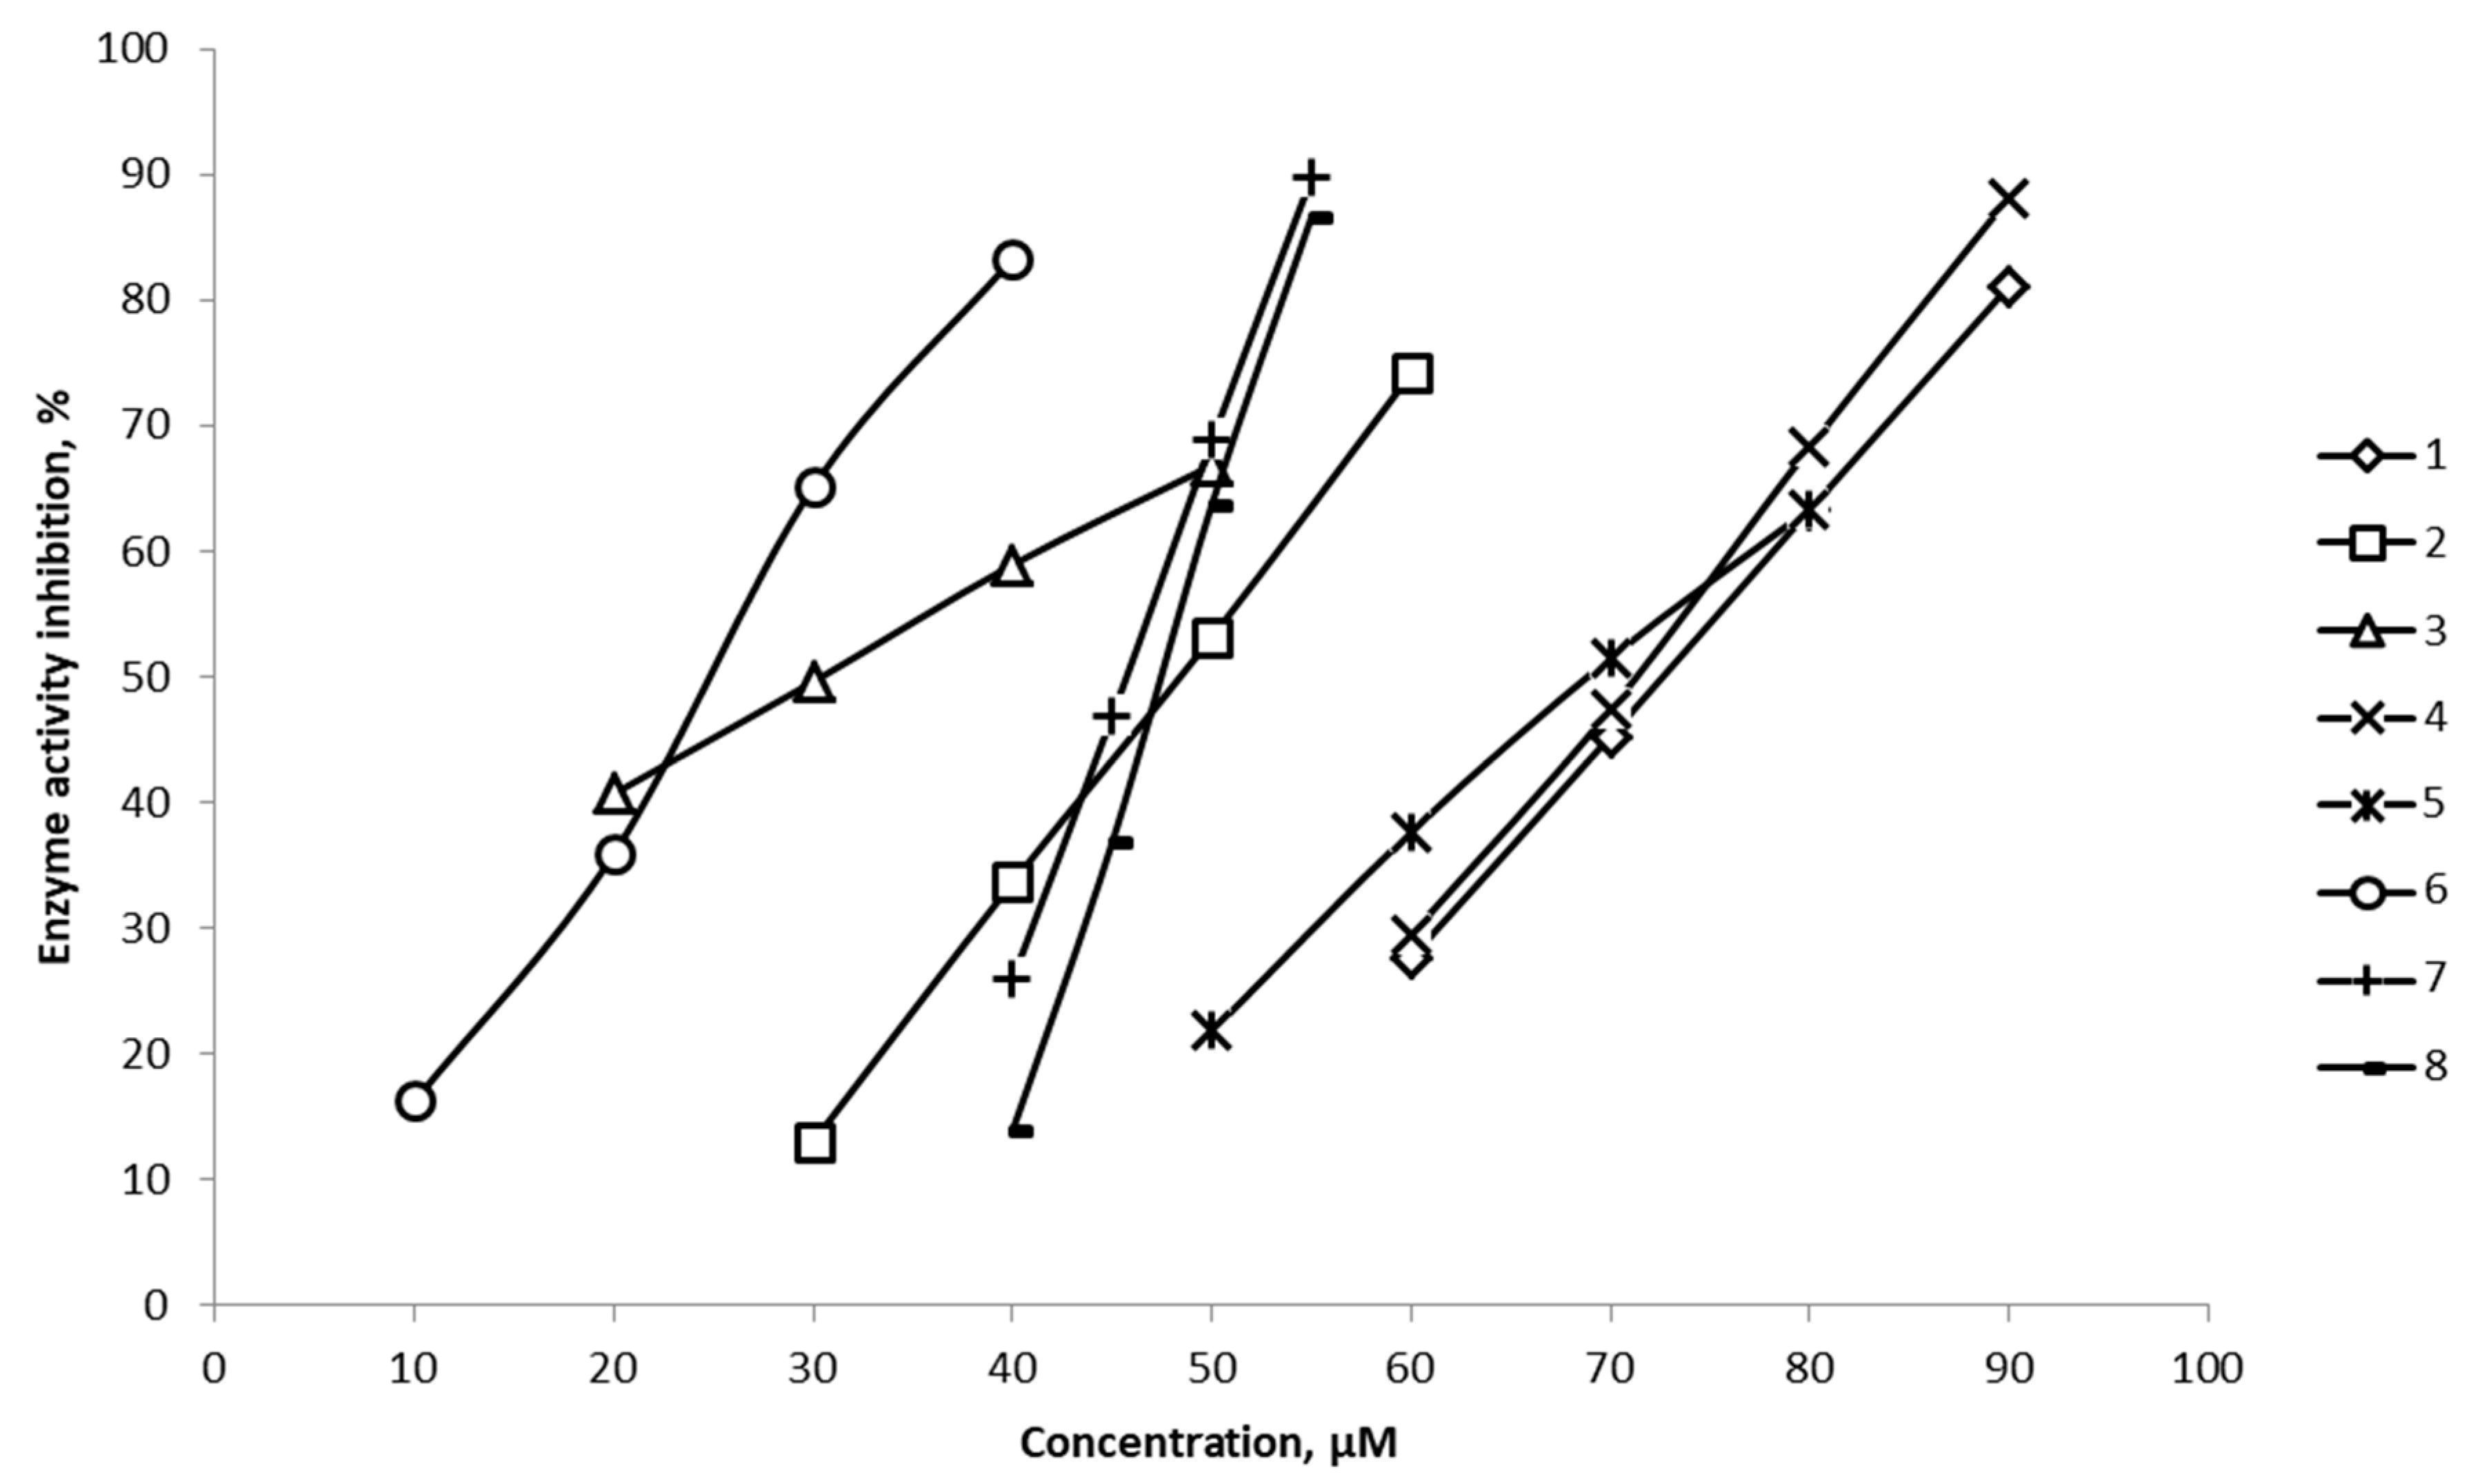
Figure 5.
Schematic representation of the GUSAR algorithm.
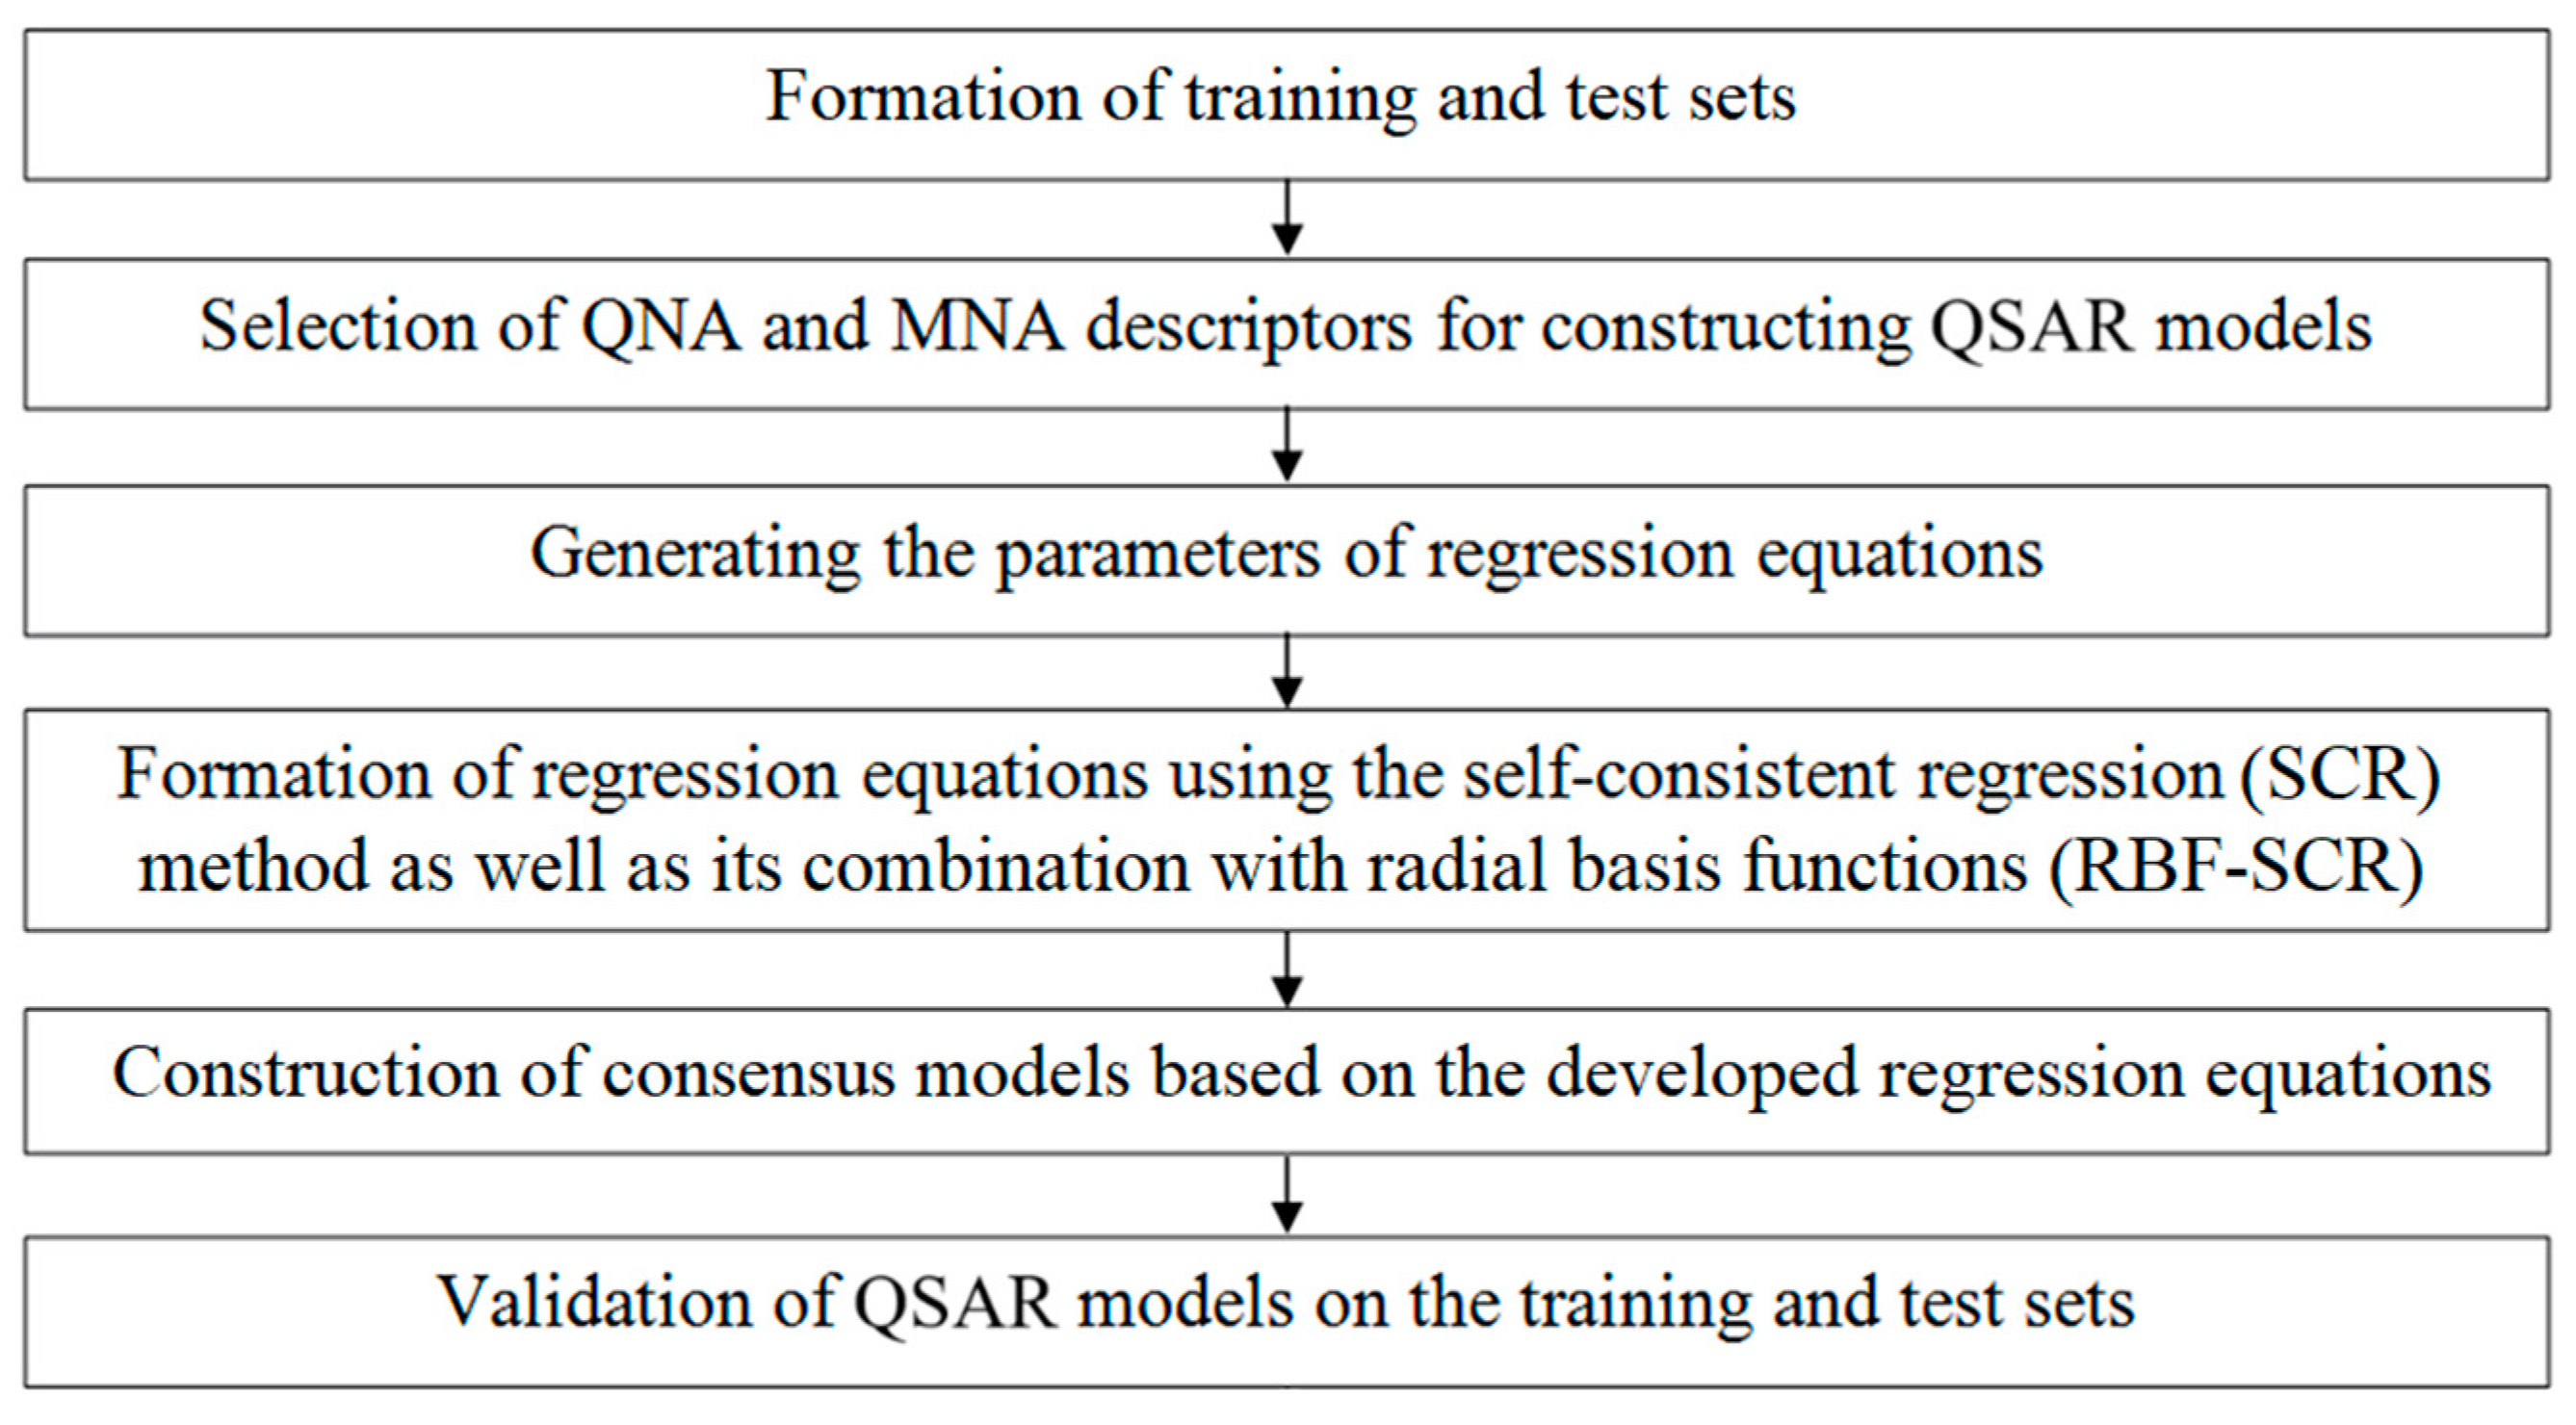
Figure 6.
Chart of constructing the training and test sets and design of the QSAR consensus models M1–M18 (S denotes “set”, TrS and TS are “training and test sets”, respectively, N is the number of compounds included to the corresponding sets and arrays). Designations: (1) S1 are all datasets; (2) S2 is the training set TrS1 for models M1–M9; (3) S3 is the external test set TS1 for models M1–M18; (4) S4 is the training set TrS2 for models M10–M18; (5) S5 is the internal test set TS2 for models M10–M18.
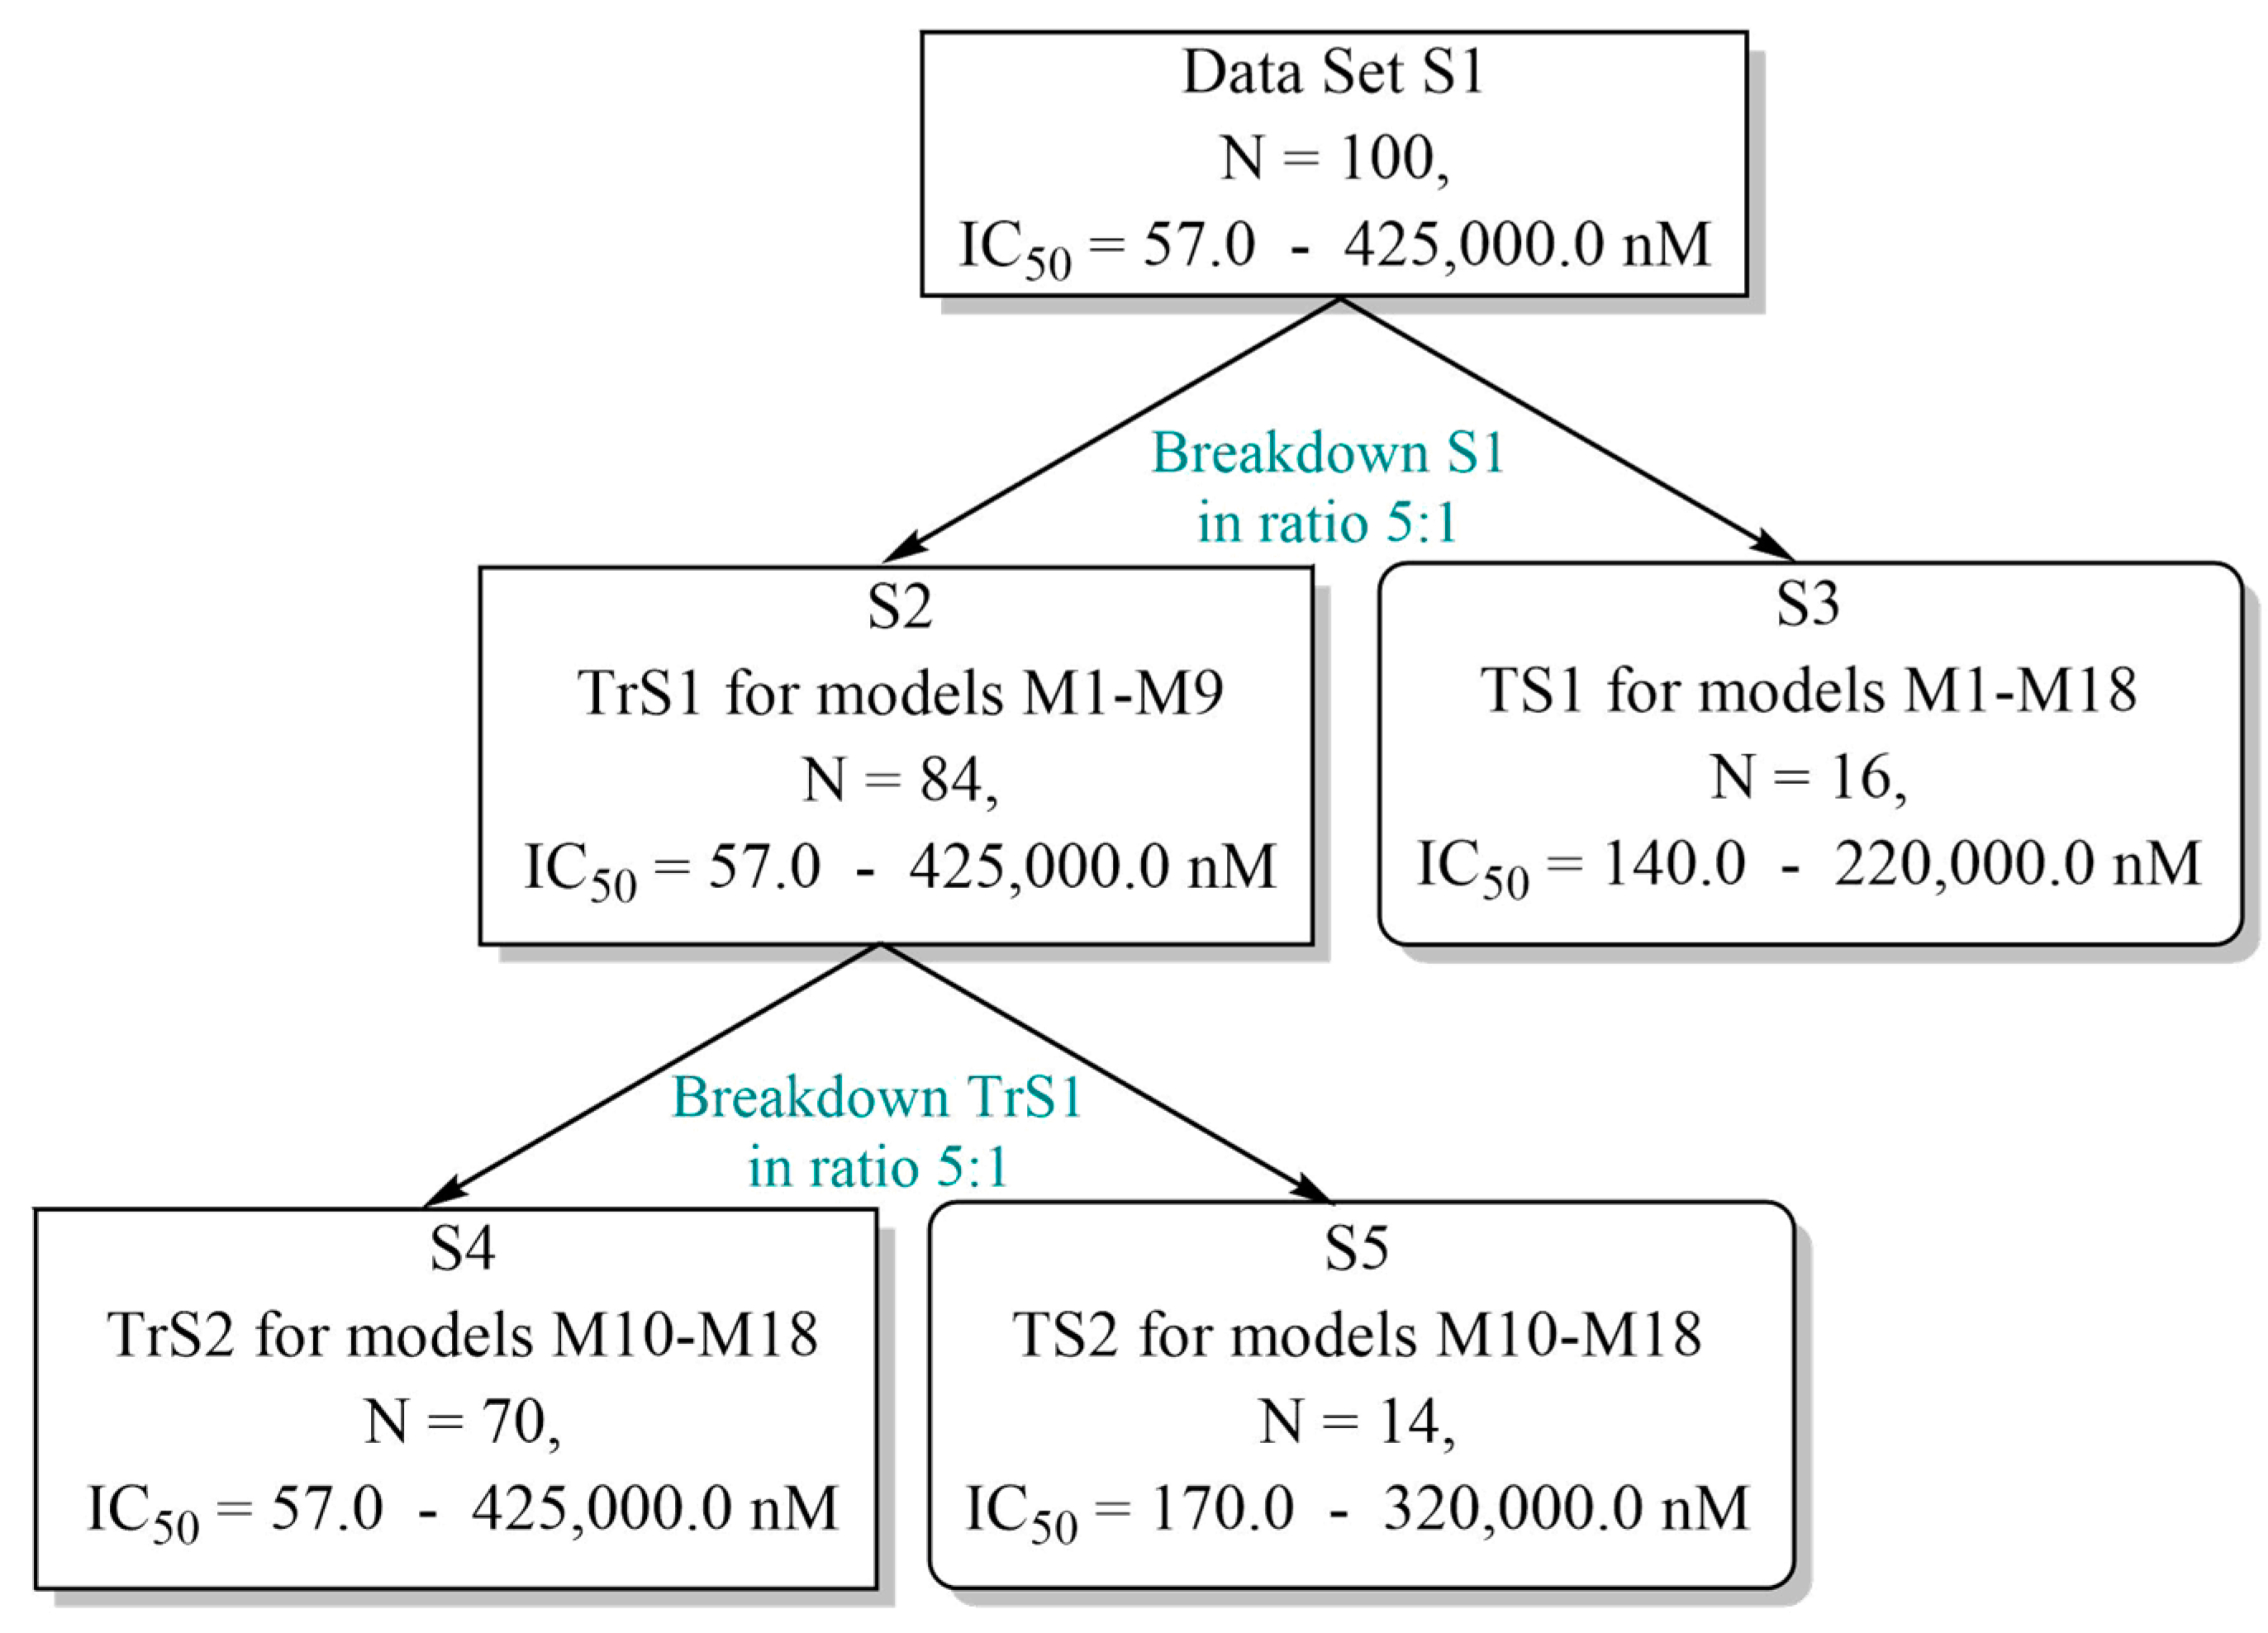
Figure 7.
Structural formulas 1-8 of experimental 15-LOX inhibitors included in the TS3 data set.
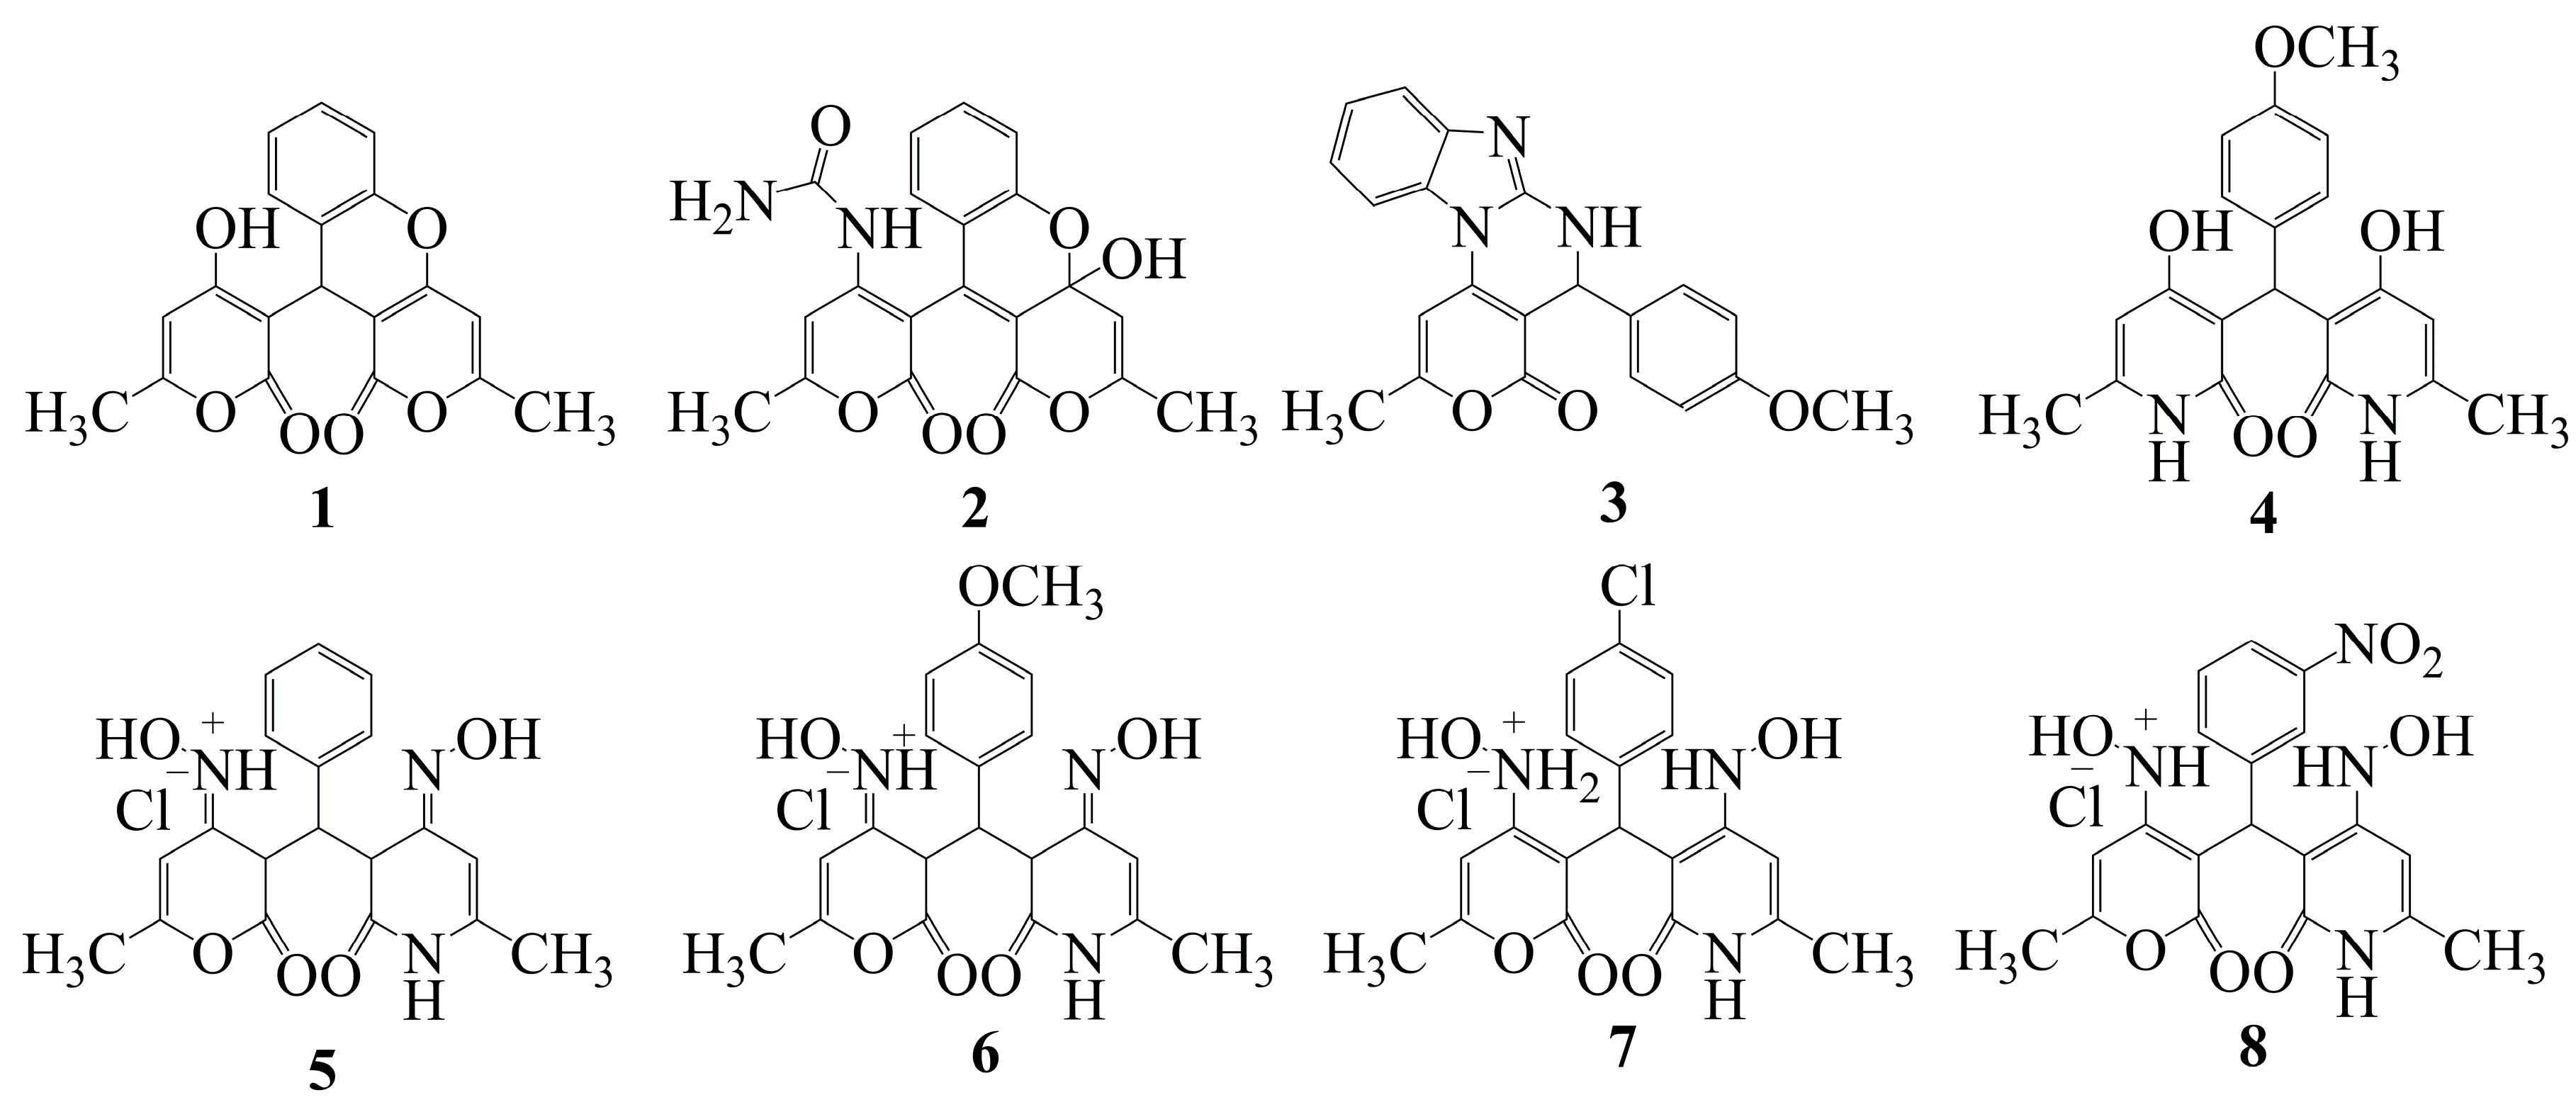

Table 1.
Statistical parameters and accuracy of the predicted pIC50 values of the compounds included in the training sets TrS1–TrS2 within the consensus models M1–M18. pIC50 TrS1 = pIC50 TrS2 = 3.873, pIC50 TS1 = 3.196; pIC50 TS2 = 3.275.
Table 1.
Statistical parameters and accuracy of the predicted pIC50 values of the compounds included in the training sets TrS1–TrS2 within the consensus models M1–M18. pIC50 TrS1 = pIC50 TrS2 = 3.873, pIC50 TS1 = 3.196; pIC50 TS2 = 3.275.
| Training Set | Method | Model | N 1 | NPM | V | A 2 | ||||
|---|---|---|---|---|---|---|---|---|---|---|
| QSAR models based on the QNA descriptors | ||||||||||
| TrS1 | SCR | M1 | 84 | 20 | 0.825 | 0.758 | 10.429 | 0.485 | 17 | 0.067 |
| TrS2 | M10 | 70 | 20 | 0.804 | 0.714 | 7.608 | 0.531 | 15 | 0.090 | |
| TrS1 | RBF-SCR | M4 | 84 | 20 | 0.997 | 0.802 | 14.606 | 0.437 | 17 | 0.195 |
| TrS2 | M13 | 70 | 20 | 0.996 | 0.753 | 10.204 | 0.492 | 15 | 0.243 | |
| TrS1 | Both | M7 | 84 | 20 | 0.962 | 0.800 | 13.026 | 0.443 | 17 | 0.162 |
| TrS2 | M16 | 70 | 20 | 0.959 | 0.759 | 9.264 | 0.491 | 15 | 0.200 | |
| QSAR models based on the MNA descriptors | ||||||||||
| TrS1 | SCR | M2 | 84 | 20 | 0.798 | 0.725 | 8.749 | 0.517 | 16 | 0.073 |
| TrS2 | M11 | 70 | 20 | 0.825 | 0.741 | 6.444 | 0.512 | 17 | 0.084 | |
| TrS1 | RBF-SCR | M5 | 84 | 20 | 0.985 | 0.745 | 11.115 | 0.495 | 16 | 0.240 |
| TrS2 | M14 | 70 | 20 | 0.982 | 0.725 | 7.267 | 0.518 | 17 | 0.257 | |
| TrS1 | Both | M8 | 84 | 20 | 0.955 | 0.760 | 10.365 | 0.486 | 16 | 0.195 |
| TrS2 | M17 | 70 | 20 | 0.959 | 0.759 | 7.170 | 0.495 | 17 | 0.200 | |
| QSAR models based on both QNA and MNA descriptors | ||||||||||
| TrS1 | SCR | M3 | 84 | 320 | 0.842 | 0.777 | 8.747 | 0.480 | 17 | 0.065 |
| TrS2 | M12 | 70 | 320 | 0.842 | 0.766 | 7.067 | 0.499 | 16 | 0.076 | |
| TrS1 | RBF-SCR | M6 | 84 | 320 | 0.991 | 0.783 | 11.373 | 0.460 | 17 | 0.208 |
| TrS2 | M15 | 70 | 320 | 0.99 | 0.769 | 9.189 | 0.480 | 16 | 0.221 | |
| TrS1 | Both | M9 | 84 | 320 | 0.965 | 0.798 | 10.443 | 0.454 | 17 | 0.167 |
| TrS2 | M18 | 70 | 320 | 0.966 | 0.787 | 8.401 | 0.474 | 16 | 0.179 | |
1 N is the number of structures in the training set; NPM is the number of regression equations used for the consensus model; is the coefficient of determination calculated for the compounds of TrSi; is the correlation coefficient calculated for the training set by cross-validation with the exception of one; is Fisher’s criterion; is the standard deviation; V is the number of variables in the final regression equation. 2 .
Table 2.
Range of variability of statistical criteria in assessing the descriptive power of models M1–M18.
Table 2.
Range of variability of statistical criteria in assessing the descriptive power of models M1–M18.
| Criteria | Code of the Training Set | |||||||
|---|---|---|---|---|---|---|---|---|
| TrS1 | TrS2 | |||||||
| 100% data of TrS1 | 95% data of TrS1 | 100% data of TrS2 | 95% data of TrS2 | |||||
| max | min | max | min | max | min | max | min | |
| R2 | М4 | М2 | М4 | М2 | М13, М15 | М10 | М15 | М10 |
| 0.990 | 0.932 | 0.993 | 0.942 | 0.986 | 0.923 | 0.991 | 0.934 | |
| R20 | М4 | М2 | М4 | М2 | М13 | М10 | М15 | М10 |
| 0.989 | 0.920 | 0.992 | 0.933 | 0.985 | 0.914 | 0.991 | 0.934 | |
| R2’0 | М4 | М2 | М4 | М2 | М13 | М10 | М13 | М10 |
| 0.989 | 0.891 | 0.963 | 0.786 | 0.984 | 0.886 | 0.9545 | 0.781 | |
| М4 | М2 | М4 | М2 | М13 | М10 | М13 | М10 | |
| 0.964 | 0.811 | 0.971 | 0.837 | 0.959 | 0.813 | 0.969 | 0.832 | |
| ΔR2m | М2 | М4 | М2 | М4 | М10 | М13 | М10 | М15 |
| 0.067 | 0.009 | 0.057 | 0.006 | 0.071 | 0.012 | 0.062 | 0.008 | |
| CCC | М4 | М2 | М4 | М2 | М13, М15 | М10 | М13, М15 | М10 |
| 0.993 | 0.942 | 0.996 | 0.962 | 0.992 | 0.951 | 0.995 | 0.959 | |
| RMSE | М2 | М4 | М2 | М4 | М10 | М13 | М10 | М14, М15 |
| 0.278 | 0.101 | 0.244 | 0.088 | 0.290 | 0.120 | 0.260 | 0.101 | |
| MAE | М2 | М4 | М2 | М4 | М10 | М13 | М10 | М14 |
| 0.225 | 0.079 | 0.201 | 0.070 | 0.240 | 0.092 | 0.218 | 0.079 | |
| SD | М2 | М4 | М2 | М4 | М11 | М13 | М11 | М15 |
| 0.165 | 0.063 | 0.140 | 0.053 | 0.168 | 0.078 | 0.147 | 0.060 | |
| MAE + 3·SD | М2 | М4 | М2 | М4 | М10 | М13 | М10 | М15 |
| 0.719 | 0.268 | 0.620 | 0.230 | 0.733 | 0.326 | 0.644 | 0.261 | |
Table 3.
Range of variability of statistical criteria in assessing the predictive ability of models M1–M18 using test sets TS1–TS2.
Table 3.
Range of variability of statistical criteria in assessing the predictive ability of models M1–M18 using test sets TS1–TS2.
| Criteria | Code of the Test Set | |||||||
|---|---|---|---|---|---|---|---|---|
| TS1 | TS2 | |||||||
| 100% data of TS1 | 95% data of TS1 | 100% data of TS2 | 95% data of TS2 | |||||
| max | min | max | min | max | min | max | min | |
| R2 | М14 | М9, М12 | М10 | М3 | М13 | М11 | М13 | М11 |
| 0.832 | 0.776 | 0.870 | 0.798 | 0.849 | 0.723 | 0.880 | 0.730 | |
| R20 | М14 | М12 | М10 | М3 | М13 | М11 | М13 | М11 |
| 0.832 | 0.775 | 0.870 | 0.790 | 0.848 | 0.721 | 0.868 | 0.722 | |
| R2’0 | М14 | М9 | М1 | М12 | М13 | М11 | М16 | М11 |
| 0.806 | 0.711 | 0.820 | 0.627 | 0.809 | 0.580 | 0.700 | 0.583 | |
| М14 | М12 | М10 | М3, М12 | М13 | М11 | М13 | М11 | |
| 0.872 | 0.832 | 0.903 | 0.866 | 0.894 | 0.805 | 0.914 | 0.843 | |
| R2m | М14 | М12 | М10 | М3 | М13 | М11 | М13 | М11 |
| 0.828 | 0.774 | 0.869 | 0.783 | 0.845 | 0.716 | 0.868 | 0.673 | |
| CCC | М14 | М9 | М10 | М3 | М13 | М11 | М13 | М11 |
| 0.761 | 0.700 | 0.815 | 0.732 | 0.748 | 0.574 | 0.742 | 0.633 | |
| RMSEP | М1 | М18 | М12 | М1 | М11 | М13 | М11 | М13 |
| 0.147 | 0.040 | 0.123 | 0.016 | 0.204 | 0.118 | 0.186 | 0.104 | |
| MAE | М14 | М9 | М10 | М3 | М13 | М11 | М13 | М11 |
| 0.909 | 0.873 | 0.928 | 0.892 | 0.915 | 0.831 | 0.921 | 0.836 | |
| SD | М12 | М14 | М12 | М13 | М11 | М13 | М11 | М13 |
| 0.441 | 0.384 | 0.406 | 0.338 | 0.497 | 0.367 | 0.433 | 0.342 | |
| MAE + 3·SD | М3 | М13 | М12 | М16 | М11 | М13 | М11 | М13 |
| 0.377 | 0.326 | 0.347 | 0.287 | 0.411 | 0.314 | 0.365 | 0.291 | |
Table 4.
Experimental characterisation of the inhibition of 15-LOX activity in the presence of compounds 1–8.
Table 4.
Experimental characterisation of the inhibition of 15-LOX activity in the presence of compounds 1–8.
| Сompound | Concentration, μM | Enzyme activity inhibition, % | IC50, µmol/l |
| 1 | 60 | 27.62 | 72.5 |
| 70 | 45.25 | ||
| 80 | 63.30 | ||
| 90 | 81.12 | ||
| 2 | 30 | 12.99 | 48.2 |
| 40 | 33.61 | ||
| 50 | 53.12 | ||
| 60 | 74.14 | ||
| 3 | 20 | 40.679 | 30.4 |
| 30 | 49.593 | ||
| 40 | 58.907 | ||
| 50 | 66.821 | ||
| 4 | 60 | 29.47 | 70.8 |
| 70 | 47.37 | ||
| 80 | 68.27 | ||
| 90 | 88.18 | ||
| 5 | 50 | 21.78 | 69.6 |
| 60 | 37.64 | ||
| 70 | 51.49 | ||
| 80 | 63.36 | ||
| 6 | 10 | 16.2134 | 24.9 |
| 20 | 35.8994 | ||
| 30 | 65.0854 | ||
| 40 | 83.2714 | ||
| 7 | 40 | 25.9180 | 45.7 |
| 45 | 46.8465 | ||
| 50 | 68.7750 | ||
| 55 | 89.7035 | ||
| 8 | 40 | 13.886 | 47.4 |
| 45 | 36.793 | ||
| 50 | 63.700 | ||
| 55 | 86.607 |
Table 5.
Results of parameter pIC50 prediction for 15-LOX inhibitors 1–8 by QSAR models M3, M6, M9, M12, M15, M18.
Table 5.
Results of parameter pIC50 prediction for 15-LOX inhibitors 1–8 by QSAR models M3, M6, M9, M12, M15, M18.
| Сompound | pIC50 exp 1 | SCR | RBF-SCR | Both | ||||||
| Model | pIC50 pred | pIC50 2 | Model | pIC50 pred | pIC50 | Model | pIC50 pred | pIC50 | ||
| 1 | 4.140 | M3 | 4.323 | 0.183 | M6 | 4.313 | 0.173 | M9 | 4.267 | 0.127 |
| M12 | 4.301 | 0.161 | M15 | 4.301 | 0.161 | M18 | 4.249 | 0.109 | ||
| 2 | 4.317 | M3 | 4.033 | 0.284 | M6 | 4.063 | 0.254 | M9 | 3.934 | 0.383 |
| M12 | 4.145 | 0.172 | M15 | 4.166 | 0.151 | M18 | 4.054 | 0.263 | ||
| 3 | 4.517 | M3 | 4.086 | 0.431 | M6 | 4.119 | 0.398 | M9 | 4.081 | 0.436 |
| M12 | 4.054 | 0.463 | M15 | 4.112 | 0.405 | M18 | 4.052 | 0.465 | ||
| 4 | 4.150 | M3 | 4.874 | 0.724 | M6 | 4.836 | 0.686 | M9 | 4.823 | 0.673 |
| M12 | 4.840 | 0.690 | M15 | 4.808 | 0.658 | M18 | 4.813 | 0.663 | ||
| 5 | 4.157 | M3 | 4.426 | 0.269 | M6 | 4.389 | 0.232 | M9 | 4.388 | 0.231 |
| M12 | 4.518 | 0.361 | M15 | 4.479 | 0.322 | M18 | 4.493 | 0.336 | ||
| 6 | 4.604 | M3 | 4.403 | 0.201 | M6 | 4.373 | 0.231 | M9 | 4.385 | 0.219 |
| M12 | 4.427 | 0.177 | M15 | 4.398 | 0.206 | M18 | 4.429 | 0.175 | ||
| 7 | 4.340 | M3 | 4.532 | 0.192 | M6 | 4.450 | 0.11 | M9 | 4.501 | 0.161 |
| M12 | 4.635 | 0.295 | M15 | 4.552 | 0.212 | M18 | 4.613 | 0.273 | ||
| 8 | 4.324 | M3 | 4.318 | 0.006 | M6 | 4.290 | 0.034 | M9 | 4.270 | 0.054 |
| M12 | 4.396 | 0.072 | M15 | 4.364 | 0.040 | M18 | 4.362 | 0.038 | ||
1 The experimental determination of the parameter pIC50 for compounds 1–8 is presented in Section III. 2ΔpIC50 = pIC50 pred – pIC50 exp.
Table 6.
Numerical values of error RMSEP and parameter 2·RMSER for models M3, M6, M9, M12, M15, M18 estimated using Xternal Validation Plus 1.2 software based on TS1, TS2.
Table 6.
Numerical values of error RMSEP and parameter 2·RMSER for models M3, M6, M9, M12, M15, M18 estimated using Xternal Validation Plus 1.2 software based on TS1, TS2.
| Model | RMSEP | 2·RMSEP | ||||||
| TS1 | TS2 | TS1 | TS2 | |||||
| 100% data | 95% data | 100% data | 95% data | 100% data | 95% data | 100% data | 95% data | |
| M3 | 0.437 | 0.389 | ‒ | ‒ | 0.874 | 0.778 | ‒ | ‒ |
| M6 | 0.431 | 0.326 | ‒ | ‒ | 0.862 | 0.652 | ‒ | ‒ |
| M9 | 0.440 | 0.375 | ‒ | ‒ | 0.880 | 0.750 | ‒ | ‒ |
| M12 | 0.441 | 0.406 | 0.458 | 0.390 | 0.882 | 0.812 | 0.916 | 0.780 |
| M15 | 0.425 | 0.365 | 0.420 | 0.362 | 0.850 | 0.730 | 0.840 | 0.724 |
| M18 | 0.432 | 0.381 | 0.433 | 0.373 | 0.864 | 0.762 | 0.866 | 0.746 |
Table 7.
Statistical characteristics of the training sets TrS1–TrS2.
| Designation of TrSi | Code of the Training Set | |
| TrS1 | TrS2 | |
| N | 84 | 70 |
| 5.308 | ||
| ∆pIC50 | 3.873 | |
| Thresholds used to evaluate model's forecast | ||
| 0.10 × ∆pIC50 | 0.387 | |
| 0.15 × ∆pIC50 | 0.581 | |
| 0.20 × ∆pIC50 | 0.775 | |
| 0.25 × ∆pIC50 | 0.968 | |
Table 8.
Statistical characteristics of the test sets TS1–TS2.
| Designation of TSi | Code of the Test Set | |
| TS1 | TS2 | |
| N | 84 | 70 |
| 4.765 | 4.678 | |
| ∆pIC50 | 3.196 | 3.275 |
| Distribution of the observed response values of test sets TSi around the test mean | ||
| ± 0.5, % | 37.500 | 50.000 |
| ± 1.0, % | 75.000 | 78.571 |
| ± 1.5, % | 87.500 | 85.714 |
| ± 2.0, % | 93.750 | 92.857 |
| Distribution of the observed response values of test sets TSi around the training mean | ||
| ± 0.5, % | 12.500 | 14.286 |
| ± 1.0, % | 50.000 | 42.857 |
| ± 1.5, % | 87.500 | 85.714 |
| ± 2.0, % | 100.000 | 100.000 |
Table 9.
Criteria for evaluating the descriptive and predictive ability of QSPR M1-M18 models.
| Model quality | High descriptive and predictive ability | Moderate descriptive and predictive ability | Low descriptive and predictive ability |
| Criteria based on R2 | R2 → R20 > 0.8 | R2 → R20 ≤ 0.8 | R2 → R20 ≤ 0.6 |
| > 0.8 | ≤ 0.6 | > 0.5 | |
| ≤ 0.15 | < 0.2 | < 0.2 | |
| CCC > 0.8 | CCC ≤ 0.8 | CCC → 0.7 | |
| Q2LMO > 0.70 | Q2LMO ≤ 0.70 | Q2LMO< 0.60 | |
| Q2F1 > 0.70 | Q2F1 ≤ 0.70 | Q2F1 < 0.60 | |
| Q2F2 > 0.70 | Q2F2 ≤ 0.70 | Q2F2 < 0.60 | |
| А* < 0.3 | А* ≤ 0.3 | А* > 0.3 | |
| MAE | MAE ≤ 0.387 | MAE = (0.387;0.581] | MAE > 0.581 |
| Criteria B** | B ≤ 0.775 | B = (0.775; 0.968] | B > 0.968 |
* The symbol of the parameter characterizing the stability of the model. It is calculated as the difference between the average values of the coefficients R2 and Q2LMO (A = R2-Q2LMO) ** Criteria B are calculated based on the values MAE and SD (B=MAE+3SD).
Disclaimer/Publisher’s Note: The statements, opinions and data contained in all publications are solely those of the individual author(s) and contributor(s) and not of MDPI and/or the editor(s). MDPI and/or the editor(s) disclaim responsibility for any injury to people or property resulting from any ideas, methods, instructions or products referred to in the content. |
© 2024 by the authors. Licensee MDPI, Basel, Switzerland. This article is an open access article distributed under the terms and conditions of the Creative Commons Attribution (CC BY) license (http://creativecommons.org/licenses/by/4.0/).
Copyright: This open access article is published under a Creative Commons CC BY 4.0 license, which permit the free download, distribution, and reuse, provided that the author and preprint are cited in any reuse.


