
Submitted:
05 November 2024
Posted:
05 November 2024
You are already at the latest version
Abstract
This study aimed to develop a novel nanotechnological slow-release drug delivery platform based on hyaluronic acid Microsponge (MSP) for the subcutaneous administration of methotrexate (MTX) in the treatment of rheumatoid arthritis (RA). RA is a chronic autoimmune disease characterized by joint inflammation and damage, while MTX is a common disease-modifying antirheumatic drug (DMARD), the conventional use of which is limited by adverse effects and the lack of release control. In this work, MSP were synthesized as freeze-dried powder to increase their stability and allow for a facile reconstitution prior to administration and precise MTX dosing. These MSP exhibited stable, rounded shapes, with a signature open porosity structure, and achieved a high MTX loading efficiency, with a slow release after injection. Our drug release studies demonstrated indeed an initial burst, followed by sustained release over a month. Remarkably, by means of a (collagen induced - CIA) rat model of RA, the MTX-loaded MSP almost doubled the therapeutic efficacy, by significantly reducing arthritic scores compared to controls. The pre-clinical study was replicated twice to confirm this marked improvement in performance and the safety profile of MSP. The results show the potential of MSP mediated therapy to enhance MTX efficacy in RA treatment by enabling sustained slow-release while minimizing side effects. This study therefore suggests that the MSP platform may be considered in clinical practice for improving the MTX delivery in RA therapy.
Keywords:
microsponge
; rheumatoid arthritis
; methotrexate
; slow delivery system
1. Introduction
Rheumatoid arthritis (RA) is an immune mediated inflammatory disease characterized by hyperplastic synovium, cartilage damage, bone erosion and different systemic manifestations [1]. The disease is defined by the activation of fibroblast-like synoviocytes and the infiltration of monocytes into the joints, where they undergo transformation into macrophages [2]. This perpetuates the chronic nature of the ailment and markedly affects the quality of life of individuals suffering from it. RA affects approximately 0.5% to 1% of the global population, typically emerging between the ages of 25 and 60, but globally the incidence of RA is increasing [3,4]. This disease tends to disproportionately affect women compared to men, requiring several therapeutic interventions throughout the life of a patient to alleviate symptoms [5]. Factors such as infections, trauma, advanced age, abnormal metabolism, and dysfunction in the immune system significantly contribute to the increased risk of developing RA. Individuals with RA experience substantial discomfort, swelling, limited joint mobility, and difficulties in daily activities throughout their life.
The diagnosis of RA primarily relies on clinical assessment, evaluating the characteristics and distribution of joint symptoms, which often begin appearing in hands and feet, notably involving the metacarpophalangeal and metatarsophalangeal joints [6]. The presence of autoantibodies such as rheumatoid factor or anti-citrullinated peptide autoantibodies (ACPAs), along with indicators of systemic inflammation such as elevated erythrocyte sedimentation rate or C-reactive protein, can support diagnosis of RA [7].
The treatment of RA includes several options, e.g., oral medications, non-pharmacological interventions, the use of splints, and, in the final stage, joint replacement surgeries [8]. Initially, the RA treatment primarily focused on using antibodies that target tumor necrosis factor (TNF). Subsequently, drugs capable of modulating the immune system (disease-modifying antirheumatic drugs - DMARDs) were approved for RA treatment, with options falling into synthetic or biologic subcategories [9]. DMARDs are often used in combination with glucocorticoids and non-steroidal anti-inflammatory drugs (NSAIDs) to prevent joint erosion and chronic inflammation. However, the frequent parenteral administration of these drugs can lead to complications such as thrombus formation, hypersensitivity, pain, and increased costs.
Early diagnosis and personalized treatments of RA are crucial for proper management of the disease but current therapeutic options for long term management of such a severe chronical disease are lacking in many ways, determining a clear unmet medical need and a demand for new personalized medicine approaches. Advancements in RA treatment are driven by the expanding selection of targeted therapies propelled by a deeper understanding of pathobiology and complemented by biotechnological advancements.
Among DMARDs, methotrexate (MTX), a derivate of folic acid and aminopterin, is recognized as the primary pharmaceutical choice for managing both RA and juvenile idiopathic arthritis (JIA) due to its relatively low cost and favorable efficacy/safety profile [10,11,12]. Numerous biochemical and cellular mechanisms have been proposed to explain the potent anti-inflammatory and anti-rheumatic effects of MTX. Intracellularly, MTX can stimulate the transition of inflammatory M1 monocytes to anti-inflammatory M2 monocytes, inducing monocyte apoptosis, and inhibiting the activation of fibroblast-like synoviocytes [13]. MTX has demonstrated efficacy in relieving arthritis symptoms and controlling disease progression, whether used as a standalone treatment [13] or in combination with other chemical or biological DMARDs [14,15].
Nevertheless, it should be noted that MTX possesses impactful hepatotoxic properties, potentially causing liver fibrosis in up to 3% of individuals with RA. Furthermore, despite MTX effectiveness in treating RA, the current methods of administration are considered unsatisfactory for treating this pathology [16]. In fact, the choice of MTX route of administration can significantly affect drug bioavailability, influencing both its efficacy and tolerability. The oral route is the most common and convenient method for administering MTX [17]. However, the oral administration of MTX exhibits variable intestinal absorption and non-linear pharmacokinetics. This case-by-case and patient-by-patient variability has significant implications in terms of drug bioavailability and clinical efficacy [18,19,20,21]. Furthermore, the extended use of orally administered MTX may result in both minor adverse and severe effects [22,23,24] that often lead to limited compliance, with more than half of the patients dropping out of therapy or switching to costly biological drugs [17,25].
Over time, the shift from oral therapy to subcutaneous (SC) injection has been recognized as a successful strategy to bypass the gastrointestinal tract [18], but it also is plagued by its own challenges, such as nausea and vomiting [26,27] arising from the increased peak blood levels of MTX [24,28]. Moreover, SC injections are related to discomfort and stress, also impacting patient compliance [27,29].
In this context, options entailing slow delivery of MTX are not available in the market but could offer a way to overcome several of aforementioned limitations. This study illustrates the first pre-clinical results of using a novel slow drug delivery platform (DDP), called Microsponge (MSP) [30], to administer MTX and selectively accumulate it in inflamed and rheumatic joints has been employed.
MSP is a nano-enabled, tunable, biodegradable and biocompatible polymeric delivery platform made of microscale near-spherical particles endowed with a nanoscale open porous structure, capable of effectively entrapping active ingredients/drugs and their subsequent controlled release [31,32]. These sponge-like particles consist of a 3D network of interconnecting voids with a large porous surface and sizeable mechanical properties, ensuring structural stability during drug loading-unloading operations and gradual biodegradation [33].
Some other microsponge systems, usually much larger in size, have been proposed as topical formulations for controlled drug release. For example, when used as inert particles, those microsponges may remain on the skin surface, thereby gradually releasing active ingredients to prevent buildup and enhance treatment safety [34]. Therefore, microsponge-based formulations, as a class of DDP, have the potential to enhance stability, decrease side effects, and positively modify drug release [35,36].
The main goal of this study is to provide a pre-clinical proof-of-concept for the safe and effective deployment of our MSP loaded with MTX in RA treatment, culminating with animal models assays (collagen induced arthritis “CIA” rats) of RA assessed in terms of pathophysiological outcomes and replicate twice for confirmation. Both molecular and morphological parameters were accounted for and compared with results from conventional subcutaneous drug injections.
2. Materials and Methods
2.1. Materials
Di(imidazol-1-yl)methanone (carbonyl di-imidazole, CDI), 2,2′-Diaminodiethyl disulfide dihydrochloride (Cys), [9-(2-carboxy-6-isothiocyanatophenyl)-6-(diethylamino) xanthen-3-ylidene]-diethylazanium-chloride (Rhodamine B isothiocyanate, RBITC), and dipotassium-trisodium-dihydrogen phosphate-hydrogen phosphate-dichloride (phosphate buffered saline, PBS) were obtained from Merck Italia (Milan, Italy). Sodium Hyaluronate (HA, MW 1,590 kDa) was purchased from Lifecore Biomedical (Chaska, MN, USA). Commercially available Methotrexate (Reumaflex prefilled syringe, dose 50 mg/mL, Alfasigma S.p.A., Bologna, Italy) was used. All additional reagents and chemicals employed were analytical grade.
2.2. Synthesis of Microsponge
The synthesis of hyaluronic acid based Microsponge was carried out following previously reported procedure with some modifications [30,37]. 20 mg of Cys dissolved in 300 µL of MilliQ water was added to 30 mg of CDI and the cross-linker (CL) was obtained as precipitate. The mixture was then stirred using a vortex and allowed to incubate for 30 minutes at room temperature. After, to solubilize the precipitate, 50 µL of HCl 5M was added until reaching a final pH between 2 and 4. The MSP are obtained by adding 1 mL of a solution of HA 1% in MilliQ water (w/v) to the cross-linker. After the mix was maintained at 30 °C for 24 hours, a white precipitate was obtained, washed 3 times with MilliQ water, and centrifugated each time for 5 min at 5000 RPM to eliminate unreacted cross-linker and polymer molecules. The precipitate, containing purified MSP, was than frozen for 1 hour at -20 °C and placed in a freeze-dryer (Lyovapor L 300, Buchi, Italy) for 48 hours, with pressure under 0.1 mbar, and a condenser temperature of -60 °C.
2.3. Loading studies
MTX loading in the platform was achieved using the physical adsorption method [38], where 1 mg of lyophilized MSP was reconstituted with 100 µL of an aqueous solution of MTX 15 mg/ml [39,40]. After, the obtained suspension was incubated in a rotary shaker at room temperature for 24 hours. At variable intervals (0, 30 minutes, 1, 2, 3 and 24 hours), the sample was centrifuged at 7,000 rpm at room temperature for 5 min [41]. The drug loading efficiency into MSP was assessed using UV–Visible spectroscopy (Jasco V-550, Jasco Corporation, Japan) to quantify the free MTX present in the supernatant. This method provided an indirect measurement of the amount of drug loaded into the MSP, by analyzing the absorbance peak at 302 nm for MTX and referencing a previously established calibration curve [42].
The percentage of MTX that was successfully incorporated into MSP compared to the initial amount used, expressed as entrapment efficiency (EE), was estimated according to Equation 1. Alternatively, the loading efficiency (LE) of MSP refers to the payload capacity, which indicates the amount of drug encapsulated per unit weight of the MSP, was calculated by equation 2 [40].
Where the MTX loaded amount was obtained by calculating the difference between the initial amount of added MTX and the amount of free MTX in the supernatant.
Once the optimal time for achieving maximum drug entrapment in the MSP was determined, the sample was frozen and placed in a freeze-dryer overnight in dark conditions [36]. This process was carried out to obtain a dosed powder ready to be resuspended immediately before administration in animal studies.
2.4. Endotoxin detection
Since all formulations in this work are intended for subcutaneous (parenteral) administration in a clinical, it is essential that they be sterile and endotoxin-free. This was already accounted for in this study, ensuring that all synthesis procedures underlying our formulations were conducted under laminar air flow conditions, using sterilized solvents and materials to prevent microbial contamination.
Additionally, after synthesis the samples were analyzed to detect the presence of endotoxins by means of ToxinSensor™ Chromogenic LAL Endotoxin Assay Kit by Genescript (Piscataway, NJ, USA). The evaluation of endotoxin levels included MSP and MTX loaded MSP after freeze-drying. For experimental purposes, the samples were reconstituted in endotoxin-free water at a concentration of 1.0 mg/mL. Concurrently, a standard curve was established using known endotoxin concentrations of 0, 0.005, 0.01, 0.025, 0.05, 0.1 EU/mL. Absorbance readings were taken at 545 nm using the GloMax® Discover Microplate reader (Promega, Sunnyvale, CA). Utilizing the standard curve, the endotoxin levels of the samples were determined.
2.5. Particle size, surface charge analysis and morphology studies
The particle size distribution of all samples was analyzed in MilliQ water using a Mastersizer® 3000 Hydro MV (Malvern, United Kingdom), using refractive indexes of 1.33 and 1.52 for water and MSP, respectively. Specifically, the particles were dispersed in water, and each sample underwent 120 seconds of sonication before measurement to achieve a uniform resuspension without particle aggregation. The average particle size was expressed in terms of the volume median diameter d (0.9) [42].
The ζ-potential (PZ) of all samples was measured using dynamic light scattering (DLS) with a Zetasizer Nano 90ZS (Malvern Instruments Ltd., Worcestershire, UK) at 25°C.
Size and charge measurements were conducted in triplicate, and the average value was reported. The morphology of all samples was characterized by optical, confocal fluorescence and scanning electron microscopy experiments.
A field-emission Scanning electron microscopy (FEG-SEM, LEO 1530, Zeiss, Germany) was used to observe MSP dispersed on a SEM sample stub covered with silicon or graphite background.
Fluorescence microscopy experiments were carried out on an Axio-Zoom Scope microscope (Zeiss, Oberchoken, Germany), equipped with an HBO 50 Hg lamp and an AxioCam ICm1 CCD camera. Dry powdery samples were dispersed on glass slides. Confocal laser scanning fluorescence microscopy (CLSFM) experiments were performed using an FV1000 (Olympus, Tokyo, Japan) confocal scanning device interfaced to an OlympusIX 81 inverted microscope. CLSFM measurements were carried out using an oil immersion 60x objective (numerical aperture: 1.35) and 488 nm (Ar) and 543 nm (HeNe) laser for green (MTX) and red (MSP) channel respectively. 3D Volume rendering of the samples investigated were elaborated by Imaris 6.2.1 software (Bitplane, Switzerland). For this purpose, the HA polymer was labelled using the RBITC, as previously reported [36]. Briefly, the fluorescent dye RBITC was dissolved in MillliQ water at a concentration of 1 mg/ml [43]. After, 1 ml of the dye solution was added to the HA solution 1% (w/v) in NaHCO3/Na2CO3 buffer (12 M, pH 9 [44]) and stirred for 12 hours at room temperature in the dark. The resulted mix was then dialyzed against water (3 times, 500 mL per time), using a dialysis membrane (MWCO 12-14 kDa Spectra/Por®), to allow the elimination of residual non-conjugated dyes [45].
2.6. In vitro release profile of MTX from Microsponge
MTX release from MSP was performed using the dialysis method using a dialysis tube (MWCO 12–14 kDa SpectraPore, Spectrum Laboratories Inc., Rancho Dominguez, Canada) [46]. In particular, the lyophilized MTX-MSP was resuspended in 0.1 mL of PBS 1X (pH 7.4) and transferred into the dialysis membrane which was previously soaked overnight in the dissolution medium (PBS, pH 7.4).
The membrane was tied from both ends and immersed in PBS medium maintained at 37 ± 1°C and stirred at 200 rpm. Aliquots were withdrawn periodically at predetermined time interval (from 1 to 8 hours each hour and after 24 hours, up to 1 month), analyzed and then replaced back into the release solution to maintain the volume constant [45]. To quantify the cumulative fraction of MTX released, withdrawn samples were assayed by measuring the absorbance at λ = 302 nm with a spectrophotometer and using a standard curve of MTX concentration. Parallelly, the release profile of methotrexate was compared by placing the free drug inside the dialysis bag, to evaluate its behavior under the same experimental conditions. Additionally, to demonstrate that the ability of the MSP to release MTX was not altered by the lyophilization step following loading, the release profile of the lyophilized sample was compared with that of the centrifuged sample, where the precipitate was resuspended in 0.1 mL PBS. All experiments were conducted independently in triplicate.
2.7. Ethical approval
All experiments were carried out at the Interdepartmental Center for Comparative Medicine, Alternative Techniques and Aquaculture, University of Rome Tor Vergata. All the animal experiments were ethically approved by the Animal-Welfare body (OPBA) and authorized by the Ministry of Health, Legislative Decree no. 26/2014; European Directive 2010/63/UE (Authorization number 763/2021-PR - October 12, 2021). This research was performed and reported according to the animal research: Reporting of In Vivo Experiments (ARRIVE) guidelines (https://arriveguidelines.org/).
2.8. Animal husbandry
A total of 34 female and male Winstar rats aged 9 and 11 weeks (Envigo, Rome, Italy) were used in this study. The animals were acclimatized for 7 days before the experiment and housed under standard conditions: a 12/12-hour light/dark cycles, room temperature of 20±2°C, and 55% relative humidity. The rats were provided with a standard laboratory diet and tap water ad libitum. A veterinary surgeon, responsible for the welfare of laboratory animals, was present during all experiments. Animal care was overseen by trained personnel. Mice were divided into groups, and the number of mice in each group was calculated using G Power Analysis.
2.9. Animal treatment for safety study
In this study, female and male rats were used. Rats were randomly divided into six groups (n = 3), a control group and five treated groups of three animals each:
- (i)
- Control group 0.8 mL of Normal saline (NS) as vehicle);
- (ii)
- MSP 1 mg/rat/0.8 mL in NS;
- (iii)
- MSP 5 mg/rat/0.8 mL in NSL;
- (iv)
- Cross Linker 0.75 mg/rat/0.8 mL in NS;
- (v)
- Cross Linker 3.75 mg/rat/0.8 mL in NS;
- (vi)
- Hyaluronic acid 0.25 mg/rat/0.8 mL in NS.
To determine a safe concentration of MSP, two doses were tested in this experiment: 1 mg and 5 mg. Additionally, the individual components of MSP, CL and HA, were also evaluated. The quantities of these individual components were calculated based on the ratio of CL to HA in MSP, which is approximately 1:4. For hyaluronic acid, only one dose, equivalent to 1 mg of MSP, was selected, because according to literature data, the widely used hyaluronic acid generally does not exhibit significant toxicological effects, and its safety profile is well-established and recognized [47]. By excluding this group, we ensured compliance with ethical standards while maintaining the integrity and relevance of the study’s findings. Instead, about the cross-linker, both doses, corresponding to the amounts present in 1 mg and 5 mg of MSP, were evaluated.
All animals received a single subcutaneous injection on day one of the experimental plan (Figure 1). On the ninth day post-injection, the rats were sacrificed, and histopathological studies were conducted.
2.10. Animal treatment for efficacy study
Seventeen rats were randomly divided into five groups of four or three rats each. Four groups were immunized intradermally with 200 μg Type II collagen from bovine tracheal cartilage (Sigma C1188) in 0.05 M acetic acid/rat/100 μl emulsified with an equal volume of incomplete Freund’s adjuvant (IFA) (Chondrex, Redmond, WA, USA) on day 7 to induce RA. A boost injection of 100 μg collagen-IFA suspension was given in the same manner on day 15 (Figure 2).
In the first experiment conducted, the animals were randomized into the following experimental groups:
- (i)
- healthy non-arthritic as negative control;
- (ii)
- arthritic untreated as positive control;
From day 22 to 42, immunized groups were subcutaneously administered with a single injection every week of:
- (i)
- MTX 0.125 mg/rat in 0.1 mL NS for MTX group;
- (ii)
- MSP 1mg/rat in 0.1 mL NS; for MSP group;
- (iii)
- 1mg/rat in 0.1 mL NS; for MTX-loaded MSP Lyophilized.
Meanwhile, in the second study, the experimental design included:
- (i)
- Positive control group: untreated arthritic rats;
- (ii)
- MSP group: arthritic rats treated with 1.5 mg MSP/rat in 0.1 mL NS;
- (iii)
- MTX group: arthritic rats treated with 0.125 mg MTX/rat in 0.1 mL NS;
- (iv)
- MTX-MSP centrifuged group: arthritic rats treated with 1.5 mg MTX-MSP centrifuged/rat in 0.1 mL NS;
- (v)
- MTX-MPS lyophilized group: arthritic rats treated with 1.5 mg MTX-MSP lyophilized/rat in 0.1 mL NS;
In the design of the second experiment, variations were made to the groups: specifically, a higher amount of MSP (1.5 mg) was used while keeping the loaded methotrexate concentration constant and both the centrifuged and lyophilized samples were evaluated.
All animals were anesthetized with Ketamine 70 mg/Kg and Medetomidine Chlorhydrate 0.1 mg/Kg and sacrificed by intracardiac blood sampling with subsequent aortic arch recession on day 43. In the first experiment, both posterior knees and serum were collected for analysis while in the second experiment, only the right knees were collected. For each rat, an aliquot of about 1 mL of blood was used for obtaining serum, and an aliquot of about 0.5 mL of blood was used to make the blood cell count.
2.11. Measurement of hematological parameters
For determination of hematological parameters, 20 µL of whole blood, collected in K2EDTA microtainers (Becton, Dickinson and Company, USA), were analyzed using the commercially available automated cell counter “Drew3” (BPC BioSed s.r.l., Italy). For cytomorphological examination, each sample from peripheral blood smears was prepared using the differential staining Diff-Quick (Dade SpA, Italy) and analyzed under optical microscopy. The complete blood count (CBC) includes: haemoglobin (HGB), haematocrit (HCT), red blood cell (RBC) count, white blood cell (WBC) count, platelet count (PLT), red cell distribution width (RDW), mean corpuscular volume (MCV), mean platelet volume (MPV), mean corpuscular volume (MCV), mean corpuscular haemoglobin (MCH), mean corpuscular haemoglobin concentration (MCHC), red cell distribution width (RDW), lymphocytes (LYMF), mid-range cells (MID), granulocytes (GRAN), platelet distribution width (PDW), platelet large cell ratio (LPCR), plateletcrit (PCT).
2.12. Detection of spleen index and thymus index
After the measurement of rat weight, rats were sacrificed. The spleen and thymus were isolated from rats and weighed immediately. Thymus index and spleen index were analyzed based on the following equation: Thymus index or spleen index = (weight of thymus or spleen)/body weight.
2.13. Histological analysis
For the toxicological study lung, liver, kidney and spleen have been formalin fixed and paraffin embedded. Architectural modification, as well as the presence of inflammatory infiltrate, have been evaluated on 4-µm serial section stained with haematoxylin and eosin (H&E) (see Table 1). Right hind limbs were formalin fixed, then decalcified in 0.5 M EDTA and 0.5% paraformaldehyde for 24h. Decalcified samples were dehydrated an alcohol series, cleared with xylene, and paraffin embedded. Five-micrometer thick sections of talocrural joint sections were stained with H&E and mounted on glass slides for histological analysis by light microscopy. Histopathological changes of the joint were evaluated based on morphological parameters (structure, cells, matrix and tidemark) using a cumulative score ranging from 0 to 11 points. Higher scores indicate greater tissue damage. Criteria used to evaluate the histopathological score are shown in Table 2.
2.14. Cytokine and antibody α-collagen ELISA assays
IL1-β quantification in rat serum was performed using an ELISA kit (BMS630, Invitrogen) according to the manufacturer’s instructions.
Antibody levels to type II collagen were measured using an enzyme-linked immunosorbent assay (ELISA) technique. Ninety-six-well plates were coated with type II collagen (Sigma C1188) diluted (final concentration 2 µg/mL) in 100 µL of phosphate buffer (pH 9.3), then incubated overnight, washed three times and blocked using PBS containing 1% bovine serum albumin (PBS-BSA) for 1h. The sera were incubated (37°C, 1 h) with 100 µL of serum (1:100). After the incubation with sera, all plates were incubated (37°C, 1 h) with anti-rat IgG secondary antibody HRP-conjugated (Invitrogen, Italy). The absorbance (OD) at 495 nm of antigen- and buffer-coated wells was measured, and the difference in mean OD values was calculated. All samples were assayed in duplicate to increase precision.
2.15. Statistical analyses
Experiments were repeated 3 times. Data were reported as the mean values ± standard error of the mean (SEM) or standard deviation (SD).
To calculate the size of each in vivo treatment group G*Power 3.1 power analysis software was used, considering an 80% probability of detecting the difference and α error of 0.05.
For the analysis of data derived from in vitro experiments, differences in means were assessed for statistical significance using ANOVA and Tukey tests, with p values < 0.05 considered significant.
Statistical comparisons between animal groups were performed using a 2-Way ANOVA, with p values < 0.05 considered to be statistically significant.
GraphPad Prism version 7.0 statistical software (GraphPad Software Inc., San Diego, CA, USA) was used for all statistical analyses and graphs.
3. Results and Discussion
This study was designed as a proof-of-concept preclinical trial aimed at evaluating the safety and efficacy of the MSP. In particular, the focus of this investigation was the use of MSP technology to deliver methotrexate, a drug currently used in the management of RA, via subcutaneous administration.
3.1. Physico-chemical characterization of unloaded and loaded Microsponge
Hyaluronic acid-based MPS were synthesized using an established one-pot self-precipitation/cross-linking method [30,37]. In contrast to previous studies, the hyaluronic acid utilized in this work has a higher molecular weight (1,590 kDa), compared to the reported ranges (20–70 kDa [36] and 1,200 kDa [48], However, the synthesis steps remained unchanged to maintain the patented platform. This choice was based on literature, suggesting that high molecular weight HA exhibits anti-angiogenic and anti-inflammatory properties [49].
After synthesis, all formulations were freeze-dried, converting the suspension into a powder. A well-designed freeze-drying cycle ensures both the physical and chemical stability of the final formulation, thereby prolonging its long-term conservation. It also allows for adjusting concentration and dispersant type during reconstitution, facilitating easy redispersion for parental administration.
Generally, the freeze-drying process involves: (i) initial freezing of the suspension, (ii) primary drying, during which water is removed from the formulation by sublimation without passing through a liquid phase, and (iii) secondary drying, which removes any adsorbed surface-bound water and reduces residual moisture content, resulting in a free-flowing dry powder. However, a drug delivery platform may be damaged during lyophilization and/or subsequent rehydration if appropriate stabilizers are not used. Such instability can lead to aggregation and coalescence of MSP into significantly larger constructs [46]. Cryoprotectants were not used in MSP formulation because, SEM analysis (Figure 3) revealed no evidence of morphological instability. This is evident by comparing panels A and B, for empty MSP and panels C and D, for loaded MSP. The result was confirmed by particle size analysis using the same technique (Table 3), showing no significant changes between filled and empty samples, before and after lyophilization. Moreover, all synthetized MSP displayed a spherical shape of nano-sized porous surface with a homogenous population (Figure 3, Panel E).
To achieve effective loading of MTX on the porous surface of the MSP through physical absorption, lyophilized MSP were exposed to a MTX solution. For drug loading studies, the lyophilized formulation was used because according to Crotts and Park [50], the lyophilization process leaves pores open and available for drug loading by removing solvent (water).
Absorbance measurements were taken on centrifuged samples at different time intervals to determine the time required to achieve maximum drug absorption.
As shown in Figure 4, after 3 hours of contact, the MSP retained 91.76% of the initially loaded dose, expressed as entrapment efficiency, which corresponds to 0.125 mg of MTX. This result is promising for the in vivo studies, as the recommended weekly dose of MTX for humans is 7.5-15 mg [51]. When adjusted for rats, the equivalent acceptable range for this study is 0.11-0.23 mg/week, based on dosage conversion criteria between animals and humans [52].
Results are presented as the average ± standard deviation (SD) (n = 3).
After 24 hours, the data remained unchanged (data not shown), which is why 3 hours was established as the optimal time for drug loading.
Analysis of the loading capacity of the MSP for MTX at the used concentration reveals that it is approximately of 110% at the 3-hour mark. This result indicates that 1 mg of MSP can effectively entrap the loaded MTX. The observed excess in the maximum amount of loaded capacity can be explained by the fact that the amount of MSP used in this experiment is fully capable of accommodating the MTX within the MSP pores [40]. In fact, when using 10 mg of MSP while maintaining a constant MTX concentration, the loading efficiency percentage decrease (data not shown).
This finding is also confirmed by the data obtained by fluorescence confocal microscopy (Figure 3, Panel F, and Figure S1, in Supporting Information). The image is acquired in xyz mode and 4x optical zoom and is shown in volume rendering with isosurfaces for the green and red channels. It shows that MTX (in green) is primarily localized within the pores of MSP (in red). Since drug loading is achieved through physical adsorption, the interaction between MTX and MSP is crucial to ensure strong drug-support interactions. According to a recent study [53], computational approaches suggest that MTX absorption on the HA surface within MSP pores is primarily due to polar covalent and electrostatic bonding in aqueous mediums [36].
Following, the sample was freeze-dried. This technique is commonly and widely used in the pharmaceutical industry to stabilize drugs, vaccines, antibodies, and other biological materials [54]. According to the literature, this process preserves API and its activity. However, it does not guarantee that the physical state of the final formulation remains unchanged [55]. To ensure that not only the morphology and size were not altered by this technique but also that the drug itself was stable, the MTX spectrum was analyzed. As shown in Figure 3, Panel G, no significant changes were observed in MTX spectra, confirming the stability of the MTX-MSP formulation after freeze-drying. Additionally, Panel H (Figure 3) shows that the formulation can be easily reconstituted within seconds, indicating no particles aggregation [39].
Table 4 shows the average particle size, expressed as 90th percentile, and ζ-potential values of empty MPS and MTX-MPS reconstituted after lyophilization.
Photon correlation spectroscopy revealed a particle size d (0.9) of 34.5 µm for empty MSP resuspended after freeze-drying. After the addition of MTX, the particle size significantly increased to 60.8 µm, indicating successfully drug loading into the MSP [56].
The ζ-potential values were measured as −36 mV for empty MSP and – 43 mV for MTX-MSP. According with the literature [57], particles with a ζ-potential higher than +30 mV or less than −30 mV typically exhibit steric stabilization due to electrostatic repulsion forces, which prevent agglomeration. This suggests that the achieved ζ-potential values ensure steric stabilization and maintain the physical stability of the formulation. These findings indicate that both the composition and synthesis processes used in this work make the samples electrically stable. Additionally, the negatively charged particles demonstrate enhanced lymphatic uptake and prolonged retention time [57].
Manufactured samples must be free of microbial agents to protect tissues and reduce patient inflammatory and immune responses. Microbial agents can be introduced through raw materials or the manufacturing process. To ensure the absence of such agents, all samples were tested for endotoxin contamination. Endotoxins, which are lipopolysaccharides (LPS) from Gram-negative bacteria, are a common cause of toxic reactions due to pyrogens. Endotoxin assays test for viable Gram-negative bacteria and also detect LPS from dead bacteria. Therefore, the absence of LPS indicates an absence of pyrogens. In this study, samples were tested for endotoxins using a Limulus Amebocyte Lysate (LAL) assay. The results, shown in Table 4, indicated that each sample contained very low levels of endotoxin n each sample (below 0.01 EU/mL) [58]. This is significantly lower than the threshold for being considered endotoxin-free (0.5 EU/mL) [59]. These results confirm the suitability of the developed formulations for subcutaneous administration.
3.2. MTX release studies from Microsponge
The in vitro release of MTX from the loaded MSP was evaluated using a dialysis membrane and compared to the release profile of the free drug. Additionally, to assess whether the lyophilization technique altered the release capacity of the platform, release profiles of MTX from both lyophilized and centrifuged formulations were evaluated and compared.
As shown in Figure 5, the conventional formulation (free MTX) released 50 % of the drug load after 30 minutes and was completely exhausted within 2 hours. In contrast, both MSP formulations exhibited an initial burst release followed by a sustained release phase, lasting over 30 days. Moreover, the freeze-drying step did not significantly modify the release profile of MTX.
The absence of an initial burst release at the time zero from the formulation confirms the absence of non-encapsulated MTX on the exterior of the MSP. The MTX release reached about 14.51 % during the first few hours of the experiment, followed by a drastic drop in release-rate after 3 hours, indicating the onset of prolonged drug release from the MSP, thereafter lasting up and beyond 1 month. Initially, the rapid release of the drug from the MSP could be attributed to the superficial MTX adsorbed on the porous surface, while the sustained release suggests that most of the drug is retained within the nano-sized pores [60]. Furthermore, the drug release from the MSP is also controlled by interactions between MTX and hyaluronic acid. In fact, the slow release of the drug from the MSPs can be explained by the results obtained by Faizul Azam et al. [53]. By all-atom molecular dynamics simulations, they showed that the HA-MTX complex is extremely stable in an aqueous solution, preventing the premature release of MTX immediately after resuspension at the time of administration.
These findings support that the developed hyaluronic acid-based MSP are a promising drug platform for MTX, especially for RA.
3.3. In vivo safety study
As an initial step toward a preclinical evaluation, an in vivo safety experiment was conducted to evaluate the potential effects on target organs following a single injection of empty MSP and its individual components in a healthy animal model using both male and female Wistar rats. The study assessed the effect of a single subcutaneous dose of MSP on the structure and function of the liver, lungs, kidneys, and spleen of the rats. At sacrifice, blood, liver, kidneys, spleen, and lungs samples were collected for histological examination.
As shown in Figure 1, animals were weighed three times: (i) before the administration of MSP, (ii) on day 4 after MSP administration, and (iii) the day before sacrifice.
No significant body weight differences were observed between experimental and control groups (Figure 6). No adverse effects on body weights were noted in either sex throughout the study. No clinical signs of morbidity or mortality were observed during the study.
Blood count parameters (Table S1, in Supporting Information) and histopathological evaluations (Figure 7 and Figure S1 and Table 5 and Table S1) displayed no anomalies. In particular, no significant macroscopic differences were observed at necropsy, and no macroscopic or microscopic changes were reported.
Any histopathological change in examined organs did not reach statistical significance. Based on a combined score of architectural damage and inflammation (Table 5 and Table S2), histopathological evaluation revealed in fact no abnormalities related to the subcutaneous injection of MSP or its components.
In conclusion, the single subcutaneous administration of two different doses of MSP (1 mg and 5 mg), and their respective components (CL and HA), was well tolerated in rats and caused no adverse clinical or anatomical pathology findings, proving the safety of the DDP.
3.4. In vivo efficacy study
Following the safety study, encompassing doses from 1 mg to 5 mg of MSP, we proceeded to conduct our preclinical studies, starting with an experiment using a dose of 1 mg of MSP and 0.125 mg of MTX. The study investigated the efficacy of weekly subcutaneous treatment with MTX-loaded MSP compared to MTX alone, in the CIA rat model. At sacrifice, blood samples and knee joints were collected (Figure 2). The therapeutic efficacy of MTX loaded delivery platform was evaluated in terms of the histopathological RA score, a key parameter for assessing the anti-inflammatory effect.
This specific histological RA score was evaluated for both posterior knees of the CIA animals. Similar body weight trends were observed in rats from several treated groups compared to the positive and negative control groups, without significant variations (Figure 8, Panel a).
To confirm RA induction in the positive control group and study post-RA induction changes in rats, the expression levels of autoreactive antibodies against CII (CII-specific IgG) were evaluated in the serum samples collected at the end of the experiment. The Anti-CII antibody levels in the positive control group and the empty MSP group were significantly higher than those in the negative control group (Figure 8, Panel b).
The results suggest that treatments with free MTX and MTX-loaded MSP positively affected the pathology, influencing the levels of expression of antibodies against CII. Though not statistically significant compared to the positive control, a clear downward trend in antibody expression levels was observed in the treated groups, hinting to an improvement in therapeutic efficacy of MTX-MSP.
To assess the impact of treatments on immune organ indices, spleen and thymus weights were measured at the end of the experiment to calculate thymus and spleen indices. Treatments had a non-significant effect on both indices compared to both negative and positive control rats. No statistically significant differences were observed between groups (Figure 9, Panel a and b).
To evaluate the impact of weekly MTX-loaded MSP subcutaneous treatment on joint destruction, both posterior joints were analyzed histologically (Figure 10, Panel a).
H&E staining of both hind limbs in the negative control group revealed normal structure, normal cellular organization, matrix staining, and tidemark integrity. Conversely, as expected, the analysis of RA rats in the positive control group showed structural irregularities, cellular clusters, reduced matrix staining, and altered tidemark integrity. These modifications were reflected in increased RA score in both limbs (Figure 10, Panel b). The average values used to calculate the RA score are reported in Tables S3, S4, and S5 (in Supporting Information). The histological RA scores for individual treated groups are presented in Figure 10, showing pooled data of both knees (Panel b), the score for the right (Panel c) and left limb (Panel d).
Figure 10 (Panel b) presents the RA score calculated as the total sum of the analyzed knees. Treatment with MSP alone significantly reduces the RA score. An even more pronounced reduction was observed in the group treated with MTX alone. The MTX-loaded MSP group, however, exhibits the most significant reduction in this histological scoring.
Figure 10, Panel c shows that all treatments significantly impacted the reduction of the RA score in the right knees. With the MTX alone group showing the greatest reduction.
In Figure 10, Panel d, presents the results of the histopathological analysis of the left knees. The MTX-MSP lyophilized group achieves a significant reduction compared to the control group, although significant reductions are also evident in the other two groups.
The beneficial histological effect observed with MSP alone may be attributed to the high molecular weight hyaluronic acid used in the platform’s synthesis, which appears to significantly impact inflammation associated with rheumatoid arthritis [49,61]. This result confirms that selecting 1 mg of MSP is sufficient not only for effectively trapping the loaded MTX but also for having a significant biological effect associated with the presence of hyaluronic acid.
Additionally, the expression levels of IL-1β were measured in the serum collected at the time of sacrifice. Although no significant decreases were observed, a clear downward trend in IL-1β expression levels compared to the positive control group was evident. In fact, the expression levels of this cytokine in the groups treated with empty MSP and MTX-loaded MSP returned to similar values as those in the negative control group, albeit with a slight but notable reduction, especially in the MTX-loaded MSP group (Figure 11).
The CBC analysis, shown in Table S6 (in Supporting Information), demonstrated no significant differences across the various treatments, including MTX alone, MSP alone, or the combination of MTX-MSP in rats. The CBC results indicate that all treatments had a similar impact on blood parameters, with no notable deviations or abnormalities observed in any of the treatment groups.
The results from the initial preclinical study spurred a second confirmatory experiment, which was re-designed by increasing the MSP dose to 1.5 mg while maintaining the MTX concentration. This was done to determine whether a higher MSP dose would enhance the biological effect in the CIA rat model. Additionally, to ensure that the biological outcomes were not influenced by the platform preparation technique, we also evaluated efficacy using centrifuged MTX-MSP, i.e., where an empty MSP platform was provided as dry powder and the MTX liquid drug was loaded in it at the time of injection by simple mixing. Conversely, in the lyophilized MTX-MSP, both the drug and the platform were pre-lyophilized and provided as a pre-loaded powder ready for use off-the-shelf at time of injection. H&E staining analysis (Figure 12, Panel a) revealed that both treatment groups exhibited significantly lower histological RA scores compared to the positive control one (Figure 12, Panel b).
The data from this second animal set confirmed the results from prior experiment, proving that, while standard MTX treatment is effective (i.e., a significant reduction in the RA score exists, Figure 12, Panel b), combining MTX with our MSP drug delivery platform substantially enhances the therapeutic effect. However, contrary to the results obtained in the first experiment, increasing the MSP dose alone did not lead to a significant enhancement of the biological effect, suggesting that the therapeutic benefits are due to the combination of the platform with MTX.
4. Conclusions
The results of this study demonstrate the potential benefits of the proposed MSP platform for clinical use in the treatment of rheumatoid arthritis, laying the groundwork for further development and optimization of this approach.
Formulation studies highlighted the ability to achieve a homogeneous population capable of withstanding the freeze-drying process while maintaining its size characteristics and capacity for drug loading and release, resulting in a stable and easily resuspendable powder at the time of administration. Furthermore, the proven absence of endotoxins ensures its compliance for parenteral administration, which is crucial for preventing adverse reactions in patients and guaranteeing the safety of the product for clinical use. In vitro release studies showed that, compared to the drug alone, the MSP platform enables a slow and sustained drug release, which could potentially extend the therapeutic effect and reduce the frequency of administrations.
Toxicity studies confirmed the safety profile of the MSP platform, both when tested alone and when loaded with the drug, demonstrating that it is well-tolerated with no significant side effects observed during preclinical testing.
Finally, efficacy studies clearly showed that the MSP system outperforms traditional subcutaneous MTX administration in terms of overall therapeutic effectiveness, reducing the severity of RA symptoms and potentially improving long-term outcomes.
Following the positive outcome of this study from both a formulative and pre-clinical viewpoints, follow-up research could consider a dose-finding study, to further optimize the formulation and tailor the MSP platform more effectively for RA management towards given target end-points in a clinical setting, e.g., either to minimize side effects (reducing dose) for a given therapeutic grade or to maximize efficacy for a fewer number of injections. Moreover, exploring alternative routes of administration beyond subcutaneous injection could greatly enhance the versatility and applicability of this treatment across various medical conditions. The potential of MSP to address other clinical needs beyond RA and CRD, where a DDP for slow-release could be beneficial, should also be considered, e.g., type 2 diabetes, cancer treatment, ophthalmic intra-vitreal injections, mesotherapy, etc.
Supplementary Materials
The following supporting information can be downloaded at the website of this paper posted on Preprints.org. Figure S1: Confocal images of MSP; Figure S2. Histopathological analysis for safety study; Table S1. Effect of different concentration of MSP, CL and HA treatments in rats: complete blood count (CBC); Table S2. Organs histological score; Table S3. Rheumatoid Arthritis scores for the Right Knee; Table S4. Rheumatoid Arthritis scores for the Left Knee; Table S5. Rheumatoid Arthritis scores for the Total Knees; Table S6. Effect of different treatments of MTX, MSP and a combination of MTX-MSP treatment in rats: complete blood count (CBC).
Author Contributions
Conceptualization, N.F., P.N.H., M.M., A.M. and A.R.; methodology, N.F., P.N.H., E.R., V.P., M.S., R.B., A.M. and A.R.; validation, N.F., P.N.H. and R.B.; formal analysis, N.F., P.N.H., D.A., R.C., E.R., V.P., M.S. and R.B.; investigation, N.F., P.N.H., D.A., R.C., C.A., E.R., V.P. and M.S.; data curation, N.F. and P.N.H.; writing—original draft preparation, N.F. and P.N.H.; writing—review and editing, N.F., P.N.H., F.C., M.V., M.M., A.M. and A.R.; supervision, M.M., A.M. and A.R.; project administration, M.M., A.M. and A.R; funding acquisition, M.M., A.M. and A.R. All authors have read and agreed to the published version of the manuscript.
Funding
This research was funded by MIRA project “MIRA - call for tender “Projects of Groups of Research Diseases 2020” funded by Lazio Innova S.p.A. - POR FESR Lazio 2014-2020 funds, application no. PROT. A0375-2020- 36793 and PEPSA-MATE project - European Union’s Horizon 2020 research and innovation programme under grant agreement No 872233.
Institutional Review Board Statement
The animal study protocol was approved by the Animal-Welfare body (OPBA) and authorized by the Ministry of Health, Legislative Decree no. 26/2014; European Directive 2010/63/UE (Authorization number 763/2021-PR - October 12, 2021).
Informed Consent Statement
Not applicable.
Data Availability Statement
Data are available from the corresponding author upon reasonable request.
Acknowledgments
The support and encouragement by colleagues at the National Italian Agency for Energy New Technologies and Sustainable Economic Development (ENEA), Rome, Italy are gratefully acknowledged.
Conflicts of Interest
The authors Maurizio Mattei, Daniela Ariaudo, Rita Cimino, Carlo Abbate, Elena Romano, Francesca Cavalieri, Mariano Venanzi, Valeria Palumbo, Manuel Scimeca, Roberta Bernardini, Alberto Migliore declare no conflict of interests. The authors Noemi Fiaschini and Patrizia Nadia Hanieh are employees at company Nanofaber srl (Rome, Italy). Antonio Rinaldi is also affiliated to Nanofaber as co-founder. The Microsponge (MSP) technology is owned by Nanofaber. Yet, there has been no financial support for this work that could have influenced its outcome. The research was entirely supported by public funding and was carried out within the scope of PEPSA-MATE and MIRA projects. Also, the proofs of safety and efficacy of the MSP platform were carried out by the authors at University of Tor Vergata (Rome, Italy), which is the coordinator of both the PEPSA-MATE and MIRA projects.
References
- Yue, Y.; Shi, F.; Wang, J.; Ning, Q.; Zhang, Z.; Lv, H. Sulfated hyaluronic acid gel for the treatment of rheumatoid arthritis in rats. Int. J. Biol. Macromol. 2024, 256, 128537. [Google Scholar] [CrossRef] [PubMed]
- Mahmoud, D.E.; Kaabachi, W.; Sassi, N.; Tarhouni, L.; Rekik, S.; Jemmali, S.; Sehli, H.; Kallel-Sellami, M.; Cheour, E.; Laadhar, L. The synovial fluid fibroblast-like synoviocyte: A long-neglected piece in the puzzle of rheumatoid arthritis pathogenesis. Front. Immunol. 2022, 13, 942417. [Google Scholar] [CrossRef]
- Shi, G.; Liao, X.; Lin, Z.; Liu, W.; Luo, X.; Zhan, H.; Cai, X. Estimation of the global prevalence, incidence, years lived with disability of rheumatoid arthritis in 2019 and forecasted incidence in 2040: Results from the Global Burden of Disease Study 2019. Clin. Rheumatol. 2023, 42, 2297–2309. [Google Scholar] [CrossRef] [PubMed]
- Alivernini, S.; Tolusso, B.; Gigante, M.R.; Petricca, L.; Bui, L.; Fedele, A.L.; Di Mario, C.; Benvenuto, R.; Federico, F.; Ferraccioli, G. Overweight/obesity affects histological features and inflammatory gene signature of synovial membrane of rheumatoid arthritis. Sci. Rep. 2019, 9, 10420. [Google Scholar] [CrossRef] [PubMed]
- Spector, T.; Hall, G.; McCloskey, E.; Kanis, J. Risk of vertebral fracture in women with rheumatoid arthritis. BMJ: Br. Med. J. 1993, 306, 558. [Google Scholar] [CrossRef]
- Mohammed, R.H.; Bhutta, B.S. Hand and wrist rheumatoid arthritis. 2020.
- Brown, P.; Pratt, A.G.; Hyrich, K.L. Therapeutic advances in rheumatoid arthritis. bmj 2024, 384. [Google Scholar] [CrossRef]
- Bullock, J.; Rizvi, S.A.; Saleh, A.M.; Ahmed, S.S.; Do, D.P.; Ansari, R.A.; Ahmed, J. Rheumatoid arthritis: A brief overview of the treatment. Med. Princ. Pract. 2019, 27, 501–507. [Google Scholar] [CrossRef]
- Tanaka, Y. A review of upadacitinib in rheumatoid arthritis. Mod. Rheumatol. 2020, 30, 779–787. [Google Scholar] [CrossRef]
- Shinde, C.G.; Venkatesh, M.; Kumar, T.P.; Shivakumar, H. Methotrexate: A gold standard for treatment of rheumatoid arthritis. J. Pain Palliat. Care Pharmacother. 2014, 28, 351–358. [Google Scholar] [CrossRef]
- McCann, L. Efficacy and safety of oral and parenteral methotrexate therapy in children with juvenile idiopathic arthritis: An observational study with patients from the German Methotrexate Registry. Current Medical Literature: Rheumatology 2013, 32.
- Wilsdon, T.D.; Hill, C.L. Managing the drug treatment of rheumatoid arthritis. Aust. Prescr. 2017, 40, 51. [Google Scholar] [CrossRef]
- Lucas, C.J.; Dimmitt, S.B.; Martin, J.H. Optimising low-dose methotrexate for rheumatoid arthritis—A review. Br. J. Clin. Pharmacol. 2019, 85, 2228–2234. [Google Scholar] [CrossRef] [PubMed]
- Dale, J.; Alcorn, N.; Capell, H.; Madhok, R. Combination therapy for rheumatoid arthritis: Methotrexate and sulfasalazine together or with other DMARDs. Nat. Clin. Pract. Rheumatol. 2007, 3, 450–458. [Google Scholar] [CrossRef] [PubMed]
- Becciolini, A.; Biggioggero, M.; Favalli, E.G. The role of methotrexate as combination therapy with etanercept in rheumatoid arthritis: Retrospective analysis of a local registry. J. Int. Med. Res. 2016, 44, 113–118. [Google Scholar] [CrossRef]
- Zhao, W.; Zheng, L.; Yang, J.; Ma, Z.; Tao, X.; Wang, Q. Dissolving microneedle patch-assisted transdermal delivery of methotrexate improve the therapeutic efficacy of rheumatoid arthritis. Drug Deliv. 2023, 30, 121–132. [Google Scholar] [CrossRef] [PubMed]
- Bello, A.E.; Perkins, E.L.; Jay, R.; Efthimiou, P. Recommendations for optimizing methotrexate treatment for patients with rheumatoid arthritis. Open access rheumatology: Research and reviews 2017, 67-79. [CrossRef]
- Branco, J.C.; Barcelos, A.; de Araújo, F.P.; Sequeira, G.; Cunha, I.; Patto, J.V.; Oliveira, M.; Mateus, M.P.; Couto, M.; Nero, P. Utilization of subcutaneous methotrexate in rheumatoid arthritis patients after failure or intolerance to oral methotrexate: A multicenter cohort study. Adv. Ther. 2016, 33, 46–57. [Google Scholar] [CrossRef]
- Jacobse, J.; Ten Voorde, W.; Rissmann, R.; Burggraaf, J.; Ten Cate, R.; Schrier, L. The effect of repeated methotrexate injections on the quality of life of children with rheumatic diseases. Eur. J. Pediatr. 2019, 178, 17–20. [Google Scholar] [CrossRef]
- Braun, J.; Kästner, P.; Flaxenberg, P.; Währisch, J.; Hanke, P.; Demary, W.; Von Hinüber, U.; Rockwitz, K.; Heitz, W.; Pichlmeier, U. Comparison of the clinical efficacy and safety of subcutaneous versus oral administration of methotrexate in patients with active rheumatoid arthritis: Results of a six-month, multicenter, randomized, double-blind, controlled, phase IV trial. Arthritis Rheum. 2008, 58, 73–81. [Google Scholar] [CrossRef]
- Braun, J.; Rau, R. An update on methotrexate. Curr. Opin. Rheumatol. 2009, 21, 216–223. [Google Scholar] [CrossRef]
- Kalb, R.E.; Strober, B.; Weinstein, G.; Lebwohl, M. Methotrexate and psoriasis: 2009 National Psoriasis Foundation consensus conference. J. Am. Acad. Dermatol. 2009, 60, 824–837. [Google Scholar] [CrossRef]
- Khan, N.; Abbas, A.M.; Whang, N.; Balart, L.A.; Bazzano, L.A.; Kelly, T.N. Incidence of liver toxicity in inflammatory bowel disease patients treated with methotrexate: A meta-analysis of clinical trials. Inflamm. Bowel Dis. 2012, 18, 359–367. [Google Scholar] [CrossRef]
- Wang, W.; Zhou, H.; Liu, L. Side effects of methotrexate therapy for rheumatoid arthritis: A systematic review. Eur. J. Med. Chem. 2018, 158, 502–516. [Google Scholar] [CrossRef]
- Rohr, M.K.; Mikuls, T.R.; Cohen, S.B.; Thorne, J.C.; O’Dell, J.R. Underuse of methotrexate in the treatment of rheumatoid arthritis: A national analysis of prescribing practices in the US. Arthritis Care Res. 2017, 69, 794–800. [Google Scholar] [CrossRef]
- Taylor, P.C.; Balsa Criado, A.; Mongey, A.-B.; Avouac, J.; Marotte, H.; Mueller, R.B. How to get the most from methotrexate (MTX) treatment for your rheumatoid arthritis patient?—MTX in the treat-to-target strategy. J. Clin. Med. 2019, 8, 515. [Google Scholar] [CrossRef]
- Vena, G.A.; Cassano, N.; Iannone, F. Update on subcutaneous methotrexate for inflammatory arthritis and psoriasis. Therapeutics and Clinical Risk Management 2018, 105–116. [Google Scholar] [CrossRef]
- Schiff, M.H.; Jaffe, J.S.; Freundlich, B. Head-to-head, randomised, crossover study of oral versus subcutaneous methotrexate in patients with rheumatoid arthritis: Drug-exposure limitations of oral methotrexate at doses≥ 15 mg may be overcome with subcutaneous administration. Ann. Rheum. Dis. 2014, 73, 1549–1551. [Google Scholar] [CrossRef]
- Bechard, M.A.; Lemieux, J.R.; Roth, J.; Watanabe Duffy, K.; Duffy, C.M.; Aglipay, M.O.; Jurencak, R. Procedural pain and patient-reported side effects with weekly injections of subcutaneous methotrexate in children with rheumatic disorders. Pediatr. Rheumatol. 2014, 12, 1–8. [Google Scholar] [CrossRef]
- Cavalieri, F.; Rinaldi, A. Nanoporous microsponge particles (nmp) of biocompatible polymers as universal carriers for biomolecules delivery. 2022.
- Vyas, A.; Saraf, S.; Saraf, S. Encapsulation of cyclodextrin complexed simvastatin in chitosan nanocarriers: A novel technique for oral delivery. J. Incl. Phenom. Macrocycl. Chem. 2010, 66, 251–259. [Google Scholar] [CrossRef]
- Obiedallah, M.M.; Abdel-Mageed, A.; Elfaham, T.H. Ocular administration of acetazolamide microsponges in situ gel formulations. Saudi Pharm. J. 2018, 26, 909–920. [Google Scholar] [CrossRef]
- Abdelmalak, N.S.; El-Menshawe, S.F. A new topical fluconazole microsponge loaded hydrogel: Preparation and characterization. Int J Pharm Pharm Sci 2012, 4, 460–468. [Google Scholar]
- Kaity, S.; Maiti, S.; Ghosh, A.K.; Pal, D.; Ghosh, A.; Banerjee, S. Microsponges: A novel strategy for drug delivery system. J. Adv. Pharm. Technol. Res. 2010, 1, 283–290. [Google Scholar] [CrossRef]
- Ariaudo, D.; Cavalieri, F.; Rinaldi, A.; Aguilera, A.; Lopez, M.; Perez, H.G.; Felipe, A.; del Carmen Dominguez, M.; Ruiz, O.; Martinez, G. Alginate microsponges as a scaffold for delivery of a therapeutic peptide against rheumatoid arthritis. Nanomaterials 2023, 13, 2709. [Google Scholar] [CrossRef]
- Caso, M.F.; Carotenuto, F.; Di Nardo, P.; Migliore, A.; Aguilera, A.; Lopez, C.M.; Venanzi, M.; Cavalieri, F.; Rinaldi, A. Nanoporous microsponge particles (NMP) of polysaccharides as universal carriers for biomolecules delivery. Nanomaterials 2020, 10, 1075. [Google Scholar] [CrossRef]
- Cavalieri, F. Hyaluronic acid micro-sponges and method for the production thereof. 2016.
- Seljak, K.B.; Kocbek, P.; Gašperlin, M. Mesoporous silica nanoparticles as delivery carriers: An overview of drug loading techniques. J. Drug Deliv. Sci. Technol. 2020, 59, 101906. [Google Scholar] [CrossRef]
- Wong, C.Y.; Al-Salami, H.; Dass, C.R. Lyophilisation improves bioactivity and stability of insulin-loaded polymeric-oligonucleotide nanoparticles for diabetes treatment. AAPS PharmSciTech 2020, 21, 108. [Google Scholar] [CrossRef]
- Di Francesco, M.; Primavera, R.; Summa, M.; Pannuzzo, M.; Di Francesco, V.; Di Mascolo, D.; Bertorelli, R.; Decuzzi, P. Engineering shape-defined PLGA microPlates for the sustained release of anti-inflammatory molecules. J. Control. Release 2020, 319, 201–212. [Google Scholar] [CrossRef]
- Bhandari, J.; Mishra, H.; Mishra, P.K.; Wimmer, R.; Ahmad, F.J.; Talegaonkar, S. Cellulose nanofiber aerogel as a promising biomaterial for customized oral drug delivery. Int. J. Nanomed. 2017, 2021–2031. [Google Scholar] [CrossRef]
- Pawar, A.P.; Gholap, A.P.; Kuchekar, A.B.; Bothiraja, C.; Mali, A.J. Formulation and evaluation of optimized oxybenzone microsponge gel for topical delivery. J. Drug Deliv. 2015, 2015, 261068. [Google Scholar] [CrossRef]
- Shi, H.; He, X.; Wang, K.; Yuan, Y.; Deng, K.; Chen, J.; Tan, W. Rhodamine B isothiocyanate doped silica-coated fluorescent nanoparticles (RBITC-DSFNPs)–based bioprobes conjugated to Annexin V for apoptosis detection and imaging. Nanomedicine: Nanotechnology, Biology and Medicine 2007, 3, 266–272. [Google Scholar] [CrossRef]
- Yang, T.; Sun, D.; Xu, P.; Li, S.; Cen, Y.; Li, Y.; Xu, Q.; Sun, Y.; Li, W.; Lin, Y. Stability of bovine serum albumin labelled by rhodamine B isothiocyanate. Biomed. Res 2017, 28, 3851–3854. [Google Scholar]
- Chen, Y.; Qian, H.; Zheng, X.; Jiang, X.; Yu, H.; Zhang, L. Nonspherical polysaccharide vesicles and their shape and volume regulation via osmotically sensitive channels. Soft Matter 2011, 7, 5519–5523. [Google Scholar] [CrossRef]
- Andreana, I.; Bincoletto, V.; Manzoli, M.; Rodà, F.; Giarraputo, V.; Milla, P.; Arpicco, S.; Stella, B. Freeze drying of polymer nanoparticles and liposomes exploiting different saccharide-based approaches. Materials 2023, 16, 1212. [Google Scholar] [CrossRef]
- Becker, L.C.; Bergfeld, W.F.; Belsito, D.V.; Klaassen, C.D.; Marks, J.G.; Shank, R.C.; Slaga, T.J.; Snyder, P.W.; Panel, C.I.R.E.; Andersen, F.A. Final report of the safety assessment of hyaluronic acid, potassium hyaluronate, and sodium hyaluronate. Int. J. Toxicol. 2009, 28, 5–67. [Google Scholar] [CrossRef]
- Palmieri, G.; Rinaldi, A.; Campagnolo, L.; Tortora, M.; Caso, M.F.; Mattei, M.; Notargiacomo, A.; Rosato, N.; Bottini, M.; Cavalieri, F. Hyaluronic acid nanoporous microparticles with long in vivo joint residence time and sustained release. Part. Part. Syst. Charact. 2017, 34, 1600411. [Google Scholar] [CrossRef]
- Kawano, Y.; Patrulea, V.; Sublet, E.; Borchard, G.; Iyoda, T.; Kageyama, R.; Morita, A.; Seino, S.; Yoshida, H.; Jordan, O. Wound healing promotion by hyaluronic acid: Effect of molecular weight on gene expression and in vivo wound closure. Pharmaceuticals 2021, 14, 301. [Google Scholar] [CrossRef]
- Crotts, G.; Park, T.G. Preparation of porous and nonporous biodegradable polymeric hollow microspheres. J. Control. Release 1995, 35, 91–105. [Google Scholar] [CrossRef]
- Dhir, V.; Singla, M.; Gupta, N.; Goyal, P.; Sagar, V.; Sharma, A.; Khanna, S.; Singh, S. Randomized controlled trial comparing 2 different starting doses of methotrexate in rheumatoid arthritis. Clin. Ther. 2014, 36, 1005–1015. [Google Scholar] [CrossRef]
- Nair, A.B.; Jacob, S. A simple practice guide for dose conversion between animals and human. J. Basic Clin. Pharm. 2016, 7, 27. [Google Scholar] [CrossRef]
- Azam, F.; Abd El-Mageed, H.; Anwar, M.J.; Mahmood, D. Adsorption of methotrexate on hyaluronic acid: A comparative DFT and molecular dynamics simulation insights. Chem. Phys. Impact 2024, 8, 100573. [Google Scholar] [CrossRef]
- Abla, K.K.; Mehanna, M.M. Freeze-drying: A flourishing strategy to fabricate stable pharmaceutical and biological products. Int. J. Pharm. 2022, 628, 122233. [Google Scholar] [CrossRef]
- Tiwari, A.; Tiwari, V.; Palaria, B.; Kumar, M.; Kaushik, D. Microsponges: A breakthrough tool in pharmaceutical research. Future J. Pharm. Sci. 2022, 8, 31. [Google Scholar] [CrossRef]
- Chen, W.; Palazzo, A.; Hennink, W.E.; Kok, R.J. Effect of particle size on drug loading and release kinetics of gefitinib-loaded PLGA microspheres. Mol. Pharm. 2017, 14, 459–467. [Google Scholar] [CrossRef]
- Özdemir, S.; Üner, B.; Baranauskaite, J.; Sümer, E.; Yıldırım, E.; Yaba, A. Design and characterization of dexamethasone loaded microsponges for the management of ulcerative colitis. Eur. J. Pharm. Biopharm. 2023, 187, 34–45. [Google Scholar] [CrossRef]
- Yoshioka, K.; Katayama, M.; Nishiyama, T.; Harada, K.; Takeshita, S.; Kawamata, Y. Biocompatibility study of different hyaluronan products for intra-articular treatment of knee osteoarthritis. BMC Musculoskelet. Disord. 2019, 20, 1–9. [Google Scholar] [CrossRef]
- Gooch, N.; Burr, R.M.; Holt, D.J.; Gale, B.; Ambati, B. Design and in vitro biocompatibility of a novel ocular drug delivery device. J. Funct. Biomater. 2013, 4, 14–26. [Google Scholar] [CrossRef]
- Osmani, R.A.M.; Aloorkar, N.H.; Thaware, B.U.; Kulkarni, P.K.; Moin, A.; Hani, U.; Srivastava, A.; Bhosale, R.R. Microsponge based drug delivery system for augmented gastroparesis therapy: Formulation development and evaluation. Asian J. Pharm. Sci. 2015, 10, 442–451. [Google Scholar] [CrossRef]
- Petrey, A.C.; de la Motte, C.A. Hyaluronan, a crucial regulator of inflammation. Front. Immunol. 2014, 5, 101. [Google Scholar] [CrossRef]
Figure 1.
Experimental design of safety study.
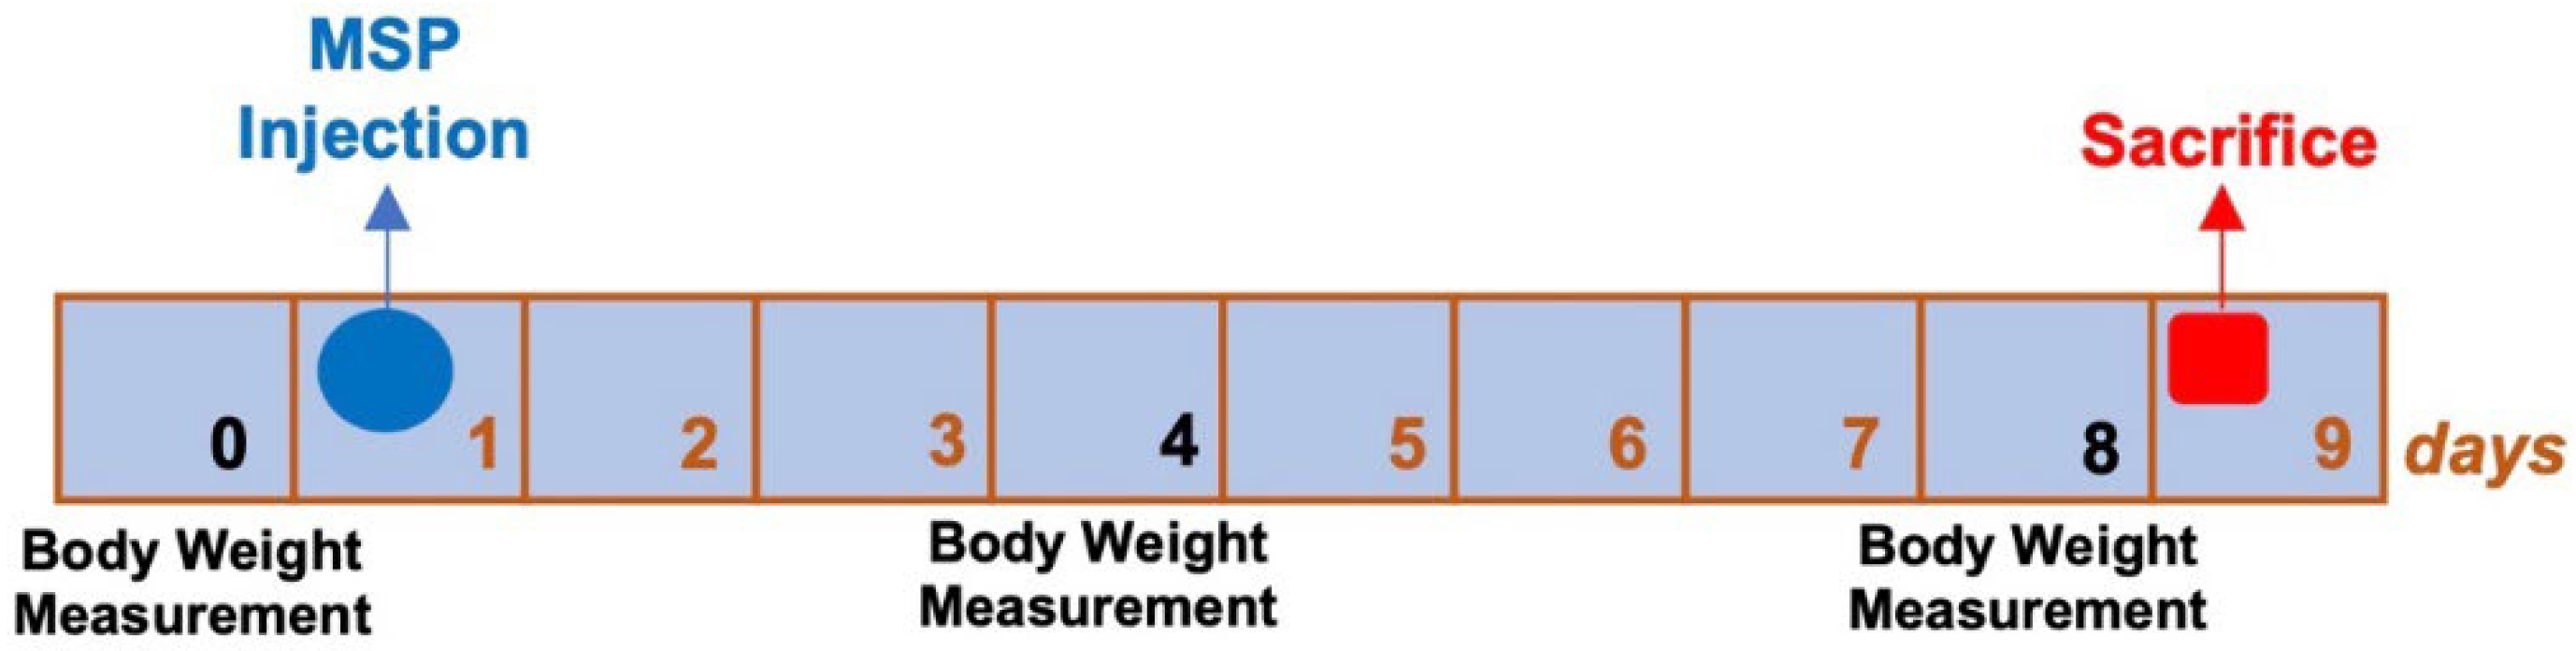
Figure 2.
Experimental design of efficacy study.
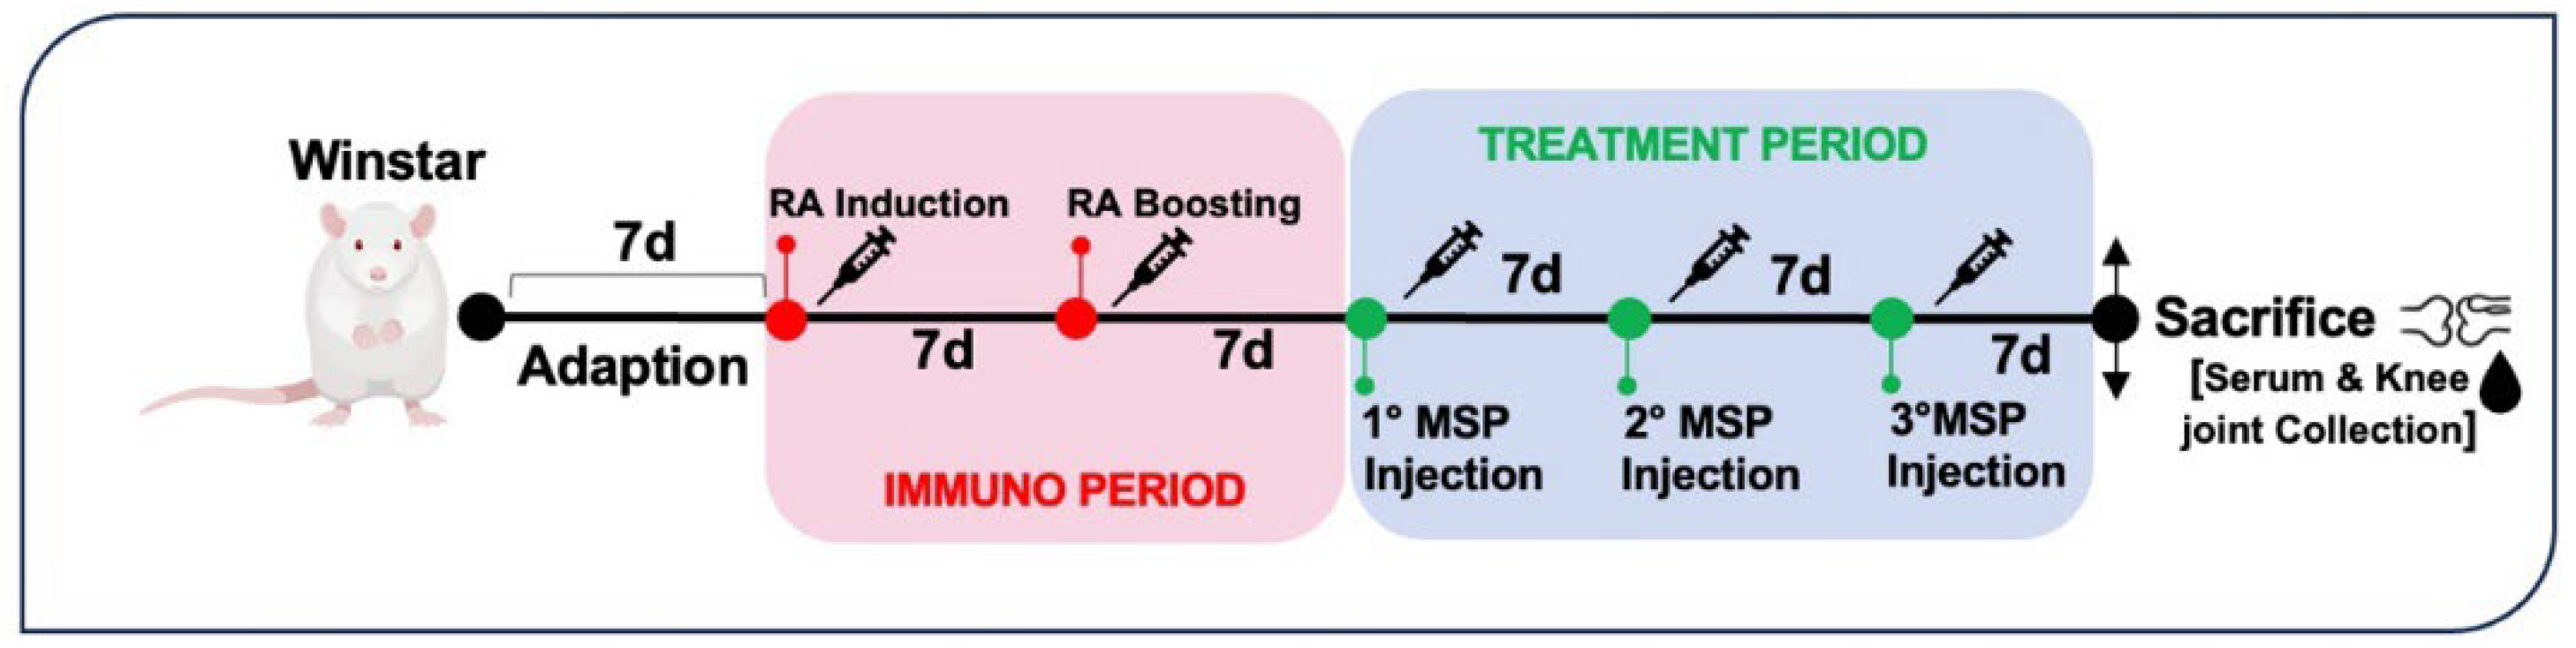
Figure 3.
SEM images of: MSP before (Panel A) and after (Panel B) freeze-dry step; MSP loaded with MTX after centrifugation (Panel C) and after freeze-drying (Panel C); scale bar: 1 μm; Morphology of MTX-MSP population by SEM (Panel E; scale bar: 20 μm) and by Confocal analysis (Panel F, 3D rendering with isosurfaces where green colour indicates MTX, and red colour indicates MSP; scale bar: 5 μm).). MTX spectra of MTX-MSP after centrifugation and lyophilization processes (Panel G). Picture of MSP loaded with MTX, centrifuged and lyophilized, after reconstitution with PBS buffer (Panel H).
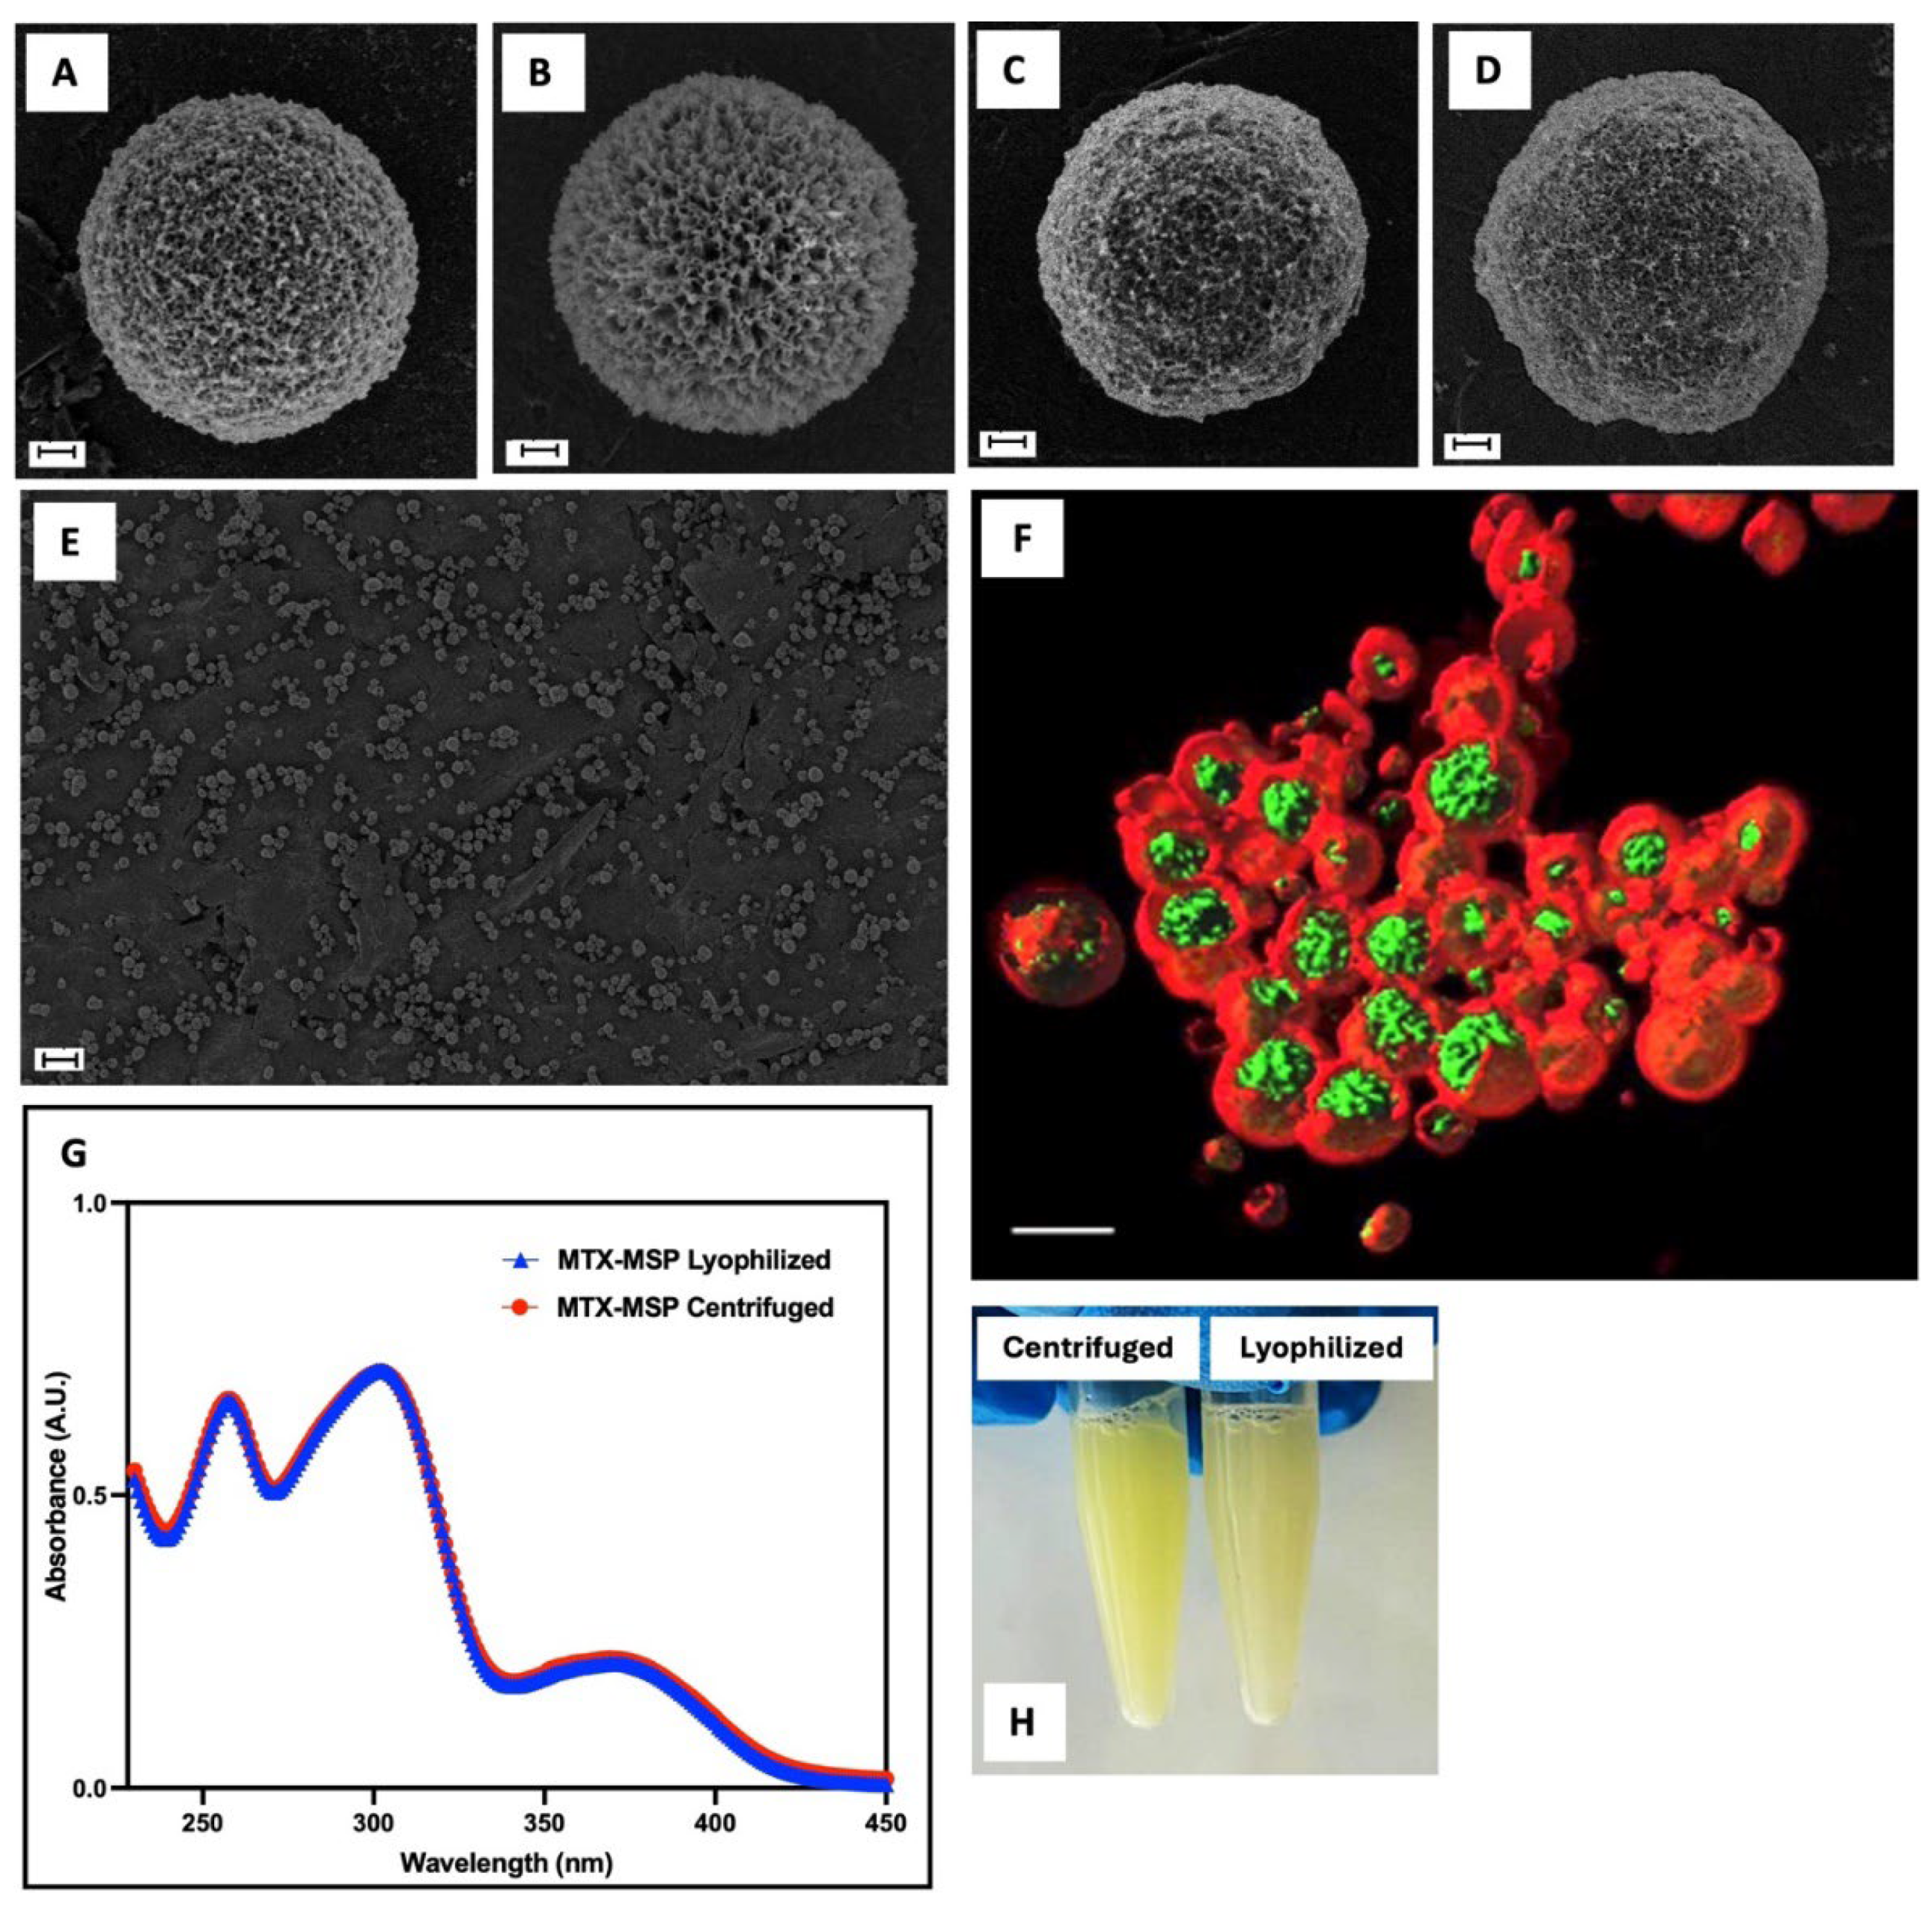
Figure 4.
Entrapment Efficiency (EE%) and Loading Efficiency (LE%) of MTX-MSP over time.
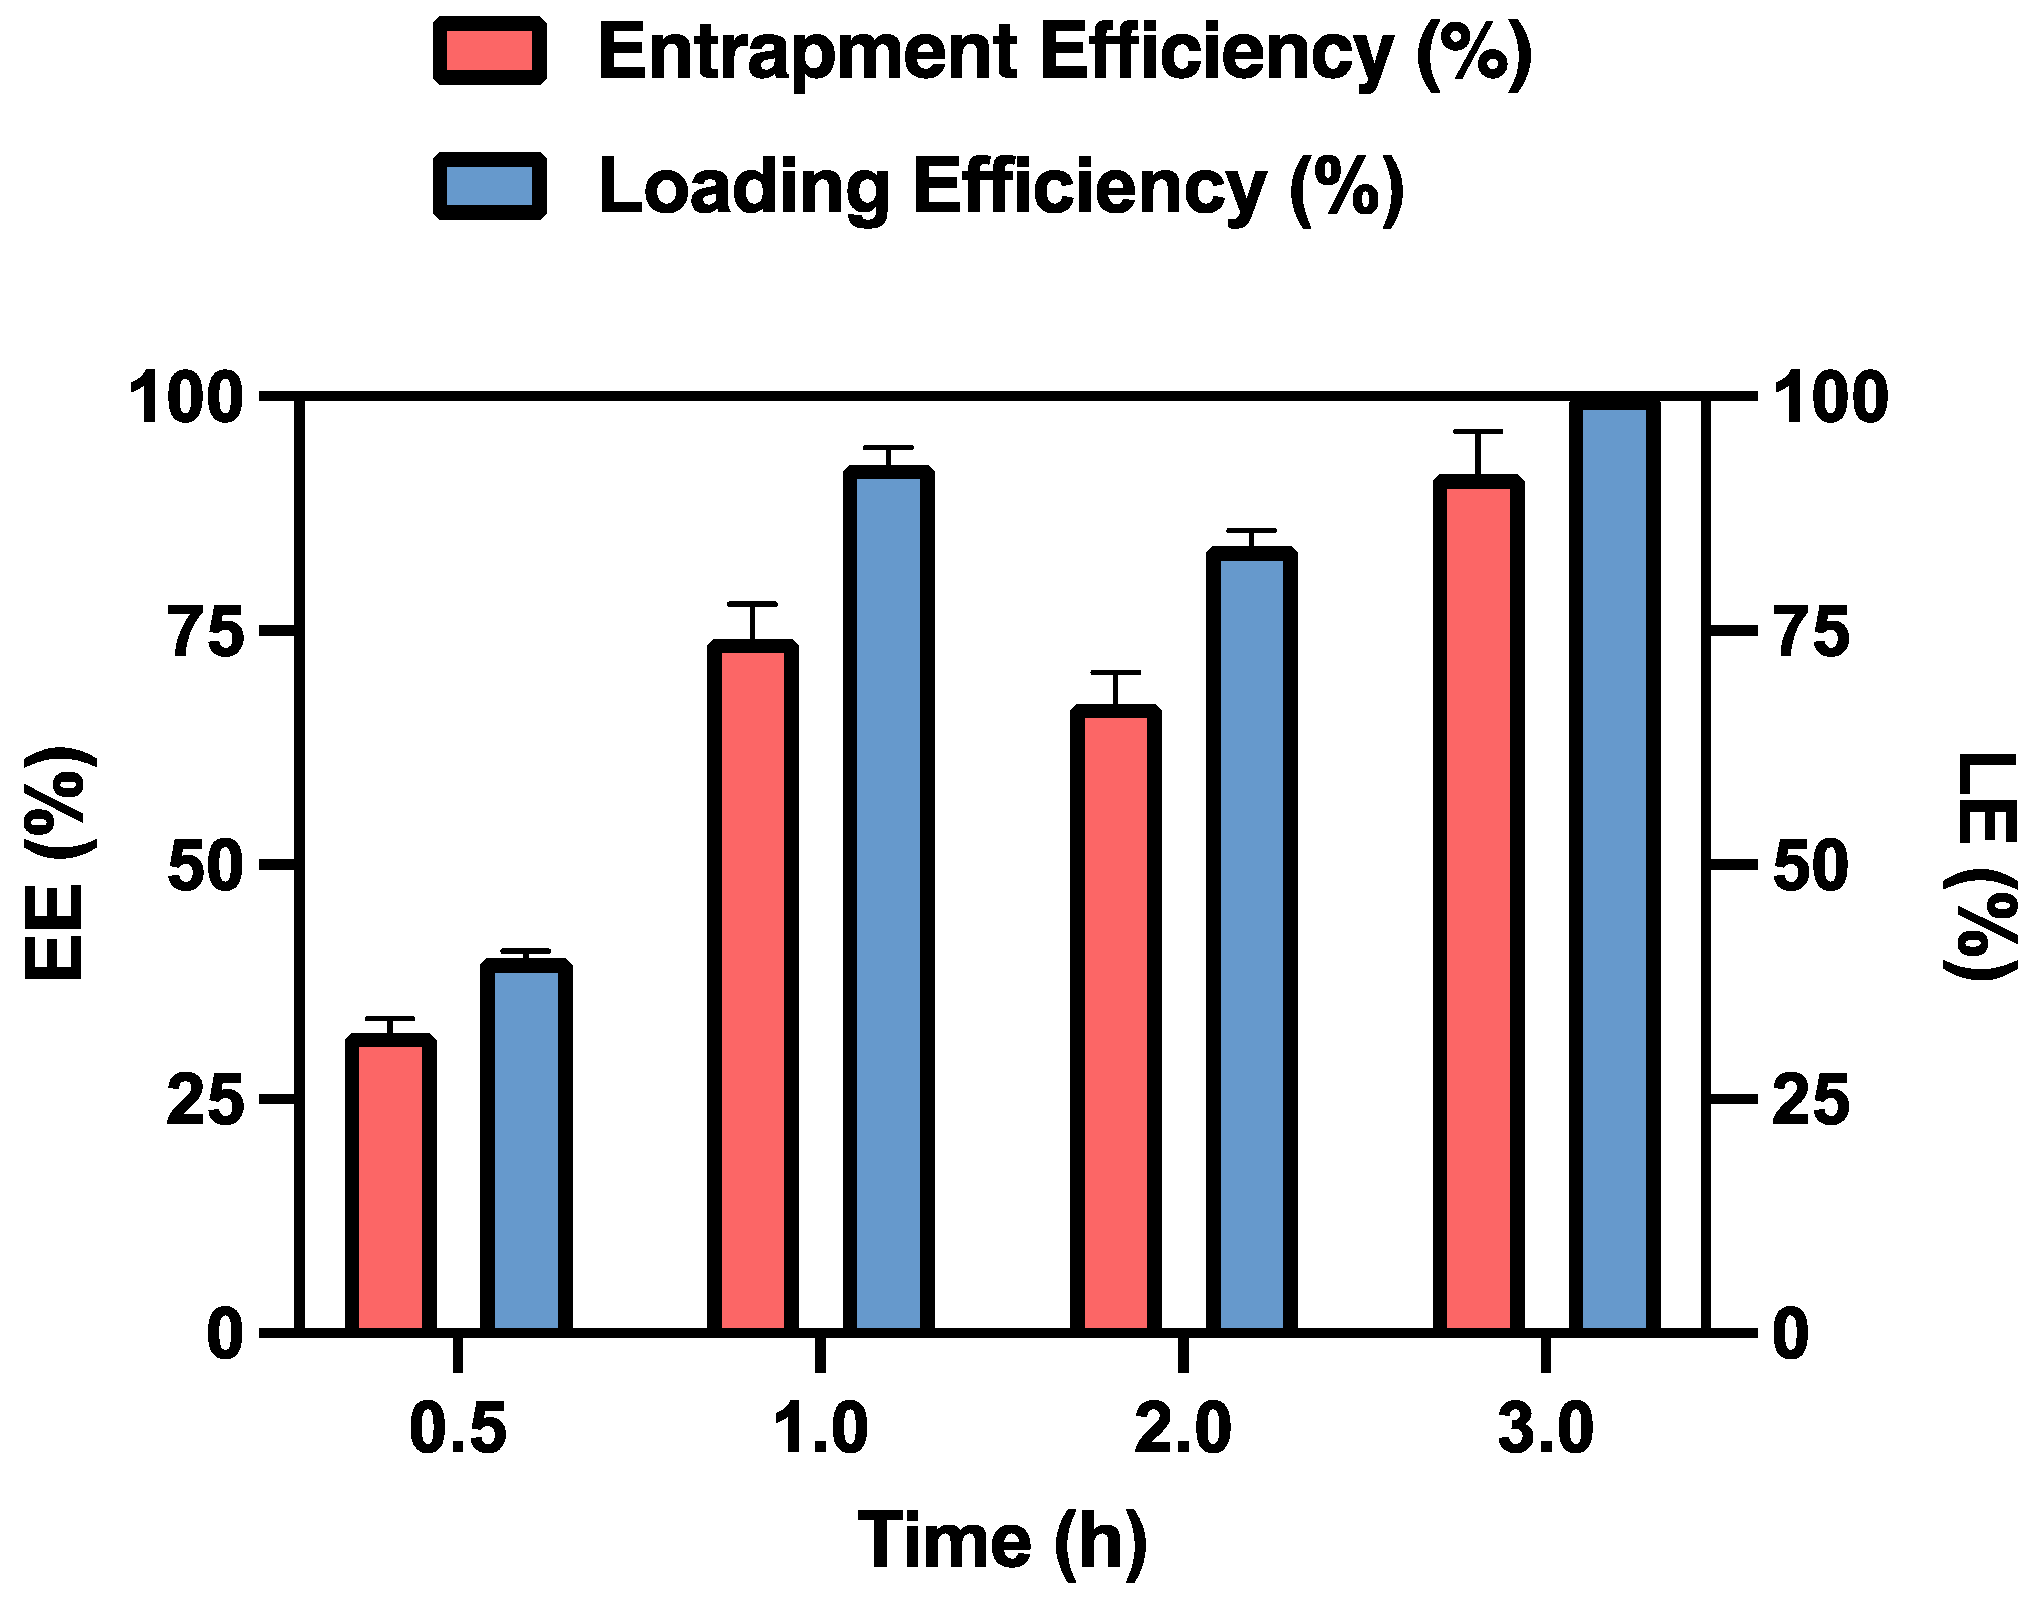
Figure 5.
Comparison of MTX release profile percentage among free MTX, MTX-MPS lyophilized and centrifuged.
Figure 5.
Comparison of MTX release profile percentage among free MTX, MTX-MPS lyophilized and centrifuged.
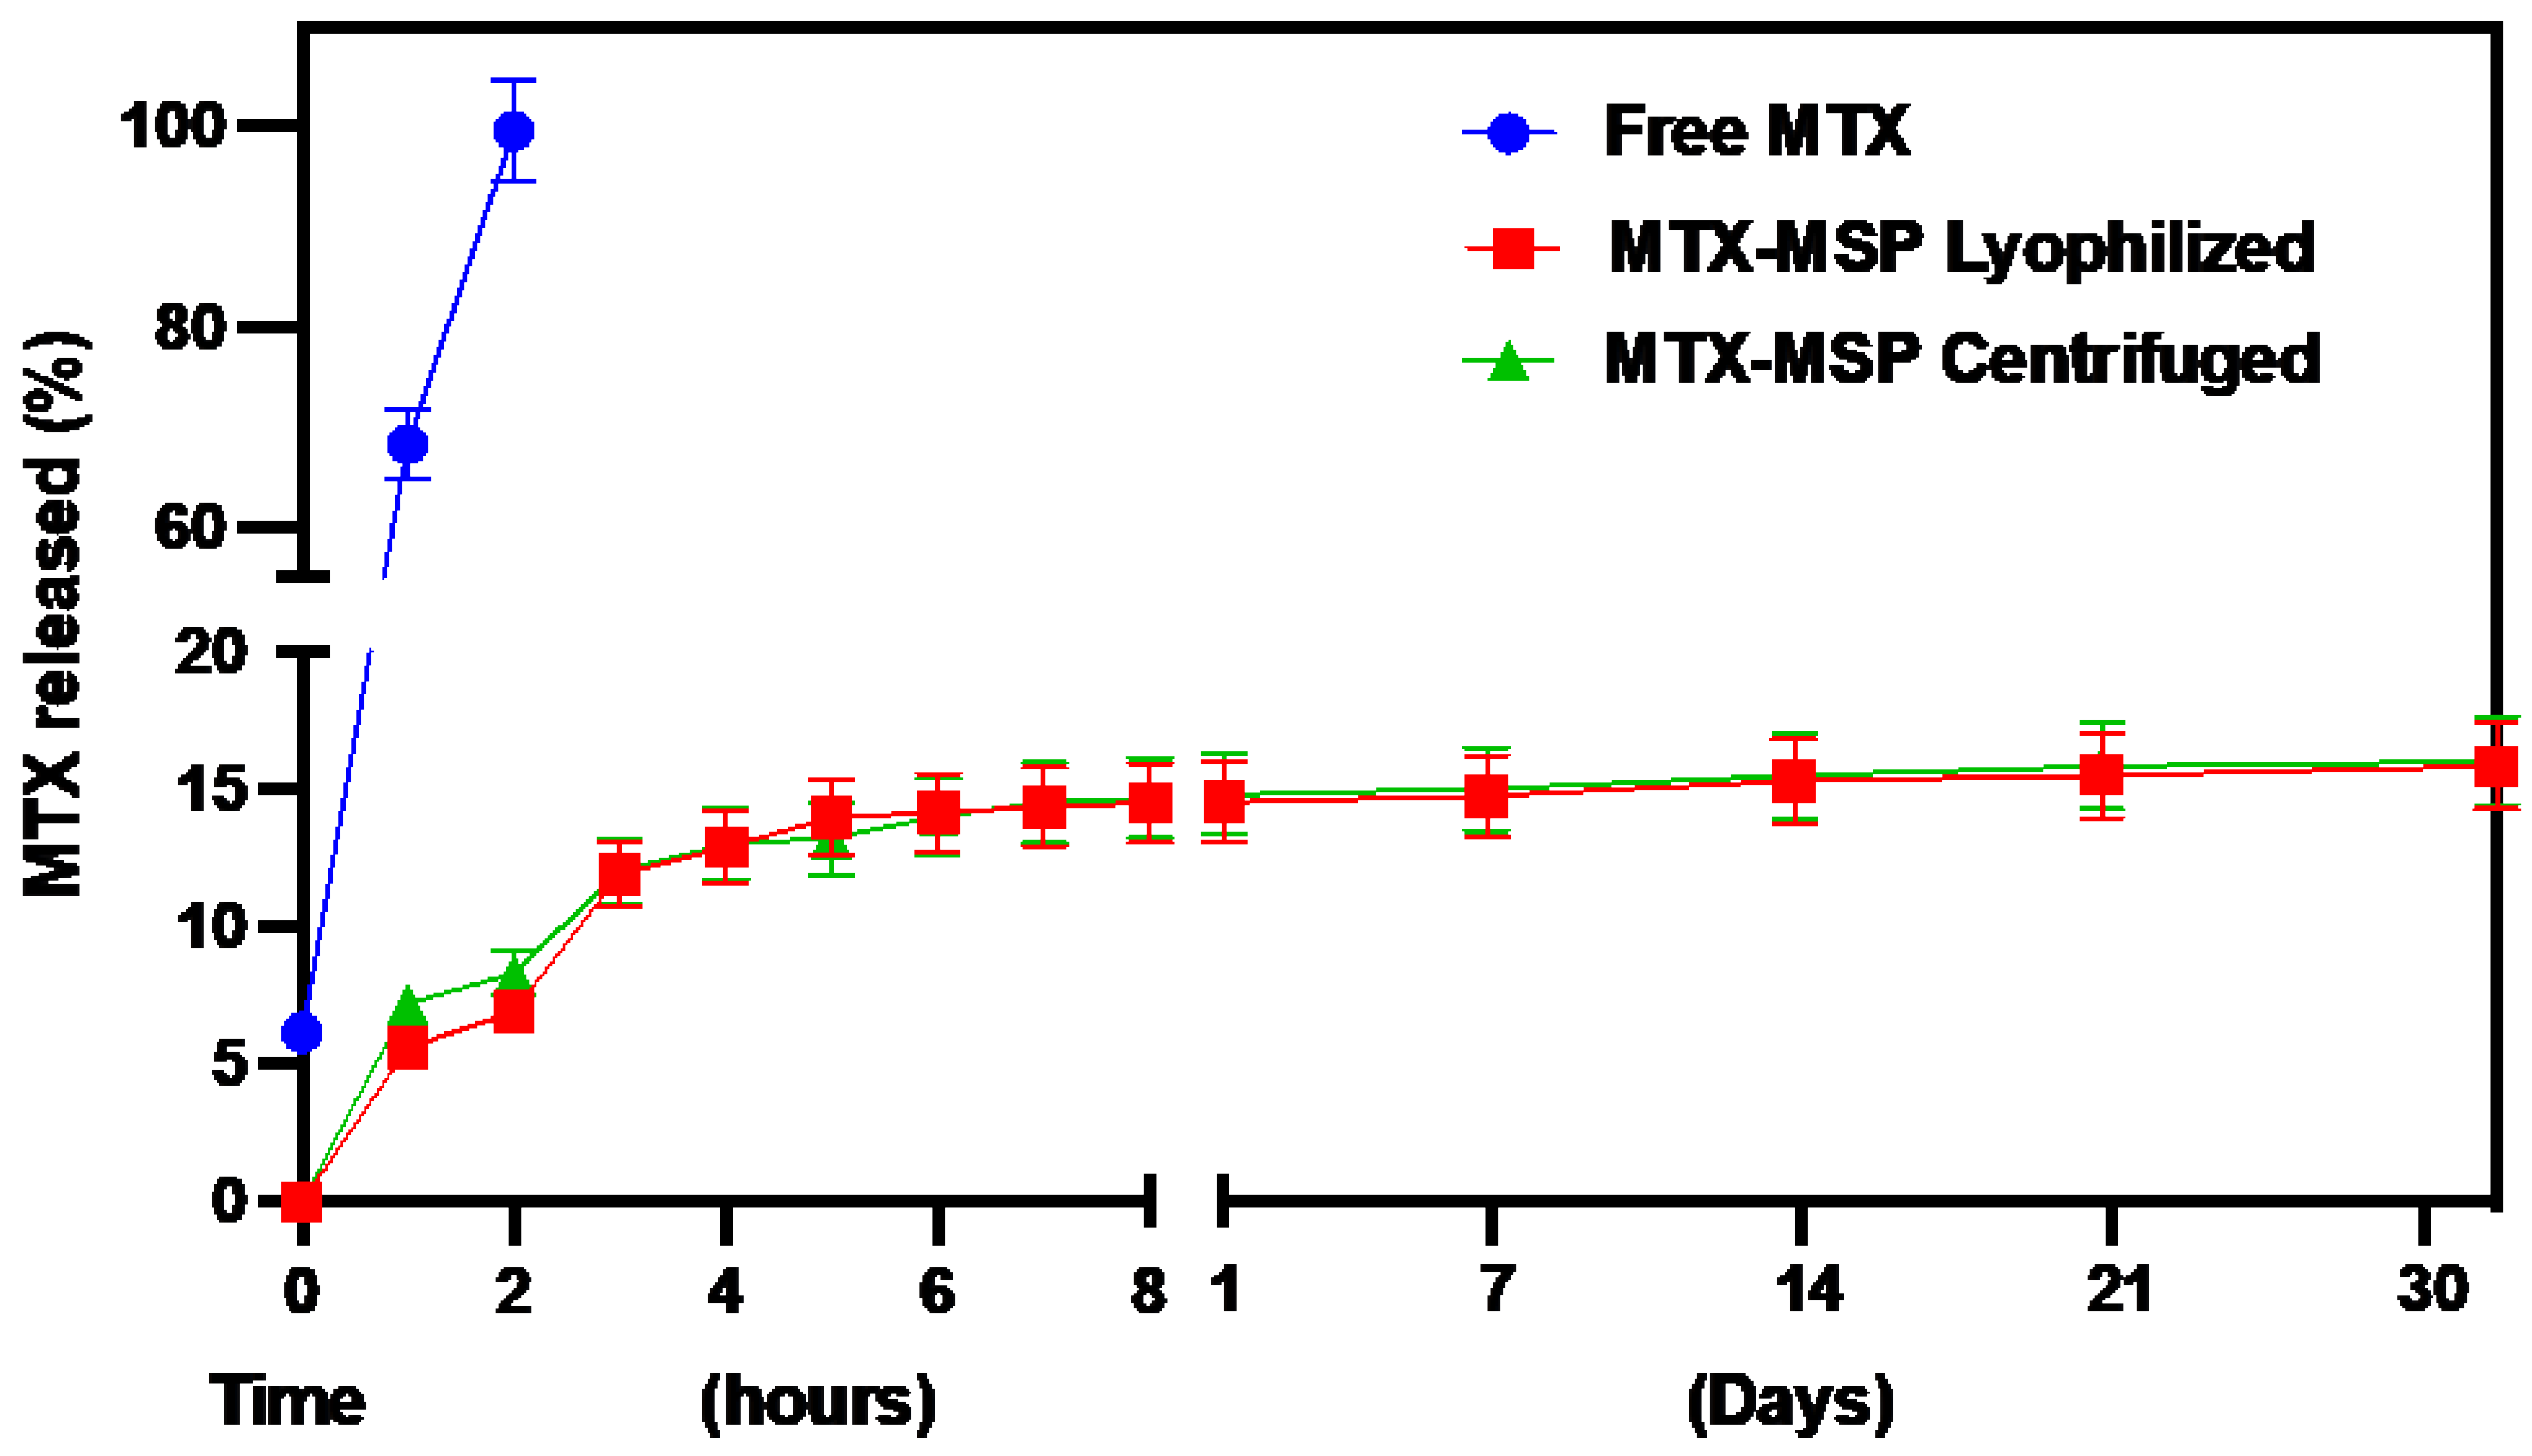
Figure 6.
Body weight measurement. Data are presented as mean ± SD.
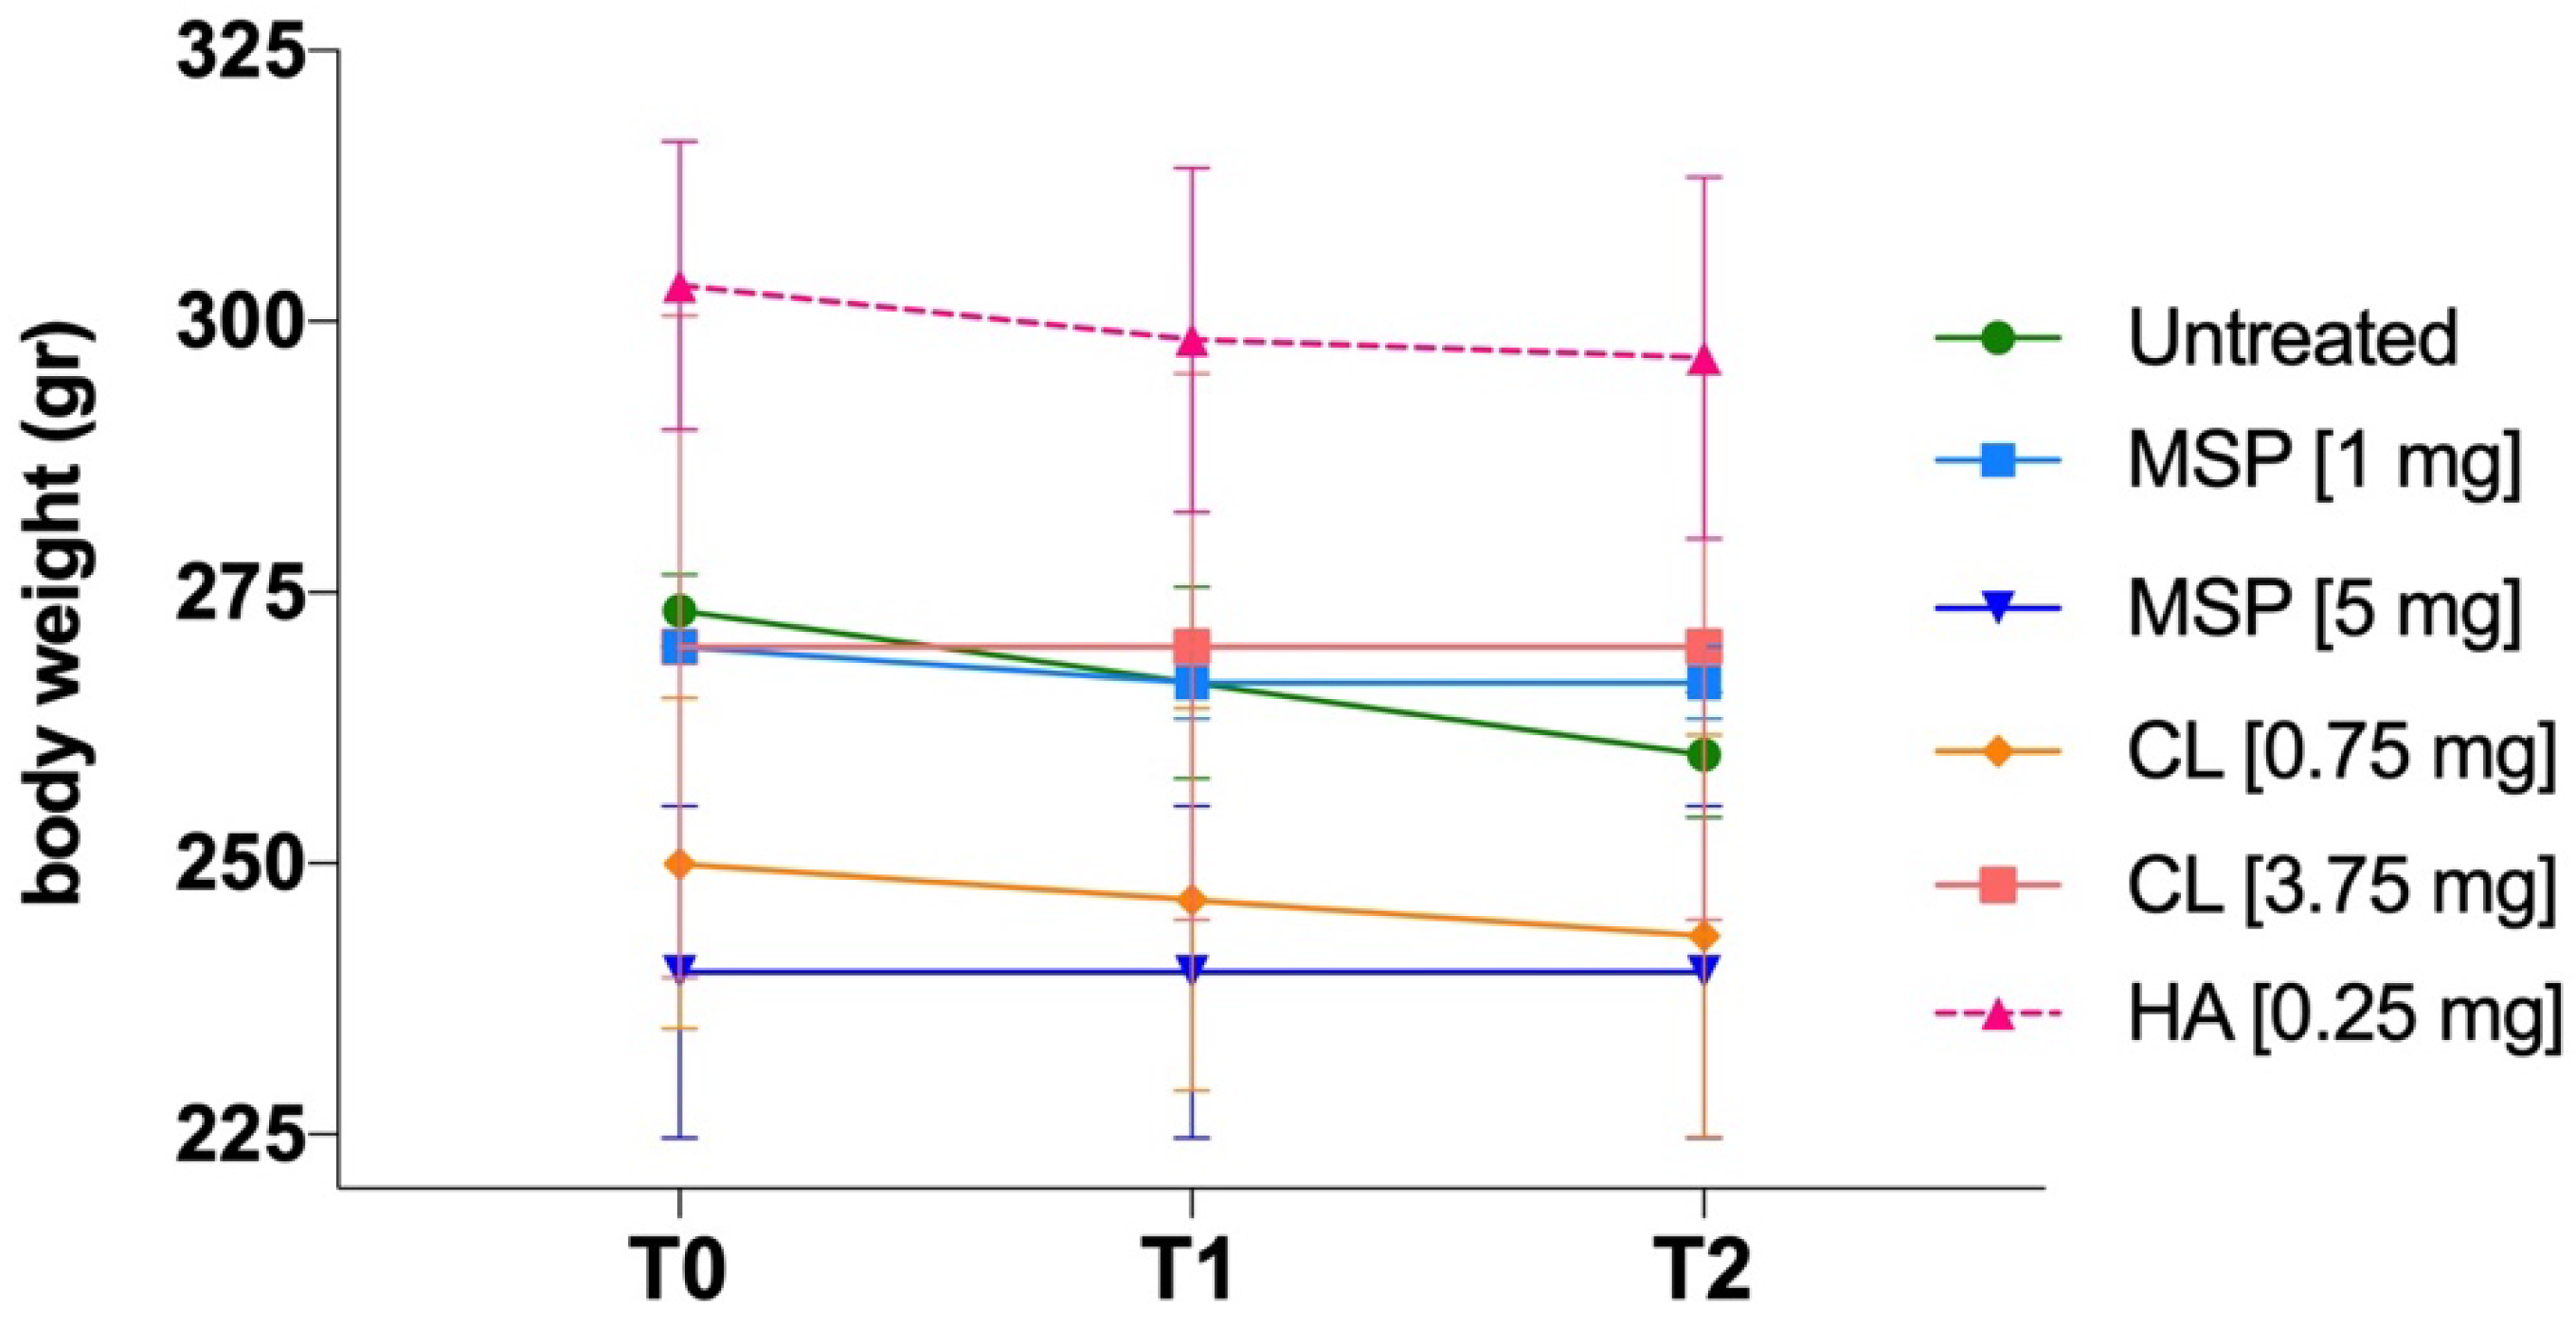
Figure 7.
Histopathological analysis for safety study. Histological analysis of Knee Joint sections by H&E staining: (A) Liver; (B) Spleen; (C) Lung; (D) Kidney. 20 X magnification: Scale bar = 50 μm.
Figure 7.
Histopathological analysis for safety study. Histological analysis of Knee Joint sections by H&E staining: (A) Liver; (B) Spleen; (C) Lung; (D) Kidney. 20 X magnification: Scale bar = 50 μm.

Figure 8.
a) Body weight measurement; (b) ELISA assay against Ab α-Collagen II. Data are presented as mean ± SD. *p<0.05 compared with negative control.
Figure 8.
a) Body weight measurement; (b) ELISA assay against Ab α-Collagen II. Data are presented as mean ± SD. *p<0.05 compared with negative control.
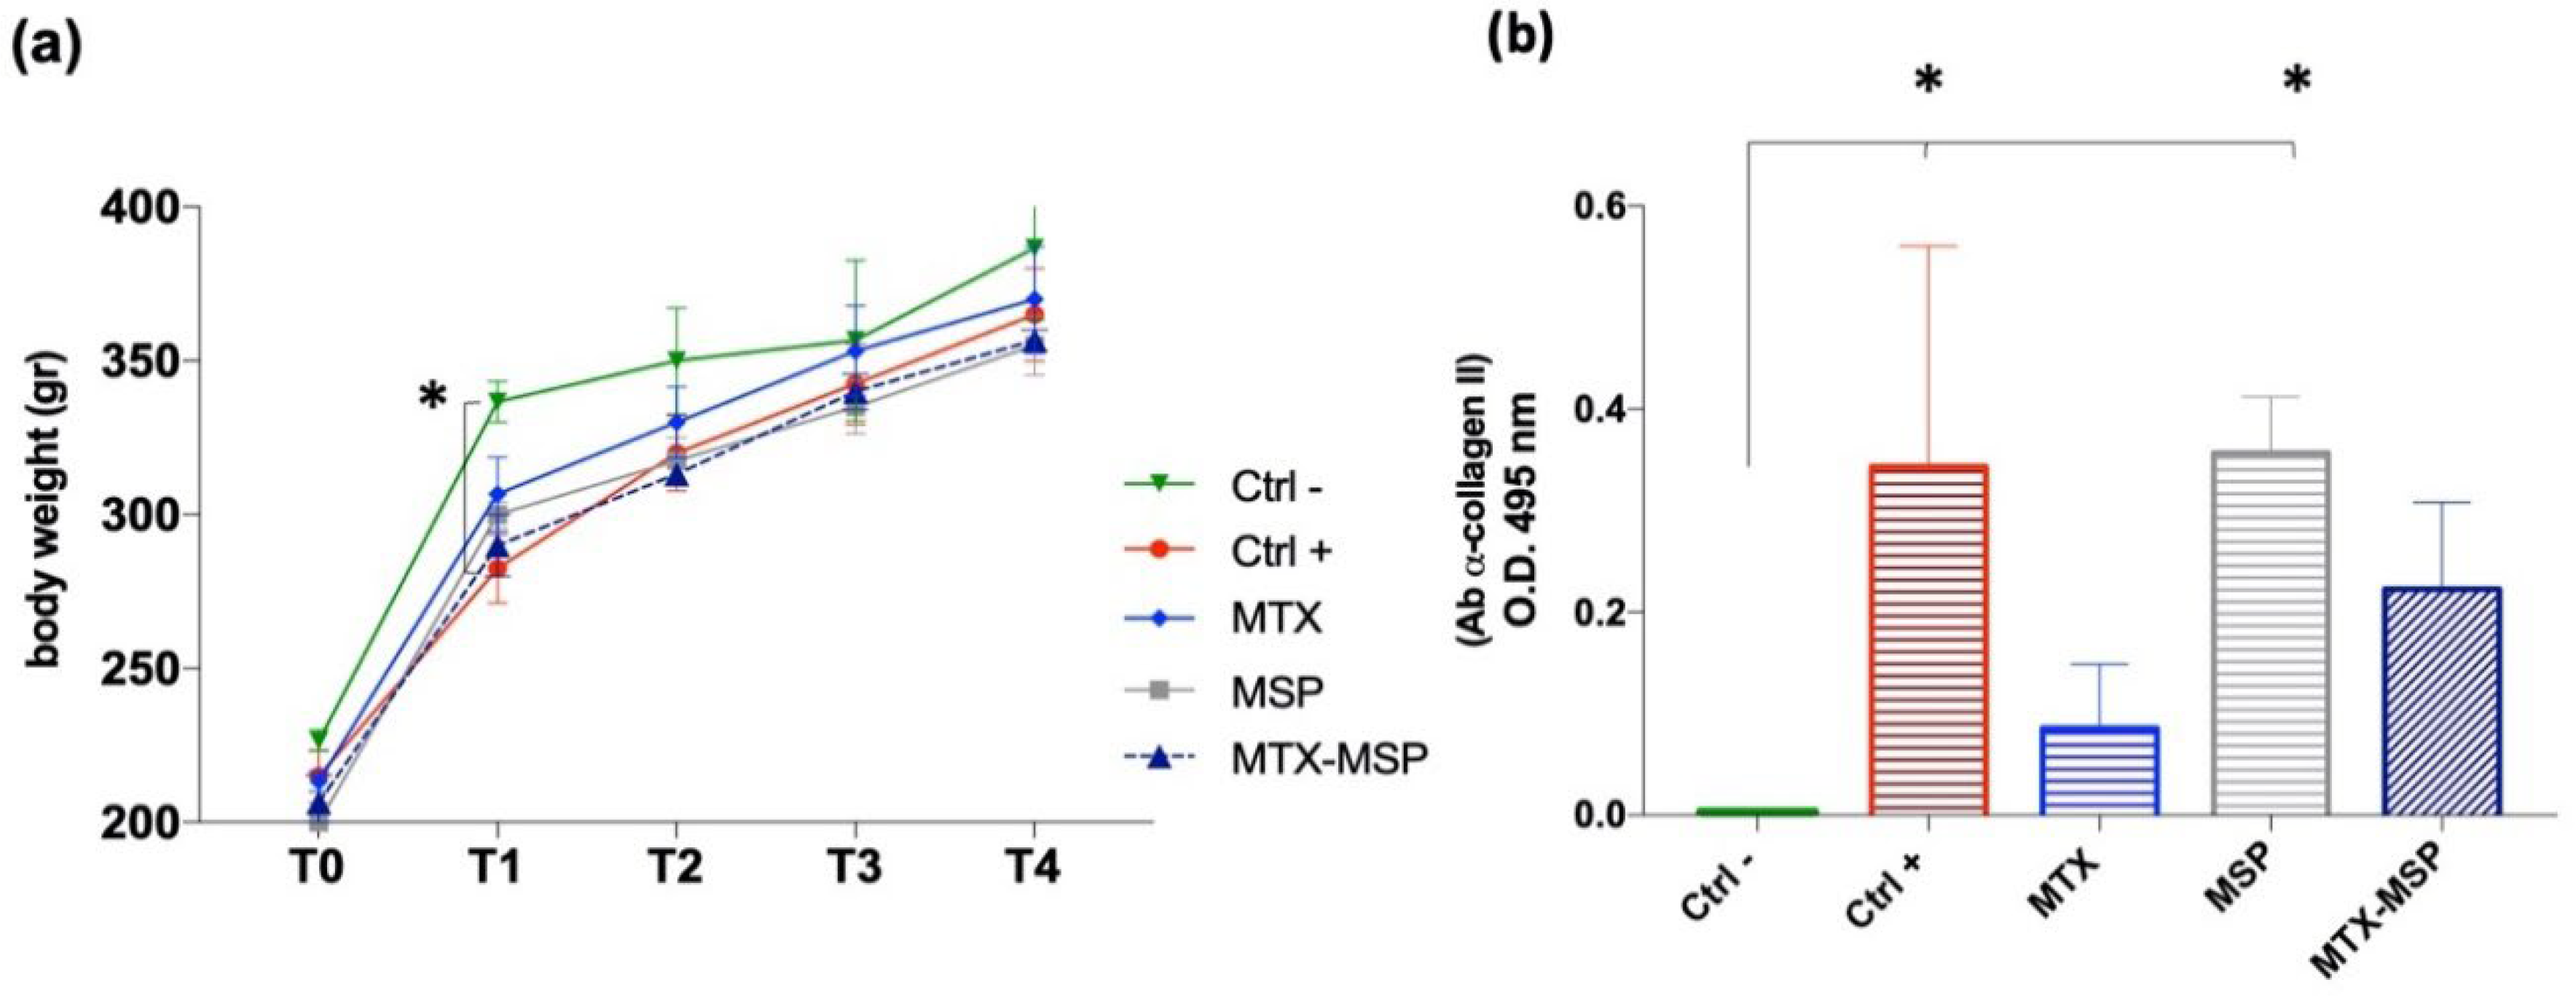
Figure 9.
Analysis of Index of Spleen and Thymus at sacrifice. Data are presented as mean ± SEM.
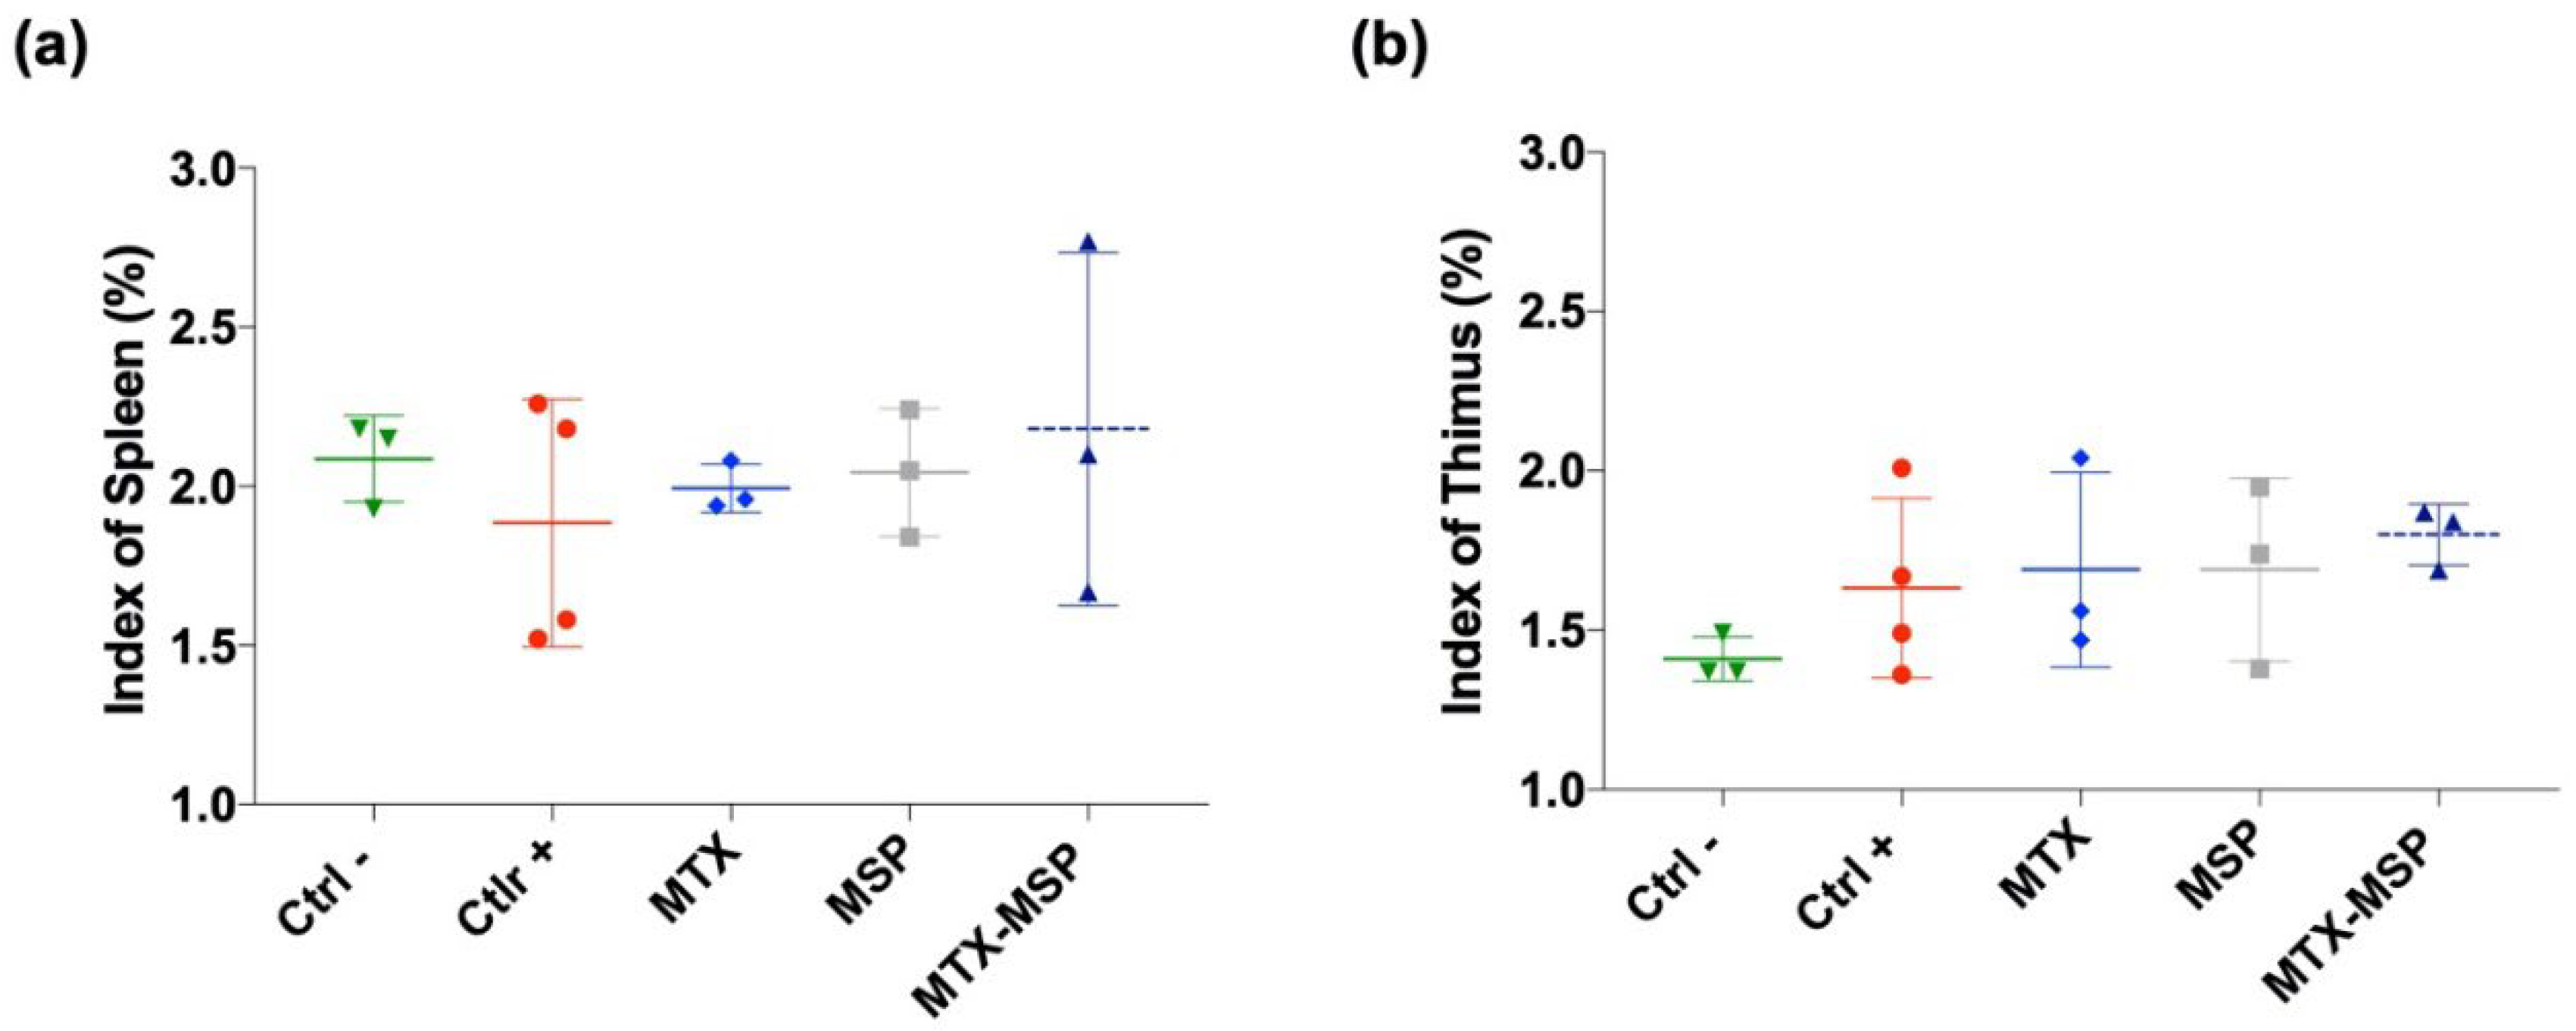
Figure 10.
(a) Histological results of the knee joints stained with hematoxylin and eosin, scale bar=50μm;(b) Rheumatoid Arthritis scores of rats in different groups for both analyzed knees; (c) Rheumatoid Arthritis scores of rats in different groups for right analyzed knees; (d) Rheumatoid Arthritis scores of rats in different groups for left analyzed knees. Data are presented as mean ± SD. *p<0.05; **p<0.01; ***p<0.001; ****p<0.0001 compared with positive control.
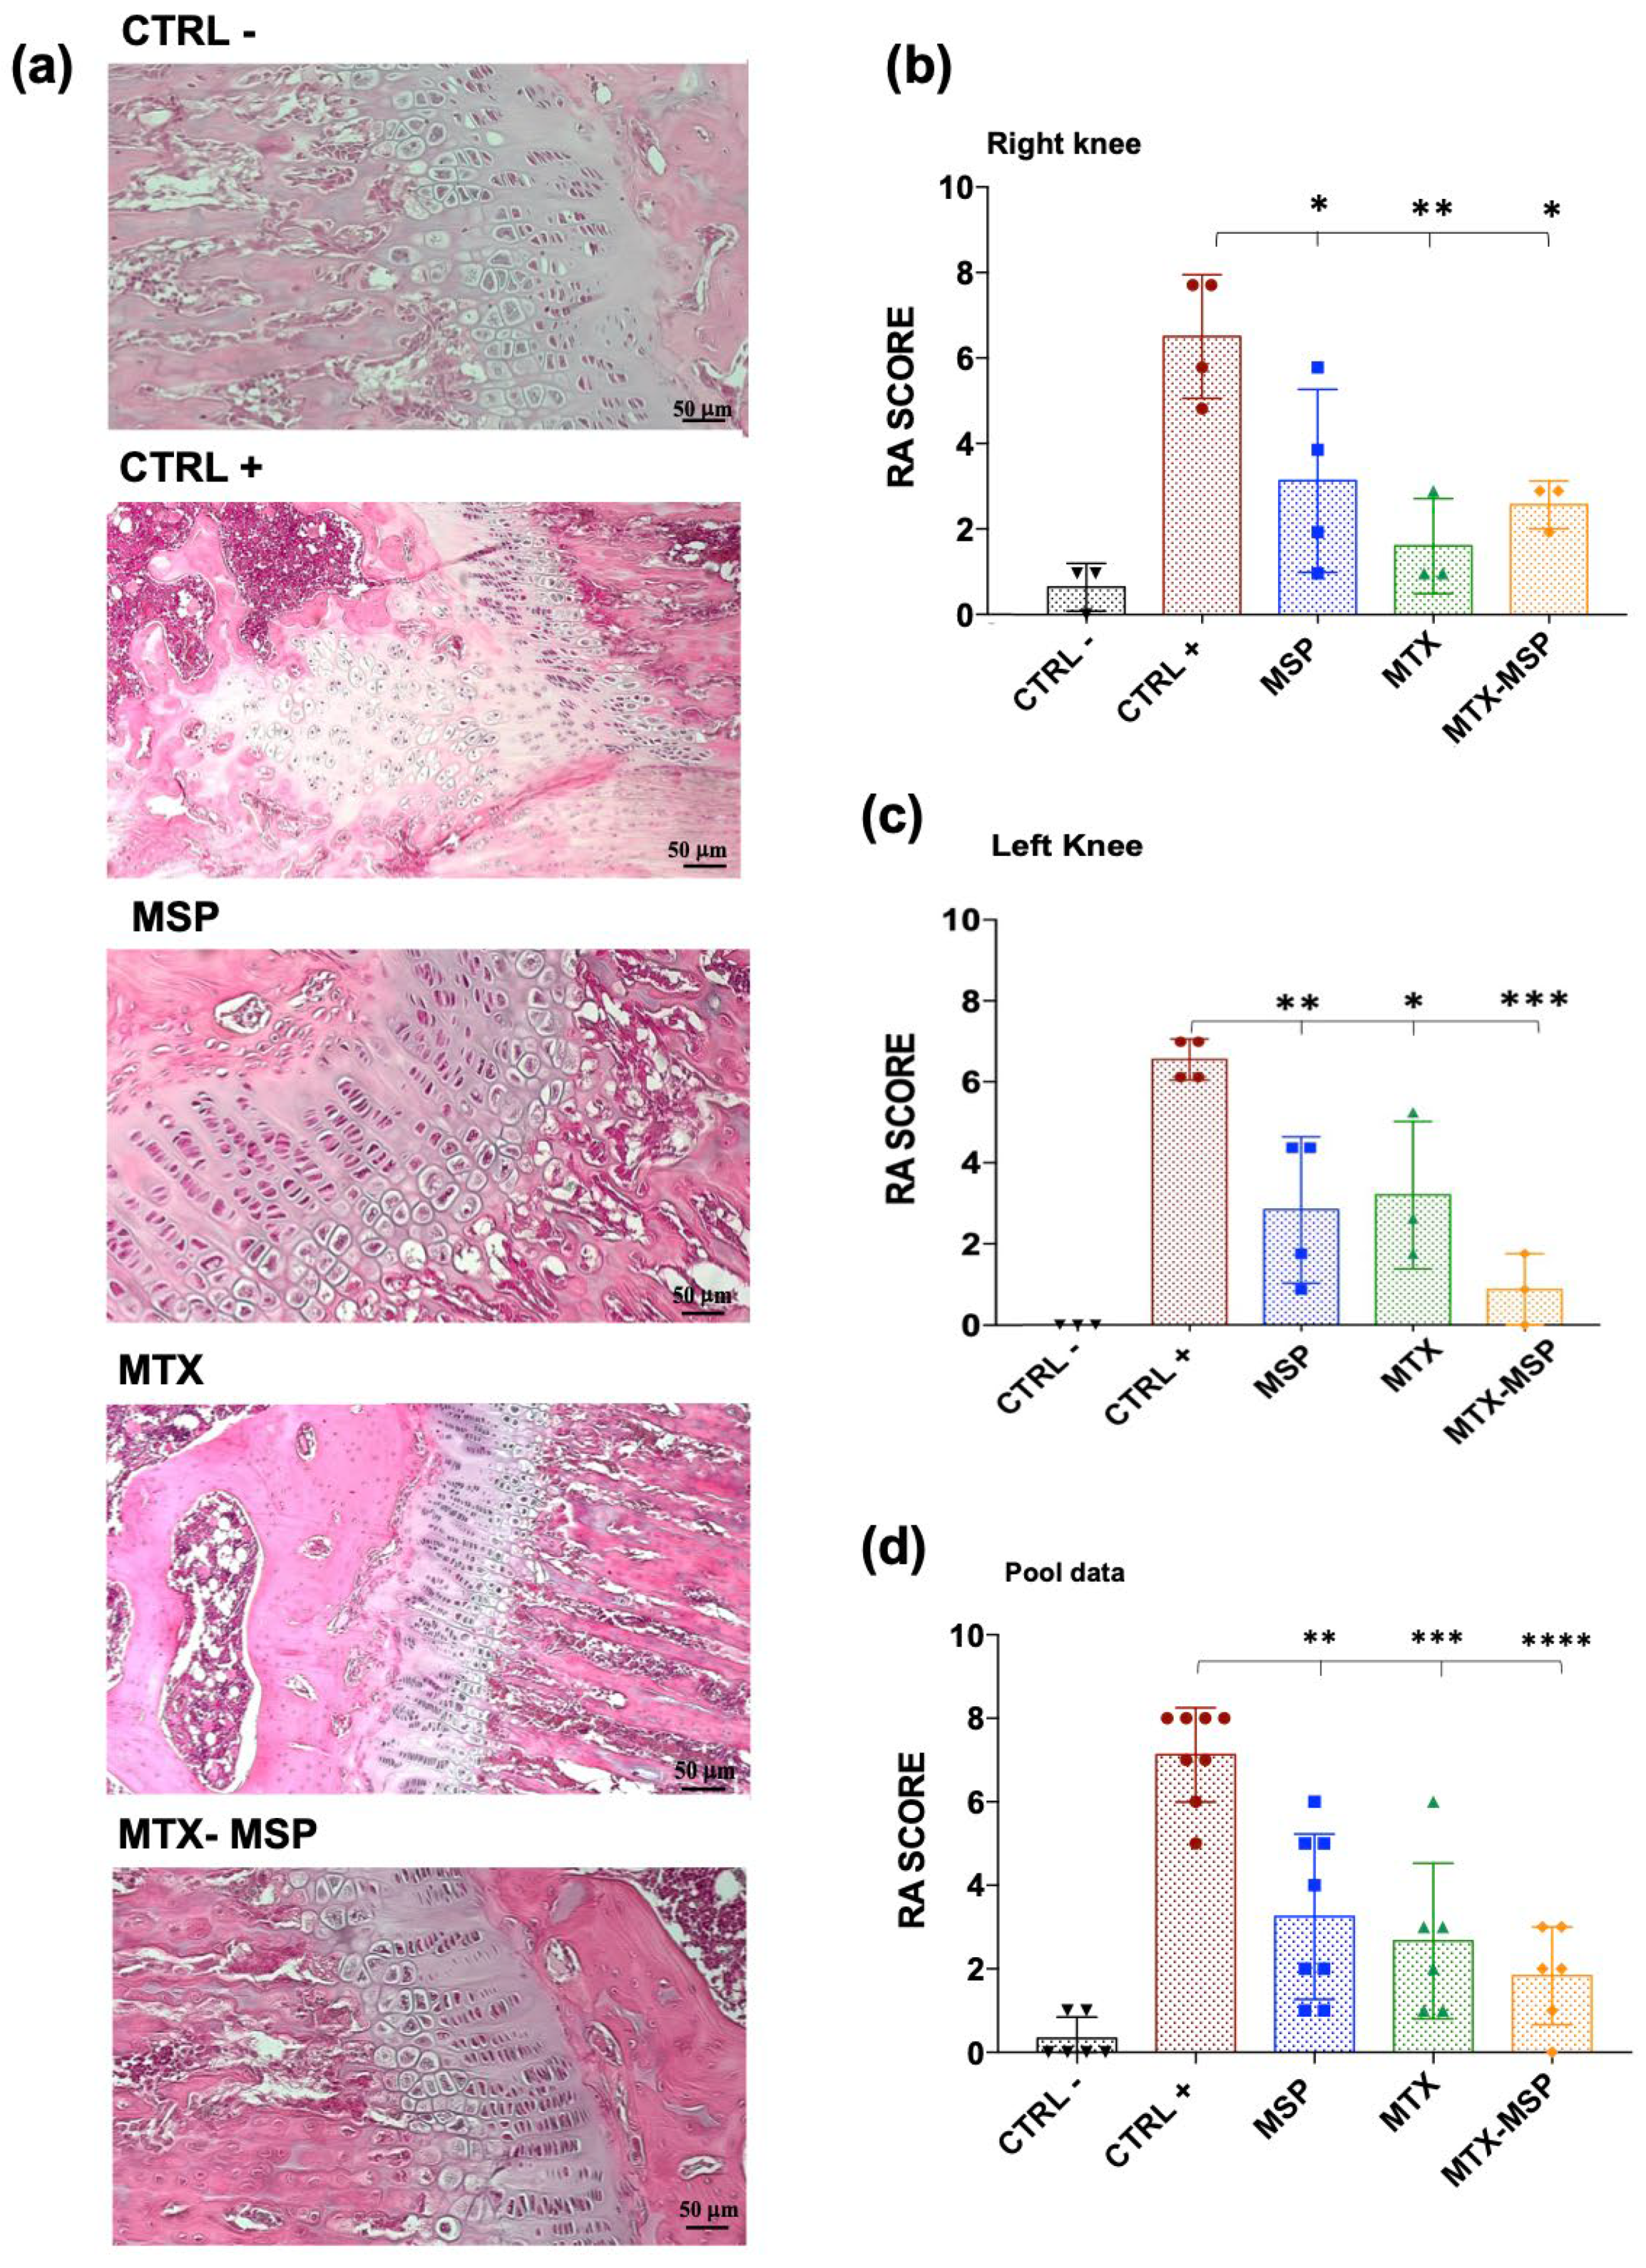
Figure 11.
The levels of IL-1β cytokine from serum determined by ELISA assay at the end of the experiment. Data are presented as mean ± SD.
Figure 11.
The levels of IL-1β cytokine from serum determined by ELISA assay at the end of the experiment. Data are presented as mean ± SD.
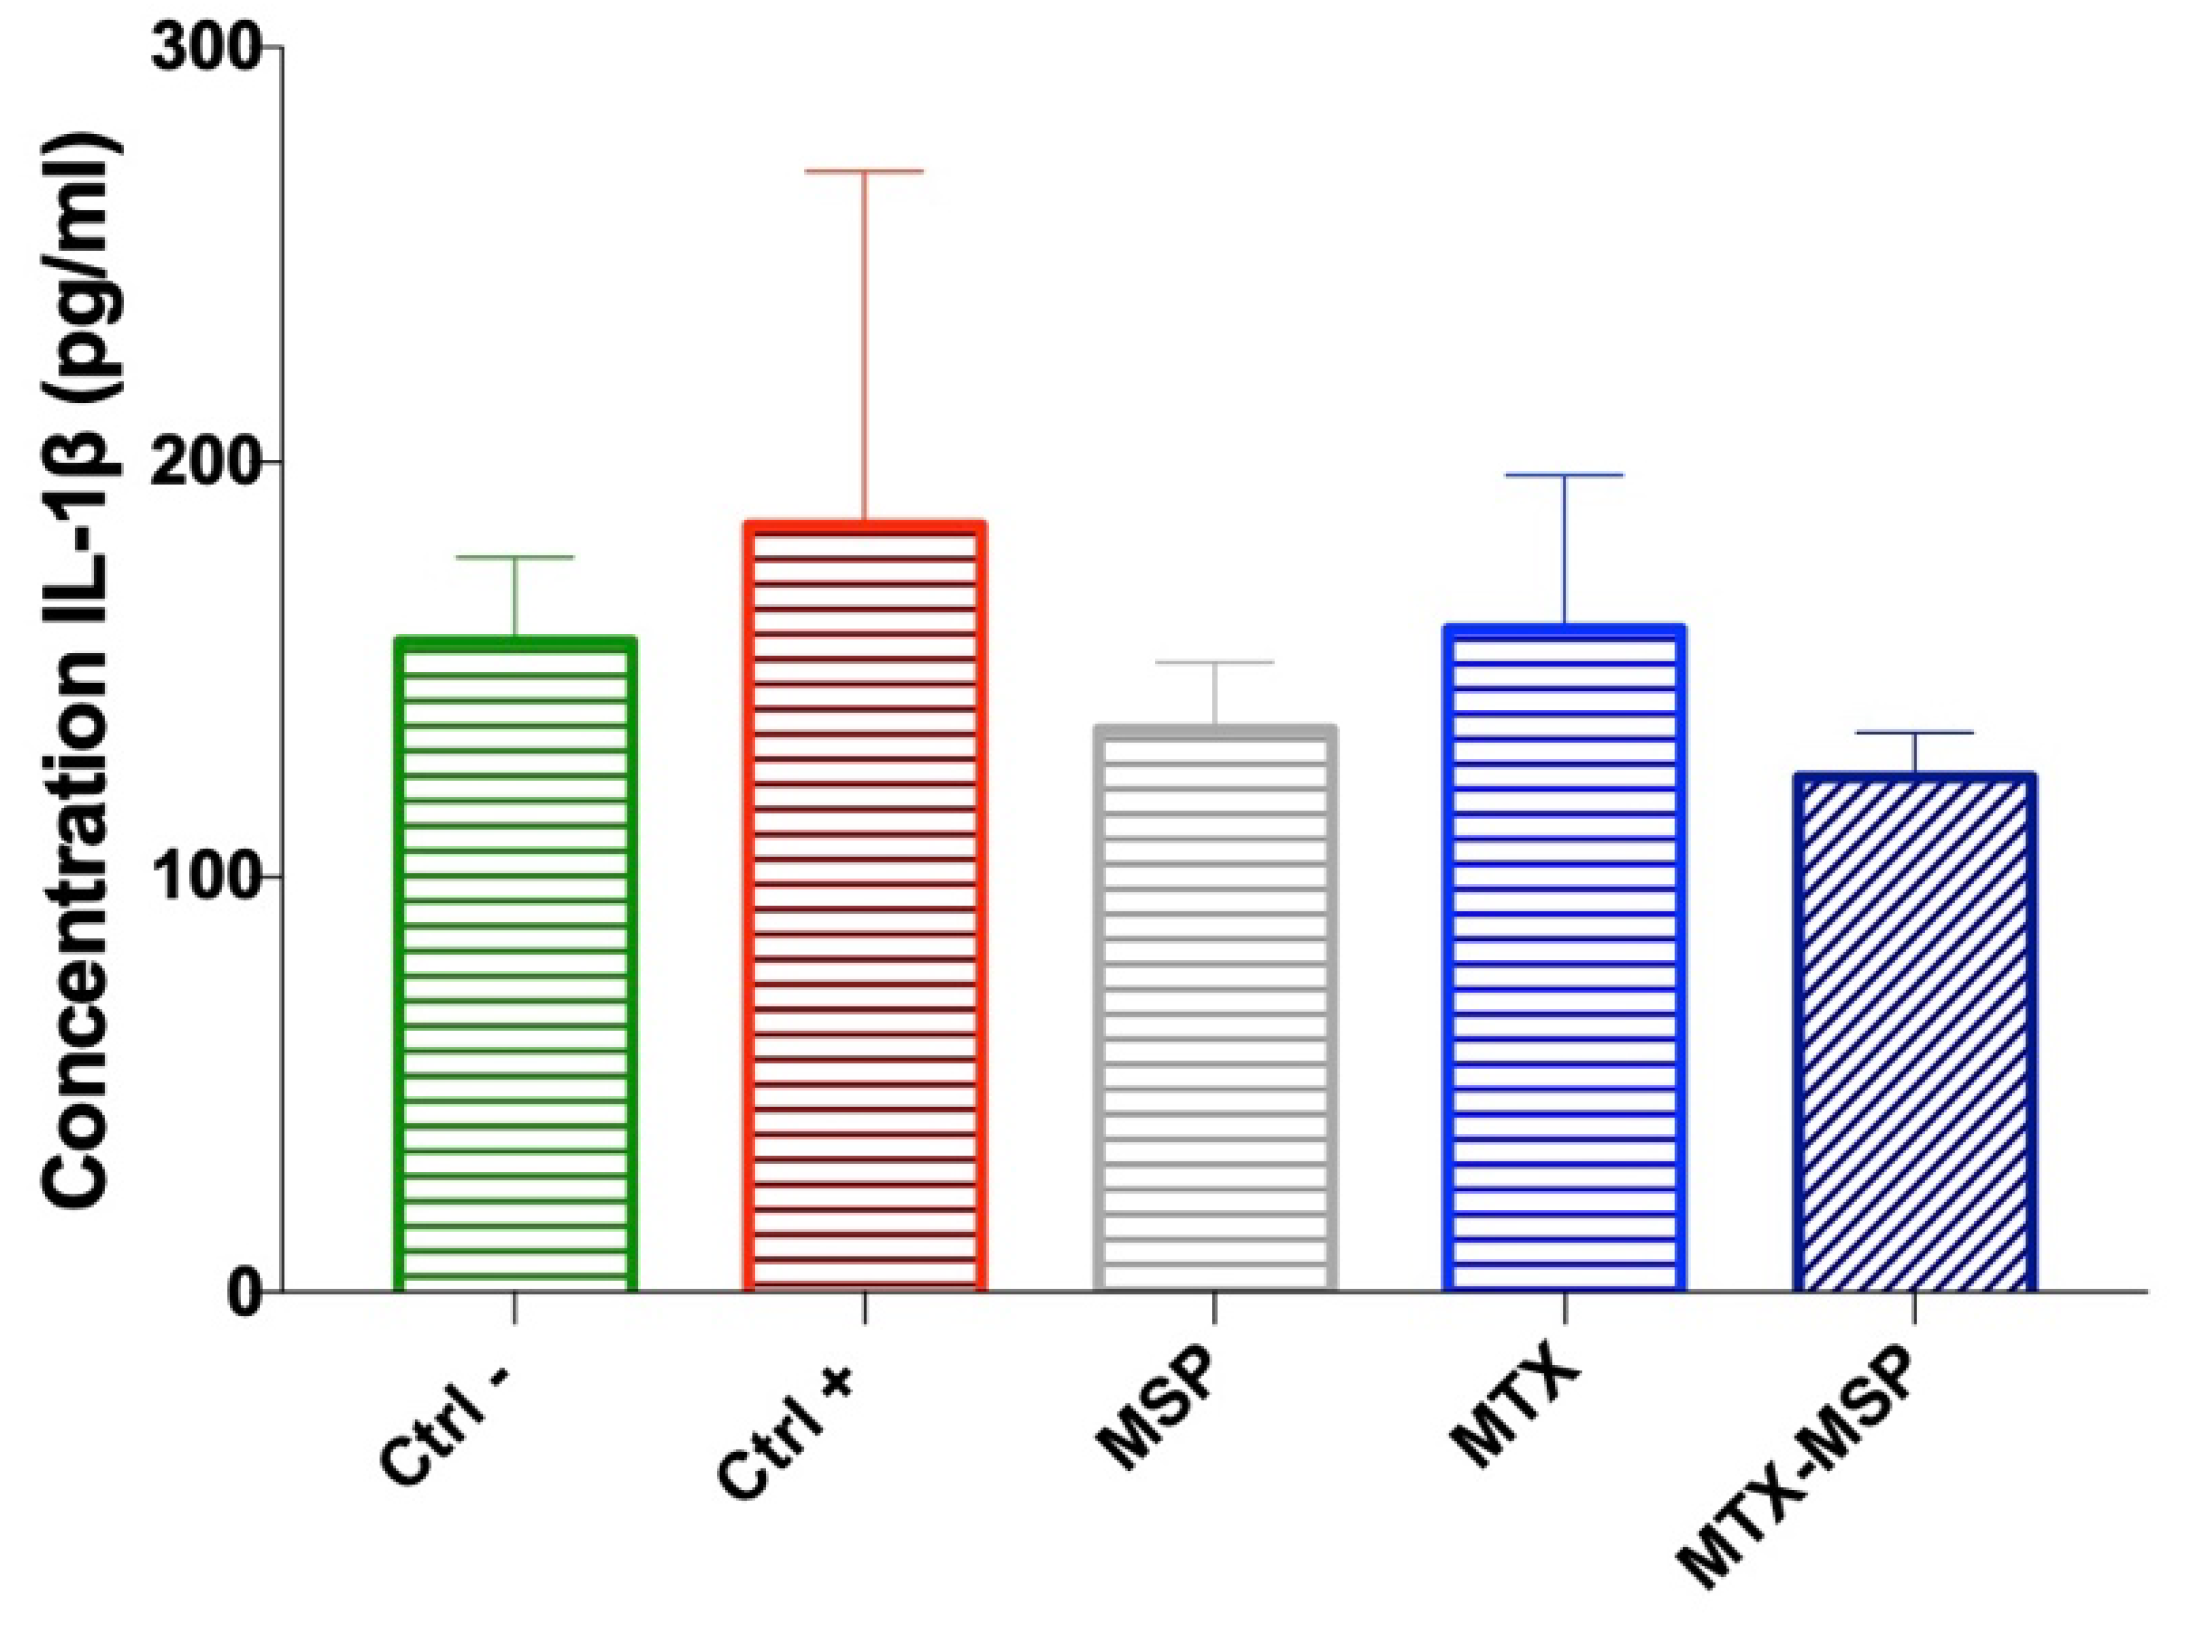
Figure 12.
(a) Histological results of the knee joints stained with H&E, scale bar=50μm; (b) Rheumatoid Arthritis scoring of rats in different groups for analyzed right knees.
Figure 12.
(a) Histological results of the knee joints stained with H&E, scale bar=50μm; (b) Rheumatoid Arthritis scoring of rats in different groups for analyzed right knees.
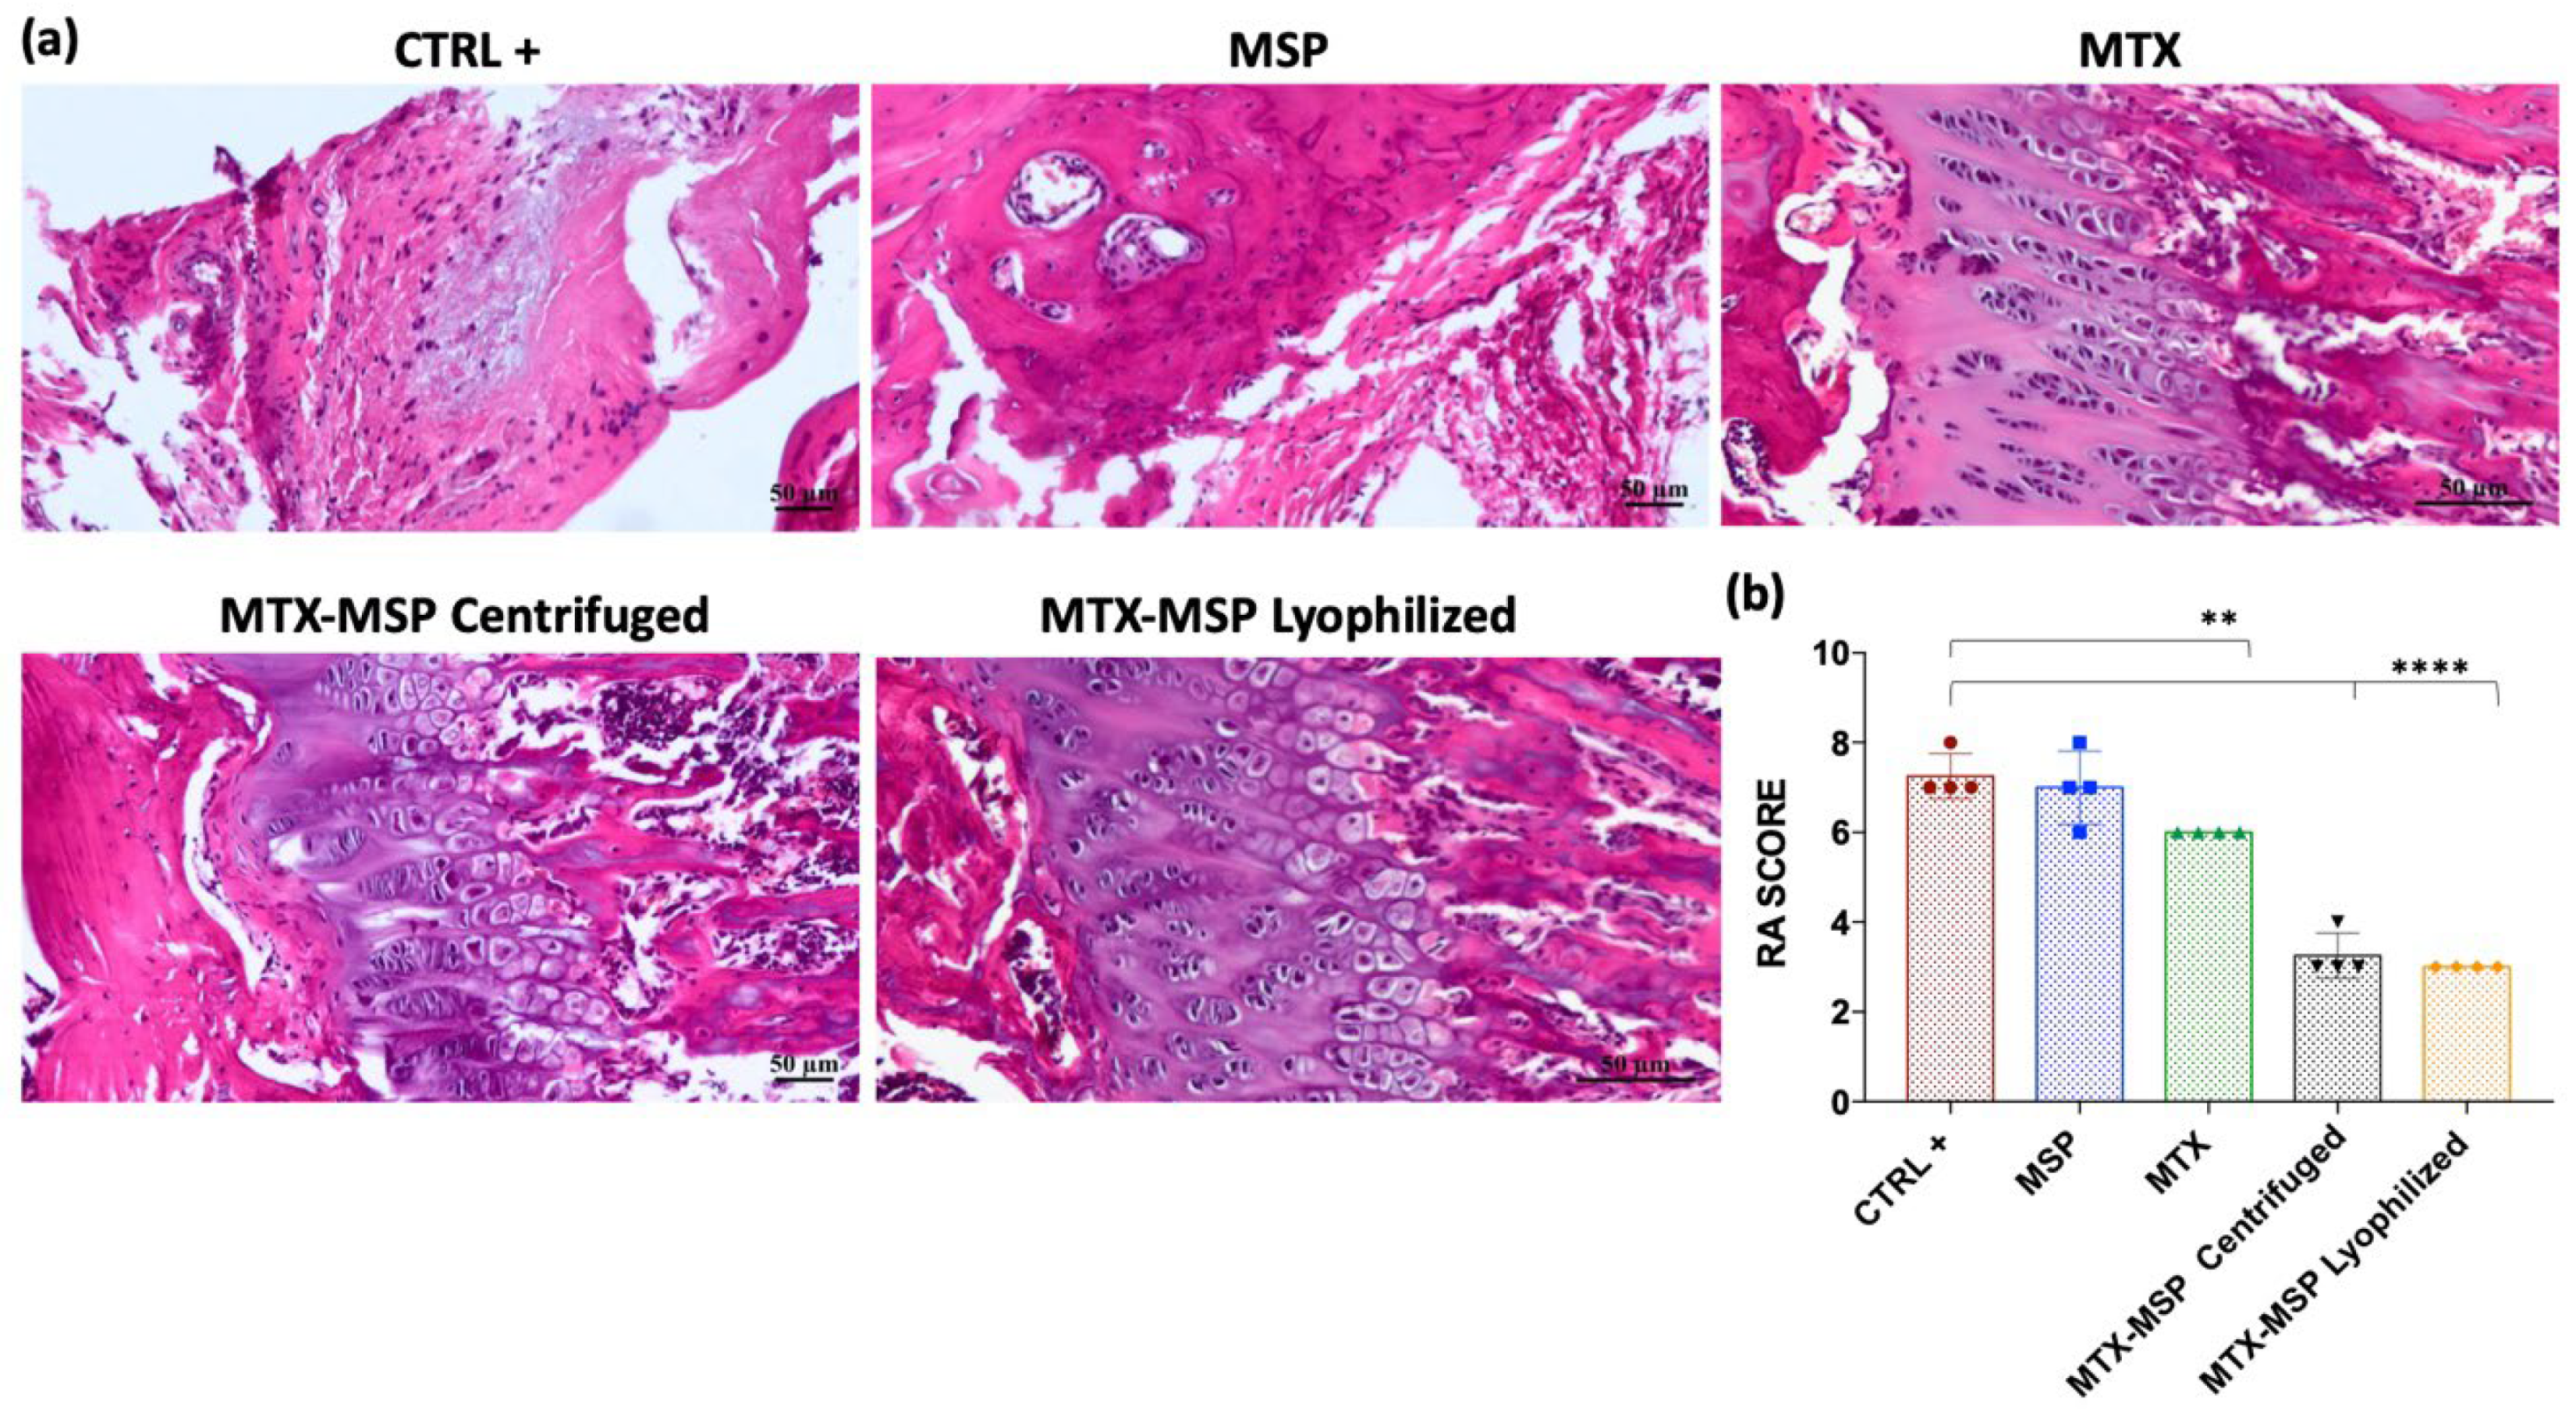

Table 1.
Histological scoring.
| Histological scoring | |||
| Architectural damage | Inflammatory infiltrate | ||
| No alterations | 0 | No inflammatory cells | 0 |
| Slight alterations | 1 | Rare isolated inflammatory cells | 1 |
| Moderate alterations | 2 | Focal infiltration of inflammatory cells | 2 |
| Severe alterations | 3 | Widespread infiltration of inflammatory cells | 3 |
Table 2.
Histological rheumatoid arthritis scoring.
| Histological rheumatoid arthritis scoring | |||||||
| Structure | Cells | Matrix Staining | Tidemark Integrity | ||||
| Normal | 0 | Normal | 0 | Normal | 0 | Intact | 1 |
| Surface irregularities | 1 | Diffuse hypercelluarity | 1 | Slight reduction | 1 | ||
| Pannus and surface irregularities | 2 | Clusters | 2 | Moderate reduction | 2 | ||
| Clefts to transitional zone | 3 | Hypocellularity | 3 | Severe reduction | 3 | Destroyed | 2 |
| Clefts to calcified zone | 4 | No staining | 4 | ||||
| Complete disorganization | 5 | ||||||
Table 3.
Particle size of all samples by SEM.
| Formulation | Centrifuged | Lyophilized |
| Dimensions (μm ± SD) | Dimensions (μm ± SD) | |
| MSP | 8.34 ± 0.35 | 7.44 ± 0.64 |
| MTX-MSP | 7.25 ± 0.55 | 6.87 ± 0.73 |
Table 4.
Mean particle size distribution of unloaded and loaded MSP after lyophilization using Mastersizer® 3000, when MSP are swollen. ζ-potential analysis of all samples using a DLS. Endotoxin concentration in all samples after synthesis process. All analyses were performed in triplicate (n = 3) and results are expressed as the mean ± standard deviation.
| Formulation | Mean particle size (μm) | ζ-Potential (mV) | Endotoxin (EU/mL) |
| MSP | 34.5 ± 0.2 | - 36 ± 2 | < 0.01 |
| MTX-MSP | 60.8 ± 0.5 | - 43 ± 2 | < 0.01 |
Table 5.
Organs histological score.
| Architectural Damage SCORE | Inflammation SCORE | |||||||
| Sample | Untreated | MSP(1 mg) | CL(0.75 mg) | HA(0.25 mg) | Untreated | MSP(1 mg) | CL(0.75 mg) | HA(0.25 mg) |
| LIVER | 0 | < 1 | 1 | 0 | 0 | 0 | 1 | < 1 |
| SPLEEN | 0 | 0 | 0 | 0 | 0 | 0 | 0 | 0 |
| LUNG | 0 | < 1 | 0 | < 1 | < 1 | 0 | 0 | 0 |
| KIDNEY | 0 | 0 | < 1 | 0 | 0 | 0 | 0 | 0 |
Disclaimer/Publisher’s Note: The statements, opinions and data contained in all publications are solely those of the individual author(s) and contributor(s) and not of MDPI and/or the editor(s). MDPI and/or the editor(s) disclaim responsibility for any injury to people or property resulting from any ideas, methods, instructions or products referred to in the content. |
© 2024 by the authors. Licensee MDPI, Basel, Switzerland. This article is an open access article distributed under the terms and conditions of the Creative Commons Attribution (CC BY) license (http://creativecommons.org/licenses/by/4.0/).
Copyright: This open access article is published under a Creative Commons CC BY 4.0 license, which permit the free download, distribution, and reuse, provided that the author and preprint are cited in any reuse.


