
Submitted:
04 November 2024
Posted:
05 November 2024
You are already at the latest version
Abstract
The sigma-1 receptor (Sig-1R) has emerged as a significant target in the realm of pain management and has been the subject of extensive research. Nonetheless, its specific function in inflammatory pain within dorsal root ganglion (DRG) neurons remains inadequately elucidated. This study utilized whole-cell patch clamp techniques, single-cell real-time PCR, and immunohistochemistry to examine the influence of Sig-1R on inflammatory pain induced by complete Freund's adjuvant (CFA) in a rat model. Our results revealed several key findings: 1) The expression of Sig-1R was found to be upregulated during the progression of inflammatory pain, with a notable translocation from the cytoplasm to the membrane; 2) Inhibition of peripheral Sig-1R using S1RA resulted in a reduction of CFA-induced allodynia; 3) Activation of Sig-1R through PRE-084 led to a decrease in the fast sodium current in isolated DRG neurons from CFA-treated rats, which was associated with a diminished action potential (AP) peak and maximum depolarizing rate (MDR), as well as an increased rheobase; 4) Furthermore, PRE-084 was observed to enhance the slow component of the sodium current, resulting in hyperpolarization of the threshold potential and an increase in AP firing frequency, alongside an elevation in the mRNA expression of the slow sodium channel Nav1.9 in CFA-treated rats. In conclusion, our findings suggest that the modulation of sodium channels by Sig-1R in DRG neurons plays a significant role in the mechanisms underlying inflammatory pain.
Keywords:
Sigma-1 receptor
; single cell PCR
; DRG neurons
; voltage-gated sodium current
; Nav1.9
Introduction
The sigma-1 receptor is a key scaffolding chaperone predominantly enriched in the endoplasmic reticulum membranes associated with mitochondria at the subcellular level [1,2]. In states of cellular stress, Sig-1Rs are activated and translocated to the cell membrane or cytosol to interact with functional proteins [3] and ion channels [4], exerting various biological effects.
Approximately 20% of adults suffer from chronic inflammatory and neuropathic pain. However, existing medications have demonstrated limited effectiveness and are associated with a variety of side effects that significantly restrict their application. Consequently, there is a critical need to discover new pharmacological targets for alleviating pain. Sig-1R represents a highly promising and appealing target for analgesic intervention, given its abundant expression in sensory neurons along the pain transmission pathway, particularly in dorsal root ganglion (DRG) neurons [5,6]. Studies have shown that animals with Sig-1R knockout exhibited reduced allodynia and hyperalgesia during pathological pain states, with no effects on acute pain sensation [7]. Similarly, blocking Sig-1Rs has been effective in decreasing hypersensitivity in pathological pain states, including neuropathic pain induced by various etiologies in rats[8,9,10,11] and inflammatory pain resulting from tissue injury [12]. The Sig-1R blocker S1RA (also known as E-52862) has shown analgesic efficacy in phase II clinical trials [10].
The most intriguing mechanism of pain relief associated with Sig-1R involves its interaction with opioid receptors[13,14,15,16]. This interaction enhances the analgesic potency of opioid drugs while simultaneously reducing their side effects and addictive potential. Additionally, Sig-1R has been shown to modulate chronic pain-related ion channels, such as TRPV1 [17] and TRPA1 [18]. Targeting Sig-1Rs on DRG neurons was a strong and effective strategy for inflammatory pain relief, as blockade of peripheral Sig-1Rs on DRG neurons was sufficient to alleviate inflammatory pain [19,20]; the specific effects of Sig-1R on sodium channel function, particularly in DRG neurons, remain unclear. Sodium channels of various subtypes (Nav1.7 [21], Nav1.8 [22], and Nav1.9 [23]) are extensively expressed in DRG neurons and serve different roles in nociception. Nav1.7 is characterized by fast activation and inactivation, driving the membrane potential toward the threshold and initiating firing. Nav1.8 accelerates the action potential’s rising phase and correlates with the AP peak [24]. In contrast, Nav1.9, which has ultra-slow activation and inactivation kinetics, helps maintain subthreshold repetitive firing [25]. It has been shown that all those three subtypes of sodium channels contribute to neuropathic and inflammatory pain [26,27,28,29].
In this study, we utilized a CFA-induced inflammatory pain model to examine the effects of Sig-1R on sodium channels. Our findings reveal that activation of Sig-1R has dual effects on the sodium current: it enhances the slow component while inhibiting the fast component. This highlights the potential therapeutic benefits of targeting Sig-1Rs and their interactions with Nav1.9 in pain management.
Method
The Complete Freund’s Adjuvant (CFA) Treated Animal Model
Female juvenile Sprague-Dawley rats, weighing between 150 and 200 grams, were accommodated in the animal facility at Tongji Medical College, Huazhong University of Science and Technology, with free access to food and subjected to a natural day/night cycle. All experimental procedures were approved by the Animal Welfare Committee of Huazhong University of Science and Technology, and all experiments in this study were conducted in accordance with the guidelines set forth by this committee.
Animals were anesthetized via isoflurane inhalation. To induce inflammation in the entire hind limb, CFA was injected intradermally at the plantar surface of the left hind paw and the lateral region of the left knee (100 μl for each site) [30]. Sham animals received saline injections.
To investigate the role of peripheral Sig-1Rs in the development of CFA-induced inflammatory pain, the selective Sig-1R blocker S1RA was injected (125 μg/20 μl/site) 12 hours before CFA administration and daily until the 7th day after CFA injection. The injection sites were the same as those used for CFA. Pain-related behavior tests were performed before and 2 hours after S1RA injection.
Behavior Test
All selected CFA animals maintained good health and exhibited indistinguishable levels of exploratory behavior, feeding activity, and weight gain compared to normal rats. Responses were measured 1 day prior to CFA injection and at 1, 3, and 7 days post-injection.
Mechanical allodynia and cold allodynia were tested as signs of stimulus-evoked pain. To test mechanical allodynia, the animal was placed on a metal mesh floor, and the plantar surface of each hind paw was touched for approximately 2 seconds with a series of von Frey filaments (Touch-Test; North Coast Medical, Morgan Hill, CA) providing forces of 0.6, 1, 1.4, 2, 4, 6, 8, 10, 15, and 26 g. Each filament was applied 5 times to different areas of the middle of the plantar surface until 100% withdrawal was achieved from the five applications [31]. A 1-minute interval was allowed between tests on alternate hind paws and a 2-minute interval between subsequent tests on the same hind paw. A withdrawal response during or immediately after the application of the von Frey filament was recorded as positive. Since the minimum force required to elicit a positive response in both the untreated and treated contralateral sides was greater than 2.0 g, mechanical allodynia was defined as a response to a force of less than 2.0 g. The 50% paw withdrawal threshold (PWT) was determined from the stimulus-response curve.
To test cold allodynia, a drop of acetone was applied using a 1 mL syringe directly to the plantar surface of each hind paw for 5 consecutive applications. The interval between each application was 3 minutes. A flinching, licking, or paw shaking response during or immediately after acetone application was considered positive and arbitrarily scored as 1, with no response scored as 0.
Investigation of the Electrophysiological Properties of Dissociated DRG Neurons
Animals were euthanized by cervical dislocation. Dorsal root ganglia from L4-6 were dissected and digested at 37ºC in 1 mg/ml trypsin for 30 minutes, followed by digestion in 1 mg/ml collagenase II for 30–50 minutes. The enzyme solutions were prepared in DMEM. The dissociated neurons were collected via low-speed centrifugation (1000 rpm for 1 minute) and kept in a 4ºC DMEM solution for patch clamp recording within 8 hours. The neurons were placed in the perfusion chamber mounted on the stage of an inverted microscope (Zeiss). After attachment, patch clamping was performed at room temperature (25 ± 1ºC). Pipettes with a resistance of 1.5–2.5 MΩ, after being filled with the pipette solution, were used for patch clamp recording. The electrical signals were amplified with Axonpatch-1B (Molecular Devices), digitized with Digidata-1322A (Molecular Devices), and sampled at 50 kHz using the pClamp 8 software suite (Molecular Devices). Data with series resistance higher than 8 MΩ were not used. Images of each patched neuron were taken for offline size measurement.
To record action potentials (APs), the neurons were perfused with Artificial Cerebrospinal Fluid (ACSF), which was composed of (in mM): NaCl 124, NaHCO3 26, KCl 3, glucose 10, CaCl2 2, NaH2PO4 1.3, and MgCl2 2, and kept saturated with 95% O2 and 5% CO2. The pipette solution was composed of (in mM): KCl 20, HEPES 10, EGTA 1, Na2ATP 2, K+ gluconate 120, and MgCl2 2. The pH was adjusted to 7.4 with NaOH. A series of 2-second currents, with increments of 20 pA and intervals of 5 seconds, were injected to evoke APs under current clamp mode.
The properties of the AP and sodium current were analyzed offline with custom written Spike2 (version 7.0, Cambridge Electronic Design Limited) scripts. The resting membrane potential (RP) was determined as the stable potential level when no current was injected. Rheobase was defined as the minimum injected current amplitude required to evoke an AP (Figure 1). The maximum AP depolarizing rate (MDR) and repolarizing rate (MRR) were determined by taking the first derivative of the action potential waveform. The threshold potential was defined as the critical level of the depolarized membrane potential from which the AP was successfully triggered. To determine this threshold, segments of the slow and fast depolarization parts were linearly fitted, respectively (illustrated by lines a and b in the inset of Figure 1). The crossover point of the two fitting lines indicated the threshold level (illustrated by line c in the inset of Figure 1).
To record sodium current, the NaCl in the ACSF was replaced with equal molar TEA-Cl, and the pipette solution was composed of (in mM) CsCl 125, NaCl 13, TEACl 20, HEPES 5, Na2ATP 5, and EGTA 10. This change reduced the external/internal sodium gradient and thus controlled the sodium current amplitude at a relatively low level; this was helpful in reducing the voltage error generated by series resistance, which could otherwise result from very high sodium current amplitudes if physiological solutions were used. To separate the fast and slow sodium current components, two sets of command potentials were applied under voltage clamp mode sequentially. The potential of the target cell was held at -100 mV for 30 ms and then depolarized from -110 mV to +40 mV for 50 ms (with a step of +5 mV and an interval of 2.5 seconds) (Figure 2A, upper). This activated the whole sodium current (both fast and slow components included; Figure 2A, bottom). The membrane potential of the cell was then set to -40 mV to deactivate the fast sodium component, before the potential was depolarized from -100 mV to +40 mV (Figure 2B, upper). Thus, the slow component of the sodium current was separated (Figure 2B, bottom). The fast sodium component was obtained via offline subtraction of the slow from the whole sodium current (Figure 2C).
Immunohistochemistry
Rats were euthanized with an overdose of sodium pentobarbital (i.p. 60 mg/kg) and were perfused transcardially with saline solution, followed by 4% paraformaldehyde in 0.1 M phosphate buffer (pH 7.4). The bilateral L4 and L5 dorsal root ganglia (DRGs) were removed, post-fixed in 4% paraformaldehyde for 1 hour, and cryoprotected in 30% sucrose in 0.1 M phosphate buffer for 12 hours. The DRGs were embedded in OCT embedding medium and stored at -80°C until processing. The DRGs were sectioned at 7 μm thickness using a cryostat and thaw-mounted onto electrostatic glass slides. Sections were washed in phosphate-buffered saline (PBS) containing 0.2% Triton X-100 three times for 5 minutes, blocked in SuperBlock solution (5% bovine serum albumin, 10% fetal bovine serum, 0.2% Triton X-100 in PBS) for 2 hours at room temperature, and then incubated overnight at 4°C with Sig1-R primary antibody diluted in blocking solution. Sections were washed three times with PBS and incubated for 4 hours in secondary antibody (Alexa Fluor 555 goat anti-rabbit, 1:1000 dilution, Invitrogen, USA). Hoechst (1 µg/mL) was added to the secondary antibody solution for nuclear staining. Sections were washed three times in PBS prior to coverslipping with Fluoroshield (F6182-20ml, Sigma, USA). Images were acquired using a Leica TCS SPE confocal microscope with the Leica Application Suite.
The labeling of Sig-1R was analyzed with a custom-designed application based on the MATLAB App Designer framework (MATLAB Version: 24.1.0.2628055 (R2024a) Update 4). The RGB images were converted to grayscale format (Figure 3 A). An interactive segmentation method was applied to delineate the whole-cell boundary and, if labeled, the membrane and nucleus regions (Figure 3 B). These regions were first automatically determined, and for each cell, the user was prompted to confirm their accuracy. Manual adjustments were made as necessary (Figure 3 B, cells 2 and 5). The number of pixels in each region was counted, and the mean pixel intensity was calculated. The whole cell area was defined as the enclosed pixel number multiplied by the unit pixel area, which was determined according to the scale bar. The diameter of the neuron was calculated using the equation: Diameter =.
Single-Cell PCR
To reduce the interference from cell type heterogeneity, real-time PCR was performed at the single-cell level. The detailed method has been described previously [32]. In brief, DRG neurons with diameters less than 30 μm were collected using a modified patch-clamp pipette. To evaluate the effect of the Sig1-R agonist PRE-084, DRG neurons were collected from 6 sham rats and 6 CFA3D rats; thus, a total of 12 groups (6 sham + 6 CFA3D) of neurons were obtained. These 12 groups of neurons were thoroughly mixed and then halved isovolumetrically. One portion was used as control, and the other was treated with PRE-084 (10 μM) for 30 minutes before further processing. Due to this grouping method, we regard the objects before and after the PRE-084 treatment as ‘identical’; thus, a paired t-test was applied to evaluate the effect of PRE-084. mRNA was extracted using the Dynabeads mRNA DIRECT Micro Kit, and the mRNA was reverse transcribed using the Superscript VILO cDNA Synthesis Kit.
Primers for Nav1.6–1.9 were designed to span the exon/exon boundaries using Primer Express 2.0 (Applied Biosystems). This design avoids co-amplification of any contaminating genomic DNA, which could compromise the specificity of the amplification. The specificity of the primers was verified using BLAST (http://www.ncbi.nlm.nih.gov/BLAST). The primers were ordered from Sangon (Shanghai, China), and their sequences are listed in Table 1.
A 10 μl reaction system was prepared and run in a PCR machine (CFX Connect Real-time system, Bio-Rad Laboratories, Inc.). The reaction system consisted of: 5 μl of 2X reaction buffer (Power SYBR Green PCR Master Mix, Applied Biosystems, catalog no.: 4368708), 1 μl of 10X primer mix, template cDNA, and RNAase-free water (Takara). The concentration of the primer mix was 2 µmol/l, resulting in an optimized final concentration of 200 nmol/l. GAPDH was used as the housekeeping gene. The quantification method was a modification of the 2-ΔΔCT method; instead of assuming an amplification efficiency of 2, the amplification efficiency for each transcript in this experiment was estimated using the sigmoidal curve-fitting method described by Liu et al. (Liu and Saint, 2002).
Chemicals
The following chemicals were used: CFA (Sigma, St. Louis, MO), Sig1-R primary antibody (Rabbit polyclonal antibody, 1:2000, A5479, ABclonal, China), PRE-084 (HY-18100A, MedChemExpress, China), S1RA (HY-18099, MedChemExpress, China), PCR kits (Invitrogen; Dynabeads mRNA DIRECT Micro Kit, catalog no.: 610.21; Superscript VILO cDNA Synthesis Kit, catalog no.: 11754-50), Collagenase II (Worthington, S4B70644176) and Trypsin (Sigma, T-8003). CFA (Sigma, St. Louis, MO) was suspended in an oil/saline emulsion (1:1). One ml of CFA contains 1 mg of heat-killed and dried mycobacterium tuberculosis (strain H37Ra, ATCC25177), 0.85 ml of paraffin oil, and 0.15 ml of mannide monooleate. All other chemicals not stated were obtained from Sigma.
Analysis
Statistical analysis was performed using SPSS 27 (IBM). A paired or independent t-test was used to compare differences within or between groups if the data were normally distributed; otherwise, Wilcoxon matched-pairs test or Mann-Whitney test was applied for rank comparisons of the paired or unpaired data, respectively. Chi-square Pearson analysis was performed to compare the percentage of neurons with membrane or nucleus-region labeling. Figures were plotted using GraphPad Prism 9.0 (GraphPad Software, LLC).
Results
CFA treatment Increased the Expression of Sig-1R and Led to Its Recruitment from Intracellular Compartments Toward the Membrane
In this study, labeling information for 679 neurons was collected, with diameters ranging from 17 to 104.5 μm and a mean diameter of 47.3 μm. The values for the 10th, 30th, and 50th percentiles were 31.3, 38.9, and 45.1 μm, respectively (Supplementary Table 1, Supplementary Figure 1). The labeling properties, including whole-cell intensity and labeling ratios at the membrane and nucleus regions, displayed no differences between neurons of different sizes (data not shown). Therefore, the statistical results of the labeling properties were based on information from all neurons, regardless of size. However, for single-cell PCR and whole-cell patch clamp experiments, data were obtained only from neurons with diameters less than 30 μm.
In sham animals, Sig-1R was aggregated in the central nucleus region in 59.4% of neurons (85 out of 143). No membrane labeling was observed (Table 2). For the nucleus-region labeled neurons, the intensity of the whole cell, nucleus region, and plasma region (excluding the nucleus region) were 101.5 ± 2.2, 145 ± 3.5, and 89.9 ± 2.1, respectively. For neurons without nucleus-region labeling, the whole-cell intensity was 87.5 ± 2.2 (Supplementary Table 2).
In CFA3D animals, the expression of Sig-1R was significantly enhanced. Compared with the sham group, the intensity of Sig-1R at the whole-cell level increased significantly from 95.8 ± 1.7 (sham) to 126.2 ± 2.0 (CFA3D) (p < 0.01).
After CFA3D, Sig-1R was recruited from the central region toward the membrane. Compared with the sham group, the ratio of neurons with central nucleus-region aggregation decreased to 27% (44 out of 162 neurons), while the ratio of neurons with membrane-region aggregation increased to 29.6% (48 out of 162 neurons) (p < 0.01, vs. sham; Pearson Chi-squared analysis, Table 1, Figure 4B). For the nucleus-region labeled neurons, the intensity of the whole cell, nucleus region, and plasma region (excluding the nucleus region) were 197.5 ± 3.8, 168.2 ± 4.8, and 124.3 ± 4.1, respectively. For neurons without nucleus-region labeling, the whole-cell intensity was 122.3 ± 2.2 (Table 2).
The increased intensity of Sig-1R observed in CFA3D persisted until CFA7D, with a trend of translocation back toward the nucleus region. Similar to CFA3D, the Sig-1R labeling intensity in CFA7D (119.5 ± 3.5, Figure 4B) and the membrane labeling ratio (3.4%, Table 2) were significantly higher than those of sham. Compared with CFA3D, the ratio of neurons with membrane labeling significantly decreased, while the ratio of nucleus-region labeling significantly increased (Table 2), indicating trafficking from the membrane back toward the nucleus region.
The trafficking observed in CFA3D ceased by CFA10D, leading to a recovery back to normal levels (vs. sham). No membrane labeling was observed at this stage, and the ratio of nucleus-region labeling was 63% (Figure 4, Table 2); these ratios were not different from those of the sham groups. The increased labeling intensity also downregulated to normal levels (vs. sham, Figure 4B).
In summary, the labeling intensity of Sig-1R increased from CFA3D to CFA7D and recovered back to normal levels by CFA10D. The nucleus-region aggregated Sig-1R was trafficked toward the membrane (CFA3D) and began to traffic back toward the central region (from CFA7D to CFA10D).
Blocking Sig-1R Rescued CFA-Induced Allodynia
To investigate the effect of the enhanced membrane-trafficked Sig-1R that occurred after CFA3D-7D, the Sig-1R blocker S1RA was administered, and its effects on animal behaviors were examined.
Compared with sham, CFA injection induced prominent mechanical and cold allodynia (at days 1, 3, and 7, Figure 5). For instance, three days after CFA injection, the mechanical 50% paw withdrawal threshold was significantly reduced from 26.3 g to 4.7 g (Figure 5B), and the scores of cold allodynia increased from 1.2 to 7 (Figure 5A) (CFA vs. sham, Mann-Whitney test, p < 0.01).
Administration of the Sig-1R antagonist S1RA partially rescued CFA-induced allodynia, with this effect evident during the entire treatment period. Notably, scores of cold allodynia after CFA at day 3 were significantly decreased from 7 to 2.4, and the 50% PWT increased from 4.7 g to 7 g (before vs. after S1RA, Mann-Whitney test, p < 0.05).
Effects of Sig1-R Agonist on the Electrophysiological Properties of DRG Neurons
Compared with sham, CFA3D significantly reduced the maximal response rate (MRR) from 74.1 ± 12.9 to 48.3 ± 8.2 V/s (sham vs. CFA3D, p < 0.05, Figure 6E); however, CFA3D did not alter the action potential (AP) properties of resting potential (RP), peak, and rheobase (Figure 6A, B, D).
The Sig-1R agonist PRE-084 hyperpolarized the RP and reduced the AP peak in both sham and CFA3D animals. Specifically, in CFA3D, the RP was hyperpolarized from -53.4 ± 3.0 mV to -57.8 ± 3.8 mV, while the AP peak decreased from 35.1 ± 2.8 to 26.1 ± 2.6 mV (before vs. after PRE-084, p < 0.01, paired t-test). In CFA3D, PRE-084 significantly decreased the MRR from 48.3 ± 8.2 to 40.3 ± 6.8 V/s; this effect was not observed in the sham animals.
In CFA3D, PRE-084 showed a trend toward hyperpolarizing the threshold, although this effect did not reach statistical significance (p = 0.09, Figure 6C). PRE-084 significantly increased the rheobase in the sham group (from 84 ± 16.8 to 150 ± 35.3 pA); however, this effect was not observed in the CFA3D group (Figure 6D).
In contrast to its hyperpolarizing effect on the RP, PRE-084 significantly increased the AP firing frequency, recorded at rheobase (Figure 6F).
Effects of Sig1-R Agonist on Fast and Slow Sodium Current
Activating the Sig-1R in isolated DRG neurons showed opposite effects on the fast and slow sodium components. The fast sodium current components were reduced by PRE-084 in CFA3D at test potentials ranging from -65 mV to +30 mV (asterisks in Figure 7B), as demonstrated by Figure 7C (before) and Figure 7D (after PRE-084). The effects of PRE-084 on sham groups were not significant (Figure 7A).
In contrast to its effect on the fast sodium current, PRE-084 enhanced the slow component of the sodium current. This effect was observed in both the sham (from -45 to +20 mV) and CFA3D (from -40 to -5 mV) groups (Figure 8A and Figure 8B). Figure 8C and Figure 8D illustrate the example slow sodium current traces before and after the administration of PRE-084.
Discussion
Our study has made several key discoveries that shed light on the role of peripheral Sig-1Rs in modulating inflammatory pain. Firstly, we found that Sig-1R immunofluorescent staining was significantly upregulated in small DRG neurons 2 days after CFA injection, with a shift in localization from the nucleus to the cytoplasm and cell membrane. Interestingly, the dynamic change of the expression of this receptor along the time scale correlates well with the development of pain-related behavior. Secondly, locally administered Sig-1R antagonists effectively reversed mechanical and cold allodynia induced by CFA administration, highlighting the therapeutic potential of peripheral Sig-1Rs in pain management. Furthermore, in CFA-treated small DRG neurons, Sig-1R activation reduced fast-inactivating sodium currents and increased slow-inactivating sodium currents mediated; consequently, Sig-1R activation reduced the rise rate and the height of action potentials, while enhanced the evoked firing frequency. Lastly, the single-cell real-time PCR analysis revealed that activation of Sig-1R significantly enhanced the expression of Nav1.9 mRNA in small DRG neurons following CFA, while showing no impact on any sodium subtypes under normal conditions. This indicates that Sig-1R activation influenced sodium channels not only at the channel level but also at the transcriptional level.
Peripheral Sig-1Rs in Inflammatory Pain: Expression and Functions
We observed a high expression of Sig-1R in DRG neurons in normal rats, and the upregulation of Sig-1R in DRG neurons 2-7 days after CFA administration, which is consistent with previous studies [33,34,35,36]. The immunofluorescent images revealed that Sig-1R exhibited predominant localization and aggregation in the nucleus region of small DRG neurons, while it displayed a more evenly distributed pattern in the cytoplasm of large neurons. This distinct distribution pattern implies potential differential modulation of Sig-1R in small and large DRG neurons, which necessitates further investigation. More intriguingly, a significant trafficking shift of the Sig-1R was observed following CFA administration. This shift was characterized by a substantial increase in Sig-1R translocation to the neuronal membrane on day 2, which then returned to baseline levels by day 10. This trafficking pattern suggests that Sig-1R is likely involved in modulating functional components on the neuronal membrane and plays a crucial role in the initiation of inflammatory pain responses following CFA injection.
In our study, the peripheral administration of Sig-1R antagonists effectively alleviated CFA-induced allodynia, demonstrating sustained analgesic effects throughout our one-week observation period. This finding highlights the crucial role of peripheral Sig-1R in chronic inflammatory pain. Previous investigations have also explored the impact of peripheral blockade of Sig-1R on inflammatory pain; however, these studies primarily focused on acute inflammatory pain models [19,37]. The current proposed mechanism for the involvement of peripheral sigma1 in inflammatory pain is primarily based on the blockade of sigma1 to remove its inhibitory effect on endogenous opioid receptors [20]. Furthermore, Sig-1Rs have been demonstrated to regulate the recruitment and release of pro-inflammatory factors from immune cells, thereby contributing to pain hypersensitivity [38]. Hence, it is plausible that Sig-1R antagonists also alleviate these inflammatory responses to produce analgesic effects. Our study expands the understanding of Sig-1R regulation beyond its known role in activating inflammatory and immune cells. We demonstrate that Sig-1R also modulates voltage-gated sodium channels and influences the electrophysiological properties of small DRG neurons. Additionally, in rats treated with CFA, Sig-1R not only directly regulates current density and gating properties of sodium currents but also affects mRNA expression level of Nav1.9. These findings provide novel insights into the mechanism underlying the involvement of peripheral Sig-1R in inflammatory pain.
Regulation of the Electrophysiological Characteristics of Small DRG Neurons by Activation of Sig-1Rs
The unique expression and combination of Nav1.6, Nav1.7, Nav1.8, and Nav1.9 is responsible for the specific electrophysiological properties of an individual DRG neuron. A correlation study between sodium subtype mRNA and corresponding electrical characteristics in a single DRG neuron indicated that the synergistic expression and action of Nav1.6, 1.7, 1.8, and 1.9 jointly determine the electrophysiological characteristics of these neurons [39]. Our study demonstrated that activation of Sig-1R reduced fast sodium currents while increasing slow sodium currents, representing an inhibitory effect on currents dominated by Nav1.7 and a promotional effect on currents dominated by Nav1.9 respectively; this regulation mimicked the effects observed with differential upregulation of Nav1.9 and downregulation of Nav1.7, providing a unique perspective to observe the effects resulting from differential changes in different subtypes of sodium channels on electrophysiological properties in certain DRG neurons. Through our research, it has been discovered that Nav1.7 is primarily responsible for the generation of action potential upstroke velocity and peak amplitude, while Nav1.9 predominantly influences the induction of firing frequency. Our observations are highly consistent with previous studies conducted on animals carrying mutations of either Nav1.7 [40,41] or Nav1.9 [42,43].
The upregulation of Nav1.9 current and mRNA expression was notably observed in small DRG neurons subjected to CFA treatment, which exhibited a strong correlation with an increased frequency of evoked neuronal firing. These results indicate a significant role for enhanced Nav1.9 functionality in the modulation of discharge frequency in DRG neurons during inflammatory conditions. This interpretation is further corroborated by prior experimental studies. For example, Martin et al. demonstrated that exposure to inflammatory mediators resulted in an increase in the firing frequency of small DRG neurons; however, this effect was entirely negated in the absence of Nav1.9 [44]. Additionally, Okuda et al. found that ANP-230, a non-selective sodium channel blocker, effectively mitigated thermal and mechanical pain responses in Nav1.9 mutant mice by inhibiting the repetitive firing of DRG neurons [42]. Moreover, Ma et al. provided electrophysiological evidence indicating that both the overexpression and knockout of Nav1.9 significantly affected the firing frequency of action potentials in DRG neurons, thereby influencing neuronal excitability and contributing to hyperalgesia [45].
The influence of various subtypes of sodium channels on the excitability and threshold of small-cell DRG neurons is complex. Due to the simultaneous and distinct effects of Sig-1R on fast and slow sodium currents (one inhibitory and one promotive), we observed a subtle impact of Sig-1R on the excitability of small DRG neurons, as indicated by threshold and rheobase. This finding aligns well with previous studies demonstrating that Nav1.7, Nav1.8, and Nav1.9 can modulate neuronal excitatory states to some extent [39,46,47]. Consequently, the excitatory state of neurons results from the synergistic actions of different subtypes of sodium channels. Modulating any individual sodium channel can lead to alterations in this excitatory state. For instance, overexpression of Nav1.7 induces hyperexcitability in DRG neurons, which correlates with the pain phenotype observed in individuals with Nav1.7 mutations [47]. Additionally, computer simulation results reveal that the overexpression of Nav1.9 significantly enhances a cell’s response frequency to subthreshold stimuli [46].
Possible Mechanisms of Sig-1R Regulation of Sodium Channels in DRG Neurons
By applying the specific Sig-1R agonist PRE-084, we observed an immediate impact on sodium current and electrophysiological properties in small DRG neurons, as well as a rapid effect on Nav1.9 mRNA levels. We hypothesized that direct interaction could be a possible mechanism for Sig-1R regulation of sodium channels, supported by previous findings demonstrating complex formation between Sig-1Rs and Nav1.5 [48,49]. Further investigations are required to determine whether Sig-1Rs in small DRG neurons directly interact with each other through complex formation with Nav1.7 and/or Nav1.9.
It has been suggested that certain Sig-1R ligands, including agonists and antagonists, possess the ability to directly inhibit specific ion channels and their associated transmembrane currents. For instance, the Sig-1R agonist SKF10047 exhibits direct inhibition of Nav1.2/1.4 [50], while the Sig-1R agonist 4-IPB and antagonists BD1047 and BD1063 demonstrate direct inhibition of calcium currents [51]. Importantly, these inhibitory effects remain unaffected by Sig-1R knockout [51].
In our study, we employed the Sig-1R agonist PRE-084, which has not been reported to exhibit non-receptor-dependent modulation of ion channels. Our findings further support that the regulation of sodium currents by PRE-084 is mediated through activation of Sig-1Rs rather than direct non-receptor-dependent mechanisms. Firstly, we observed a bidirectional effect of PRE-084 on sodium currents in small-sized DRG neurons, enhancing slow sodium currents while inhibiting fast sodium currents; secondly, the strength of PRE-084’s regulatory effect positively correlated with the expression level of membrane-bound Sig-1Rs; specifically, when there was a significant upregulation of Sig-1Rs on day 2 after CFA treatment, the regulatory effect of PRE-084 on sodium currents was significantly enhanced compared to controls.
The Role of Peripheral Sig-1Rs in Regulating Sodium Channels in Inflammatory Pain and Its Implications
The most notable finding of our study was the observed enhancement in slow sodium current and Nav1.9 mRNA expression levels following Sig-1R activation in small DRG neurons treated with CFA. It is widely acknowledged that neuronal hyperactivity within the sensory processing pathway contributes to hypersensitivity and chronic pain. Therefore, we explore whether upregulation of Nav1.9 induces increased activity in sensory neurons.
Nav1.9 is primarily expressed in small nociceptive neurons and plays a role in non-peptidergic nociceptor-mediated pain transmission [46,52]. The currents mediated by Nav1.9 exhibit low-voltage activation at about -70mV, along with slow activation and ultra-slow inactivation kinetics. Investigations into the influence of Nav1.9 on neuronal activity mainly rely on Nav1.9-overexpressing mutant mice and patients [45,53], as specific blockers for Nav1.9 are currently unavailable. Due to its low-voltage activation and super-slow inactivation properties, enhanced expression of Nav1.9 in mutant neurons leads to depolarized resting membrane potential [53] and increased spontaneous and evoked firing frequencies, indicating increased electrical activity [54].
Previous hypotheses have suggested that a reduction in Nav1.9 expression may lead to increased neuronal excitability [46]. This assertion is based on the premise that the removal of Nav1.9’s depolarizing effect on the resting membrane potential could potentially reactivate low-threshold fast sodium channels, thereby enhancing neuronal excitability. Supporting this theory, prior studies have reported an elevation in neuronal excitability concomitant with a reduction in Nav1.9 expression following nerve injury. However, in contrast to conditions associated with neuropathic pain, our research indicates that the upregulation of Nav1.9 plays a distinct and significant role in the context of inflammatory pain. This upregulation may be linked to the modulation of sodium channels by inflammatory mediators, as prior studies have demonstrated that various inflammatory factors can induce the upregulation of both Nav1.8 [55] and Nav1.9 [56].
In conclusion, our study illustrates that the upregulation, translocation, and activation of Sig-1Rs not only resulted in an immediate increase in the slow inactivation current but also significantly enhanced the expression of Nav1.9 mRNA. This investigation provides new insights into the role of peripheral Sig-1Rs in the modulation of sodium channels, particularly Nav1.9, in chronic inflammatory pain, and underscores the potential therapeutic implications of targeting peripheral Sig-1Rs and their interactions with sodium channels for pain management.
Supplementary Materials
The following supporting information can be downloaded at the website of this paper posted on Preprints.org.
References
- Kourrich, S.; et al. The sigma-1 receptor: roles in neuronal plasticity and disease. Trends Neurosci 2012, 35, 762–771. [Google Scholar] [CrossRef] [PubMed]
- Schmidt, H.R. and A.C. Kruse, The Molecular Function of σ Receptors: Past, Present, and Future. Trends Pharmacol Sci 2019, 40, 636–654. [Google Scholar] [CrossRef] [PubMed]
- Brindley, R.L.; et al. Sigma-1 receptor ligands inhibit catecholamine secretion from adrenal chromaffin cells due to block of nicotinic acetylcholine receptors. J Neurochem 2017, 143, 171–182. [Google Scholar] [CrossRef] [PubMed]
- Zhang, K.; et al. Sigma-1 Receptor Plays a Negative Modulation on N-type Calcium Channel. Front Pharmacol 2017, 8, 302. [Google Scholar] [CrossRef]
- Mavlyutov, T.A.; et al. Sigma-1 receptor expression in the dorsal root ganglion: Reexamination using a highly specific antibody. Neuroscience 2016, 331, 148–157. [Google Scholar] [CrossRef]
- Bangaru, M.L.; et al. Sigma-1 receptor expression in sensory neurons and the effect of painful peripheral nerve injury. Mol Pain 2013, 9, 47. [Google Scholar] [CrossRef]
- Puente, B.; et al. Sigma-1 receptors regulate activity-induced spinal sensitization and neuropathic pain after peripheral nerve injury. Pain 2009, 145, 294–303. [Google Scholar] [CrossRef]
- Yoon, S.Y.; et al. Intrathecal injection of the neurosteroid, DHEAS, produces mechanical allodynia in mice: involvement of spinal sigma-1 and GABA receptors. Br J Pharmacol 2009, 157, 666–673. [Google Scholar] [CrossRef]
- Nieto, F.R.; et al. Role of sigma-1 receptors in paclitaxel-induced neuropathic pain in mice. J Pain 2012, 13, 1107–1121. [Google Scholar] [CrossRef]
- Romero, L.; et al. Pharmacological properties of S1RA, a new sigma-1 receptor antagonist that inhibits neuropathic pain and activity-induced spinal sensitization. Br J Pharmacol 2012, 166, 2289–2306. [Google Scholar] [CrossRef]
- Gris, G.; et al. The selective sigma-1 receptor antagonist E-52862 attenuates neuropathic pain of different aetiology in rats. Sci Rep 2016, 6, 24591. [Google Scholar] [CrossRef] [PubMed]
- Tejada, M.Á.; et al. Targeting immune-driven opioid analgesia by sigma-1 receptors: Opening the door to novel perspectives for the analgesic use of sigma-1 antagonists. Pharmacol Res 2018, 131, 224–230. [Google Scholar] [CrossRef] [PubMed]
- Xiong, J.; et al. Optimization of bifunctional piperidinamide derivatives as σ(1)R Antagonists/MOR agonists for treating neuropathic pain. Eur J Med Chem 2021, 226, 113879. [Google Scholar] [CrossRef] [PubMed]
- Ruiz-Cantero, M.C.; et al. Sigma-1 receptor: A drug target for the modulation of neuroimmune and neuroglial interactions during chronic pain. Pharmacol Res 2021, 163, 105339. [Google Scholar] [CrossRef]
- Ruiz-Cantero, M.C.; et al. The sigma-1 receptor curtails endogenous opioid analgesia during sensitization of TRPV1 nociceptors. Br J Pharmacol 2023, 180, 1148–1167. [Google Scholar] [CrossRef]
- Tejada, M.Á.; et al. Targeting immune-driven opioid analgesia by sigma-1 receptors: Opening the door to novel perspectives for the analgesic use of sigma-1 antagonists. Pharmacol Res 2018, 131, 224–230. [Google Scholar] [CrossRef]
- Ortíz-Rentería, M.; et al. TRPV1 channels and the progesterone receptor Sig-1R interact to regulate pain. Proc Natl Acad Sci U S A 2018, 115, E1657–E1666. [Google Scholar] [CrossRef]
- Marcotti, A.; et al. TRPA1 modulation by Sigma-1 receptor prevents oxaliplatin-induced painful peripheral neuropathy. Brain 2023, 146, 475–491. [Google Scholar] [CrossRef]
- Tejada, M.A.; et al. Sigma-1 receptor inhibition reverses acute inflammatory hyperalgesia in mice: role of peripheral sigma-1 receptors. Psychopharmacology 2014, 231, 3855–3869. [Google Scholar] [CrossRef]
- Tejada, M.A.; et al. Sigma-1 receptors control immune-driven peripheral opioid analgesia during inflammation in mice. Proc Natl Acad Sci U S A 2017, 114, 8396–8401. [Google Scholar] [CrossRef]
- Djouhri, L.; et al. Sensory and electrophysiological properties of guinea-pig sensory neurones expressing Nav 1.7 (PN1) Na+ channel alpha subunit protein. J Physiol 2003, 546 Pt 2, 565–576. [Google Scholar] [CrossRef] [PubMed]
- Djouhri, L.; et al. The TTX-resistant sodium channel Nav1.8 (SNS/PN3): expression and correlation with membrane properties in rat nociceptive primary afferent neurons. J Physiol 2003, 550 Pt 3, 739–752. [Google Scholar] [CrossRef] [PubMed]
- Fang, X.; et al. The presence and role of the tetrodotoxin-resistant sodium channel Na(v)1.9 (NaN) in nociceptive primary afferent neurons. J Neurosci 2002, 22, 7425–7433. [Google Scholar] [CrossRef] [PubMed]
- Djouhri, L.; Bleazard, L.; Lawson, S.N. Association of somatic action potential shape with sensory receptive properties in guinea-pig dorsal root ganglion neurones. J Physiol 1998, 1998. 513 Pt 3 Pt 3, 857–72. [Google Scholar] [CrossRef]
- Dib-Hajj, S.; et al. NaN/Nav1.9: a sodium channel with unique properties. Trends Neurosci 2002, 25, 253–259. [Google Scholar] [CrossRef]
- Chen, L.; et al. Pharmacological characterization of a rat Nav1.7 loss-of-function model with insensitivity to pain. Pain 2020, 161, 1350–1360. [Google Scholar] [CrossRef]
- Urru, M.; et al. Dexpramipexole blocks Nav1.8 sodium channels and provides analgesia in multiple nociceptive and neuropathic pain models. Pain 2020, 161, 831–841. [Google Scholar] [CrossRef]
- Nascimento, D.L.A.; et al. Nav1.8 in small dorsal root ganglion neurons contributes to vincristine-induced mechanical allodynia. Brain, 2024.
- Dib-Hajj, S.D.; Black, J.A.; Waxman, S.G. NaV1.9: a sodium channel linked to human pain. Nat Rev Neurosci 2015, 16, 511–519. [Google Scholar] [CrossRef]
- Djouhri, L.; Lawson, S.N. Changes in somatic action potential shape in guinea-pig nociceptive primary afferent neurones during inflammation in vivo. J Physiol 1999, 520 Pt 2, 565–576. [Google Scholar] [CrossRef]
- Chaplan, S.R.; Pogrel, J.W.; Yaksh, T.L. Role of voltage-dependent calcium channel subtypes in experimental tactile allodynia. J Pharmacol Exp Ther 1994, 269, 1117–1123. [Google Scholar]
- Song, Y.; et al. Difference of acute dissociation and 1-day culture on the electrophysiological properties of rat dorsal root ganglion neurons. J Physiol Biochem 2018, 74, 207–221. [Google Scholar] [CrossRef] [PubMed]
- Bangaru, M.L.; et al. Sigma-1 receptor expression in sensory neurons and the effect of painful peripheral nerve injury. Mol Pain 2013, 9, 47. [Google Scholar] [CrossRef] [PubMed]
- Mavlyutov, T.A.; et al. Sigma-1 receptor expression in the dorsal root ganglion: Reexamination using a highly specific antibody. Neuroscience 2016, 331, 148–157. [Google Scholar] [CrossRef]
- Jerčić, L.; et al. Sigma-1 Receptor Expression in DRG Neurons During a Carrageenan-Provoked Inflammation. Anat Rec (Hoboken) 2019, 302, 1620–1627. [Google Scholar] [CrossRef] [PubMed]
- Chun, S.; et al. The Peripheral Role of CCL2 in the Anti-Nociceptive Effect of Sigma-1 Receptor Antagonist BD1047 on Inflammatory Hyperalgesia in Rats. Int J Mol Sci 2021, 22. [Google Scholar] [CrossRef]
- Jerčić, L.; et al. Sigma-1 Receptor Expression in DRG Neurons During a Carrageenan-Provoked Inflammation. Anat Rec (Hoboken) 2019, 302, 1620–1627. [Google Scholar] [CrossRef]
- Ruiz-Cantero, M.C.; et al. Sigma-1 receptor: A drug target for the modulation of neuroimmune and neuroglial interactions during chronic pain. Pharmacol Res 2021, 163, 105339. [Google Scholar] [CrossRef]
- Thériault, O.; Chahine, M. Correlation of the electrophysiological profiles and sodium channel transcripts of individual rat dorsal root ganglia neurons. Front Cell Neurosci 2014, 8, 285. [Google Scholar]
- Wimalasena, N.K.; et al. Na(v)1.7 gain-of-function mutation I228M triggers age-dependent nociceptive insensitivity and C-LTMR dysregulation. Exp Neurol 2023, 364, 114393. [Google Scholar] [CrossRef]
- Lu, W.; et al. A Buthus martensii Karsch scorpion sting targets Nav1.7 in mice and mimics a phenotype of human chronic pain. Pain 2022, 163, e202–e214. [Google Scholar] [CrossRef]
- Okuda, H.; et al. Reduced pain sensitivity of episodic pain syndrome model mice carrying a Nav1.9 mutation by ANP-230, a novel sodium channel blocker. Heliyon 2023, 9, e15423. [Google Scholar] [CrossRef] [PubMed]
- Huang, J.; et al. A Novel Gain-of-Function Nav1.9 Mutation in a Child With Episodic Pain. Front Neurosci 2019, 13, 918. [Google Scholar] [CrossRef] [PubMed]
- Martin, C.; et al. Na(V)1.9 Potentiates Oxidized Phospholipid-Induced TRP Responses Only under Inflammatory Conditions. Front Mol Neurosci 2018, 11, 7. [Google Scholar] [CrossRef]
- Ma, T.; et al. Protein arginine methyltransferase 7 modulates neuronal excitability by interacting with NaV1. 9. Pain 2022, 163, 753–764. [Google Scholar] [CrossRef]
- Dib-Hajj, S.; et al. NaN/Nav1.9: a sodium channel with unique properties. Trends Neurosci 2002, 25, 253–259. [Google Scholar] [CrossRef] [PubMed]
- Waxman, S.G.; Dib-Hajj, S.D. Na(V)1.7: A central role in pain. Neuron 2023, 111, 2615–2617. [Google Scholar] [CrossRef]
- Balasuriya, D.; et al. The sigma-1 receptor binds to the Nav1.5 voltage-gated Na+ channel with 4-fold symmetry. J Biol Chem 2012, 287, 37021–37029. [Google Scholar] [CrossRef]
- Aydar, E.; et al. Sigma-1 receptors modulate neonatal Na(v)1.5 ion channels in breast cancer cell lines. Eur Biophys J 2016, 45, 671–683. [Google Scholar] [CrossRef]
- Gao, X.F.; et al. Sigma-1 receptor agonists directly inhibit Nav1.2/1.4 channels. PLoS One 2012, 7, e49384. [Google Scholar] [CrossRef]
- Asano, M.; et al. SKF-10047, a prototype Sigma-1 receptor agonist, augmented the membrane trafficking and uptake activity of the serotonin transporter and its C-terminus-deleted mutant via a Sigma-1 receptor-independent mechanism. J Pharmacol Sci 2019, 139, 29–36. [Google Scholar] [CrossRef]
- Fang, X.; et al. Intense isolectin-B4 binding in rat dorsal root ganglion neurons distinguishes C-fiber nociceptors with broad action potentials and high Nav1.9 expression. J Neurosci 2006, 26, 7281–7292. [Google Scholar] [CrossRef] [PubMed]
- Huang, J.; et al. Gain-of-function mutations in sodium channel Na(v)1.9 in painful neuropathy. Brain 2014, 137 Pt 6, 1627–1642. [Google Scholar] [CrossRef] [PubMed]
- Zhang, X.Y.; et al. Gain-of-function mutations in SCN11A cause familial episodic pain. Am J Hum Genet 2013, 93, 957–966. [Google Scholar] [CrossRef] [PubMed]
- Atmaramani, R.R.; et al. Conserved Expression of Nav1.7 and Nav1.8 Contribute to the Spontaneous and Thermally Evoked Excitability in IL-6 and NGF-Sensitized Adult Dorsal Root Ganglion Neurons In Vitro. Bioengineering 2020, 7. [Google Scholar] [CrossRef]
- Maingret, F.; et al. Inflammatory mediators increase Nav1.9 current and excitability in nociceptors through a coincident detection mechanism. J Gen Physiol 2008, 131, 211–225. [Google Scholar] [CrossRef]
Figure 1.
Protocols for action potential (AP) recording and analysis of AP properties. A series of currents, each lasting 2 seconds and increased in intensity (20 pA increments), were injected into the neurons repeatedly with a 5-second interval until action potentials were successfully triggered. The minimum current intensity in this example, 40 pA, is denoted as the rheobase. The membrane potential when no current was injected is referred to as the resting potential (RP), and the maximum reached membrane potential during the AP is indicated as the peak (indicated by an arrow). The AP threshold is defined as the critical depolarized membrane potential level at which an AP can be successfully initiated. The threshold level was determined as the intersection point (marked by line c) of the linearly fitted lines of the slow and fast depolarizing phases (lines a and b).
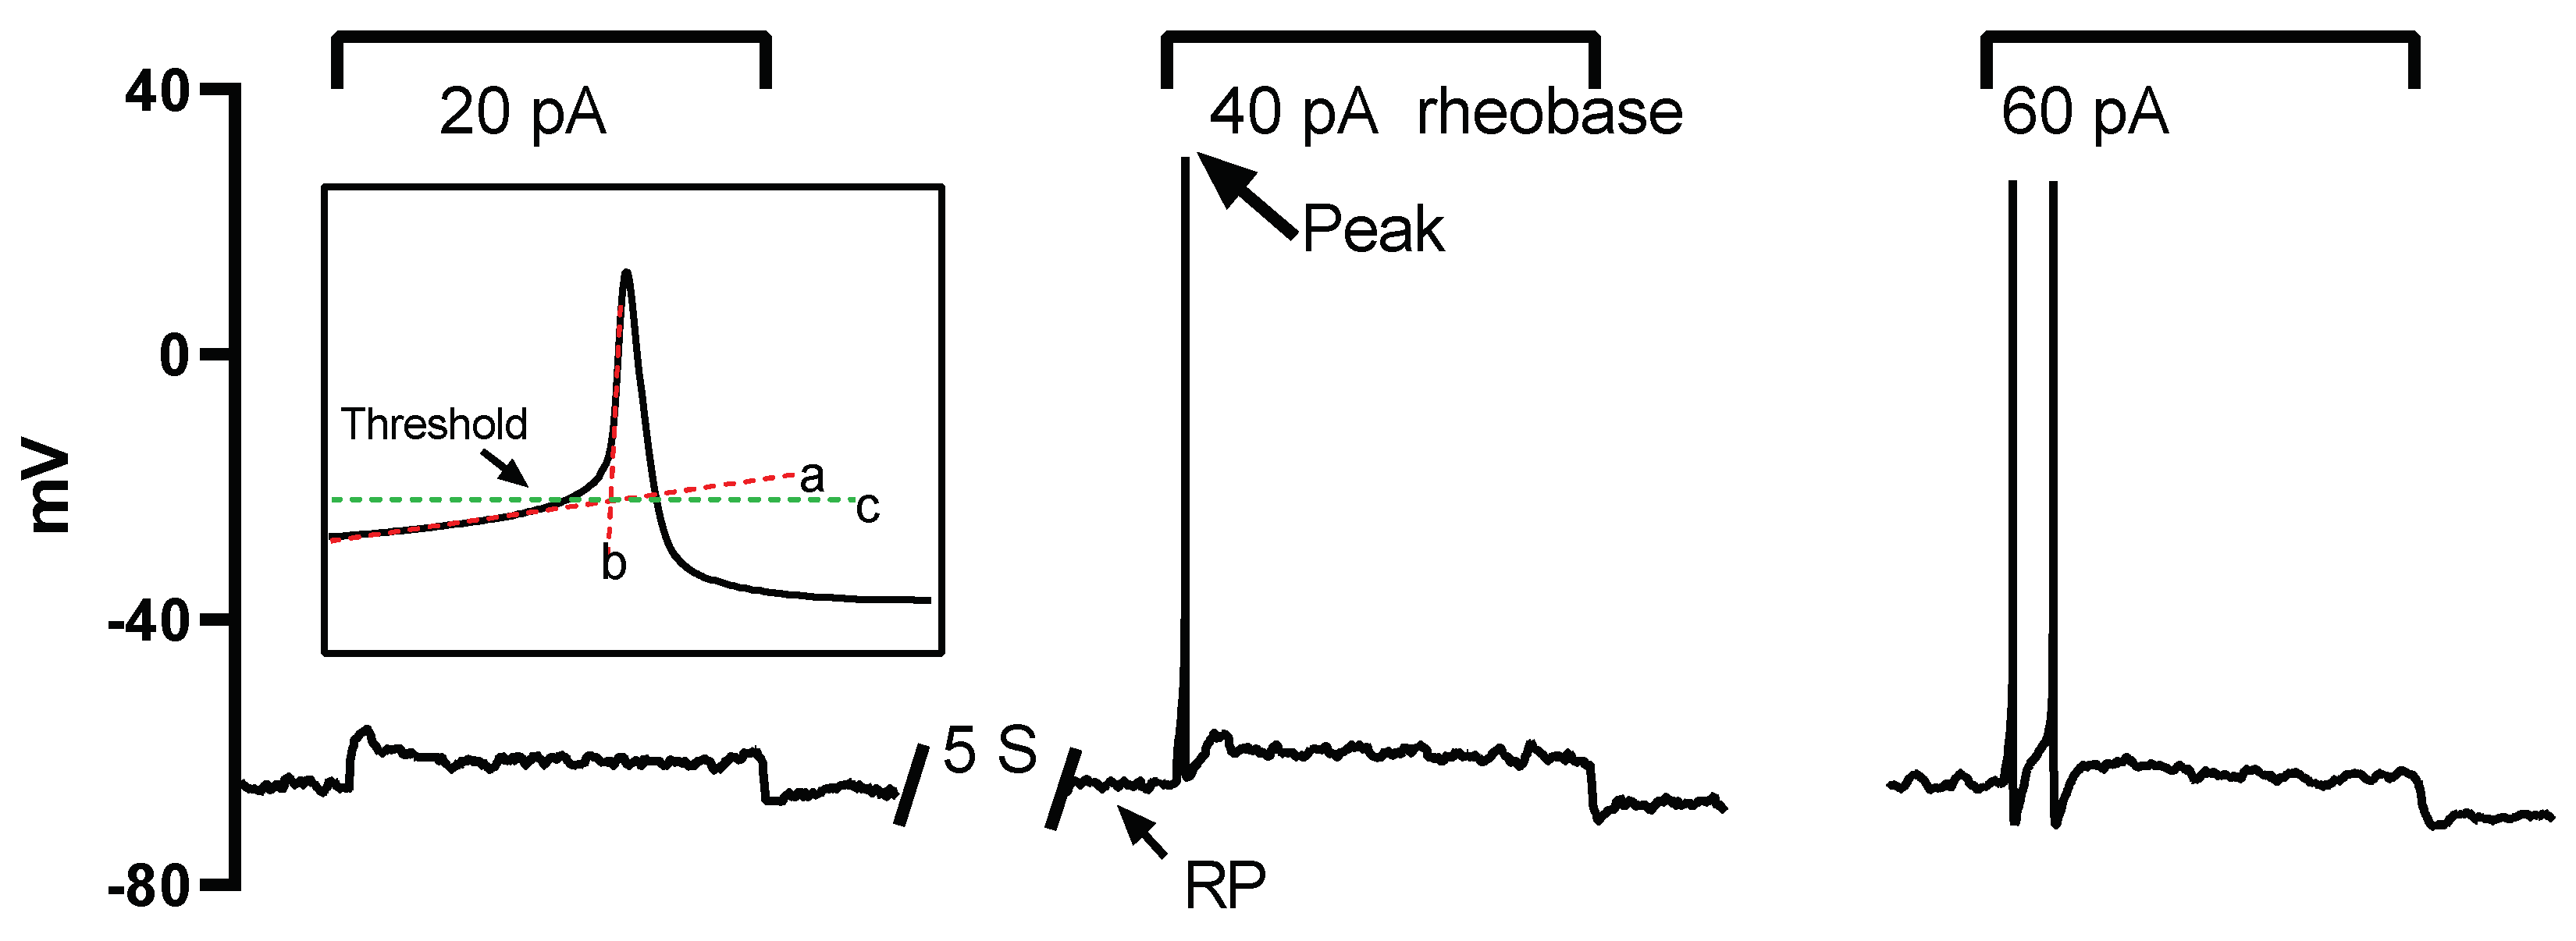
Figure 2.
Protocols for the separation of fast and slow sodium components. (A) Upper: The command potentials for ‘whole’ sodium current recording. The membrane potential was held at -100 mV for 30 ms before a series of 50 ms potentials (5 mV increments and 2.5 s intervals) were repeatedly applied to the cell. Lower: The ‘whole’ sodium current, which includes both fast and slow components. (B) Upper: The command potentials for slow sodium current recording. The fast component was deactivated with a depolarizing pre-pulse (-40 mV), which produced the slow sodium current (lower). The current amplitude was measured at steady state (marked by the dashed line). (C) Offline subtraction was performed to generate the fast sodium current, which was measured at the peak level (indicated by an arrow).
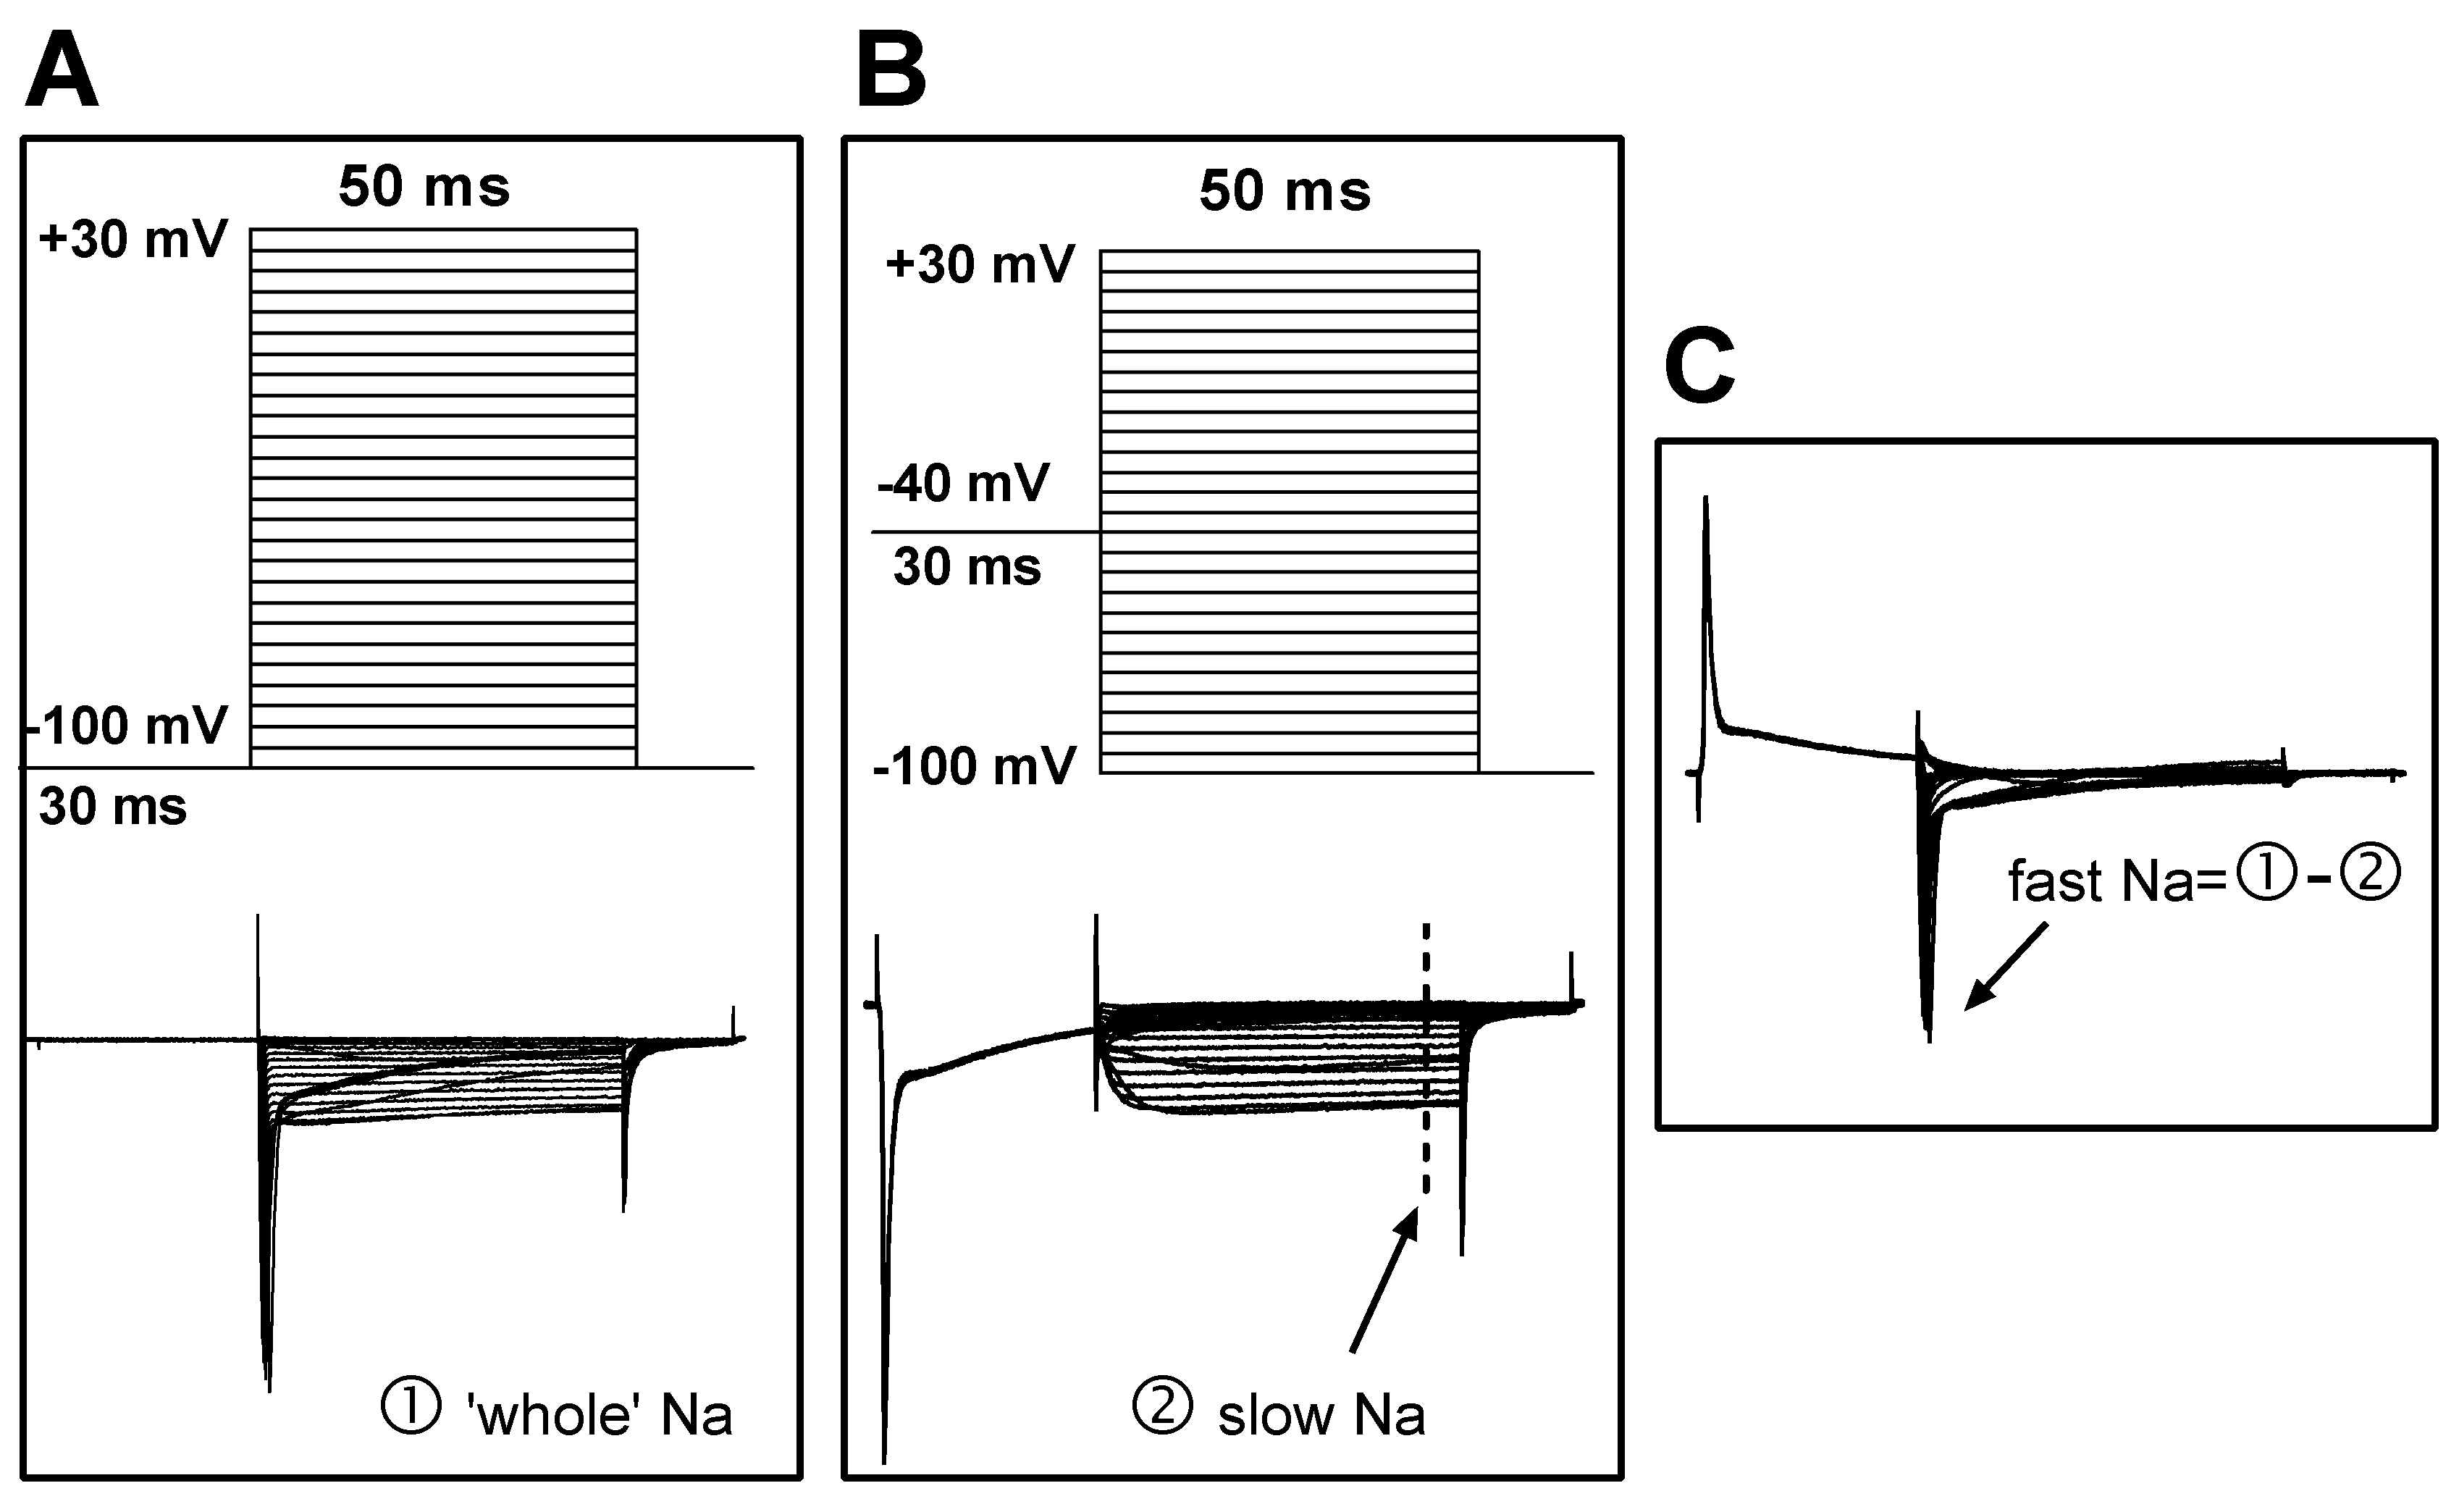
Figure 3.
Labeling analysis of the immunofluorescent images. (A) The images were converted to grayscale. The labeling intensity was indicated by arbitrary pixel intensity (from 0 to 255). (B) Boundaries of the whole cell, membrane, plasma, and nucleus regions were determined automatically using a custom-designed application. The accuracy of the segmentation was verified by the user, and corrections were made if necessary. The example cells 1, 3, and 4 were automatically determined, while the isolations of cells 2 and 5 resulted from manual intervention. (C) Locations of the extracted neurons are displayed.
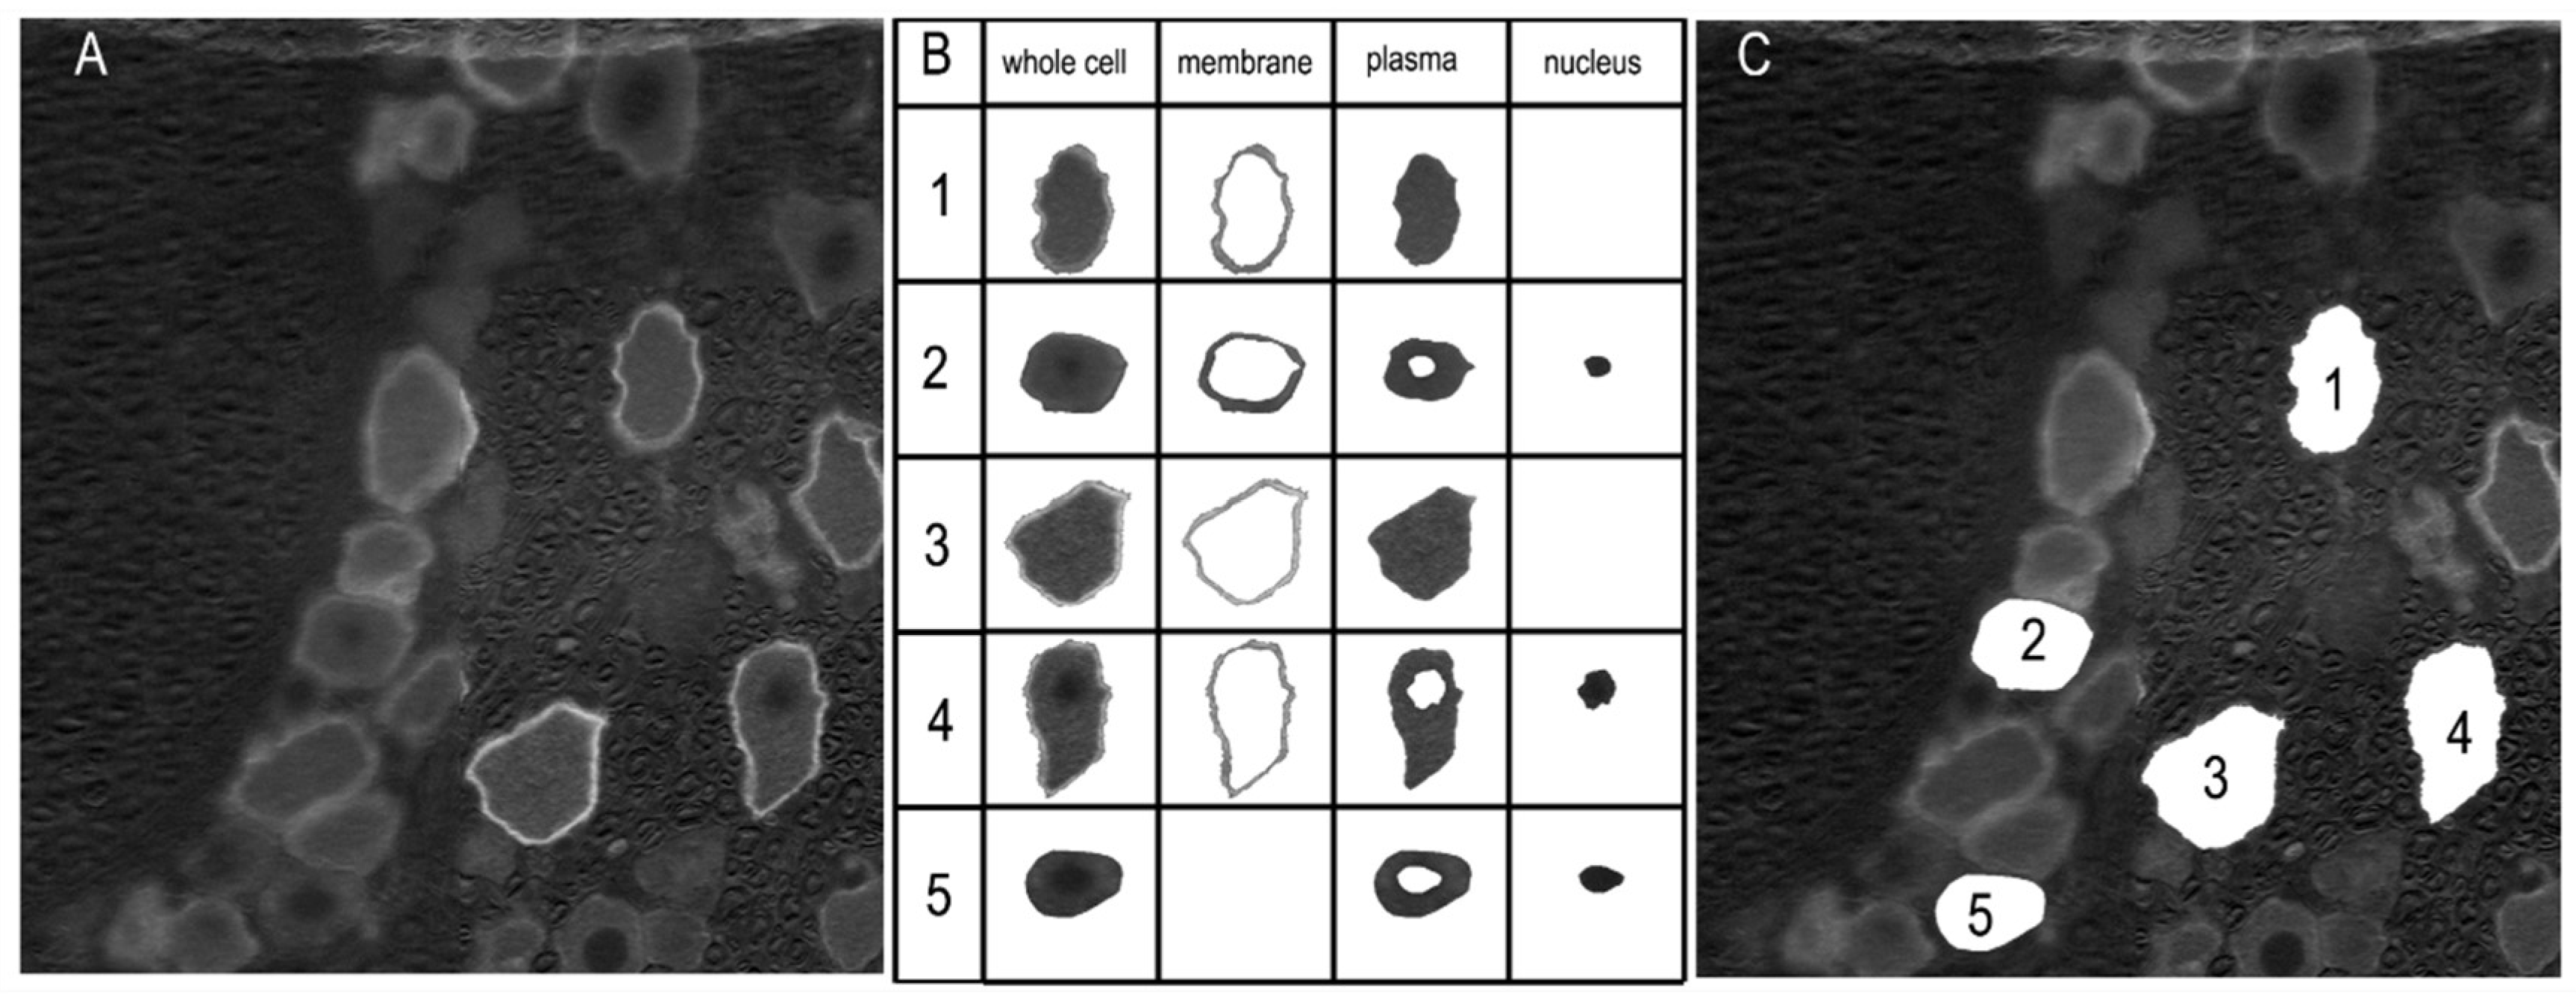
Figure 4.
Dynamic immunofluorescent labeling of Sig-1R from CFA Day 3 to Day 10. (A) In the sham animals, a high proportion of Sig-1Rs aggregated in the central nuclear regions (indicated by an arrow). In CFA Day 3 (CFA3D), Sig-1R trafficking occurred toward the membranous region (indicated by an arrow). By CFA Day 7 (CFA7D), Sig-1R trafficking reversed back toward the nuclear region. In CFA Day 10 (CFA10D), Sig-1R was primarily expressed in the nuclear region, similar to the sham condition. (B) The ratio of neurons with nuclear region aggregation was significantly reduced due to membrane trafficking in CFA3D (compared to naïve). From Day 3 to Day 10, this ratio recovered to normal levels. (C) The total intensity of Sig-1R significantly increased in CFA3D and CFA7D before returning to normal levels in CFA10D.
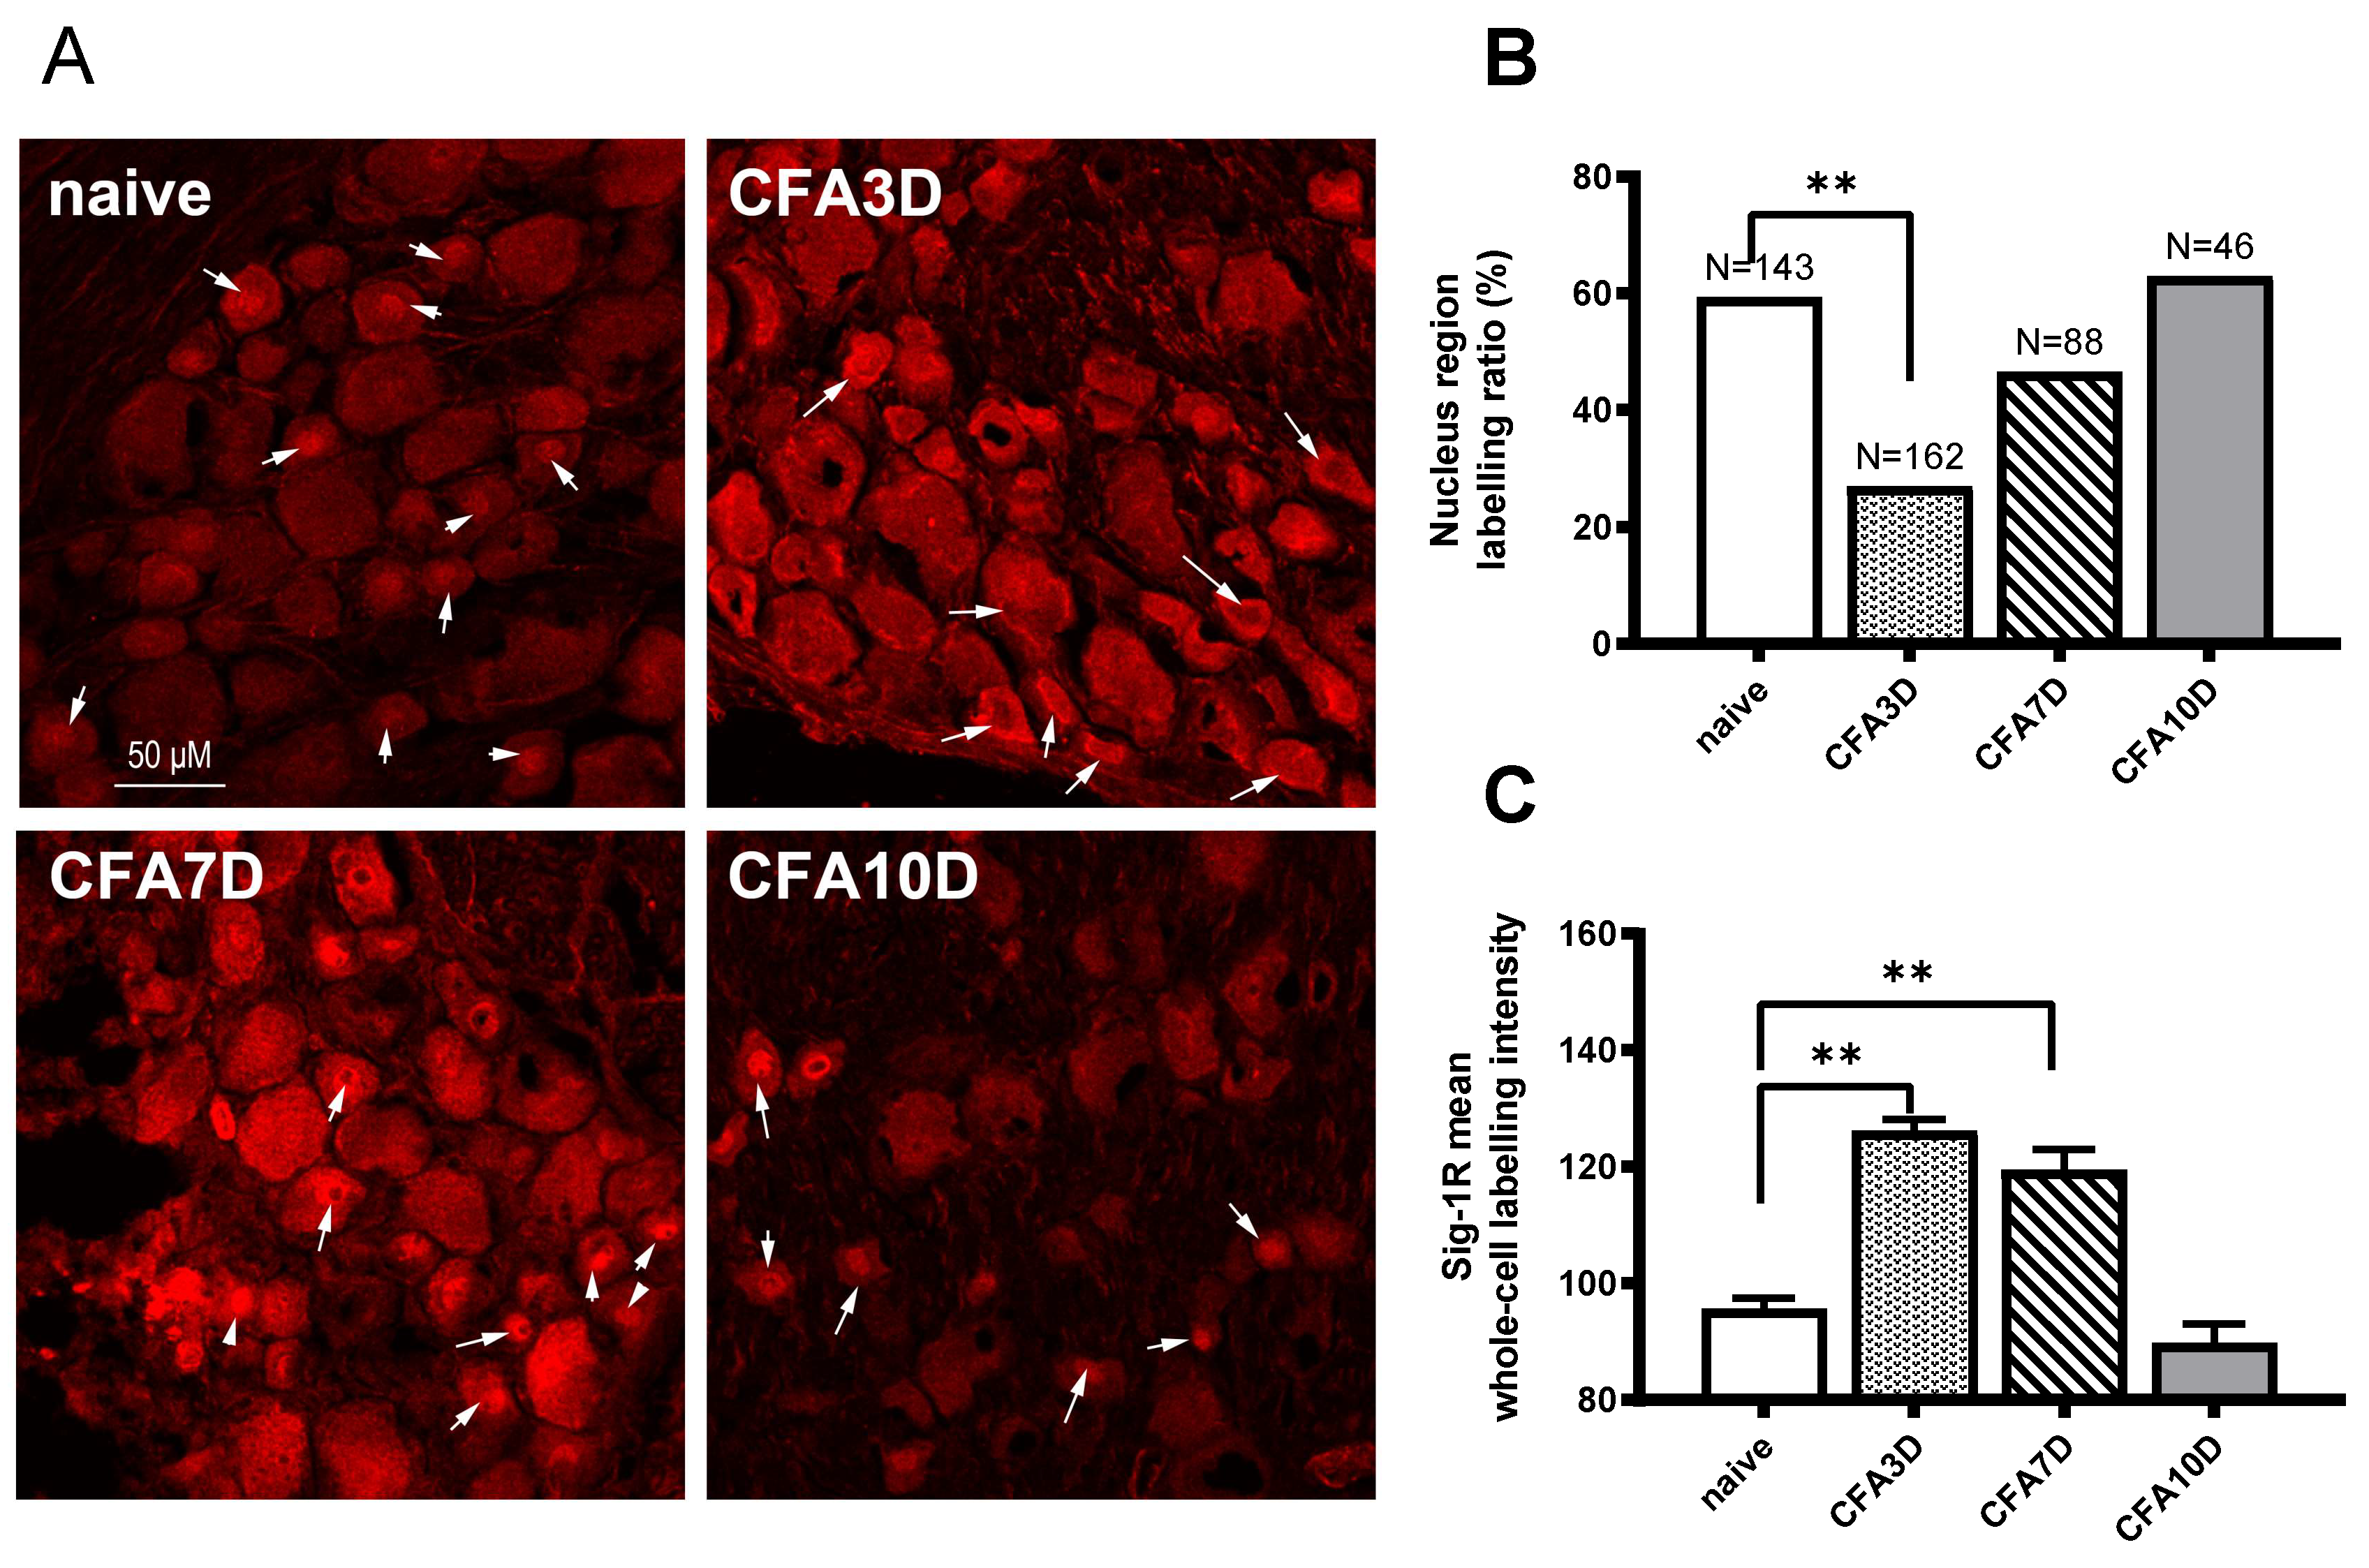
Figure 5.
The effects of CFA injection and S1RA on cold and tactile allodynia. (A) CFA injection increased the cold allodynia scores, which were decreased by S1RA administration. (B) CFA injection decreased the 50% paw withdrawal thresholds (PWTs) for tactile allodynia, which were increased by S1RA administration. (*p < 0.05, **p < 0.01. CFA vs. sham; # p<0.05, ## p<0.01, S1RA vs. CFA).
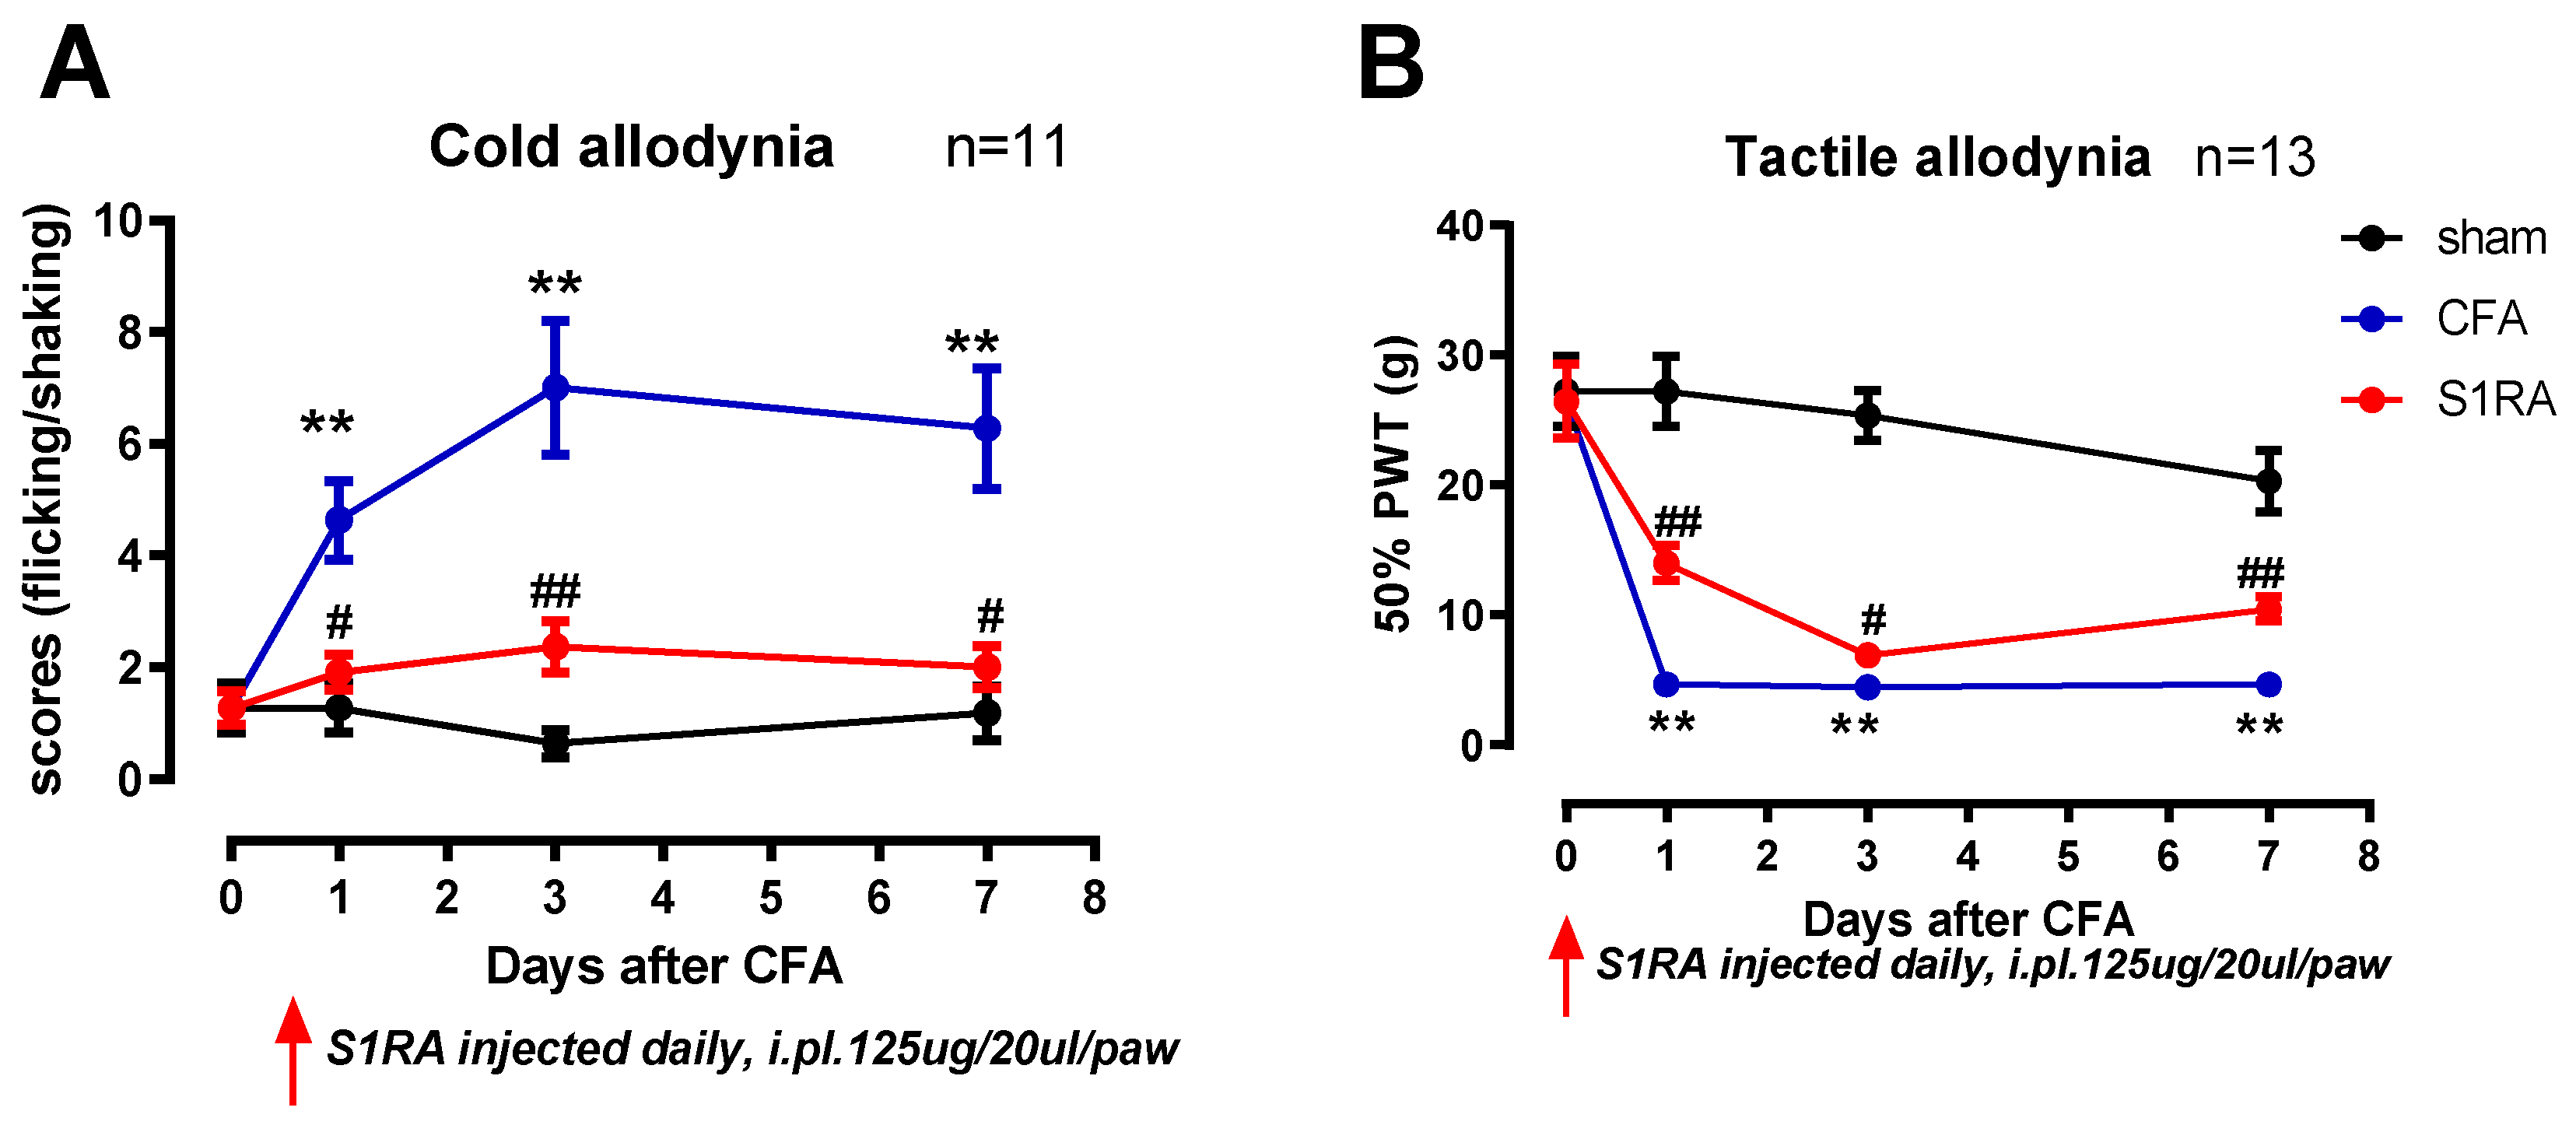
Figure 6.
The effects of the Sig-1R agonist, PRE-084, on the electrophysiological properties of small DRG neurons. (A) PRE-084 hyperpolarized the resting potential (RP) of DRG neurons from both naïve and CFA3D animals. (B) PRE-084 significantly reduced the peak amplitude of the action potentials (APs) in both naïve and CFA3D animals. (C) PRE-084 showed a trend toward hyperpolarizing the AP firing threshold potential (p = 0.09). (D) PRE-084 increased the rheobase in naïve animals but had no effect in CFA3D animals. (E) PRE-084 significantly increased the maximum depolarization rate (MDR) of the AP in CFA3D animals. (F) PRE-084 increased the firing frequency in CFA3D neurons.
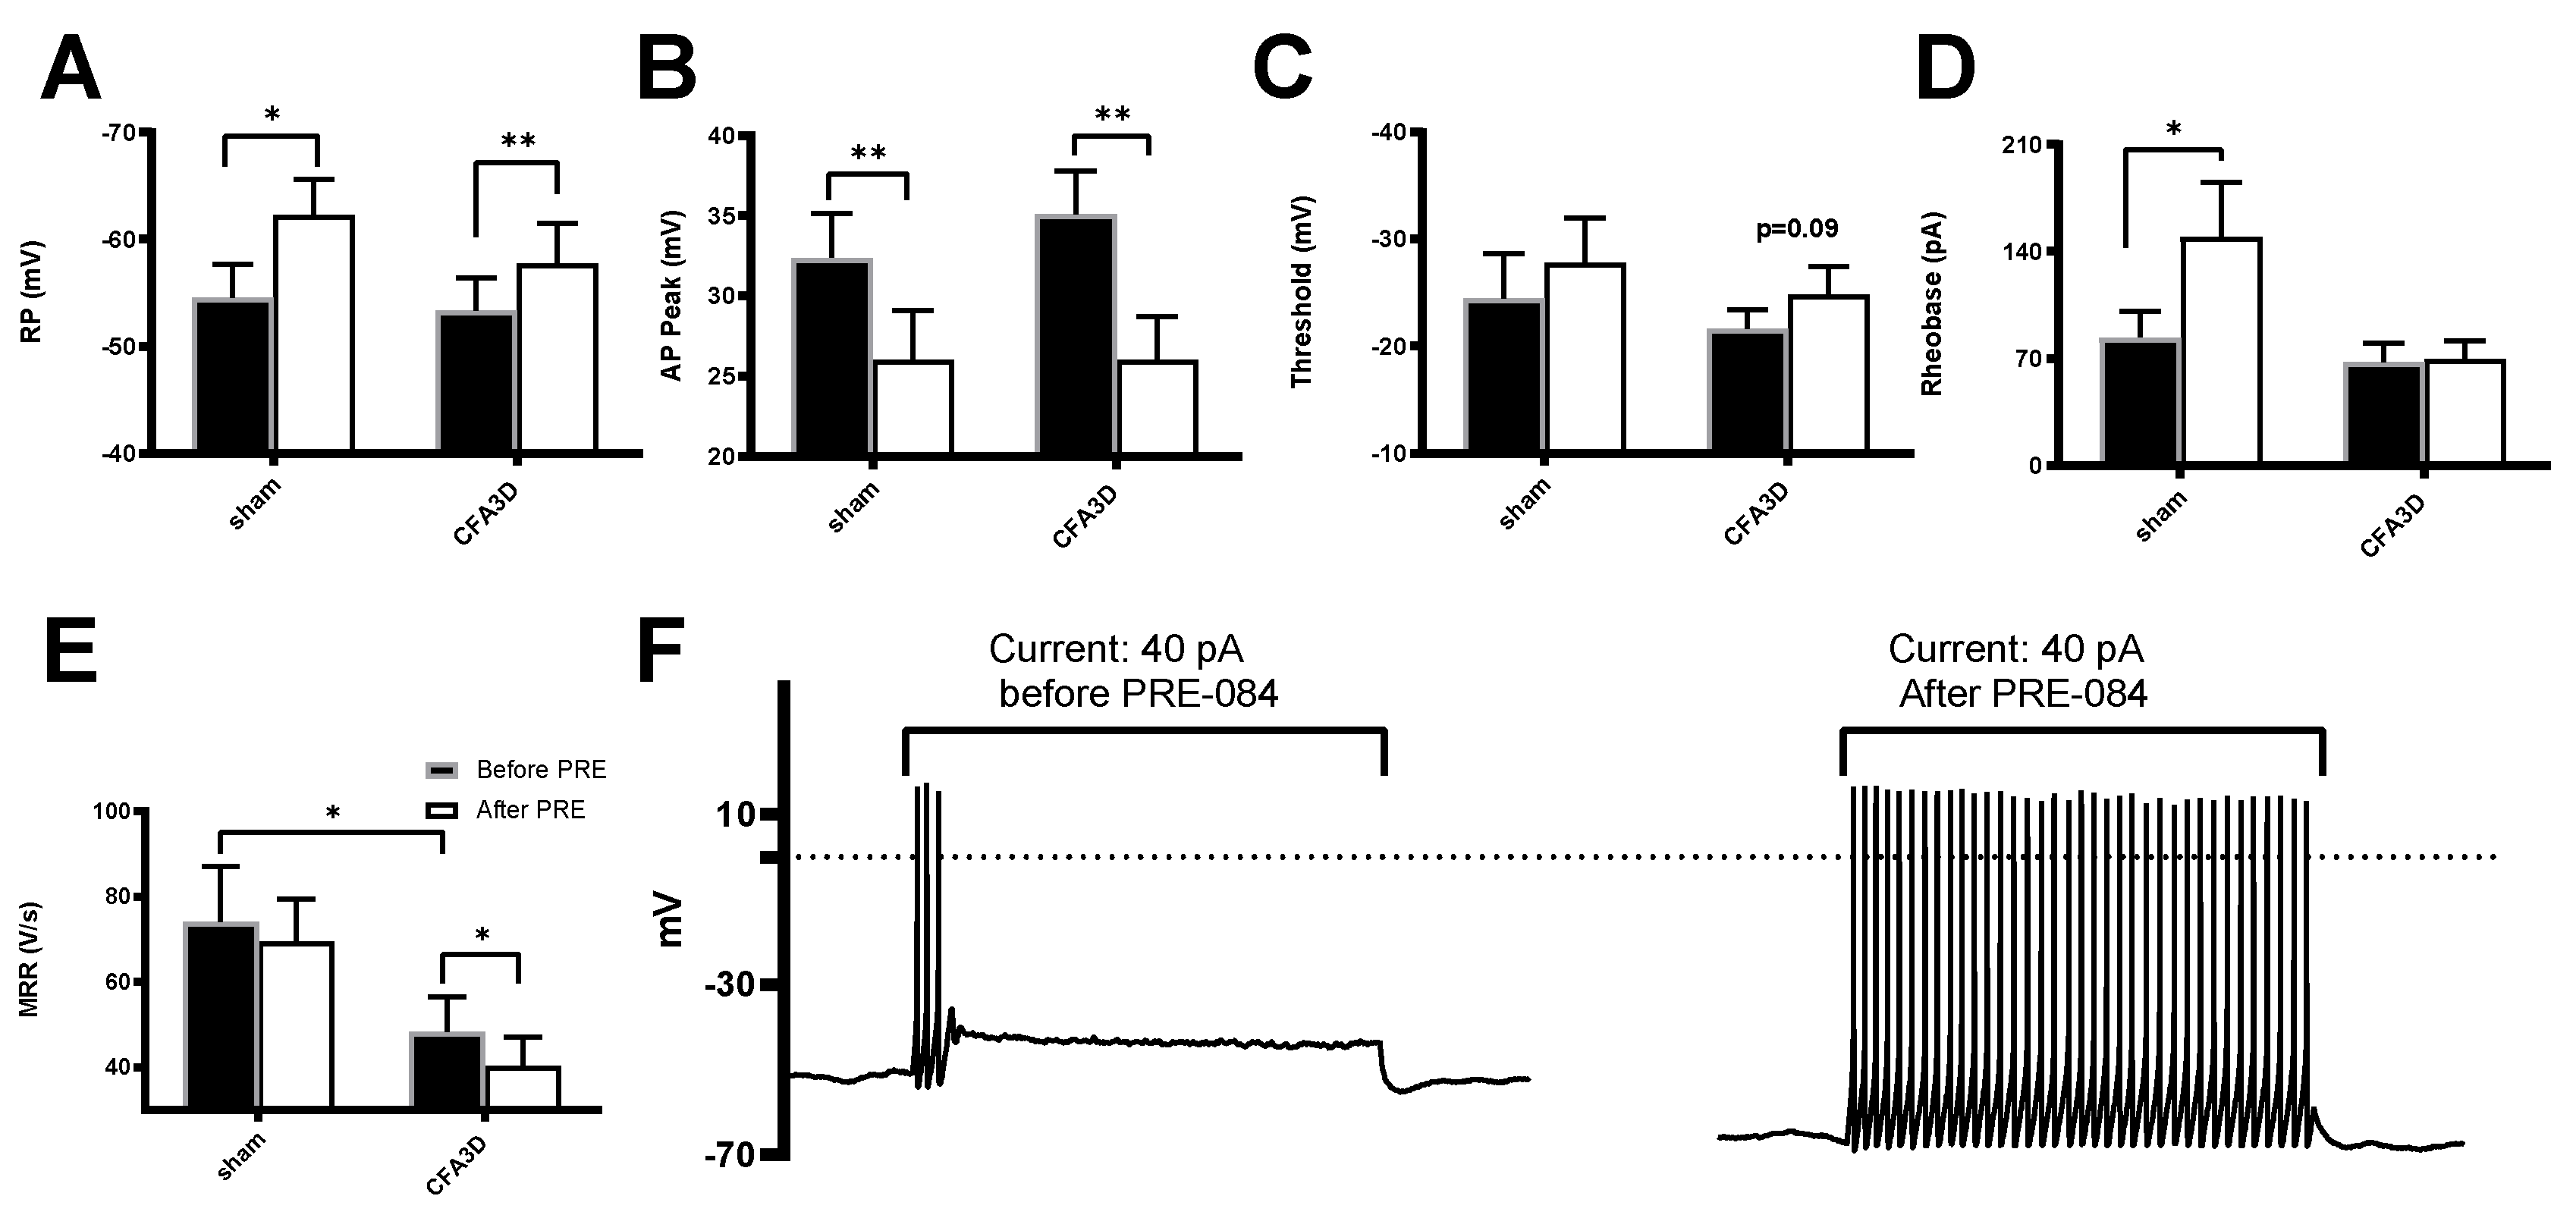
Figure 7.
The effects of PRE-084 on the fast components of sodium current. (A-B) The inhibitory effect of PRE-084 on the fast sodium current in sham (A) and CFA3D animals (B). The inhibition was statistically significant only in CFA3D animals (*p < 0.05, before vs. after PRE-084). (C-D) Example sodium currents recorded from a CFA3D neuron. The application of PRE-084 inhibited this current (before (C) vs. after (D)).
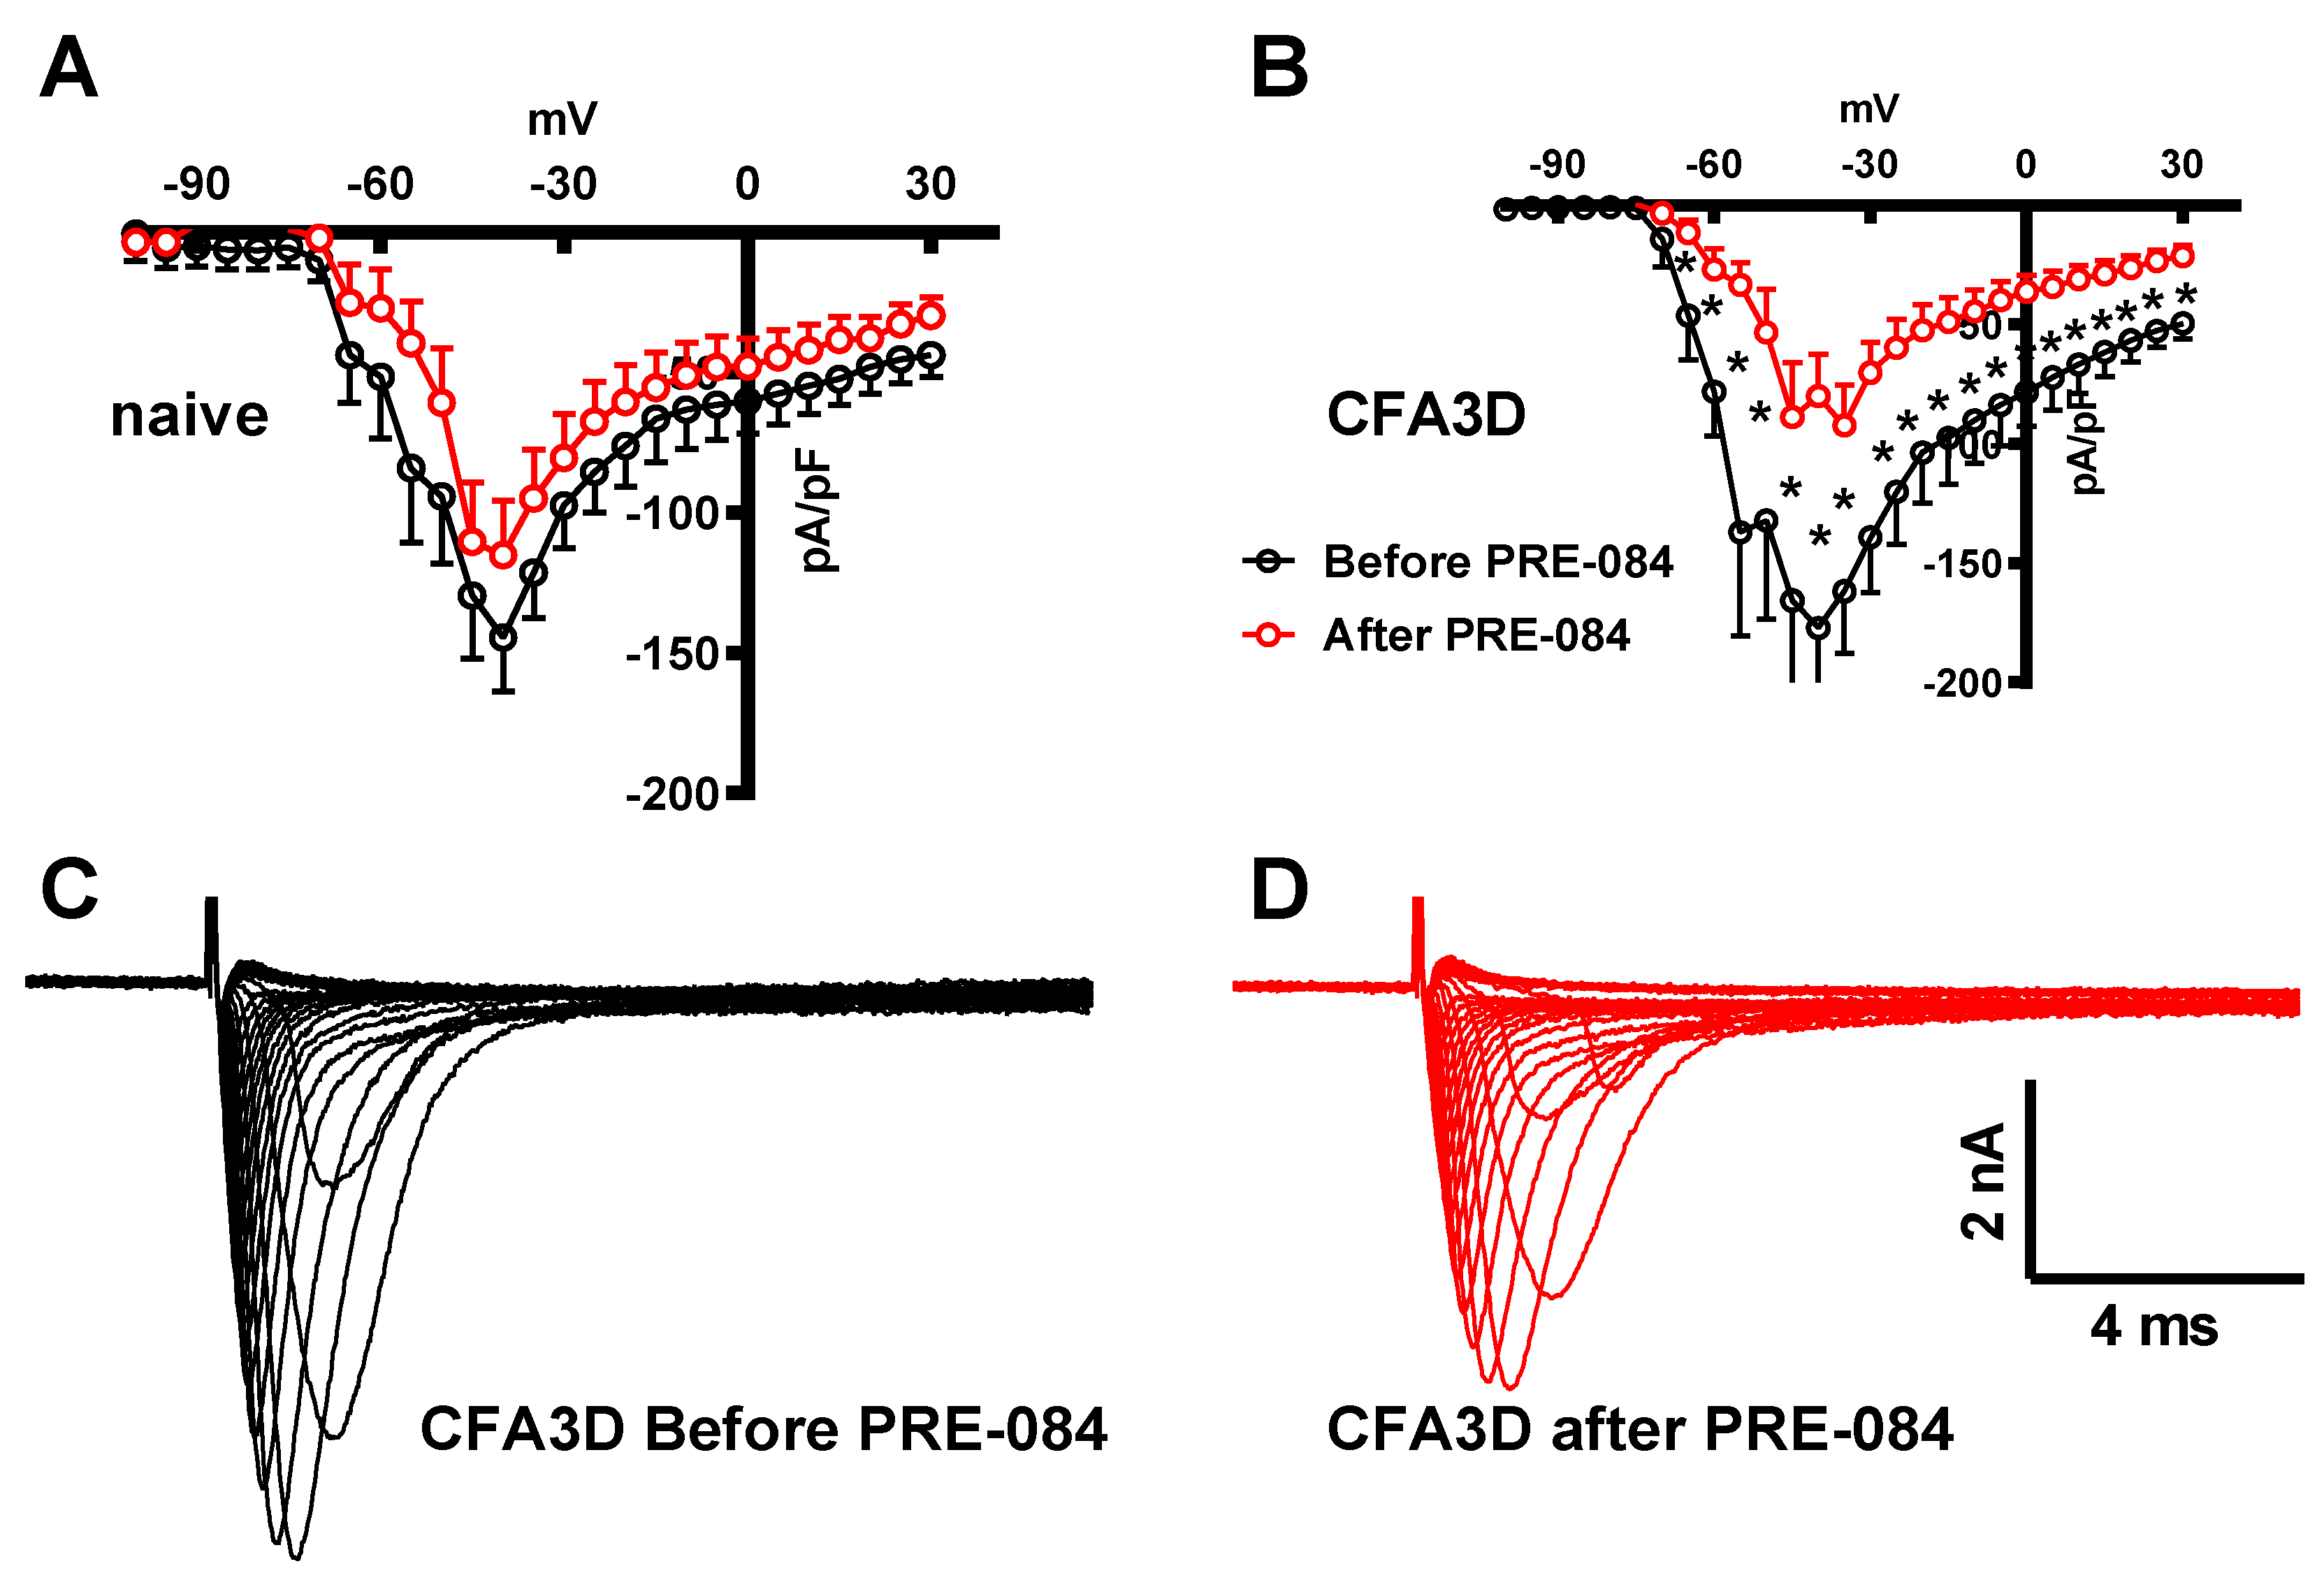
Figure 8.
The effects of PRE-084 on the slow components of sodium current. (A-B) The enhancing effect of PRE-084 on the slow sodium current in sham (A) and CFA3D animals (B) (*p < 0.05, before vs. after PRE-084). (C-D) Example sodium currents recorded from a CFA3D neuron. The application of PRE-084 increased this current (before (C) vs. after (D)).
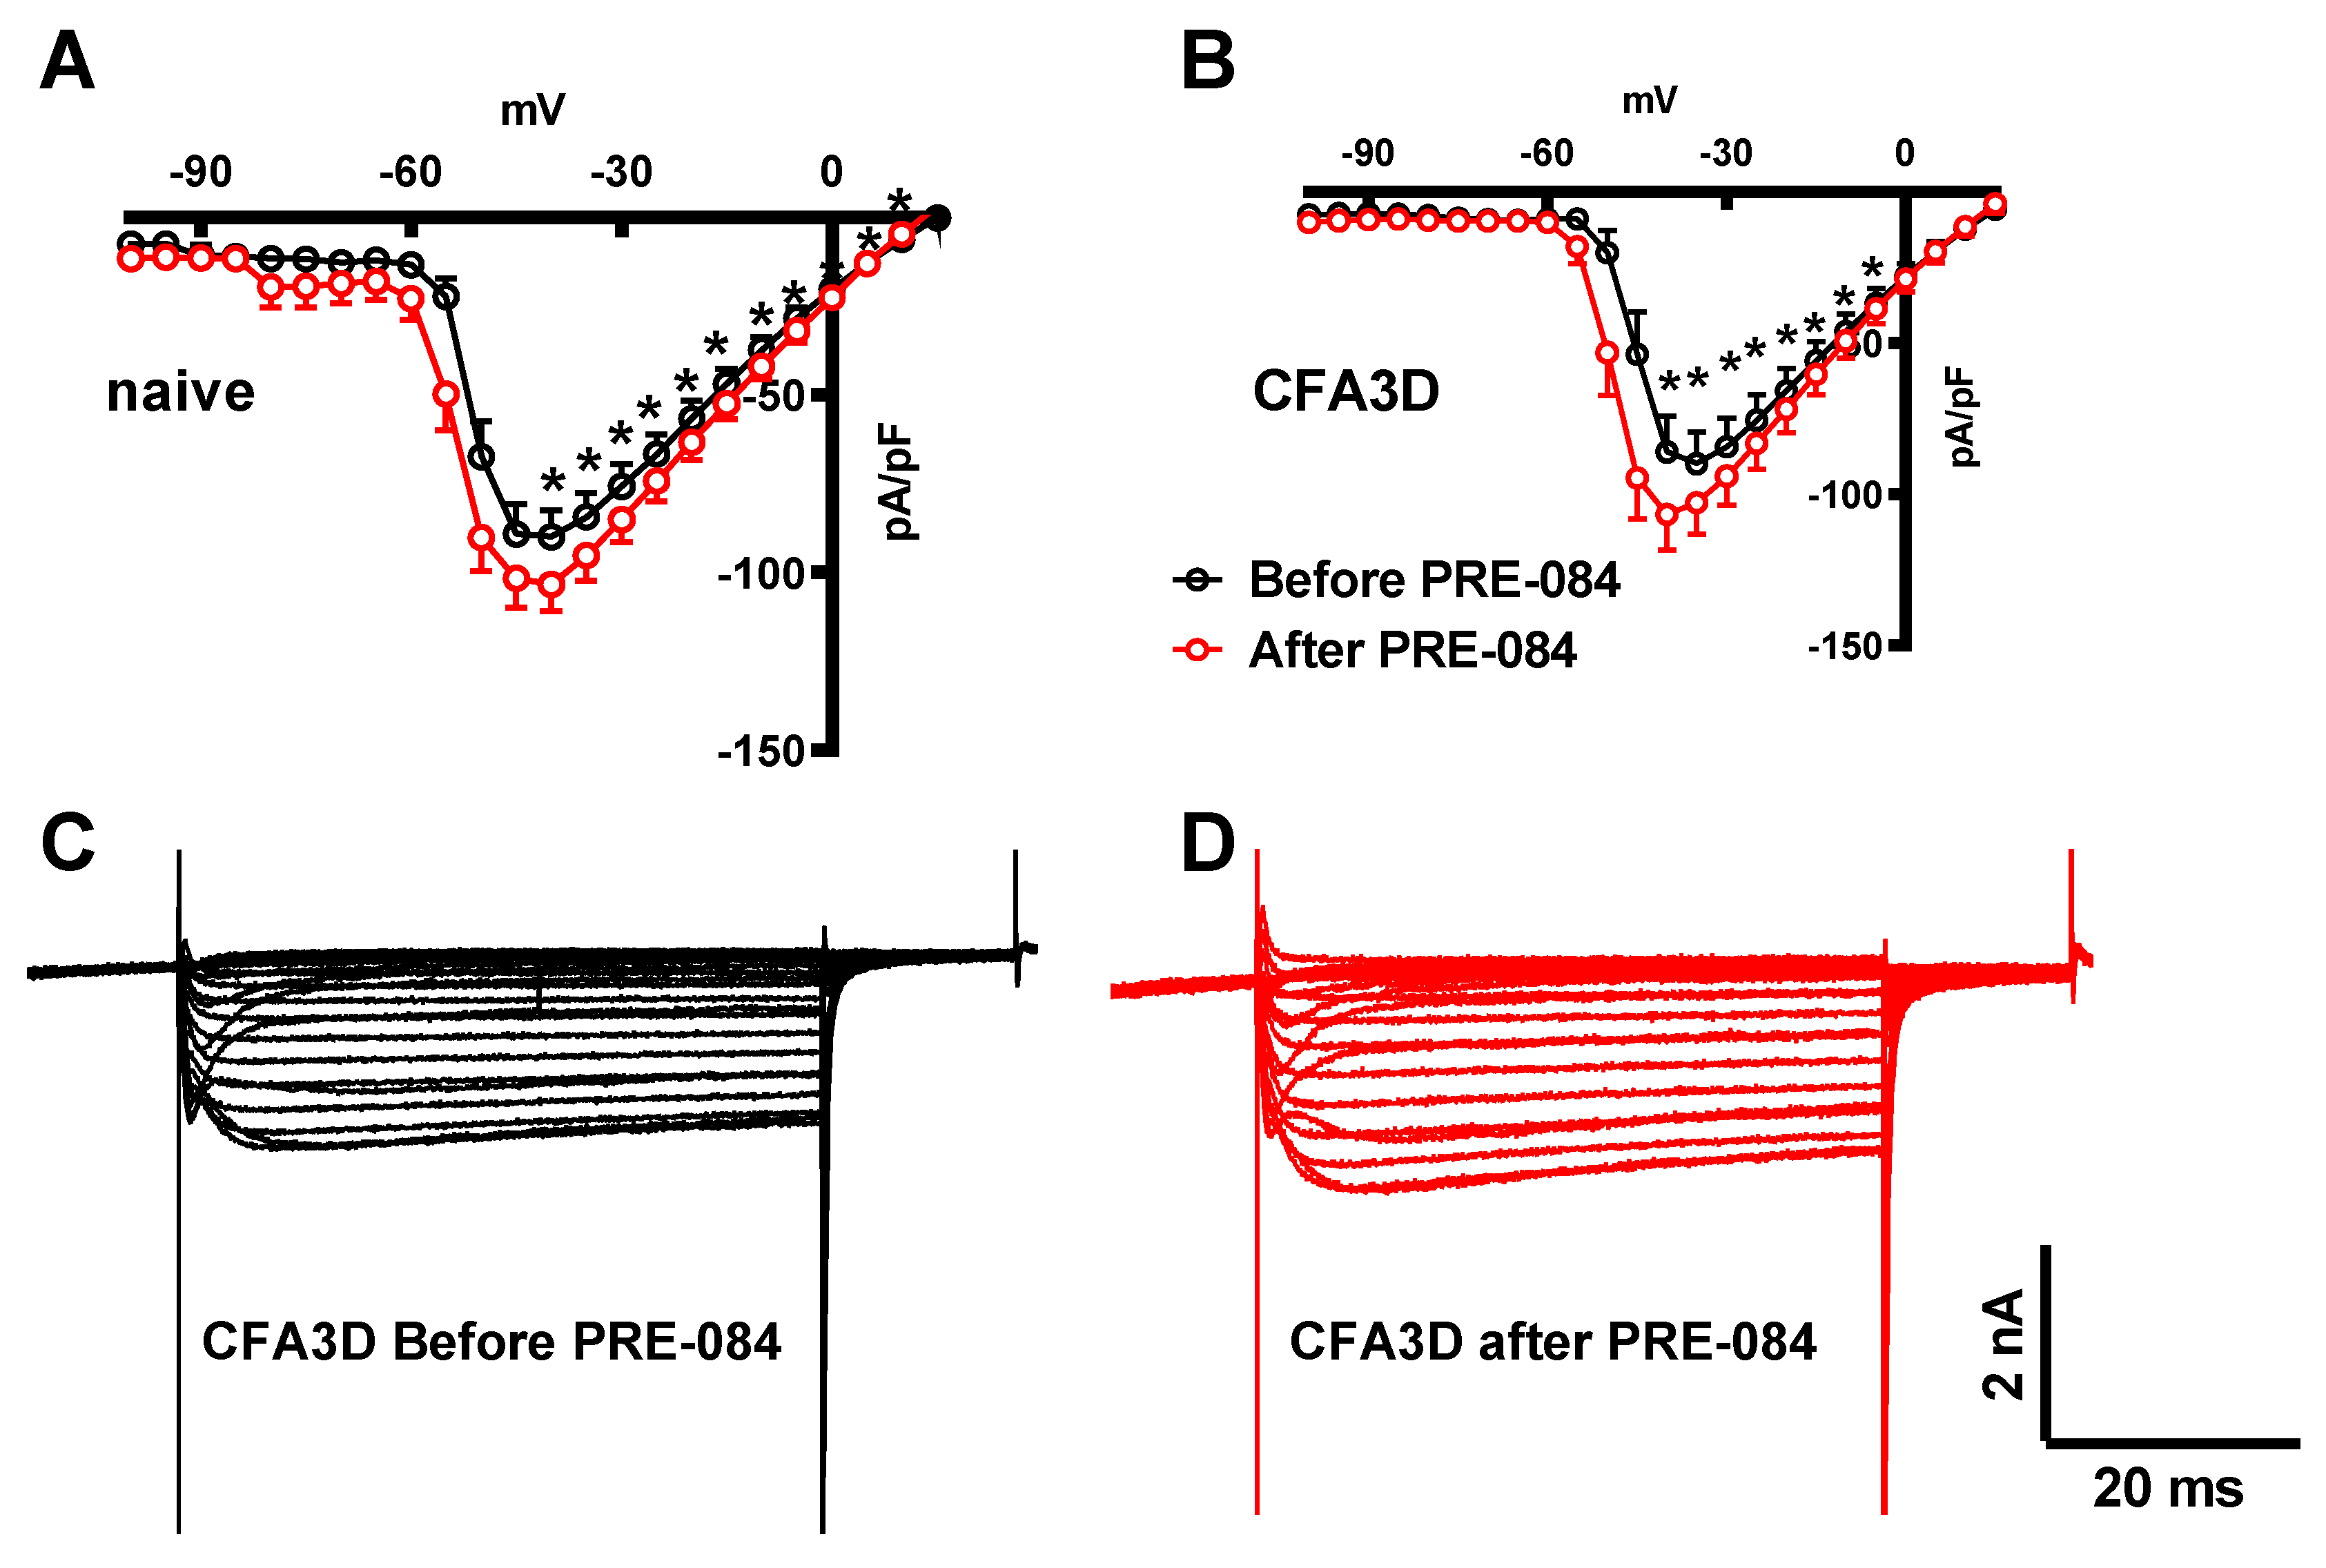
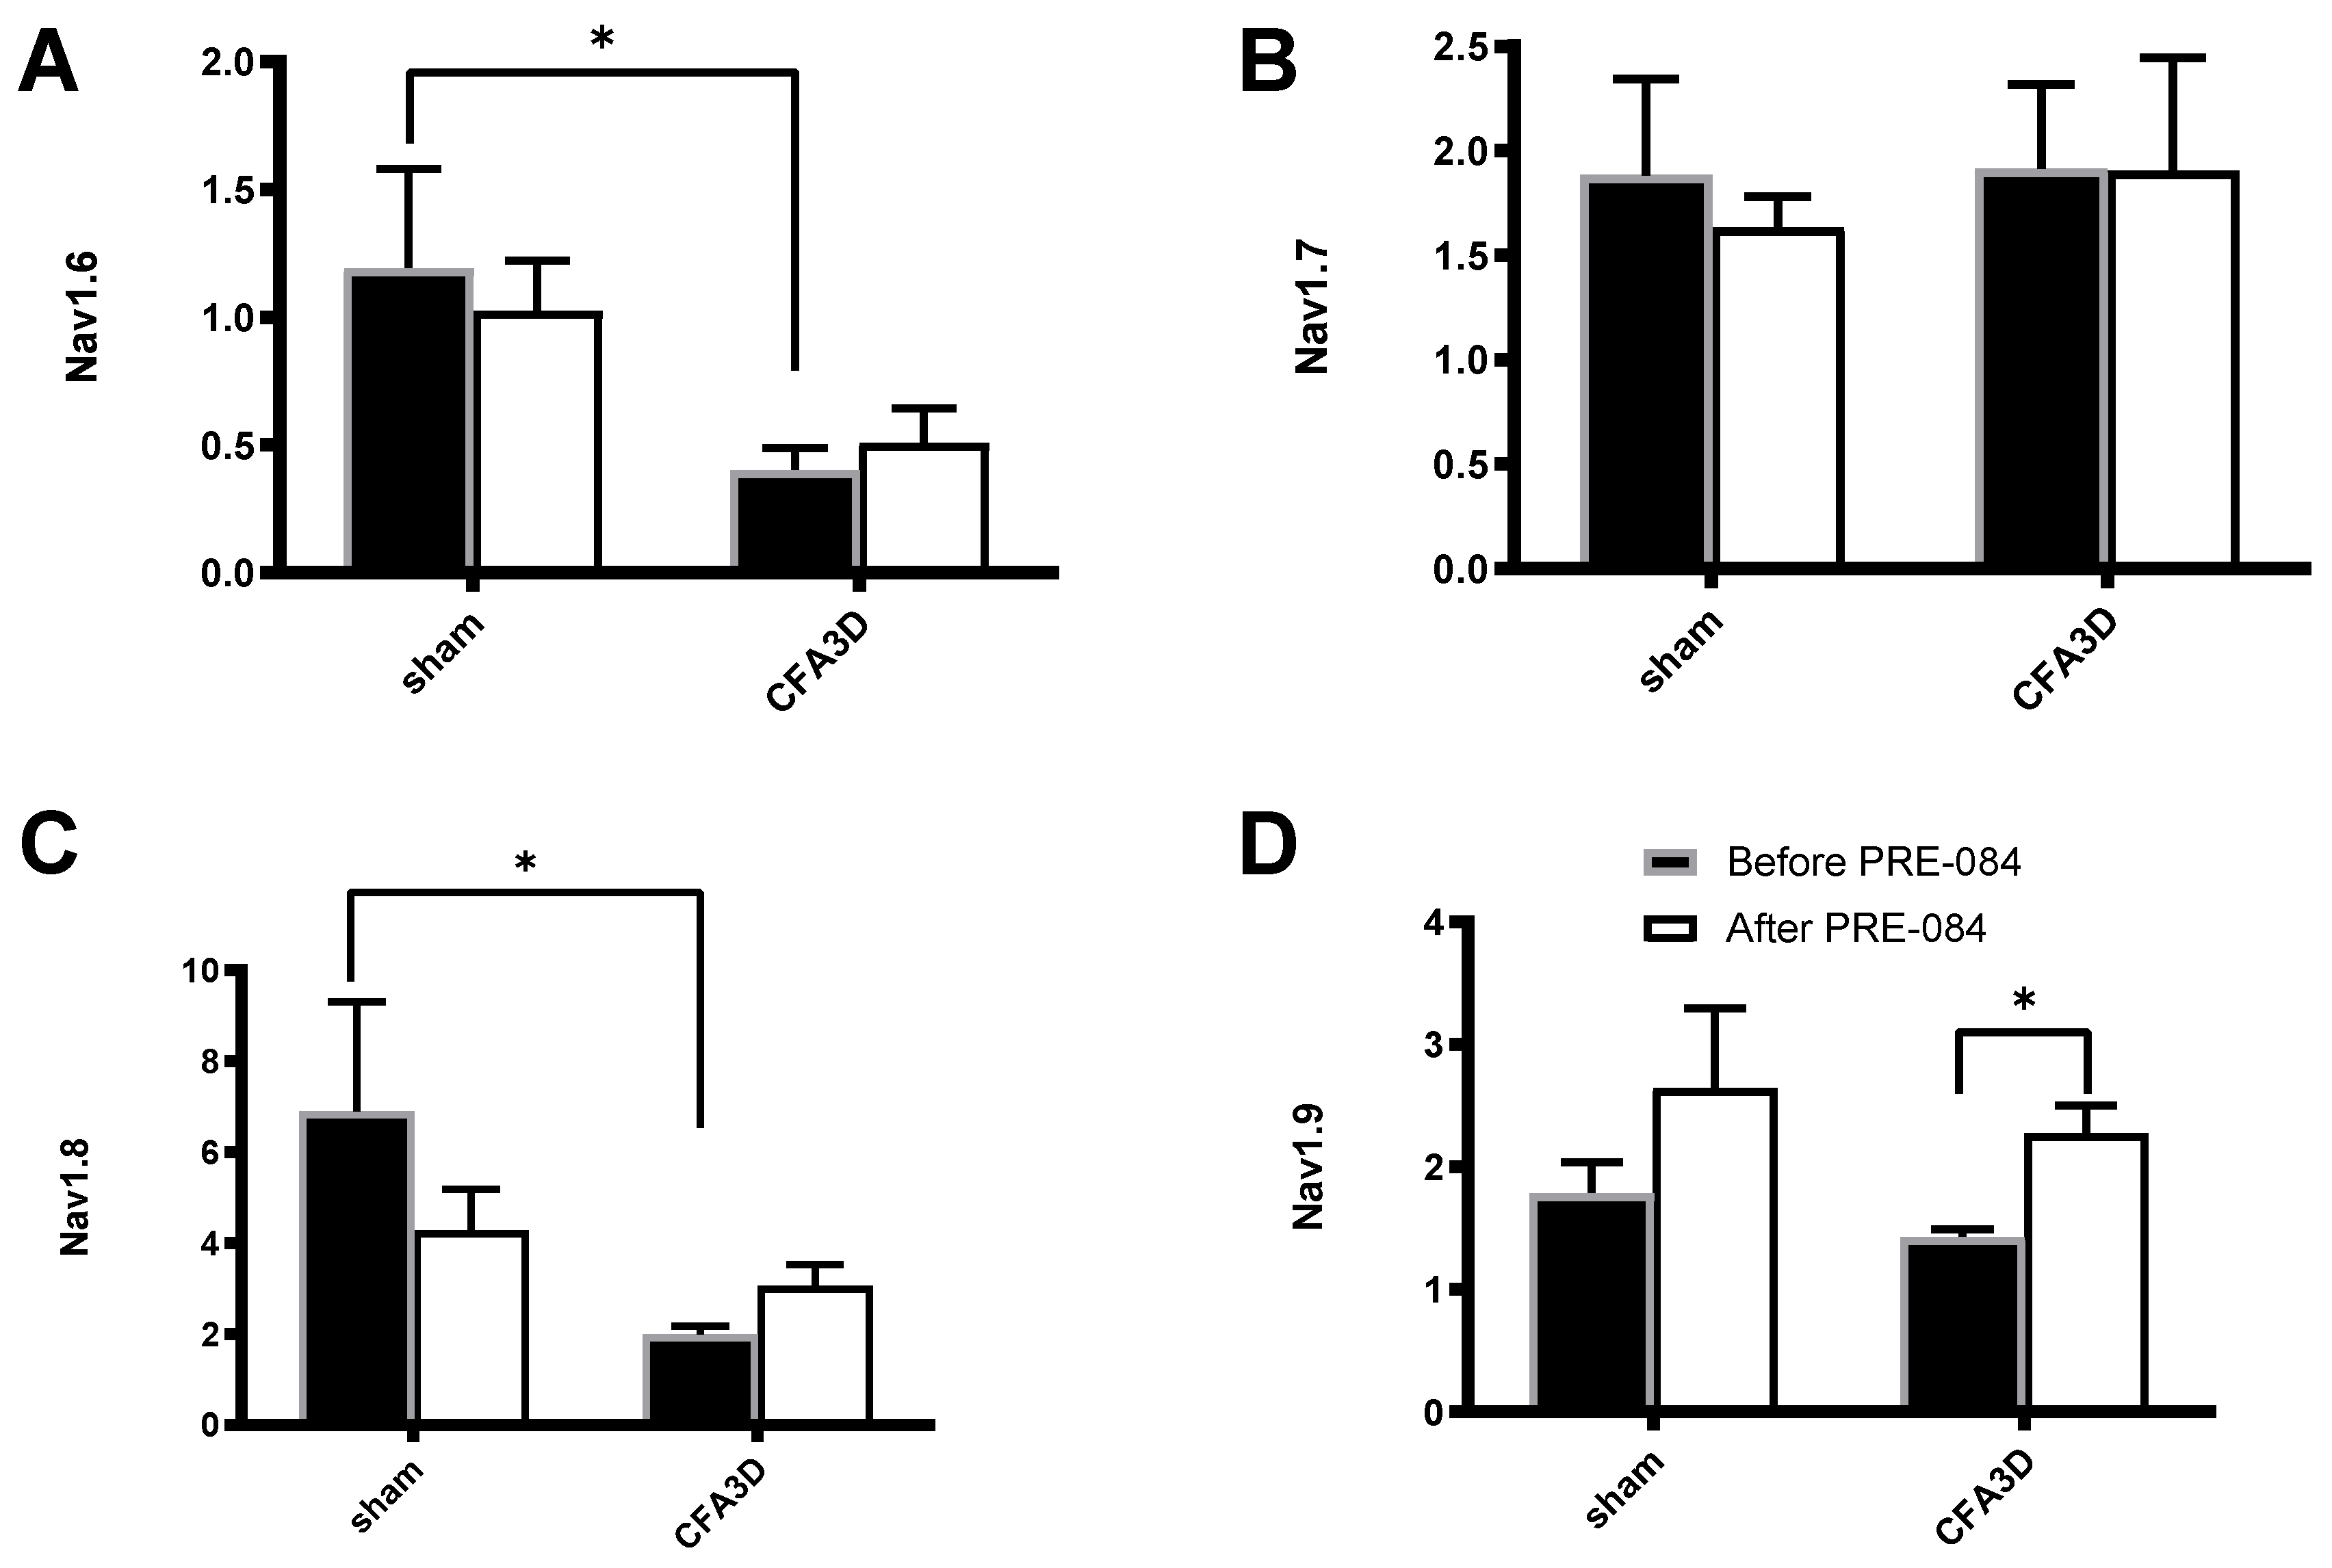
Figure 9.
The effects of PRE-084 on the mRNA abundance of Nav1.6-1.9. CFA3D reduced the relative mRNA abundance of Nav1.6 (A) and Nav1.8 (C) (*p < 0.05, sham vs. CFA3D). PRE-084 increased the relative mRNA abundance of Nav1.9 (D) (*p < 0.05, before vs. after PRE-084) and had no effect on Nav1.6 or Nav1.8 (A-C).
Disclaimer/Publisher’s Note: The statements, opinions and data contained in all publications are solely those of the individual author(s) and contributor(s) and not of MDPI and/or the editor(s). MDPI and/or the editor(s) disclaim responsibility for any injury to people or property resulting from any ideas, methods, instructions or products referred to in the content. |
© 2024 by the authors. Licensee MDPI, Basel, Switzerland. This article is an open access article distributed under the terms and conditions of the Creative Commons Attribution (CC BY) license (http://creativecommons.org/licenses/by/4.0/).
Copyright: This open access article is published under a Creative Commons CC BY 4.0 license, which permit the free download, distribution, and reuse, provided that the author and preprint are cited in any reuse.


