
Submitted:
31 October 2024
Posted:
01 November 2024
You are already at the latest version
Abstract
Background: Parenteral nutrition (PN) is a nutrient solution administered intravenously (IV) to premature babies. PN causes elevations of some amino acids in blood samples that are also biomarkers used in newborn screening (NBS). Therefore, PN status must be annotated on dried blood spot (DBS) cards by clinicians to reduce NBS laboratory burdens associated with potential false results, however, NBS laboratories continue to receive DBS with misannotated PN status. N-acetyltyrosine (NAT), a water-soluble tyrosine analog used to increase tyrosine bioavailability in PN solutions, can be used as a blood-based biomarker of PN administration in NBS assays.
Methods: Residual DBS specimens and manufactured DBS were used in analyses. The assay was developed and validated using flow injection analysis tandem mass spectrometry (FIA-MS/MS) for detection of NAT.
Results: NAT was only present in neonate DBS with annotated PN administration, and was multiplexed into first-tier newborn screening assays. NAT was highly correlated with amino acids present in PN solutions such as arginine, leucine, methionine, phenylalanine, and valine. In our sample cohort, we determined an NAT cutoff could aid identification of misannotated neonates administered PN. We also report the Amadori rearrangement product valine-hexose (Val-Hex) was quantifiable in neonates administered PN, which we suspect forms in the PN solution and/or IV lines.
Conclusions: Here we present the first known use of NAT as a biomarker for PN administration, which is currently being piloted by two U.S. NBS laboratories. NAT and Val-Hex can aid identification of misannotated DBS from neonates administered PN, thus, decreasing false positive rates.
Keywords:
Newborn Screening
; Parenteral nutrition
; Metabolic disorders
; multiplexing
; biomarker
1. Introduction
Parenteral nutrition (PN) is a solution of essential nutrients administered intravenously (IV) to treat malnutrition [1], most commonly during the first days of life in very premature low-birthweight infants. It is sometimes referred to as total PN (TPN). PN is prepared in the hospital pharmacy where concentrated macronutrients including amino acids and lipids, and micronutrients such as vitamins and minerals, are diluted to various concentrations in a 5 or 10% dextrose solution [2,3]. Newborns receive PN for various reasons including premature birth, necrotizing enterocolitis [4], and other intestinal disorders [5]. Premature birth is a nutritional emergency [5] and PN is often administered upon admission to the neonatal intensive care unit (NICU) to ensure adequate protein intake [6]. It is estimated 9-13% of neonates are admitted to the NICU [7] and up to 70% of NICU neonates are prescribed PN [8]. It is important to note that PN contains free amino acids, not intact proteins, and the protein intakes of premature babies are paired with appropriate gestational ages. For instance, premature babies 24 to 30 weeks have protein requirements ranging from 3.5 to 4.0 g/kg/day, while 34 to 36 weeks ranges from 2.5 to 3.0 g/kg/day [6].
There are still reports of postnatal growth failure in premature neonates despite numerous efforts to provide adequate PN in the NICU [9,10]. The postnatal growth failure in premature neonates administered PN may be associated with an incomplete understanding of nutrition and metabolism [i.e., immature metabolic pathways [11,12]] in low-birthweight NICU infants. For instance, one study administered adult PN solutions with higher levels of phenylalanine (Phe), aiming to deliver higher tyrosine (Tyr) by relying on enzymatic conversion by Phe hydroxylase [13]. However, in neonates the high Phe appeared to overload Phe metabolism causing elevated Phe and Phe catabolite excretion, rather than shunting completely to Tyr biosynthesis [13]. Tyr is an aromatic amino acid with low solubility in water which limits Tyr to < 1 % of total amino acids in PN solutions, while aromatic amino acids requirements in neonates were estimated at 3.1% to 3.9% of total [14]. It was hypothesized that Tyr deficiency in PN solutions could trigger low thyroxine, since both thyroxine and Tyr were similarly low [15] in a PN randomized clinical trial. The rationale was that low Tyr availability in PN could impact thyroxin biosynthesis, since the protein thyroglobulin is essential for thyroxin synthesis, and thyroglobulin contains roughly 140 Tyr residues with roughly 30 being iodinated [16].
In neonatal PN solutions, Tyr solubility limitations are overcome by adding an acetylated form of Tyr deemed N-acetyltyrosine (NAT) along with Tyr. NAT is found in PN solutions prescribed to NICU neonates in the U.S. [17,18] and it is not present in adult PN solutions. Nearly 4 decades ago NAT was described as a higher soluble form of Tyr for PN, increasing Tyr incorporation into tissues after NAT IV infusion [19]. However, NAT is poorly metabolized to Tyr by hepatic and renal enzymes [20], and although NAT administered by PN does increases Tyr in tissues, a large proportion of intact NAT is present in the blood and excreted in the urine [21,22]. Poor NAT metabolism appears to be a phenomena unique to neonates and children younger than twelve months of age, compared to children ages one to seven years, and may be related to oversaturation of deacetylases and the immature metabolism of neonates [23].
Newborn Screening (NBS) analyzes biomarkers from dried blood spots (DBS) collected shortly after birth to identify pre-symptomatic newborns at risk for rare inborn errors of metabolism (IEM). Flow injection analysis tandem mass spectrometry (FIA-MS/MS) is used to screen the majority of NBS biomarkers and diseases included in the US Recommended Uniform Screening Panel [24]. Many NBS amino acid biomarkers elevated in the presence of IEMs are the same amino acids present in PN solutions. In 2007, the expanded NBS program in the Netherlands documented 14 false-positive cases of homocystinuria over two months, all originating from a single NICU that was using PN solutions with high methionine (Met) content [25]. Since PN elevates levels of amino acids and other biomarkers in the blood, clinicians annotate PN status on DBS cards after collection, so NBS laboratories anticipate elevated biomarkers and report inconclusive screening results for selected IEMs. However, if PN status is not correctly annotated, the neonate can be identified as a presumptive positive for one or more IEMs. This occurrence in NBS laboratories is burdensome because both running additional tests and/or reaching out to hospital staff to confirm PN status is time consuming [26]. Also, the false positive results from a misannotated PN specimen could lead to a parent being notified their premature newborn is also at risk for an IEM which increases parental anxiety [27]. Since NAT is uniquely present in neonatal PN solutions, poorly metabolized, and detectable in the blood, we hypothesized that NAT could be used as a DBS-based biomarker of PN administration in NBS assays.
2. Materials and Methods
2.1. Sample Type and Preparation
Detailed information on clinical specimens, quality control (QC), and linearity materials used in analyses; method optimization; extraction methods; solvents and chemicals; and unlabeled biomarkers and isotopically-labeled internal standards (IS) are provided in Supplementary Materials. Certified values for linearity materials and QCs are presented in Table S1 and S2.
2.2. Acquisition, Quantification, and Data Analysis
Electrospray ionization source parameters, peak integrations, and quantification methods are presented in Supplementary Materials. Biomarker parent and product ion m/z, the IS employed for quantification, and cone and collision voltages are presented in Table S3. All quantified data and peak area data were exported as spreadsheets and imported into R version 4.2.1 [28] for analysis and visualization.
3. Results
The chemical structure of NAT, its product ion, and corresponding accurate M+H m/z’s are presented in Figure 1A. Analysis of residual NBS samples by FIA-MS/MS on a triple quadrupole platform appeared to indicate NAT was present in all samples (Figure 1B). This was surprising, however, by using a 20 µM NAT cutoff we could correctly identify 91.25 % of neonates with reported PN administered (PN+) with one or more elevated biomarker (PN+PosElv) samples (i.e., 73 of 80), with no presumptive normals being misidentified. Based on our cohort, if their DBS cards were not correctly annotated as PN+, a significant number of potential IEM false positives (i.e., PN+PosElv) could be flagged as PN+ solely by using NAT.
The presence of NAT in all residual NBS specimens was unusual given that NAT is not reported as an endogenous blood-based metabolite, therefore, we suspected an interference in the m/z 224.1 > 136.1 NAT transition on triple quadrupole platforms. The residual NBS specimens were re-analyzed by FIA coupled to high-resolution mass spectrometry (HRMS) using parallel reaction monitoring, and we determined a m/z 136.0870 present in the NAT m/z 224.1 > 136.1 transition is integrated on triple quadrupole platforms (Figure S1A and S1B). Figure 1C clearly displays NAT was only present in PN+ specimens when analyzed by HRMS (i.e., 74 of 80 PN+PosElv, 92.5%), and six of the seven PN+PosElv that had NAT < 20 µM (Figure 1B) did not have any detectable NAT present in the blood (Figure 1C). We hypothesized that these six PN+PosElv neonates had been taken off PN [26] and/or transitioned to enteral feeding, and their DBS cards were still annotated as PN+, thus, there was sufficient time for NAT urinary excretion prior to their DBS collection.
Next, concentrations of biomarkers in PN+ specimens were correlated using Spearman correlations and a bubble correlogram of Spearman coefficients was generated. The full bubble correlogram is presented in Figure S2. Figure 2 displays NAT was highly correlated with arginine (Arg), leucine (Leu), Met, Phe, and valine (Val). This was expected since NAT is present in PN solutions with these amino acids, so an increase in NAT should result in a concomitant increase in amino acids. Isovalerylcarnitine (C5) was positively correlated with NAT, which is not present in PN solutions, however, it is well known that C5 elevates in PN+ as a metabolic byproduct [29].
Figure 3A and 3B display bi-plots with NAT and amino acids that were acquired by FIA-MS/MS on a triple quadrupole platform. Figure 3A displays NAT and Phe concentrations of residual NBS specimens, along with hashed lines denoting 20 µM NAT and 140 µM Phe (i.e., 2023 average US Phe cutoff). In the lower left quadrant, one can see the coalescence of presumptive normals, PN+ with no elevations in biomarkers (PN+NegElv), a few PN+PosElv with NAT < 20 µM, and a tyrosinemia type 1 (TYRSN1, OMIM 276700, n=1) confirmed case. The upper left quadrant had only PN+, while the upper right quadrant had only PN+PosElv specimens. In the lower right quadrant, one can see the four PN+PosElv specimens that had NAT < 20 µM and Phe concentrations exceeding 140 µM. Figure 3B displays NAT and Leu concentrations of the residual NBS specimens, along with hashed lines denoting 20 µM NAT and 290 µM Leu (i.e., 2023 average US Leu cutoff). The distribution of data in Figure 3B bi-plot is similar to Figure 3A. In both Figure 3A and 3B one can see that the several of the seven PN+PosElv specimens with NAT < 20 µM did have elevated concentrations of amino acids, which we feel supports our hypothesis that the six of seven PN+PosElv specimens without NAT (Figure 1B and 1C) were removed from PN prior to DBS collection. Some NICUs discontinue PN administration to normalize amino acids, while continuing glucose administration, several hours before DBS collection to minimize NBS inconclusive specimens [26]. It is also important to note that in Figure 3A and 3B, the two specimens with the highest NAT had the highest levels of each amino acid.
NAT quantification in our cohort of residual NBS specimens demonstrated positive clinical utility, so we validated the multiplexed method. It is important to note that in addition to NAT and NAT IS, we added direct IS for C5:1, C10:0, and C14:1, which have historically used surrogate IS in NBS assays. Furthermore, we created 9-level DBS NAT linearity materials spanning from 0 to 250 µM for use in validation (Figure 4), since none of the QC and linearity DBS materials currently manufactured by our group contains NAT. Figure 4A demonstrates the NAT response was linear across the enriched concentrations, while Figure 4B demonstrates that NAT did not hydrolyze to Tyr in these validation materials (i.e., NAT was stable in the DBS). Analytical validation parameters presented included precision, linearity, and estimated of limit of detection (LOD) and limit of quantification (LOQ) using the Taylor method, which are presented in Table 1. Concentrations of DBS QC and linearity materials are presented in Tables S1 and S2. Precision was measured by analyzing low, middle, and high DBS QCs in triplicate on 20 separate days, so the data are presented as the precision range across the three QC levels. Precision was ≤ ~16% for all biomarkers (Table 1). Precision data on each of the QC pools individually are presented in Table S4. Linearity was assessed by analyzing the manufactured linearity materials in triplicate on a single day, using the measured and expected concentration of each biomarker. All biomarkers analyzed in Table 1 had R2 values ≥ 0.99. Estimated LOD and LOQ were sufficient for most biomarkers, and we calculated the signal-to-noise ratio for several biomarkers that had higher than expected estimated LODs and LOQs which are presented in Table S5. Since many NBS labs are already screening Tyr using the IS Tyr-13C6, we also calculated NAT precision using this surrogate IS and these similar results are presented in Table S6.
Lastly, we hypothesized that since dextrose and amino acids are simultaneously present during PN administration, that amino acid-dextrose conjugates called Amadori rearrangement products (ARPs) would be detectable. Recently ARPs were demonstrated as biomarkers for some IEMs [30], and we included ARP transitions during the HRMS reanalysis of residual NBS specimens. Unfortunately, the major product ion of ARPs is an intramolecular dehydration which is a very common small molecule dissociation product, so to add confidence to our identification, data were acquired using a mass resolving power of 60,000 and we used the accurate product ion m/z with a ∆ 5-ppm threshold as integration criteria. Val-hexose (Val-Hex) was present in 57.5% of PN+PosElv specimens, compared to 22.5% Phe-hexose, 3.75% Met-hexose, 0% Tyr-hexose, and 0% Leu-hexose. The structure of Val-Hex is presented in Figure 5A along with the M+H m/z of the parent and product ion. More information regarding the mass spectra and confirmation of Val-Hex identification are presented in Figure S3. Since we found no internal standards commercially available for ARPs, we used Val-2H8 as a surrogate IS for Val-Hex quantification.
As mentioned, the two neonates with the highest NAT also had the highest levels of Phe and Leu (Figure 3A and 3B). Figure 5B displays the amino acid profiles for these two neonates, which had Val-Hex concentrations exceeding 100 µM. Figure S4A displays the histogram of Val-Hex concentrations and no other PN+ neonate had Val-Hex > 50 µM. Furthermore, the two neonates with Val-Hex > 100 µM also had the highest level of nearly every amino acid (Figure S4A-S4F). The amino acid profiles resembled specimens where clinical staff collect the DBS from the PN IV port, which contaminates the blood with the PN solution, and is considered improper DBS specimen collection. CLSI guidelines state that DBS should be collected by heel prick, and while not documented in the literature, it is known by NBS laboratories and clinical follow-up teams that improper specimen collection does sometimes occur. Taken together, we hypothesize that Val-Hex, NAT, and other amino acids could be used as a screening algorithm for improper DBS collection during PN administration.
4. Discussion
In our current study, we hypothesized the presence of NAT in neonatal DBS could be utilized as a biomarker of PN administration. Using residual NBS DBS specimens, we confirmed NAT was present in 74 of the 80 PN+PosElv specimens and hypothesize the remaining six were transitioned to enteral feeding or fasted hours prior to DBS collection; thus, giving sufficient time for NAT to be excreted in the urine. Roughly 50% of PN+NegElv specimens had NAT present in the blood, the remainder likely had DBS collection before or shortly after PN administration (i.e., not enough time for NAT and amino acids to elevate in the blood prior to collection). NAT was not detected in any presumptive normal, nor was it present in the TYRSN1 specimen. There are currently two U.S. NBS laboratories actively piloting NAT and Val-Hex screening in a clinical setting, Manning et al. recently presented their preliminary NAT clinical results at the 2023 Association for Public Health Laboratories NBS Symposium [31]. We are working with three additional U.S. NBS laboratories to aid pilot adoption of NAT and Val-Hex into their assays.
The biomarkers NAT and Val-Hex address several challenges associated with previously reported PN administration markers. In 2010, we identified unique m/z signals from elevated dextrose in PN solutions using butyl ester analysis of DBS from PN+ samples [32]. However, the use of butyl ester derivatization in newborn screening (NBS) has steadily declined over the past decade [33], and dextrose is undetectable in DBS without derivatization. Val-Hex may allow detection of PN-contaminated blood for both amino acids and dextrose in non-butyl ester assays. Other potential PN biomarkers, like transthyretin [34] and phthalates [35], have been suggested, but proteins are precipitated during NBS small molecule extraction, and phthalates in DBS may not be detectable under FIA-MS/MS conditions. Val-Hex and NAT offer the added benefit of being easily integrated into existing NBS methods using surrogate IS Val-2H8 and Tyr-13C6, respectively.
NAT detection in blood after administration of NAT-containing PN solutions has been well known for several decades [20]. However, to our knowledge, our study is the first to hypothesize and demonstrate the clinical utility of NAT as a PN administration biomarker in first-tier NBS assays. In neonates and children < 12 months, the poor metabolism of NAT was suggested as unique, since the phenomena was not observed in children ages one to seven [23]. In 2001 glycyl-L-tyrosine was demonstrated to be a more bioavailable source of Tyr in neonates, with extremely low, if any, excretion of the dipeptide [14]. While we mention the association between low thyroxine and low Tyr as possibly being related Tyr deficiency during PN administration [15], it was suggested that newborns administered PN more than 15 days could suffer from iodine deficiency resulting in low thyroxine levels [36]; however, most neonates are transferred to enteral nutrition sooner to support growth and development of the GI system [37]. While sources of Tyr and PN solution composition were outside the scope of our study, it is possible the immature metabolic pathways of premature neonates could explain the low Tyr while administered PN. If manufacturers alter PN formulas to contain more bioavailable forms of Tyr in the future, it should be considered to have some NAT present, as it does provide NBS laboratories the ability to determine PN status and blood contaminated with PN.
We acknowledge that NAT's rapid urinary excretion limits its utility, making it detectable in blood only during PN administration and for a few hours after PN is discontinued, and overall there is limited information regarding NAT as a metabolite in humans. While we state NAT is not an endogenous metabolite in the blood, it is important to note NAT has been found in the urine of TYRSN1, tyrosyluria [20,21], and tyrosinosis [38]. Therefore, we acknowledge that NAT is produced in humans through a mechanism historically associated with clearing excess Tyr. More recently in 2020, NAT was demonstrated in stressed animal models to function as an intrinsic factor of mitohormesis [39]. Also this study reported NAT detection in what appeared to be 80 µL pooled adult human serum [39], and comparison of their spectral results, the pure NAT standard (Figure S1C), and spectral results from our PN+ specimens (Figure S1B) are all in agreement. We acknowledge it is possible NAT could be a low abundant circulating metabolite in adults that we were not able to detect in 3.1 µL of whole blood on DBS collected from neonates shortly after birth. It is also important to note that NAT is sold as a nutritional supplement, similar to N-acetylcysteine. Therefore, while very unlikely in our opinion, it may be possible that a mother consuming a NAT dietary supplement shortly before giving birth or while breastfeeding, could result in NAT elevations in their newborn’s DBS; although we found no data in the literature to support this.
Our study confirms NAT as a reliable biomarker for PN administration. Using our assay and instrument, a NAT concentration ≥ 20 µM indicates PN use, with positive correlations observed between NAT levels and other elevated analytes during PN administration. However, NAT concentrations < 20 µM in PN-annotated samples did not always correspond with normal levels of other analytes. This discrepancy is likely due to NAT’s rapid urinary excretion (within 4-8 hours) [20], while amino acids and C5 can take up to 48 hours to normalize [40]. The sample cohort size may be considered a limitation to our study, but since our laboratory does not perform routine NBS, we rely on receiving residual NBS specimens from U.S. public health NBS laboratories. These labs only know if PN was administered around the time of sample collection, without details on the type of PN or whether the newborn was fasting. Some hospitals practice glucose-only PN or fasting before sample collection to minimize false biomarker elevations and reduce the need for repeat tests [26]. Further studies should include detailed data on feeding and PN doses within the 6-hour period before collection.
Once the clinical utility of our assays is demonstrated and disseminated, our group will then transfer the technology to NBS laboratories for pilot testing in thousands of samples for clinical validation. Based on early disclosures and discussions with various stakeholders, along with our recent disclosure of these study results the 2023 Association for Public Health Laboratories NBS Symposium [31], we anticipate global adoption of NAT as a biomarker of PN administration. To support adoption, starting in 2024 we began piloting the addition of NAT into DBS based quality assurance materials manufactured. We are currently working to obtain freshly made PN solutions from a hospital to confirm our Val-Hex hypothesis. Future directions should include using NAT in combination with other biomarkers to investigate the possibility of developing algorithms that can aid identification of premature neonates with IEMs being administered PN, to enhance diagnosis and accelerate treatment initiation. In conclusion, addition of NAT in first-tier NBS assays provides the ability to identify PN+ specimens that may be incorrectly annotated, along other potential uses in clinical chemistry and neonatology.
Abbreviations:
PN, Parenteral nutrition
IV, Intravenous
TPN, Total parenteral nutrition
NICU, Neonatal intensive care unit
Phe, Phenylalanine
Tyr, Tyrosine
NAT, N-acetyltyrosine
NBS, Newborn screening
IEM, Inborn error of metabolism
FIA-MS/MS, Flow injection analysis tandem mass spectrometry
Met, Methionine
QC, Quality control
IS, Internal Standard
PN+, Neonate with reported parenteral nutrition administration
PN+PosElv Neonate with reported parenteral nutrition administration and elevations in one or more biomarkers
HRMS, High-resolution mass spectrometry
Arg, Arginine
C5, Isovalerylcarnitine
Leu, Leucine
Val, Valine
PN+NegElv Neonate with reported parenteral nutrition administration and no elevations in biomarkers
TYRSN1, Tyrosinemia type 1
LOD, Limit of detection
LOQ, Limit of quantification
ARP, Amadori rearrangement products
Val-Hex, Valine-hexose
Author Contributions
Conceptualization, CAP, KP, DHC; Methodology, CAP, KP, SLI; Software, CAP; Validation, CAP, SS, SLI; Formal Analysis, CAP, SS, RC, ERC, TL, SLI; Investigation, CAP, KP; Resources, KP, RL, CC; Data Curation, CAP, RC, ERC, TL; Writing – Original Draft Preparation, CAP, KP; Writing – Review & Editing, CAP, SS, RC, SLI, ERC, TL, DHC, RL, CC, KP; Visualization, CAP, SLI; Supervision, CAP, KP, RL, CC; Project Administration, CAP, KP, RL, CC; Funding Acquisition, KP, RL, CC.
Acknowledgments
The authors thank the Biochemical Mass Spectrometry laboratory (BMSL) and Newborn Screening Quality Assurance Program (NSQAP) lab staff for producing and certifying the QC materials. The authors would also like to thank the Texas Department of State Health Services Newborn Screening Laboratory for providing the de-identified residual newborn screening specimens that were used in this study. Samyukta Sah and Rahul Chandrappa were supported in part by an appointment to the Science Education and Workforce Development Programs at Oak Ridge National Laboratory, administered by Oak Ridge Institute for Science and Education through the U.S. Department of Energy.
Conflicts of Interest
The authors have no conflicts of interest to disclose.
Disclaimer:
The findings and conclusions in this study are those of the authors and do not necessarily represent the views of the U.S. Department of Health and Human Services, or the U.S. Centers for Disease Control and Prevention. Use of trade names and commercial sources is for identification only and does not constitute endorsement by the U.S. Department of Health and Human Services, or the U.S. Centers for Disease Control and Prevention.
References
- Hamdan, M. and Y. Puckett, Total Parenteral Nutrition, in StatPearls. 2022: Treasure Island (FL).
- Riskin, A. Shiff, and R. Shamir, Parenteral nutrition in neonatology--to standardize or individualize? Isr Med Assoc J, 2006. 8(9): p. 641-5.
- Slattery, E. , et al., 3-in-1 vs 2-in-1 parenteral nutrition in adults: a review. Nutr Clin Pract, 2014. 29(5): p. 631-5.
- Savarino, G.; Carta, M.; Cimador, M.; Corsello, A.; Giuffrè, M.; Schierz, I.A.M.; Serra, G.; Corsello, G. Necrotizing enterocolitis in the preterm: newborns medical and nutritional Management in a Single-Center Study. Ital. J. Pediatr. 2021, 47, 1–9. [Google Scholar] [CrossRef] [PubMed]
- Cerdó, T.; García-Santos, J.A.; Rodríguez-Pöhnlein, A.; García-Ricobaraza, M.; Nieto-Ruíz, A.; Bermúdez, M.G.; Campoy, C. Impact of Total Parenteral Nutrition on Gut Microbiota in Pediatric Population Suffering Intestinal Disorders. Nutrients 2022, 14, 4691. [Google Scholar] [CrossRef]
- Hay, W.W. Nutritional Support Strategies for the Preterm Infant in the Neonatal Intensive Care Unit. Pediatr. Gastroenterol. Hepatol. Nutr. 2018, 21, 234–247. [Google Scholar] [CrossRef]
- Pineda, R.; Knudsen, K.; Breault, C.C.; Rogers, E.E.; Mack, W.J.; Fernandez-Fernandez, A. NICUs in the US: levels of acuity, number of beds, and relationships to population factors. J. Perinatol. 2023, 43, 796–805. [Google Scholar] [CrossRef]
- Calkins, K.L.; Venick, R.S.; Devaskar, S.U. Complications Associated with Parenteral Nutrition in the Neonate. Clin. Perinatol. 2014, 41, 331–345. [Google Scholar] [CrossRef]
- Dinerstein, A.; Nieto, R.M.; Solana, C.L.; Perez, G.P.; E Otheguy, L.; Larguia, A.M. Early and aggressive nutritional strategy (parenteral and enteral) decreases postnatal growth failure in very low birth weight infants. J. Perinatol. 2006, 26, 436–442. [Google Scholar] [CrossRef]
- Horbar, J.D.; Ehrenkranz, R.A.; Badger, G.J.; Edwards, E.M.; Morrow, K.A.; Soll, R.F.; Buzas, J.S.; Bertino, E.; Gagliardi, L.; Bellù, R. Weight Growth Velocity and Postnatal Growth Failure in Infants 501 to 1500 Grams: 2000–2013. Pediatrics 2015, 136, e84–e92. [Google Scholar] [CrossRef]
- Kadrofske, M.M.; Parimi, P.S.; Gruca, L.L.; Kalhan, S.C.; El-Kadi, S.W.; Suryawan, A.; Gazzaneo, M.C.; Srivastava, N.; Orellana, R.A.; Nguyen, H.V.; et al. Effect of intravenous amino acids on glutamine and protein kinetics in low-birth-weight preterm infants during the immediate neonatal period. Am. J. Physiol. Metab. 2006, 290, E622–E630. [Google Scholar] [CrossRef]
- Kalhan, S.C.; Parimi, P.S.; Gruca, L.L.; Hanson, R.W. Glutamine supplement with parenteral nutrition decreases whole body proteolysis in low birth weight infants. J. Pediatr. 2005, 146, 642–647. [Google Scholar] [CrossRef]
- A Roberts, S.; O Ball, R.; Filler, R.M.; Moore, A.M.; Pencharz, P.B. Phenylalanine and Tyrosine Metabolism in Neonates Receiving Parenteral Nutrition Differing in Pattern of Amino Acids. Pediatr. Res. 1998, 44, 907–914. [Google Scholar] [CrossRef]
- A Roberts, S.; O Ball, R.; Moore, A.M.; Filler, R.M.; Pencharz, P.B. The Effect of Graded Intake of Glycyl-l-Tyrosine on Phenylalanine and Tyrosine Metabolism in Parenterally Fed Neonates with an Estimation of Tyrosine Requirement. Pediatr. Res. 2001, 49, 111–119. [Google Scholar] [CrossRef]
- Kelleher, A.S.; Clark, R.H.; Steinbach, M.; Chace, D.H.; Spitzer, A.R. ; for the Pediatrix Amino-Acid Study Group The influence of amino-acid supplementation, gestational age and time on thyroxine levels in premature neonates. J. Perinatol. 2008, 28, 270–274. [Google Scholar] [CrossRef]
- Belkadi, A.; Jacques, C.; Savagner, F.; Malthièry, Y. Phylogenetic analysis of the human thyroglobulin regions. Thyroid. Res. 2012, 5, 3–3. [Google Scholar] [CrossRef]
- cited 2023 12/1]; Available from: https://www.baxterpi.com/pi-pdf/Premasol_PI.pdf.
- cited 2023 11/1]; Available from: https://www.rxlist.com/trophamine-drug.htm#description.
- Im, H.A. P.D. Meyer, and L.D. Stegink, N-acetyl-L-tyrosine as a tyrosine source during total parenteral nutrition in adult rats. Pediatr Res, 1985. 19(6): p. 514-8.
- Magnusson, I.; Ekman, L.; Wångdahl, M.; Wahren, J. N-acetyl-l-tyrosine and N-acetyl-l-cysteine as tyrosine and cysteine precursors during intravenous infusion in humans. Metabolism 1989, 38, 957–961. [Google Scholar] [CrossRef]
- Druml, W.; Lochs, H.; Roth, E.; Hubl, W.; Balcke, P.; Lenz, K. Utilization of tyrosine dipeptides and acetyltyrosine in normal and uremic humans. Am. J. Physiol. Metab. 1991, 260, E280–E285. [Google Scholar] [CrossRef]
- Hoffer, L.J. , et al., N-acetyl-L-tyrosine as a tyrosine source in adult parenteral nutrition. JPEN J Parenter Enteral Nutr, 2003. 27(6): p. 419-22.
- Shelton, C.M.; Clark, A.J.; Storm, M.C.; Helms, R.A. Plasma Amino Acid Concentrations in 108 Children Receiving a Pediatric Amino Acid Formulation as Part of Parenteral Nutrition. J. Pediatr. Pharmacol. Ther. 2010, 15, 110–118. [Google Scholar] [CrossRef]
- Administration, H.R.S. Recommended Uniform Screening Panel. 2023 [cited 2024 September 25]; Available from: https://newbornscreening.hrsa.gov/about-newborn-screening/recommended-uniform-screening-panel#:~:text=The%20Recommended%20Uniform%20Screening%20Panel%20(RUSP)%20is%20a%20national%20guideline#:~:text=The%20Recommended%20Uniform%20Screening%20Panel%20(RUSP)%20is%20a%20national%20guideline.
- Hoedt, A.E.T.; van Kempen, A.A.; Boelen, A.; Duran, M.; Kemper-Proper, E.A.; Oey-Spauwen, M.J.W.; Wijburg, F.A.; Bosch, A.M. High incidence of hypermethioninaemia in a single neonatal intensive care unit detected by a newly introduced neonatal screening programme. J. Inherit. Metab. Dis. 2007, 30, 978–978. [Google Scholar] [CrossRef]
- Wiggins, J.B.; Khan, M.M.; Vergales, B.D. Pausing TPN to Decrease Abnormal Newborn Screens: A NICU Quality Initiative. Pediatr. Qual. Saf. 2022, 7, e595. [Google Scholar] [CrossRef]
- Schmidt, J.L.; Castellanos-Brown, K.; Childress, S.; Bonhomme, N.; Oktay, J.S.; Terry, S.F.; Kyler, P.; Davidoff, A.; Greene, C. The impact of false-positive newborn screening results on families: a qualitative study. Anesthesia Analg. 2012, 14, 76–80. [Google Scholar] [CrossRef]
- R Core Team. R: A language and environment for statistical computing. 2017, R Foundation for Statistical Computing, Vienna, Austria.
- Clark, R.H.; Chace, D.H.; Spitzer, A.R. ; for the Pediatrix Amino Acid Study Group Effects of Two Different Doses of Amino Acid Supplementation on Growth and Blood Amino Acid Levels in Premature Neonates Admitted to the Neonatal Intensive Care Unit: A Randomized, Controlled Trial. Pediatrics 2007, 120, 1286–1296. [Google Scholar] [CrossRef]
- van Outersterp, R.E. , et al., Amadori rearrangement products as potential biomarkers for inborn errors of amino-acid metabolism. Commun Biol, 2021. 4(1): p. 367.
- Olney, R.S.; Bonham, J.R.; Schielen, P.C.J.I.; Slavin, D.; Ojodu, J. 2023 APHL/ISNS Newborn Screening Symposium. Int. J. Neonatal Screen. 2023, 9, 54. [Google Scholar] [CrossRef]
- Chace, D.H.; De Jesús, V.R.; Lim, T.H.; Hannon, W.H.; Spitzer, A.R. Tandem mass spectrometric identification of dextrose markers in dried-blood spots from infants receiving total parenteral nutrition. Clin. Chim. Acta 2010, 411, 1806–1816. [Google Scholar] [CrossRef]
- Pickens, C.A.; Sternberg, M.; Seeterlin, M.; De Jesús, V.R.; Morrissey, M.; Manning, A.; Bhakta, S.; Held, P.K.; Mei, J.; Cuthbert, C.; et al. Harmonizing Newborn Screening Laboratory Proficiency Test Results Using the CDC NSQAP Reference Materials. Int. J. Neonatal Screen. 2020, 6, 75. [Google Scholar] [CrossRef]
- Freitas, R.G.B.d.O.N.; Hessel, G.; Vasques, A.C.J.; Nogueira, R.J.N. Transthyretin levels: Potential biomarker for monitoring nutritional support efficacy and clinical complications risk in patients receiving parenteral nutrition. Clin. Nutr. ESPEN 2018, 24, 134–139. [Google Scholar] [CrossRef]
- Al-Saleh, I.; Elkhatib, R.; Alnuwaysir, H.; Aldhalaan, H.; Alismail, E.; Binmanee, A.; Hawari, A.; Alhazzani, F.; Bin Jabr, M.; Mohamed, G. Exposure of preterm neonates receiving total parenteral nutrition to phthalates and its impact on neurodevelopment at the age of 2 months. Sci. Rep. 2023, 13, 1–16. [Google Scholar] [CrossRef]
- Pérsico, R.S.; Silveira, R.d.C.d.S.; Gazal, C.H.A.; Viana, L.V. Prevalence of thyroid dysfunction in neonates receiving parenteral nutrition in the intensive care unit. J. de Pediatr. 2022, 99, 79–85. [Google Scholar] [CrossRef]
- Jacobi, S.K.; Odle, J. Nutritional Factors Influencing Intestinal Health of the Neonate. Adv. Nutr. Int. Rev. J. 2012, 3, 687–696. [Google Scholar] [CrossRef]
- Fairney, A.; Francis, D.; Ersser, R.S.; Seakins, J.W.; Cottom, D. Diagnosis and treatment of tyrosinosis. Arch. Dis. Child. 1968, 43, 540–547. [Google Scholar] [CrossRef]
- Matsumura, T. , et al., N-acetyl-l-tyrosine is an intrinsic triggering factor of mitohormesis in stressed animals. EMBO Rep, 2020. 21(5): p. e49211.
- Peng, G.; Tang, Y.; Cowan, T.M.; Zhao, H.; Scharfe, C. Timing of Newborn Blood Collection Alters Metabolic Disease Screening Performance. Front. Pediatr. 2021, 8. [Google Scholar] [CrossRef]
Figure 1.
N-acetyltyrosine structure and distribution among residual DBS clinical samples. Analysis of N-acetyltyrosine (NAT) in residual clinical samples was performed by flow injection analysis-tandem mass spectrometry. Figure 1A displays the structure of NAT and major product ion, along with the accurate M+H m/z, respectively. Figure 1B and 1C display boxplots of NAT concentrations in residual clinical specimens, where the solid black horizontal line denotes an NAT concentration of 20 µM. Data in Figure 1B were acquired using a triple quadrupole mass spectrometer, while data in Figure 1C were acquired using a high-resolution mass spectrometer. In Figure 1C, since the accurate m/z of NAT’s product ion was not present in any non-PN+ specimens, the data are NA instead of zero; which explains the absence of data in Figure 1C when compared to Figure 1B. PN+: neonates administered total parenteral nutrition; Normal: presumptive normals (n=120); PN+NegElv: PN+ with no elevated biomarkers (n=42); PN+PosElv: PN+ with one or more elevated biomarker (n=80); TYRSN1: neonate with tyrosinemia type I (TYRSN1, OMIM 276700, n=1).
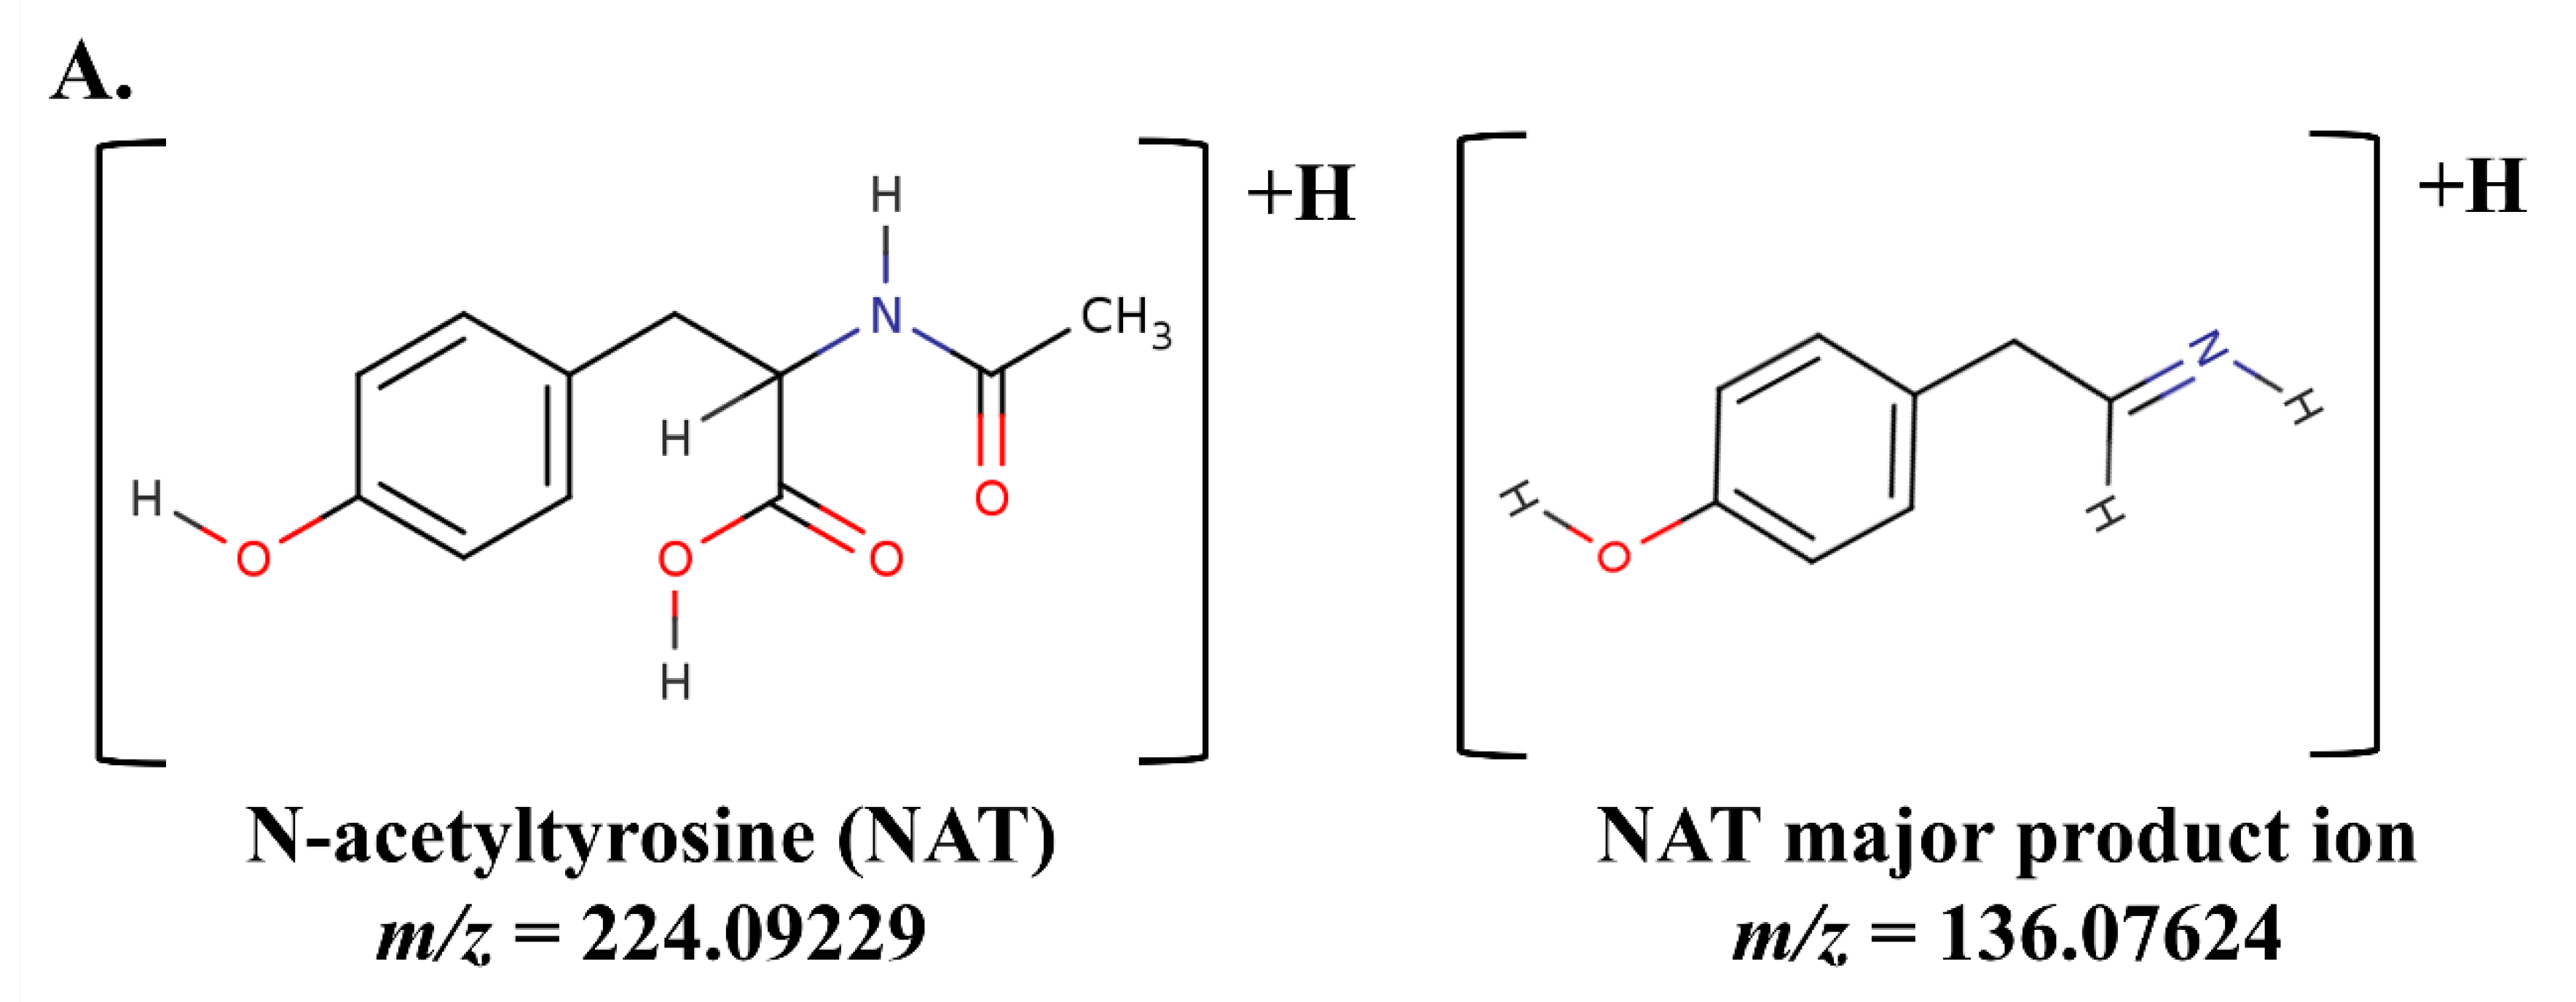
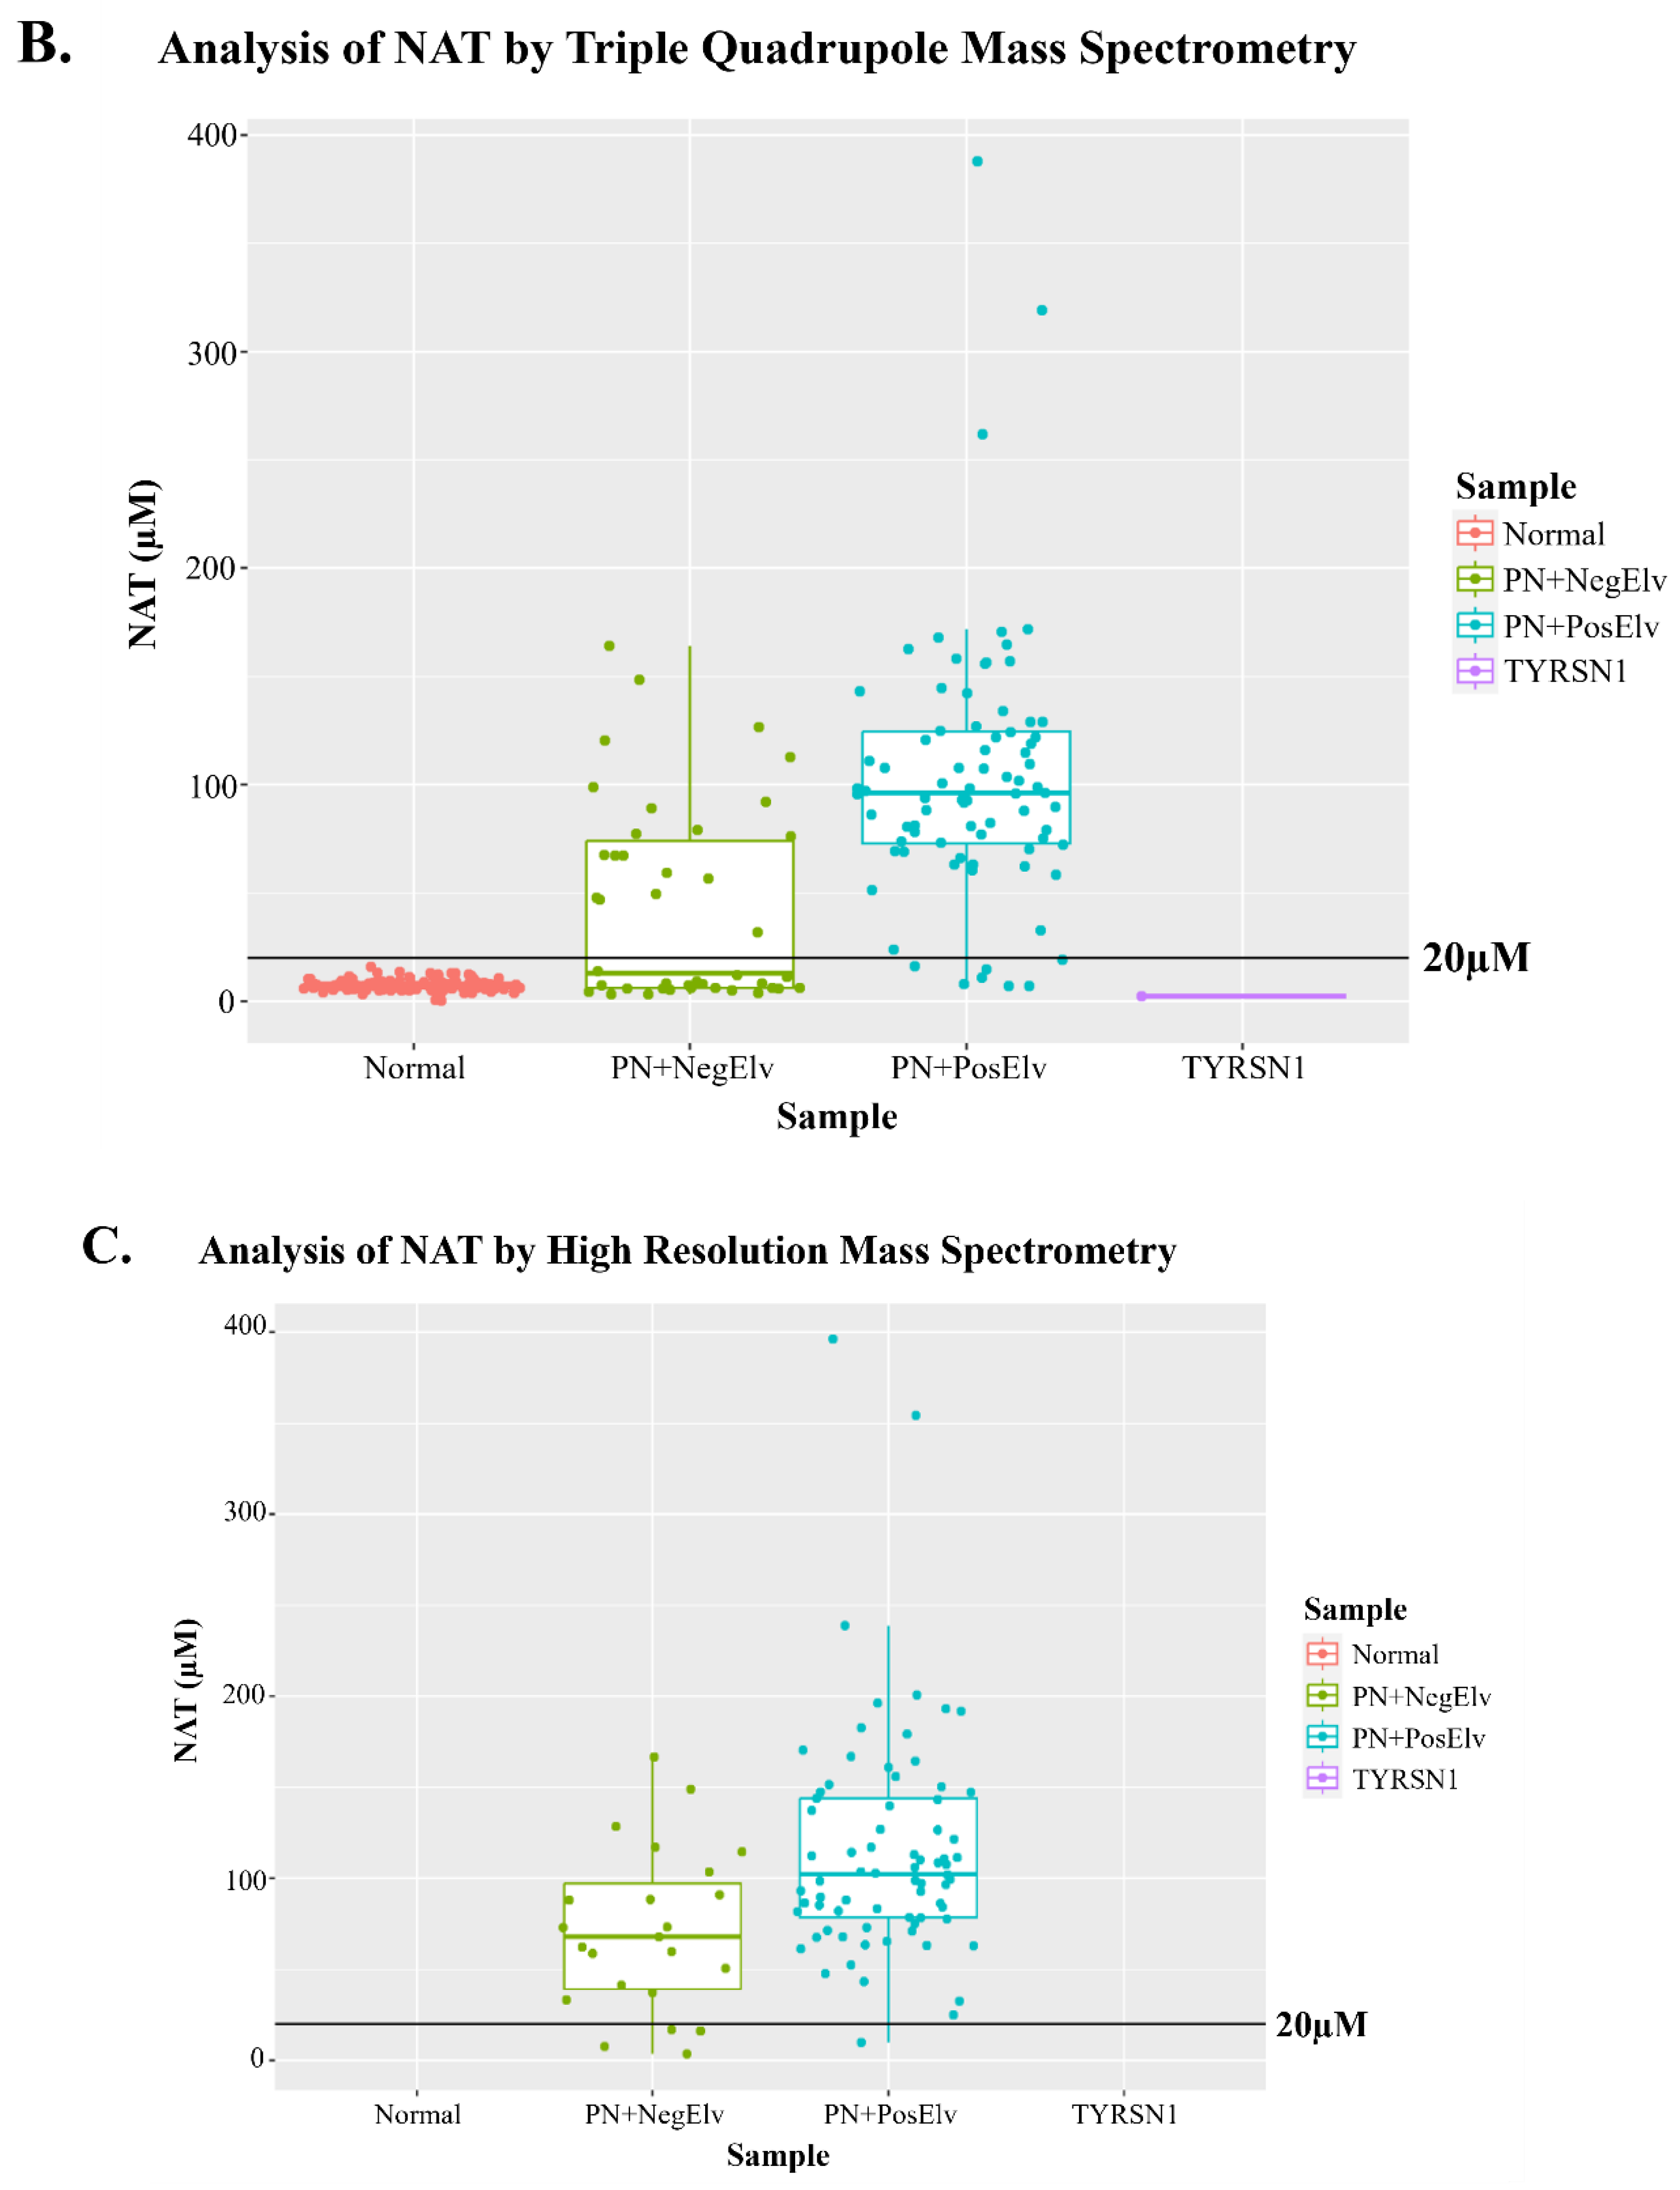
Figure 2.
Bubble correlogram of Spearman correlation coefficients of neonates administered parenteral nutrition. N-acetyltyrosine (NAT) concentration data were correlated with other biomarkers in the assay, using only data from neonates with reported parenteral nutrition administration (PN+, n=122). Spearman correlations were performed and coefficients were plotted using a bubble correlogram, where the size of the bubble and color denote the direction of correlation and proximity to 1 or -1. NAT was positively correlated with amino acids that are present in parenteral nutrition solutions. The acylcarnitine C5 was positively correlated with NAT, since C5 is documented to elevate in PN administered neonates.
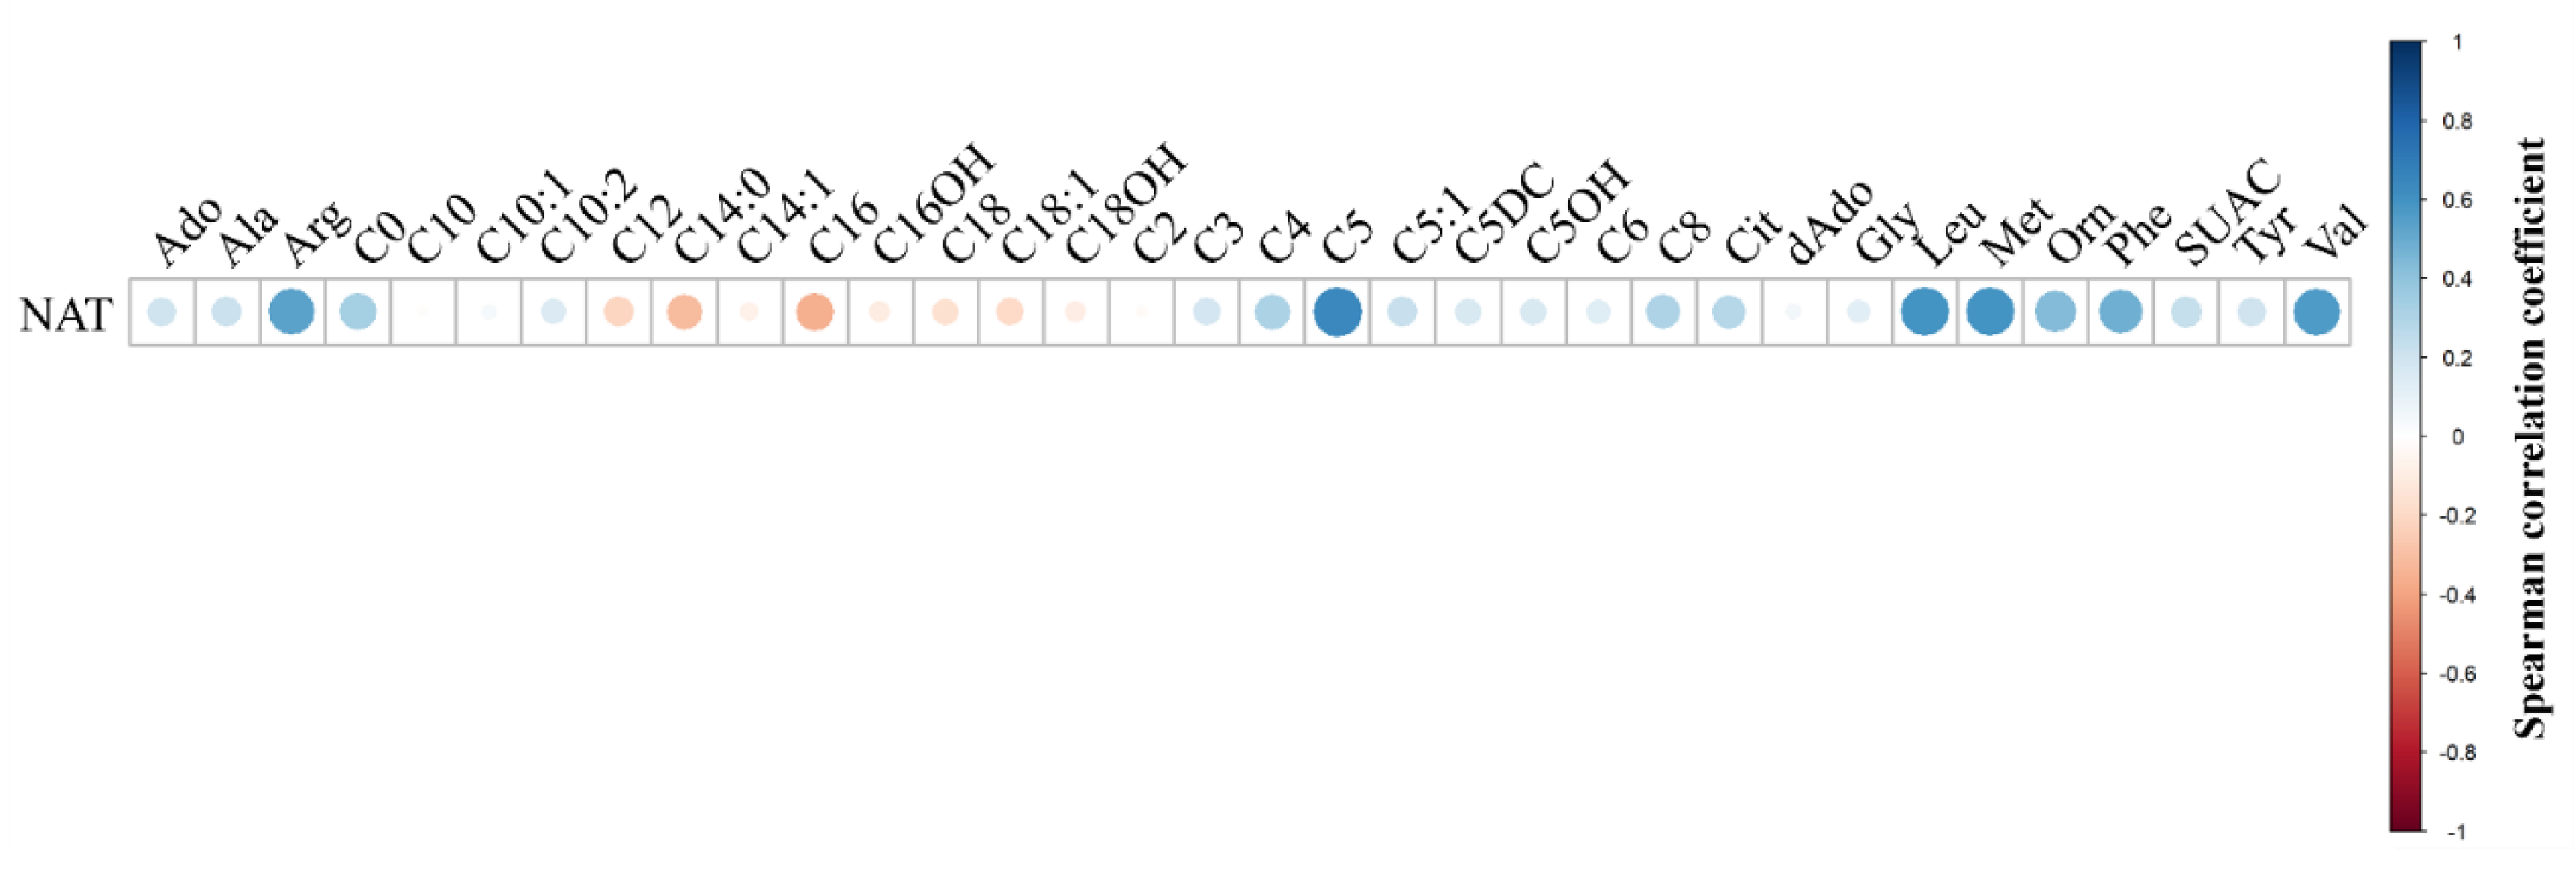
Figure 3.
N-acetyltyrosine bi-plots. Figure 3A and 3B display bi-plots of N-acetyltyrosine (NAT) with an amino acid. In each plot sample groups are denoted by color as outlined in each figure legend. The horizontal line corresponds to a NAT concentration of 20 µM. Figure 3A displays a bi-plot of NAT with phenylalanine, where the hashed vertical line represents 140 µM phenylalanine. Figure 3B displays a bi-plot of NAT with leucine, where the hashed vertical line represents 290 µM leucine. PN+: neonates administered total parenteral nutrition; Normal: presumptive normals (n=120); PN+NegElv: PN+ with no elevated biomarkers (n=42); PN+PosElv: PN+ with one or more elevated biomarker (n=80); TYRSN1: neonate with tyrosinemia type I (TYRSN1, OMIM 276700, n=1).
Figure 4.
Characteristics of dried blood spot materials containing N-acetyltyrosine for method validation. In order to validate the method containing N-acetyltyrosine (NAT) as a biomarker, NAT dried blood spot materials were created for method validation. NAT was linearly enriched into whole blood, then spotted onto dried blood spot cards. Figure 4A displays a bi-plot with measured NAT concentration on the y-axis and the enriched NAT concentration on the x-axis, with an overlayed regression line. The slope of the regression line was 0.77 with and R2 of 0.99. Figure 4B demonstrates that in these validation materials that NAT did not hydrolyze to tyrosine. The measured concentration of tyrosine is presented on the y-axis and the measured concentration of NAT on the x-axis, with an overlayed regression line. The slope of the regression line was 0.034 with an R2 of 0.08.
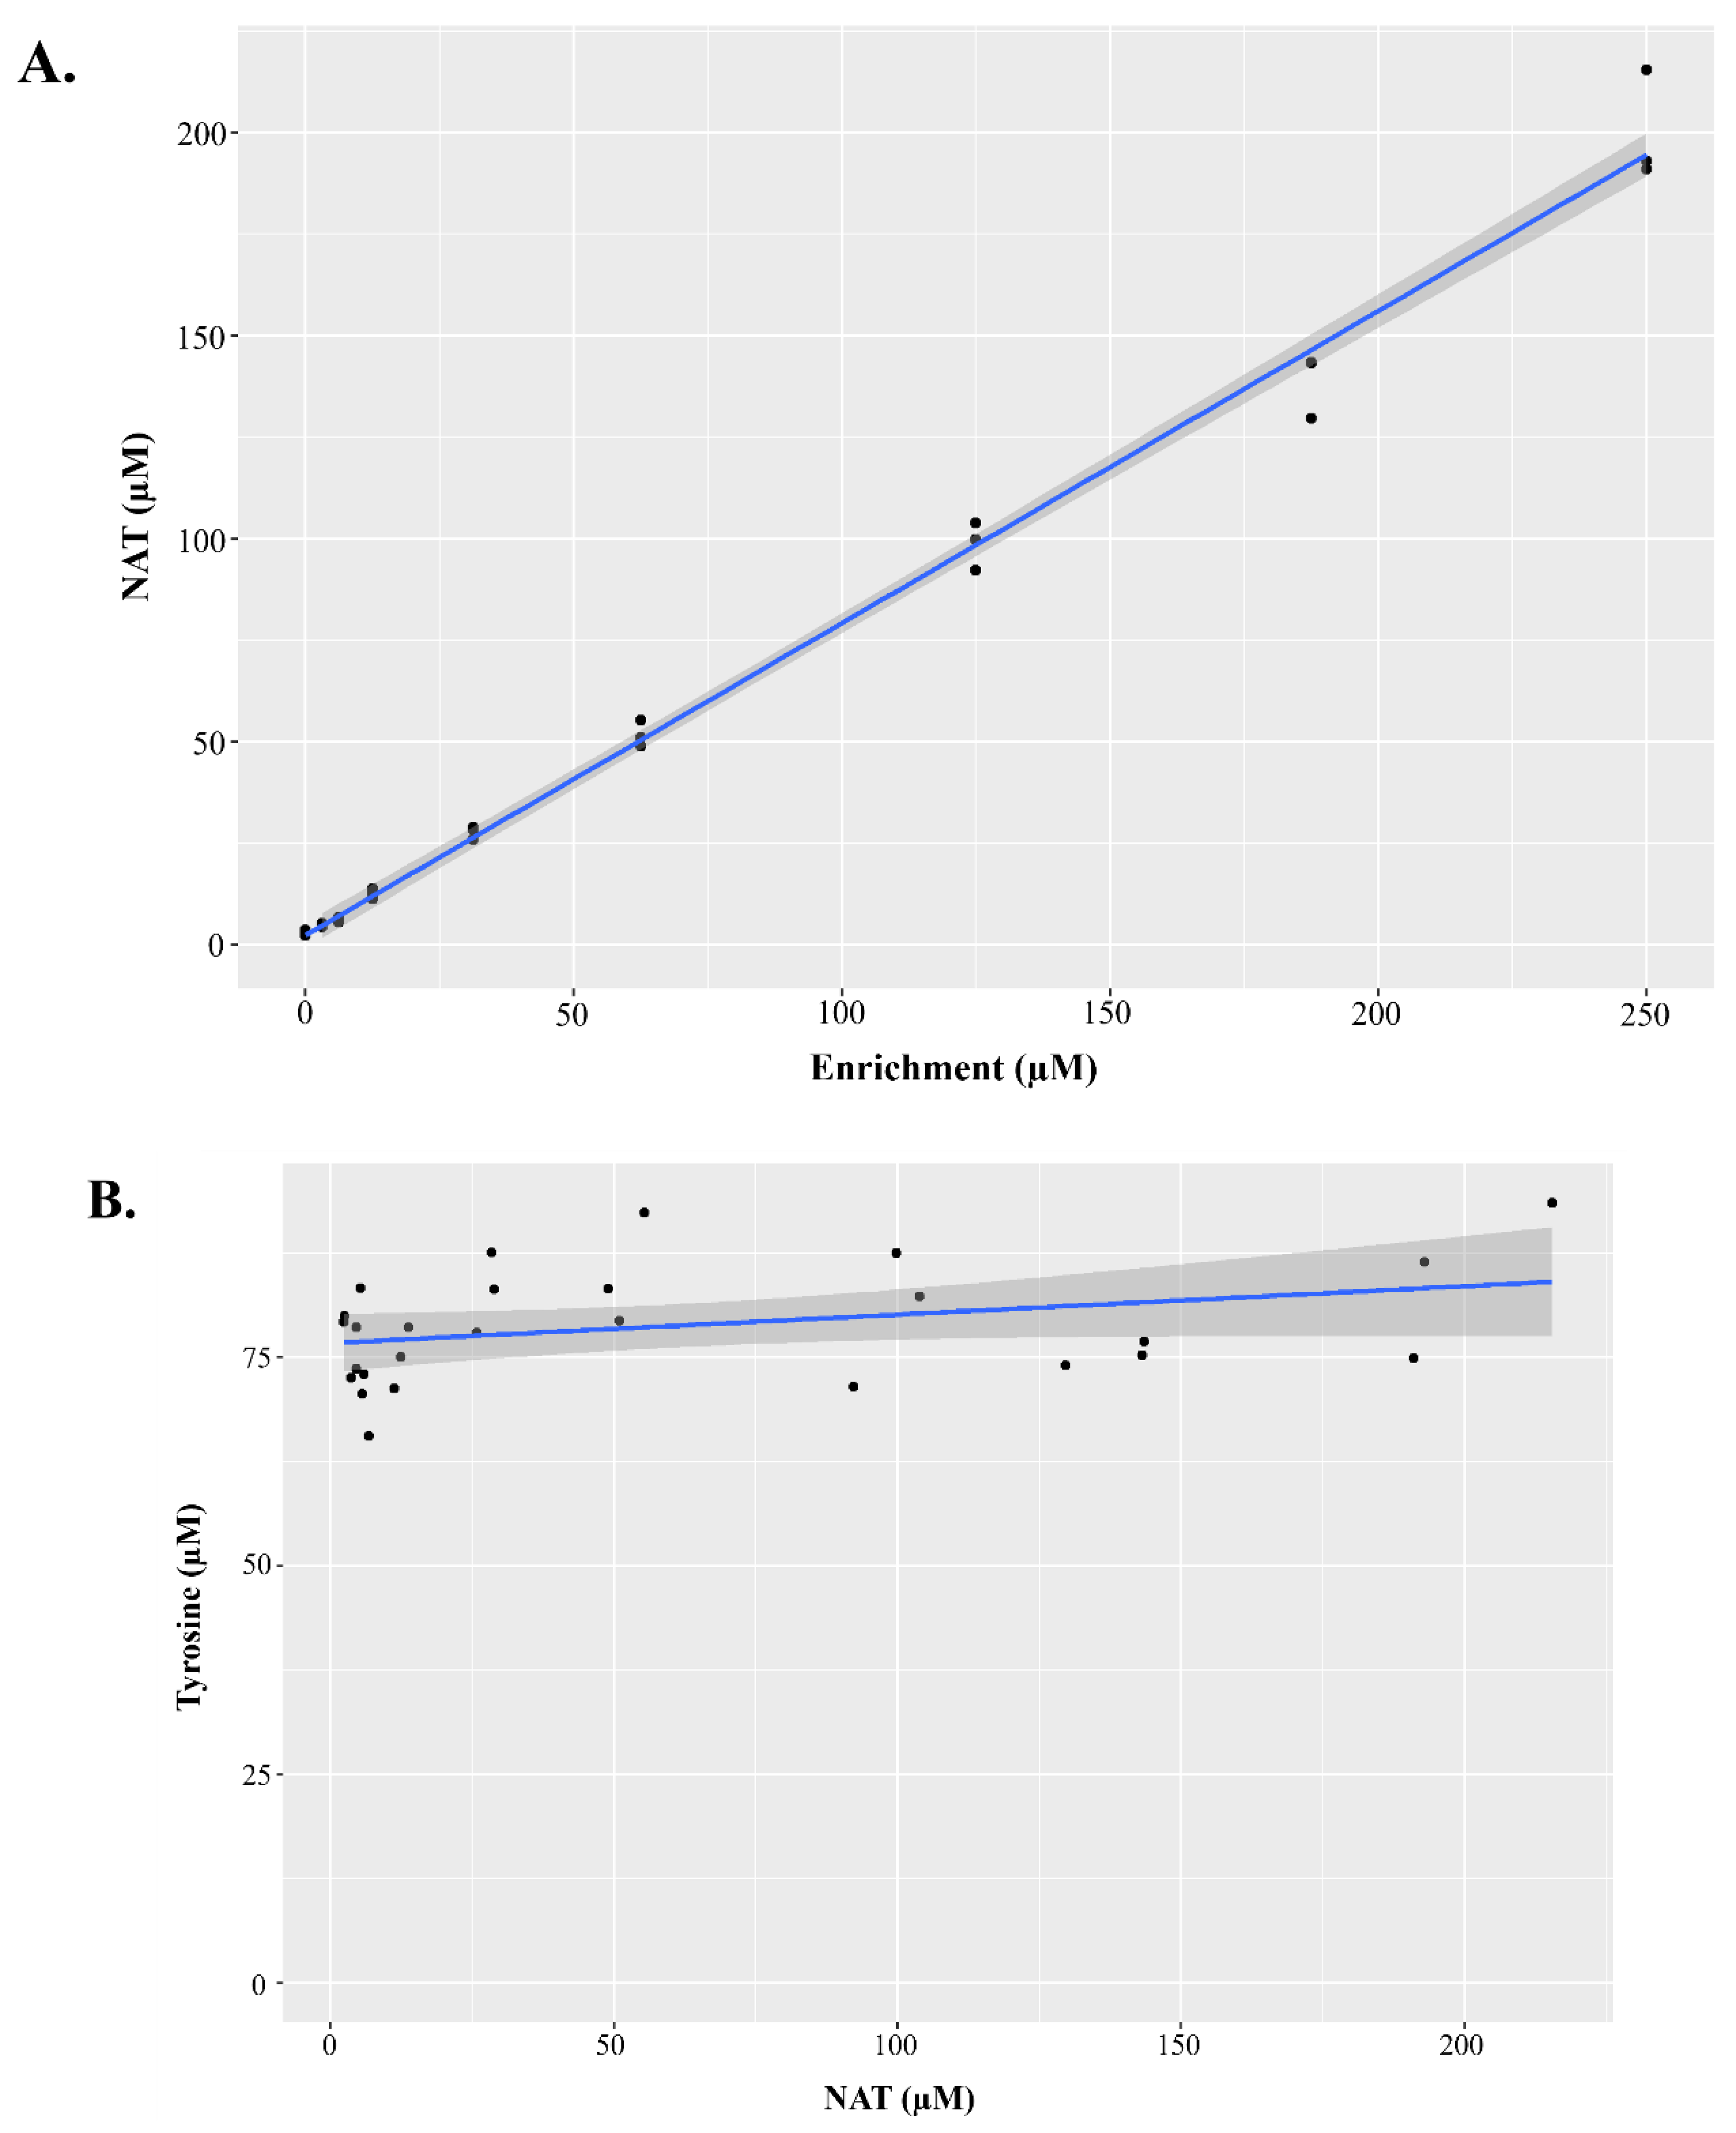
Figure 5.
Structure, transition, and concentration of the Amadori rearrangement production valine-hexose (Val-Hex). Figure 5A displays the structure of the Amadori rearrangement product (ARP) valine-hexose (Val-Hex), along with the M+H parent and product ion m/z presented as a transition. We hypothesized that ARPs would form since the parenteral nutrition administered would contain high dextrose and amino acids. Val-Hex was the most abundant ARP in our sample cohort. Figure 5B displays the Val-Hex, NAT, and several other amino acids for two PN+PosElv neonates. These two neonates had unusual amino acid profiles that appeared similar to an improper specimen collection (i.e., IV port collection instead of a heel prick collection). Val-2H8 was used as a surrogate internal standard for Val-Hex quantification. Val-Hex data were quantified by high-resolution mass spectrometry, while other biomarkers were analyzed by triple quadrupole mass spectrometry. Figure S3A-S3F highlights these two neonates in the histogram of each biomarker in Figure 5B. PN+PosElv: PN+ with one or more elevated biomarker; Leu: leucine; Met: methionine; NAT: N-acetyltyrosine; Phe: phenylalanine.
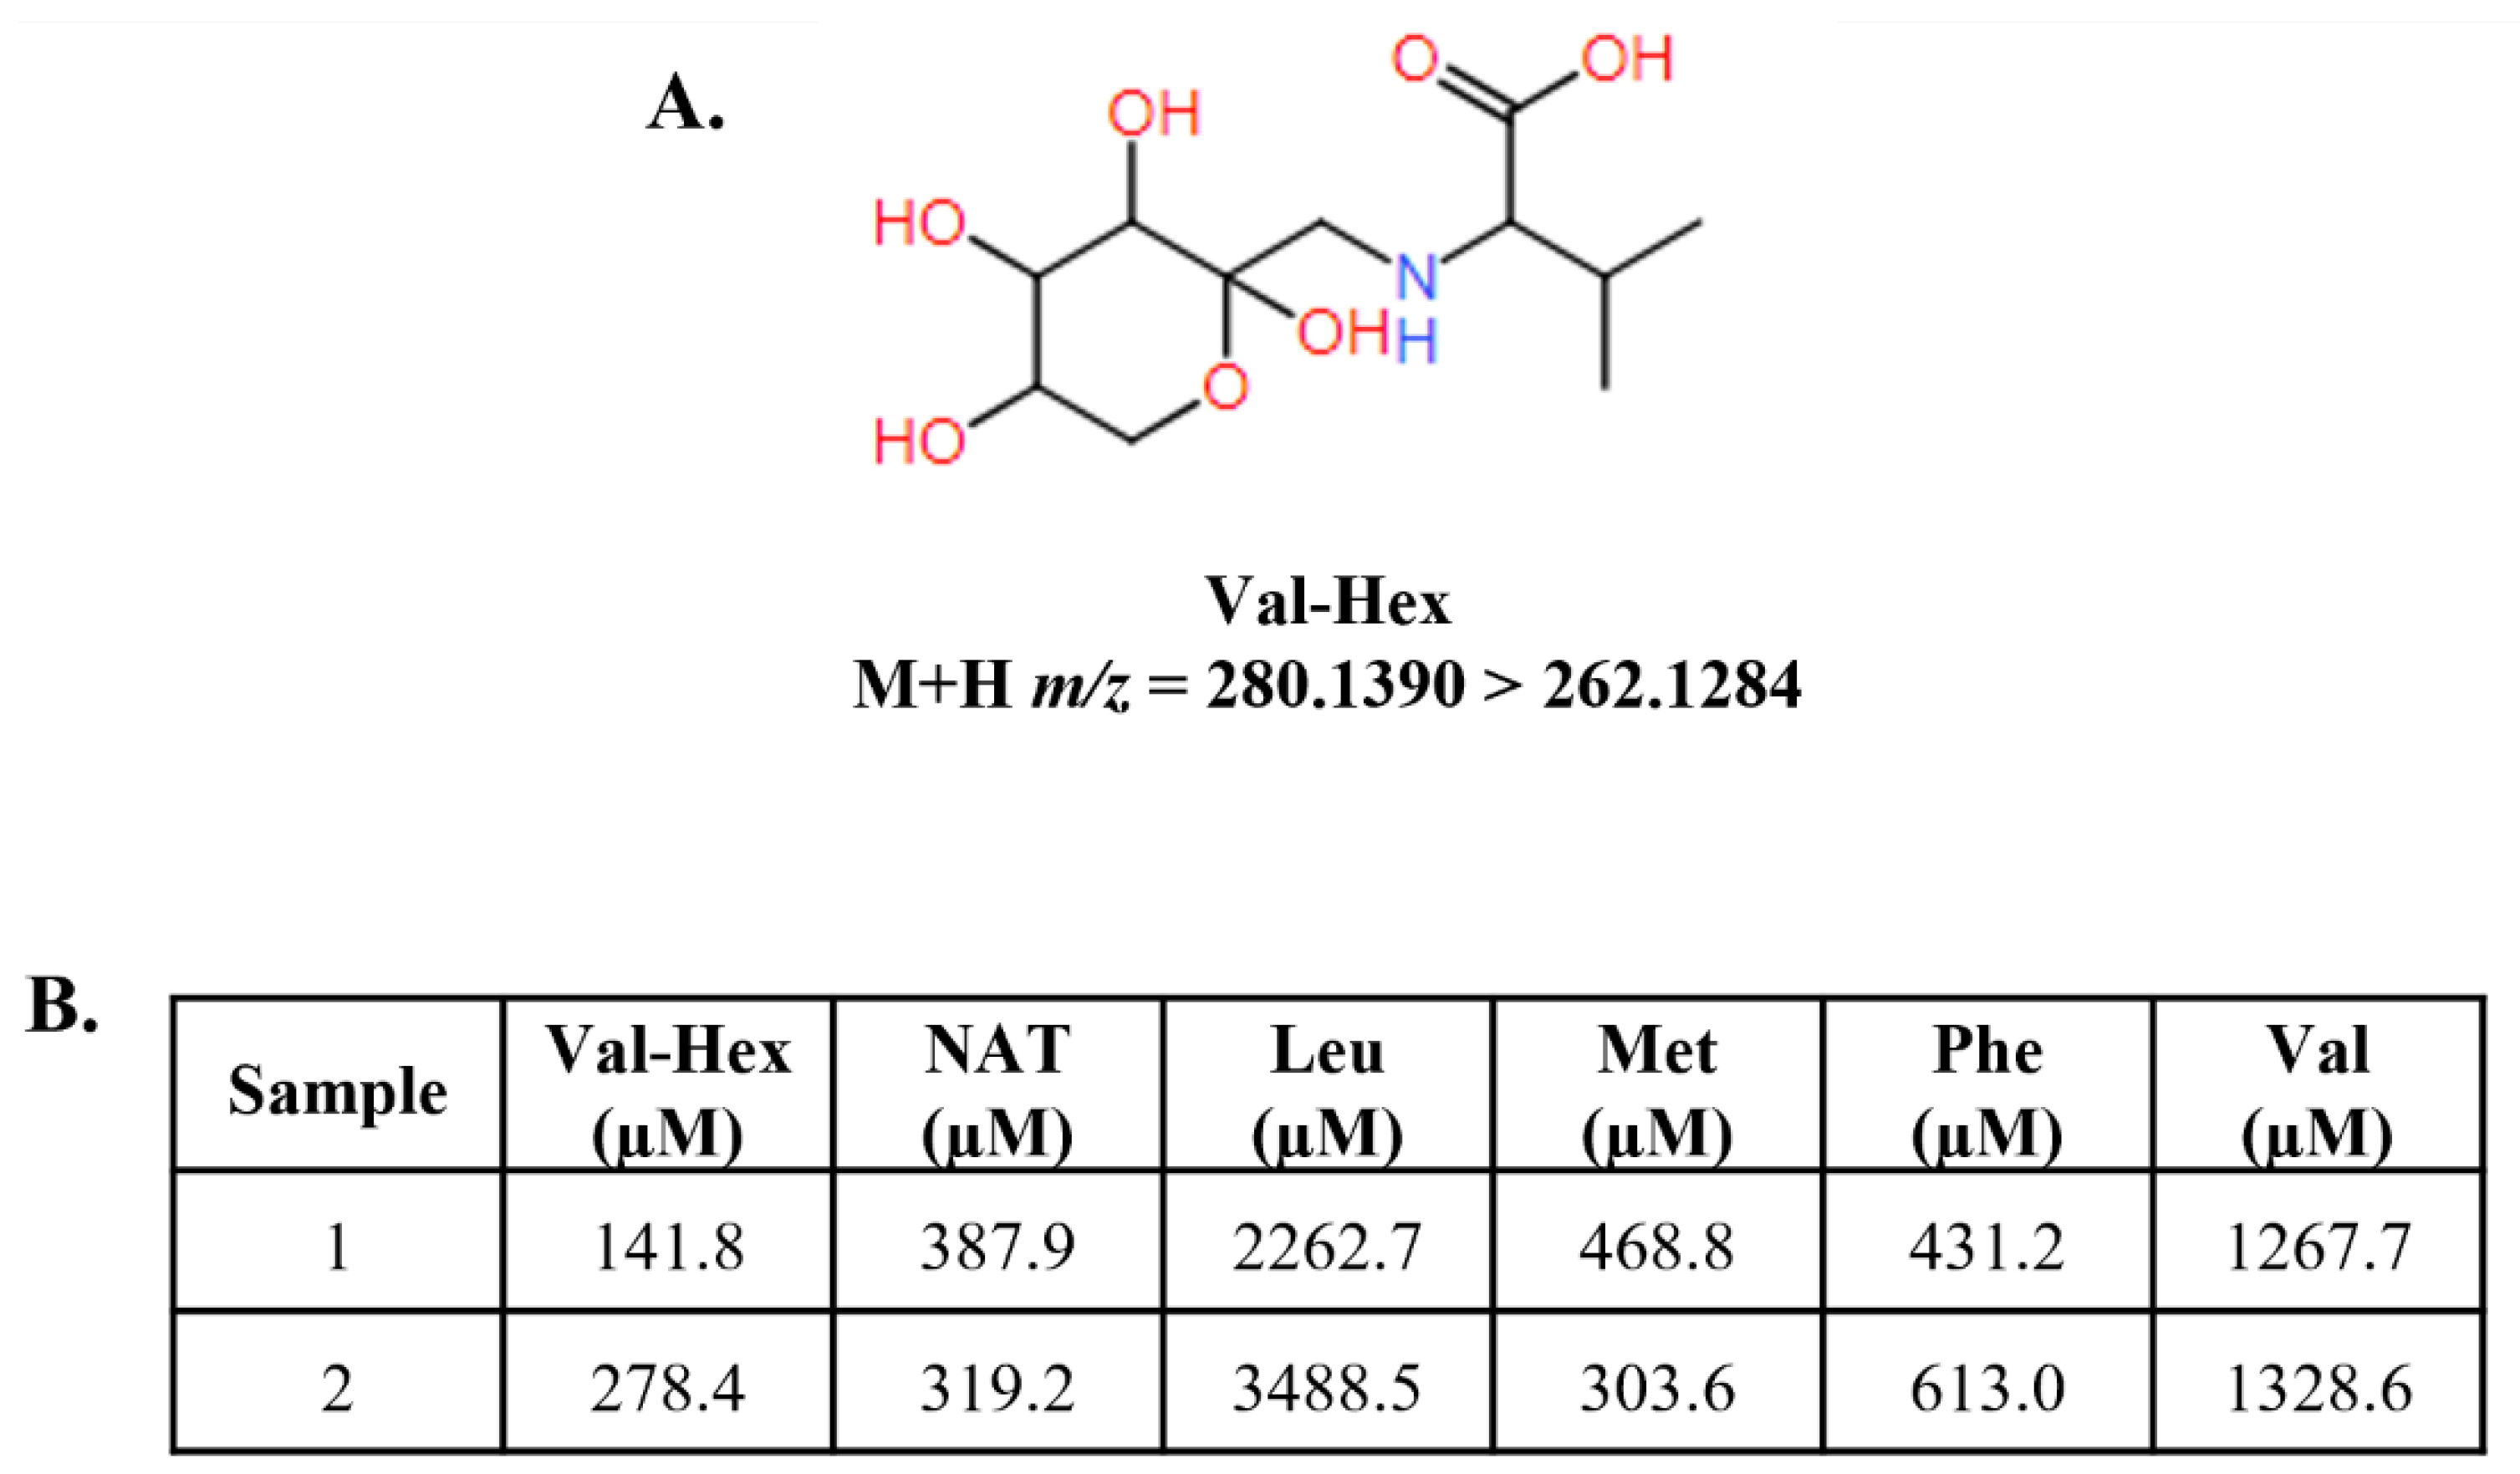

Table 1.
Table of precision ranges, linearity parameters, and estimated limits of detection and quantification.
Table 1.
Table of precision ranges, linearity parameters, and estimated limits of detection and quantification.
| Biomarker | Precision Range | R2 | Estimated LOD | Estimated LOQ |
|---|---|---|---|---|
| Alanine | [6.56 - 8.86] | 0.99 | 23.45 | 78.15 |
| Arginine | [13.71 - 15.32] | 0.99 | 1.56 | 5.18 |
| C0 | [6.23 - 8.47] | 0.99 | 2.39 | 7.98 |
| C2 | [6.69 - 9.17] | 0.99 | 3.16 | 10.53 |
| C3 | [6.62 - 8.87] | 0.99 | 0.27 | 0.89 |
| C3DC+C4OH | [7.62 - 10.15] | 0.99 | 0.06 | 0.2 |
| C4 | [6.39 - 9.8] | 0.99 | 0.04 | 0.12 |
| C5 | [5.97 - 8.47] | 0.99 | 0.07 | 0.22 |
| C5:1 | [6.87 - 10.62] | 0.99 | 0.04 | 0.12 |
| C5DC | [8.23 - 14.19] | 0.98 | 0.15 | 0.49 |
| C5OH | [6.3 - 8.42] | 0.99 | 0.25 | 0.85 |
| C6 | [7.39 - 9.17] | 0.99 | 0.05 | 0.18 |
| C8 | [8.24 - 9] | 0.99 | 0.31 | 1.02 |
| C10 | [7.52 - 13.59] | 0.99 | 0.13 | 0.44 |
| C10:1 | - | 0.99 | 0.07 | 0.25 |
| C10:2 | - | 0.99 | 0.07 | 0.23 |
| C12 | [7.06 - 9.68] | 0.99 | 0.13 | 0.42 |
| C14:0 | [6.31 - 8.56] | 0.99 | 0.1 | 0.34 |
| C14:1 | [6.02 - 8.14] | 0.99 | 0.1 | 0.33 |
| C16 | [6.86 - 8.62] | 0.99 | 0.37 | 1.23 |
| C16OH | [8.66 - 9.84] | 0.99 | 0.06 | 0.18 |
| C18:0 | [6.79 - 8.41] | 0.99 | 0.27 | 0.89 |
| C18:1 | - | 0.99 | 0.39 | 1.3 |
| C18OH | [14.51 - 15.34] | 0.99 | 0.09 | 0.31 |
| Citrulline | [12.84 - 13.52] | 0.99 | 14.95 | 49.83 |
| Creatine | [5.05 - 6.82] | 0.99 | 13.61 | 45.36 |
| Creatinine | [5.84 - 9.97] | 0.99 | 2.73 | 9.1 |
| Glycine | [6.83 - 8.86] | 0.99 | 26.78 | 89.25 |
| GUAC | [8.68 - 12.11] | 0.99 | 0.88 | 2.93 |
| Leucine | [5.87 - 7.51] | 0.99 | 4.61 | 15.35 |
| Methionine | [13.96 - 14.48] | 0.99 | 2.81 | 9.37 |
| NAT | [8.99 - 14.59] | 0.99 | 3.2* | 10.67* |
| Ornithine | [14.01 - 15.65] | 0.99 | 10.39 | 34.62 |
| Phenylalanine | [5.88 - 8.8] | 0.99 | 5.51 | 18.38 |
| SUAC | [7.95 - 12.02] | 0.99 | 0.25 | 0.85 |
| Tyrosine | [6.95 - 9.68] | 0.99 | 6.56 | 21.87 |
| Valine | [6.19 - 9.21] | 0.99 | 4.63 | 15.42 |
Precision data are presented as the [minimum to maximum] residual standard deviation, expressed as a percentage, calculated across three quality control dried blood spot pools. Precision was assessed by analyzing each of the three quality control pools in duplicate on twenty separate days. Linearity was assessed by analyzing dried blood spot linearity pools in triplicate on a single day. The R2 was calculated by regressing the measured concentration of each analyte on the expected value of each analyte. Limits of detection (LOD) and limits of quantification (LOQ) were estimated using the Taylor method Quality Assurance of Chemical Measurements. Taylor, JK (1987) Lewis Publishers, Chelsea, Michigan. Three dried blood spot pools from linearity materials were analyzed in triplicate on seven separate days. The standard deviation was regressed on the mean of these data to generate regression parameters. The LOD was calculated by multiplying the intercept (S0) by 3 and the LOQ was calculated by multiplying the intercept by 10. The asterisk (*) denotes that this biomarker had a negative intercept, and for this biomarker, the standard deviation of the lowest linearity pool was assumed as the intercept (S0) to estimate the LOD and LOQ as described above. Since the Taylor method is an estimation of LOD and LOQ, we calculated the signal-to-noise in the base QC pools for several analytes that have higher estimated LOD and LOQ (Table S5).
Disclaimer/Publisher’s Note: The statements, opinions and data contained in all publications are solely those of the individual author(s) and contributor(s) and not of MDPI and/or the editor(s). MDPI and/or the editor(s) disclaim responsibility for any injury to people or property resulting from any ideas, methods, instructions or products referred to in the content. |
© 2024 by the authors. Licensee MDPI, Basel, Switzerland. This article is an open access article distributed under the terms and conditions of the Creative Commons Attribution (CC BY) license (https://creativecommons.org/licenses/by/4.0/).
Copyright: This open access article is published under a Creative Commons CC BY 4.0 license, which permit the free download, distribution, and reuse, provided that the author and preprint are cited in any reuse.


