Submitted:
30 October 2024
Posted:
31 October 2024
Read the latest preprint version here
Abstract
Over the years, the construction sector has used traditional methodologies that often fail to meet established budgets and deadlines, making it imperative to adopt collaborative methodologies such as IPD and BIM. This research evaluates the influence of these methodologies in the design stage of residential buildings, through a case study in Peru managed by an SME. The methodology is divided into three parts: first, a diagnosis of traditional management is carried out through documentary review and semi-structured interviews; second, a proposal for improvement is proposed using tools based on BIM and IPD; third, the proposal is validated through statistical analysis and a validation matrix. Nine typical management problems were identified, such as deficiencies in plans, measurements and budgets, and delays due to inadequate planning. Eight optimization tools are suggested, such as the NEC4 ECC Collaborative Contract, ECD, Revit, Navisworks, early integration of the contractor, ICE Sessions, 3D, 4D and 5D BIM models. The 3D model showed 0.48 interferences per m², the 4D model allowed monitoring the progress of the project, and the 5D model allowed a cost optimization of 4.73%. The profitability analysis showed a return on investment of S/ 3.42 per “sol” invested. The validation of the optimization was demonstrated by the Z Test. The validation matrix highlighted the NEC4 ECC Collaborative Contract and the 3D BIM Model as the most effective tools. In this way, the study contributes to closing the knowledge gap regarding the implementation of BIM and IPD to optimize the management of residential buildings.
Keywords:
Residential Buildings
; Integrated Management
; BIM Methodology
; IPD Methodology & SME
; BIM
; IPD
; Infrastructure Management
1. Introduction
The construction industry has shown a weak performance compared to other industries, with only 5% of global projects being completed within the original budget and schedule [1]. Commonly used execution systems, such as Design-Bid-Build (DBB) and Design-Build (DB), present notable differences in performance. Research indicates that DBB projects typically experience delays equivalent to half of their original duration, while DB projects have shorter delays [2]. Furthermore, the lack of integration between project owners and project staff contributes to the failure of most projects in meeting the performance requirements [3].
Although contract documents should be complete and accurate, in practice they are often incompatible and incomplete, leading to the need for clarification during construction [4]. Project compatibilization is predominantly done in the traditional way by overlaying 2D CAD drawings [5].
The critical global situation in the construction industry is not isolated from the Peruvian reality [6]. According to the Report of Paralyzed Projects, published by The Peruvian Republic's General Comptroller [7], it is revealed that 1,746 projects have been paralyzed in the country. Deficiency in the design of technical files is one of the main causes [8]. The Southern Macro Region, which includes Arequipa, Apurímac, Puno, Moquegua, Cusco and Tacna, has the largest concentration of paralyzed projects, with a total of 746 projects. According to Acero [9], there are many paralyzed projects in Tacna; such is the case of the Hipólito Unanue hospital, which had its contract signed in December 2015 with the Consorcio Salud Tacna for a total of S/279'291,101, with the expected completion of the work scheduled for 2019. However, to date, the infrastructure is paralyzed at an execution progress of 45.9% and its budget has increased to S/. 598'431,044.
Thus, it is evident that there is a global problem which includes Peru. This research addresses such issue considering the management and integration of projects in Peru. Sullivan, et al. [10] point out that the success of a construction project depends largely on the selection of the execution system. Since the design phase of a DBB project is completely independent of the construction phase, this results in significant efforts during the construction phase to resolve constructability issues and coordination requirements that were overlooked during the design phase [11]. These problems can be avoided with a more integrated approach in which all project stakeholders communicate and collaborate to develop a better design [12].
The Integrated Project Delivery (IPD) is one of the recent and rapidly implemented approaches that incorporates people, systems, commercial structures and actions into one single process, bringing together talents and vision of all project participants to increase the value delivered to the customer, reduce waste and enhance efficiency, thereby promoting the success of the entire project [13,14,15]. Likewise, Building Information Modelling (BIM) represents the digital transformation of the construction industry. Value is created based on the use of 3D models in a collaborative manner, which means more efficient methods to design, create and maintain assets; it also supports decision making and information management [16].
Murguía [17] points out that, there is currently an increasing acceptance of BIM among construction professionals in Peru. However, despite the great willingness to use BIM, the actual usage behavior still shows a significant knowledge gap, suggesting that there are still challenges to fully implement BIM in practice. The Peruvian Ministry of Economy and Finance (MEF) [18] by means of Directorial Resolution No. 0002-2021-EF/63.01 approved the Implementation Plan and Roadmap of the BIM Peru Plan, as well as the National Competitiveness and Productivity Plan 2019-2030, approved by Supreme Decree No. 237-2019-EF, which establishes the “Policy Measure 1.2: BIM Plan”, with the main objective of progressively incorporating the collaborative methodology of digital information modeling for construction in the public sector
Given the above, this research proposes the following hypothesis: through the implementation of BIM and IPD methodologies, it will be possible to optimize the design stage in residential building projects. IPD and BIM are both considered as independent variables, and the Design Stage in Management as the dependent variable. The objective of the research is to evaluate how BIM and IPD methodologies, in an integrated manner, will optimize the design stage in residential building projects. Therefore, the study is based on literature reviews throughout Section 2, followed by Section 3, which discusses the developed methodology in a Peruvian case study, results are presented in Section 4, continued by their discussion in Section 5 and finally Section 6 includes the conclusions.
2. Background
This section addresses a review of the most relevant research regarding IPD and BIM methodologies, which both have proven to be useful for construction projects. Table 1 summarizes the literature consulted in indexed journals about IPD and BIM.
Table 1 presents a detailed review of the literature, highlighting the limitations of traditional project management methodologies and the importance of adopting more efficient methodologies. Among these methodologies, IPD stands out for its fundamental principles: (1) early involvement of key participants to achieve early optimizations, (2) shared risks and benefits according to project results to motivate improvements, (3) joint project governance to empower the team, (4) reduced blaming exposure to encourage the development of new ideas and (5) jointly developed and validated goals to engage the team.
Research such as those of Franz, Leicht, Molenaar and Messner [19], Buk'hail and Al-Sabah [2] y Ling, Teo, Li, Zhang and Ma [21] have shown that IPD significantly improves cost, schedule, quality, and project performance results. Laurent and Leicht [20] emphasize the importance of forming these teams from the earliest design phases to ensure project success. In this context, NEC4 ECC contracts are aligned with IPD principles and their importance for good management has been pointed out by Ajmal and Rajasekaran [25].
The other relevant methodology is BIM, which emerges as a key tool of the IPD. BIM interoperability with other digital tools is critical for more accurate and efficient management. According to Bravo and Mendoza [28], Maciel, de Souza and Oliveira [5] & Khanna, Elghaish, McIlwaine and Brooks [15], BIM improves planning, estimation and cost control, and facilitates early identification of interferences and incompatibilities in drawings, thus optimizing the budget.
Reviewed studies, including those of Alinezhad et al. [24], Khanna, Elghaish, McIlwaine and Brooks [15] & Bravo and Mendoza [28], conclude that the implementation of IPD and BIM offers significant benefits such as transparency, effective coordination, early cost awareness, reliable pricing and improved quality.. Tools for modeling and measurement, such as Revit, and Navisworks for resolving interferences, automate tasks, save time and reduce costs, improving budgetary accuracy.
Despite the obvious benefits, the construction industry faces significant challenges in implementing IPD and BIM. Buk'hail and Al-Sabah [2] identify barriers such as unwillingness to sign contracts that included liability waivers and that excluded IPD's organizational hierarchical structure. Othman and Youssef [22] highlight the existence of communication and collaboration issues among stakeholders. Khanna, Elghaish, McIlwaine and Brooks [15] point out the resistance to change and lack of experience as main obstacles for change. Yañez [16] determines that not all professionals have the same level of knowledge about BIM, that design is not done directly in 3D and that supervision does not yet have a direct involvement in BIM. To overcome these challenges and maximize the use of these methodologies, it is essential to examine their application in projects.
Thus, this research focuses on implementing BIM and IPD methodologies in the design stage of a residential building project in order to achieve management optimization, which underlines the relevance and potential of this research as a proposal in this field.
3. Materials and Methods
The methodology of the present study is based on the analysis of a single case study using a mixed approach which combines qualitative and quantitative methods. From a qualitative perspective, contract management is reviewed by comparing the case study contract with the objectives of the NEC4 ECC, which allows us to identify shortcomings of the traditional model compared to the international standardized model. In addition, an analysis of information management is carried out through a bibliographic review, which facilitates the formulation of improvement proposals and tools to address the deficiencies detected. From a quantitative approach, specific units such as interferences, metrics and costs are measured (126 items analyzed).
This research is of an applied nature, since it seeks to obtain new knowledge to offer practical solutions to specific problems. The study design is non-experimental, the level of research is correlational, as it describes the relationship between variables, and it is also classified as cross-sectional, given that the study is carried out at a specific time.
IPD, BIM and management optimization at the design stage are the three most relevant variables. Management at the design stage, which depends on IPD and BIM, is the dependent variable, while IPD and BIM, which do not depend on other variables, are both independent variables. Table 2 details the methods to be applied in accordance with the specific objectives of the study, which are based on the literature review presented in the previous chapter.
According to Table 2, the design stage is optimized by integrating IPD and BIM in a specific case study. Initially, a diagnosis of the Small and Medium-sized Enterprise (SME), which manages projects in a traditional manner, is carried out. Then, an improvement is proposed by integrating IPD and BIM into an SME project, with the objective of adapting this proposal to other similar projects within the same SME and to other SME with similar characteristics. To evaluate for optimization with BIM, statistical indicators are used, such as interference indicators per square meter, comparison of the variability in the metering of the traditional methodology versus the BIM methodology, and the probable cost of the project is quantified and validated by Z-tests. The cost-effectiveness of BIM and IPD methodologies is also analyzed.
4. Results
4.1. Diagnosis
4.1.1. SME Description
The SME is a construction company located in Tacna, Peru, specialized in residential building projects, with the mission of providing the population of the city with access to proper housing, and with the vision of creating adequate living spaces in collaboration with the government through the use of bonds destined for this purpose. Currently, the SME has completed the delivery of eleven projects, while four others are under implementation and three are pending. The management of its projects follows a traditional approach which comprises several stages. Initially, the planning and basic studies stage is carried out, followed by the preparation of the preliminary project, after which the basic design and construction design are developed. Simultaneously, the corresponding permits are processed with the corresponding public entities. Subsequently, the measurements, construction budget and schedule are prepared. With all this documentation, the financing is processed with the financial institution.
Once these stages are completed, the contract is formalized with the contractor, with the SME assuming 64% of the work and the contractor 36%. A traditional contract is used to establish the contract amount, terms, penalties, methods of payment, project manager and annexes that include blueprints, technical specifications, descriptive report, measurements, construction budget and schedule. Upon completion of that stage, execution of the work begins, the progress of which is monitored by means of monthly valorization reports until the project is completed.
The SME's main resources include both human and material resources. The company has a staff of 10 employees, while the contractor has 13 employees. In addition, they rely on the collaboration of 10 service providers to carry out operations efficiently. SME's organization chart is composed of the General Management, Deputy General Management, Administration and Finance (accounting, logistics and treasury), and the Technical Area (architecture and engineering: projects and project manager).
In terms of material resources, the SME has 7 computers, 2 laptops, 1 plotter and 3 printers. All workstations operate with the Windows 10 operating system. The software applications used include AutoCAD, Microsoft Excel, SketchUp, Lumion and Microsoft Word. Regarding information management, data and document management is mainly done manually and through Google Drive, where all project documentation is stored and shared with each area of the SME. Communication is carried out through WhatsApp groups, temporary meetings and phone calls.
4.1.2. Description of the case study
The management system in the SME proves to be inefficient, as it affected the profitability and delivery time of certain projects. These are detailed in Figure 1 and Figure 2.
Figure 1 shows the comparison between the contract amount and the executed amount of four SME projects. The variation margin between these amounts ranges from -3.45% to -5.13%, with Project D having the largest margin. These results are consistent with the findings of Asvadurov, Varilla, Brindado, Brown, Knox and Ellis [1], who reported cost overruns of up to 37% in global projects.
Figure 2 presents the comparison between the contractual schedule and the executed schedule for the same four projects. The percentage of variation in schedule varies between -26.29% and -39.67%, with Project D showing the largest gap. These findings are consistent with those reported by Asvadurov, Varilla, Brindado, Brown, Knox and Ellis [1], who found gaps of up to 53% in global projects.
Based on the indicators presented, Project D was chosen as the case study. This project is a residential building in Tacna, Peru, of 5 levels plus rooftop, with a 128 m² lot and a roofed area of 617.87 m². The first level includes 2 garages, 1 storage room, 1 solid waste room, 1 staircase and 1 apartment. Second, third, fourth and fifth levels have a typical layout with 1 staircase and 2 apartments. The roof terrace consists of 1 rooftop terrace and 1 area for drying clothes. The structure is framed with confined masonry. The sanitary installations include a pumping system, cold water distribution and drainage networks. The electrical installations include independent single-phase current for each apartment and data and communications outlets. Project development was carried out in the traditional manner and under a traditional contract. The programmed budget was S/. 834,376.79, while the executed budget reached S/. 877,180.32. The programmed deadline was 305 days, and the final execution deadline was 426 days.
4.1.2. Typical management problems
Following the analysis of the SME documentation and the case study, 11 interviews were conducted with different project participants including contractors, professionals from different specialties, labor personnel and suppliers. The following question was formulated to them: What do you consider to be the main reasons for cost overruns and delays in the SME projects? Based on all this information, the following management problems were identified:
- P1: Deficiencies in the blueprints.
- P2: Deficiencies in the measurement and budget.
- P3: Weak team communication, coordination, and collaboration.
- P4: Modifications and/or reworks.
- P5: Existence of hidden flaws that generate additional work.
- P6: Cost overruns in the construction process.
- P7: Delays due to poor planning in material supply and errors in material purchasing.
- P8: Lack of clarity and transparency in the contract and its clauses.
- P9: Lack of incentives for good practices.
It is evident that most of the identified problems could have been avoided during the design stage. Therefore, we will focus on solving these problems by incorporating tools from the BIM and IPD methodologies.
4.2. Optimization Proposals
With the purpose of addressing the problems identified in the diagnosis, the tools of both BIM and IPD methodologies, which were compiled through a detailed bibliographic review in Section 2, are presented below. It should be mentioned that these tools allow for better project management and can be integrated into a working model that includes BIM and IPD.
4.2.1. H1: Contractual Management – Standardized Contract
To develop an optimal project, it is crucial to have clear and well-defined contracts. This tool is related to the 1D dimension of BIM, as well as to aspects of project conception under IPD standards.
Based on the criteria of Yabar-Ardiles, Sanchez-Carigga, Vigil, Málaga and Zevallos [26], Table 3 is elaborated to identify the deficiencies in the case study contract, using the incentives and tools recommended by NEC4 ECC as a reference. (New Engineering Contract - Engineering and Construction Contract).
Table 3 presents the shortcomings of the traditional contract in the case study in terms of clarity and stimulus for good management. Some clauses contain insufficient information, which can lead to disputes, and there is no adequate risk distribution. These problems coincide with the key aspects that NEC4 considers essential for good management. It is therefore recommended to implement NEC4 ECC clauses to address these deficiencies, supported by studies such as the Managing Reality compendium [33] and Yabar-Ardiles, Sanchez-Carigga, Vigil, Málaga and Zevallos [26], which also suggest their use to foster collaborative environments. The following clauses are suggested below.
- Communication (X13).
Establishes a written communication system with defined response times for notifications such as early warnings, inconsistencies among others. Each party maintains its own record to facilitate problem prevention and resolution.
- Early Warnings (X15).
Allows any party to notify events that may affect the price, schedule or execution of the project. Notification should be made as soon as the event becomes known, so that meetings are held to manage changes efficiently and failure to do so may result in penalties.
- Compensation Events (Core Clause 6).
Covers situations where the contractor is entitled to compensation, as long as the problem is not attributable to the contractor. The contractor must submit to the Project Manager the corresponding solution and quotation for the Compensation Event. The Manager will evaluate this proposal and, if necessary, instruct the contractor to consider more efficient alternatives. Timely notifications of these events are essential to avoid penalties and to promote a collaborative resolution of the problems.
- Incentives.
Clause X12 promotes multi-party collaboration and rewards compliance or improvement of key performance indicators (KPIs). X20 establishes incentives for the contractor based on KPIs defined by the counterparty. X6 provides incentives for early completion of works. Main Options C and D, which operate under a Target Price Contract, compare the final price of the works with a target price set in the contract. If there is a positive balance in this comparison, it is distributed between the parties as agreed.
- Dispute Avoidance Board (W3).
Offers dispute mitigation and resolution options, with it as the first method. This board visits the project site, inspects the work, offers recommendations and resolves disputes before they are formally referred to a court of law.
4.2.2. H2: Common Data Environment (CDE)
Communications are fundamental to establish collaborative environments. In the case study, Drive, WhatsApp and emails were used; however, with the implementation of BIM models, there is a need to improve this aspect. The Common Data Environment (CDE) is the leading platform for document, quality and project information management. It aims to streamline model reviews, facilitate change management, improve communication and foster collaboration, as well as ensure information security and prevent document duplication. It is crucial that the CDE is available to all stakeholders, with clearly defined roles and access levels.
In this context, it is recommended Trimble Connect, a cloud-based platform that meets these requirements and organizes all project documentation, 3D models, 2D drawings, PDF files, spreadsheets and RFIs, in a single accessible location. This eliminates the need to compress and email files, ensuring that all team members work with the latest version of documents and models. This reduces errors, ensures transparency, accessibility and traceability of project information, improving collaboration by allowing an overview and specific details. In addition, all movements are registered, which facilitates the control of changes and updates.
Trimble Connect Sync allows you to synchronize files from your computer, network drive or mobile device to the cloud, keeping everything up to date in both locations. The To-Do tool improves task management and project communication by allowing comments, questions and concerns to be documented and assigned to team members, who receive email notifications. Tasks are customized with titles, descriptions, due dates and other relevant information, which can be linked to specific objects in the model reviewed by all participants. Trimble Connect offers a free version with 10 GB of cloud storage; for more capacity, professional licenses must be purchased.
4.2.3. H3: Software
The efficiency of project development depends to a large extent on the technical capabilities of the software used. In the case study, a traditional AutoCAD approach was used for documentation development, so it is essential to have adequate resources to ensure a trouble-free development. There are several key software categories in this process, such as modeling, coordination, measurement and budgeting, scheduling and visualization. Tools such as Revit and Navisworks are prominent examples in the construction field.
Revit is the leading platform for building BIM information models. Its ability to automatically coordinate project changes and share a database of files among multiple users makes it indispensable.
On the other hand, Navisworks stands out as a BIM model viewer that covers all phases of the project. It facilitates the interoperability of 3D models during design and construction, improving visualization and interference detection. Its ability to read almost any 3D file format and handle large files makes it a crucial tool for project management.
4.2.4. H4: Work Teams
In projects, it is essential that teams have complementary skills, share a common purpose, pursue performance objectives and are mutually accountable for the end result. In the case study, the work team during the design stage did not include the contractor up until the execution of the work, which is a practice that could be improved. It is recommended that the team consists of, at a minimum, the owner or a representative, an architect or engineer, a designer, and a general contractor or project manager. Early inclusion of the contractor facilitates the incorporation of diverse perspectives, optimizes deliverables, and reduces the need for later modifications.
Likewise, it is necessary to have trained professionals with experience in BIM and IPD methodologies software. To ensure effective management of these methodologies, an adequate budget should be allocated for the continuous training of these professionals.
4.2.5. H5: ICE Sessions
The Integrated Concurrent Engineering (ICE) sessions are fundamental to successful project development. In the case study, they were limited to temporary meetings, indicating the need to improve this approach. It is recommended that ICE Sessions be held face-to-face in a suitable space, equipped with chairs, projectors, large tables, electrical connectors, lighting and ventilation control, and a whiteboard. This environment should encourage active participation and use the best technological tools available to ensure transparency and trust among participants.
ICE sessions should be held at least once a week, with the active participation of all those involved in the project. During the design phase, the frequency can be increased to twice a week or even daily, depending on the size of the project. These meetings allow the integration of all project specialties and improve the overall understanding, thus optimizing the design procedures.
Clear agendas should be established to align the team with the project objectives. Agendas should be shared in advance with everyone involved to allow for brainstorming solutions in case problems arise. Pre-sessions help to reduce latency times and to make faster decisions.
4.2.6. H6: 3D Model
The three-dimensional representation of the drawings, together with the parametric representation of each building component, forms the 3D Model. In the case study, a traditional approach with 2D drawings was used; therefore, it is recommended to implement 3D Models to improve visualization, coordination, project presentation, design review and incompatibility detection, thus optimizing planning and productivity control. The development of the 3D models is performed as follows.
- Structural Modeling.
In the Revit structural template, the structural CAD drawing is linked. Levels are created 5 centimeters below the finished floor level, ensuring that the structural elements are always below the finishes when integrated with the architectural model. Thus, beams, columns, slabs and slabs were modeled according to the plan dimensions. The modeling was completed in 20 days.
The modeling of concrete and steel structures (Figure 3) was accurate in quantity, size, shape and location, making it a Level of Development (LOD) 400.
- Architectural Modeling.
In the Revit architectural template, the architectural CAD drawing and the structural model are linked, creating reference levels per floor. Each element is modeled with its respective layer finishing at the appropriate level, following the design of the CAD drawings. The modeling was completed in 15 days.
The architectural modeling (Figure 4) was carried out accurately in quantity, size, shape and location making it a Level of Development (LOD) 400.
- Sanitary Installations Modeling.
In the Revit plumbing template, the architectural and structural models are linked. Architectural levels are set up for modeling pipes and fittings, ensuring that each element matches the finished floor level as per the CAD drawings. Modeling was completed in 15 days.
The modeling of sanitary installations (Figure 5) was accurate in quantity, size, shape and location and is therefore a Level of Development (LOD) 400.
- Electrical Installations Modeling.
In the Revit electrical template, the already developed structural and architectural models are linked to establish reference levels. Elements are placed according to the finished floor level and CAD drawings. The modeling was completed in 15 days.
The model of electrical installations (Figure 6) was carried out accurately in quantity, size, shape and location so it is a Level of Development (LOD) 400.
Based on the criteria of Maciel, de Souza and Oliveira [5], modeling was carried out in separate templates for each specialty, with linkage between them. This methodology allowed keeping the templates lighter so that they would not interfere with the computer processing. In addition, by separating the specialties, the possibility of accidental changes in the models of other disciplines was prevented, a risk that can arise when everything is modeled in a single template.
- Interference Detection.
Once the modeling process was completed, the integration of the models was carried out using Navisworks software for interference detection. This detection was performed by superimposing the 3D models in a specific order, as follows:
Structures VS Architecture, 64 conflicts were identified, including interferences between walls, beams, windows and doors. Figure 7 shows the most relevant ones.
As shown in Figure 7, doors and windows were found to intersect with beams due to design errors. During modeling, the integrity of the beams is prioritized by adjusting the windows and doors according to the architectural plan. This approach ensured an accurate representation and avoided unnecessary displacement of structural elements.
Structures VS Sanitary Installations, 103 conflicts were identified, especially with pipes crossing beams, columns and slabs. Figure 8 shows the most significant ones.
Figure 8 illustrates the interferences between the drainage pipes and the beams, as well as between the water pipes and the concrete wall. These interferences are critical as they could have compromised the structural capacity. By identifying them early, adjustments can be made prior to execution. To solve these problems, it is recommended to strategically relocate the pipes, redirecting them to the walls.
Structures VS Electrical Installations: 128 conflicts were identified in the interference analysis, with pipes crossing columns, plates and beams.
Figure 9 shows the incorrect positioning of pipes on key structural elements, such as columns and beams. It shows a switch located on a column and a group of pipes crossing a beam. To solve these problems, it is necessary to strategically relocate the piping to ensure structural stability.
These examples highlight the importance of the BIM methodology to ensure compatibility in projects. It is crucial to prioritize interferences according to their impact. To solve these problems, ICE sessions should be scheduled with all stakeholders to make shared decisions.
After the identification of the interferences, in Figure 10 the number and percentage of interferences between specialties are shown: 64 interferences (22%) for “Structures VS Architecture”, 103 interferences (35%) for “Structure VS Sanitary installations” and 128 interferences (43%) between “Structure VS Electrical installations”, for a total of 295 interferences.
As shown in Figure 10, “Structure VS Electrical Installations” interferences represent the highest percentage, mainly due to the presence of pipes and devices in structural elements. To minimize these interferences, it is essential to coordinate the installation of electrical systems with that of the structures. Placing outlets, switches and switchgear on plates, columns and beams should be avoided, and instead, they should be located on the walls.
On the other hand, Maciel, de Souza and Oliveira [5] identified in their study that the highest number of interferences was between Structures VS Sanitary Installations , which also underlines the importance of using BIM methodology for better coordination.
The interference per square meter indicator was calculated considering the total interference detected between the total roofed area of the project, as shown in Table 4.
Table 4 shows that there is 0.48 interferences per square meter of roofed area, which indicates a significant amount in relation to the total area. This finding is crucial to assess the impact on the budget, as it highlights the need to identify possible modifications that could have affected the original budget. Systematic analysis by overlaying models in Navisworks facilitates early detection of problems and contributes to more efficient project execution by reducing rework and delays during construction.
4.2.7. H7: 4D Model
Time factor determines a sequence of execution for each element of the project, which allows controlling its dynamics and anticipating possible difficulties, thus increasing performance and complying with the established deadlines. Implementing the 4D model in the planning and control of a project can be of great help to ensure compliance with time and budget, being essential to constantly monitor the progress of the project.
Figure 11 shows the monthly sectorization of the structure specialty of Project D, according to the contractual schedule. This methodology can also be applied to other specialties.
Sectorization or 4D simulation allows the generation of project progress control reports using the BIM model. This approach is more valued by clients compared to a Gantt chart, as it facilitates a better understanding and visualization of project progress.
4.2.8. H8: 5D Model
It covers the obtaining of measurements and cost estimation, allowing precise control over the financial information and improving the profitability of the project's investment. After generating the 3D models of the different specialties, quantification tables are prepared. This methodology facilitated the comparison in the variation of the measurements obtained through BIM and the traditional method, demonstrating the effectiveness of the implementation of BIM in the project.
- Structures.
Of the total number of entries, 75.56% (34 items) were analyzed, excluding some items such as earthwork due to the lack of topographic modeling, and concrete countertops due to the lack of details that prevented their complete analysis. Of the items submitted for analysis, it was identified that 100% showed variation.
- Architecture.
Of the total number of entries, 95.65% (22 items) were analyzed, excluding some items such as the handrail because it has a global unit of measure associated with it. Of the items submitted for analysis, 81.82% were found to have variation in the following items.
- Sanitary Installations.
A total of 95.92% (47 items) of the total entries were evaluated, including sanitary appliances, cold water systems, drainage systems and ventilation. Of these, 59.57% were identified as showing variation. Of these, it was observed that, according to the CAD drawings, the traditional measurement did not consider some items such as sanitary fixtures, which led to the variation in the measurement.
- Electrical Installations.
A total of 96% of 23 entries were evaluated, excluding the grounding system because its unit of measure was global. Of the items subjected to analysis, 56.52% were identified as showing variation. Table 5 details the variation of the items by specialty.
As shown in Table 5, the specialty with the greatest variation is structures, followed by architecture, and more than 50% of all specialties have variation, which is a detrimental factor for the budget.
- Analysis of item variation.
Table 6 shows the total number of project items and the items with variation in the measurement, comparing the BIM methodology and the traditional methodology.
Of the total number of items analyzed with the BIM methodology, 73.81% (93 items) show variation with traditional metrics, and only 26.19% (33 items) show no variation at all. Therefore, the use of BIM tools is essential to ensure the optimization and quality of the project.
- Cost Comparison.
A comparison was carried out between the costs of the traditional methodology (items extracted from the file), and the cost obtained by using the BIM methodology. It was observed that the items with variations in the measurement also experience changes in the costs.
Table 7 shows that the total cost of the project, according to the technical file, which is S/804,430.48; while the cost using BIM tools is S/766,392.86, which represents a difference of S/38,037.63. This difference indicates an optimization of 4.73% with respect to the traditional method. In comparison, Chirinos and Pecho [34] reported an optimization of 1.97%. This suggests that the implementation of BIM not only offers economic advantages, but also contributes to improve the time and quality of the project.
- BIM and IPD Profitability Analysis.
Through Table 8 and Table 9, the estimated cost of implementing the BIM and IPD methodologies for the case study was analyzed. The implementation of BIM and IPD requires previous knowledge, so a training cost will be considered. This cost was obtained from the course “Project Management through IPD and BIM” of the Continuous Education Center of ESPOL.
Moreover, the cost of modeling and management of the application of the BIM methodology and the extraction of metrics in Revit software is detailed, the hours worked in the development of the BIM model of the case study were counted, which were 10 weeks (250 hours) with a working day of 5 hours per day. A monthly salary of S/3,341.00 was assumed according to Diar Ingenieros S.A., according to a work shift of 48 hours per week for 4 weeks, resulting in a rate of S/17.40 per man hour.
With all this data, it is possible to calculate the return on investment (ROI) of the implementation of BIM and IPD methodologies, which will allow us to evaluate their profitability. ROI according to Cabrera and Quiroz [35] is determined by relating net income to the cost of implementation.
Table 11 shows a return on investment percentage of 342.43%, which means there is a return of S/3.42 for each S/1.00 invested in the implementation of BIM and IPD. In comparison, Cabrera y Quiroz [35] reported a 109% return for the BIM methodology. This suggests that the BIM and IPD methodologies offer a significantly higher return compared to the traditional methodology.
4.3. Validation
4.3.1. Statistical Analysis
To perform the analysis, according to Ureta and Chileno [36], a Control Group (CG) was created to perform a thorough measurement to determine the accuracy of the information obtained through the traditional and BIM methodology. Figure 12 presents the variation of the costs of the specialty of structures in relation to the Control Group.
Figure 12 shows that the costs of the BIM methodology show less variation compared to the control group, in contrast to the traditional methodology.
Similarly, Figure 13 shows that the costs of the architectural specialty have less variation with the BIM methodology with respect to the control group, compared to the traditional methodology.
Figure 14 shows that the costs of the sanitary installations specialty show less variation with the BIM methodology with relation to the control group, as compared to the traditional methodology.
Figure 15 shows that the costs in the Electrical Installations specialty are more accurate with the BIM methodology, exhibiting less variation in relation to the Control Group, as compared to the traditional methodology.
Using the information presented in Figure 12, Figure 13, Figure 14 and Figure 15, the percentages of variation with respect to the Control Group were determined. For the statistical analysis, the left-tailed test with a critical z-value was used, since we worked with a large sample of 126 items, with a significance level of α =0.01. With 125 degrees of freedom (DF). The hypothesis is shown in Table 10 and tested in Table 11.

Table 10.
Hypothesis test for two samples.
| Hypothesis | Symbol | Description | Expression | Decision rule |
| Alternative H. | Ha | With BIM methodology, costs are optimized. | µ1 < µ2 1 | IF REJECTED Ho Si: Zk < Zα |
| Null H. | H0 | With the BIM methodology, costs are not optimized. | µ1 ≥ µ2 1 | IF ACCEPTED Ho Si = Zk ≥ Zα |
1 µ1 represents the sample average percentage change in BIM costs relative to the Control Group; and µ2 is the sample average percentage change in Technical File costs relative to the Control Group.
Table 11.
Data for test statistics.
| Sample | No. | Media | Standard Deviation |
| % Variation BIM / G.C. | 126 | x1 = 3.04 % | σ1 = 40.15 % |
| % Variation E.T. / G.C. | 126 | x2 = 40.15 % | σ2 = 122.90 % |
With this data, calculation is made according to the following formula:
The value of Zk = - 3.39 is obtained as a result. In the "Z" table, a critical value of Zα = -2.33 is found for a significance level α = 0.01.
Figure 16 shows that the value of Zk obtained (-3.39) is lower than Zα (-2.33), therefore the null hypothesis is discarded and the alternative hypothesis is accepted. This confirms that the BIM methodology optimizes costs, providing more accurate data.
4.3.2. Validation Matrix
After examining the eight proposed tools, Table 12 shows how each one addresses and solves the management problems identified in the diagnostic, with the objective of improving management in future SME projects.
Most of the problems identified are addressed by Tools H1 and H6 as shown in Table 12, followed by Tool H3 which solves six of the identified problems. From Tool H1 it can be said that a detailed contract ensures a complete understanding and definition of the responsibilities of each party, thus encouraging a higher level of collaboration in the project during its development and execution.
H2 and H5 tools are key to improve communication, coordination and collaboration between teams. Tool H3 highlights the importance of using appropriate software, such as Revit and Navisworks, for the effective implementation of BIM models. Tool H4 stresses the need to clearly define the team members and ensure their active collaboration at each stage of the process. In addition, it is essential that the contract includes all the documentation necessary for the contractor to carry out the stipulated works; therefore, tools H6, H7 and H8 are essential from the early stages of the project all the way through to completion. These tools not only improve the quality of deliverables, but also optimize project scheduling, metrics and costs, ensuring more accurate outputs.
5. Discussion
By examining the case study, nine key problems have been identified in the traditional management of residential buildings. These problems coincide with those reported by Othman and Youssef [22], Yabar-Ardiles, Sanchez-Carigga, Vigil, Málaga and Zevallos [26], Ajmal and Rajasekaran [25] and Dos Santos, Ferreira and Ferreira [31], who also identified similar problems. The concurrence with previous studies underscores the persistent shortcomings in traditional management.
Eight optimization tools are proposed from the integration of IPD and BIM, such as the implementation of NEC4 ECC collaborative clauses in traditional contracts, Yabar-Ardiles, Sanchez-Carigga, Vigil, Málaga and Zevallos [26] and Wright and Fergusson [37], support this proposal, indicating that NEC ECC improves project management, provides contractual clarity and fosters proactive relationships, thus optimizing project management. The Trimble Connect CDE tool simplifies coordination and information exchange on BIM projects, Gehry, et al. [38] emphasize that this tool improves constructive clarity, reducing costs and deadlines. Using Revit and Navisworks within a BIM environment excels because of their interoperability and ability to integrate information from various disciplines, according to Akter, Datta, Islam, Tayeh, Sraboni and Das [32], these tools significantly improve construction quality and safety. Regarding the Work Teams, the case study team did not have contractor intervention until the actual execution of the work, this approach should be improved; the adoption of IPD principles (NEC4 ECC) by integrating the contractor from early stages are supported by authors such as Franz, Leicht, Molenaar and Messner [19] and Laurent and Leicht [20] who highlight that their integration significantly improves performance in terms of costs and project timelines.
With regard to ICE sessions, it is recommended to implement them regularly, at least once a week, and to increase their frequency during the design stage, as this practice will improve team collaboration and communication, Laurent and Leicht [20] also suggest weekly or more frequent sessions in order to optimize management. Analysis of the 3D Model revealed 295 interferences, equivalent to 0.48 interferences per square meter of roofed area. These findings suggest that the use of BIM facilitates the identification and correction of interferences prior to project execution, resulting in cost and time savings. Consistent with this, Dos Santos, Ferreira and Ferreira [31] confirm that project compatibilization through BIM makes it possible to detect and correct interferences before the execution phase, thus improving project management. The integration of the 4D Model facilitates decision making and improves communication by allowing visualization of the construction sequence over time. According to Martins, et al. [39], the 4D Model optimizes communication between teams at different stages of the project. In relation to the 5D Model, the study revealed that 73.81% of the items analyzed showed variations in metrics and costs. BIM methodology achieved an optimization of 4.73%, equivalent to savings of S/38,037.63. The Z-test confirmed this optimization with a value of Zk = -3.39, which is lower than Zα = -2.33. Chirinos and Pecho [34] found an optimization of 1.97%, demonstrating that the BIM methodology reduces the margin of error and optimizes costs through a more accurate quantification of the measurements. Profitability analysis showed a net profit of S/29,440.27 and a return of 342.43%, indicating that each S/1.00 invested in BIM and IPD generated a return of S/3.42. Cabrera and Quiroz [35] found a 109% return, suggesting that these methodologies are cost-effective.
Finally, the Validation Matrix showed that all of the proposed tools address management problems, with the NEC4 ECC Collaborative Contract and the 3D BIM Model solving the most problems. Khanna, Elghaish, McIlwaine and Brooks [15] emphasize that the integration of IPD and BIM methodologies improves coordination and transparency, optimizing costs and deadlines. Therefore, the implementation of these methodologies will improve the management of future projects.
It should be mentioned that there are additional BIM dimensions under development, such as BIM 6D (energy and sustainability), BIM 7D (maintenance and asset management), and the emerging BIM 8D (safety), BIM 9D (Lean Construction) and BIM 10D (construction industrialization), as well as the City Information Model (CIM). As technology evolves, it is suggested to consider the integration of new technologies such as artificial intelligence (AI) and Machine Learning with IPD and BIM for more efficient processes. This research highlights the benefits of BIM and IPD and suggests the integration of new dimensions and technologies in future research. It is recommended to prioritize a change of philosophy and mentality to achieve better results, using Kotter's method for change management, which will allow leading the transformation processes within the SME in a strategic and effective way.
6. Conclusions
Considering that the main objective of this study was to evaluate how IPD and BIM methodologies optimize the design stage in residential buildings. The research achieved this purpose through optimization proposals such as: the introduction of collaborative clauses NEC4 ECC that improves the clarity and management of contracts, and the Trimble Connect CDE which optimizes the handling of information and document management.
The incorporation of Revit and Navisworks facilitates the management of BIM models, the early involvement of the contractor in the work teams will give diverse perspectives reducing the need for later modifications, the implementation of ICE Sessions will improve communication, coordination and collaboration. The use of 3D BIM models allowed us to identify 0.48 interferences per square meter, achieving more accurate deliverables and optimizing the design. The application of the 4D model facilitates the monitoring of project progress, and the 5D model achieved a direct cost optimization of 4.73%, with a return on investment of S/. 3.42 per S/1.00 invested. The management of residential buildings in an SME and one of its projects was evaluated. Nine recurring problems were identified, such as deficiencies in plans, measurements and budgets, as well as delays due to inadequate planning in the supply of materials. To effectively address these problems, eight optimization strategies were proposed based on the BIM and IPD methodologies described above. Validation of these strategies showed that the NEC4 ECC Collaborative Contract and the 3D BIM Model are the most effective tools. Adoption of these tools will provide favorable results for the SME, as they address deficiencies that are not fully controlled by traditional methods. In conclusion, this study demonstrates that the synergistic implementation of BIM and IPD methodologies significantly optimizes the design stage in residential buildings, effectively solving management problems and contributing to the closing of the knowledge gap in this field.
Author Contributions
Conceptualization, D.S.T.C., E.M.C. and A.J.E.V.; methodology, D.S.T.C.; software, D.S.T.C.; validation, D.S.T.C.; formal analysis, D.S.T.C.; investigation, D.S.T.C. and A.J.E.V.; resources, D.S.T.C.; data curation, D.S.T.C.; writing—original draft preparation, D.S.T.C. and A.J.E.V.; writing—review and editing, D.S.T.C., E.M.C. and A.J.E.V.; visualization, D.S.T.C.; supervision, E.M.C. and A.J.E.V.; project administration, D.S.T.C. and A.J.E.V.; funding acquisition, A.J.E.V. All authors have read and agreed to the published version of the manuscript.
Funding
This research received no external funding.
Data Availability Statement
The data presented in this study are available on request from the author, D.S.T.C. The data are not publicly available due to ethical restrictions.
Acknowledgments
The authors thank Oscar Yabar for providing useful insights and assistance with the research reported.
Conflicts of Interest
The authors declare no conflicts of interest.
References
- Asvadurov, S.; Varilla, R.; Brindado, T.; Brown, T.; Knox, D.; Ellis, M. The art of project leadership: Delivering the world's largest projects; 2017.
- Buk'hail, R.; Al-Sabah, R.S. Exploring the Barriers to Implementing the Integrated Project Delivery Method. J. King Saud Univ. Eng. Sci. 2022. [Google Scholar] [CrossRef]
- Mesa, H.A.; Molenaar, K.R.; Alarcon, L.F. Exploring performance of the integrated project delivery process on complex building projects. Int. J. Proj. Manag. 2016, 34, 1089–1101. [Google Scholar] [CrossRef]
- Alcantara, P. Metodología para minimizar las deficiencias de diseño basada en la construcción virtual usando tecnologías BIM. 2013.
- Maciel, A.C.F.; de Souza, D.A.; Oliveira, P.H. Detection of design incompatibilities between traditional 2D and bim methodology: A comparative study. Rev. Gest. Proj. 2022, 13, 97–116. [Google Scholar] [CrossRef]
- Espinoza Vigil, A.J.; Carhart, N.J. Local infrastructure governance in Peru: A systems thinking appraisal. Infrastructure Asset Management 2024, 11, 145–160. [Google Scholar] [CrossRef]
- La Contraloría General de la República del Perú. Reporte de obras paralizadas en el territorio Nacional a mayo 2023. 2023.
- Tapia, E. Hay más de S/ 29 mil millones en obras, paralizados por malos expedientes técnicos. Voces 2023. [Google Scholar]
- Acero, Y. Consejero regional anuncia reanudar obras paralizadas en Tacna. Radio Uno 2023. [Google Scholar]
- Sullivan, J.; El Asmar, M.; Chalhoub, J.; Obeid, H. Two Decades of Performance Comparisons for Design-Build, Construction Manager at Risk, and Design-Bid-Build: Quantitative Analysis of the State of Knowledge on Project Cost, Schedule, and Quality. J Constr Eng Manage 2017, 143. [Google Scholar] [CrossRef]
- AIA. AIA California Council. Integrated Project Delivery A Guide. 2007.
- Ahmed, M.M.; Lotfy, S.M.; Othman, A.A.E.; Hammad, H.A. An Analytical Study of the Current Status of Managing Change Orders during the Construction Phase of Governmental Projects in Egypt. MEJ Mansoura Engineering Journal 2016. [Google Scholar] [CrossRef]
- Eastman, C.; Teicholz, P.; Sacks, R.; Liston, K. BIM Handbook: A Guide to Building Information Modeling for Owners, Managers, Architects, Engineers and Contractors; 2008.
- Kent, D.C.; Becerik-Gerber, B. Understanding construction industry experience and attitudes toward integrated project delivery. J Constr Eng Manage 2010, 136, 815–825. [Google Scholar] [CrossRef]
- Khanna, M.; Elghaish, F.F.; McIlwaine, S.; Brooks, T. Feasibility of implementing ipd approach for infrastructure projects in developing countries. J. Inf. Technol. Constr. 2021, 26, 902–921. [Google Scholar] [CrossRef]
- Yañez, D.S. Retos de la implementacion de BIM durante la etapa de diseño de infraestructura de salud. 2023.
- Murguía, D. Tercer estudio de adopcion BIM en proyectos de edificacion en Lima; Pontificia Universidad Catolica del Perú: Lima, Perú, 2023. [Google Scholar]
- MEF. Plan de implementación y Hoja de Ruta del Plan BIM Perú. 2021.
- Franz, B.; Leicht, R.; Molenaar, K.; Messner, J. Impact of Team Integration and Group Cohesion on Project Delivery Performance. J Constr Eng Manage 2017, 143. [Google Scholar] [CrossRef]
- Laurent, J.; Leicht, R.M. Practices for Designing Cross-Functional Teams for Integrated Project Delivery. J Constr Eng Manage 2019, 145. [Google Scholar] [CrossRef]
- Ling, F.Y.Y.; Teo, P.X.; Li, S.; Zhang, Z.; Ma, Q. Adoption of Integrated Project Delivery Practices for Superior Project Performance. J. Legal Aff. Disput. Resolut. Eng. Construction 2020, 12. [Google Scholar] [CrossRef]
- Othman, A.A.E.; Youssef, L.Y.W. A framework for implementing integrated project delivery in architecture design firms in Egypt. J. Eng. Des. Technol. 2021, 19, 721–757. [Google Scholar] [CrossRef]
- Alqahtani, F.K.; Alsanad, A.; Alsadan, A.; Sherif, M.; Mohamed, A.G. Scrutinizing the Adoption of Integrated Project Delivery in the Kingdom of Saudi Arabia Construction Sector. Buildings 2022, 12. [Google Scholar] [CrossRef]
- Alinezhad, M.; Saghatforoush, E.; Kahvandi, Z.; Preece, C. Analysis of the Benefits of Implementation of IPD for Construction Project Stakeholders. CIVIL ENGINEERING JOURNAL-TEHRAN 2020, 6, 1609–1621. [Google Scholar] [CrossRef]
- Ajmal, M.; Rajasekaran, C. Comparison of Afghanistan’s Construction and Engineering Contract with International Contracts of FIDIC RED BOOK (2017) and NEC4—ECC. In Proceedings of the Lecture Notes in Civil Engineering, 2023; pp. 299–313.
- Yabar-Ardiles, O.; Sanchez-Carigga, C.; Vigil, A.J.E.; Málaga, M.S.G.; Zevallos, A.A.M. Seeking the Optimisation of Public Infrastructure Procurement with NEC4 ECC: A Peruvian Case Study. BUILDINGS 2023, 13. [Google Scholar] [CrossRef]
- Lau, C.H.; Mesthrige, J.W.; Lam, P.T.I.; Javed, A.A. The challenges of adopting new engineering contract: A Hong Kong study. Engineering, Construction and Architectural Management 2019, 26, 2389–2409. [Google Scholar] [CrossRef]
- Bravo, A.J.; Mendoza, J.C. Propuesta de un método de integración basado en las herramientas de Integrated Project Delivery y Virtual Design and Construction para reducir el impacto de las incompatibilidades en la etapa de diseño de edificios residenciales de alto desempeño en Lima Metropolitana. 2019.
- El Asmar, M.; Hanna, A.S.; Loh, W.Y. Quantifying Performance for the Integrated Project Delivery System as Compared to Established Delivery Systems. J Constr Eng Manage 2013, 139. [Google Scholar] [CrossRef]
- Mesquita, H.D.; Eduardo, R.C.; Rodrigues, K.C.; de Paula, H.M. Case study of analysis of interferences between the discipline of a building with conventional designs (re) modeling in BIM. Mater. Rio De Jan. 2018, 23. [Google Scholar] [CrossRef]
- Dos Santos, D.F.A.; Ferreira, M.E.C.; Ferreira, M.P. Compatibility of design through BIM methodology. REVISTA INGENIERIA DE CONSTRUCCION 2023, 38, 80–89. [Google Scholar] [CrossRef]
- Akter, J.; Datta, S.D.; Islam, M.; Tayeh, B.A.; Sraboni, S.A.; Das, N. Assessment and analysis of the effects of implementing building information modelling as a lean management tool in construction management. International Journal of Building Pathology and Adaptation 2024. [Google Scholar] [CrossRef]
- Mitchell, B.; Trebes, B. Managing Reality: Book One; 2017.
- Chirinos Santander, L.R.; Pecho Llacta, J.C. Implementación de la metodología BIM en la construcción del proyecto multifamiliar DUPLO para optimizar el costo establecido. Implementation of the BIM methodology in the construction of the DUPLO multifamily project to optimize the established cost 2019. [Google Scholar]
- Cabrera, J.; Quiroz, L. Análisis del retorno de inversión al aplicar Building Information Modeling (BIM) en un proyecto inmobiliario. (Lima - Perú). 2020.
- Ureta, D.D.; Chileno, J.O. Analisis comparativo de la rentabilidad entre el modelo convencional CAD y el BIM en la etapa de planificacion del bloque de administración de la escuela técnico superior PNP - Arequipa. 2022.
- Wright, J.N.; Fergusson, W. Benefits of the NEC ECC form of contract: A New Zealand case study. International Journal of Project Management 2009, 27, 243–249. [Google Scholar] [CrossRef]
- Gehry, F.; Lloyd, M.; Shelden, D. Empowering Design: Gehry Partners, Gehry Technologies and Architect-Led Industry Change. Architectural Design 2020, 90, 14–23. [Google Scholar] [CrossRef]
- Martins, S.S.; Evangelista, A.C.J.; Hammad, A.W.A.; Tam, V.W.Y.; Haddad, A. Evaluation of 4D BIM tools applicability in construction planning efficiency. International Journal of Construction Management 2022, 22, 2987–3000. [Google Scholar] [CrossRef]
Figure 1.
Historical information on the profitability margin of the SME's private projects.
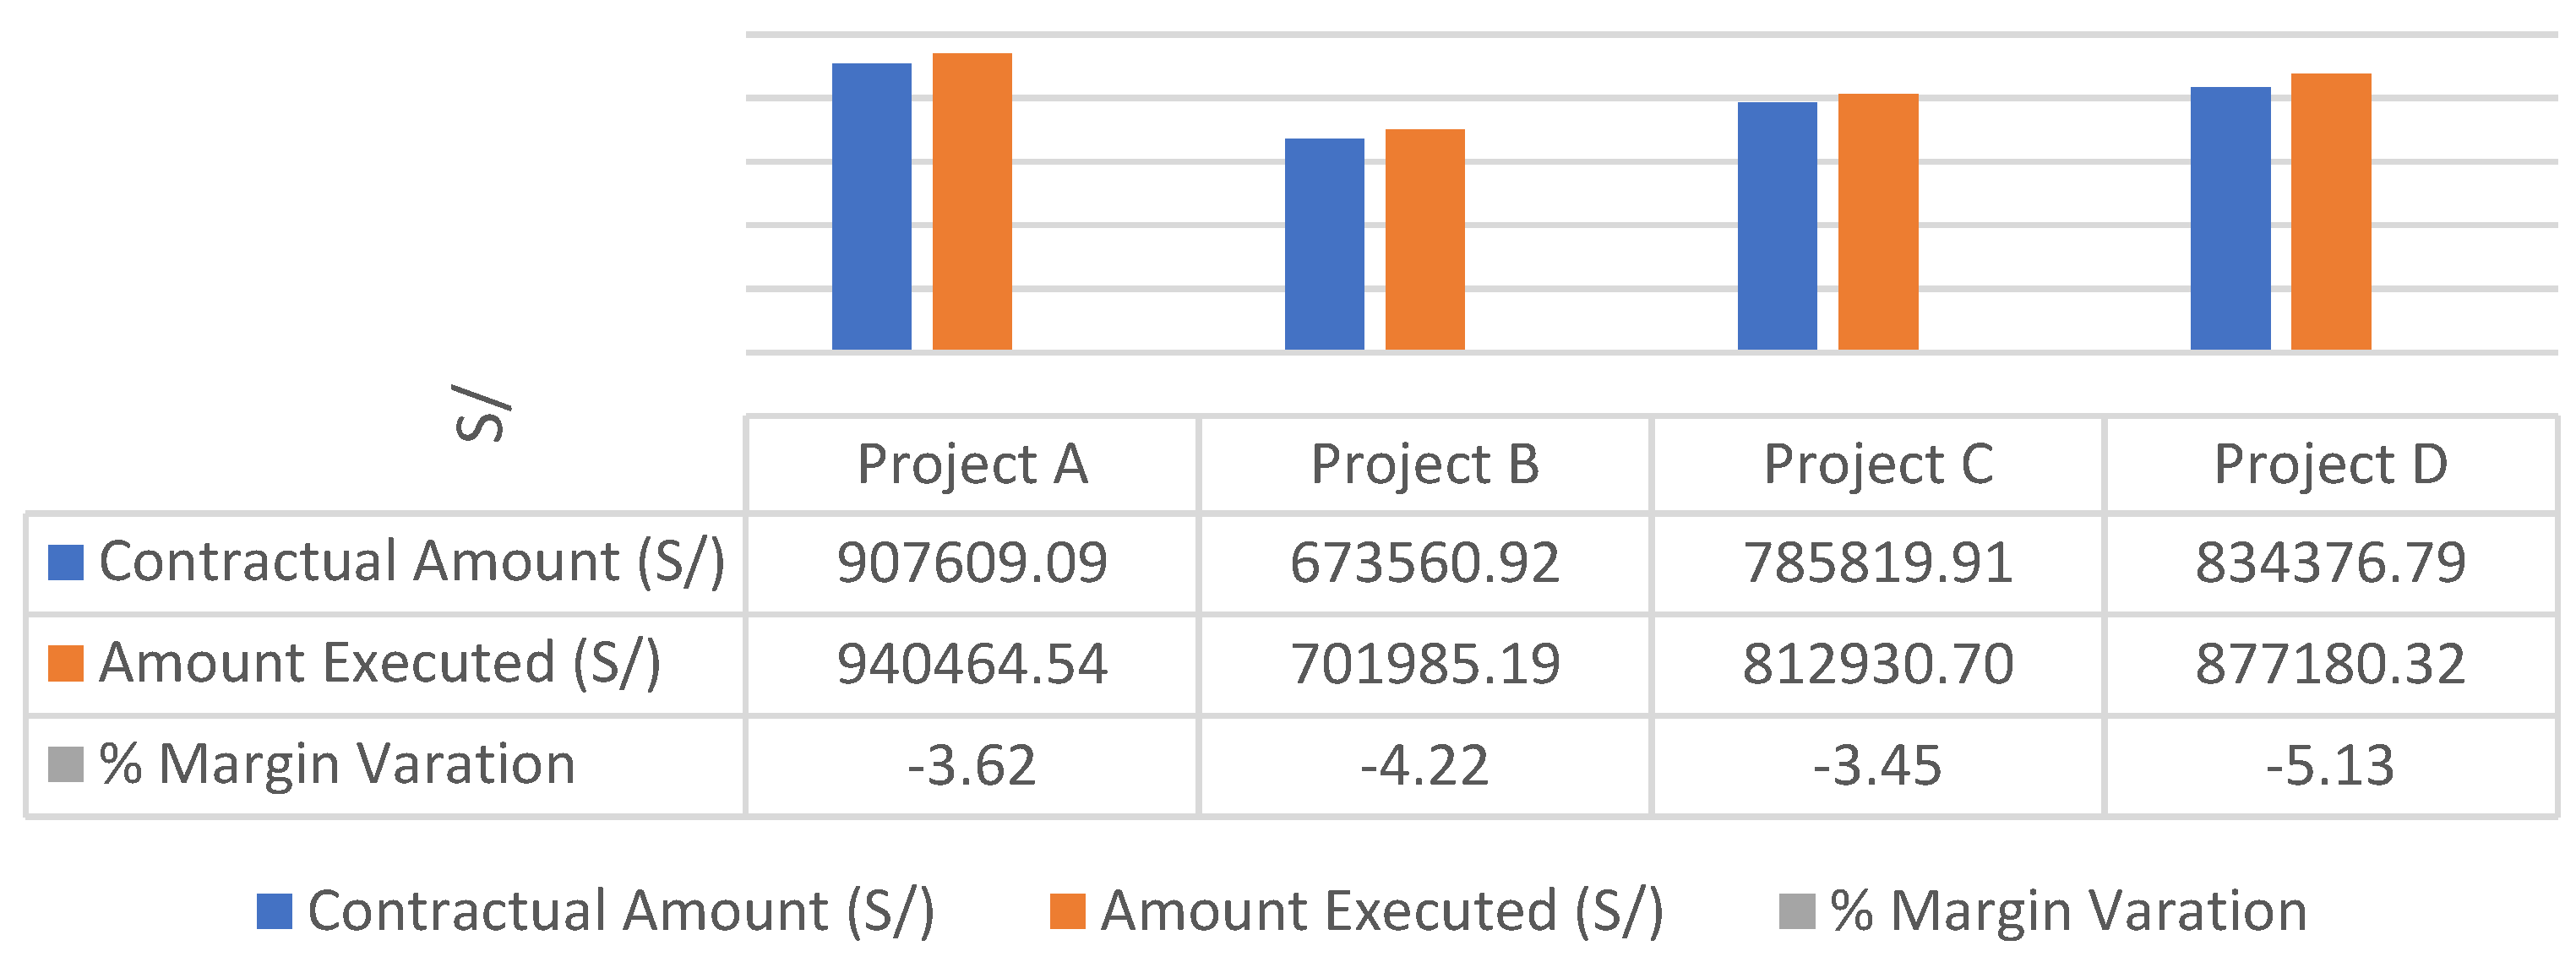
Figure 2.
Historical information on the execution time of private SME projects.
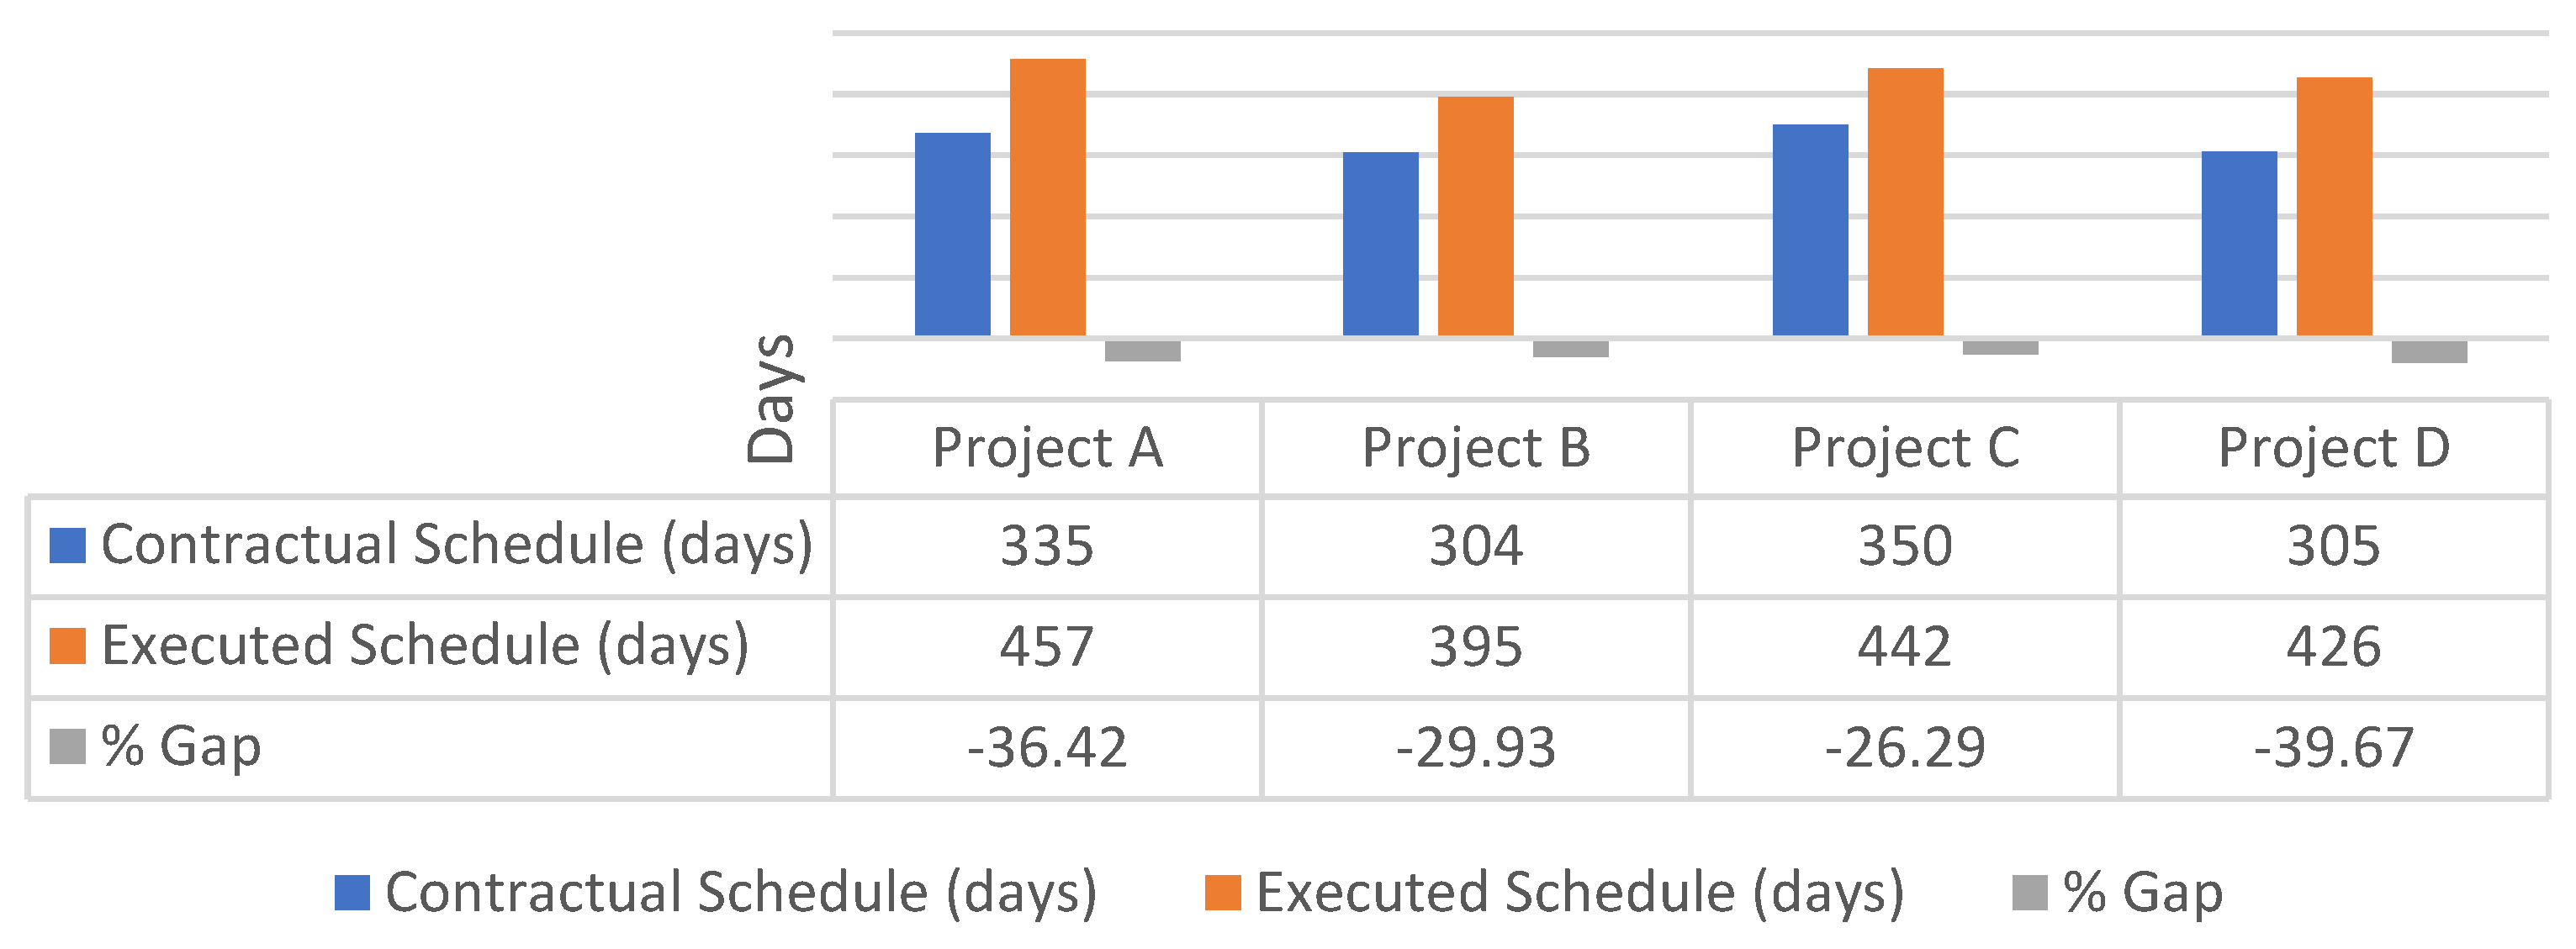
Figure 3.
Concrete and Steel Model – Structural Specialty.

Figure 4.
Architectural s Model.
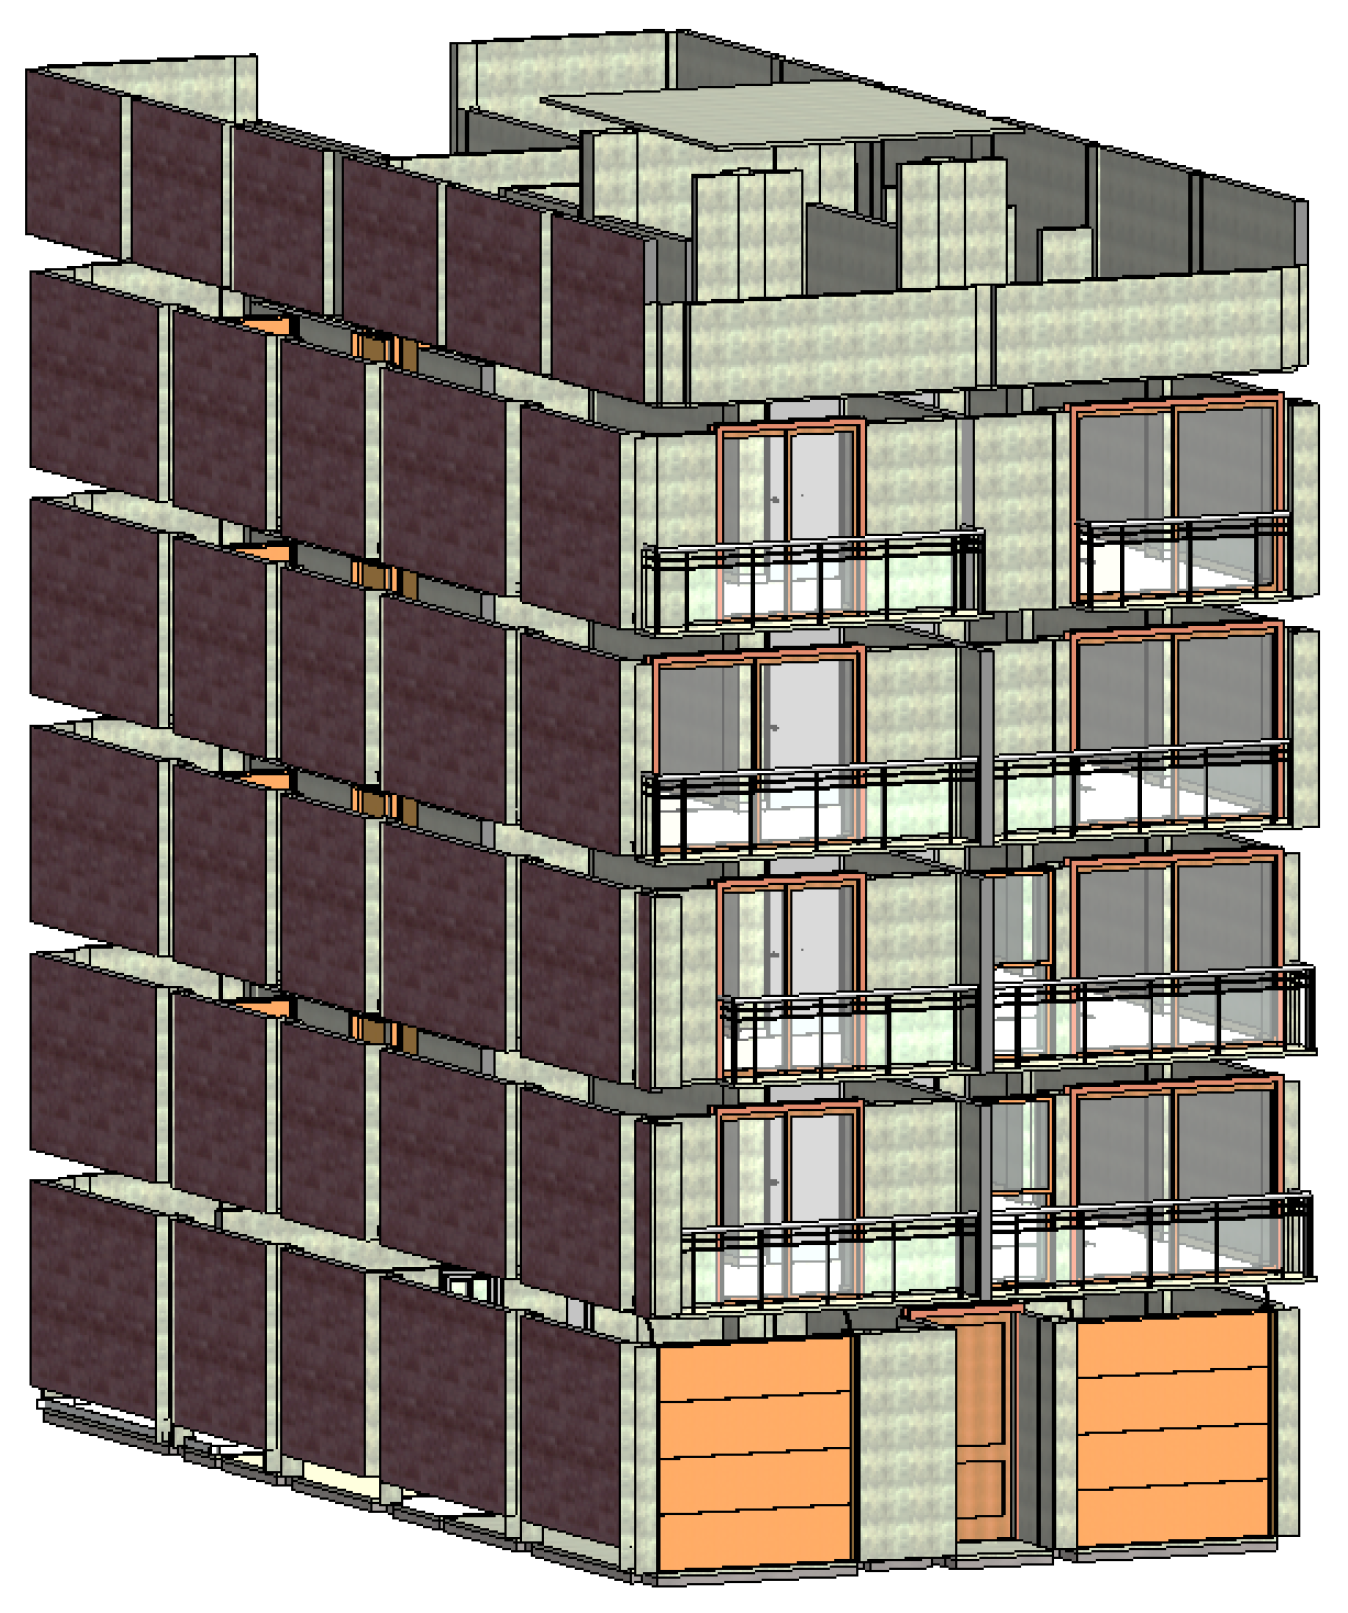
Figure 5.
Sanitary Installations Specialty Model.
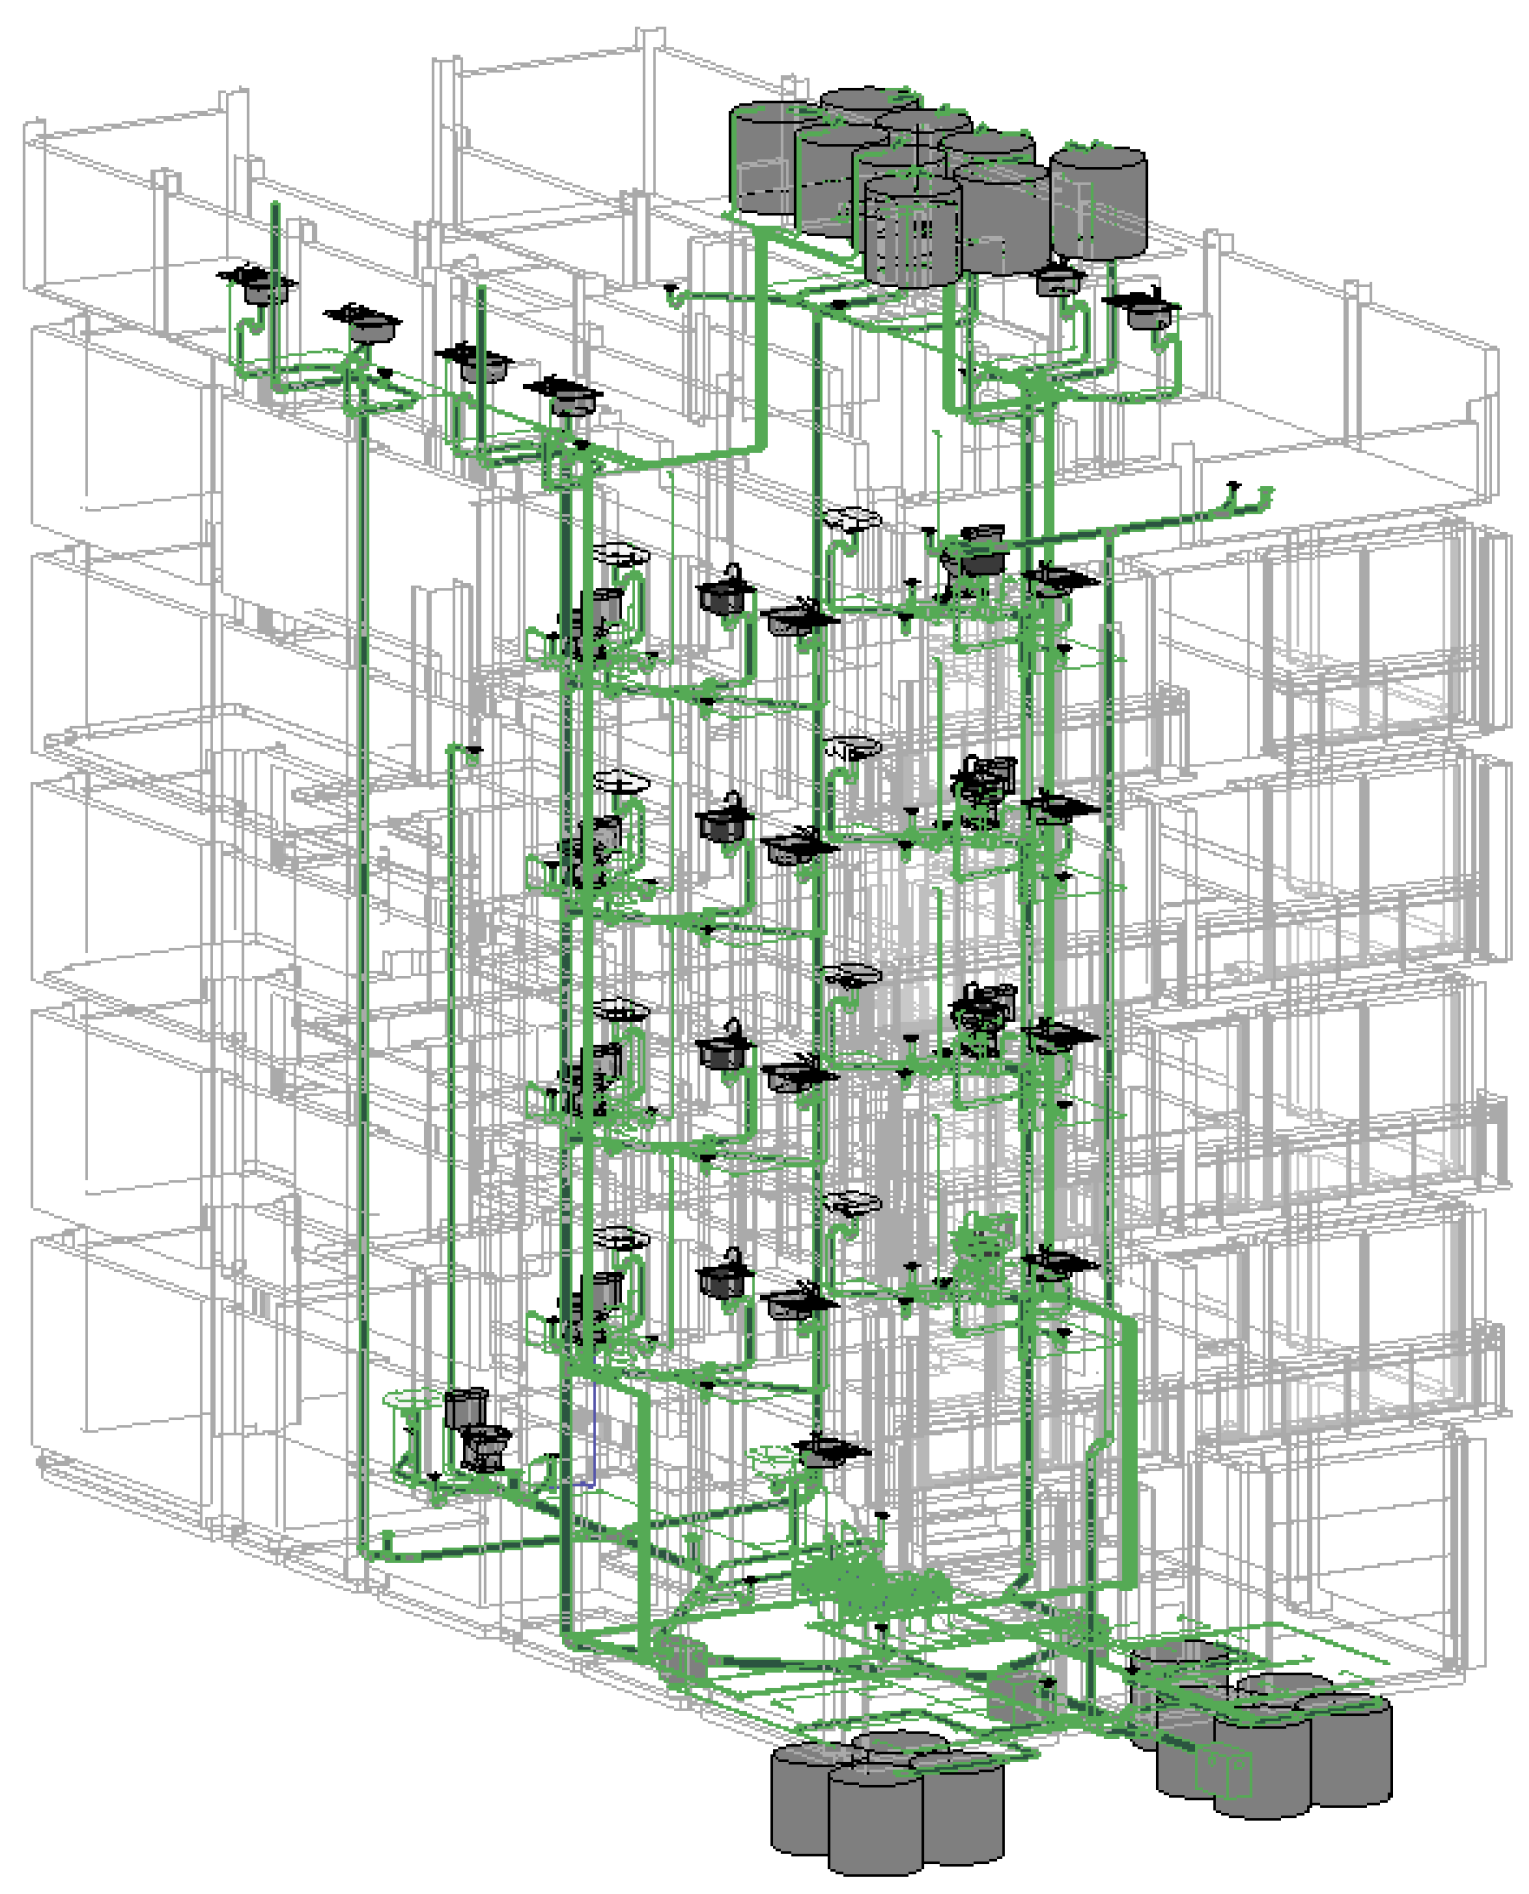
Figure 6.
Electrical Installations Specialty Model.
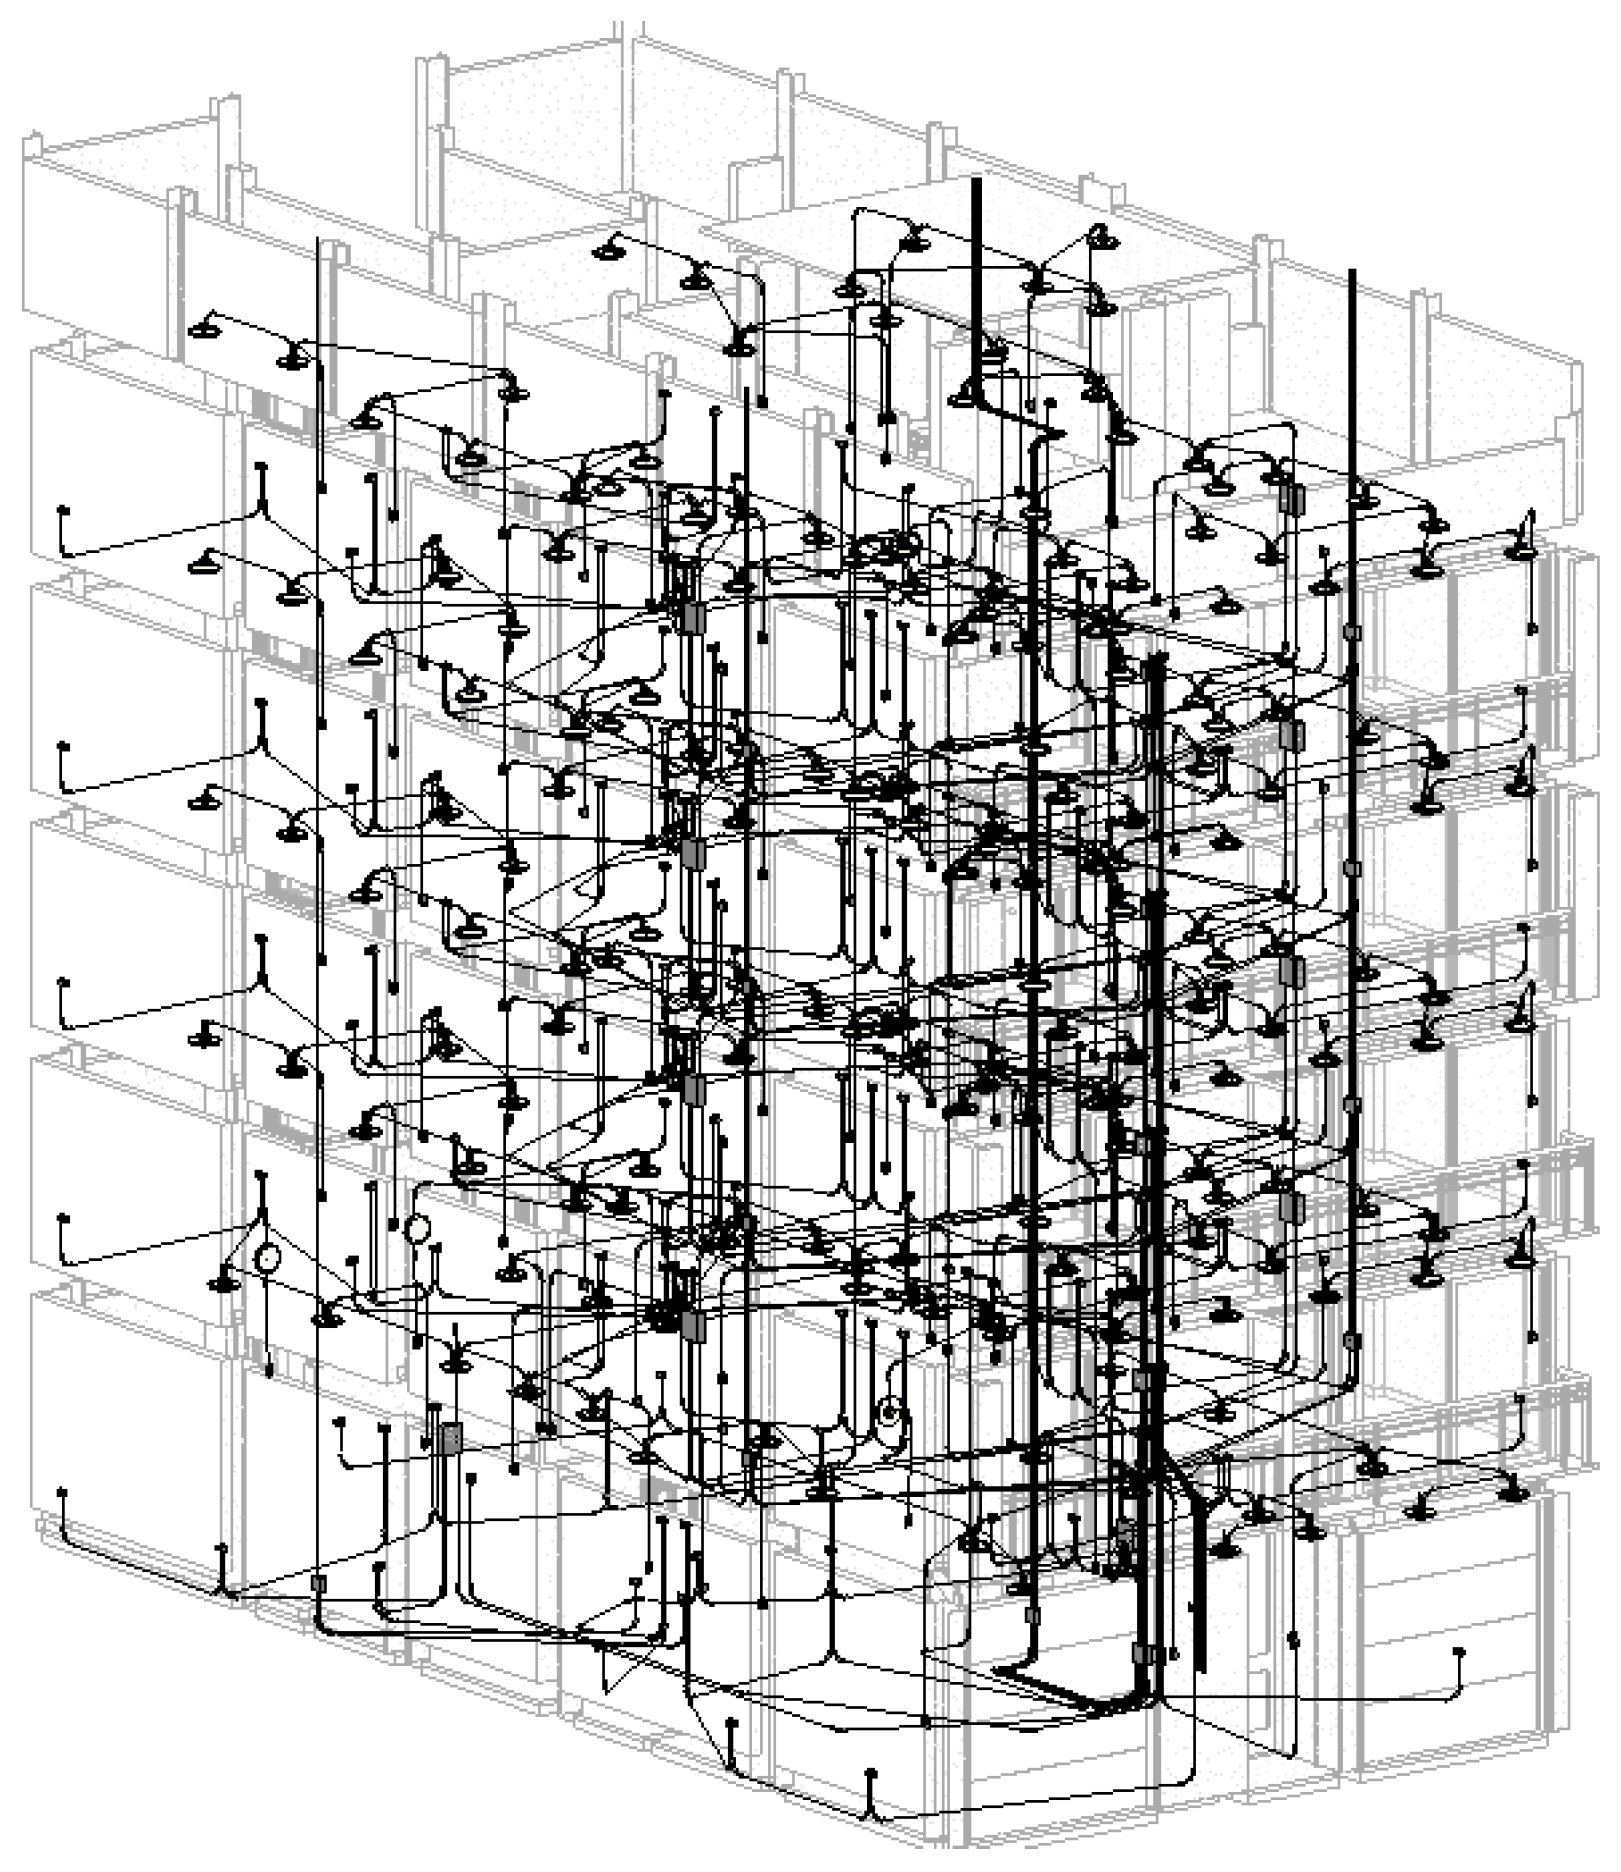
Figure 7.
Structures VS Architecture Interferences.
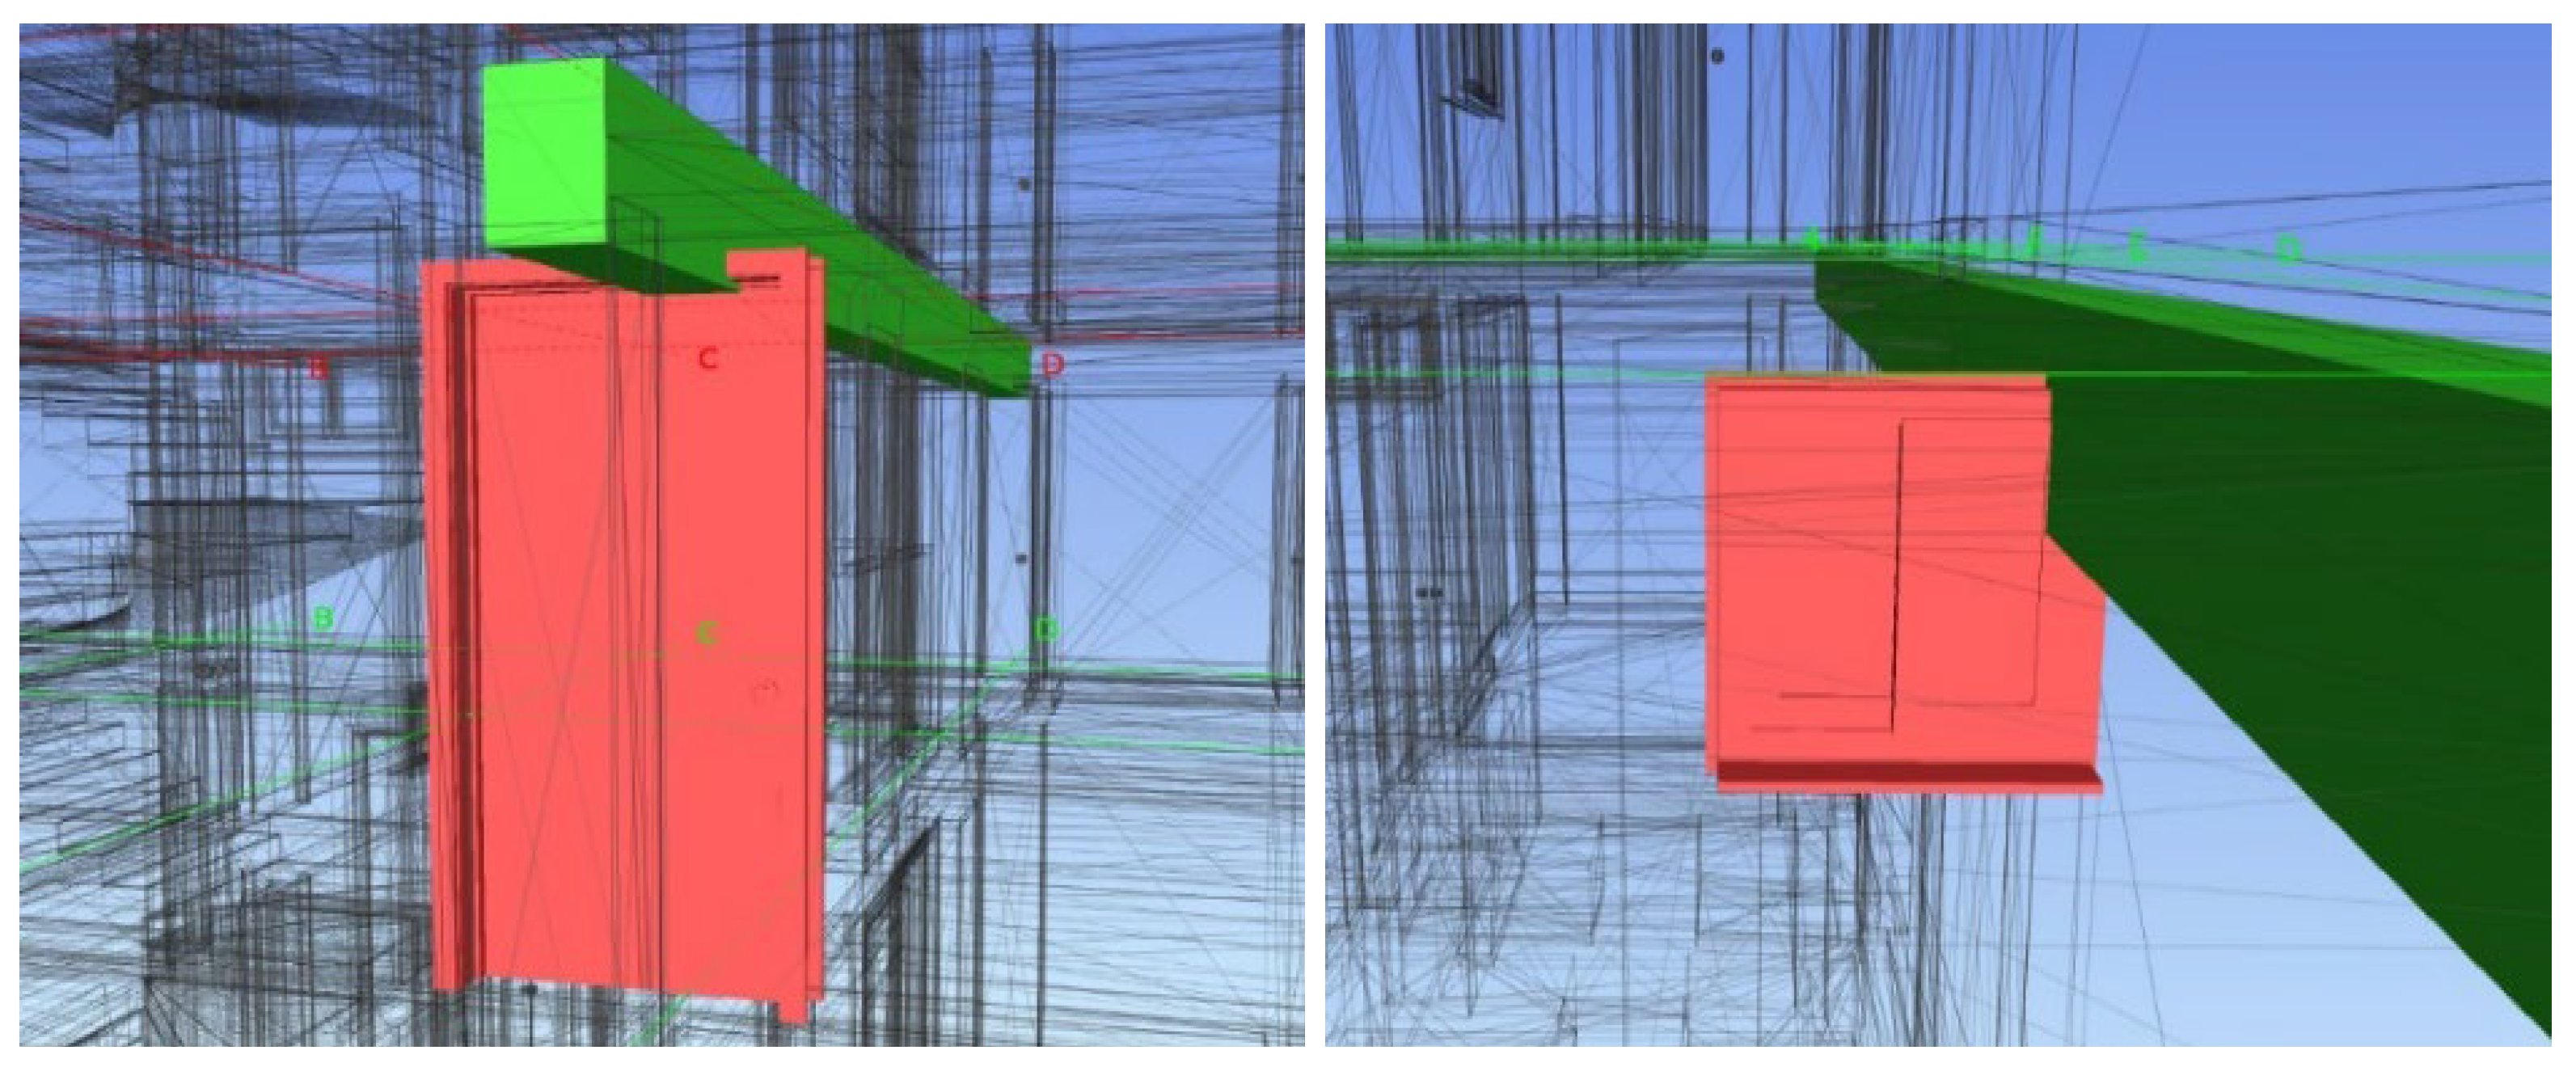
Figure 8.
Structures VS Sanitary Installations Interferences.
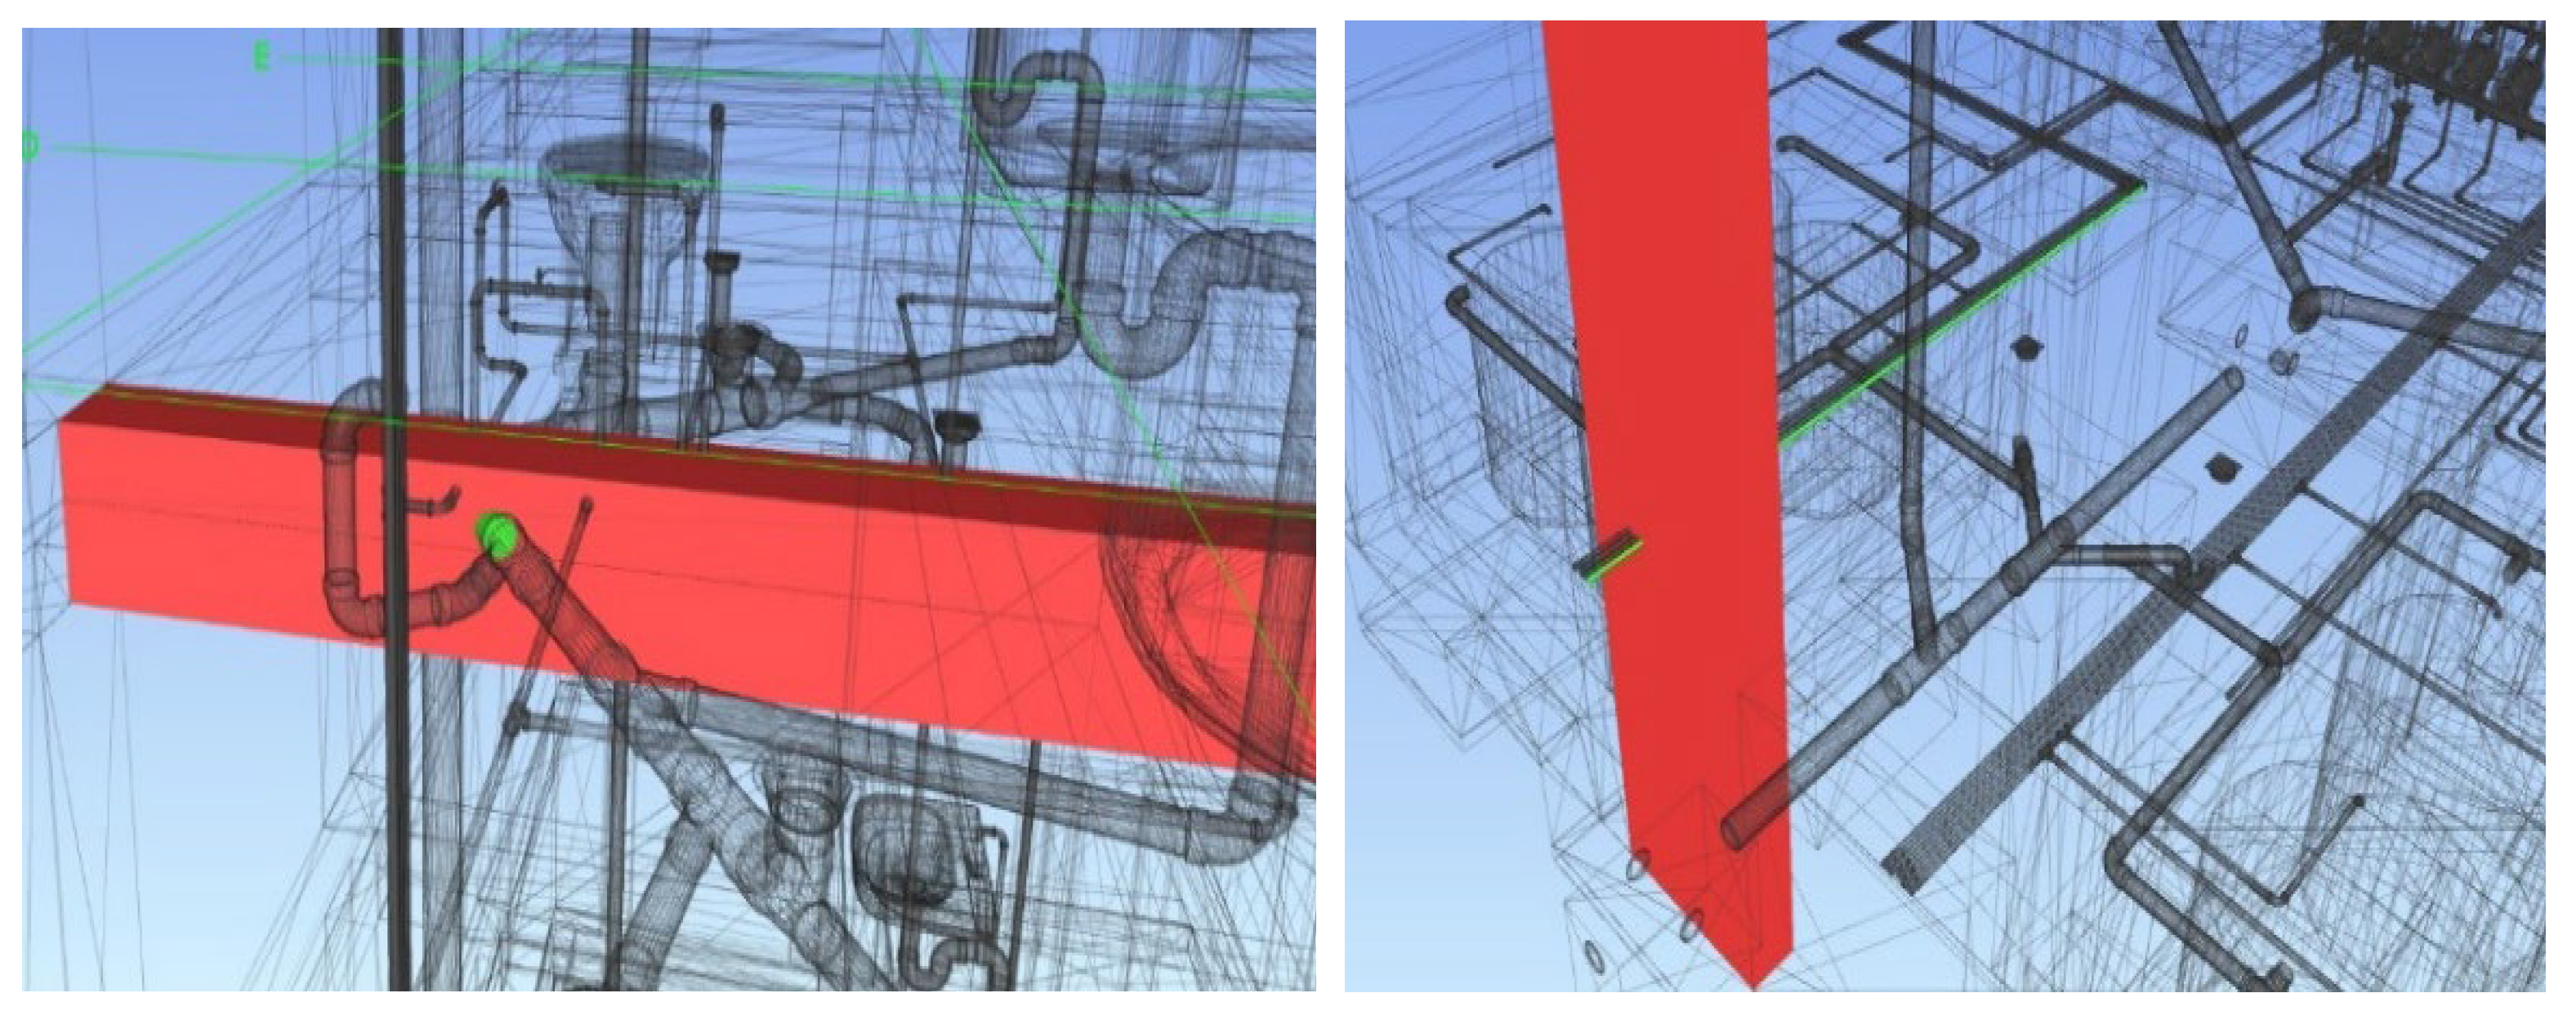
Figure 9.
Structures VS Electrical Installations Interferences.
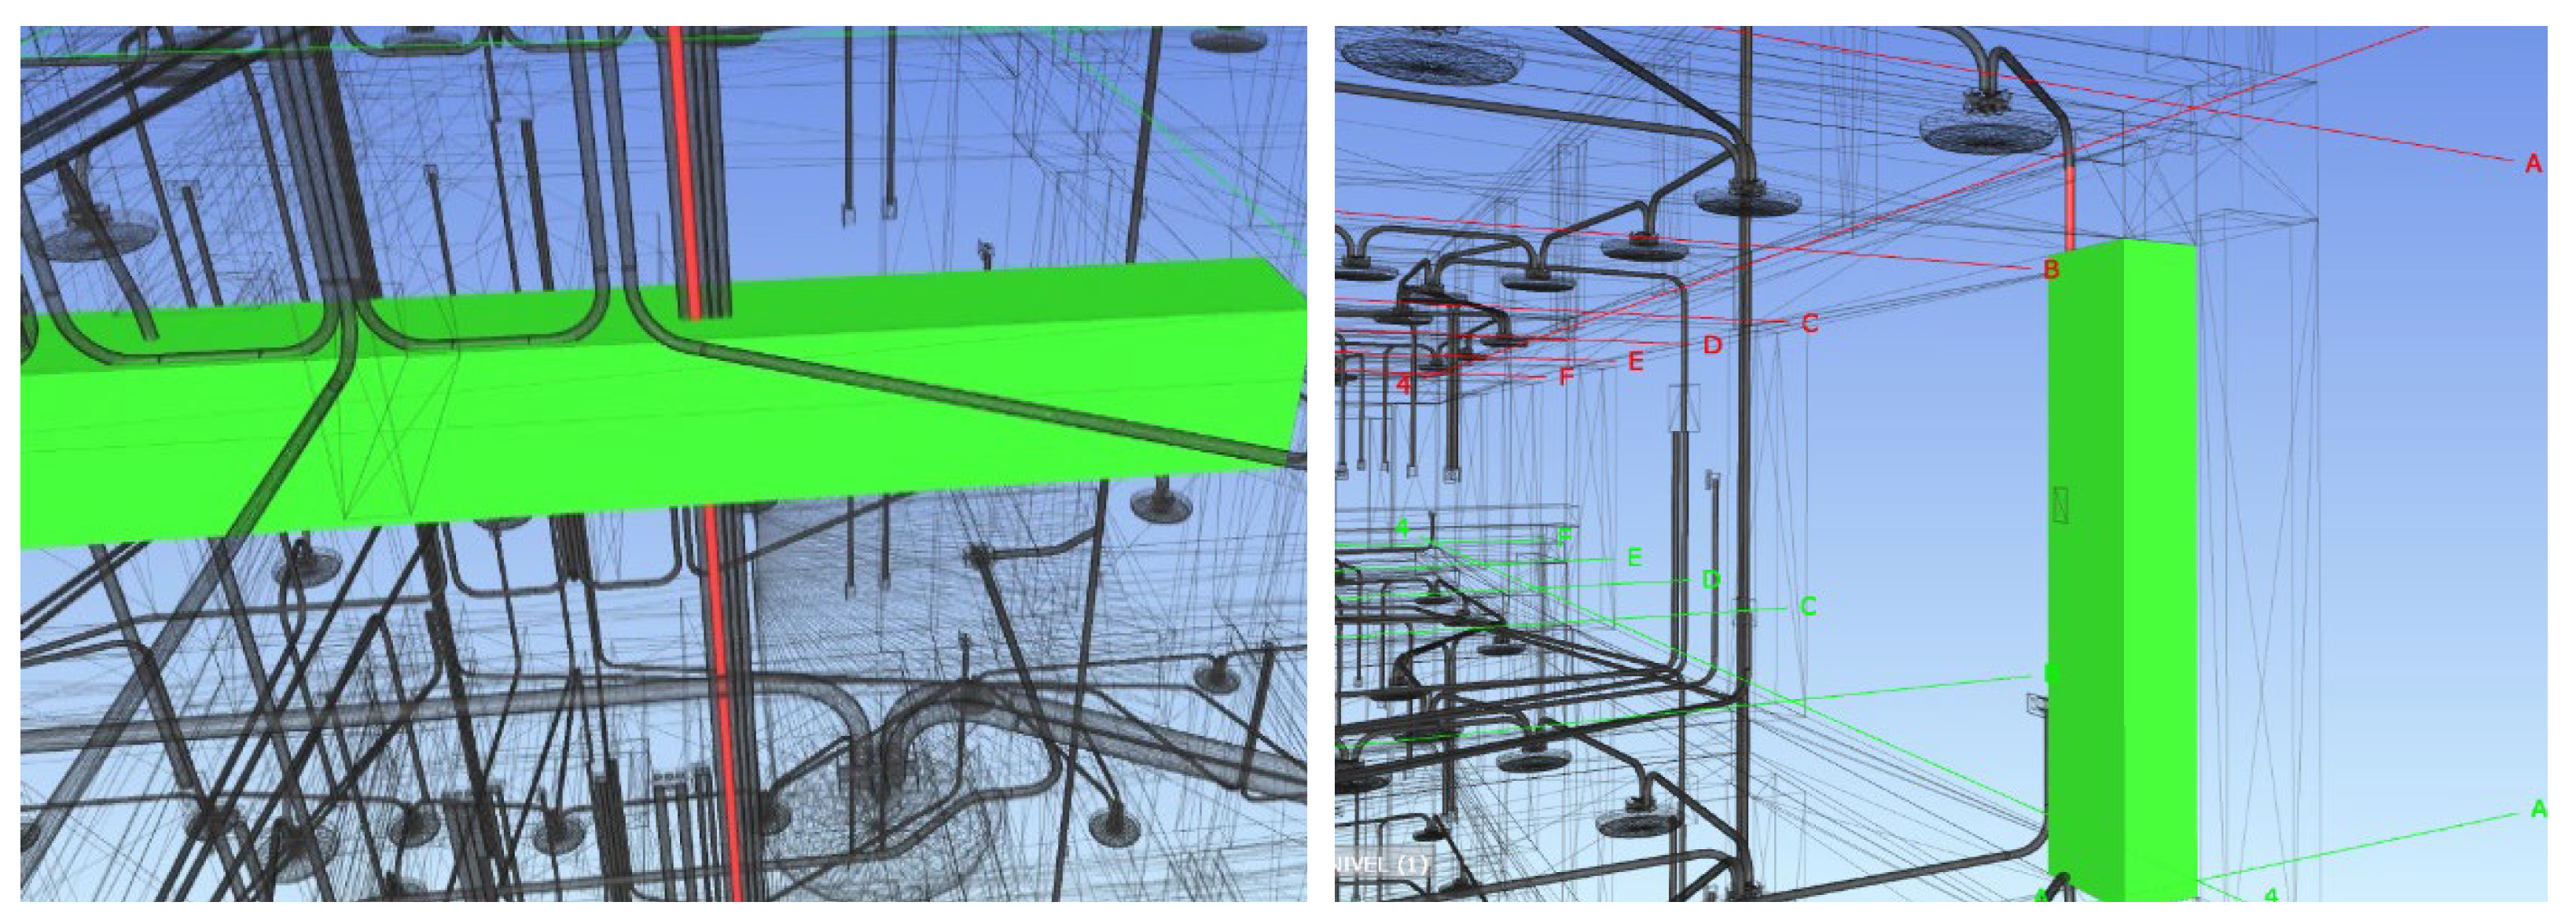
Figure 10.
Number and percentage of interferences by specialty.
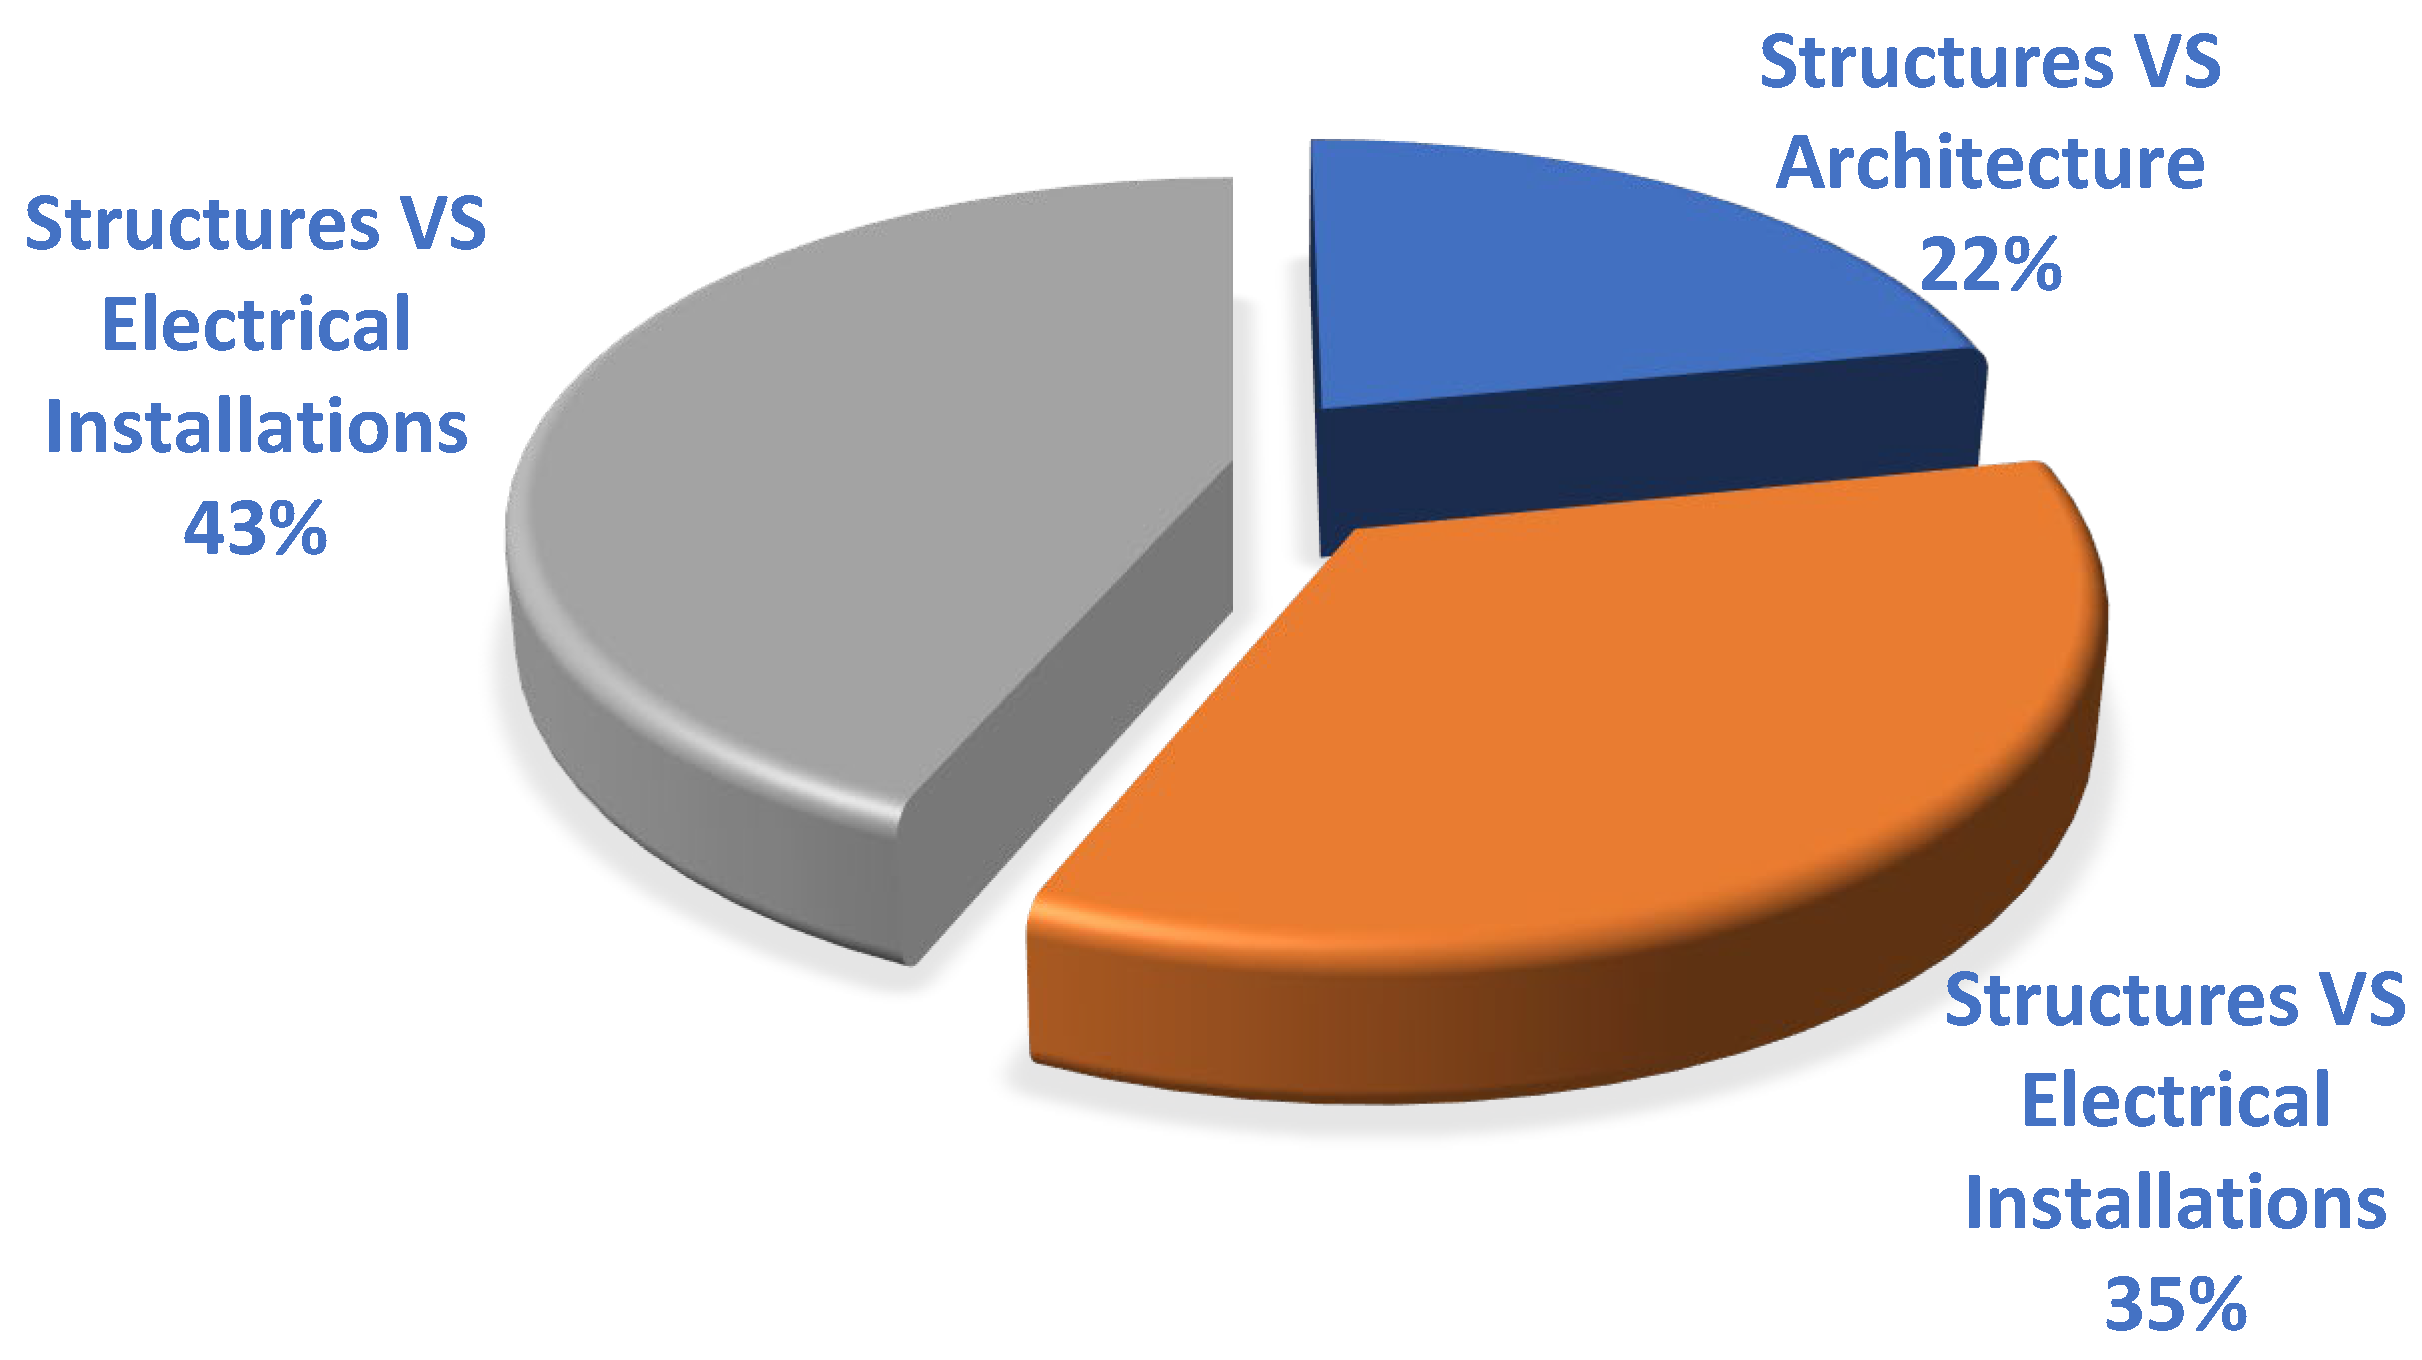
Figure 11.
Monthly sectoring – Specialty of structures.
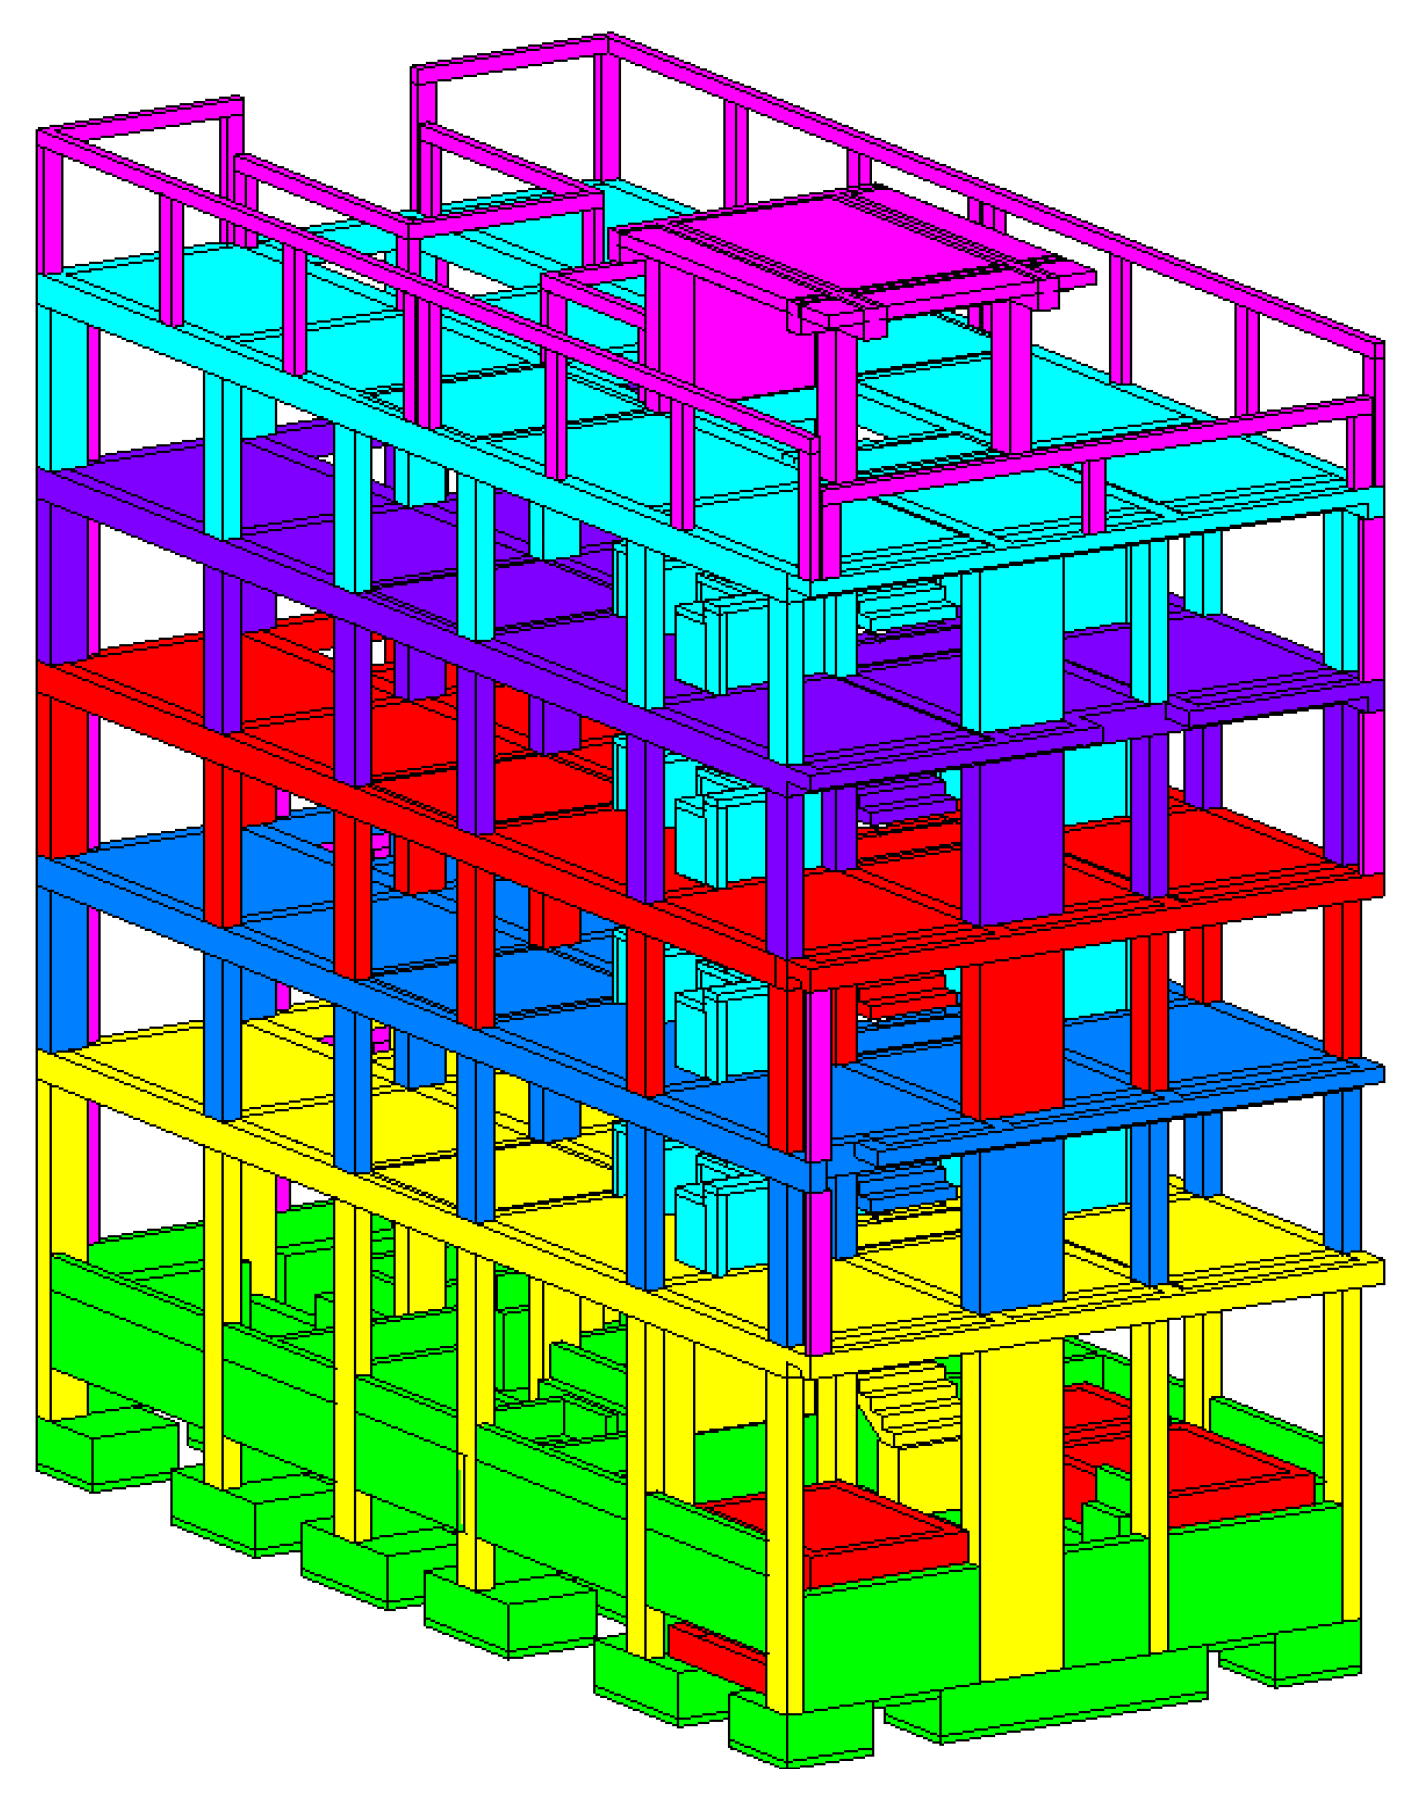
Figure 12.
Structural Specialty Costs.
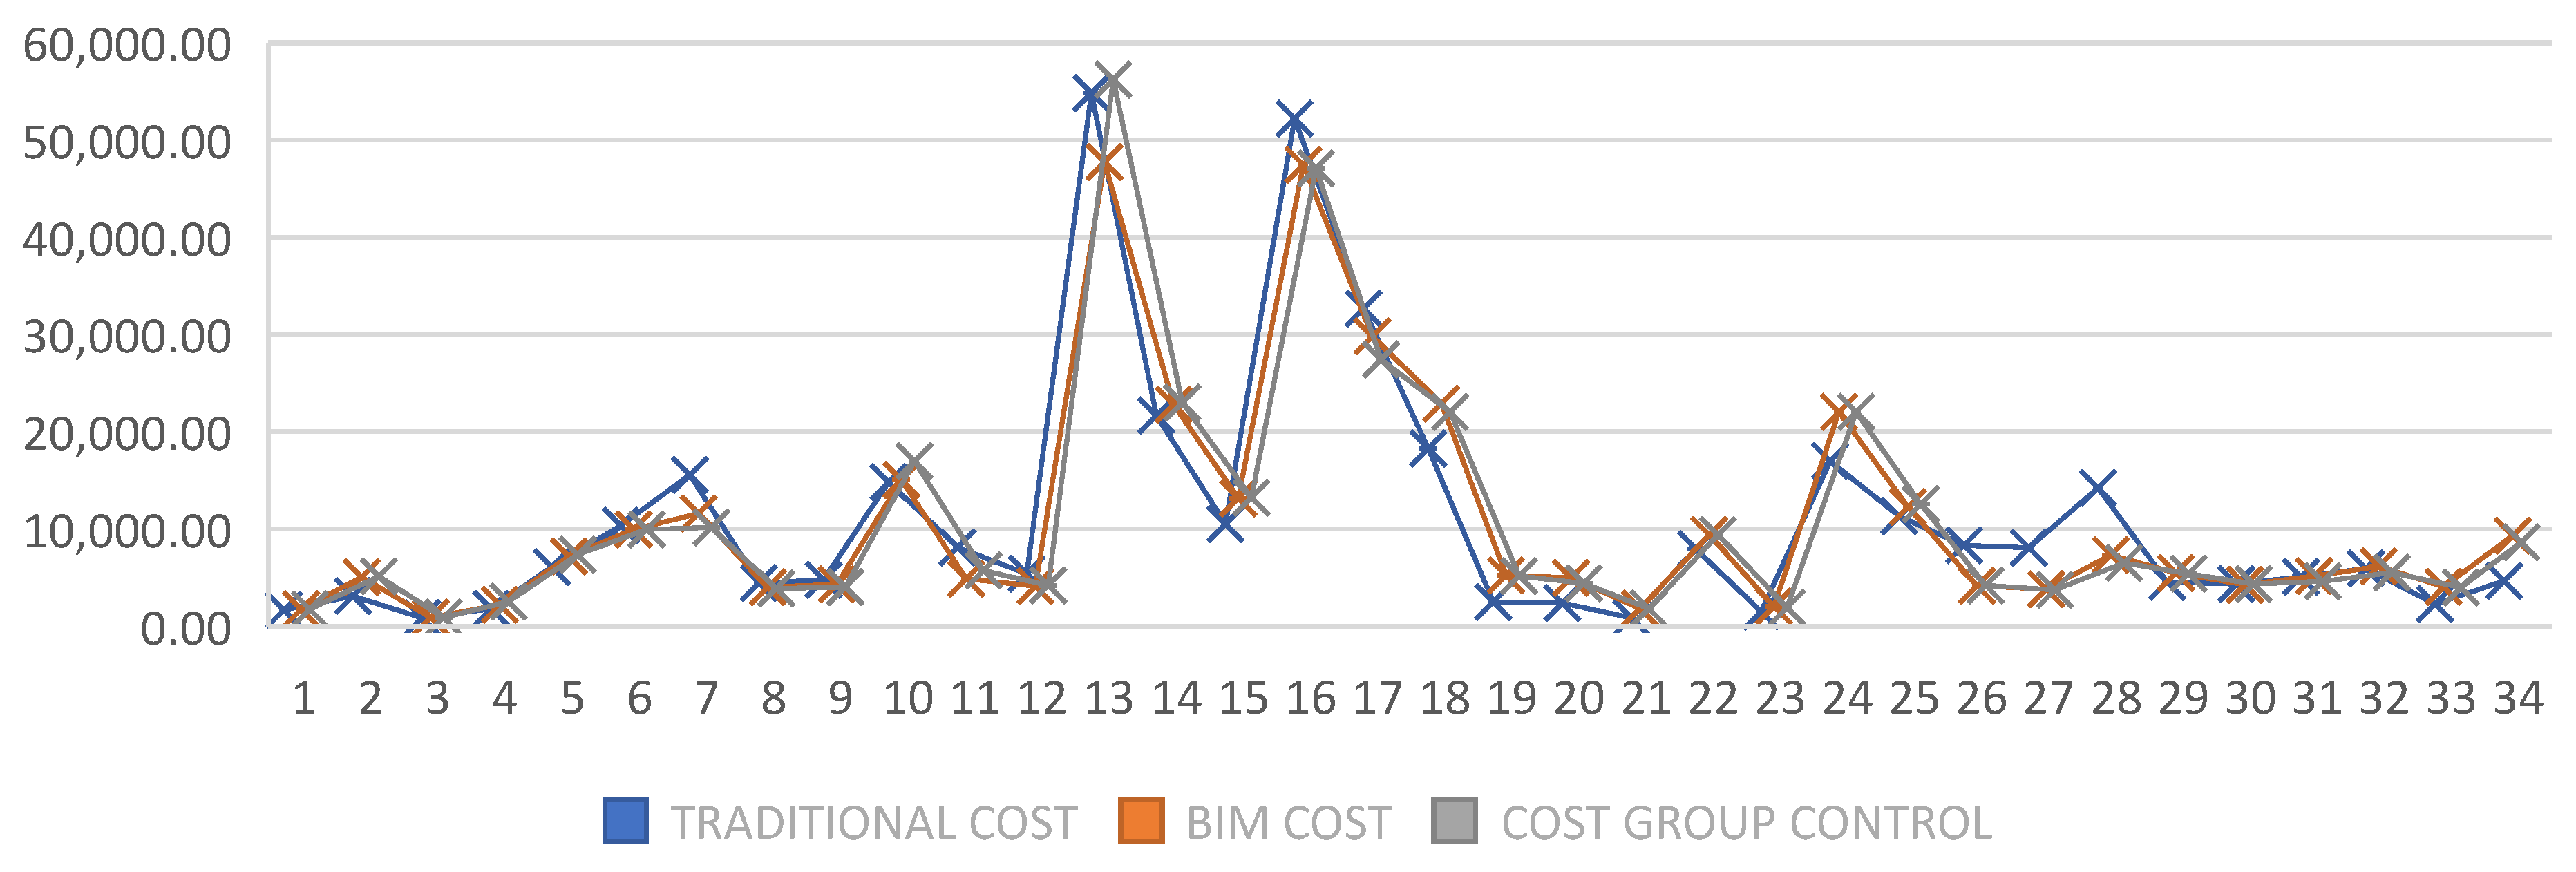
Figure 13.
Architecture Specialty Costs.
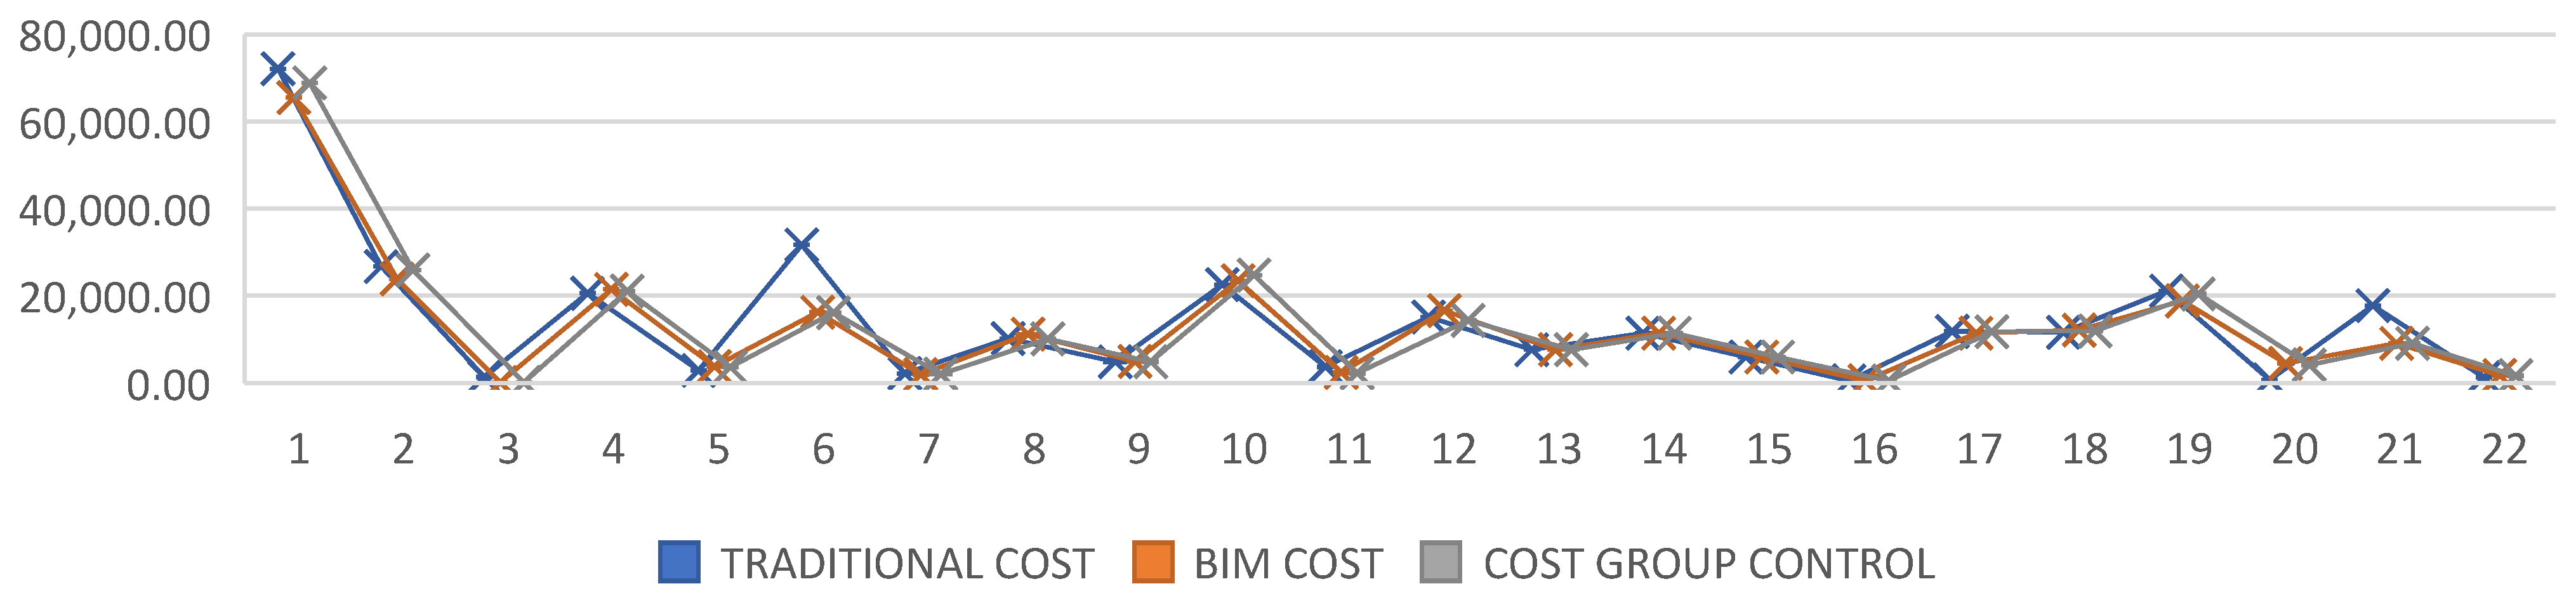
Figure 14.
Sanitary Installations Specialty Costs.
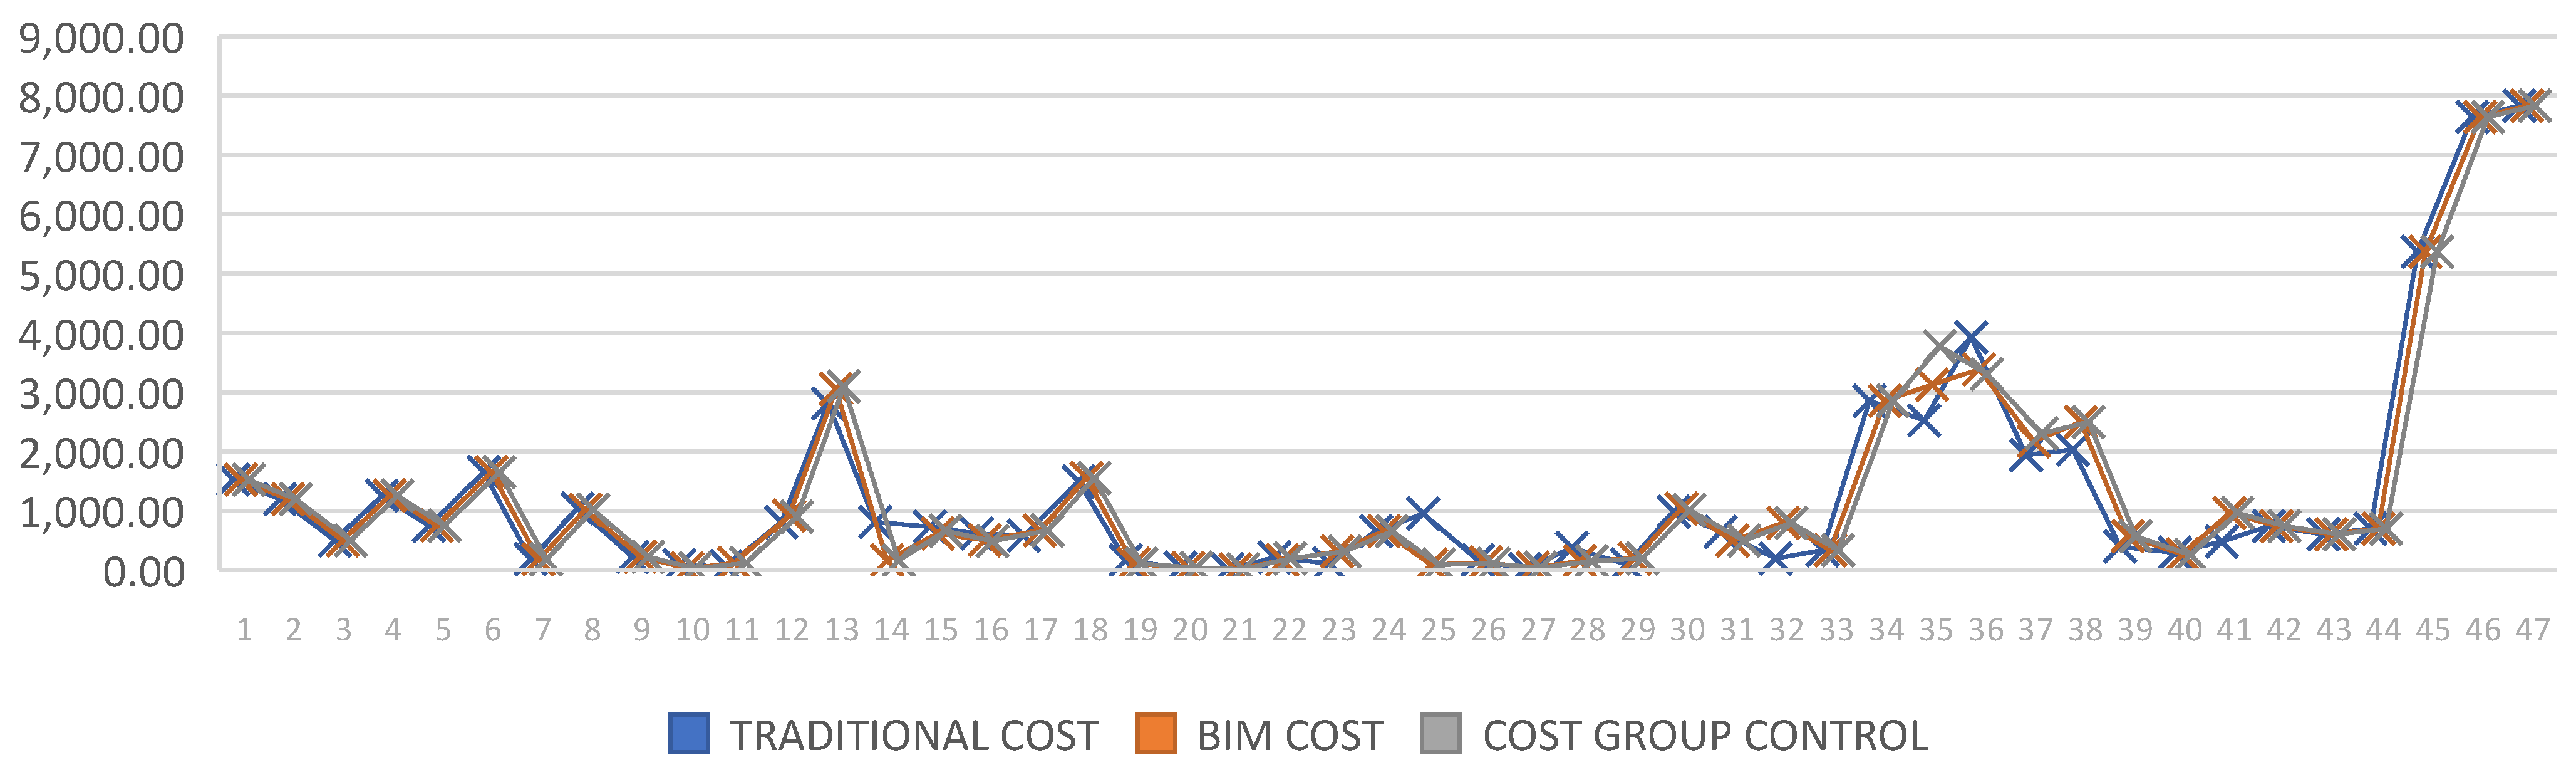
Figure 15.
Electric Installations Specialty Costs.
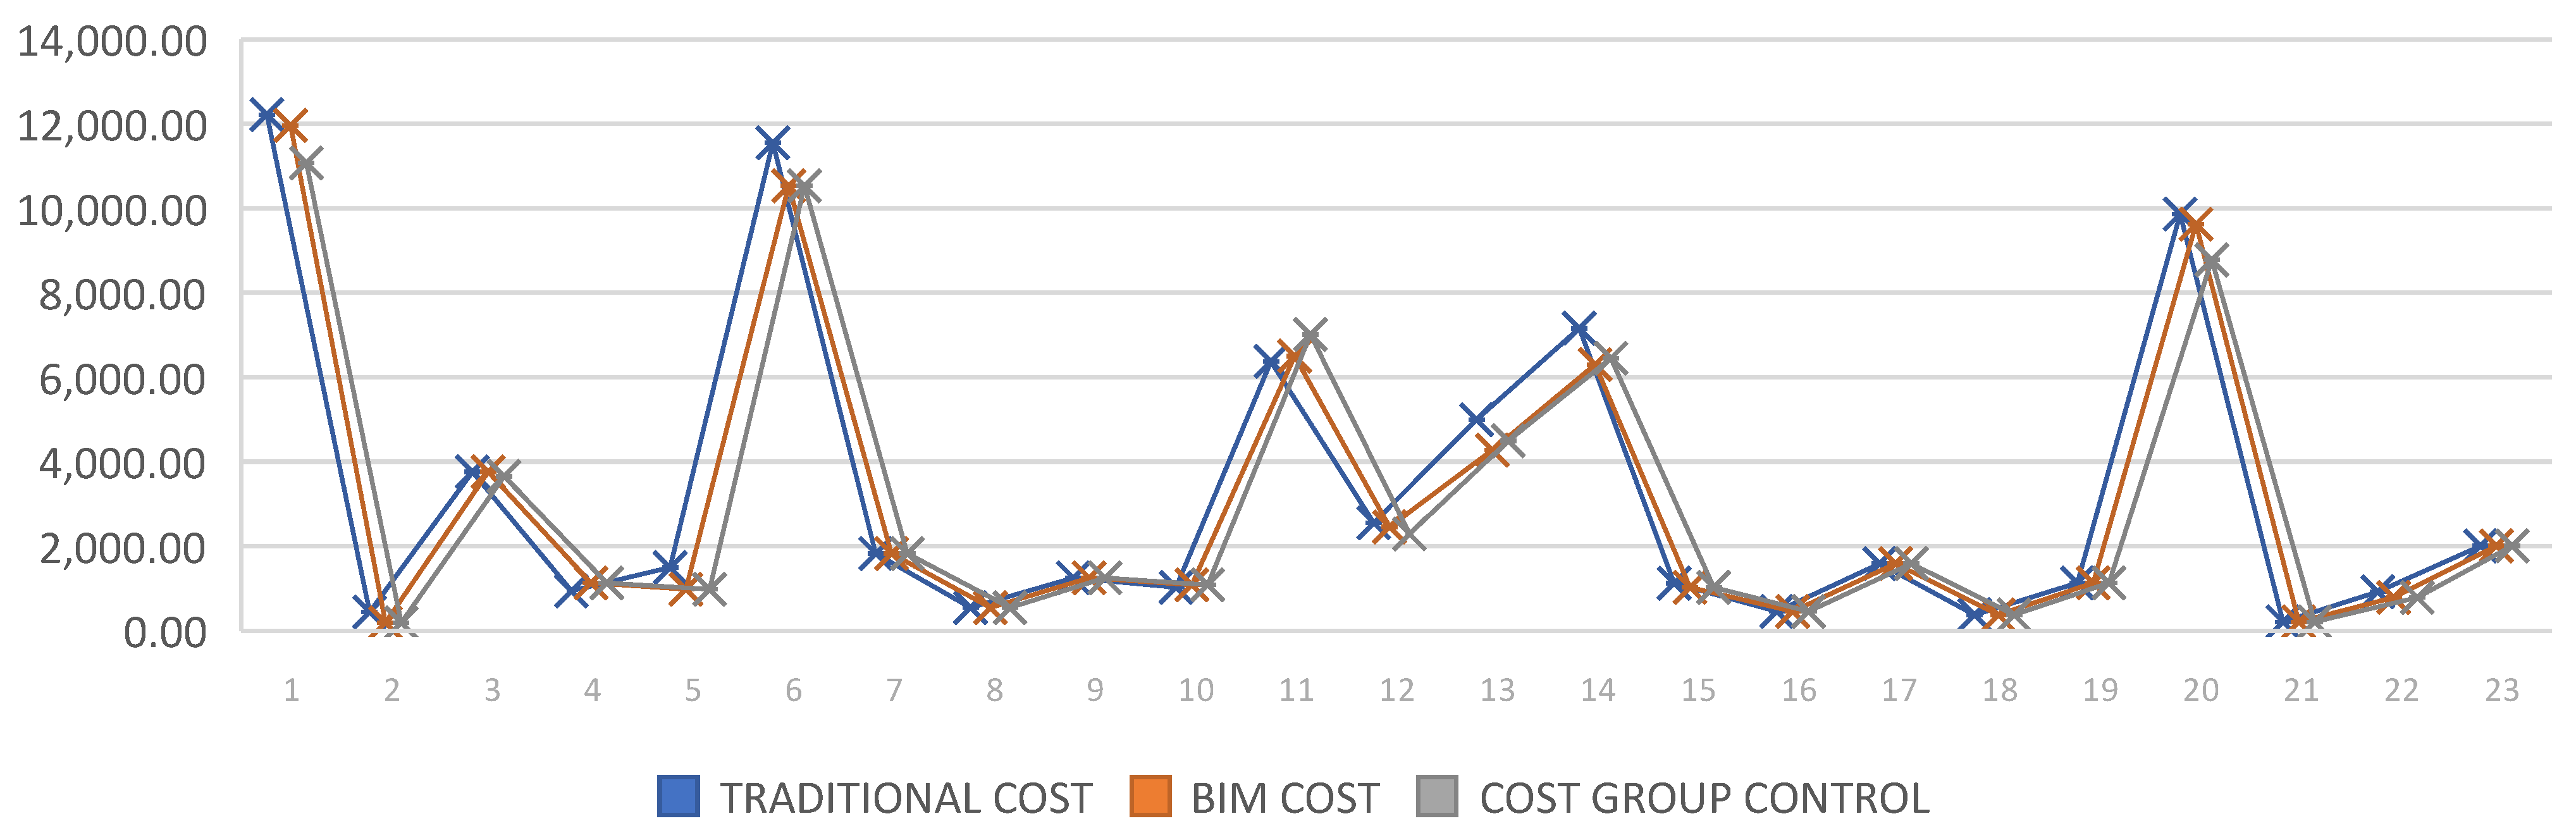
Figure 16.
Electric Installations Specialty Costs.
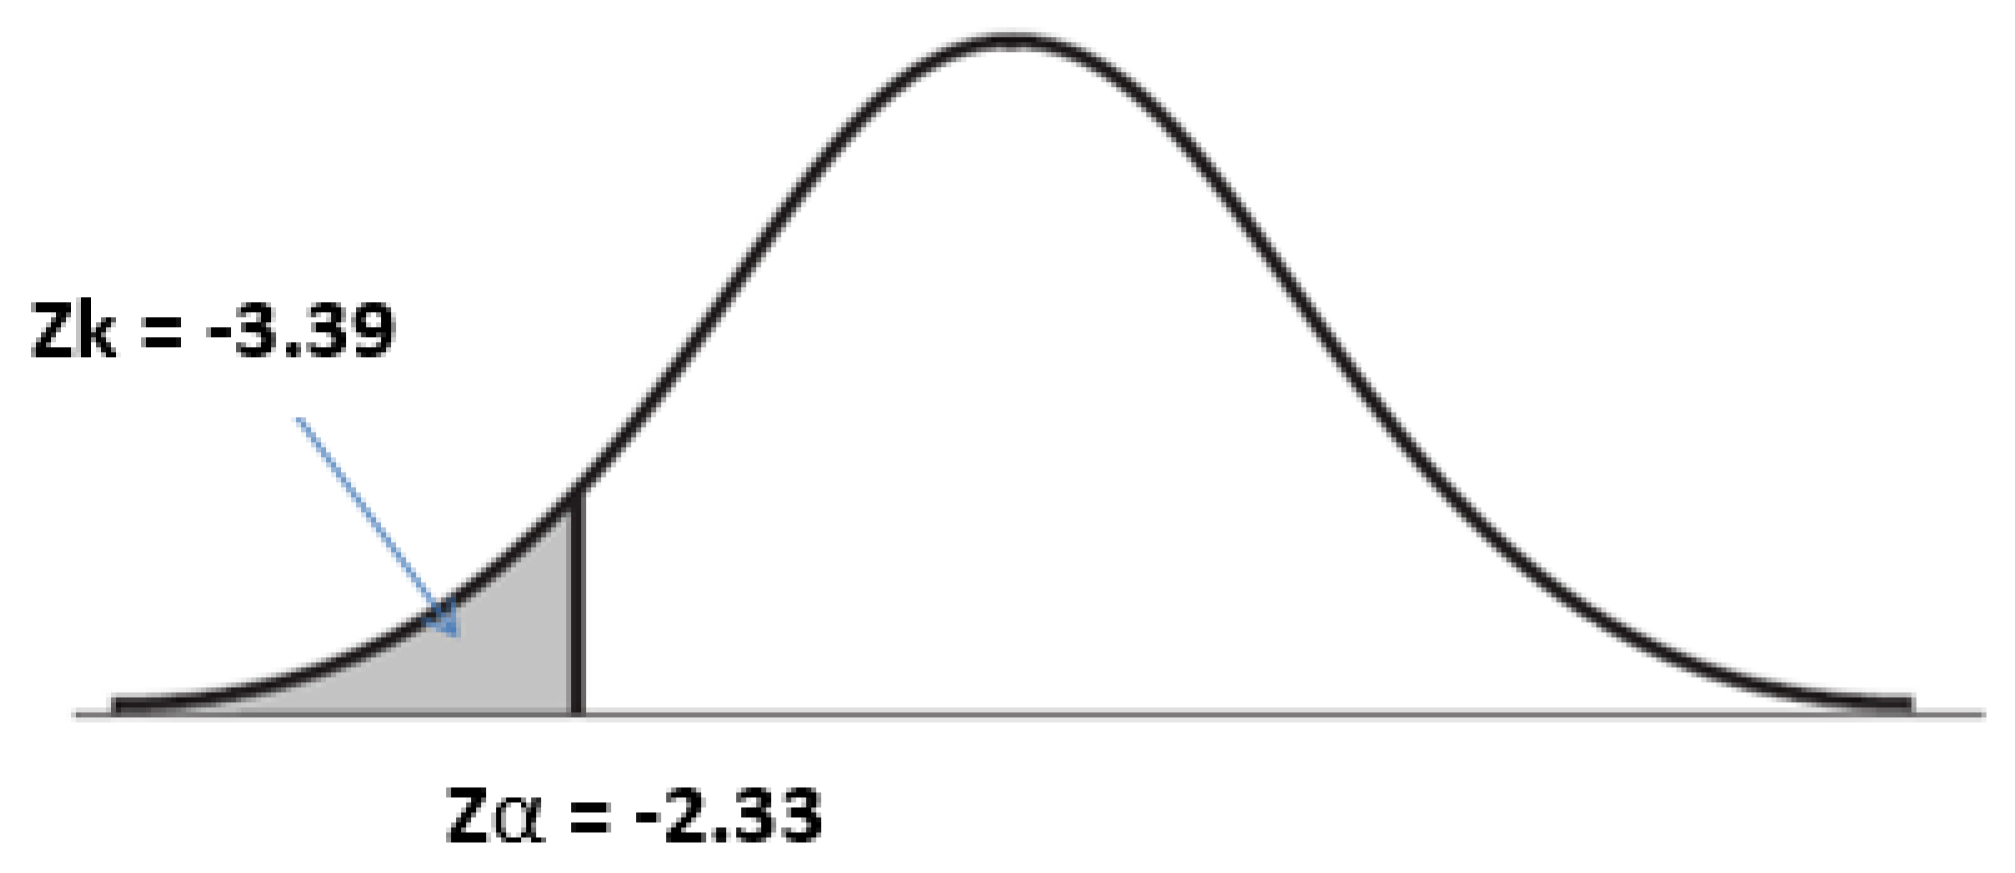
Table 1.
Relevant literature about IPD and BIM.
| Author | Importance or Relevance | Methods |
|---|---|---|
| Franz, et al. [19] | Analyzes how team integration and group cohesion influence project performance in the U.S., using different execution methods. | Surveys. |
| Laurent and Leicht [20] | Identifies organizational practices for the use of cross-functional teams in IPD projects in the USA. | Surveys, Case study. |
| Ling, et al. [21] | Examines the effect of the application of IPD practices on the performance of traditional projects in Singapore. | Case study, Questionnaires. |
| Buk'hail and Al-Sabah [2] | Examines the willingness to implement IPD in Kuwait's construction industry. | Literature review, Questionnaires. |
| Othman and Youssef [22] | Develops a framework for the implementation of IPD approach at the design stage for ADF in Egypt. | Literature review, Case study, Questionnaires. |
| Alqahtani et al. [23] | Investigates the bidding process and procurement regulation in Saudi Arabia for IPD implementation. | Literature review, Surveys. |
| Alinezhad et al. [24] | Identifies the benefits of implementing the IPD approach in U.S. building projects. | Literature review, Case study. |
| Ajmal and Rajasekaran [25] | Examines and compares Afghanistan's construction and engineering contracts with NEC4 ECC standardized contracts. | Literature review, Case study. |
| Yabar-Ardiles, et al. [26] | Examines and compares public building and construction contracts in Peru with the NEC4 ECC standardized contract. | Literature review, Case study. |
| Lau, et al. [27] | Identifies the challenges that hinder the widespread implementation of NEC in Hong Kong. | Surveys, Semi-structured interviews. |
| Khanna, Elghaish, McIlwaine and Brooks [15] | Investigate the viability of implementing IPD along with BIM and ICT in projects in India. | Literature review, Interviews. |
| Bravo and Mendoza [28] | Design an integration proposal to reduce the causes of losses in the design stage, using IPD and VDC tools in Peruvian projects. | Surveys, Case study. |
| El Asmar, et al. [29] | Examines the performance of IPD projects compared to non-IPD projects in the US. | Literature review, Surveys, Case study. |
| Mesquita, et al. [30] | Demonstrates the use of BIM for modeling and interference analysis on a project in Brazil. | Case study. |
| Dos Santos, et al. [31] | Analyzes how BIM methodology is used to ensure project compatibility in Brazil. | Case study. |
| Yañez [16] | Determines the challenges associated with the implementation of BIM in the design of healthcare projects in Peru. | Literature review, Case study, Interviews. |
| Akter, et al. [32] | Investigates and evaluates the impacts of using BIM as a construction management tool in Bangladesh. | Surveys, Case study. |
Table 2.
Objectives and Methods.
| Section | Objectives | Methods |
|---|---|---|
| 4.1 | To conduct a diagnosis on the management of residential building projects for the SME. | Analysis of management practices in SME residential building projects through documentation review and semi-structured interviews. Analysis of an SME residential project through documentation review and semi-structured interviews. Identification of typical issues in the SME. |
| 4.2 | to propose an optimization of the SME by integrating IPD and BIM. | Literature review on BIM and IPD tools that can be implemented to improve management and a description of their application. |
| 4.3 | To validate the proposal for optimization of IPD and BIM integration. | Validation statistical analysis via Z-test. Elaboration of a validation matrix for the implementation of improvement tools integrating BIM and IPD. |
Table 3.
Comparison of SME contract and NEC4 ECC tools and incentives.
| Indicator | SME Case Study Contract |
| Clarity and simplicity | Specifications |
| Number of clauses | The contract stipulates seven clauses. |
| Linguistic level | The contract primarily uses legal language. |
| Contract parties | The contract only mentions the Client, which is the SME, and the contractor. There is no direct mention of the other parties and their responsibilities under the contract; only the construction manager is mentioned in the sixth clause. |
| Stimulus for good management | Specifications |
| Payment | The contract establishes monthly appraisals as a form of payment. |
| Incentives | The contract does not stipulate any incentives for good practices on behalf of the contractor or other contract agents, only penalties for unjustified delays. |
| Communication systems | The contract does not mention any type of communication system or mechanism that requires the parties to make notifications through the contract. |
| Early warnings | The contract does not stipulate any early warning mechanism. |
| Conflict resolution | Two dispute resolution mechanisms are contemplated, conciliation or arbitration. |
| Risk allocation | The contract does not stipulate risk allocation. |
Table 4.
Interference per square meter.
| Data | |
| Roofed area (m2) | 617.87 |
| Interferences (No.) | 295 |
| Interferences (m2) | 0.48 |
Table 5.
Variation of items by specialty matrix.
| Specialty | Total items | P. with variation | P. without variation | Percentage | |
|---|---|---|---|---|---|
| P. with variation | P. without variation | ||||
| Structures | 34 | 34 | 0 | 100.00% | 0.00% |
| Architecture | 22 | 18 | 4 | 81.82% | 18.18% |
| Sanitary Installations | 47 | 28 | 19 | 59.57% | 40.43% |
| Electrical Installations | 23 | 13 | 10 | 56.52% | 43.48% |
| Total | 126 | 93 | 33 | 73.81% | 26.19% |
Table 6.
Item variation.
| Item | Und | Nº of Items | Percentage (%) |
|---|---|---|---|
| Total project items analyzed | und | 126 | 100.00% |
| Total items with variation | und | 93 | 73.81% |
| Total items without variation | und | 33 | 26.19% |
Table 7.
Comparison of total costs by specialty.
| Specialty | Traditional methodology | BIM Methodology | Difference |
| Structures | S/ 367,773.24 | S/ 362,032.92 | S/ 5,740.32 |
| Architecture | S/ 304,190.49 | S/ 275,158.84 | S/ 29,031.65 |
| Sanitary | S/ 58,642.92 | S/ 59,213.74 | -S/ 570.81 |
| Electrical | S/ 73,823.83 | S/ 69,987.36 | S/ 3,836.47 |
| Total | S/ 804,430.48 | S/ 766,392.86 | S/ 38,037.63 |
Table 8.
BIM and IPD implementation cost.
| Description | Quantity |
| Training Cost | S/ 4,247.36 |
| Modeling and management cost | S/ 4,350.00 |
| BIM and IPD implementation cost | S/ 8,597.36 |
Table 9.
Return on Investment Calculation (ROI).
| Description | Quantity |
| Direct Cost Adjustment with BIM | S/ 38,037.63 |
| BIM and IPD Implementation Cost | S/ 8,597.36 |
| Net income | S /29,440.27 |
| ROI | 342.43% |
Table 12.
Proposals for improvement and implementation.
| Proposed Tools | Problem to be solved | |||||||||
| P1 | P2 | P3 | P4 | P5 | P6 | P7 | P8 | P9 | ||
| H1 | Standardized Contract: NEC4 ECC | X | X | X | X | X | X | X | ||
| H2 | CDE – Trimble Connect | X | X | X | X | |||||
| H3 | Software: Revit and Navisworks | X | X | X | X | X | X | |||
| H4 | Work Teams | X | X | X | ||||||
| H5 | ICE Sessions | X | X | X | X | |||||
| H6 | 3D BIM Model | X | X | X | X | X | X | X | ||
| H7 | 4D BIM model | X | X | X | ||||||
| H8 | 5D BIM model | X | X | X | ||||||
Disclaimer/Publisher’s Note: The statements, opinions and data contained in all publications are solely those of the individual author(s) and contributor(s) and not of MDPI and/or the editor(s). MDPI and/or the editor(s) disclaim responsibility for any injury to people or property resulting from any ideas, methods, instructions or products referred to in the content. |
© 2024 by the authors. Licensee MDPI, Basel, Switzerland. This article is an open access article distributed under the terms and conditions of the Creative Commons Attribution (CC BY) license (http://creativecommons.org/licenses/by/4.0/).
Copyright: This open access article is published under a Creative Commons CC BY 4.0 license, which permit the free download, distribution, and reuse, provided that the author and preprint are cited in any reuse.


