Submitted:
29 October 2024
Posted:
30 October 2024
You are already at the latest version
Abstract
This report summarizes the findings of a deep retrofitting modelling study of four government buildings across the UAE. Buildings envelope assessment, HVAC, and electrical systems design, installed conditions, maintenance practices and operation methods, and rigorous engineering analysis has been performed for the four buildings to produce calibrated energy models that confirm a good correlation between actual annual energy consumption and advanced simulated energy modeling results. IES-VE software, ASHRAE Guideline 14, and IPMVP were the basis of the energy model calibration based on actual data. Energy retrofitting options were applied to the calibrated energy models of the four government buildings where advanced computational modeling studies have been utilized to analyze different thermal envelope components and external fabric energy efficiency measures in conjunction with the actual HVAC systems. The results have shown that it may be financially challenging to implement a single envelope retrofitting measure on any of the four buildings due to high payback periods. Nevertheless, when conducting an optimization through a holistic building approach targeting the overall envelope enhancements, the financial modeling results provide significantly improved and provide reduced payback periods of the solutions, making them more attractive to investors. Based on the energy modeling results and the cost of the various proposed building envelope solutions provided by Saint-Gobain, the payback period in all cases varies between 15 to 20 years. However, huge savings in terms of carbon emissions are achieved by implementing the deep retrofitting measures, crucial to achieving carbon neutrality within the UAE built environment. Deep retrofitting is a promising segment of the execution roadmap as part of the UAE's decarbonization journey; even though it is capital-intensive upfront, it has a major impact on long-term operational savings. Moreover, it is often more cost-effective than building new and energy-efficient structures from scratch. The findings indicate that deep retrofitting can be a techno-financially viable solution if it is well-planned during major refurbishment or as part of building maintenance. It has significant potential to reduce carbon emissions while also providing a range of benefits such as operational cost savings, improved thermal comfort – a feature which has a direct impact on perceived efficiency and productivity at work, indoor air quality, improved asset value, reputational enhancement, and better choice for environmentally-cautious tenants or buyers.
Keywords:
Building retrofit
; energy consumption
; carbon emissions
; Government buildings
; UAE
; IES software
1. Introduction
Due to human activities, the earth surface is currently experiencing an increase in temperature caused by the greenhouse effect, leading to climate change. Thus, there is an urgent need to address this environmental problem by reducing greenhouse gas emissions [1]. The building sector generates 40% of annual CO2e emissions globally [2]. Therefore, this sector must take immediate action to reduce such emissions. Energy efficiency has a big role to play in tackling climate change and delivering various beneficial solutions while satisfying occupant needs and requirements. Existing building retrofit can achieve energy efficiency by adding and replacing building components so that the building can perform better. Identifying the cost-effective retrofit measures is a technical challenge [3]. However, the retrofit market offers many opportunities worldwide. Even if United Arab Emirates (UAE) is leading the reduction of emissions in the region, UAE is still one of the highest countries in terms of environmental emissions and per capita energy consumption [4]. Reducing the energy demands of the UAE building sector is of utmost importance. There are many existing building retrofit projects currently underway in the UAE. A study [5] indicated that simple technologies such as lighting, better glazing, good insulation and more efficient heating, ventilation and air-conditioning (HVAC) systems could considerably lower the CO2 emissions. Another study confirmed that existing building retrofitting procedures could reduce energy consumption by 57% [6]. Consequently, the aim of this paper is a deep retrofitting study of government buildings in the UAE. In order to fulfill the overall aim, the following steps were taken: (1) reviewing the literature to identify gaps (2) choosing four government buildings in the UAE to act as case studies (3) applying some retrofit strategies (4) simulating the case study models by using Integrated Environmental Solutions (IES) to analyze the impact of a building retrofit (5) making recommendations for the future.
2. Literature Review
2.1. Building Retrofit
Researchers have defined passive retrofit as a process focusing on minimizing heat loss or heat gain through the building envelope by reducing thermal conductivity, while concurrently enhancing the building’s airtightness in order to reduce energy consumption [7]. Similarly, the active building retrofit process focuses on the operational components of the building such as HVAC. One study [8] confirmed that the use of both active and passive building retrofit measures including glazing replacement, wall insulation and recovery system enhancement, could achieve a 53% reduction in energy demand in Swedish residential buildings. Recently, many international organizations and governments have made significant efforts with regard to improving energy efficiency and retrofitting existing buildings. For instance, the US government has allocated a substantial amount of financial assistance to support existing building retrofits [9]. In the UAE, many of the buildings have been designed unsuitably for the region in that it is located in a harsh and hot climatic zone. Due to inappropriate design parameters of the pastl, most of the buildings suffer from extreme cooling load and a high energy consumption [10]. However, one study confirmed that in a hot climatic zone, insulation plays a big role and has more impact on lowering the electricity demand compared to external shading measures [11]. Building retrofit has an economic benefit, which shows the payback period is usually prepared as a common indicator [12] but due to Climate Change pledges, carbon has also a priority considering investments. A study conducted in Abu Dhabi indicated that the optimal features of a residential building is a cool roof and walls, in conjunction with shading, which can lead to a total energy saving of 25% [13]. Table 1 illustrates the recent studies relating to building retrofit.
Moreover, studies have shown that retrofitting buildings, externally or internally, when using the right solutions can improve the occupant’s health and well-being. A study carried out on a retrofitted office building in the U.S. [22] showed strong correlations between improved visual, acoustical, and indoor air qualities of the retrofitted building and improved employee’s productivity and satisfaction.
2.2. Saint-Gobain Passive Energy Efficiency Measures
The passive retrofitting measures considered in this study are focused on optimizing the thermal performances of existing envelope systems such as roofs and façades of commercial buildings. It also focuses on reducing air infiltration and thermal bridging due to bad workmanship and the poor insulation levels of existing systems. In terms of the external visual façade, it aims at optimizing the solar factor, thermal performance and weatherproofing by installing correctly-performing glazing systems or by adding protective solar films.
2.2.1. External Walls and Roofs
Table 2 lists the different Saint-Gobain passive retrofitting measures for the external walls and roofs applied to the base case.
2.2.2. Solar Films
Given the harsh climate of the UAE and the high solar irradiance levels, a good cost-effective option to consider when retrofitting the existing glazing of the buildings would be the installation of solar films on the internal part of the glazing assembly in order to reduce the Shading Coefficient (SC). Two options were considered in this study, SolarGard Sterling-40 (SHGC of 0.3) and SolarGard Silver-20 (SHGC of 0.22).
2.2.3. External Glazing Systems
Table 3 summarizes the glazing areas per orientation of all buildings as extracted from the IES Model.
Table 4 below lists the different double-glazing units considered, together with the description and specifications.
2.2.4. Reduced Air Leakages
The airtightness of the building is improved as a result of the post deep retrofit measures if the installation is correctly carried out as per the technical guidelines and detailed drawings of the solutions implemented. In addition to enhancing the thermal performance, the objective of retrofitting the building envelope is to close any cracks and seal all weak points and air leakages following the implementation of the different façade solutions, leading to a reduced airtightness. Based on the literature, the airtightness of the retrofitted buildings considered in this study is estimated at 2 m3/m2hr at 50Pa in the modelling parameters.
The overall tightening and sealing of the building envelope will decrease the cooling load within the conditioned space due to lower infiltration rates. This will lead to reduced HVAC operating hours and a reduced total cooling energy consumption. Moreover, reducing infiltration rates will influence the flow of air recirculating within the spaces, the operating hours of the HVAC fans, and thus annual fan energy consumption.
Since the infiltration will decrease, the quantity of conditioned air will reduce respectively. Variable Frequency Drives (VFD) will be installed on the air side equipment to reduce fan speed during off-peak conditions. In addition, the quantity of fresh air will decrease, since the building will be positively pressurized. These VFDs will need to be connected to the Building Management System and dedicated control panels will be required, the implementation of which will be expensive.
3. Research Methodology
3.1. Research Approach
The four UAE governmental buildings selected were the Ministry of Public Works office building in Fujairah (Case 1), the Ministry of Energy and Infrastructure in Dubai (Case 2), the Ras Al Khaimah Municipality Department building (Case 3) and finally the Khorfakkan Municipality building (Case 4). See Figure 1. Based on the architectural layouts provided, HVAC, and electrical systems design, installed conditions, maintenance practices, and operation methods, a rigorous engineering analysis has been performed for the four buildings in order to produce calibrated energy models that confirm a good correlation between actual annual energy consumption and advanced simulated energy modeling results. The outcome of the buildings’ energy auditing and data collection has been provided for the KEO’s Energy Simulation team for validation, and in order to perform extensive energy modeling simulations. IES-VE software is selected for this analysis due to its capabilities and its ability to obtain different time base results for each of the buildings. ASHRAE Guideline 14, and IPMVP were the basis of the energy model calibration which is turn are based on actual data. As a final step, energy retrofitting options are applied to the calibrated energy models of the four government buildings, with advanced computational modeling studies being utilized to analyze different thermal envelope components and external fabric energy efficiency measures. The energy retrofit options have considered Saint-Gobain building envelope solutions which support the optimized thermal performance of external walls and roofs, better performing glazing systems, enhanced building airtightness solutions, and reduced infiltration. The effectiveness and feasibility of the suggested energy retrofit measures are evaluated based on annual energy reduction, financial assessment, and potential carbon abatement. Therefore, a Basket of Solutions approach has also been considered whereby a combination of various building envelope solutions is assessed as a single solution. One of the benefits of improving the building fabric and the external envelope including the roof, external walls, and glazing, is the significant reduction of air leakages that may result from the use of traditional construction techniques. The financial modeling results of the overall envelope enhancements provide a significant reduction in the payback periods of the solutions. This makes them more attractive to investors. Based on the energy modeling results and the cost of the various proposed building envelope solutions, which includes also the cost of full installation costs, provided by Saint-Gobain, the payback period in all cases varies between 15 and 20 years. Table 5 summarizes the Overall Envelope Enhancement Solution proposed for each building, the associated payback period of the investment, and the potential reduction in operational carbon emissions.
NOTE ‘..Municipality..’ AND ‘..building..’ IN CASE 4
3.2. Simulations Model Set-Up
Integrated Environment Simulation (IES) VE is a fast, accurate, sub-hourly, thermal simulation suite that can model new and existing buildings of any size and complexity. The simulation program complies with ASHRAE 140-2017 standards. It can model heating, cooling, ventilation, lighting, and water consumption using a state-space method (the thermal load of the building is simulated using a heat balance method). Each building was modelled in IES VE according to as-built drawings that is collected from the owners of the building. Four main steps were followed to set up each building. First weather files were set up through APlocate based on the weather file for each building location. The “ARE_FU_Fujairah – 2.epw” weather file has been used for Case 1 while the “ARE_DU_Dubai.Intl.AP.411940_TMYx.epw” weather file has been used for Case 2, the “ARE_RK_Khaimah.Intl.AP.epw” weather file has been used for Case 3, and the “ARE_FU_Fujairah – 2.epw” weather file has been used for Case 4.
Secondly, envelope parameters were set up: these include the type of glass, and the U-value of wall, roof and glazing. To define the envelope parameters, a construction template was created in the building templet manager. Thirdly, the mechanical, electrical and pumping systems load were set up: these were defined in the thermal conditions’ icon. LPD, receptacle, equipment, and elevators (when applicable) loads were defined as per each building data, along with the infiltration rate, fan power (when applicable) and cooling set-points (as recorded). In a situation in which some properties are missing, values of a similar government buildings and of a similar age has been assumed. When this isn’t possible, ASHRAE 90.1 is referred to. Fourthly, setting up operational details such as building operation timing was done by creating a thermal profile on a daily, weekly and annual basis on APpro, and determining occupancy details according to the actual data.
3.3. Methodological Map
An energy audit and the calibrated energy simulations have followed the methodology prescribed in ‘ASHRAE Standard 211-2018’ and in the ASHRAE publication ‘Procedures for Commercial Building Energy Audits’. The project followed a four-phase approach to deliver the project outcomes. Phase 1: Data Validation. Phase 2: Energy Model Calibration. Phase 3: Retrofit measures analysis for energy and carbon performance with return on investment (ROI). Phase 4: Basket of Iterations Solution. Figure 2 illustrates the methodological map.
3.4. Calibration
The models are ‘whole-building models’ of pre-retrofit conditions. They are calibrated and checked against actual measured energy use (monthly) and demand data, and other operating data.
The comparison between simulated and actual metered data is carried out to determine the accuracy of the analysis. The calibrated energy model is within the error tolerance specified in ASHRAE Guideline 14 – Measurement of Energy and Demand Savings, the International Performance Measurement and Verification Protocol (IPMVP), and the Federal Energy Management Program (FEMP). Figure 3 compares the energy model and the actual energy consumption profile of the building of Case 1. Figure 4 compares the energy model and the actual energy consumption profile of the building of Case 2. Figure 5 compares the energy model and the actual energy consumption profile of the building of Case 3. Figure 6 compares the energy model and the actual energy consumption profile of the building of Case 4.
The Coefficient of Variation of the Root Mean Square Error (CV RMSE) and Normalized Mean Bias Error (NMBE) of the results in comparison to industry standards are as shown below.
where:
yi is the measured value
is the simulated value
n is the sample size – 12 simulated months
p is the number of adjustable model parameters (as per ASHRAE Guideline 14 – for calibrated simulations, considered as 1 for CV RMSE, and 0 for NMBE)
is the mean of measured values.
4. Results and Analysis
Following the extensive assessment, data validation and calibration of the energy models for the 4 simulated buildings, various options with regard to passive energy efficiency measures have been implemented to study the potential energy and carbon reduction, in addition to the associated ROI. The measures consist of using Saint-Gobain external envelope solutions which support the optimized thermal performance of walls and roofs, better performing glazing systems, enhanced building airtightness solutions, and reduced infiltration and thermal bridges. For the different passive retrofitting measures, the associated costs consist of the cost of material and the provisional installation cost.
4.1. Assumptions and Measured Parameters
4.1.1. Electricity Tariffs
The electricity tariffs considered in this study are summarized in Table 6.
With regard to the increase in electricity tariffs in the different Emirates, the assumption was for a 5% increase per annum over a 5-year period in all cases.
4.1.2. Carbon Reduction
Due to the need for action aimed at reducing the impact of climate change, and in line with the UAE’s efforts to achieve carbon neutrality by 2050, energy efficiency has become a strong driver, and the first pillar of any decarbonization strategy. In this study, carbon emission savings associated with all the retrofitting measures are predicted based on the savings in the total annual energy consumed, and on a grid emission factor of 0.4041 tCO2/MWh. The latter represents the grid emission factor for 2020 as estimated by DEWA.
4.1.3. Simple Payback Period and Annualized Return on Investment
Energy conservation retrofits may be deemed cost-effective based on predictions of post-retrofit energy and cost savings. The estimate of the retrofit energy savings can be obtained by simply comparing the actual energy consumption before and after the retrofit. For both the payback periods and the ROI, consideration is given to a building life expectancy of 50 years as indicated in Dubai Building Code 2021.
Simple payback time is defined as the number of years when money saved after retrofitting will cover the investment.
ROI is a performance measure used to evaluate the efficiency or profitability of an investment, or to compare the efficiency of several different investments. It measures the amount of return on a particular investment, relative to the investment’s cost. It is calculated using the following formula:
The annualized rate of ROI is a process for determining investment returns on an annual basis. It is used when a particular investment is compared with the annual returns of other more conventional types of investment.
where n is the number of years investment is held (assumed to be 50 years in this study).
4.2. Individual Retrofitting Measures
Based on the calibrated model result and the simulations of all the suggested retrofit measures, the annual energy reductions, payback periods, annualized ROI, and carbon emission reductions are projected for each of the retrofit measures applied to the buildings considered in this study.
It is important to note that, for each case, the results are specific to the building modeled and are impacted by the base case performance and the areas and orientations of the different building envelope elements.
4.2.1. Case 1 – Ministry of Public Works Office Building (Fujairah)
External walls and roofs
The results of the calculations detailed in Table 7 show that energy savings are the highest for the lowest Uvalue in both external wall and roof iterations. Nevertheless, the best iteration, when considering the associated retrofitting cost, is the roof which has the highest Uvalue iteration (0.3 W/m2.K) giving the shortest payback period (14 years) and the highest annualized ROI (3.1%). For the external walls, given the area and the already existing level of insulation, longer payback periods are achieved. The potential annual carbon emission reductions vary from 7 to 12 tCO2 per annum.
Glazing
When comparing the results of the 2 different solar films modelled, the one with the lowest SHGC (0.22) gives the highest annual energy savings of 1.12% with the best payback period of around 7 to 8 years with a high annualized ROI reaching 4.2% (see Table 8).
Regarding the high-performance glazing iterations, the projected annual energy savings can reach up to 4.68% for the best performing glazing with a payback period of around 17 years and an annualized total ROI of 2.6% over a building life of 50 years. The potential carbon emission reductions vary from 17 to 25tCO2 per annum.
4.2.2. Case 2 – Ministry of Energy and Infrastructure Building (Dubai)
External walls and roofs
The results of the calculations detailed in Table 9 show that energy savings are the highest for the lowest Uvalue in both external wall and roof iterations. Nevertheless, the best iteration when considering the associated retrofitting cost is the roof with the highest Uvalue iteration (0.3 W/m2.K) giving the least payback period of 10 years and the highest annualized ROI of 3.6 % (see Table 9). With regard to the external walls, given the area and the already existing level of insulation, longer payback periods are achieved. The potential carbon emission reductions vary from 11 to 49 tCO2 per annum.
Glazing
When comparing the results of the 2 different solar films modelled, the one with the lowest SHGC (0.22) gives the highest annual energy savings of 3.12%, with the best payback period of around 9 years with a high annualized ROI reaching 4.1% (See Table 10).
Regarding the high-performance glazing iterations, given that the building is highly glazed, the projected annual energy savings can be as high as 7.76% for the best performing glazing, with a payback period of around 27 years and an annualized total ROI of 1.5% over a building life of 50 years. The associated savings in terms of carbon emissions are huge and can reach up to 105 tCO2 per annum.
4.2.3. Case 3 – Ras Al Khaimah Municipality Building
External walls and roofs
The results of the calculations detailed in Table 11 show that energy savings are the highest for the lowest Uvalue in both external wall and roof iterations. Nevertheless, the best iteration when considering the associated retrofitting cost is the roof with the highest U-value iteration (0.3 W/m2.K) giving the least payback period of 9 years and the highest annualized ROI of 4 % (see Table 11). For the external walls, given the area and the already existing level of insulation, longer payback periods are achieved. The potential carbon emission reductions vary from 11 to 49 tCO2 per annum.
Glazing
When comparing the results of the 2 different solar films modelled, the one with the lowest SHGC (0.22) gives the highest annual energy savings of 2.63% with the best payback period of around 8 years with a high annualized ROI reaching 4.4% (See Table 12).
Regarding the high-performance glazing iterations, the projected annual energy savings can be as high as 9 % (annual carbon emission reduction of 61 tCO2) for the best performing glazing with a payback period of around 18 years and an annualized total ROI of 2.4% over a building life of 50 years.
4.2.4. Case 4 – Khorfakkan Municipality Building
External walls & roofs
The results of the calculations detailed in Table 13 show that energy savings are the highest for the lowest Uvalue in both external wall and roof iterations. The best iteration when considering the associated retrofitting cost is the roof with the lowest Uvalue iteration (0.15 W/m2.K) giving the least payback period of 20 years and the highest annualized ROI of 2.2 % (See Table 13). For the external walls, given the area and the already existing level of insulation, longer payback periods are achieved. The potential carbon emission reductions vary from 5 to 24 tCO2 per annum.
Glazing
When comparing the results of the 2 different solar films modelled, the one with the lowest SHGC (0.22) gives the highest annual energy savings of 2.63% with the best payback period of around 8 years with a high annualized ROI reaching 4.6%.

Table 14.
SHGC and U-value of the glazing and solar films of Case 4.
| Iterations | ||||||
|
Solar films Area of 411 m2 Base case Uvalue 2.1 and SHGC 0.4 |
SHGC | 0.3 | 0.22 | |||
| Annual energy savings (%) | 0.55 | 1.25 | ||||
| Single payback period (years) | 15-16 | 6-7 | ||||
| Annualized ROI (%) | 2.7 | 4.6 | ||||
| Annual carbon emission reduction (tCO2) | 4 | 9 | ||||
|
Glazing Area of 411 m2 Base case Uvalue 2.1 and SHGC 0.4 |
Uvalue (W/m2.K) / SHGC | 2.1 /0.3 | 1.9/0.3 | 1.9/0.25 | 1.6/0.3 | 1.2/0.22 |
| Annual energy savings (%) | 3.25 | 3.6 | 4.24 | 3.9 | 5.63 | |
| Single payback period (years) | 19-20 | 18-19 | 16-17 | 18-19 | 12-13 | |
| Annualized ROI (%) | 2.2 | 2.3 | 2.6 | 2.4 | 3.2 | |
| Annual carbon emission reduction (tCO2) | 22 | 24 | 29 | 26 | 38 | |
Regarding the high-performance glazing iterations, the projected annual energy savings can reach up to 5.63 % (annual carbon emission reduction of 38 tCO2) for the best performing glazing with a payback period of around 13 years and an annualized total ROI of 3.2% over a building life of 50 years.
5. Discussion
5.1. Holistic Retrofit Measures with the Best Alternative Selections
Implementing several passive retrofitting measures at once can help optimize the energy efficiency of the building and lower the payback period. For this reason, the most economically-feasible solution for roof, external walls and glazing is selected, and an optimized basket of solutions is considered and simulated for each of the 4 cases.
Table 15 summarizes the overall envelope enhancement in the case of each of the buildings under consideration. It also lists the pre- and post-energy levels of energy consumption after implementing the overall envelope enhancement for all cases, and the estimated budget for the provided solutions.
5.2. Holistic Approach for Building Energy Optimization
Additional energy conservation measures are considered for Case 1 and Case 2. Retrofit of the existing lighting fixtures with LED fixtures is considered for both cases in addition to installing adiabatic cooling for the chillers for Case 2 (See Table 16). The results show an increase in energy savings of 16% to 19% and a reduction in the payback period of as much as 7 to 10 years. This is an acceptable payback period range in the context of regions where utility rates are on the low side. However, based on the survey conducted by Emirates Green Building Council (EGBC) (https://emiratesgbc.org/wpcontent/uploads/2020/10/Advancing-Deep-Retrofits-Appendix_FINAL-.pdf) majority stakeholders accept this as a normalized ROI and the best alternative for decarbonization goals.
6. Conclusion
This paper aimed to investigate the impact of building retrofitting strategies with special focus on the building thermal envelope. Four government buildings in the UAE acted as case studies. The outcome of advanced computational modelling of the individual retrofitting measures allows predicting the impact on energy savings, carbon reduction, and life-cycle cost of each of the envelope retrofit measures with regard to the 4 government buildings in the UAE. The study shows that applying each retrofitting measure individually can be quite challenging for most of the solutions, as reflected in the long payback periods, although most of the solutions provide important energy savings and high carbon emission reductions. Therefore, a holistic approach considered a basket of solutions to optimize the results in term of performance and ROI, which is most representative for deep retrofitting strategies. The overall envelope enhancements shall be seen and included as parts of the basket of potential retrofitting solutions, in addition to the ‘low-hanging fruits’, so the overall investment is seen to be better when the reduction in energy use is more significant. Based on the results of the individual retrofitting of the building thermal envelopes and the external glazing involving Saint-Gobain solutions, an optimized basket of solutions in the form of the most financially-feasible solutions is proposed for each of the buildings under consideration. Based on the energy modeling results and on the cost of the various proposed building envelope solutions provided by Saint-Gobain, the payback period in all cases varies between 15 and 20 years. Integrating such investments with additional energy efficient measures such as the retrofitting of lighting fixtures by LED fixtures, reduces the payback period for Case 1 to 8 years. In addition to such retrofitting, adiabatic cooling is proposed for the existing chillers of Case 2, leading to a reduction in the payback period to 10 years. The results show that deep retrofitting can lead to important reductions in operational carbon emissions which can, in some cases, reach 115 tCO2e/MWh. As part of the analysis, it can also be concluded that by investing only in ‘low hanging fruit’ energy reduction measures without integrating building fabric measures within the investment, the opportunity to improve the overall energy reduction can be missed from a green finance perspective. To support UAE’s pledge to achieve carbon neutrality in the built environment by 2050, the need to reduce operational carbon emissions through deep retrofitting measures is unavoidable. Furthermore, a deeper analysis will be carried out by the researchers with regard to the impact of deep retrofitting on the health and well-being of occupants. The objective will be to better understand how an improved façade can impact the comfort levels inside buildings, and determine whether or not there is a positive correlation between improved visual and thermal comfort and the productivity and well-being of the occupants.
Data Availability Statement
No data available.
Nomenclature
| HVAC | Heating, Ventilation and Air Conditioning |
| BMS | Building Management System |
| CDD | Cooling Degree Days |
| CHW | Chilled Water |
| COP | Coefficient of Performance |
| CMS | Chiller Management System |
| ECM | Energy Conservation Measure |
| AHU | Air Handling Unit |
| FAHU | Fresh Air Handling Unit |
| GPM | Gallon per minute (Dimension of flow) |
| H | Head |
| W / KW | Watt / Kilowatt (might be electrical or thermal) |
| LPS | Letter per second (Dimension of flow) |
| m | Meter (SI Units) |
| M&V | Measurement & Verification |
| P | Power Speed Drive |
| q | Flow Rate (GPM, LPS, etc.) |
| U | U-Value, which is Thermal Transmittance |
| VFD | Variable Frequency Drive |
| VSD | Variable |
| ΔT | Temperature difference |
| oC | Degree Centigrade |
| oF | Degree Fahrenheit |
| oK | Degree Kelvin |
| ESCO | Energy Services Company |
| PIR | Passive Infrared Sensor |
| PMV | Predicted Mean Vote |
| PPD | Percentage People Dissatisfied |
| TR | Ton Refrigeration |
| TRH | Ton Refrigeration Hour |
| DCV | Demand Control Ventilation |
| PV | Photovoltaic Panel |
| Mass flow | |
| ROI | Return of Investment |
References
- Harvey, L. D. Global warming: the hard science; Routledge: Toronto, 2018. [Google Scholar]
- Wu, P.; Song, Y.; Zhu, J.; Chang, R. Analyzing the influence factors of the carbon emissions from China's building and construction industry from 2000 to 2015. J. Clean. Prod. 2019, 221, 552–566. [Google Scholar] [CrossRef]
- Ma, Z.; Cooper, P.; Daly, D.; Ledo, L. Existing building retrofits: Methodology and state-of-the-art. Energy Build. 2012, 55, 889–902. [Google Scholar] [CrossRef]
- Asif, M. Growth and sustainability trends in the buildings sector in the GCC region with particular reference to the KSA and UAE. Renew. Sustain. Energy Rev. 2016, 55, 1267–1273. [Google Scholar] [CrossRef]
- McKinsey and Company. Climate Change Special Initiative; McKinsey & Company: New York, NY, USA, 2007. [Google Scholar]
- Zhou, Z.; Zhang, S.; Wang, C.; Zuo, J.; He, Q.; Rameezdeen, R. Achieving energy efficient buildings via retrofitting of existing buildings: a case study. J. Clean. Prod. 2016, 112, 3605–3615. [Google Scholar] [CrossRef]
- Suárez, R.; Fernández-Agüera, J. Passive energy strategies in the retrofitting of the residential sector: A practical case study in dry hot climate. Build. Simul. 2015, 8, 593–602. [Google Scholar] [CrossRef]
- Mata, É.; Kalagasidis, A.S.; Johnsson, F. Energy usage and technical potential for energy saving measures in the Swedish residential building stock. Energy Policy 2013, 55, 404–414. [Google Scholar] [CrossRef]
- Hens, H. Energy efficient retrofit of an end of the row house: Confronting predictions with long-term measurements. Energy Build. 2010, 42, 1939–1947. [Google Scholar] [CrossRef]
- Khoukhi, M.; Darsaleh, A.F.; Ali, S. Retrofitting an Existing Office Building in the UAE Towards Achieving Low-Energy Building. Sustainability 2020, 12, 2573. [Google Scholar] [CrossRef]
- Aguiar, A.; Abu Hileh, B. Energy performance of public housing buildings in sao paulo-Brazil. An evaluation of the current design practices. Presented at the Sustainable Buildings 2010 Brazil Conference (SB10Brazil), Sao Paulo, Brazil, 8-9 November 2010. [Google Scholar]
- Amstalden, R.W.; Kost, M.; Nathani, C.; Imboden, D.M. Economic potential of energy-efficient retrofitting in the Swiss residential building sector: The effects of policy instruments and energy price expectations. Energy Policy 2007, 35, 1819–1829. [Google Scholar] [CrossRef]
- Bande, L.; Cabrera, A.G.; Kim, Y.K.; Afshari, A.; Ragusini, M.F.; Cooke, M.G. A Building Retrofit and Sensitivity Analysis in an Automatically Calibrated Model Considering the Urban Heat Island Effect in Abu Dhabi, UAE. Sustainability 2019, 11, 6905. [Google Scholar] [CrossRef]
- Liu, Y.; Liu, T.; Ye, S.; Liu, Y. Cost-benefit analysis for Energy Efficiency Retrofit of existing buildings: A case study in China. J. Clean. Prod. 2018, 177, 493–506. [Google Scholar] [CrossRef]
- Reyna, J.L.; Chester, M.V. Energy efficiency to reduce residential electricity and natural gas use under climate change. Nat. Commun. 2017, 8, 14916. [Google Scholar] [CrossRef] [PubMed]
- Burgett, J.M.; Chini, A.R.; Oppenheim, P. Specifying residential retrofit packages for 30 % reductions in energy consumption in hot–humid climate zones. Energy Effic. 2013, 6, 523–543. [Google Scholar] [CrossRef]
- Biswas, K.; Patel, T.; Shrestha, S.; Smith, D.; Desjarlais, A. Whole building retrofit using vacuum insulation panels and energy performance analysis. Energy Build. 2019, 203. [Google Scholar] [CrossRef]
- Ma'BDeh, S.N.; Ghani, Y.A.; Obeidat, L.; Aloshan, M. Affordability assessment of passive retrofitting measures for residential buildings using life cycle assessment. Heliyon 2023, 9, e13574. [Google Scholar] [CrossRef] [PubMed]
- Friess, W.A.; Rakhshan, K. A review of passive envelope measures for improved building energy efficiency in the UAE. Renew. Sustain. Energy Rev. 2017, 72, 485–496. [Google Scholar] [CrossRef]
- Alkhateeb, E.; Abu-Hijleh, B. Potential for retrofitting a federal building in the UAE to net zero electricity building (nZEB). Heliyon 2019, 5, e01971. [Google Scholar] [CrossRef] [PubMed]
- Taleb, H.M. Using passive cooling strategies to improve thermal performance and reduce energy consumption of residential buildings in U.A.E. buildings. Front. Arch. Res. 2014, 3, 154–165. [Google Scholar] [CrossRef]
- Ihab Elzeyadi, S.D. Gatland (2017) Indoor Environmental Quality Design for Advanced Occupant’s Comfort – A Pre-post Occupancy Evaluation of a Green-Certified Office Building,.
Figure 1.
The four case studies of UAE government buildings.
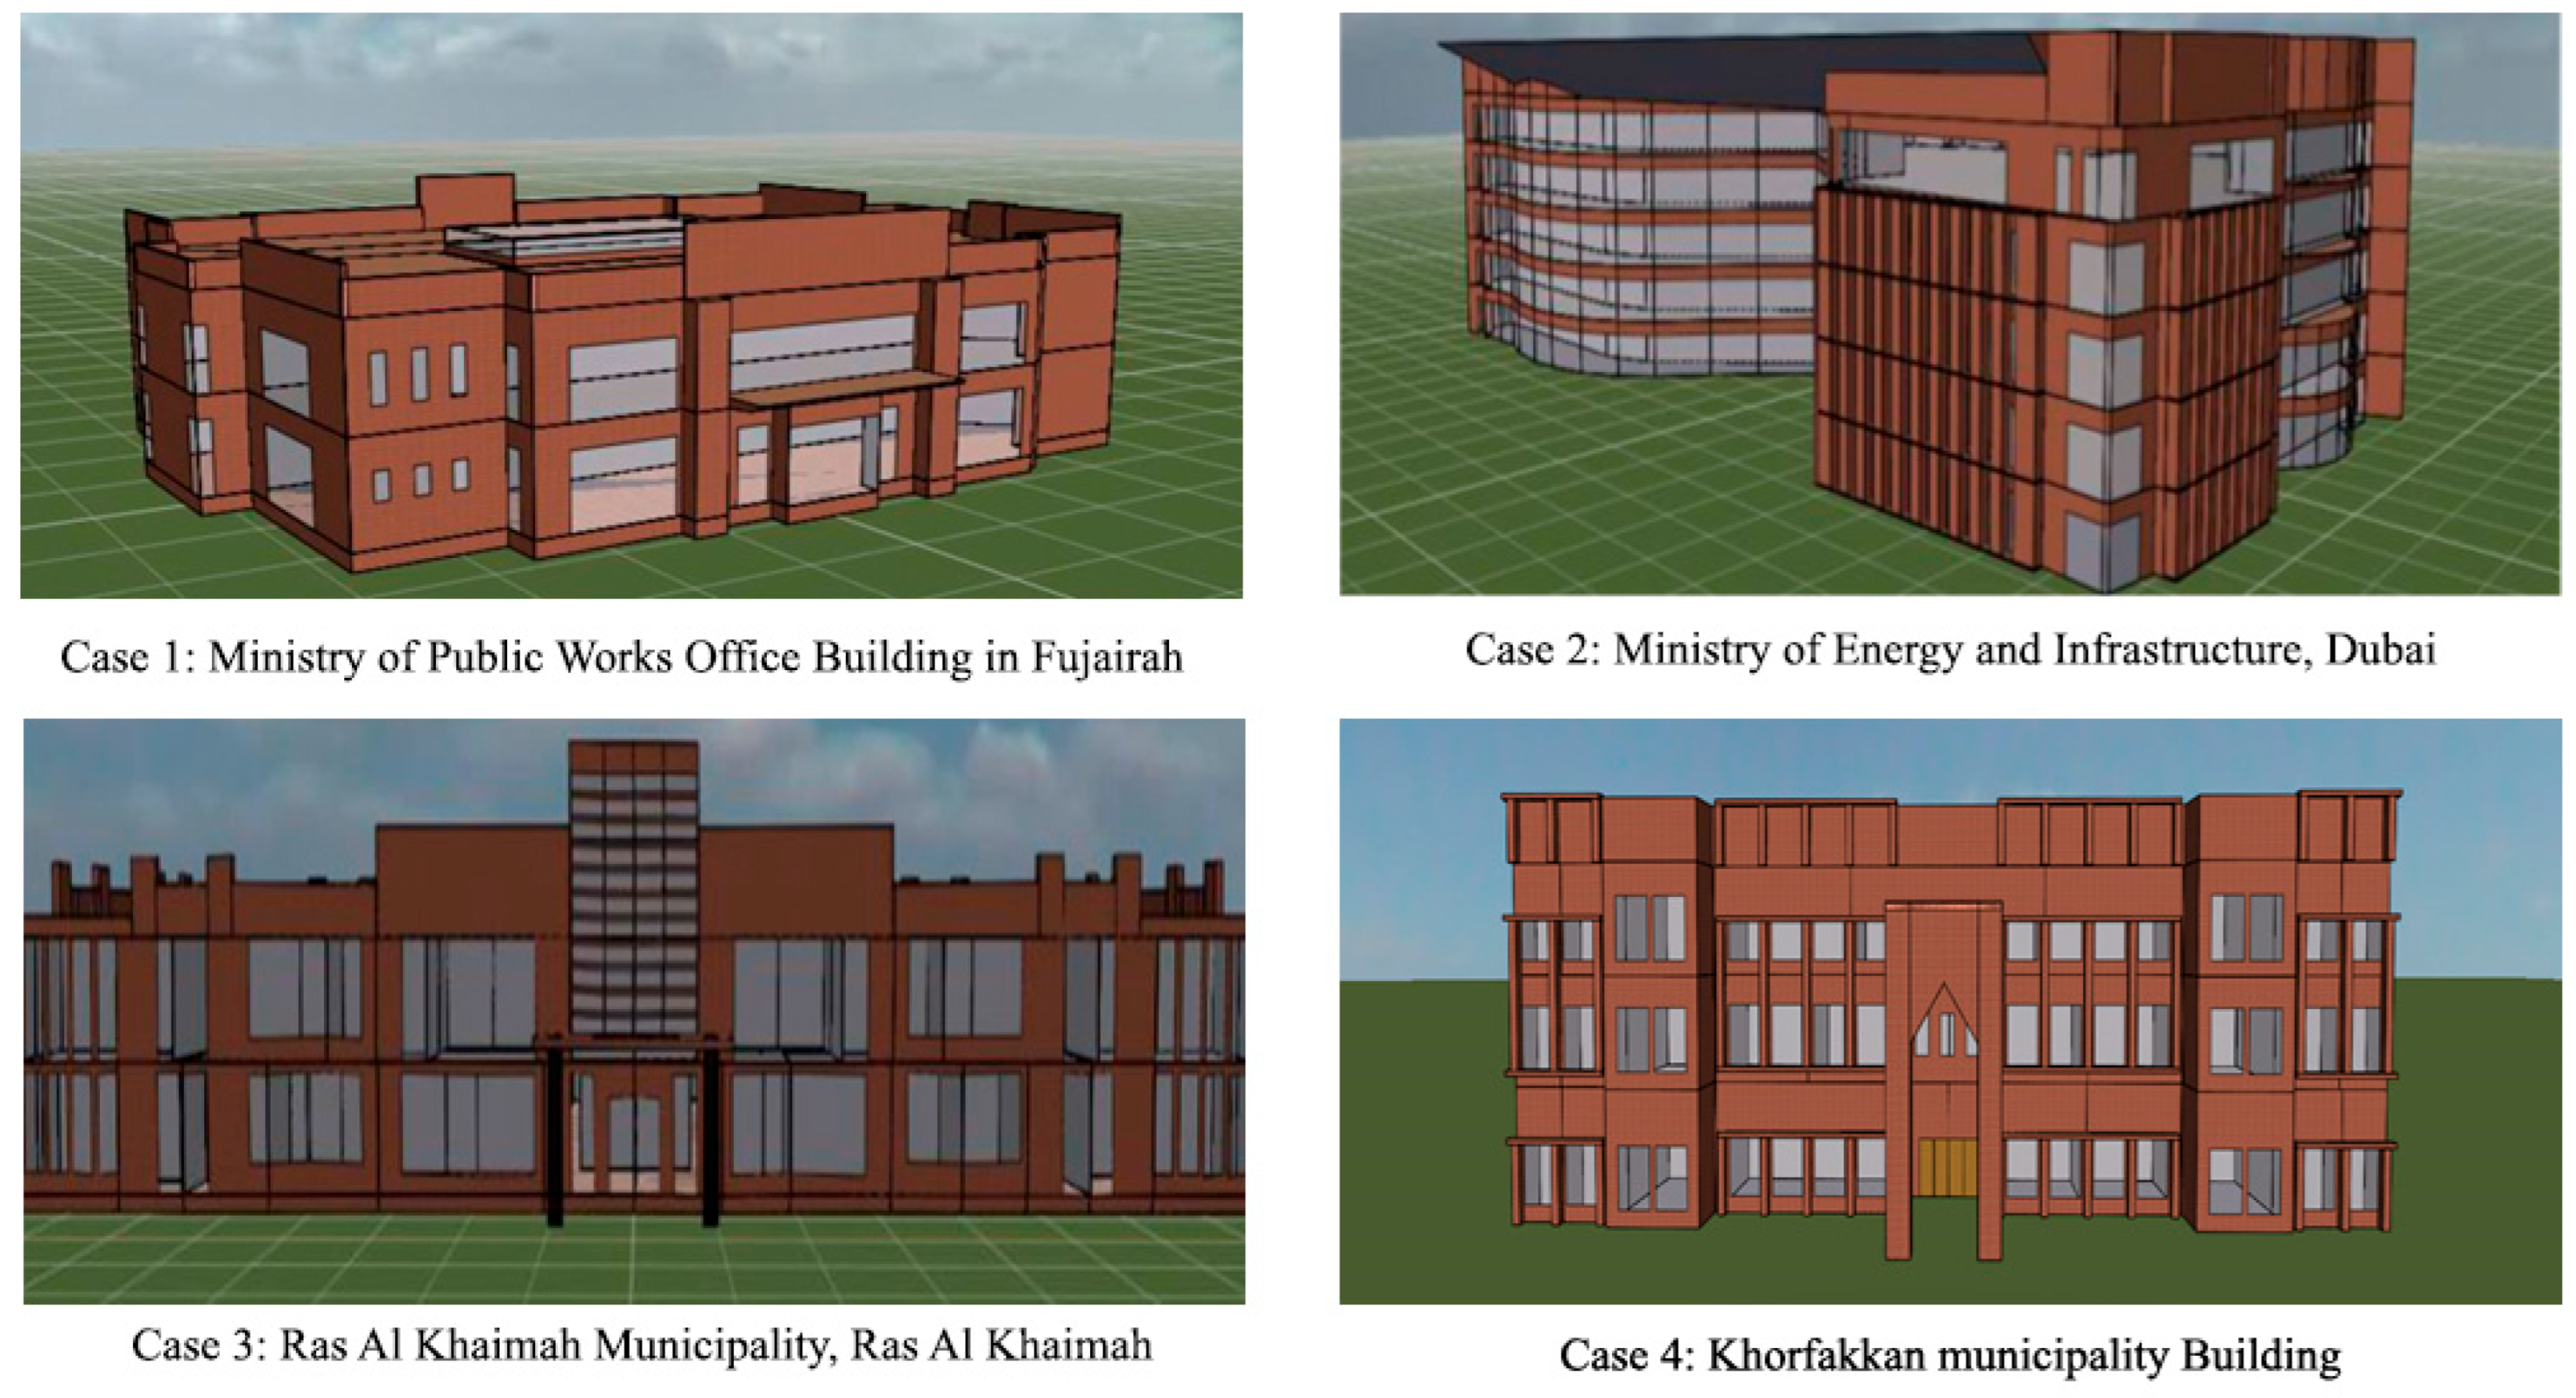
Figure 2.
Methodology that has been undertaken as part of these studies.
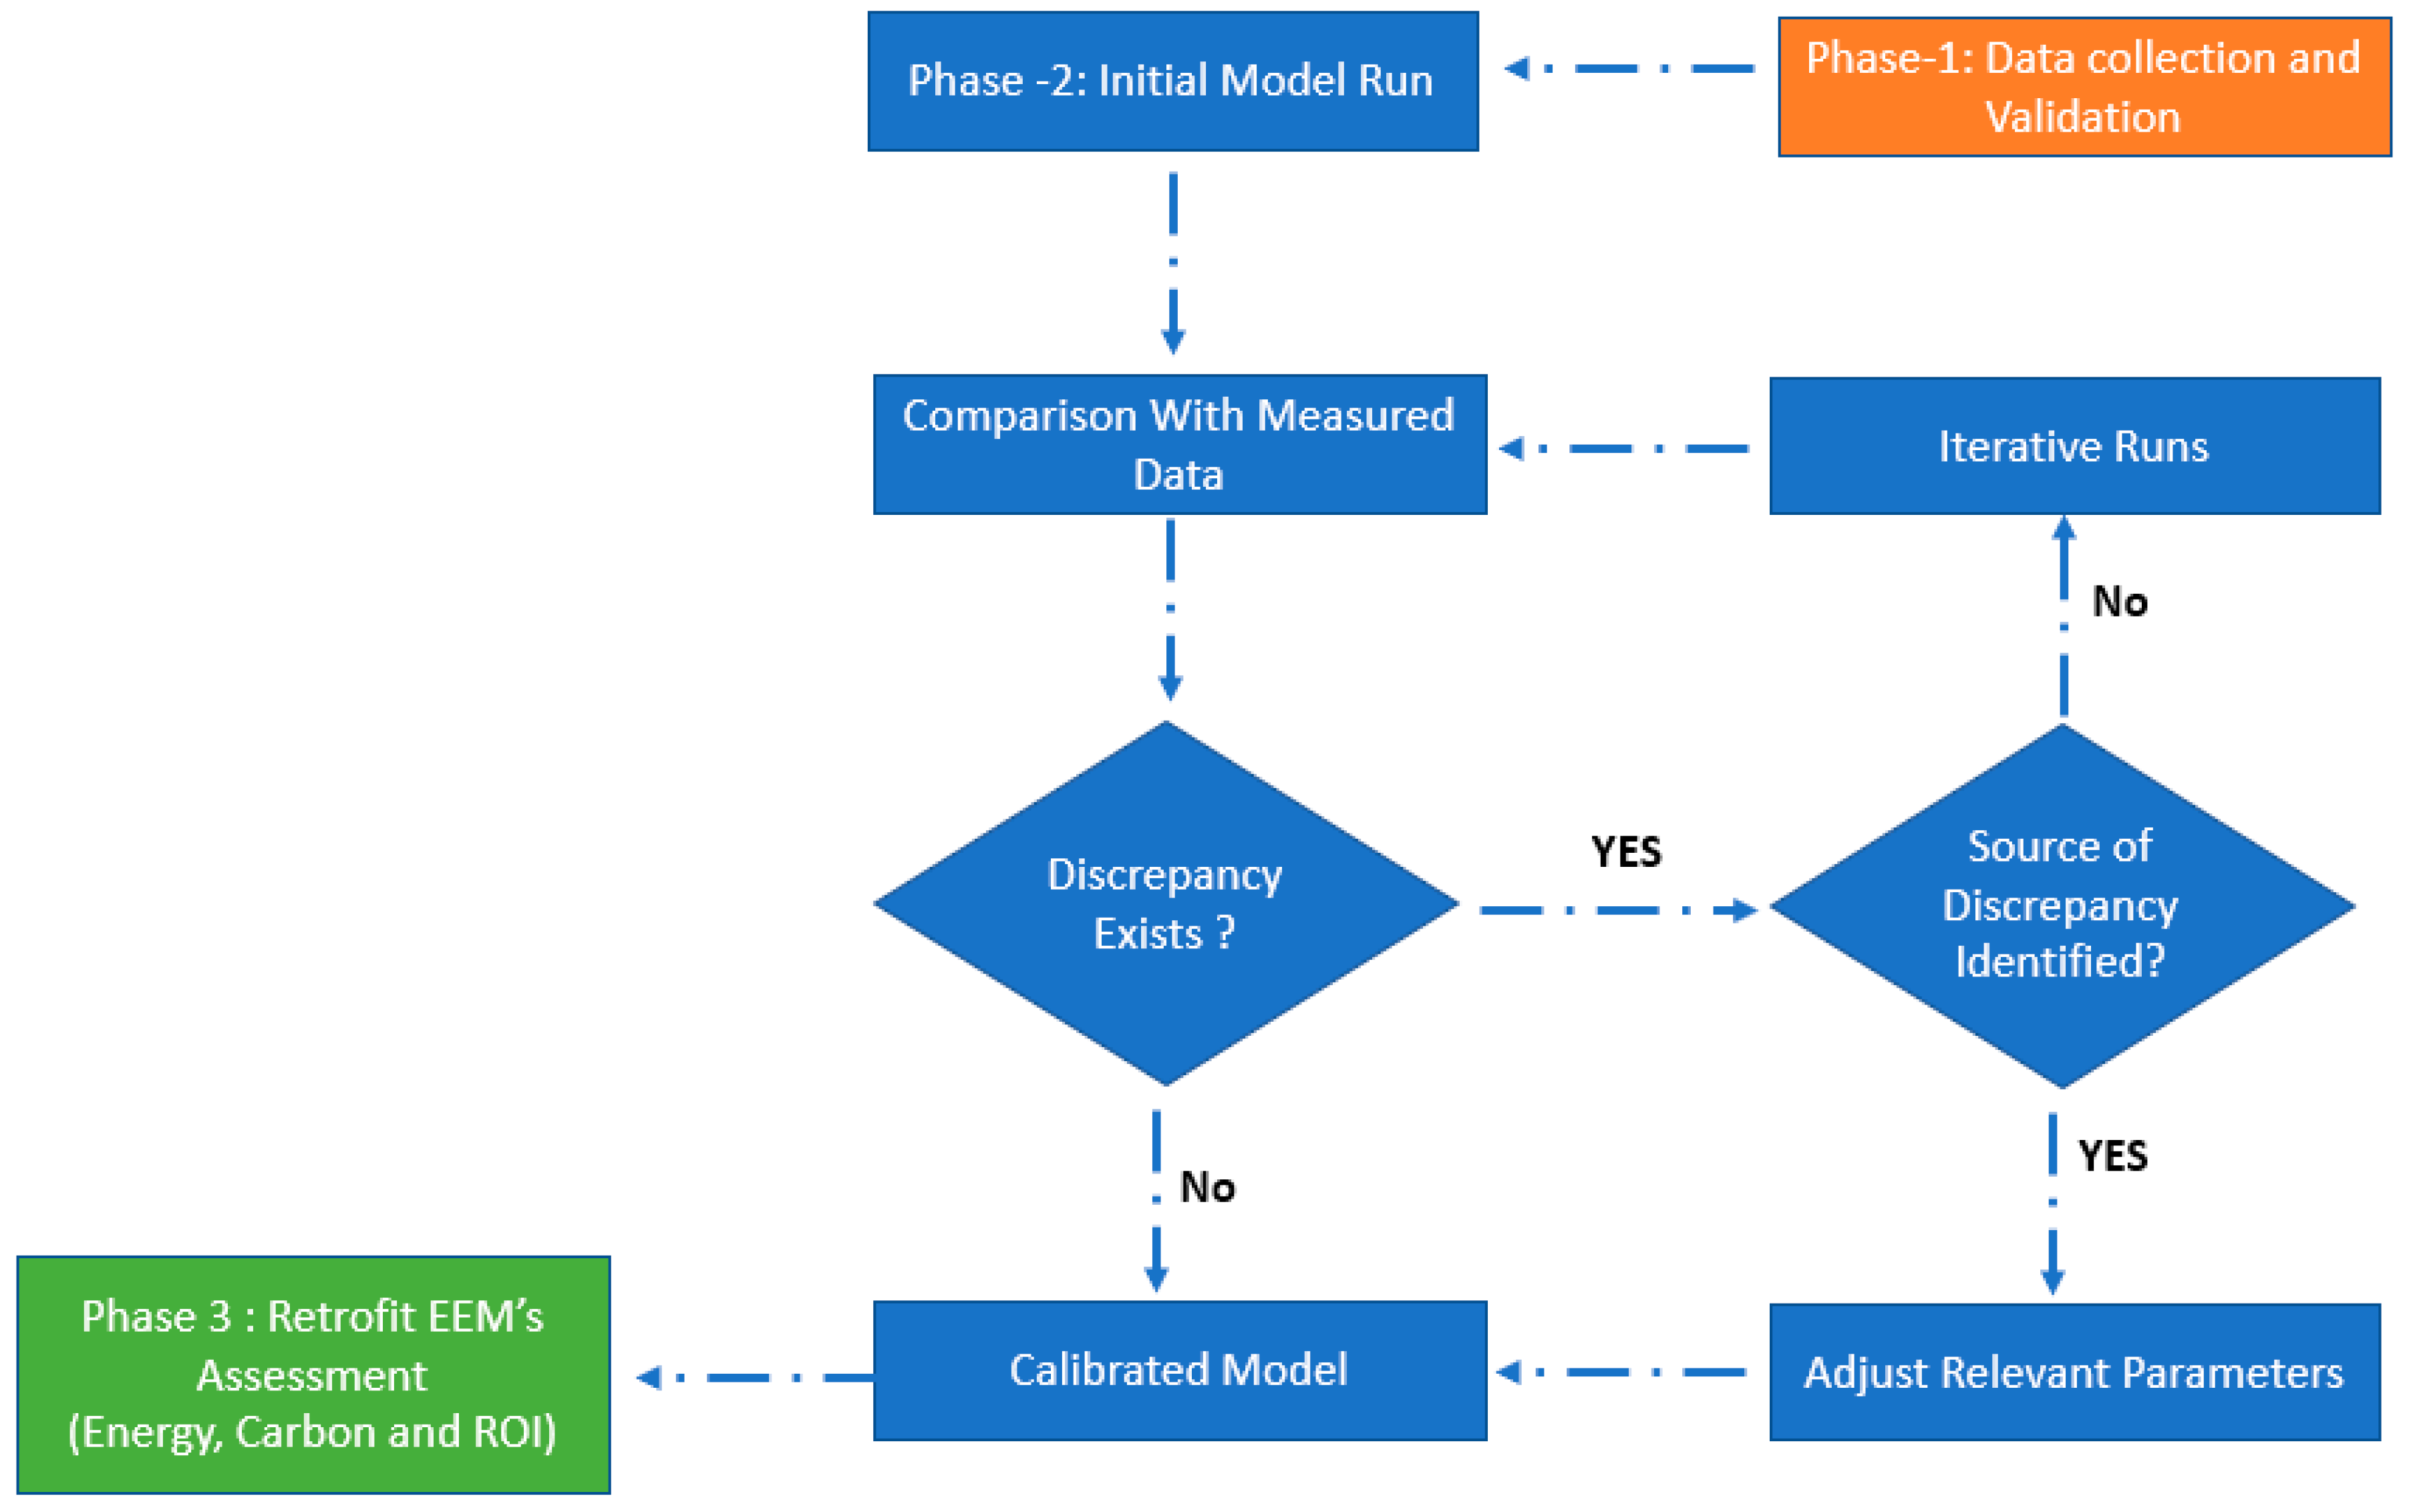
Figure 3.
Energy model and the actual energy consumption profile of the building of Case 1.
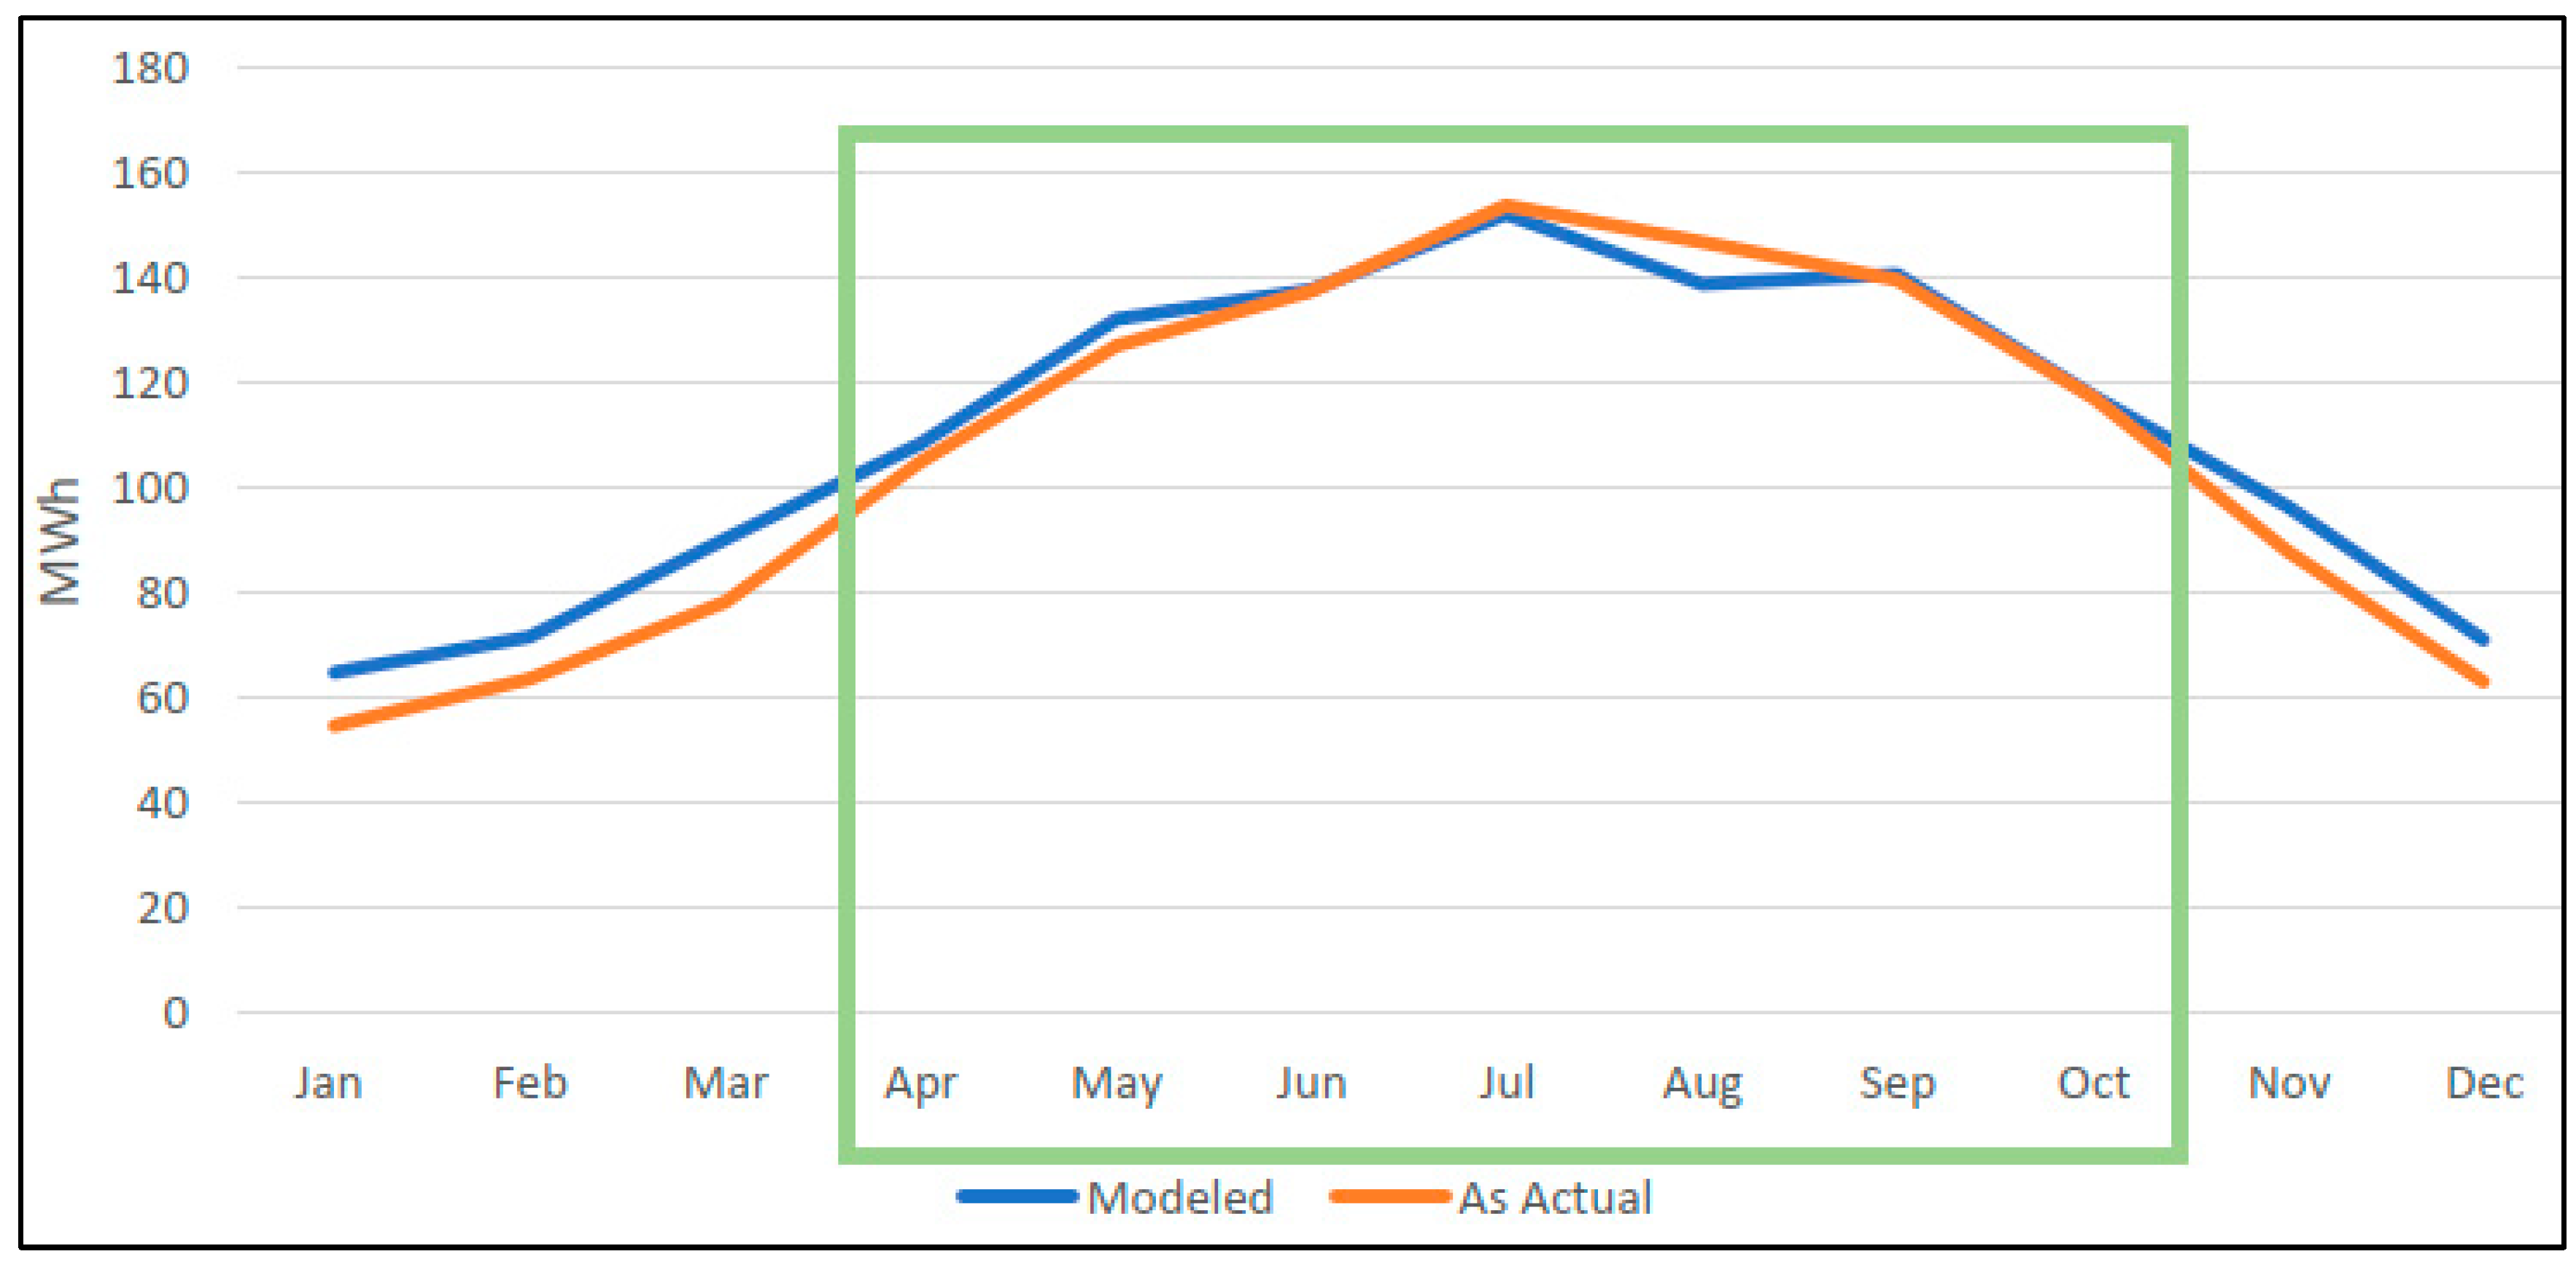
Figure 4.
Energy model and the actual energy consumption profile of the building of Case 2.
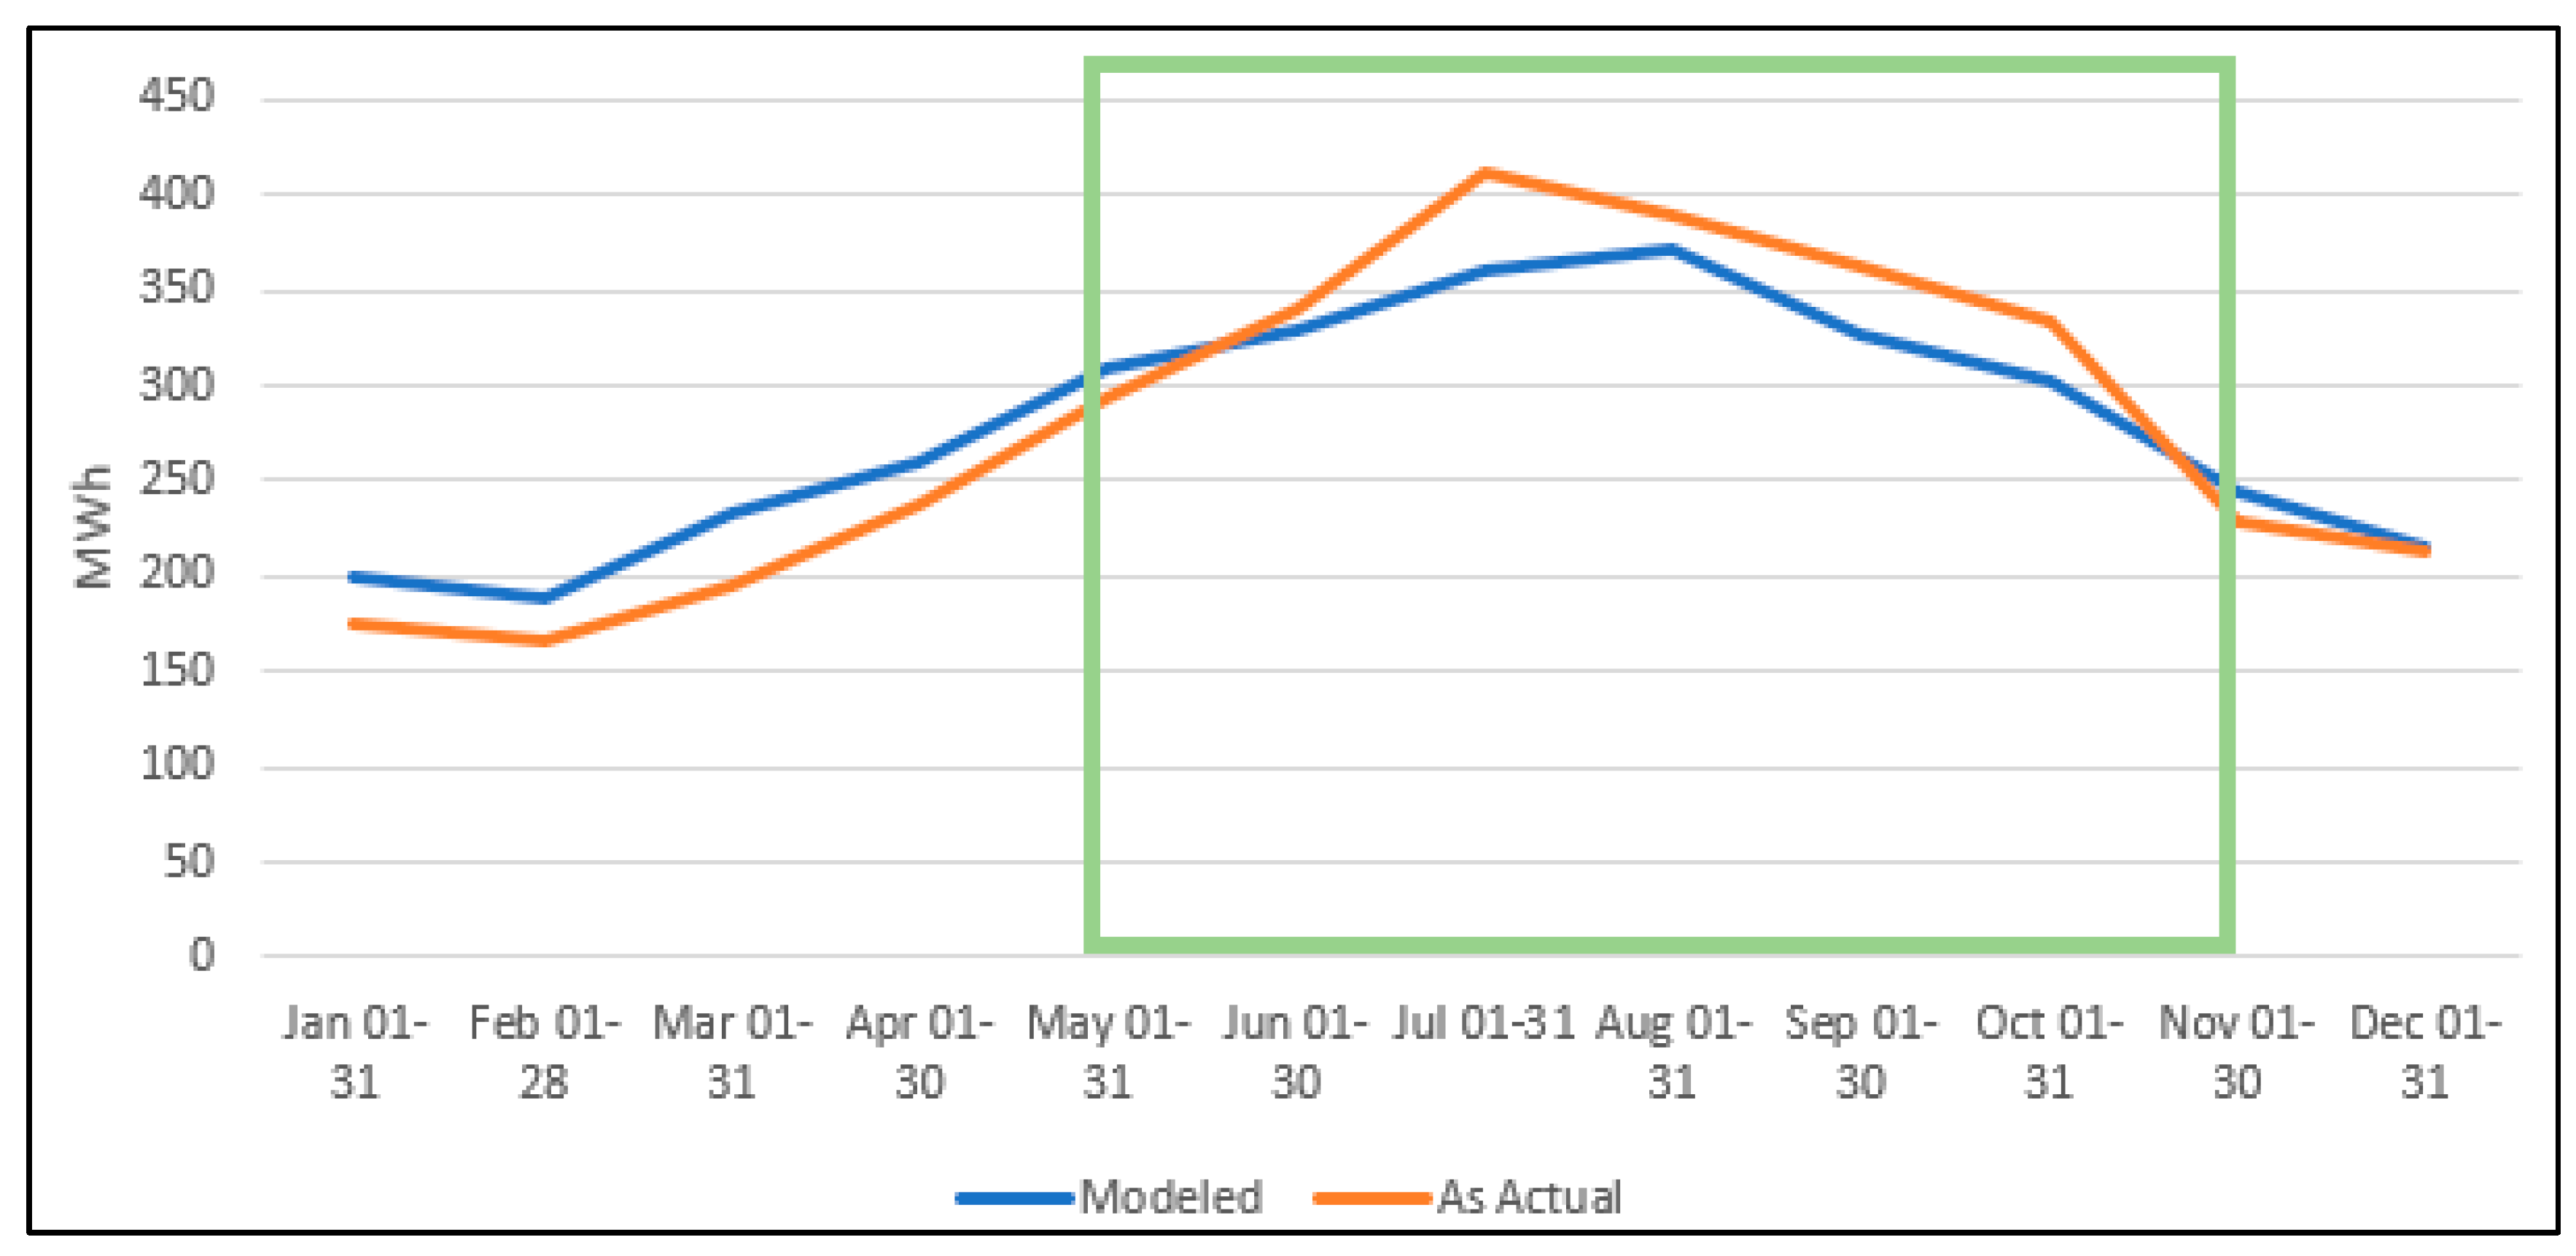
Figure 5.
Energy model and the actual energy consumption profile of the building of Case 3.
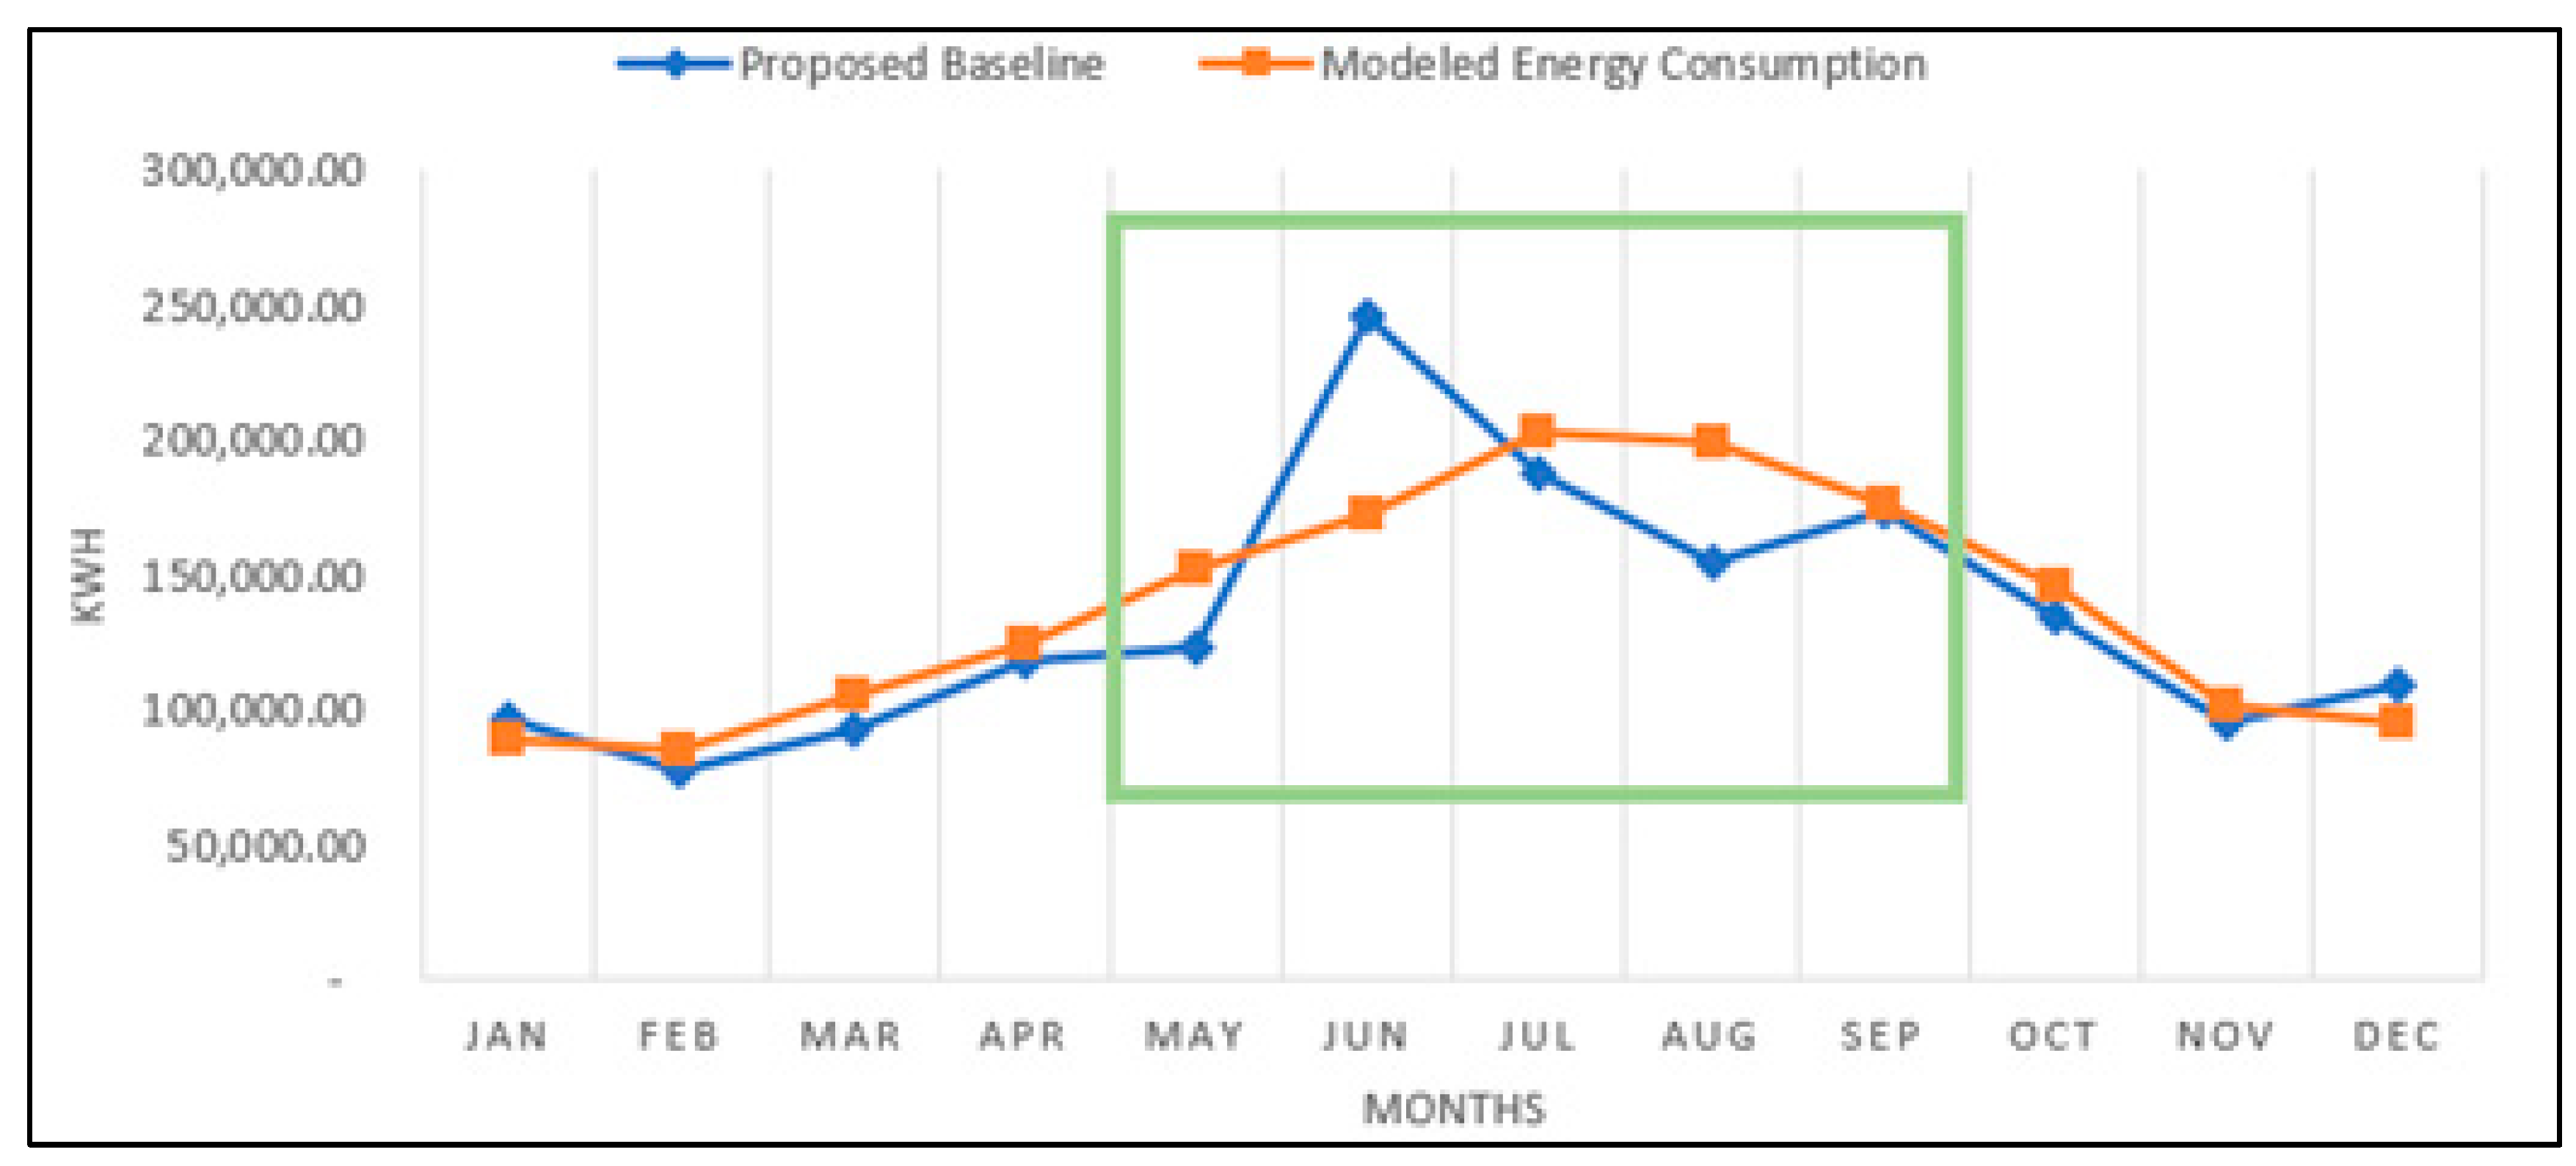
Figure 6.
Energy model and the actual energy consumption profile of the building of Case 4.
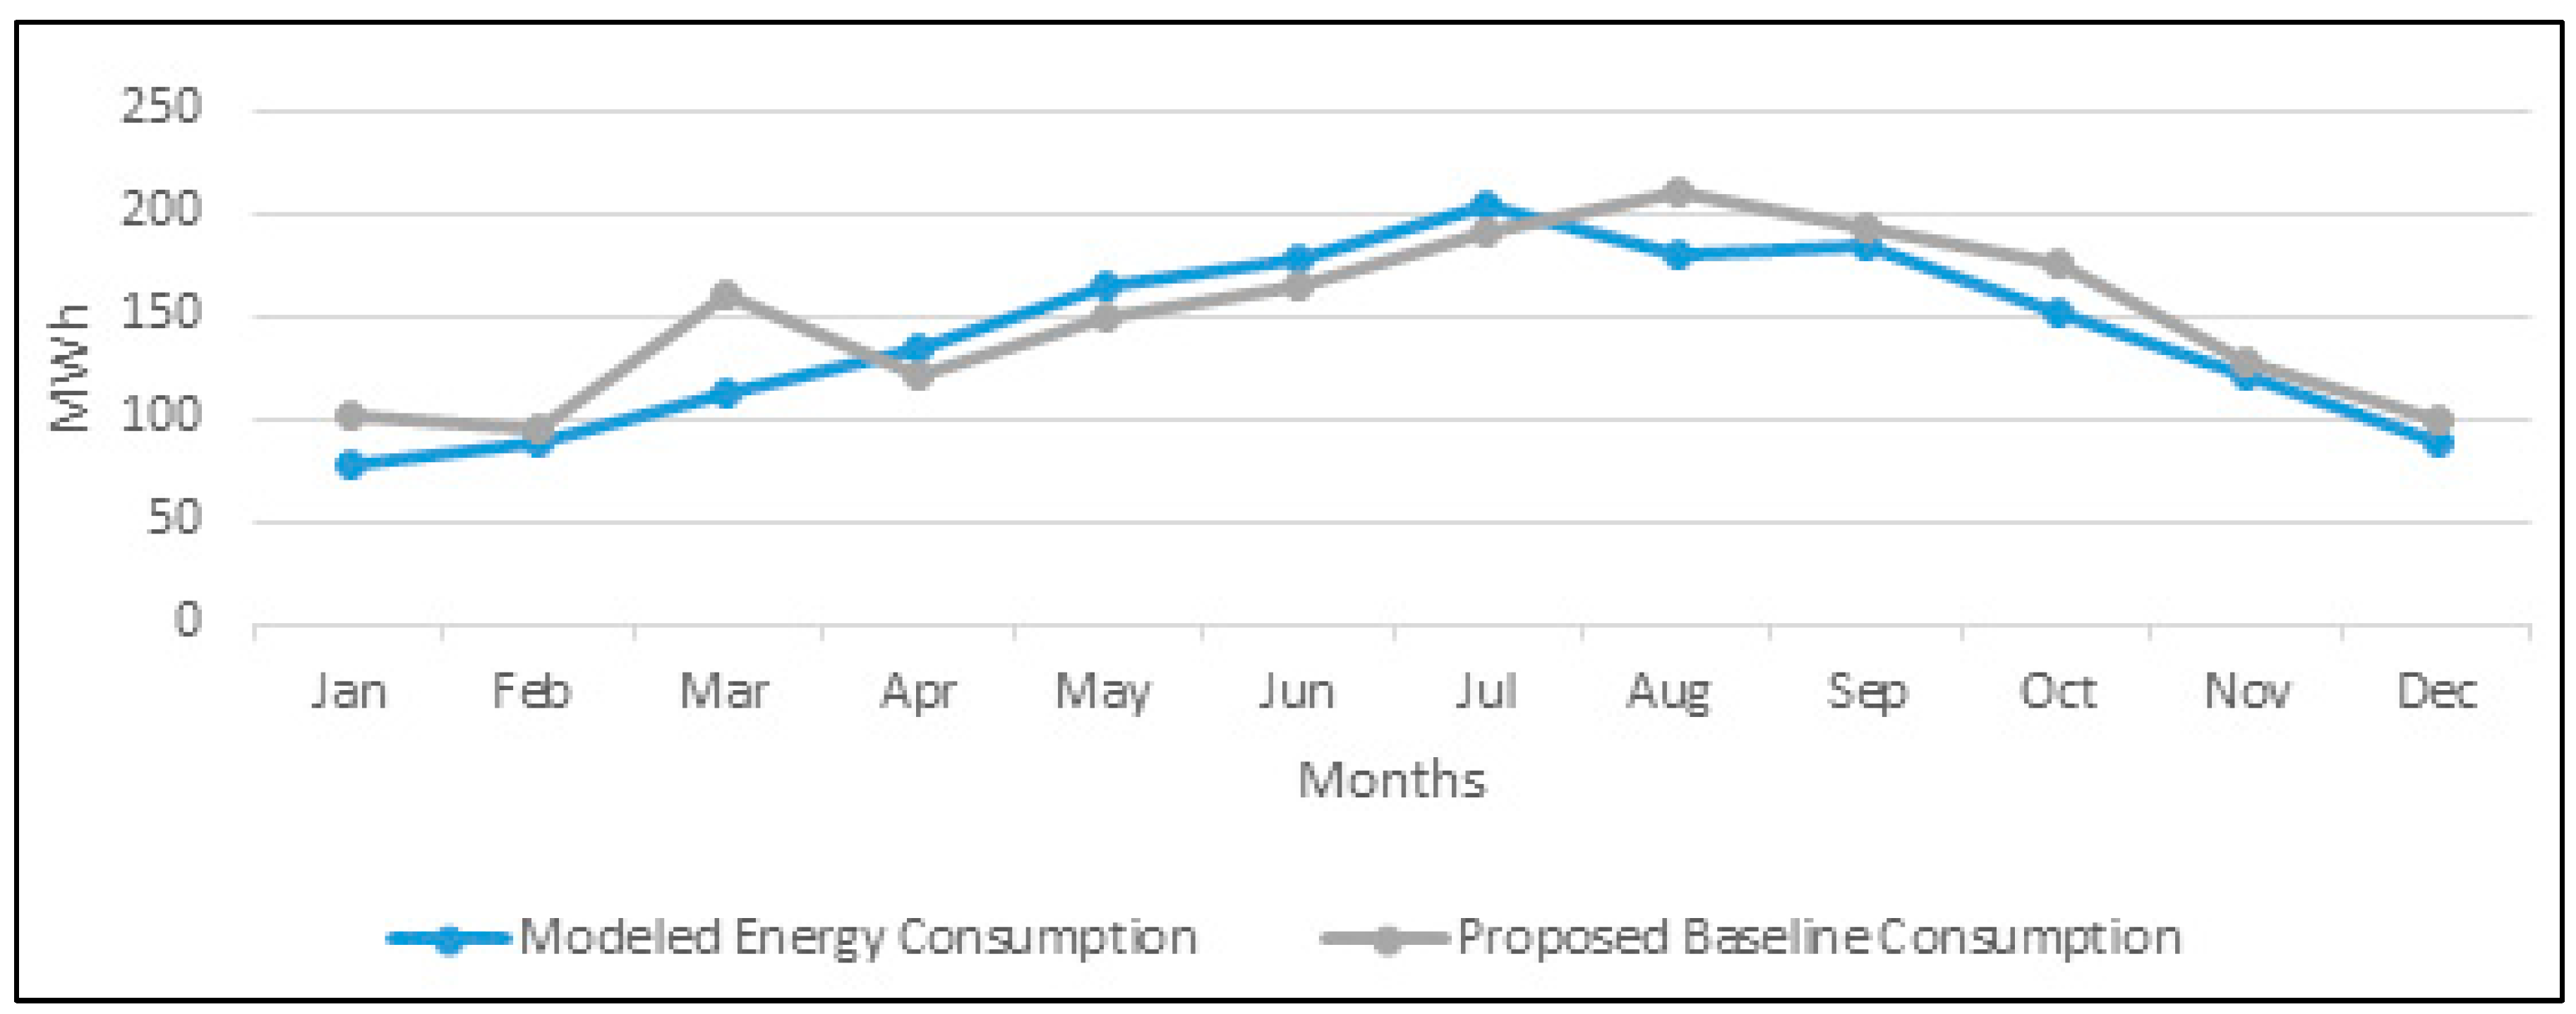
Table 1.
Recent international studies relating to building retrofit.
| study | Authors | Aim | Main findings | citation |
| 1 | Liu et al. (2018) | To assess the building envelope and heating system as well as the outdoor heating pipe network a part of a holistic retrofit strategy of a high-rise building in Beijing |
|
[14] |
| 2 | Reyna et al. (2017) | To come up with rigorous measures to improve the building performance of existing building stock in Los Angeles. |
|
[15] |
| 3 | Burgett et al. (2013) | To investigate the potential of lowering energy consumption through residential retrofit packages. |
|
[16] |
| 4 | Biswas et al. (2019) | To apply vacuum insulation panels and undertake energy performance analysis |
|
[17] |
| 5 | Ma’bdeh et al. (2023) | To investigate the affordability assessment of passive retrofit measures for residential buildings using life cycle analysis in Jordan. |
|
[18] |
| 6 | Friess and Rakhshan (2017) | To review passive envelope strategies to improve the energy efficiency of buildings in the UAE |
|
[19] |
| 7 | Alkhateebm and Abu Hijleh (2019) | To assess the impact of building retrofit in federal building in the UAE to achieve net zero electricity building |
|
[20] |
| 8 | Taleb (2014) | To apply passive strategies on residential building in the UAE. |
|
[21] |
Table 2.
Saint-Gobain walls and roofs passive retrofitting measures applied to the base case.
| External systems | Drawing | Uvalue (W/m2.K) |
|
Waterproofing & thermal insulation roofing system: weberoof SPF is a multilayer system where insulation is a two-component spray applied polyurethane foam and the top layer is a cement-based acrylic coating with a solar reflective index value SRI of greater than 78. Different insulation thicknesses are considered to obtain the Uvalue iterations simulated for the 4 buildings under consideration |
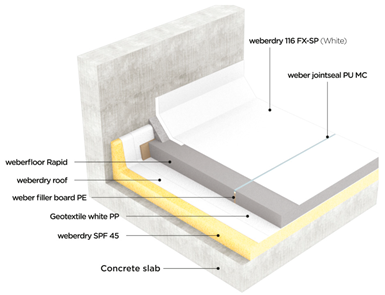 |
0.3 – 0.25 – 0.2 – 0.15 |
|
External wall insulation systems: Two options were considered for the retrofitting of the external walls: Saint-Gobain façade system using structural steel framing (SFS) providing high performances in terms of fire, acoustic and thermal WORD MISSING? , much faster to construct with lower caron footprint than traditional construction methods. The second system is an External Thermal Insulation Composite System (ETICS), webertherm MW. In this study both systems were designed to achieve the same level of thermal performances for the façade |
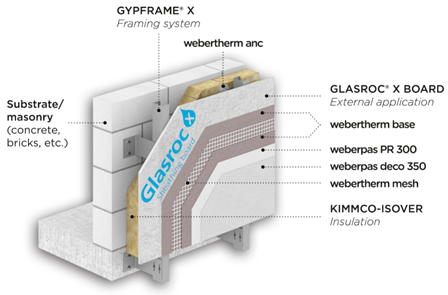 |
0.57 – 0.4 – 0.3 – 0.2 |
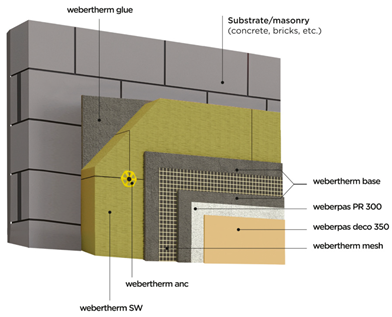 |
Table 3.
glazing areas per orientation of all buildings as extracted from the IES Model.
| Vertical Glazing Areas (m2) | Case 1 - Ministry of Public Works in Northern Emirates (Fujairah) | Case 2 - Ministry of Energy and Infrastructure in the UAE. WHERE? | Case 3 - Ras Al Khaimah Municipality Department | Case 4 - Khorfakkan Municipality Building | |
| North | 52.5 m2 | 871.6 m2 | 372.6 m2 | 92.6 m2 | |
| East | 111 m2 | 588.5 m2 | 160.3 m2 | 50.6 m2 | |
| South | 58 m2 | 1010.5 m2 | 355.7 m2 | 204 m2 | |
| West | 122.8 m2 | 403.9 m2 | 169.7 m2 | 63.5 m2 |
Table 4.
double-glazing units considered with the description and specifications.
| Double glazing units | Description | Glazing Uvalue (W/m2.K) / SHGG |
| Cool-lite KN 140 II | Single silver solar control & Low-e coating | 1.9 / 0.3 |
| Cool-lite KN 130 II | Single silver solar control & Low-e coating | 1.9 / 0.25 |
| Cool-lite SKN 165 II | Double silver solar control & Low-e coating | 1.6 / 0.3 |
| Cool-lite SKN 144 II | Double silver solar control & Low-e coating with inert gas filling | / 0.22 |
Table 5.
Summary of Overall Envelope Enhancement Results of all Building Cases.
| Case 1: Ministry of Public Works Office Building, Fujairah | Case 2: Ministry of Energy and Infrastructure, Dubai | Case 3: Ras AL Khaimah Municipality Department | Case 4: Khorfakkan Municipality Building | ||
|---|---|---|---|---|---|
| Overall Envelope Enhancement | Proposed optimized envelope u-values | Roof U value Iteration-1 = 0.3 W/m2.k | Roof U value Iteration-1 = 0.3 W/m2.k | Roof U value Iteration-1 = 0.3 W/m2.k | Roof U value Iteration-1 = 0.15 W/m2.k |
| ETICS Wall U-value Iteration-2=0.4 W/m2.k | ETICS Wall U-value Iteration-2 = 0.3 W/m2.k | ETICS Wall U-value Iteration-2 = 0.3 W/m2.k | ETICS Wall U-value Iteration-2 = 0.3 W/m2.k | ||
| Fenestration glazing optimizations | SHGC with Solar Film-Iteration-2 (Silver 20) | SHGC with Solar Film-Iteration-2 (Silver 20) | SHGC with Solar Film-Iteration-2 (Silver 20) | SHGC with Solar Film-Iteration-2 (Silver 20) | |
| Reduce air leakages | Yes | Yes | Yes | Yes | |
| Percentage savings | 5.5% | 8.5% | 8% | 6.8% | |
| Total Investment Cost (AED) | 496,803 AED | 2,201,081 AED | 983,059 AED | 695,342 AED | |
| Carbon emission reduction | 29 tCO2/MWh | 115 tCO2/MWh | 54 tCO2/MWh | 46 tCO2/MWh | |
| Payback Period | 16-18 years | 18-20 years | 15-17 years | ears | |
Table 6.
The electricity tariffs considered in this study.
| UAE Emirates | 2022 electricity tariff (AED/kWh) |
| Fujairah (Case 1) | 0.38 |
| Dubai (Case 2) | 0.43 |
| RAK (Case 3) | 0.43 |
| Sharjah (Case 4) | 0.38 |
Table 7.
U-value in both external walls and roofs iterations of Case 1.
| Iterations | |||||
|
Roof Area of 1,189 m2 Reference Uvalue 1.53 W/m2.K |
Uvalue (W/m2.K) | 0.3 | 0.25 | 0.2 | 0.15 |
| Annual energy savings (%) | 1.9 | 2 | 2.1 | 2.2 | |
| Single payback period (years) | 13-14 | 14-15 | 16-17 | 18-19 | |
| Annualized ROI (%) | 3.1 | 2.9 | 2.7 | 2.4 | |
| Annual carbon emission reduction (tCO2) | 10 | 11 | 11 | 12 | |
|
External walls Area of 964 m2 Reference Uvalue 0.74 W/m2.K |
Uvalue (W/m2.K) | 0.57 | 0.4 | 0.3 | 0.2 |
| Annual energy savings (%) | 1.24 | 1.44 | 1.55 | 1.67 | |
| Single payback period (years) | 27-28 | 24-25 | 24-25 | 28-29 | |
| Annualized ROI (%) | 1.5 | 1.7 | 1.7 | 1.4 | |
| Annual carbon emission reduction (tCO2) | 7 | 8 | 8 | 9 | |
Table 8.
SHGC and U-value of the glazing and solar films of Case 1.
| Iterations | ||||||
|
Solar films Area of 344 m2 Base case Uvalue 2.1 and SHGC 0.4 |
SHGC | 0.3 | 0.22 | |||
| Annual energy savings (%) | 0.85 | 1.12 | ||||
| Single payback period (years) | 10-11 | 7-8 | ||||
| Annualized ROI (%) | 3.5 | 4.2 | ||||
| Annual carbon emission reduction (tCO2) | 5 | 6 | ||||
|
Glazing Area of 344 m2 Base case Uvalue 2.1 and SHGC 0.4 |
Uvalue (W/m2.K)/SHGC | 2.1/0.3 | 1.9/0.3 | 1.9/0.25 | 1.6/0.3 | 1.2/0.22 |
| Annual energy savings (%) | 3.19 | 3.34 | 3.85 | 3.44 | 4.68 | |
| Single payback period (years) | 21-22 | 21-22 | 19-20 | 21-22 | 16-17 | |
| Annualized ROI (%) | 2 | 2 | 2.2 | 2 | 2.6 | |
| Annual carbon emission reduction (tCO2) | 17 | 18 | 21 | 18 | 25 | |
Table 9.
U-value in both external walls and roofs iterations of Case 2.
| Iterations | |||||
|
Roof Area of 4,464 m2 Reference Uvalue 1.53 W/m2.K |
Uvalue (W/m2.K) | 0.3 | 0.25 | 0.2 | 0.15 |
| Annual energy savings (%) | 3.1 | 3.3 | 3.5 | 3.63 | |
| Single payback period (years) | 10-11 | 11-12 | 12-13 | 14-15 | |
| Annualized ROI (%) | 3.6 | 3.4 | 3.2 | 2.8 | |
| Annual carbon emission reduction (tCO2) | 42 | 45 | 47 | 49 | |
|
External walls Area of 2,819 m2 Reference Uvalue 0.74 W/m2.K |
Uvalue (W/m2.K) | 0.57 | 0.4 | 0.3 | 0.2 |
| Annual energy savings (%) | 0.82 | 1.17 | 1.39 | 1.6 | |
| Single payback period (years) | 39-40 | 29-30 | 27-28 | 29-30 | |
| Annualized ROI (%) | 0.12 | 0.76 | 0.82 | 0.73 | |
| Annual carbon emission reduction (tCO2) | 11 | 16 | 19 | 22 | |
Table 10.
SHGC and U-value of the glazing and solar films of Case 2.
| Iterations | ||||||
|
Solar films Area of 2,875 m2 Base case Uvalue 2.1 and SHGC 0.4 |
SHGC | 0.3 | 0.22 | |||
| Annual energy savings (%) | 1.32 | 3.12 | ||||
| Single payback period (years) | 19-20 | 8-9 | ||||
| Annualized ROI (%) | 2.2 | 4.1 | ||||
| Annual carbon emission reduction (tCO2) | 18 | 42 | ||||
|
Glazing Area of 2,875 m2 Base case Uvalue 2.1 and SHGC 0.4 |
Uvalue (W/m2.K)/SHGC | 2.1/0.3 | 1.9/0.3 | 1.9/0.25 | 1.6/0.3 | 1.2/0.22 |
| Annual energy savings (%) | 3.92 | 4.36 | 5.6 | 4.8 | 7.76 | |
| Single payback period (years) | 45-46 | 42-43 | 39-40 | 39-40 | 26-27 | |
| Annualized ROI (%) | 0.2 | 0.4 | 0.8 | 0.5 | 1.5 | |
| Annual carbon emission reduction (tCO2) | 53 | 59 | 76 | 64 | 105 | |
Table 11.
U-value in both external walls and roofs iterations of Case 3.
| Iterations | |||||
|
Roof Area of 3,163 m2 Reference Uvalue 1.53 W/m2.K |
Uvalue (W/m2.K) | 0.3 | 0.25 | 0.2 | 0.15 |
| Annual energy savings (%) | 5.6 | 5.9 | 6.2 | 6.5 | |
| Single payback period (years) | 8-9 | 9-10 | 10-11 | 11-12 | |
| Annualized ROI (%) | 4 | 3.9 | 3.6 | 3.3 | |
| Annual carbon emission reduction (tCO2) | 38 | 40 | 42 | 44 | |
|
External walls Area of 1,083 m2 Reference Uvalue 0.6 W/m2.K |
Uvalue (W/m2.K) | 0.57 | 0.4 | 0.3 | 0.2 |
| Annual energy savings (%) | 1.09 | 1.19 | 1.48 | 1.51 | |
| Single payback period (years) | 24-25 | 22-23 | 20-21 | 24-25 | |
| Annualized ROI (%) | 1.68 | 1.9 | 2.1 | 1.7 | |
| Annual carbon emission reduction (tCO2) | 7 | 8 | 10 | 10 | |
Table 12.
SHGC and U-value of the glazing and solar films of Case 3.
| Iterations | ||||||
|
Solar films Area of 1,058 m2 Base case Uvalue 2.1 and SHGC 0.4 |
SHGC | 0.3 | 0.22 | |||
| Annual energy savings (%) | 1.27 | 2.63 | ||||
| Single payback period (years) | 15-16 | 7-8 | ||||
| Annualized ROI (%) | 2.8 | 4.4 | ||||
| Annual carbon emission reduction (tCO2) | 9 | 18 | ||||
|
Glazing Area of 1,058 m2 Base case Uvalue 2.1 and SHGC 0.4 |
Uvalue (W/m2.K)/SHGC | 2.1/0.3 | 1.9/0.3 | 1.9/0.25 | 1.6/0.3 | 1.2/0.22 |
| Annual energy savings (%) | 5.8 | 6.13 | 7 | 6.45 | 9 | |
| Single payback period (years) | 24-25 | 23-24 | 22-23 | 23-24 | 17-18 | |
| Annualized ROI (%) | 1.7 | 1.8 | 1.9 | 1.8 | 2.4 | |
| Annual carbon emission reduction (tCO2) | 39 | 42 | 48 | 44 | 61 | |
Table 13.
U-value in both external walls and roofs iterations of Case 4.
| Iterations | |||||
|
Roof Area of 1,283 m2 Reference Uvalue 0.45 W/m2.K |
Uvalue (W/m2.K) | 0.3 | 0.25 | 0.2 | 0.15 |
| Annual energy savings (%) | 0.8 | 1.1 | 1.4 | 1.7 | |
| Single payback period (years) | 25-26 | 20-21 | 20-21 | 19-20 | |
| Annualized ROI (%) | 1.6 | 2.1 | 2.2 | 2.2 | |
| Annual carbon emission reduction (tCO2) | 5 | 8 | 9 | 12 | |
|
External walls Area of 2,060 m2 Reference Uvalue 0.45 W/m2.K |
Uvalue (W/m2.K) | 0.4 | 0.3 | 0.2 | |
| Annual energy savings (%) | 2.19 | 2.9 | 3.6 | ||
| Single payback period (years) | 26-27 | 22-23 | 22-23 | ||
| Annualized ROI (%) | 1.5 | 1.9 | 1.9 | ||
| Annual carbon emission reduction (tCO2) | 15 | 20 | 24 | ||
Table 15.
Envelope enhancement considered for each case study.
| Case 1: Ministry of Public Works Office Building, Fujairah | Case 2: Ministry of Energy and Infrastructure, Dubai | Case 3: Ras AL Khaimah Municipality Department | Case 4: Khorfakkan Municipality Building | ||
|---|---|---|---|---|---|
| Overall Envelope Enhancement | Proposed Optimized Envelope Uvalues | Roof Uvalue Iteration-1 = 0.3 W/m2.k | Roof Uvalue Iteration-1 = 0.3 W/m2.k | Roof Uvalue Iteration-1 = 0.3 W/m2.k | Roof Uvalue Iteration-1 = 0.15 W/m2.k |
| ETICS Wall Uvalue Iteration-2=0.4 W/m2.k | ETICS Wall Uvalue Iteration-2 = 0.3 W/m2.k | ETICS Wall Ualue Iteration-2 = 0.3 W/m2.k | ETICS Wall Uvalue Iteration-2 = 0.3 W/m2.k | ||
| Fenestration glazing optimizations | SHGC with Solar Film-Iteration-2 (Silver 20) | SHGC with Solar Film-Iteration-2 (Silver 20) | SHGC with Solar Film-Iteration-2 (Silver 20) | SHGC with Solar Film-Iteration-2 (Silver 20) | |
| Reduce air leakages | Yes | Yes | Yes | Yes | |
| Pre EUI | 0.54 MWh/m2 | 0.25 MWh/m2 | 0.25 MWh/m2 | 0.4 MWh/m2 | |
| Post EUI | 0.51 MWh/m2 | 0.23 MWh/m2 | 0.23 MWh/m2 | 0.37 MWh/m2 | |
| Percentage savings | 5.5% | 8.5% | 8% | 6.8% | |
| Total Investment Cost (AED) | 496,803 AED | 2,201,081 AED | 983,059 AED | 695,342 AED | |
| Carbon emission reduction | 29 tCO2/MWh | 115 tCO2/MWh | 54 tCO2/MWh | 46 tCO2/MWh | |
| Payback Period | 16-18 years | 18-20 years | 15-17 years | 15-17 years | |
Table 16.
Additional energy conservation measures considered for Case 1 and Case 2.
| Holistic Approach for Building Energy Optimization | Pre-Energy Consumption | Post-Energy Consumption | Pre EUI | Post EUI | Percentage Savings | Payback period (Years) |
|---|---|---|---|---|---|---|
| Case 1 | 1320.5 MWh | 1105.8 MWh | 0.54 MWh/m2 | 0.45 MWh/m2 | 16% | 7-9 |
| Case 2 | 3345.6 MWh | 2699 MWh | 0.25 MWh/m2 | 0.2 MWh/m2 | 19% | 8-10 |
Disclaimer/Publisher’s Note: The statements, opinions and data contained in all publications are solely those of the individual author(s) and contributor(s) and not of MDPI and/or the editor(s). MDPI and/or the editor(s) disclaim responsibility for any injury to people or property resulting from any ideas, methods, instructions or products referred to in the content. |
© 2024 by the authors. Licensee MDPI, Basel, Switzerland. This article is an open access article distributed under the terms and conditions of the Creative Commons Attribution (CC BY) license (http://creativecommons.org/licenses/by/4.0/).
Copyright: This open access article is published under a Creative Commons CC BY 4.0 license, which permit the free download, distribution, and reuse, provided that the author and preprint are cited in any reuse.


