
Submitted:
28 October 2024
Posted:
29 October 2024
You are already at the latest version
Abstract
Water containing fluoride concentrations greater than 1.5 mg/L is a public health problem. Adsorption on activated carbon is one of the most commonly used methods for removing elevated fluoride concentrations in water. This research was tested the parameters of fluoride adsorption on four modified activated carbons with nitric acid and hydrogen peroxide. Adsorption properties includes initial fluoride concentrations (2-40 mg/L), pH (4-9), dosage of activated carbon (2-20 g/L), contact time (15-360 min) and temperature (25-45°C). The research results showed a decrease in the proportion of adsorbed fluorides by increasing their initial concentration, while an increase in temperature had a positive effect on the proportion of removed fluorides. The optimal pH value of adsorption at which the largest amount of fluoride is adsorbed is from 4 to 6. Langmuir, Freundlich, Temkin and Dubinin-Radushkevich isotherms were used to determine the adsorption mechanism. The experimental data showed the best agreement with the Freundlich model at all temperatures, while the pseudo second-order kinetic model best described the adsorption rate. An increase in the adsorption temperature had a positive effect on the adsorption properties of activated carbons for all tested parameters.
Keywords:
fluoride determination
; fluoride removal
; activated carbon
; isotherms
; kinetics
1. Introduction
Fluoride contamination of drinking water is a global health problem, as more than 260 million people worldwide consume water with fluoride concentrations exceeding 1.5 mg/L. According to the recommendation of the World Health Organization, this is the maximum permissible level of fluoride in drinking water [1,2,3]. In groundwater, the concentration of fluoride is primarily determined by the geological composition of the aquifer, but there is an increasing influence of various industries, which significantly increase their concentration through the discharge of waste water and gases [4]. Most of the health consequences of intake of excessive fluoride concentration, which are most often manifested as dental and skeletal fluorosis, have been recorded in underdeveloped countries where drinking water from which fluorides have not been previously removed is mainly consumed [5,6]. However, even developed countries do not avoid the problem of elevated fluoride concentrations precisely because of developed industries and their impact on the environment [7].
To remove elevated fluoride concentrations from water, there are numerous methods such as ion exchange, membrane processes, electrocoagulation, coagulation and precipitation and adsorption [8,9,10]. High concentrations of fluoride can be adsorbed on different materials such as activated alumina, bone carbon, oxides and hydroxides, bauxite, red mud, biomass, zeolite, activated carbon and similar porous materials [11,12].
Activated carbon is a very often used adsorbent in the water treatment process due to its developed microporous structure and the exceptional number of different functional groups on the surface, low production cost and high availability. In recent years, the use of cheap and easily available adsorbents with a high carbon content for the preparation of activated carbon has been increasing. Economical and efficient adsorbents are being developed that are potentially good adsorbents for removing pollutants from water and wastewater [13,14]. An important advantage of activated carbon is its large surface area, well-developed internal pore structure and the surface area of chemical functional groups located on the external and internal surfaces. These characteristics make AC adsorption an attractive approach to removing contaminants in water [15].
Surface modification methods such as chemical, physical, microwave treatments and impregnation can change the activated carbon into more polar materials and change the pore size distribution [15,16,17,18]. Among them, chemical surface modification methods are widely used.
Numerous authors in their research report the positive influence of oxidizing agents such as HNO3, NH3, H2O2 and HClO4, H2SO4, H2S2O4, (CH3CO)2O, KMnO4, (NH4)2S2O8, H3PO4, NaOH on increasing the adsorption capacity of activated carbon. There are changes in the structure and functional groups on the surface of activated carbon, whereby the structure of the oxidized surface of activated carbon depends on the type of oxidizing agent as well as the oxidation conditions [17,19,20,21,22,23,24]. On the basis of the above, in this work, commercially available activated carbons modified with nitric acid and hydrogen peroxide. Possible positive effects on increasing the adsorption capacity of the tested adsorbents were analyzed. The adsorption properties of activated carbons before modification were reported in previously published original research [25].
2. Materials and Methods
2.1. Preparation of adsorbents
The adsorbents used in this research are four commercially available activated carbons: Norit ROW 0.8 Supra (Norit Nederland BV), Norit GAC 1240 (Norit Nederland BV), Cullar D (Culligan International Company) and Hydraffin 30 N (Donau Carbon GmbH & Co.). The oxidation process began by mixing a sample of activated carbon and an oxidizing agent in a ratio of 1:10, after which the mixture was left at room temperature for 24 hours with occasional stirring. The mixture was then filtered using a membrane filter paper with a pore size of 0.45 µm and washed several times with deionized water until the pH was neutral. Filtered and washed activated carbon samples were dried in a dryer at 105°C, cooled in a desiccator and stored in a suitable package without access to air. Abbreviations of all tested samples are listed in Table 1.
2.2. Fluoride Adsorption Experiments
A standard fluoride solution with a concentration 100 mg/L was prepared by dissolving 0.221 g of anhydrous sodium fluoride (Sigma-Aldrich, USA) in 1 L of deionized water. Model solutions with mass concentrations of 2, 5, 10, 20, 30 and 40 mg/L were prepared by diluting the standard solution. Before adsorption, the pH value of the solutions was adjusted using 0.1 M NaOH and 0.1 M HCl solution (Kefo, Croatia). The pH adjustment was monitored using a Seven Easy pH meter (Mettler Toledo, Switzerland). Adsorption was carried out on a laboratory scale using 100 ml conical flasks with 100 ml of test solution at three different temperatures (25°C, 35°C and 45°C) in a temperature-controlled shaker (Kottermann Labortechnik) at 120 rpm. After adsorption, the aqueous solutions were filtered through 0.45 μm cellulose acetate membrane filters and the fluoride concentration was determined by the potentiometric method. To determine the initial and final concentration of fluoride in aqueous solutions were used fluoride ion selective electrode (Hach, USA) and total ionic strength adjustment buffer (TISAB) for increasing the ionic strength and ensure that other ions not interfere with the fluoride ions during the measurements. The equilibrium adsorption capacity qe (mg/g) by each used activated carbon was determined due to following equation [26]:
where c0 and ce are the initial and equilibrium fluoride concentrations in aqueous solutions (mg/L), respectively, V is the solution volume (L), and m (g) is the adsorbent mass.
2.3. Adsorption isotherm and kinetic analysis
The description of the adsorption process at different temperatures is shown using adsorption isotherms: Langmuir, Freundlich, Temkin and Dubinin-Radushkevich (Table 2.). The experimental data obtained in this work were processed with mathematical models that described the equilibrium states of adsorption processes at temperatures: 25°C, 35°C and 45°C. Adsorption isotherms for all activated carbon samples were determined by adsorption of fluoride on activated carbon using standard solutions with concentrations 2, 5, 10, 20, 30 and 40 mg/L and pH 7 during 120 minutes.
Four kinetic models were used to determine the behavior of fluoride ions during adsorption onto oxidized activated carbons: pseudo-first order, pseudo-second order, intra-particle diffusion and the Elovich model (Table 2.). In order to ensure the quality of the obtained results, each experiment was performed in duplicate and only the average values are reported. Kinetic models tested in correlation with three different adsorption temperatures (25°C, 35°C and 45°C) with an initial fluoride concentration in the model solution of 5 mg/L, adsorbent mass concentration of 10 g/L and pH 7±0,3. Adsorption was carried out in a thermostatic shaker with 120 shaking in minutes through a time period of 15, 30, 60, 120, 240 and 360 minutes.
3. Results and Discussion
3.1. Effect of Initial Fluoride Concentration
The efficiency of fluoride adsorption on oxidized activated carbons depends on the initial fluoride concentration and temperature as shown in Figure 1a–d. The influence of the initial concentration of fluoride (2, 5, 10, 20, 30 and 40 mg/L) on the adsorption capacity (qe) was determined at pH 7 and three different temperatures (25, 35 and 45°C) during 120 min using adsorbent dosage 10 g/L. The adsorption capacity of all adsorbents increases by increasing the initial concentration of fluoride as well as by increasing the adsorption temperature. The highest adsorption capacities were achieved at 45°C at the maximum concentration of fluoride in the solution (40 mg/L). At a temperature of 25°C, activated carbon oxidized with HNO3 has a higher adsorption capacity than activated carbon oxidized with H2O2. At adsorption temperatures of 35°C, the difference in adsorption capacity between the mentioned adsorbents decreases. A further increase in temperature favors an increase in the adsorption capacity of all adsorbents. HN-H2O2 active carbon has the highest adsorption capacity (1 mg/g) at 45°C.
3.2. Effect of Adsorbent Dosage
The influence of different adsorbent concentrations on adsorption was determined: 2, 4, 6, 8, 10 and 20 g/L. Adsorption was carried out for 120 min, at an initial fluoride concentration of 5 mg/L, pH 7 and temperatures of 25°C, 35°C and 45°C. As can be seen in Figure 2a–d, the amount of adsorbed fluorides in all activated carbon samples at all adsorption temperatures (25°C, 35°C and 45°C) decreases with increasing mass concentration of adsorbent, while the adsorption effect increases with increasing temperature. Adsorbents oxidized with HNO3 have a higher adsorption capacity at all adsorption temperatures, except for HN-H2O2 whose values are higher at 45°C. Increasing the temperature reduces the difference in the adsorption effect depending on the type of oxidation of the samples. Several authors point out that increasing the concentration of the adsorbent increases the number of its adsorption sites that remain unsaturated during the adsorption process. This leads to a drop in the capacity of the adsorbent (qe). There is also the possibility that agglomeration of adsorbent particles due to an increase in concentration leads to a decrease in the size of its active surface, which results in an increase in the length of the diffusion path, and thus in a decrease in the adsorption effect [31,32,33].
3.3. Effect of Contact Time
The test of adsorption efficiency over time was performed with an initial fluoride concentration of 5 mg/L, an adsorbent concentration of 10 mg/L and pH 7. Adsorption took place at 25, 35 and 45°C and 120 shaking per minute in the following time intervals: 15, 30, 60, 120, 240 and 360 min. The results of testing the influence of the contact time between the adsorbent and fluoride in the solution on the adsorption effect are shown in Figure 3a–d. Observing the obtained values, it can be observed that the adsorption of fluoride on all adsorbents increases gradually over time, whereby the intensity of binding up to 120 minutes is faster compared to the entire adsorption time of 360 minutes. The type of oxidizing agent has a greater role in the increased adsorption effect at most at 25°C, slightly less at 35°C, while at the adsorption temperature of 45°C the difference is not very pronounced. At 25°C, activated carbon oxidized with HNO3 has a better capacity with a maximum value (0.102-0.123 mg/g) compared to that oxidized with H2O2 (0.056-0.099 mg/g). The maximum adsorption capacity was achieved at a temperature of 45°C for all adsorbents, and the highest adsorption capacity has the adsorbent HN-HNO3 (0,158 mg/g). The time after which the rate of adsorption significantly slows down indicates the end of adsorption due to the assumption that the fluoride ions have filled the monolayer on the adsorbent or that multilayer adsorption has occurred by diffusion of fluoride ions into the interior of the adsorbent through the film [34].
3.4. Effect of pH
The influence of pH on the adsorption of fluoride on activated carbon was tested in the value range from 4 to 9. Adsorption was carried out at temperatures of 25, 35 and 45°C for 120 min. The fluoride concentration was 5 mg/L, and the adsorbent concentration 10 g/L. The effect of the initial pH value of the aqueous solution on the capacity of the adsorbents is shown in Figure 4a–d. Maximum adsorption capacities were recorded at pH 4 for all adsorbents oxidized with H2O2 (0,041-0,168 mg/g) and pH 6 for all adsorbents oxidized with HNO3 (0,065-0,134 mg/g). At higher pH values than when maximum efficiency is achieved, there is a decrease in the affinity towards fluoride ions at all tested adsorption temperatures (25°C, 35°C and 45°C). The appearance of a reduction in adsorption efficiency by changing the pH value below or above the optimum is due to the fact that at higher pH values there is a higher concentration of OH- ions. Due to the same negative charge, the OH- ions become competitive with fluoride ions for a place on the adsorbent, and at low pH values, fluoride ions tend to form hydrofluoric acid due to the high concentration of H+ ions in the solution [35,36].
3.5. Adsorption Isotherms
The values of the linear correlation coefficients of the obtained data (R2) for all samples suggest that the Freundlich isotherm has the best agreement with the experimental data and represents a suitable model for describing the equilibrium state of the adsorption process (Table 3.). The constant n is a parameter that is significant for describing the adsorption process in the equilibrium state defined by the Freundlich isotherm. It represents the adsorption intensity, and its value should be above one, usually in the range of 1 to 10, for the adsorption process to be satisfactory. Smaller values of the constant n suggest a lower strength of adsorption, which points to a greater heterogeneity of the adsorbent surface [37]. For all adsorbents at all three adsorption temperatures, the values of n are above 1, which indicates the success of the adsorption process. Oxidation of activated carbon with HNO3 gives generally higher values of n at all temperatures compared to activated carbon oxidized with H2O2. An increase in the adsorption temperature leads to a decrease in the strength of adsorption, which is reflected in a decrease in the value of the constant n for all adsorbents. A decrease in the Freundlich constant n with increasing temperature was also observed by Ayoob and Gupta [38] examining the effectiveness of cement as an adsorbent for the removal of fluoride from water at 17°C. Similar results were obtained by Bhaumik et al. [39] using eggshell powder as an adsorbent when, for the range of adsorption temperatures from 30°C to 60°C, the values of the constant n were from 1.18 to 1.06.
The agreement of the adsorption mechanisms with the Freundlich model is also evident through the size of the Freundlich constant KF. The constant KF refers to the relative adsorption capacity of the adsorbent, which indicates that adsorption takes place by physical forces and is not limited to the formation of a monomolecular layer on the surface of the adsorbent, but fluoride ions can still bind to the previously created layer. For all adsorbents, the KF constant increases with increasing temperature, and the values are higher for adsorbents oxidized with HNO3 compared to those oxidized with H2O2. The Freundlich constants KF and n are a measure of the adsorption capacity or the intensity of adsorption on the energetically heterogeneous surface of the adsorbent. It is also considered that the constant n represents a common measure of relative magnitude and energy diversity associated with a specific adsorption process [40]. Sepehr et al. [41] state in their study on fluoride adsorption on pumice stone that the heterogeneity of the adsorbent surface increases with the increase in the constant n of the Freundlich adsorption isotherm, as well as that the agreement of experimental data with a certain isotherm model does not necessarily mean the development of the mechanism according to the applied model, but certainly indirectly points to degree of heterogeneity of the adsorbent surface. If there are several of the same adsorption sites on the adsorbent, the mechanism of the adsorption process varies until all the sites with higher affinity towards fluoride ions are filled, whereby sites with lower affinity become dominant. Therefore, the proportion of adsorbed fluorides is the sum of all filled adsorption sites, where the sites with higher energy are occupied first. The adsorption energy decreases exponentially with the degree of filling of free adsorption sites, and is lowest at the end of the adsorption process. According to the mentioned authors, the value of the Freundlich constant (KF), which refers to the degree of retention of fluoride on the adsorbent, should be less than one, which is also in accordance with the experimental data obtained in this paper.
3.6. Kinetic Models
Determining the mechanisms of adsorption processes using different kinetic models is important in order to estimate the degree of adsorption in a certain time. Adsorption behavior on modified activated carbons was investigated using four kinetic models: pseudo-first order, pseudo-second order, interparticle diffusion and Elovich kinetic model at 25°C, 35°C and 45°C (Table 4.). The results of research the adsorption mechanism on modified activated carbons using kinetic models showed the best match with the pseudo-second order kinetic model (R2=0,964-0,999). The values of the equilibrium adsorption capacity (qm2) for all adsorbents increase with increasing temperature, as does the adsorption rate constant k2. An increase in the constant k2 results in a decrease in the rate at which fluorides are adsorbed onto activated carbon. The lower the rate at which fluoride ions are adsorbed onto activated carbon, the greater amount of fluoride will be adsorbed onto the adsorbent [42]. An increase in temperature has a positive effect on the increase of qm2 in all activated carbon samples. Modification of the surface with HNO3 favors a greater intensity of increase in the amount of adsorbed fluoride ions per adsorbent mass (0.110-0.165 mg/g) compared to modification with H2O2 (0.069-0.161 mg/g).
4. Conclusions
From the present study, it was observed that modified activated carbons shows good adsorption capacity. It was also observed that the adsorption capacity adsorbents increased with increase in initial fluoride concentration, contact time and temperature but decreased with increase in concentration of the fluoride solution. The fluoride adsorption was found to be more suitable under acidic condition with maximum adsorption capacity at pH 6 for adsorbents oxidized with HNO3 and pH 4 for adsorbents oxidized with H2O2. The adsorption capacity is more pronounced with activated carbon oxidized with HNO3 at a temperature of 25°C for all tested parameters, while an increase in temperature favors an increase in adsorption capacity with adsorbents oxidized with H2O2. Analysis of different adsorption model like Langmuir, Freundlich, Temkin and Dubinin-Radushkevich shows the best fitted with Freundlich isotherms models. This suggests that fluoride adsorption is not limited with monolayer adsorption. It was also found that the rate of adsorption can be better described by pseudo second-order model.
Funding
This research received no external funding.
Conflicts of Interest
The authors declare no conflict of interest.
References
- World Health Organization (WHO). Fluoride in Drinking-water. IWA Publishing, London, United Kingdom, 2006.
- Gebrewold, B.D.; Kijjanapanich, P.; Rene, E.R.; Lens, P.N.L.; Annachhatre, A.P. Fluoride removal from groundwater using chemically modified rice husk and corn cob activated carbon. Environ. Technol. 2019, 40(22), 2913–2927. [Google Scholar] [CrossRef] [PubMed]
- Rajkumar. S; Murugesh, S.; Sivasankar, V.; Darchen, A.; Msagati, T.A.M.; Chaabane, T. Low-cost fluoride adsorbents prepared from a renewable biowaste: Syntheses, characterization and modeling. Arab. J. Chem. 2019, 12, 3004–3017. [Google Scholar] [CrossRef]
- Bakhta, S.; Sadaoui, Z.; Bouazizi, N.; Samir, B.; Allalou, O.; Devouge-Boyer, C.; Mignot, M.; Vieillar, J. Functional activated carbon: from synthesis to groundwater fluoride removal. RSC Adv. 2022, 12, 2332–2348. [Google Scholar] [CrossRef] [PubMed]
- Islam, M.; Mishra, P.C.; Patel, R. Fluoride adsorption from aqueous solution by a hybrid thorium phosphate composite. Chem. Eng. J. 2011, 166, 978–985. [Google Scholar] [CrossRef]
- Amalraj, A.; Pius, A. Removal of fluoride from drinking water using aluminum hydroxide coated activated carbon prepared from bark of Morinda tinctorial. Appl. Water Sci. 2017, 7, 2653–2665. [Google Scholar] [CrossRef]
- Chatterjee, S.; De, S. Adsorptive removal of fluoride by activated alumina doped cellulose acetate phthalate (CAP) mixed matrix membrane. Sep. Purif. Technol. 2014, 125, 223–238. [Google Scholar] [CrossRef]
- Yang, C.; Guan, L.; Wang, J.; Yang, X.; Lin, M.; You, G.; Tan, S.; Yu, X.; Ge, M. Enhanced fluoride removal behavior and mechanism by dicalcium phosphate from aqueous solution. Environ. Technol. 2019, 40(28), 3668–3677. [Google Scholar] [CrossRef]
- Gai, W.Z.; Deng, Z.Y. A comprehensive review of adsorbents for fluoride removal from water: performance, water quality assessment and mechanism. Environ. Sci. Water Res. Technol. 2021, 7, 1362–1386. [Google Scholar] [CrossRef]
- Wei, Y.; Wang, L.; Li, H.; Yan, W.; Feng, J. Synergistic fluoride adsorption by composite adsorbents synthesized from different types of materials—A review. Front. Chem. 2022, 10. [Google Scholar] [CrossRef]
- Medikondu, K. Potable water defluoridation by lowcost adsorbents from Mimosideae family fruit carbons: A comparative study. Int. Lett. Chem. Phys. Astron. 2015, 56, 71–81. [Google Scholar]
- Zhao, M.; Wang, Q.; Krua, L.S.N.; Yi, R.; Zou, R.; Li, X.; Huang, P. Application Progress of New Adsorption Materials for Removing Fluorine from Water. Water, 2023, 15, 646.
- Asaithambi, P.; Beyene, D.; Raman, A.; Alemyehu, E. Removal of pollutants with determination of power consumption from landfill leachate wastewater using an electrocoagulation process: optimization using response surface methodology (RSM). Appl. Water Sci. 2015, 8, 1–12. [Google Scholar] [CrossRef]
- Tefera, N.; Mulualem, Y.; Fito, J. Adsorption of fluoride from aqueous solution and groundwater onto activated carbon of avocado seeds. Water Conserv. Sci. Eng. 2020, 5, 187–197. [Google Scholar] [CrossRef]
- Su, P.; Zhang, J.; Tang, J., Zhang, C. Preparation of nitric acid modified powder activated carbon to remove trace amount of Ni(II) in aqueous solution. Water Sci. Technol. 2019, 80(1), 86-97.
- Yao, S.; Zhang, J.; Shen, D.; Xiao, R.; Gu, S.; Zhao, M.; Liang, J. Removal of Pb(II) from water by the activated carbon modified by nitric acid under microwave heating. J. Colloid Interface Sci. 2016, 463, 118–127. [Google Scholar] [CrossRef] [PubMed]
- Rehman, A.; Park, M.; Park, S.J. Current progress on the surface chemical modification of carbonaceous materials. Coatings. 2019, 9(2), 1–21. [Google Scholar] [CrossRef]
- Chen, C.L.; Park, S.W.; Su, J.F.; Yu, Y.H.; Heo, J.E; Kim, K.D.; Huang, C.P. The adsorption characteristics of fluoride on commercial activated carbon treated with quaternary ammonium salts (Quats). Sci. Total Environ. 2019, 693, 133605. [Google Scholar] [CrossRef]
- Chingombe, P.; Saha, B.; Wakeman, R.J. Surface modification and characterization of a coal-based activated carbon. Carbon. 2005, 43, 3132–3143. [Google Scholar] [CrossRef]
- Bhatnagar. A., Minocha, A.K. Conventional and non-conventional adsorbens for removal of pollutants from water-A review. Indian J. Chem.Technol. 2006, 13, 2013-2017.
- Yin, C.Y.; Aroua, M.K.; Daud, W.M.A.W. Review of modifications of activated carbon for enhancing contaminant uptakes from aqueous solutions. Sep. Purif. Technol. 2007, 52, 403–415. [Google Scholar] [CrossRef]
- Mahalakshmy, R., Indraneel, P., Viswanathan, B. Surface functionalities of nitric acid treated carbon – A density functional theory based vibrational analysis. Indian J. Chem. 2009, 48, 352-356.
- Ho, S.M. A Review of chemical activating agent on the properties of activated carbon. Int. J. Chem. Res. 2022, 1, 1–13. [Google Scholar]
- Senewirathna, D.S.G.D.; Thuraisingam, S.; Prabagar, S.; Prabagar, J. Fluoride removal in drinking water using activated carbonpreparedfrom palmyrah (Borassusflabellifer) nutshells. CRGSC, 2022, 5(2022), 100304.
- Ergović Ravančić, M.; Habuda-Stanić, M. Equilibrium and kinetics studies for the adsorption of fluoride onto commercial activated carbons using fluoride ion-selective electrode. Int. J. Electrochem. Sci. 2015, 10, 8137–8149. [Google Scholar] [CrossRef]
- Paudyal, H.; Pangeni, B.; Ghimire, K.N.; Inoue, K.; Ohto, K.; Kawakita, H.; Alam, S. Adsorption behavior of orange waste gel for some rare earth ions and its application to the removal of fluoride from water. Chem. Eng. J. 2012, 195-196, 289-296.
- Swain, S.K.; Mishra, S.; Patnaik, T.; Patel, R.; Jha, U.; Dey, R. Fluoride removal performance of a new hybrid sorbent of Zr(IV)-ethylenediamine. Chem. Eng. J. 2012, 184, 72–81. [Google Scholar] [CrossRef]
- Hu, Z.J.; Wang, N.X.; Tan, J.; Chen, J.Q.; Zhong, W.Y. Kinetic and equilibrium of cafradine adsorption onto peanut husk. Desalin. Water Treat. 2012, 37, 160–168. [Google Scholar] [CrossRef]
- Babaeivelni, K.; Khodadoust, A.P. Adsorption of fluoride onto crystalline titanium dioxide: Effect of pH, ionic strength and co-existing ions. J. Colloid Interface Sci. 2013, 394, 419–427. [Google Scholar] [CrossRef] [PubMed]
- Sivasankar, V.; Murugesh, S.; Rajkumar, S.; Darchen, A. Cerium dispersed in carbon (CeDC) and its adsorption behavior: A first example of tailored adsorbent for fluoride removal from drinking water. Chem. Eng. J. 2013, 214, 45–54. [Google Scholar] [CrossRef]
- Sharma, D.C.; Forster, C.F. Removal of hexavalent chromium using sphagnum moss peat. Water Res. 1993, 27(7), 1201–1208. [Google Scholar] [CrossRef]
- Özacar, M.; Şengil, I.A. Adsorption of metal complex dyes from aqueous solutions by pine sawdust. Bioresour. Technol. 2005, 96(7), 791–795. [Google Scholar] [CrossRef]
- Swain, S.K.; Mishra, S.; Patnaik, T.; Patel, R.; Jha, U.; Dey, R. Fluoride removal performance of a new hybrid sorbent od Zr(IV)-ethylenediamine. Chem. Eng. J. 2012, 184, 72–81. [Google Scholar] [CrossRef]
- Yadav, A.K., Kaushik, C.P.; Haritash, A.K.; Kansal, A.; Rani, N. Defluoridation of groundwater using brick power as an adsorbent. J. Hazard. Mater. 2006, 128(2-3), 289-293.
- Onyango, M.S.; Kojima, Y.; Aoyi, O.; Bernardo, E.C.; Matsuda, H. Adsorption equilibrium modeling and solution chemistry dependence of fluoride removal from water by trivalent-cation-exchanged zeolite F-9. J. Colloid Interface Sci. 2004, 279(2), 341–350. [Google Scholar] [CrossRef]
- Eskandarpour, A.; Onyango, M.; Ochieng, A.; Asai, S. Removal of fluoride ions from aqueous solution at low pH using schwertmannite. J. Hazard. Mater. 2008, 152(2), 571–579. [Google Scholar] [CrossRef]
- Sujana, M.G.; Pradhan, H.K.; Anand, S. Studies on sorption of some geomaterials for fluoride removal from aqueous solutions. J. Hazard. Mater. 2009, 161(1), 120–125. [Google Scholar] [CrossRef]
- Ayoob, S.; Gupta, A.K. Insights into isotherm making in the sorptive removal of fluoride from drinking water. J. Hazard. Mater. 2008, 152(3), 976–958. [Google Scholar] [CrossRef]
- Bhaumik, R.; Mondal, N.K.; Das, B.; Roy, P.; Pal, K.C.; Das, C.; Baneerjee, A.; Datta, J.K. Eggshell powder as an adsorbent for removal of fluoride from aqueous solution: Equilibrium, kinetic and thermodynamic studies. J. Chem. 2012, 9, 1457–1480. [Google Scholar] [CrossRef]
- Weber, W.J.; McGinley, P.M.; Katz, L.E. A distributed reactivity model for sorption by soils and sediments – Conceptual basis and equilibrium assessments. Environ. Sci. Technol. 1992, 26(10), 1955–1962. [Google Scholar] [CrossRef]
- Sepehr, M.N.; Sivasankar, V.; Zarrabi, M.; Kumar, M.S. Surface modification of pumice enhancing its fluoride adsorption capacity: An insight into kinetic and thermodynamic studies. Chem. Eng. J. 2013, 228, 192–204. [Google Scholar] [CrossRef]
- Zhang, S.; Lu, Y.; Lin, X.; Su, X.; Zhang, Y. Removal of fluoride from groundwater by adsorption onto La(III)-Al(III) loaded scoria adsorbent. Appl. Surf. Sci. 2014, 303, 1–5. [Google Scholar] [CrossRef]
Figure 1.
Effect of initial fluoride concentration and temperature onto fluoride adsorption capacities (mg/g) of (a) NR-HNO3 and NR-H2O2, (b) NG-HNO3 and NG-H2O2, (c) CD-HNO3 and CD-H2O2 (d) HN-HNO3 and HN-H2O2
Figure 1.
Effect of initial fluoride concentration and temperature onto fluoride adsorption capacities (mg/g) of (a) NR-HNO3 and NR-H2O2, (b) NG-HNO3 and NG-H2O2, (c) CD-HNO3 and CD-H2O2 (d) HN-HNO3 and HN-H2O2
Figure 2.
Effect of adsorbent dose and temperature onto fluoride adsorption capacities (mg/g) of (a) NR-HNO3 and NR-H2O2, (b) NG-HNO3 and NG-H2O2, (c) CD-HNO3 and CD-H2O2 (d) HN-HNO3 and HN-H2O2
Figure 2.
Effect of adsorbent dose and temperature onto fluoride adsorption capacities (mg/g) of (a) NR-HNO3 and NR-H2O2, (b) NG-HNO3 and NG-H2O2, (c) CD-HNO3 and CD-H2O2 (d) HN-HNO3 and HN-H2O2
Figure 3.
Effect of contact time and temperature onto fluoride adsorption capacities (mg/g) of (a) NR-HNO3 and NR-H2O2, (b) NG-HNO3 and NG-H2O2, (c) CD-HNO3 and CD-H2O2 (d) HN-HNO3 and HN-H2O2
Figure 3.
Effect of contact time and temperature onto fluoride adsorption capacities (mg/g) of (a) NR-HNO3 and NR-H2O2, (b) NG-HNO3 and NG-H2O2, (c) CD-HNO3 and CD-H2O2 (d) HN-HNO3 and HN-H2O2
Figure 4.
Effect of pH and temperature onto fluoride adsorption capacities (mg/g) of (a) NR-HNO3 and NR-H2O2, (b) NG-HNO3 and NG-H2O2, (c) CD-HNO3 and CD-H2O2 (d) HN-HNO3 and HN-H2O2
Figure 4.
Effect of pH and temperature onto fluoride adsorption capacities (mg/g) of (a) NR-HNO3 and NR-H2O2, (b) NG-HNO3 and NG-H2O2, (c) CD-HNO3 and CD-H2O2 (d) HN-HNO3 and HN-H2O2
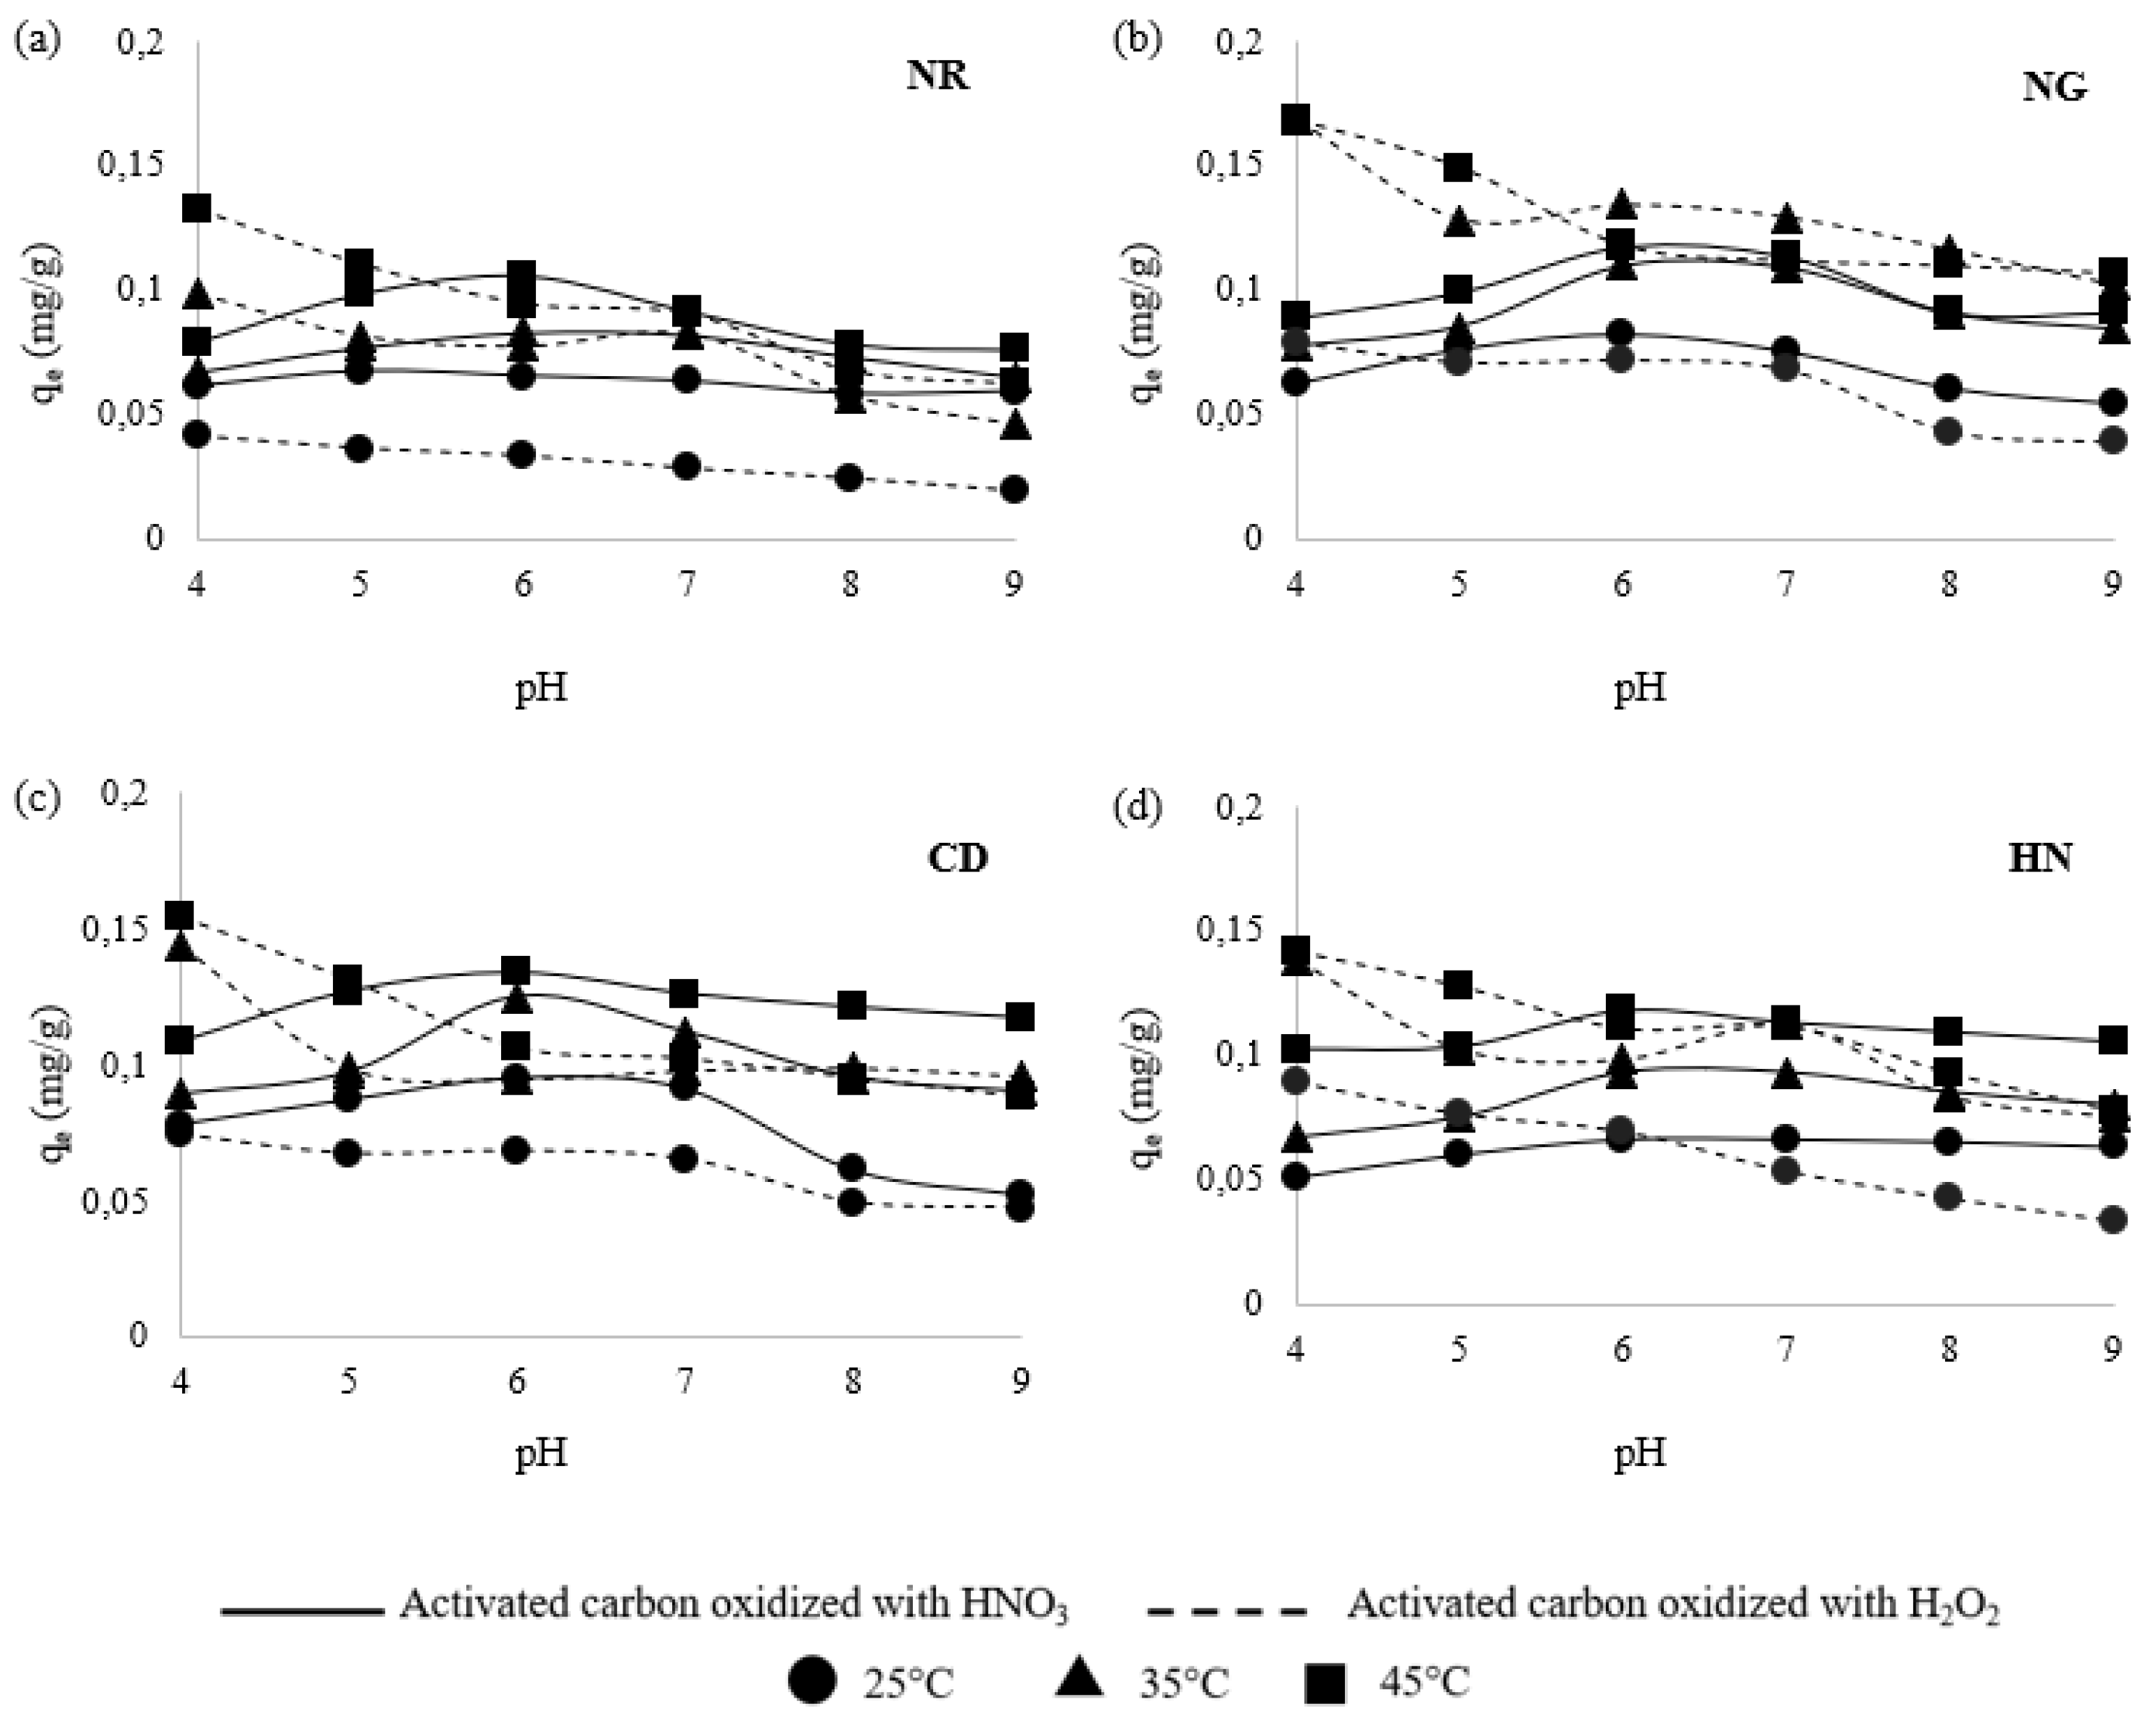

Table 1.
Abbreviations of adsorbents .
| Activated carbon | Activated carbon oxidized with HNO3 | Activated carbon oxidized with H2O2 |
|---|---|---|
| Norit ROW 0,8 SUPRA | NR-HNO3 | NR-H2O2 |
| Norit GAC 1240 | NG-HNO3 | NG-H2O2 |
| Cullar D | CD-HNO3 | CD-H2O2 |
| Hidraffyn 30 N | HN-HNO3 | HN-H2O2 |
| Isotherm | Langmuir | Freundlich | Temkin | Dubinin- Radushkevich |
| Equation | ||||
| qe = equilibrium adsorption capacity (mg/g); qm = maximum adsorption capacity (mg/g); KL = Langmuir isotherm constant(L/mg); Ce = equilibrium concentration of adsorbate (mg/L); n = Freundlich adsorption intensity; KF = Freundlich isotherm constant (mg/g)(mg/L)1/n; R = universal gas constant (J/molK); T= temperature (K); AT= Temkin equilibrium binding constant (L/g); KDR – Dubinin-Raduschkevich constant (mol2/kJ2); ε – Polanyi potential | ||||
| Kinetic model | Pseudo-first order | Pseudo-second order | Intra-particle diffusion | Elovich |
| Equation | ||||
| qm1 – equilibrium adsorption capacity (mg/g); qt – adsorption capacity in time t (mg/g); t – time (min); k1 – pseudo-first-order adsorption rate constant (min-1); qm2 – equilibrium adsorption capacity (mg/g); k2 – pseudo-second-order adsorption rate constant (g/mg min); kid – interparticle diffusion rate constant (mg/g min1/2); C – thickness of the boundary layer; α – initial adsorption rate (mg/g min); β – desorption constant (g/mg) | ||||
Table 3.
Isotherm models for adsorption of fluoride onto adsorbents
| Isotherm | |||||||||||||
| Langmuir | Freundlich | Temkin | Dubinin- Radushkevich | ||||||||||
| qm (mg/ g) | KL (L/ mg) | R2 | n | KF (mg/g) (L/mg)1/n | R2 | AT (L/ g) | BT | R2 | qm (mg/ g) | KDR (mol2/kJ) | R2 | ||
| 25°C | NR-HNO3 | 0,417 | 0,044 | 0,889 | 1,554 | 0,026 | 0,986 | 0,686 | 0,075 | 0,911 | 0,164 | 1·10-6 | 0,653 |
| NG-HNO3 | 1,089 | 0,021 | 0,863 | 1,257 | 0,027 | 0,993 | 0,554 | 0,141 | 0,903 | 0,738 | 2·10-7 | 0,458 | |
| CD-HNO3 | 2,112 | 0,012 | 0,739 | 1,151 | 0,030 | 0,998 | 0,523 | 0,189 | 0,886 | 0,337 | 1·10-6 | 0,709 | |
| HN-HNO3 | 1,565 | 0,010 | 0,588 | 1,146 | 0,019 | 0,995 | 0,461 | 0,129 | 0,877 | 0,221 | 2·10-6 | 0,672 | |
| NR-H2O2 | 0,153 | 0,067 | 0,852 | 1,492 | 0,012 | 0,904 | 0,779 | 0,034 | 0,864 | 0,087 | 2·10-6 | 0,849 | |
| NG-H2O2 | 0,271 | 0,103 | 0,835 | 1,542 | 0,026 | 0,935 | 0,865 | 0,068 | 0,809 | 0,178 | 1·10-6 | 0,808 | |
| CD-H2O2 | 0,578 | 0,028 | 0,931 | 1,327 | 0,021 | 0,997 | 0,569 | 0,088 | 0,922 | 0,178 | 1·10-6 | 0,718 | |
| HN-H2O2 | 0,983 | 0,014 | 0,809 | 1,888 | 0,016 | 0,999 | 0,486 | 0,103 | 0,881 | 0,188 | 2·10-6 | 0,714 | |
| 35°C | NR-HNO3 | 0,656 | 0,037 | 0,961 | 1,375 | 0,029 | 0,993 | 0,642 | 0,111 | 0,939 | 0,239 | 1·10-6 | 0,776 |
| NG-HNO3 | 1,047 | 0,034 | 0,937 | 1,224 | 0,035 | 0,981 | 0,653 | 0,170 | 0,957 | 0,677 | 2·10-7 | 0,539 | |
| CD-HNO3 | 1,557 | 0,021 | 0,948 | 1,199 | 0,036 | 0,996 | 0,579 | 0,191 | 0,914 | 0,371 | 1·10-6 | 0,773 | |
| HN-HNO3 | 1,129 | 0,025 | 0,847 | 1,275 | 0,035 | 0,993 | 0,596 | 0,160 | 0,903 | 0,313 | 1·10-6 | 0,710 | |
| NR-H2O2 | 1,010 | 0,018 | 0,866 | 1,232 | 0,023 | 0,999 | 0,526 | 0,122 | 0,897 | 0,229 | 1·10-6 | 0,706 | |
| NG-H2O2 | 1,327 | 0,023 | 0,986 | 1,203 | 0,035 | 0,998 | 0,639 | 0,159 | 0,911 | 0,352 | 1·10-6 | 0,759 | |
| CD-H2O2 | 1,197 | 0,016 | 0,861 | 1,178 | 0,032 | 0,999 | 0,534 | 0,201 | 0,891 | 0,362 | 1·10-6 | 0,719 | |
| HN-H2O2 | 1,263 | 0,024 | 0,867 | 1,213 | 0,033 | 0,991 | 0,584 | 0,172 | 0,919 | 0,333 | 1·10-6 | 0,731 | |
| 45°C | NR-HNO3 | 0,927 | 0,028 | 0,927 | 1,294 | 0,031 | 0,995 | 0,599 | 0,128 | 0,922 | 0,280 | 1·10-6 | 0,759 |
| NG-HNO3 | 2,465 | 0,013 | 0,959 | 1,129 | 0,036 | 0,991 | 0,545 | 0,223 | 0,902 | 0,631 | 3·10-7 | 0,447 | |
| CD-HNO3 | 1,929 | 0,021 | 0,911 | 1,158 | 0,042 | 0,992 | 0,601 | 0,232 | 0,935 | 0,449 | 1·10-6 | 0,771 | |
| HN-HNO3 | 2,409 | 0,013 | 0,609 | 1,182 | 0,039 | 0,996 | 0,551 | 0,222 | 0,855 | 0,390 | 1·10-6 | 0,682 | |
| NR-H2O2 | 1,367 | 0,015 | 0,970 | 1,167 | 0,025 | 0,999 | 0,522 | 0,147 | 0,914 | 0,276 | 1·10-6 | 0,745 | |
| NG-H2O2 | 1,496 | 0,021 | 0,959 | 1,203 | 0,035 | 0,998 | 0,639 | 0,159 | 0,911 | 0,352 | 1·10-6 | 0,759 | |
| CD-H2O2 | 1,950 | 0,013 | 0,902 | 1,148 | 0,036 | 0,999 | 0,556 | 0,206 | 0,898 | 0,378 | 1·10-6 | 0,721 | |
| HN-H2O2 | 4,570 | 0,009 | 0,950 | 1,076 | 0,046 | 0,998 | 0,574 | 0,310 | 0,911 | 0,554 | 1·10-6 | 0,755 | |
Table 4.
Kinetic models for adsorption of fluoride onto adsorbents.
| Kinetic model | ||||||||||||||||||||
| Pseudo-first order | Pseudo-second order | Intra-particle diffusion | Elovich | |||||||||||||||||
| qm1 (mg/g) | k1(g/mg min) | R2 | qm2 (mg/g) | k2(g/mg min | R2 | ki(mg/gmin1/2) | C | R2 | α (mg/g min) | β (g/mg) | R2 | |||||||||
| 25°C | NR-HNO3 | 0,068 | 0,006 | 0,921 | 0,110 | 0,131 | 0,966 | 0,004 | 0,026 | 0,949 | 0,823 | 54,05 | 0,906 | |||||||
| NG-HNO3 | 0,083 | 0,005 | 0,889 | 0,135 | 0,133 | 0,977 | 0,005 | 0,021 | 0,851 | 0,670 | 38,02 | 0,966 | ||||||||
| CD-HNO3 | 0,064 | 0,007 | 0,979 | 0,133 | 0,261 | 0,995 | 0,004 | 0,049 | 0,974 | 0,952 | 48,02 | 0,987 | ||||||||
| HN-HNO3 | 0,086 | 0,007 | 0,936 | 0,126 | 0,118 | 0,989 | 0,004 | 0,192 | 0,966 | 0,723 | 45,66 | 0,867 | ||||||||
| NR-H2O2 | 0,059 | 0,012 | 0,978 | 0,069 | 0,158 | 0,982 | 0,003 | 0,002 | 0,963 | 0,614 | 69,44 | 0,942 | ||||||||
| NG-H2O2 | 0,052 | 0,021 | 0,890 | 0,120 | 0,116 | 0,977 | 0,005 | 0,011 | 0,963 | 0,633 | 42,55 | 0,918 | ||||||||
| CD-H2O2 | 0,047 | 0,007 | 0,888 | 0,077 | 0,211 | 0,983 | 0,003 | 0,010 | 0,881 | 0,667 | 62,11 | 0,938 | ||||||||
| HN-H2O2 | 0,058 | 0,007 | 0,996 | 0,087 | 0,198 | 0,991 | 0,003 | 0,014 | 0,993 | 0,933 | 62,89 | 0,944 | ||||||||
| 35°C | NR-HNO3 | 0,106 | 0,009 | 0,903 | 0,125 | 0,184 | 0,964 | 0,005 | 0,034 | 0,953 | 0,818 | 40,32 | 0,876 | |||||||
| NG-HNO3 | 0,095 | 0,013 | 0,990 | 0,151 | 0,137 | 0,996 | 0,005 | 0,031 | 0,919 | 0,742 | 38,17 | 0,969 | ||||||||
| CD-HNO3 | 0,066 | 0,009 | 0,936 | 0,151 | 0,312 | 0,996 | 0,004 | 0,069 | 0,944 | 0,761 | 48,08 | 0,993 | ||||||||
| HN-HNO3 | 0,087 | 0,006 | 0,902 | 0,157 | 0,155 | 0,985 | 0,005 | 0,039 | 0,960 | 0,793 | 35,84 | 0,974 | ||||||||
| NR-H2O2 | 0,051 | 0,009 | 0,977 | 0,091 | 0,321 | 0,995 | 0,004 | 0,003 | 0,964 | 0,890 | 64,52 | 0,982 | ||||||||
| NG-H2O2 | 0,058 | 0,009 | 0,873 | 0,127 | 0,295 | 0,999 | 0,004 | 0,056 | 0,806 | 0,891 | 50,25 | 0,937 | ||||||||
| CD-H2O2 | 0,077 | 0,011 | 0,981 | 0,132 | 0,246 | 0,999 | 0,005 | 0,040 | 0,884 | 0,826 | 40,65 | 0,981 | ||||||||
| HN-H2O2 | 0,076 | 0,016 | 0,998 | 0,111 | 0,227 | 0,999 | 0,004 | 0,038 | 0,896 | 0,914 | 51,54 | 0,977 | ||||||||
| 45°C | NR-HNO3 | 0,054 | 0,006 | 0,933 | 0,149 | 0,337 | 0,993 | 0,004 | 0,057 | 0,915 | 0,752 | 59,52 | 0,945 | |||||||
| NG-HNO3 | 0,129 | 0,016 | 0,975 | 0,188 | 0,172 | 0,997 | 0,006 | 0,036 | 0,935 | 0,748 | 34,60 | 0,981 | ||||||||
| CD-HNO3 | 0,074 | 0,010 | 0,988 | 0,158 | 0,355 | 0,998 | 0,004 | 0,081 | 0,932 | 0,634 | 50,51 | 0,981 | ||||||||
| HN-HNO3 | 0,085 | 0,006 | 0,911 | 0,165 | 0,173 | 0,986 | 0,005 | 0,051 | 0,953 | 0,908 | 36,63 | 0,969 | ||||||||
| NR-H2O2 | 0,112 | 0,008 | 0,989 | 0,160 | 0,399 | 0,992 | 0,007 | 0,002 | 0,979 | 0,164 | 30,84 | 0,989 | ||||||||
| NG-H2O2 | 0,078 | 0,010 | 0,981 | 0,155 | 0,413 | 0,998 | 0,005 | 0,068 | 0,939 | 0,808 | 45,05 | 0,992 | ||||||||
| CD-H2O2 | 0,095 | 0,013 | 0,965 | 0,159 | 0,299 | 0,999 | 0,006 | 0,049 | 0,835 | 0,817 | 33,56 | 0,949 | ||||||||
| HN-H2O2 | 0,086 | 0,014 | 0,821 | 0,161 | 0,342 | 0,998 | 0,006 | 0,051 | 0,814 | 0,810 | 32,36 | 0,936 | ||||||||
Disclaimer/Publisher’s Note: The statements, opinions and data contained in all publications are solely those of the individual author(s) and contributor(s) and not of MDPI and/or the editor(s). MDPI and/or the editor(s) disclaim responsibility for any injury to people or property resulting from any ideas, methods, instructions or products referred to in the content. |
© 2024 by the authors. Licensee MDPI, Basel, Switzerland. This article is an open access article distributed under the terms and conditions of the Creative Commons Attribution (CC BY) license (http://creativecommons.org/licenses/by/4.0/).
Copyright: This open access article is published under a Creative Commons CC BY 4.0 license, which permit the free download, distribution, and reuse, provided that the author and preprint are cited in any reuse.


