Submitted:
26 October 2024
Posted:
29 October 2024
You are already at the latest version
Abstract
Among women globally, breast cancer is a major cause of cancer-related death. Accurate and timely diagnosis is essential, and results can be significantly improved. A new era in image analysis has been brought about by the emergence of artificial intelligence (AI), which has made significant progress in the diagnosis and customization of treatment plans for breast cancer possible. This study aimed to develop a comprehensive AI framework for breast cancer detection by integrating convolutional neural networks (CNNs) for image analysis with an artificial neural network (ANN) for clinical data. Using a dataset of ultrasound and pathology images, along with clinical features from 569 patients, we trained CNN models to classify breast tissue as benign or malignant, and the ANN to process clinical data for the same task. The combined approach significantly enhanced the accuracy of breast cancer diagnosis, achieving over 96% accuracy by leveraging both imaging and clinical data. Class Activation Maps (CAM) and heatmaps provided valuable interpretability for CNN predictions, improving trust and transparency in the model’s decision-making process. The results demonstrate that the fusion of CNNs and ANNs enhances diagnostic accuracy and offers a promising tool for early breast cancer detection, while providing crucial insights for clinical validation.
Keywords:
breast cancer
; convolutional neural network
; imaging
; machine learning
; prediction
1. Introduction
As one of the top causes of death for women globally, breast cancer requires early and precise detection techniques to enhance patient outcomes. The identification of breast cancer has been made possible using conventional diagnostic instruments including mammography, ultrasound, and biopsy. The use of novel therapeutic approaches customized to individual tumor features has greatly enhanced the prognosis of patients. The system is frequently overworked, from the difficulties caused by overdiagnosis in low-risk populations to the demanding workload carried out by the decreasing number of radiologists and pathologists [1].
In every nation on the planet, cancer is one of the main causes of mortality and a major obstacle to raising life expectancy. As per the World Health Organization's (WHO) 2019 estimations, cancer ranks first or second in 112 out of 183 nations and ranks third or fourth in 23 other countries as the primary cause of death before the age of 70 [2]. The fact that cancer is becoming a more common cause of death is partially because, in many nations, the mortality rates from stroke and coronary heart disease have significantly decreased in comparison to cancer [2]. Imaging technologies can be used to diagnose breast cancer early on, but integrated imaging approaches can offer more information about managing the illness [3]. Ultrasonography, screening mammography, and combinations of these treatments are examples of complementary imaging [4]. According to Berg and colleagues (2008), combining the screening ultrasonography with mammography would significantly reduce the number of cases diagnosed, but it will also significantly increase the number of false positives [5]. Because of variations in physical properties, pictures produced by imaging devices display variances in contrast. X-ray-based cancer imaging approaches are not receiving as much attention as digital imaging technologies. To identify cancer, stage it, evaluate the effectiveness of treatment, and direct biopsy operations, a magnetic resonance system is employed [4].
Mammography is a widely used screening method that looks for cancer and is often used to identify the illness [6]. Ultrasonography is a common imaging treatment used to diagnose breast cancer. It has developed to such an extent in recent years that breast imaging is now possible [6]. A follow-up examination using ultrasound technology can help to clarify unclear findings. The orientation and shape of breasts, which are mostly fatty and dense, may be evaluated by ultrasonography. Extended field of view imaging provides a high-resolution, panoramic picture of the breast. One common method for utilizing ultrasonic detection to find breast lesions is elastic sonography [7]. Contrast-enhanced ultrasound is used to identify and track the effectiveness of local therapy. This method uses gas microbubbles that are administered intravenously. Three-dimensional ultrasonography can be used to determine the volume of a lesion [7].
Artificial intelligence (AI) has become a powerful tool in the field of medical imaging and diagnostics in recent years. AI has shown remarkable capability in analyzing large medical datasets, such as MRIs and mammograms, and has frequently achieved accuracy levels that are on par with or even higher than those of human experts [8]. Artificial intelligence (AI) is useful in the early diagnosis and identification of breast cancer because it can identify small patterns and anomalies that are difficult for humans to notice [9]. Through its ability to predict treatment success, suggest personalized medications, and evaluate genetic information and patient histories, artificial intelligence also has an impact on the personalization of pharmaceuticals [10]. This customized approach enhances treatment results while lowering the risk of negative effects [10]. In addition to its uses in diagnosis and treatment, artificial intelligence is essential to research and medication development. It speeds up the processing of large datasets that may reveal therapeutic targets and biomarkers for breast cancer, guiding choices and accelerating the drug discovery process [11]. Additionally, AI-powered predictive modelling helps evaluate patient risk factors, allowing medical professionals to pinpoint those who are more likely to acquire breast cancer. This makes prompt interventions and preventative measures possible [12].
This paper presents the development, implementation, and evaluation of a hybrid Convolutional Neural Network (CNN) and Artificial Neural Network (ANN) model designed to enhance the accuracy of breast cancer detection. By combining the strengths of CNNs, which excel at image recognition and analysis, with the predictive power of ANNs, which handle structured clinical data, we aim to create a more robust diagnostic tool. We compare the performance of individual models—CNNs for medical imaging (ultrasound and pathological images) and ANNs for clinical data—with the combined hybrid model, demonstrating how the integration of multi-modal data significantly improves detection rates. The results underscore the potential for hybrid AI models to offer more accurate, reliable, and comprehensive solutions in medical diagnostics, addressing current limitations in breast cancer detection methods.
2. Materials and Methods
In this study, we developed three distinct artificial intelligence (AI) models using a combination of image-based and clinical data to predict breast cancer status. The models were designed to process ultrasound images, pathological images, and clinical features to classify whether a given case is benign or malignant. The goal was to create a multimodal approach that integrates different diagnostic techniques for more accurate and comprehensive predictions.
We used a dataset consisting of three components: (1) 100 ultrasound images of breast tissue, (2) 100 pathology images from breast biopsies, and (3) clinical data from 100 patients, each represented by 30 distinct features, including mean radius, texture, perimeter, and several other morphological measurements. To develop the models, we utilized Python 3 along with the Keras deep learning library. We constructed two Convolutional Neural Networks (CNNs) to analyze the ultrasound and pathology images separately. These CNN models were tasked with identifying the presence of malignant or benign tissue based on imaging data. Additionally, an Artificial Neural Network (ANN) was designed to analyze clinical data, with the objective of classifying malignancy based on various patient-specific features.
2.1. Datasets and Symptom Analysis
2.1.1. Image Data
The dataset used in this study includes two types of medical images: ultrasound images and pathology images.
- Ultrasound Images: A total of 100 breast ultrasound images were collected. Ultrasound imaging is commonly used in breast cancer detection due to its non-invasive nature and ability to distinguish between solid masses and cysts. These images typically help in identifying the presence of lumps or abnormalities in breast tissue. The dataset includes both benign and malignant cases, which were pre-labelled.
- Pathology Images: Additionally, 100 pathology images were included in the dataset. Pathological images provide a microscopic view of breast tissue and are critical for confirming cancer diagnoses. These images are highly detailed and allow for the observation of cellular structures, which are indicative of cancerous changes in the tissue. The pathology dataset also contains both benign and malignant cases, providing an opportunity for the model to learn from diverse patterns.
Both image datasets were pre-processed to ensure compatibility with the AI models. Each image was resized to 100x100 pixels and converted to a three-channel RGB format (100x100x3), allowing the CNN models to process the image data effectively. The choice of 100x100 resolution balanced computational efficiency with the need for preserving sufficient image detail for accurate analysis.
2.1.2. Clinical Data
Clinical data from 100 patients were used to train an Artificial Neural Network (ANN) model. Each patient’s dataset consists of 30 features that capture various physical and morphological properties of breast tumors, which are essential in diagnosing breast cancer. These features are derived from imaging measurements, such as the radius, texture, and smoothness of the tumors, and provide crucial information about the potential malignancy of the tissue.
- ID: A unique identifier assigned to each patient in the dataset. This feature does not contribute to the predictive model but is used to track and distinguish patient records.
- Radius Mean: The average distance from the center to the perimeter of the tumor. This feature reflects the size of the tumor, where larger radius may indicate a higher likelihood of malignancy.
- Texture Mean: Represents the variation in gray levels within the tumor, which corresponds to the roughness of the tumor surface. Tumors with uneven textures are more likely to be cancerous.
- Perimeter Mean: The average length around the boundary of the tumor. A longer perimeter often indicates an irregular tumor shape, which can be associated with malignant growth.
- Area Mean: The mean area occupied by the tumor cells. Larger areas tend to correlate with more aggressive tumor types and higher chances of malignancy.
- Smoothness Mean: Measures the regularity of the tumor's borders. Benign tumors generally have smoother edges, while malignant tumors tend to have more jagged or irregular borders.
- Compactness Mean: A measure of how closely packed the tumor cells are, calculated using the perimeter and area. Higher compactness can indicate malignancy, as cancerous cells often exhibit irregular, tight clustering.
- Concavity Mean: The degree to which parts of the tumor contour are indented. More concavities suggest irregular shapes, often associated with malignant tumors.
- Concave Points Mean: The number of distinct concave areas or "inward dents" in the tumor's boundary. More concave points typically indicate a higher risk of cancer.
- Symmetry Mean: Describes how symmetrical the tumor is. Benign tumors are generally more symmetrical, while malignant tumors tend to show asymmetry.
- Fractal Dimension Mean: A measure of the complexity of the tumor’s boundary, quantifying how detailed or rough the edges are. Higher fractal dimensions can indicate a more irregular, and potentially cancerous, tumor shape.
Standard Error Values (SE)
- Radius SE: The standard deviation of the radius, indicating variability in tumor size within the sample. Higher variability can be a sign of aggressive, heterogeneous tumors.
- Texture SE: Measures how much the texture varies across different sections of the tumor. High texture variability may indicate uneven growth, often seen in malignant tumors.
- Perimeter SE: Describes how much the perimeter measurements differ across the tumor. Greater deviations in perimeter can suggest irregular tumor growth, common in cancerous tissues.
- Area SE: Shows the variability in the tumor's area measurements, with greater variation possibly indicating more aggressive or invasive cancer.
- Smoothness SE: Indicates how much the smoothness of the tumor’s borders varies. Large fluctuations in smoothness can suggest inconsistent cell growth, often linked to malignancy.
- Compactness SE: Shows the degree of variation in how tightly packed the tumor cells are. High variation may indicate that the tumor is cancerous, as malignant cells often exhibit abnormal packing.
- Concavity SE: The standard deviation of the concavities, showing the variability in the indentations along the tumor’s contour. Malignant tumors often exhibit more irregular concavity.
- Concave Points SE: Measures the variability in the number of concave points. A higher standard error can signal irregular tumor shapes, commonly associated with malignancy.
- Symmetry SE: The standard deviation of the symmetry values across the tumor. Greater variation in symmetry may be a red flag for cancerous growth.
- Fractal Dimension SE: Measures the variability in the fractal dimension, which can indicate how much the complexity of the tumor’s boundary fluctuates. Higher values often correlate with malignancy.
Worst (Max) Values
- Radius Worst: The largest radius observed in the tumor sample. Larger radii can suggest more aggressive or advanced cancer.
- Texture Worst: The highest variation in texture observed in any part of the tumor. Irregular texture at its worst often indicates malignancy.
- Perimeter Worst: The longest perimeter measurement, representing the largest observed boundary. Larger, irregular boundaries often point to malignancy.
- Area Worst: The maximum area occupied by tumor cells. Larger areas often correlate with more advanced stages of cancer.
- Smoothness Worst: The most irregular borders observed. High smoothness variability can signal more invasive cancer.
- Compactness Worst: The highest level of cell compactness observed. Extremely compact cell formations are more commonly seen in cancerous tumors.
- Concavity Worst: The deepest concavity or inward curve along the tumor's boundary. A more pronounced concavity often signals malignancy.
- Concave Points Worst: The maximum number of concave points identified. More concave points are a red flag for irregular, cancerous growth.
- Symmetry Worst: The most asymmetrical shape of the tumor. Malignant tumors tend to have more irregular, asymmetrical growth patterns.
- Fractal Dimension Worst: The most complex boundary found in the tumor. Higher fractal dimension values are associated with irregular and invasive cancer growth.
2.2. Machine Learning Model
In this study, a convolutional neural network (CNN) model was developed for image-based breast cancer detection, utilizing Python and the Keras library. The process began by converting input images to 1D arrays. Images were pre-processed using OpenCV to resize them to 100x100 pixels, followed by flattening into a 1D array of 30,000 elements, ensuring compatibility with the model’s structure. Subsequently, the image data was stored in CSV files to streamline the training process. Once the image data was prepared, it was loaded into the system, normalized, and reshaped into a 4D tensor (100x100x3) suitable for the CNN model. The model architecture consisted of several convolutional layers (Conv2D) with ReLU activation functions and max-pooling layers to reduce dimensionality. The CNN employed two sets of convolutional layers, each followed by max-pooling. After flattening the convolutional layers, two fully connected dense layers were added, with the final layer using a sigmoid activation function for binary classification (benign vs. malignant). The model was compiled using the Adam optimizer and binary cross-entropy loss, while training was conducted for 20 epochs with a batch size of 16. The training history, including accuracy and loss over epochs, was visualized using matplotlib.
To evaluate model performance, confusion matrices and classification reports were generated, comparing predicted and actual labels. Additionally, data augmentation was performed using Keras's “ImageDataGenerator” to create a robust dataset for training and testing. The CNN model showed high predictive accuracy and performance on breast cancer ultrasound images, distinguishing between benign and malignant tissues. For further experimentation, a heatmap visualization technique (Grad-CAM) was employed to highlight important regions in the images that contributed to the model's predictions. This approach offered interpretability by mapping the CNN's learned features onto the original images.
In addition to the CNN, an artificial neural network (ANN) was implemented to classify clinical data from breast cancer patients. The dataset was standardized using a scaler, and the model architecture consisted of a simple feed-forward network with fully connected layers. The input layer handled 31 features, followed by two dense layers with ReLU and sigmoid activations for binary classification. This model was trained using the Adam optimizer and sparse categorical cross-entropy loss. The performance of the ANN was evaluated through accuracy and loss curves, as well as a confusion matrix to measure precision, recall, and F1 score. Both the CNN and ANN models exhibited strong performance in breast cancer classification tasks. The CNN excelled in image-based diagnosis, while the ANN provided accurate predictions based on clinical data, demonstrating the versatility and effectiveness of deep learning in medical applications.
3. Result
In this study, we created a CNN model for predicting the situation of being benign or malign tissue. The results of our experimental setting, which assessed the effectiveness of our AI models created for cancer detection, are shown in this part. The models' F1-score, recall, precision, and prediction accuracy on the training and test datasets are highlighted in the findings' structured format. The effectiveness of artificial neural networks (ANN) for clinical data and convolutional neural networks (CNN) for image categorization (pathology and ultrasound pictures) is compared. By using these criteria, we want to verify the AI models' ability to accurately identify benign from malignant instances and evaluate how well they generalize to a variety of data formats.
3.1. CNN-Based Classification of Ultrasound Images for Breast Cancer Detection
The study utilized a dataset of 100 ultrasound pictures, equally divided between cases of normal (50 photos) and cancerous (50 images) breast tissue that is shown at Graph. Because ultrasound imaging is non-invasive, it may identify breast cancer in real time, and can distinguish between solid and cystic tumors, it is an essential tool in the fight against breast cancer. Because of this, mammography may not be as effective in detecting problems in thick breast tissues. The convolutional neural network (CNN) model is trained to discriminate between benign and malignant situations using the photos as input. This model serves as a foundation for additional diagnostic predictions.
Figure 1.
Model Accuracy and Loss Graphs of Ultrasound Based CNN Model.
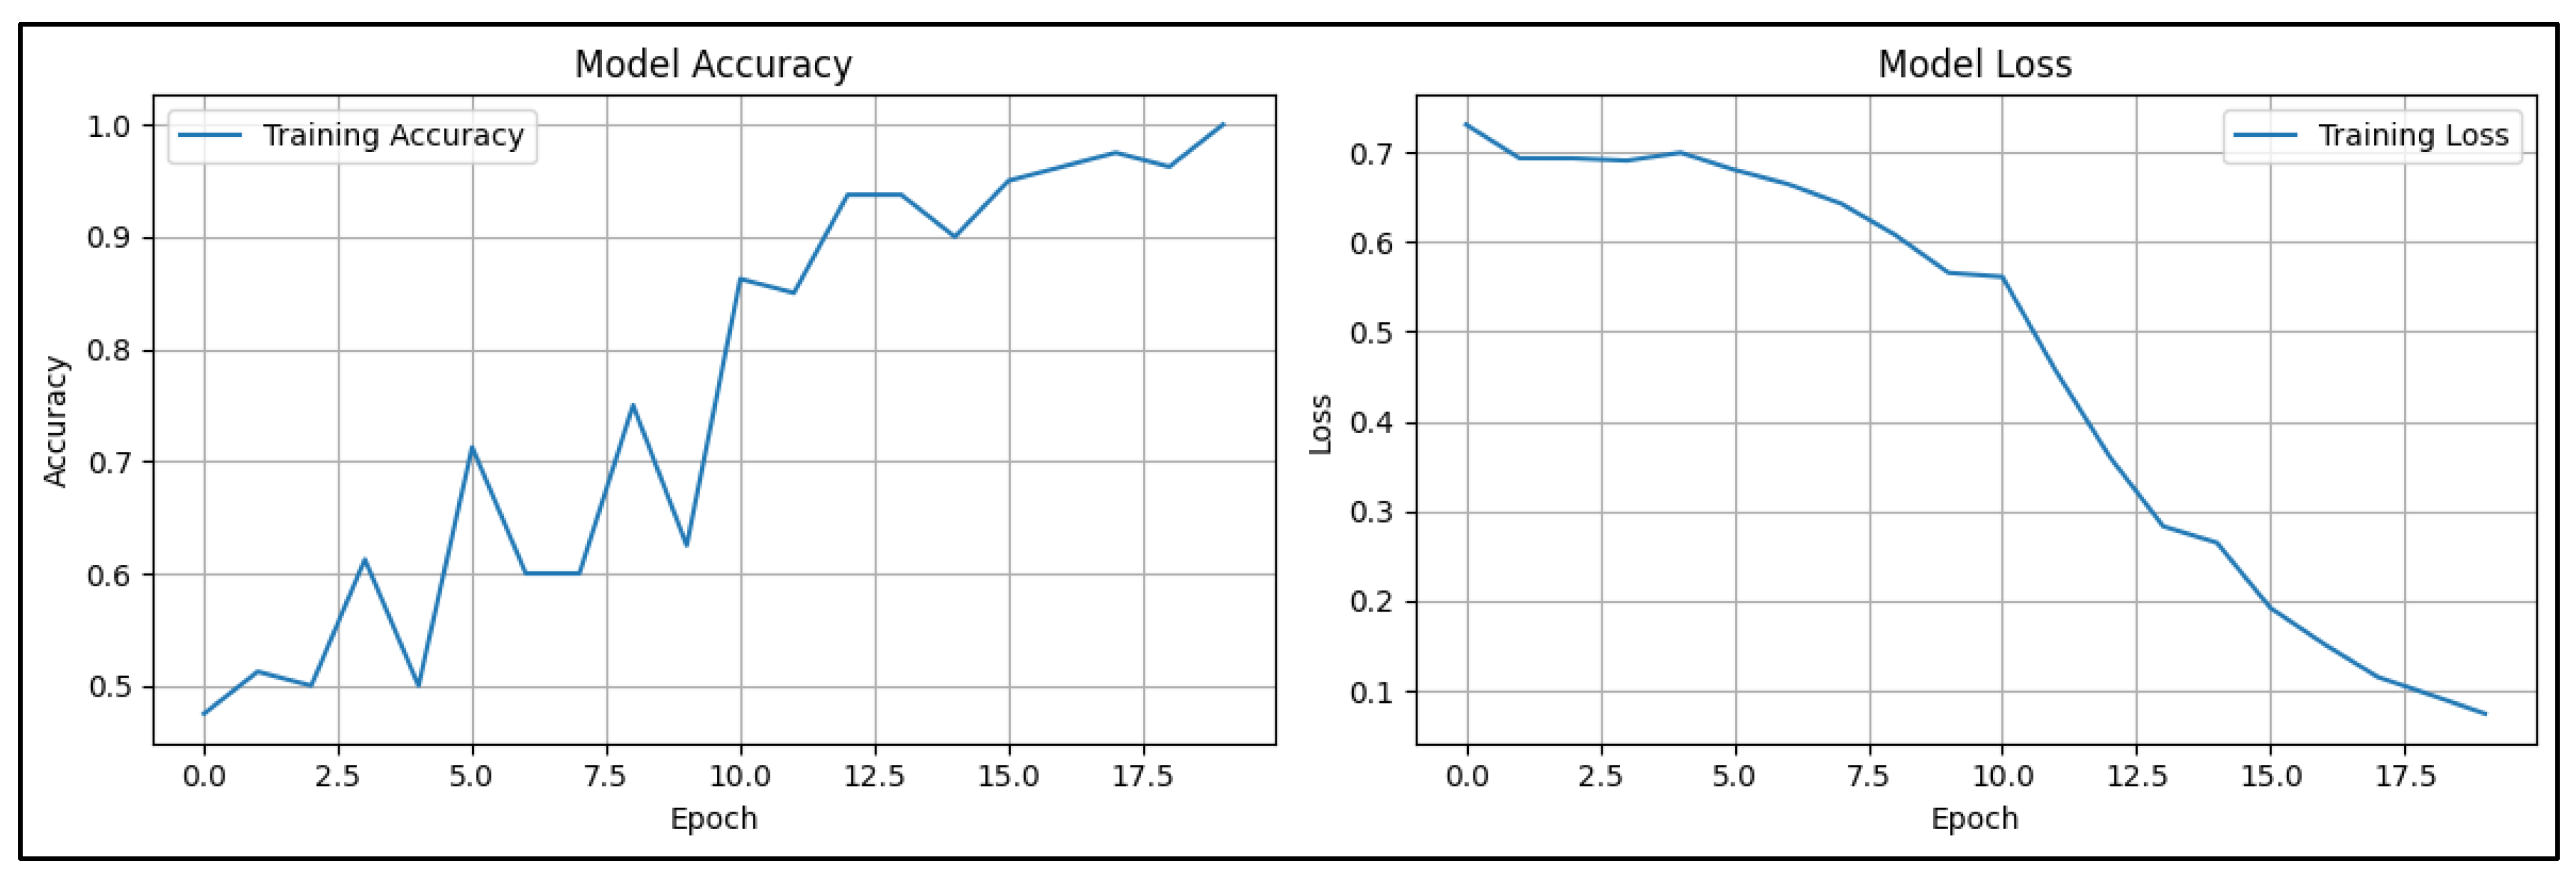
The graphs represent the performance of the CNN model in terms of accuracy and loss over the training epochs. On the left, the accuracy graph shows a steady improvement in model accuracy as the training progresses. Starting from around 50%, the accuracy increases consistently, reaching above 90% by the 18th epoch. This suggests that the model is effectively learning from the dataset and improving its ability to classify ultrasound images as benign or malignant. On the right, the loss graph indicates the reduction in training loss over the same period. Initially, the loss starts relatively high, around 0.7, but it decreases gradually as the epochs advance, demonstrating that the model is minimizing errors in its predictions.
Figure 2.
Confusion Matrix of Ultrasound Based CNN Model.
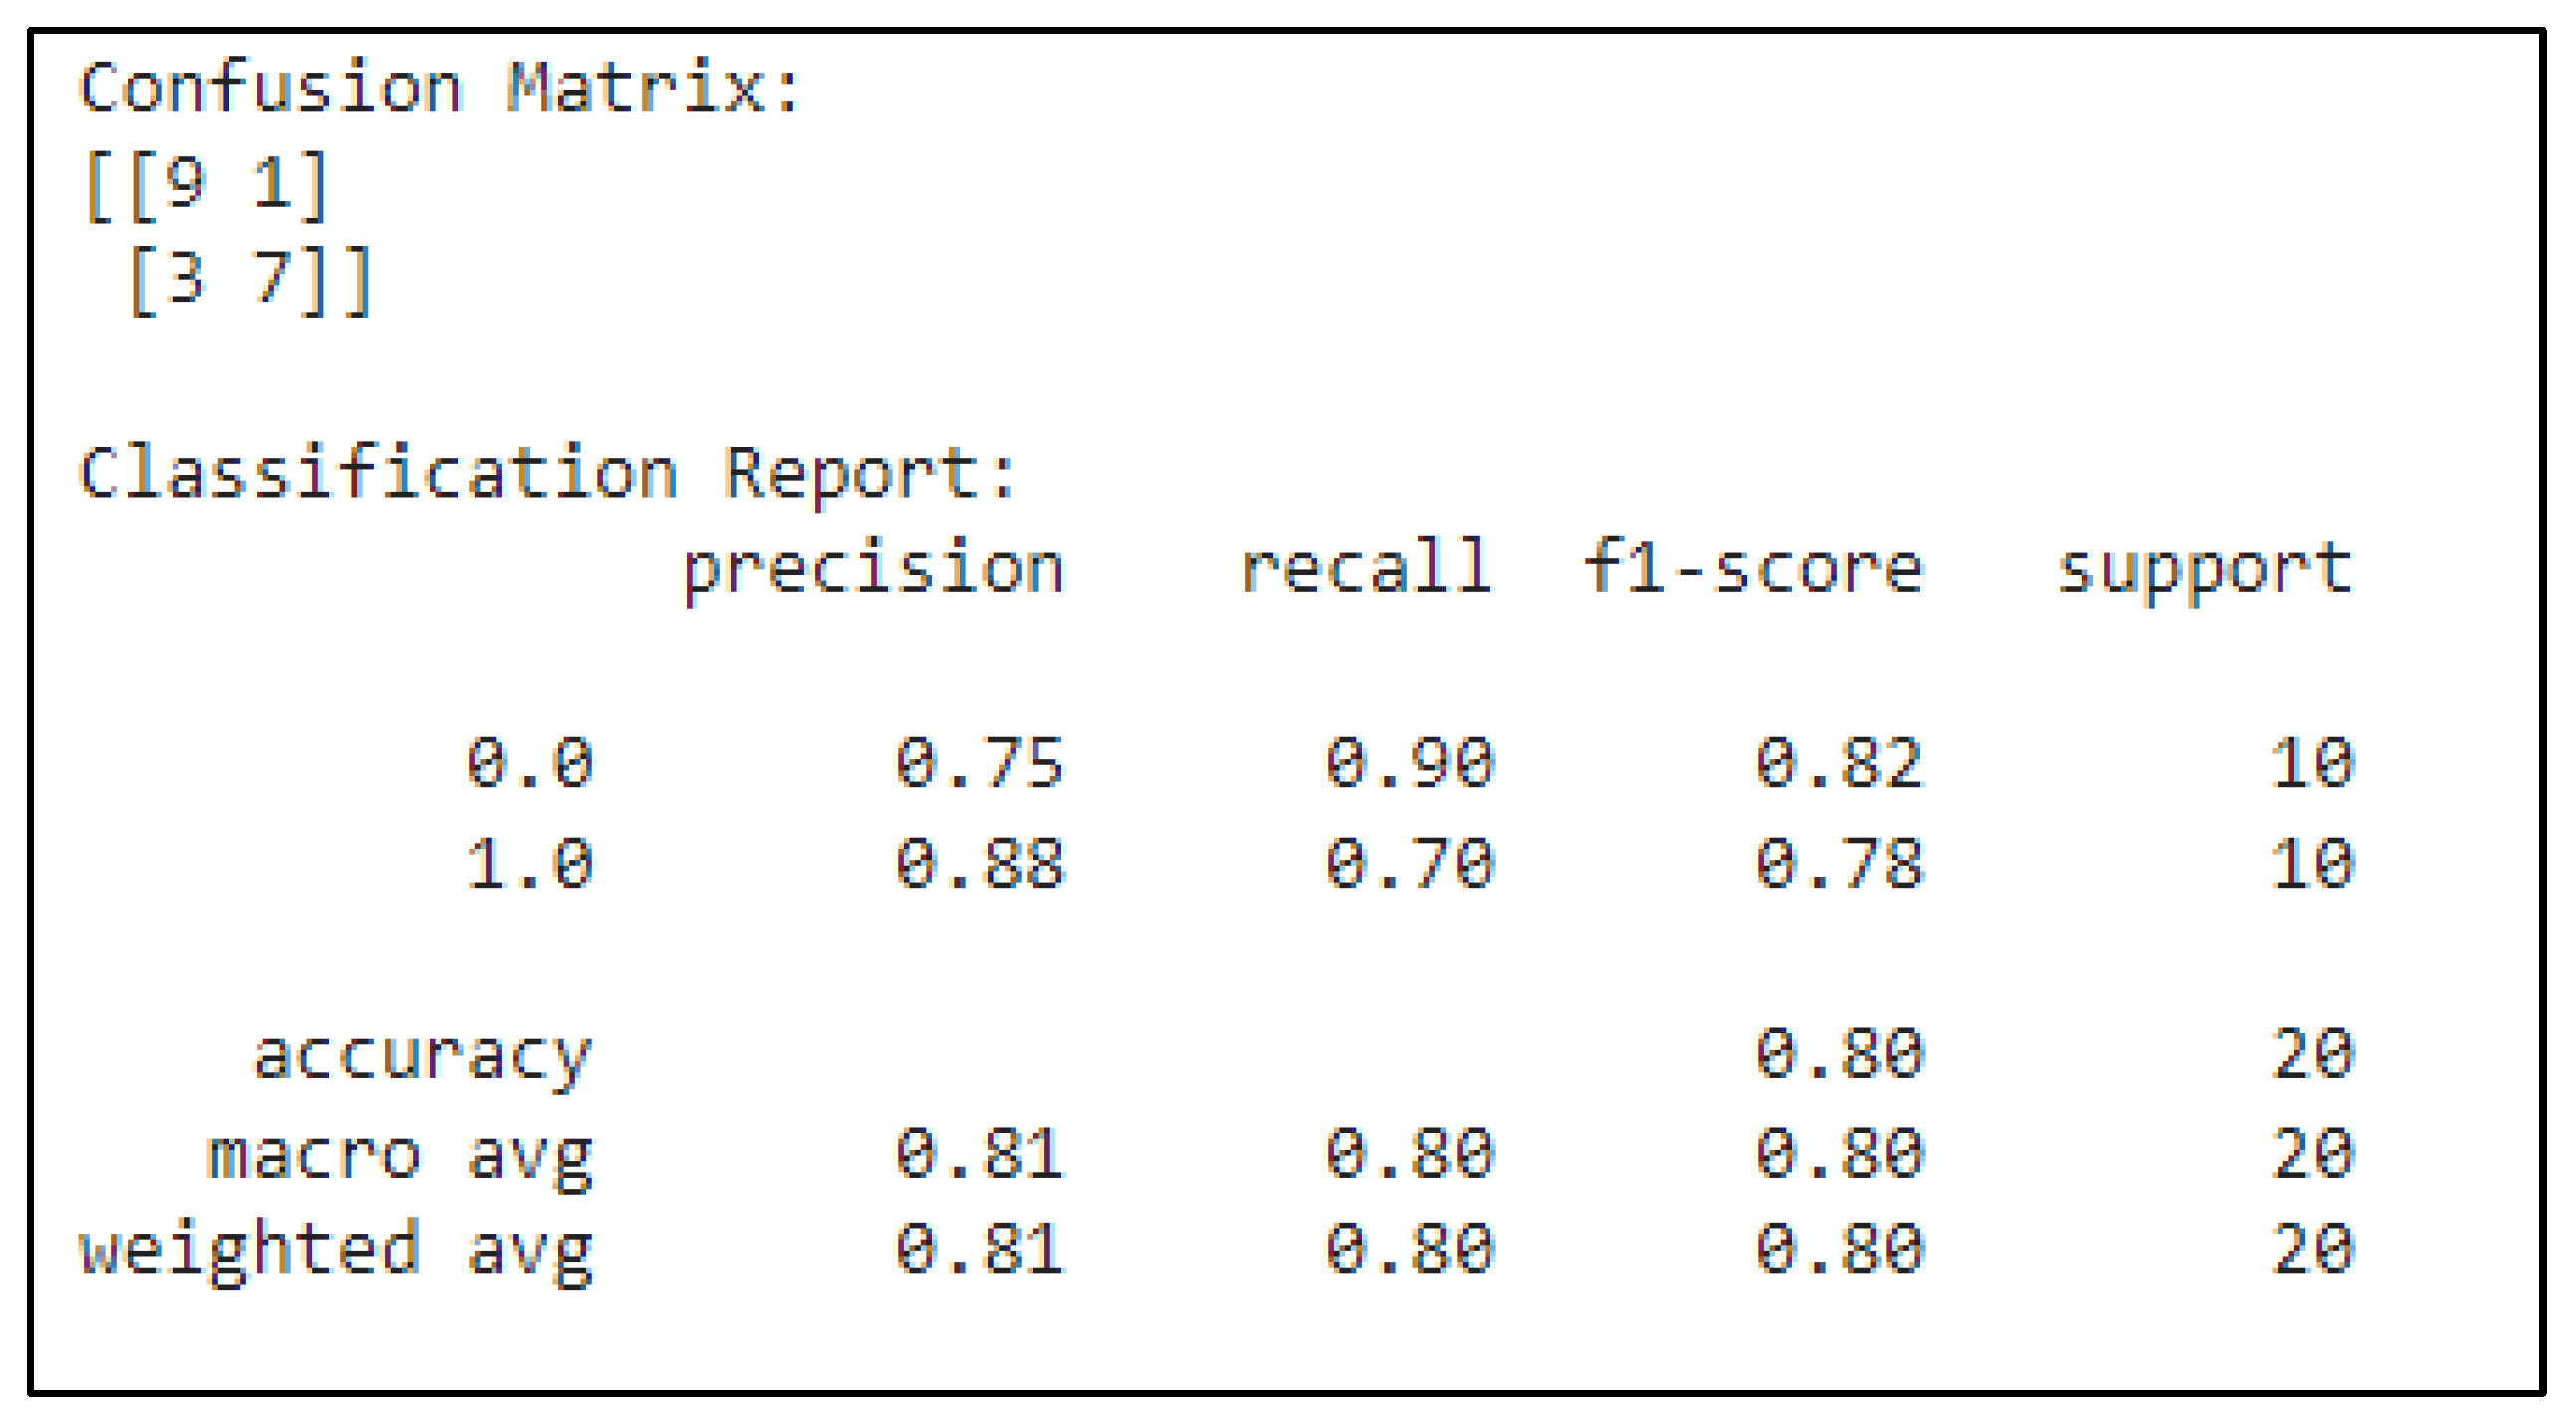
The confusion matrix presents the model's performance in predicting two classes: benign (0.0) and malignant (1.0). Out of 10 benign cases, the model correctly predicted 9, with 1 false positive. For malignant cases, the model correctly predicted 7 and produced 3 false negatives. The precision of 0.75 for benign indicates that 75% of the benign predictions were correct, while the 0.88 precision for malignant means that 88% of malignant predictions were accurate. Recall measures how well the model identifies each class: for benign, the recall is 0.90, meaning the model identified 90% of benign cases correctly, while for malignant, the recall is 0.70, meaning it caught 70% of malignant cases. The F1-score, which balances precision and recall, is 0.82 for benign and 0.78 for malignant, reflecting a well-balanced performance. The overall model accuracy is 80%, and both macro and weighted averages for precision, recall, and F1-score hover around 0.80.
Figure 3 shows the classification outcome in the attached image show that the convolutional neural network (CNN) model used in this instance correctly predicts a benign lesion. The grayscale picture most likely shows a processed scan from an ultrasound or mammography modality, where the CNN concentrates on ROIs. The image's visual qualities, especially the smooth, distinct borders that can be seen close to the center, match traits that are frequently linked to benign structures like cysts or non-malignant masses. These findings highlight the model's excellent accuracy in differentiating between benign and malignant tissue.
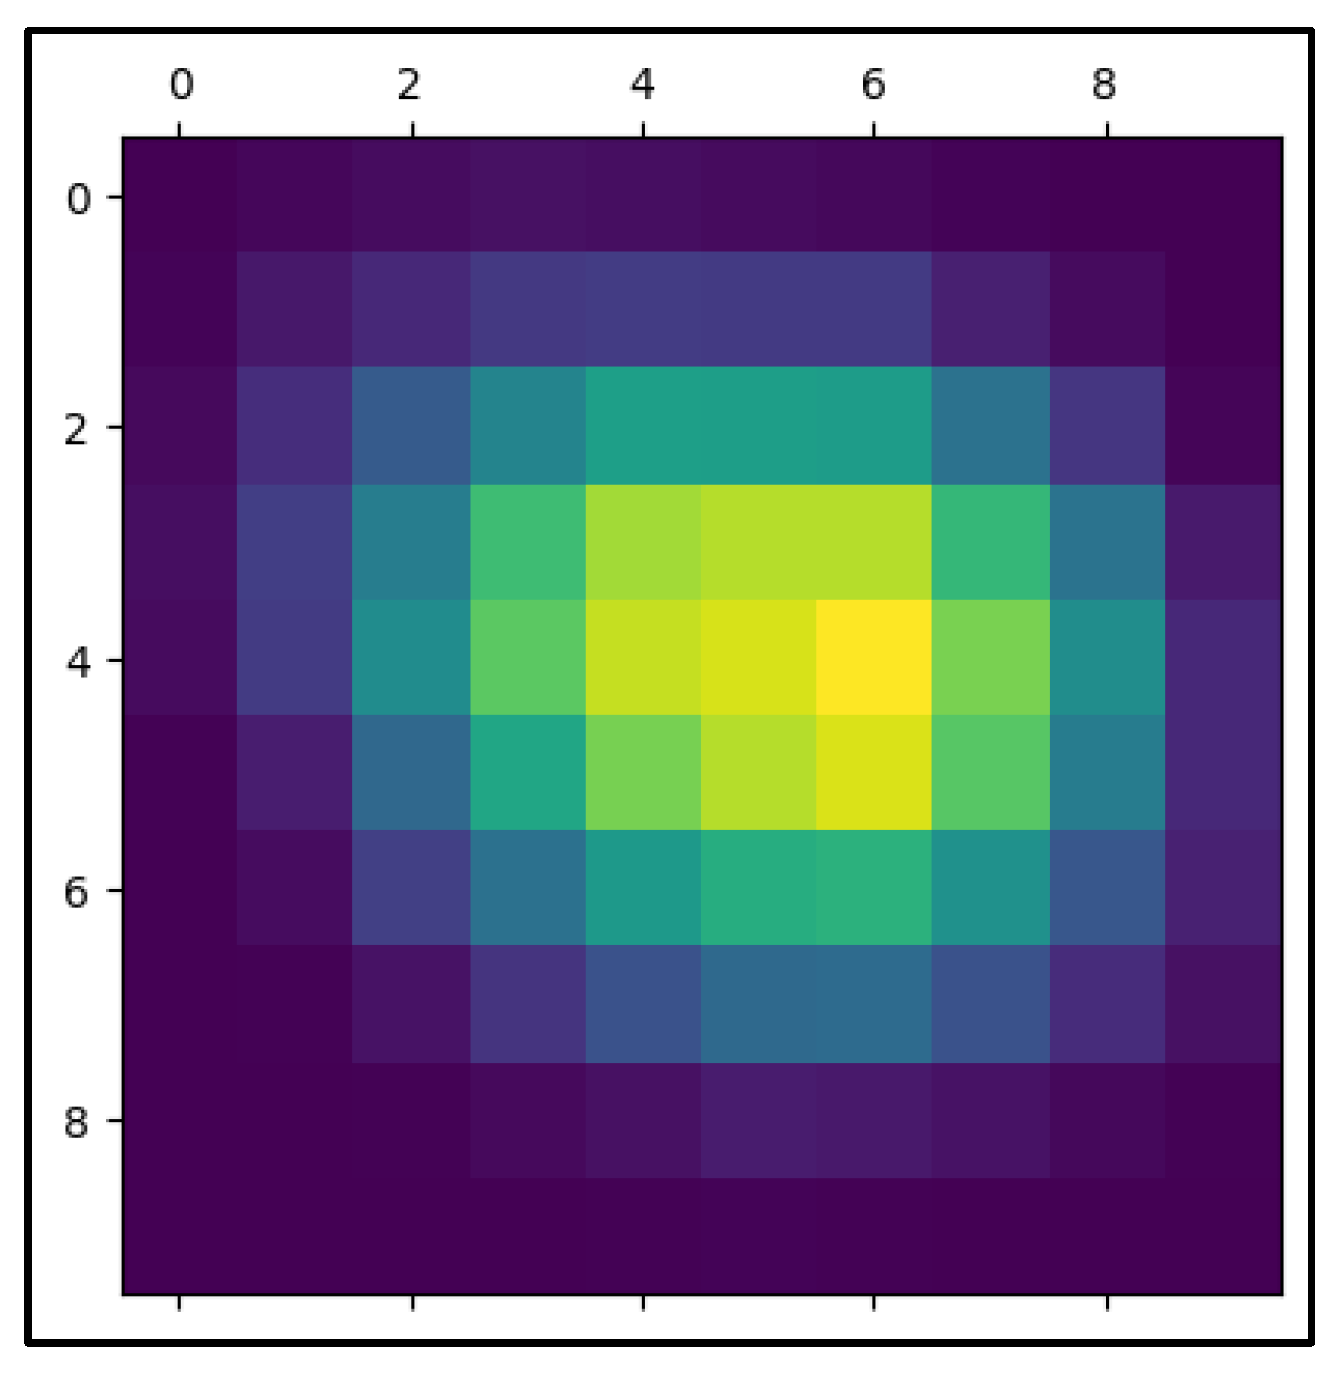
In the process of evaluating CNN-based predictions, the given heatmap image is an essential visualization, especially when it comes to medical imaging-based cancer diagnosis. In this instance, an Inception-3 model and the Keras library were used to create the heatmap. The regions of the picture that the CNN concentrated on when forming its prediction are highlighted by the heatmap, also known as the "Class Activation Map" (CAM). It is possible to see which scan regions were most important in classifying the lesion as benign or malignant by superimposing a heatmap on top of the original picture. The image's center lesion has strong coloring extending from red to green, indicating that the CNN model primarily examined this area while making its determination. Strong activation is shown by the red patches, suggesting that the elements in these locations are most important for the network's categorization. Heatmap masking may be a very useful tool for analyzing and validating the model's decision-making process in cancer detection. A conventionally black-box model gains some interpretability from the heatmap, which graphically correlates areas of high activation with clinical characteristics of malignancy (e.g., irregular boundaries, high density, or heterogeneous structures).
Figure 5.
The Heatmap Mask of Predicted Ultrasound Image.
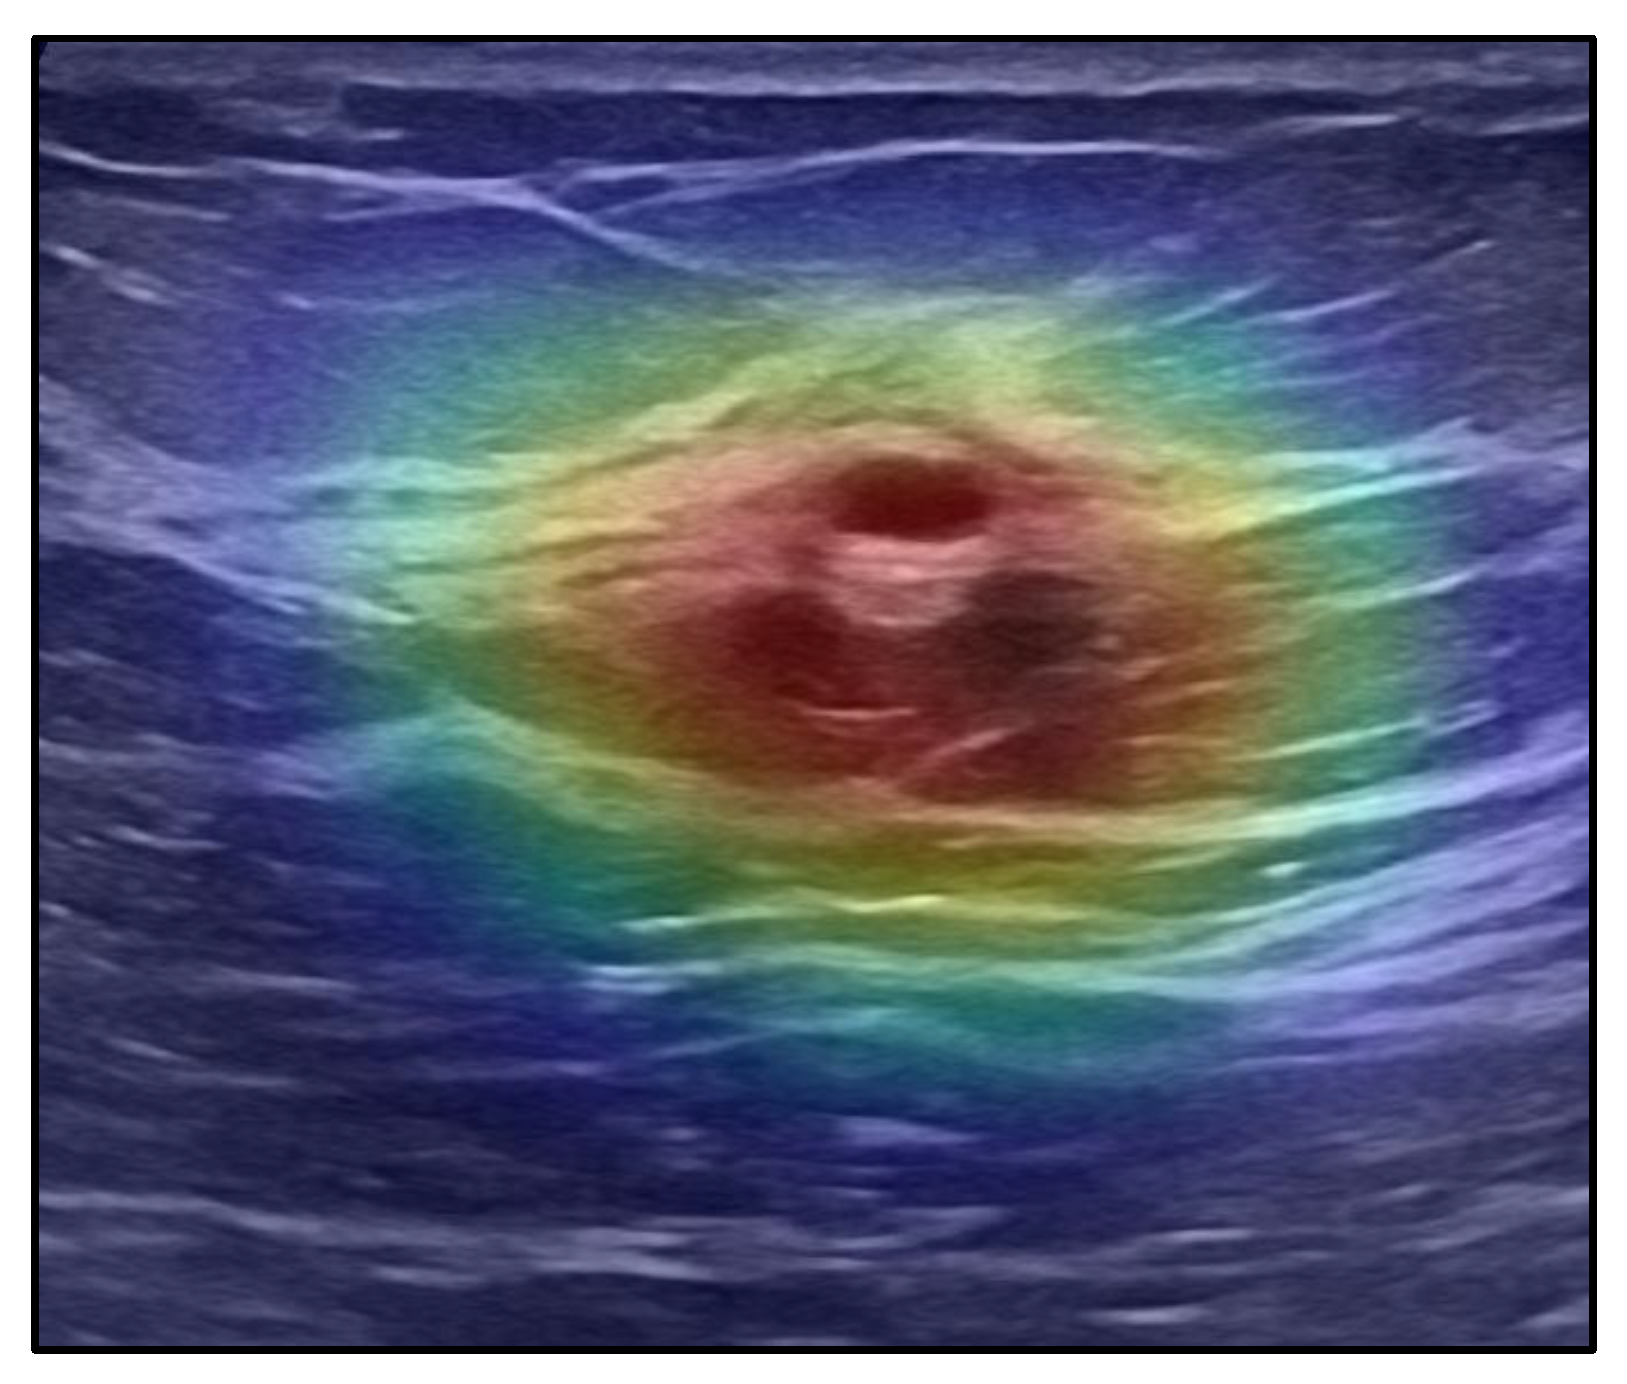
This method of visualization is particularly important in the field of medical diagnostics because it provides a means for clinicians and radiologists to validate CNN’s predictions. For instance, in cases of cancer detection, identifying which regions of the scan the network considers crucial for the decision can offer an additional layer of confidence. It allows medical professionals to cross-reference the algorithm’s assessment with their clinical expertise, thereby facilitating a more collaborative and trustworthy diagnostic process. In addition, heatmap masking is essential for model interpretability and transparency, both of which are required for regulatory approval in clinical practice. Healthcare practitioners may guarantee that the deep learning model's predictions are in line with medically important characteristics and mitigate the possibility of the model basing its predictions on irrelevant or deceptive sections of the picture by improving the interpretability of the model's internal workings. In this situation, heatmaps might help uncover biases or flaws in the training set, allowing the model to be improved iteratively.
3.2. CNN-Based Classification of Pathology Images for Breast Cancer Detection
Recent developments in computational techniques, namely in deep learning and convolutional neural networks (CNNs), have made it possible to analyze pathology pictures automatically and accurately as never before. CNN algorithms can identify patterns and traits that are associated with breast cancer by using vast datasets of pathology pictures. This allows the models to uncover subtleties that may be difficult for human specialists to identify. In this work, a CNN model was trained using a dataset of 100 pathology pictures of malignant breast lesions, demonstrating the potential of machine learning techniques to support pathologists and enhance diagnosis accuracy.
Figure 6.
Model Accuracy and Loss Graphs of Pathology Based CNN Model.
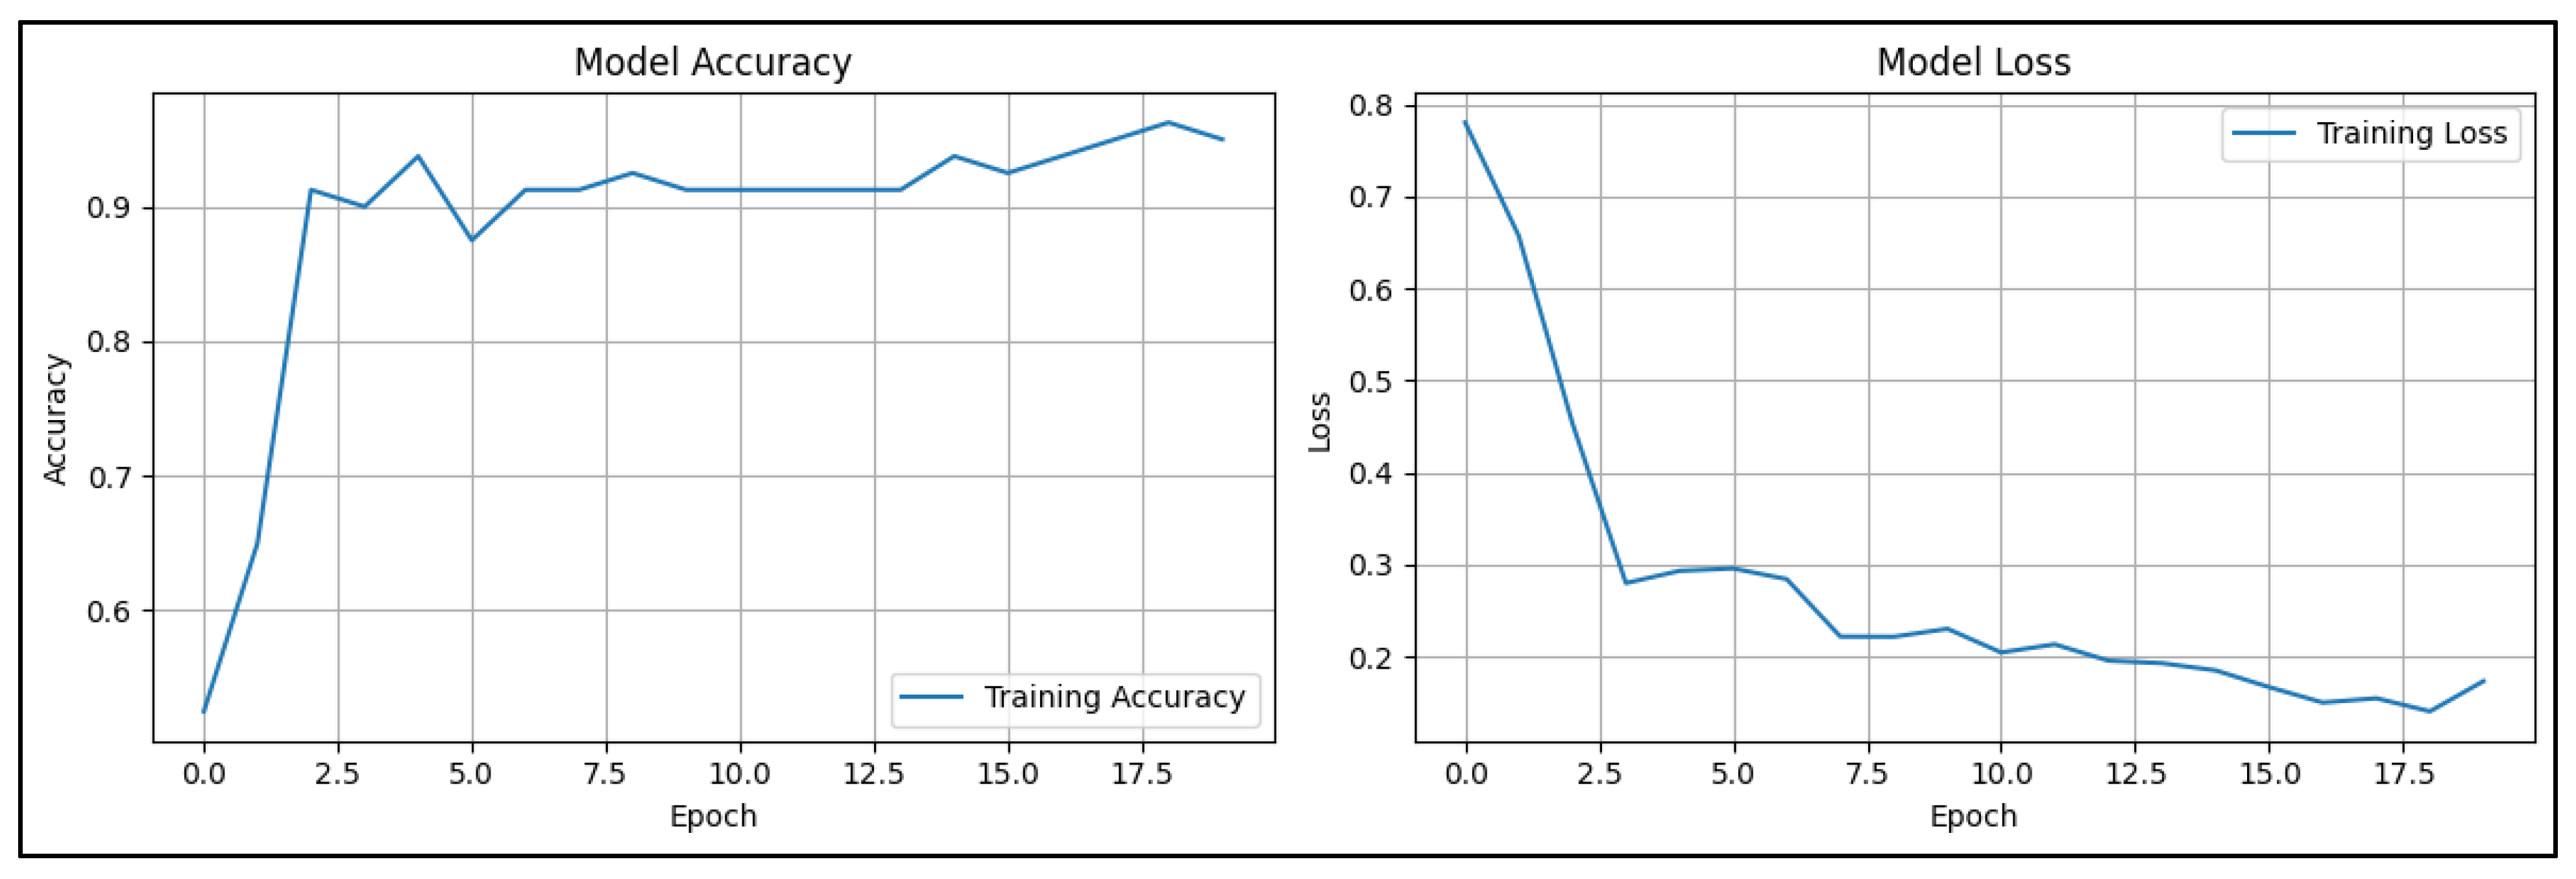
The training accuracy and loss curves depicted in the graphs provide critical insights into the performance and learning process of the CNN model developed for breast cancer detection using pathological images. These metrics reflect how well the model is learning from the training data over successive epochs and provide information on the model’s generalization capabilities. The CNN model demonstrates a sharp rise in training accuracy in the early epochs, achieving a high degree of performance early in the training process, as seen in the accuracy plot on the left. The model reaches over 90% accuracy by around the third epoch, suggesting that it has picked up significant pattern recognition in the collection of breast pathology pictures rather rapidly. After the first spike, the accuracy levels out, varying somewhat but staying high for the remainder of the epoch, reaching a peak of approximately 94%. This stability implies that the model is accurately calibrated and reliably detects important characteristics associated with malignant tumors in the breast tissue. As can be seen in the accuracy plot on the left, the CNN model performs well early in the training process and shows a sharp rise in training accuracy throughout the first few epochs. The model learns to identify significant patterns in the collection of breast pathology pictures rapidly, as evidenced by its above 90% accuracy by about the third epoch. After a brief surge, the accuracy levels off and peaks at around 94%. It then fluctuates somewhat but stays high for the next epoch. This stability shows the model is well-calibrated and reliably detects important characteristics associated with breast tissue malignant tumors.
The model's training loss, which represents the mistake in the model's predictions, is shown on the right side of the loss curve, which completes the accuracy measure. The first few epochs see a large reduction in loss, which is consistent with the precision increasing sharply. This pattern suggests that the CNN model is successfully reducing the discrepancy between the genuine labels and its predictions. The loss curve plateaus after around five epochs, and its ultimate value is less than 0.2, indicating that the model's prediction mistakes are probably not very large. The parallel examination of both accuracy and loss curves reveals that the model does not show signs of overfitting to the training data.
Figure 7.
Confusion Matrix of Pathology Based CNN Model.
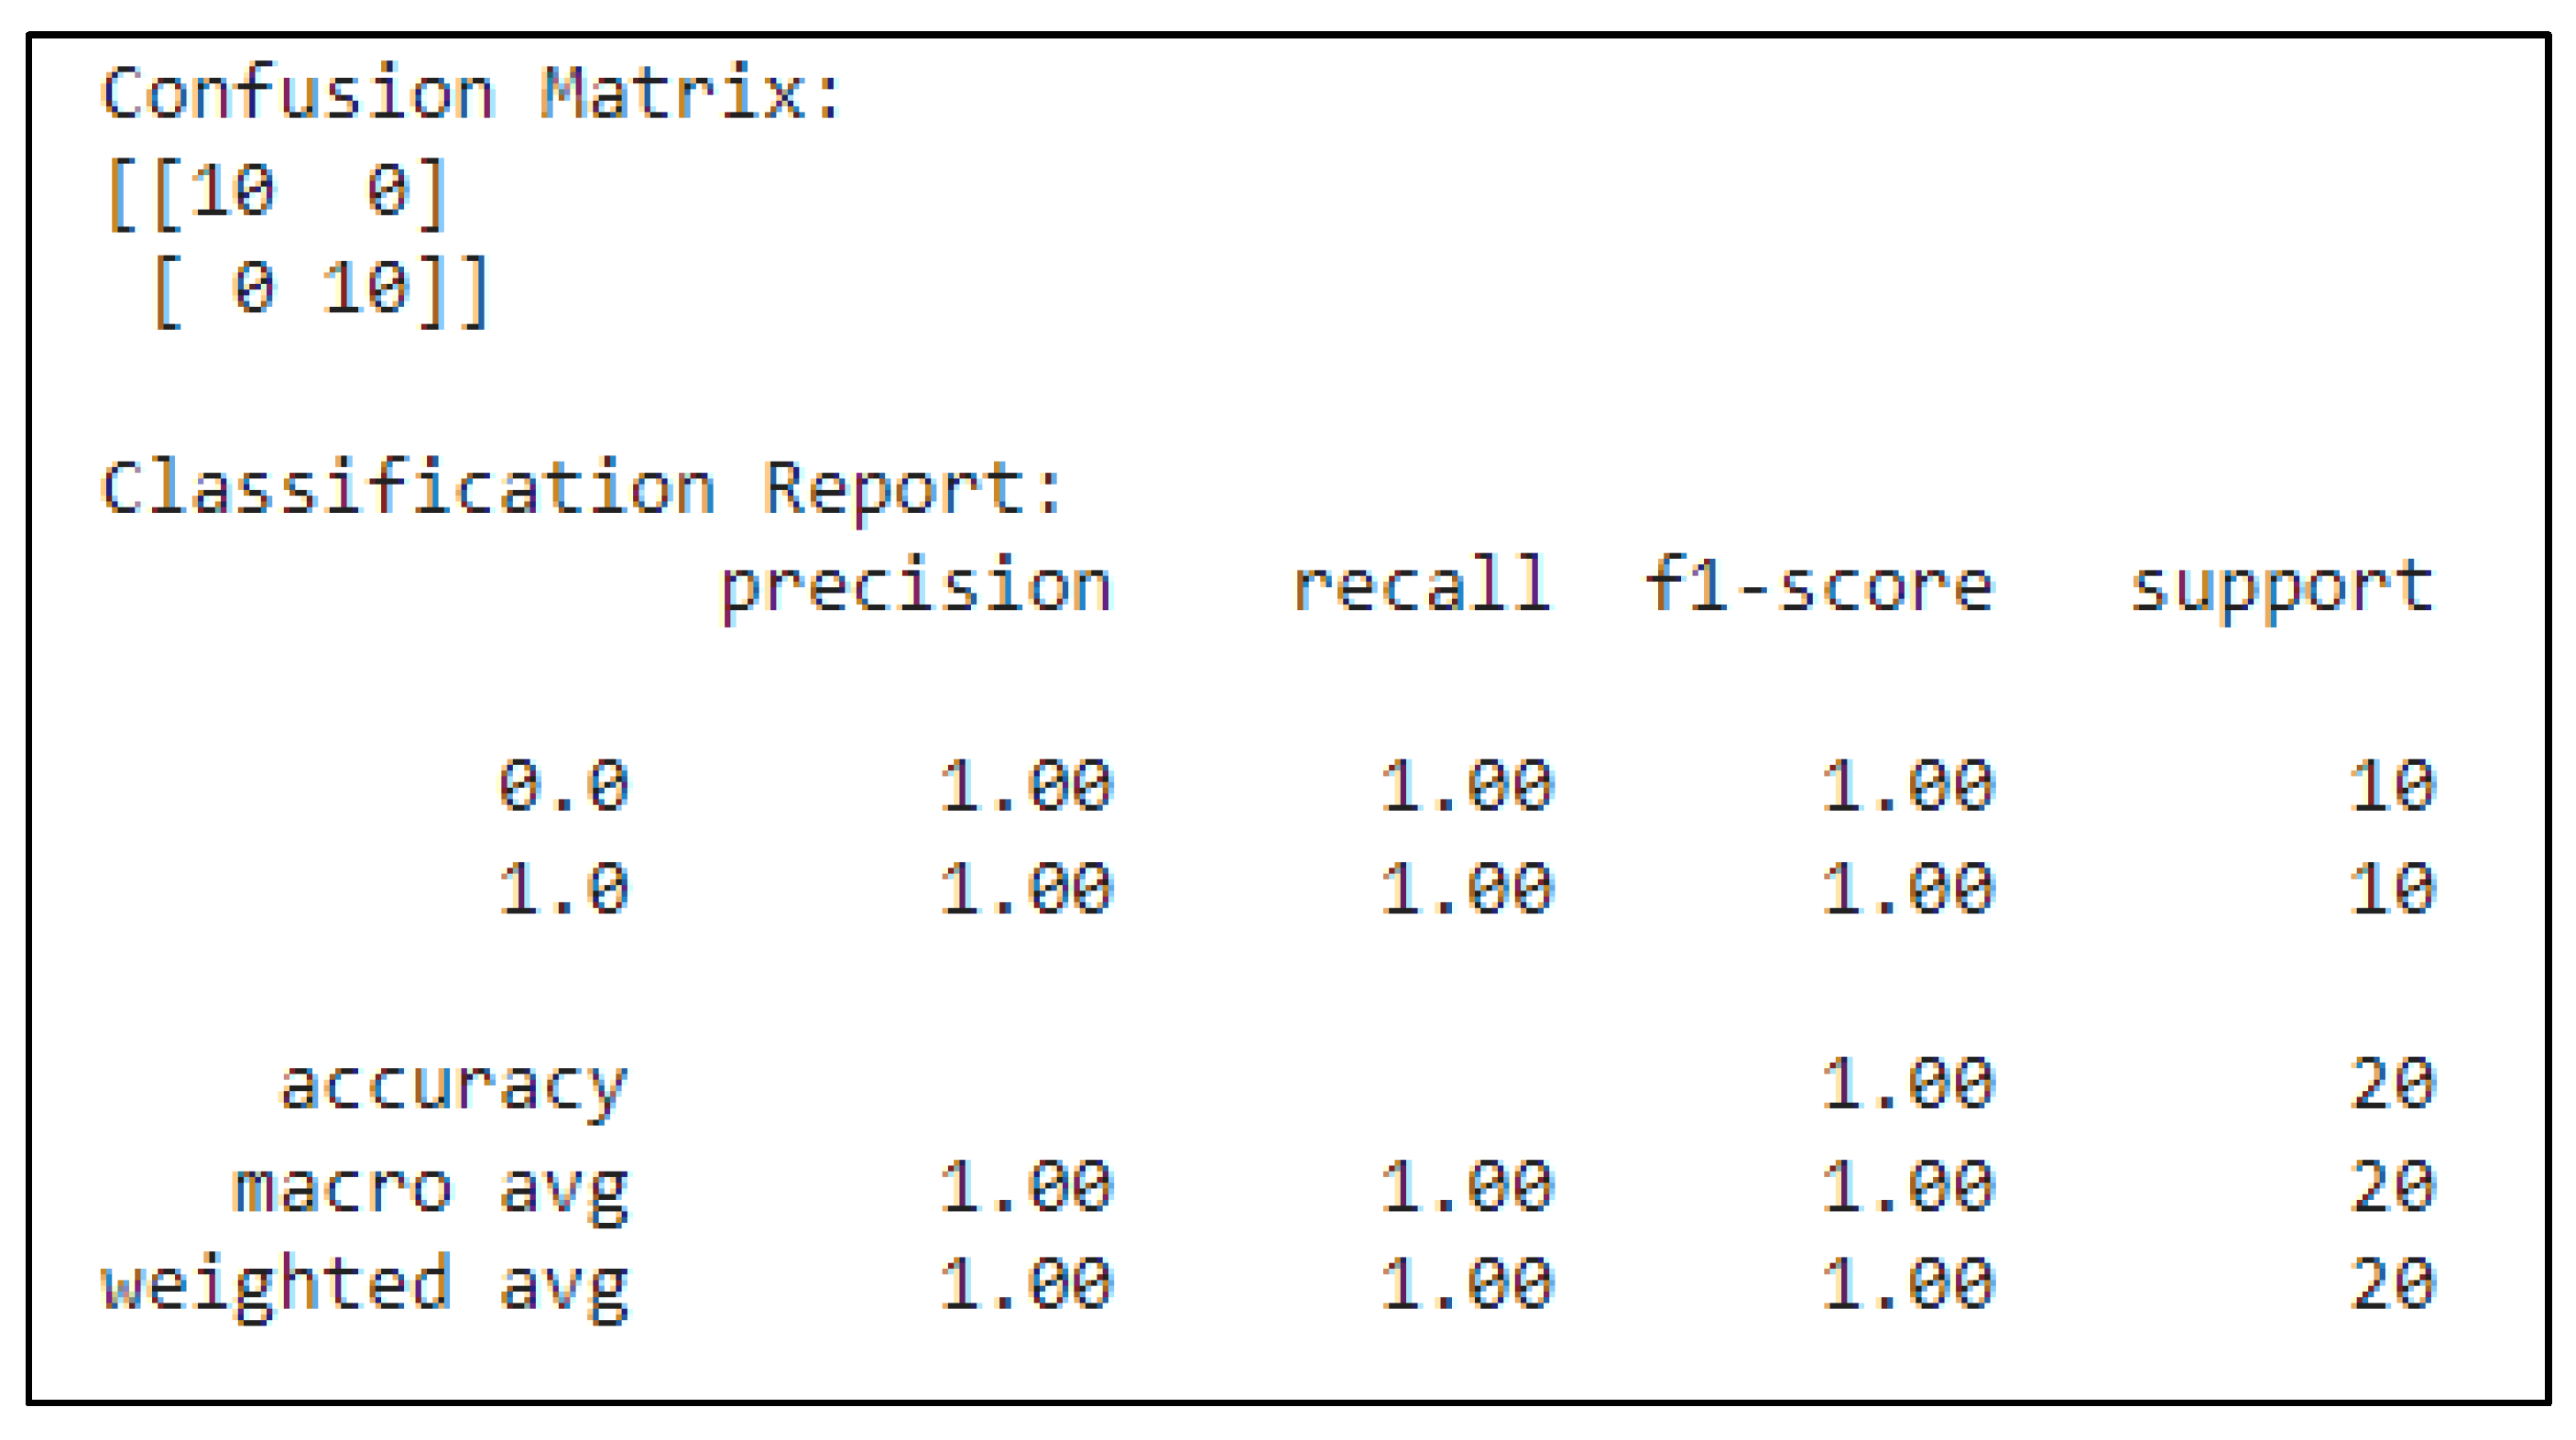
Using important assessment criteria, the classification report provides a more thorough overview of the model's performance. For both classes, precision (1.00), which measures the proportion of real positive predictions to all positive predictions, is ideal. This indicates that there were no false positives in any of the predictions produced for classes 0 or 1. Recall, a metric that assesses the model's capacity to recognize every true positive case, is also 1.00 for both classes. This shows that all real instances of each class were properly detected by CNN, with no false negatives. For all groups, the F1-score—which yields a harmonic mean of recall and precision—is likewise 1.00. This flawless F1-score attests to the model's ability to successfully trade off neither accuracy nor recall. The number of true occurrences for each class in the dataset is referred to as the support metric, and it is included in the classification report as well. There are ten occurrences in each of classes 0 and 1, giving the model an equal distribution of data to categorize. The model successfully identified all 20 samples, as indicated by the overall accuracy of 1.00, which is determined as the ratio of right predictions to the total number of cases. The accuracy, recall, and F1-score macro and weighted averages are also included in the report. The unweighted mean of these measures, or the macro average, is 1.00 for all, indicating that the model performs consistently in both groups. The weighted average, which accounts for the number of instances in each class, also results in perfect scores due to the balanced dataset.
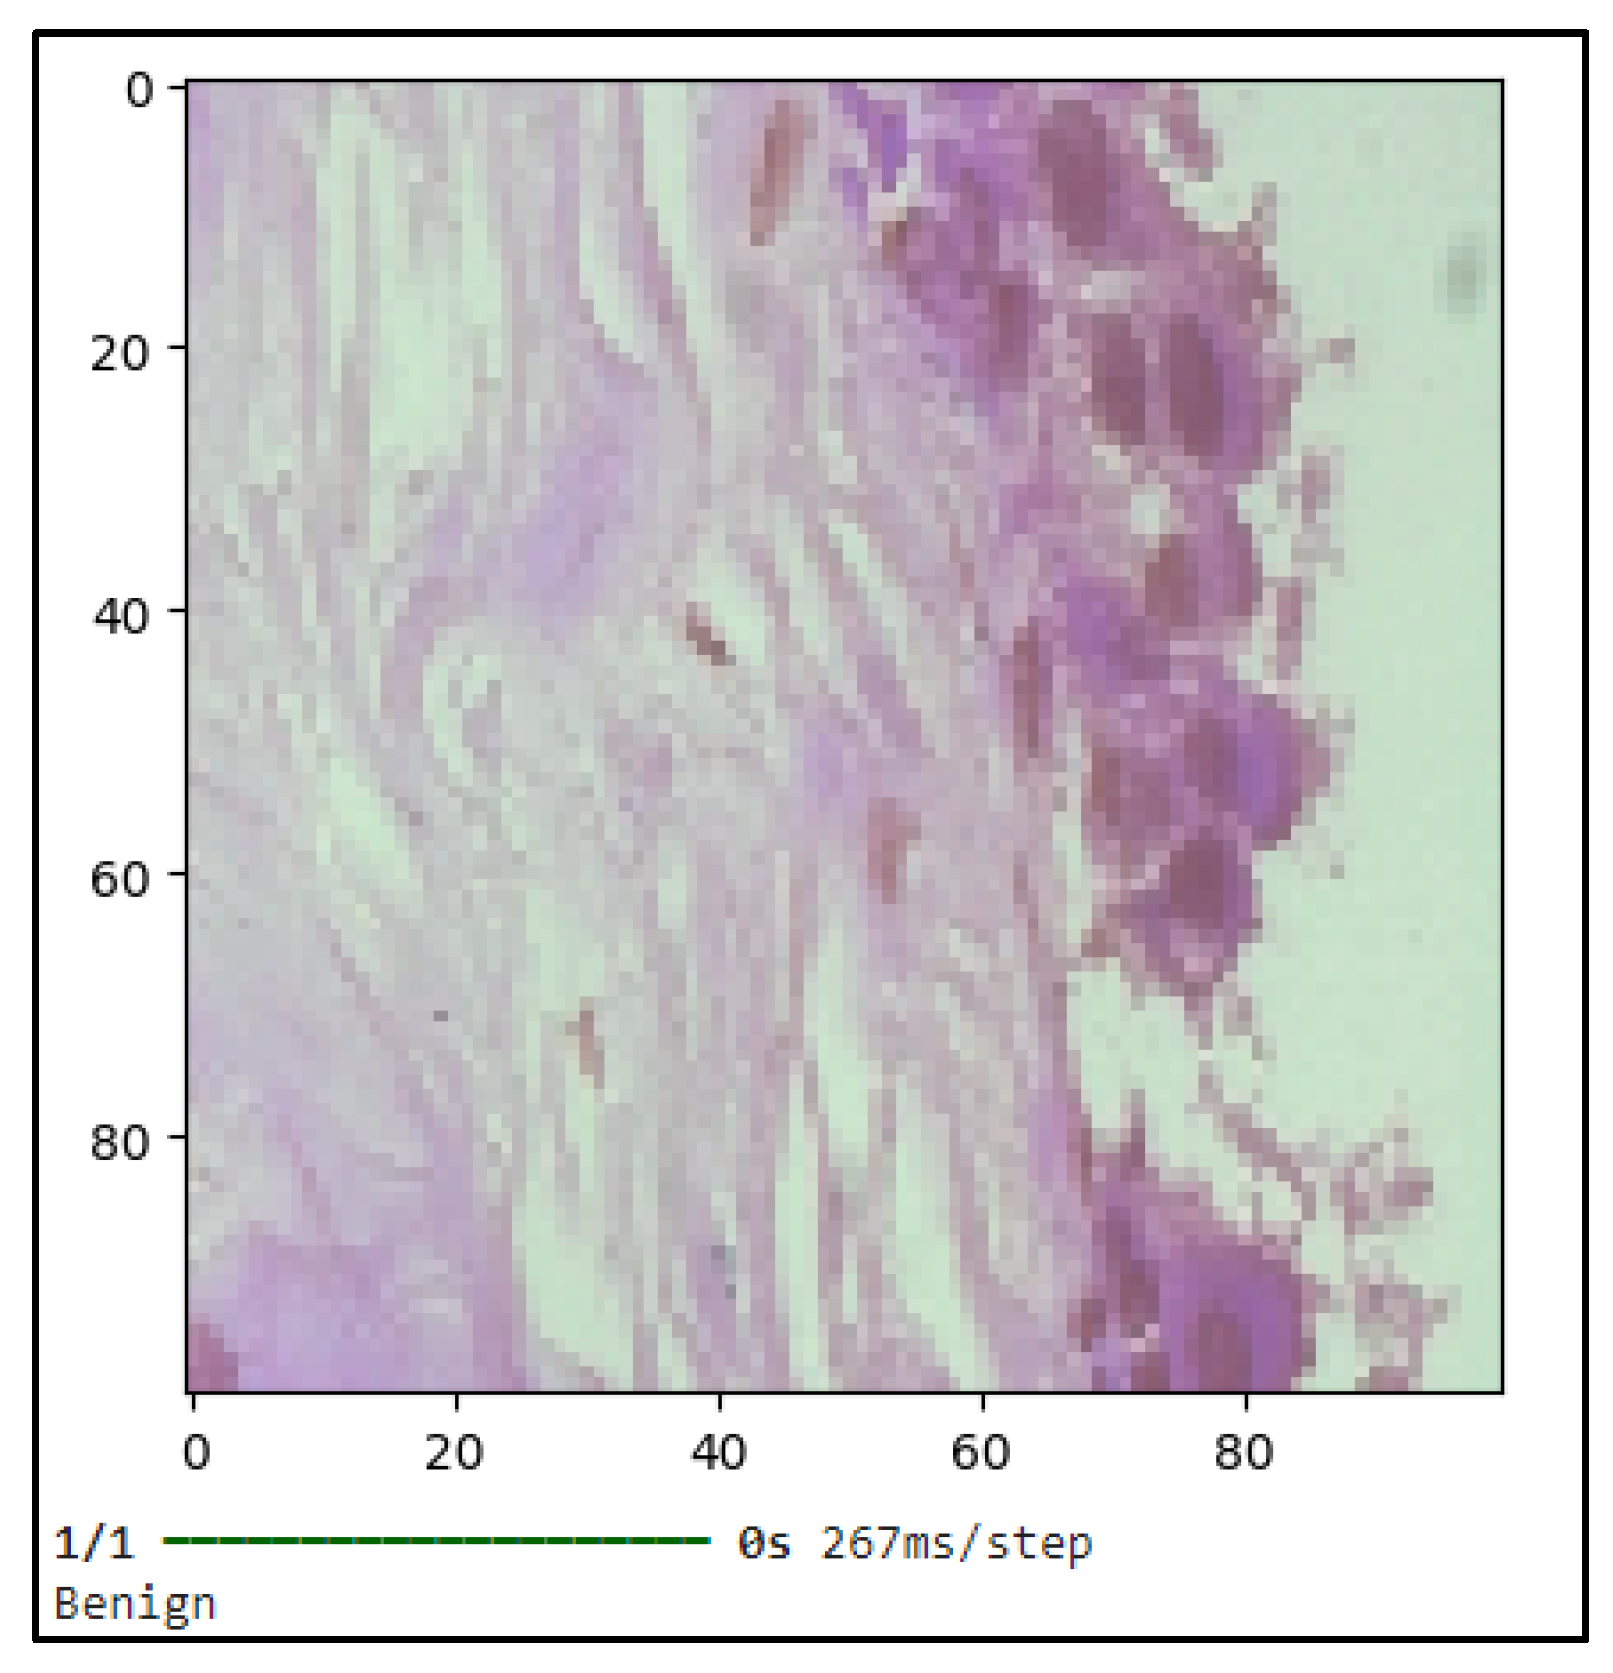
Figure 8.
The Prediction of Pathology Based CNN Model.
To evaluate the CNN model's predicted accuracy, a picture of a benign lesion was used as a test case. After analyzing the picture, the model accurately determined that the lesion was benign, which is consistent with its actual designation. The robustness of the model is further validated by the successful categorization of this benign picture, which is important in clinical contexts where right identification can have a big influence on patient treatment decisions.
Figure 9.
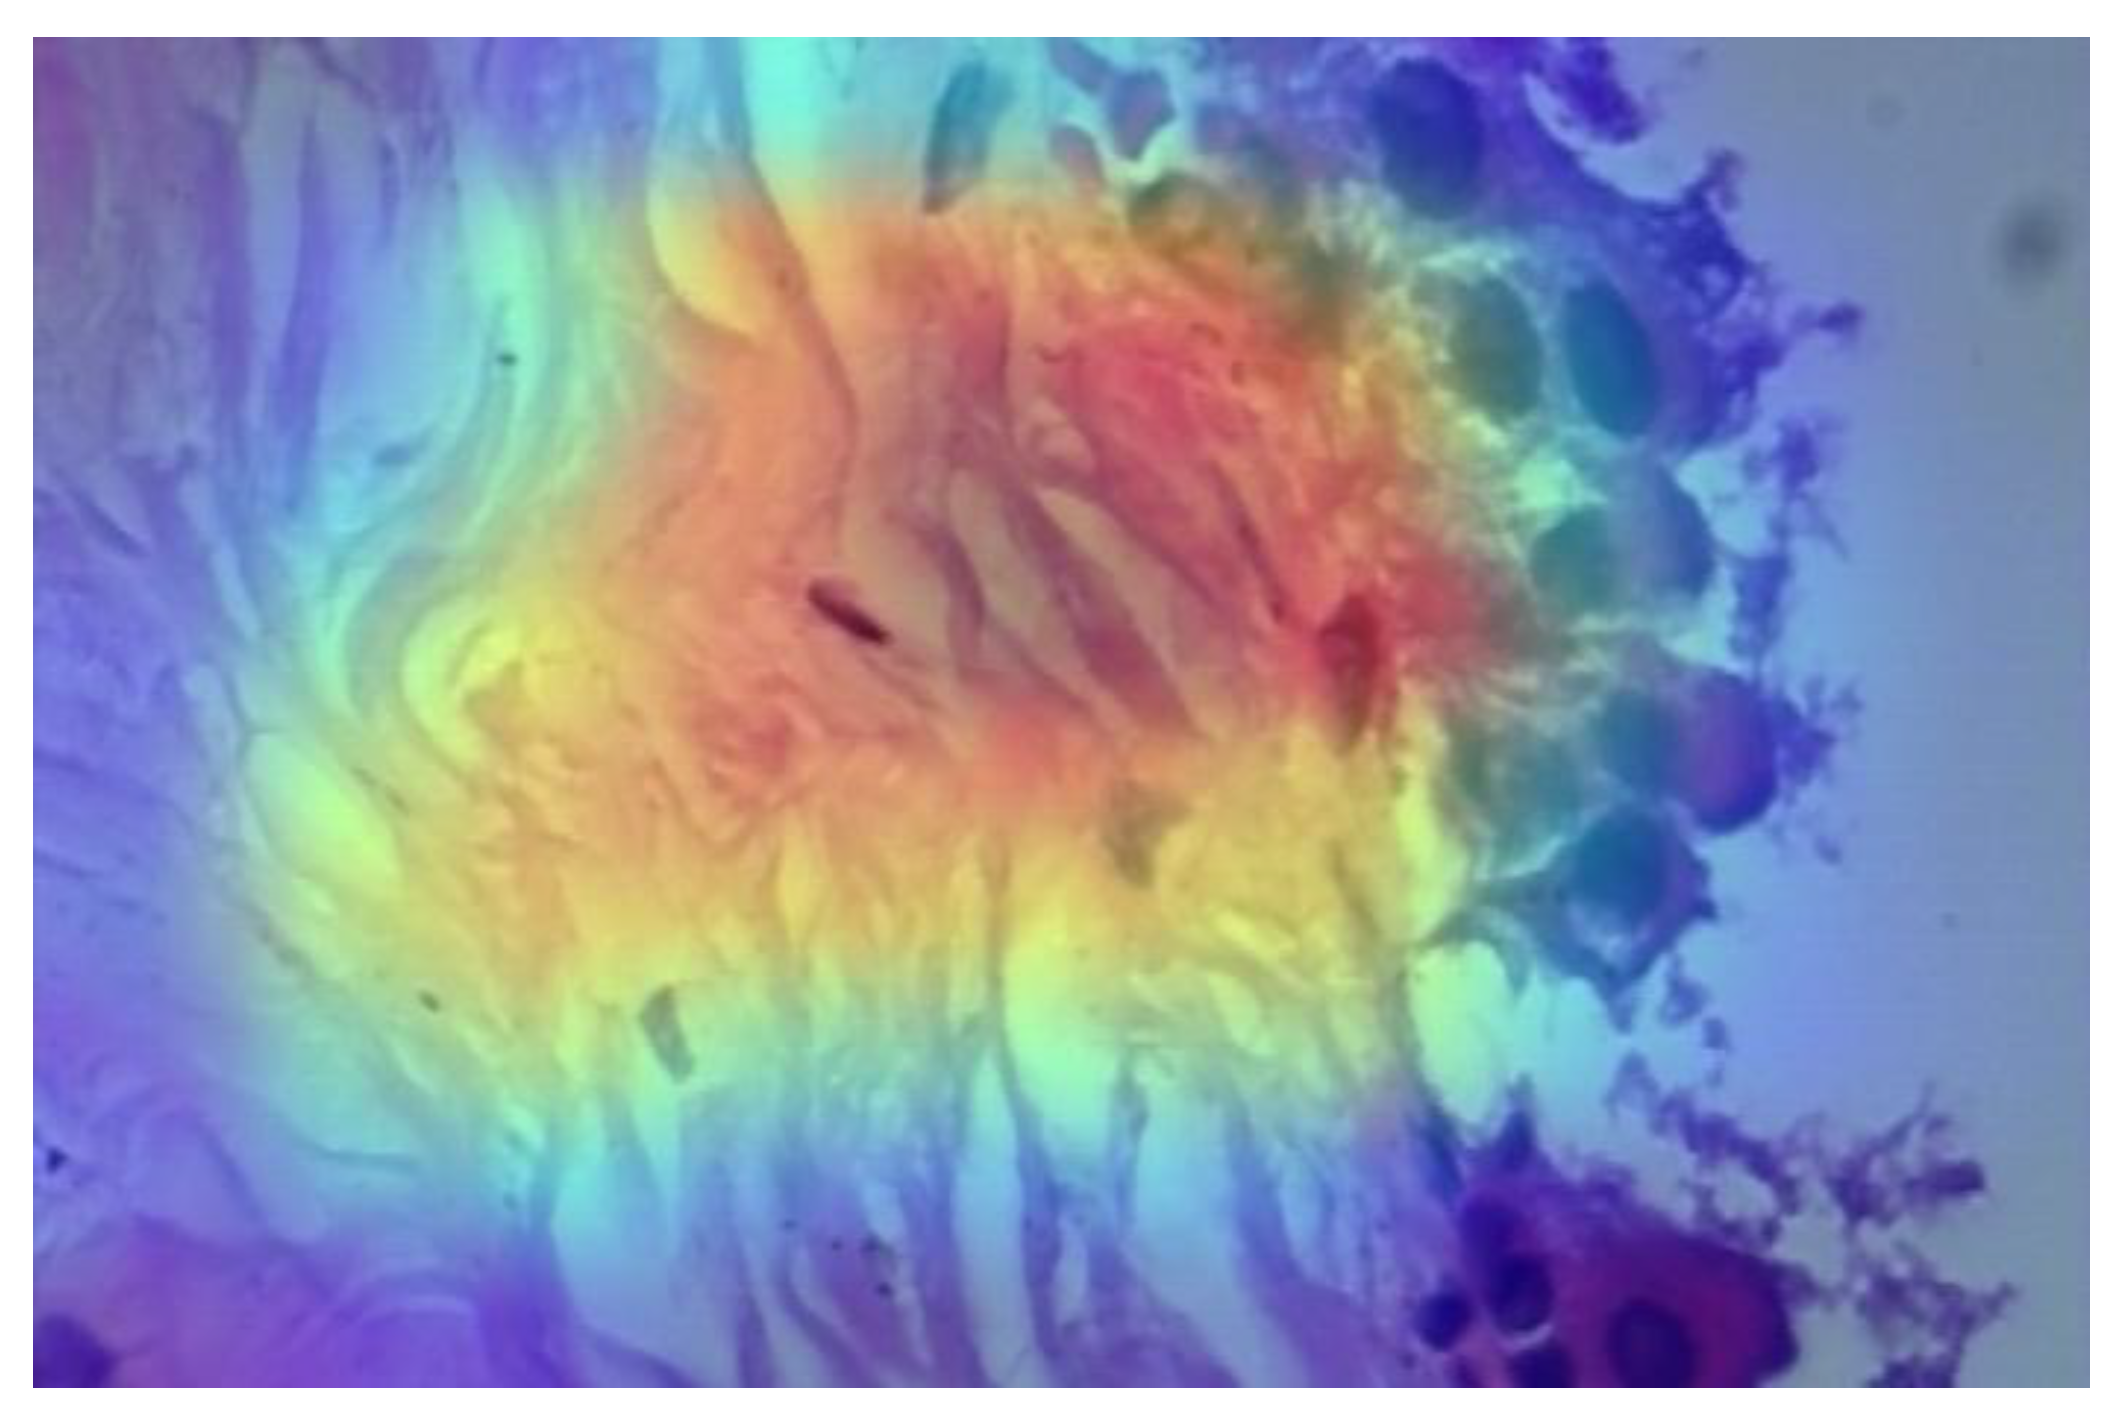
The Heatmap of Predicted Pathologic Image.
The provided image appears to be a microscopy image overlaid with a heatmap, which is used in conjunction with the CNN model to classify whether the tissue sample is benign or malignant. This heatmap helps you better understand which areas of the image contributed most to the classification decision by providing a visual depiction of the model's logic and emphasis. In this instance, the model appears to be guided toward an appropriate prediction by the bright patches, which appear to emphasize tissue structure regions that may have benign properties. By isolating important characteristics and minimizing visual noise, a heatmap mask further streamlines this process and makes it easier to analyze complicated pathologic pictures. The utilization of heatmaps in pathology pictures for cancer identification is crucial. Deep learning models in digital pathology frequently function as "black boxes," offering little information about the decision-making process. These algorithms gain more interpretability and transparency—a crucial component in medical diagnostics—by producing heatmaps. Heatmaps assist pathologists in comprehending the underlying patterns in tissue morphology that resulted in a certain categorization by highlighting areas of the tissue sample that the model considers important. In clinical settings, where precision and openness have a direct impact on patient outcomes, interpretability is crucial. Heatmaps in cancer detection can identify atypical tissue regions that can show early indicators of cancer, leading to quicker and more precise diagnosis.
Figure 10.
The Heatmap Mask of Predicted Pathologic Image.
3.3. ANN-Based Classification of Patients' Data for Breast Cancer Detection
The Artificial Neural Network (ANN) model designed for this study utilizes a dataset comprising 569 patient entries, with each row representing an individual patient and each column containing specific clinical features pertinent to breast cancer diagnosis. The model is trained using attributes such as tumor radius, texture, perimeter, and other relevant clinical data. These features serve as input nodes for the ANN, which processes the data through multiple layers of interconnected neurons. As the model learns through backpropagation, the weights of the neurons are adjusted to minimize the error in predictions, allowing the network to classify tumors as benign or malignant with increasing accuracy. The ability of the ANN to capture complex, non-linear relationships within the dataset enables it to distinguish subtle differences between benign and malignant cases, leading to improved prediction performance over time. This method offers a robust approach to cancer diagnosis, leveraging advanced computational techniques to assist in clinical decision-making.
Figure 11.
Model Loss Graph of ANN Model.
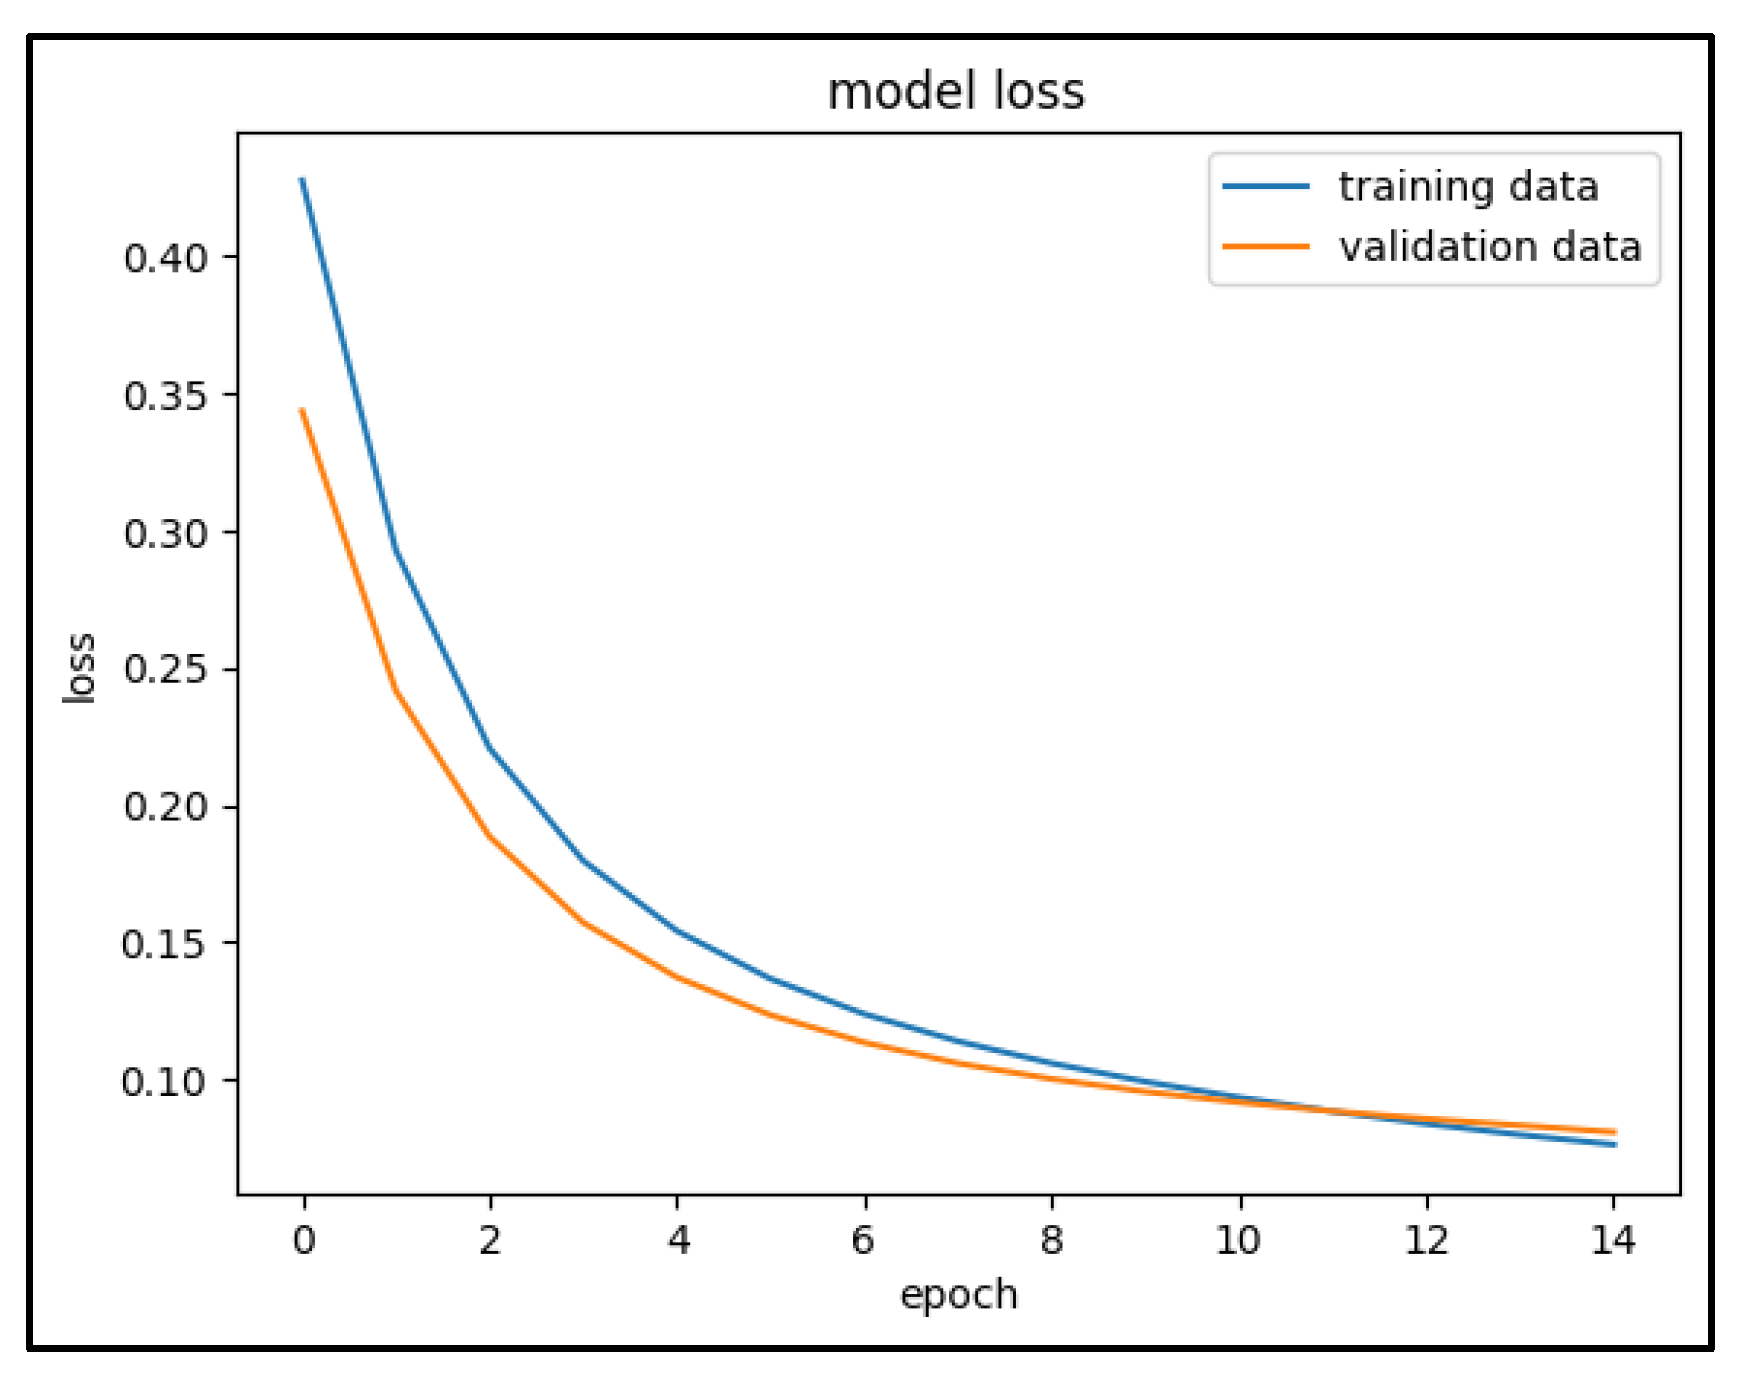
The first graph, which depicts model accuracy, illustrates how the accuracy of the training and validation data evolves over the epochs. The training accuracy starts at approximately 82.5% and increases steadily, eventually stabilizing around 97.5%. Similarly, the validation accuracy starts higher, around 90%, peaks early, and then remains consistent, aligning with the training data. The close relationship between training and validation accuracy indicates that the model generalizes well, minimizing overfitting. In the second graph, representing model loss, both training and validation loss decrease as the epochs progress. The training loss decreases sharply at first and then gradually converges to an extremely low value. Validation loss follows a similar pattern, showing consistency between the two sets. This trend demonstrates that the model is improving its predictions by minimizing errors over time, reinforcing that the model is well-tuned for the dataset without significant overfitting.
Figure 12.
Confusion Matrix of ANN Model.
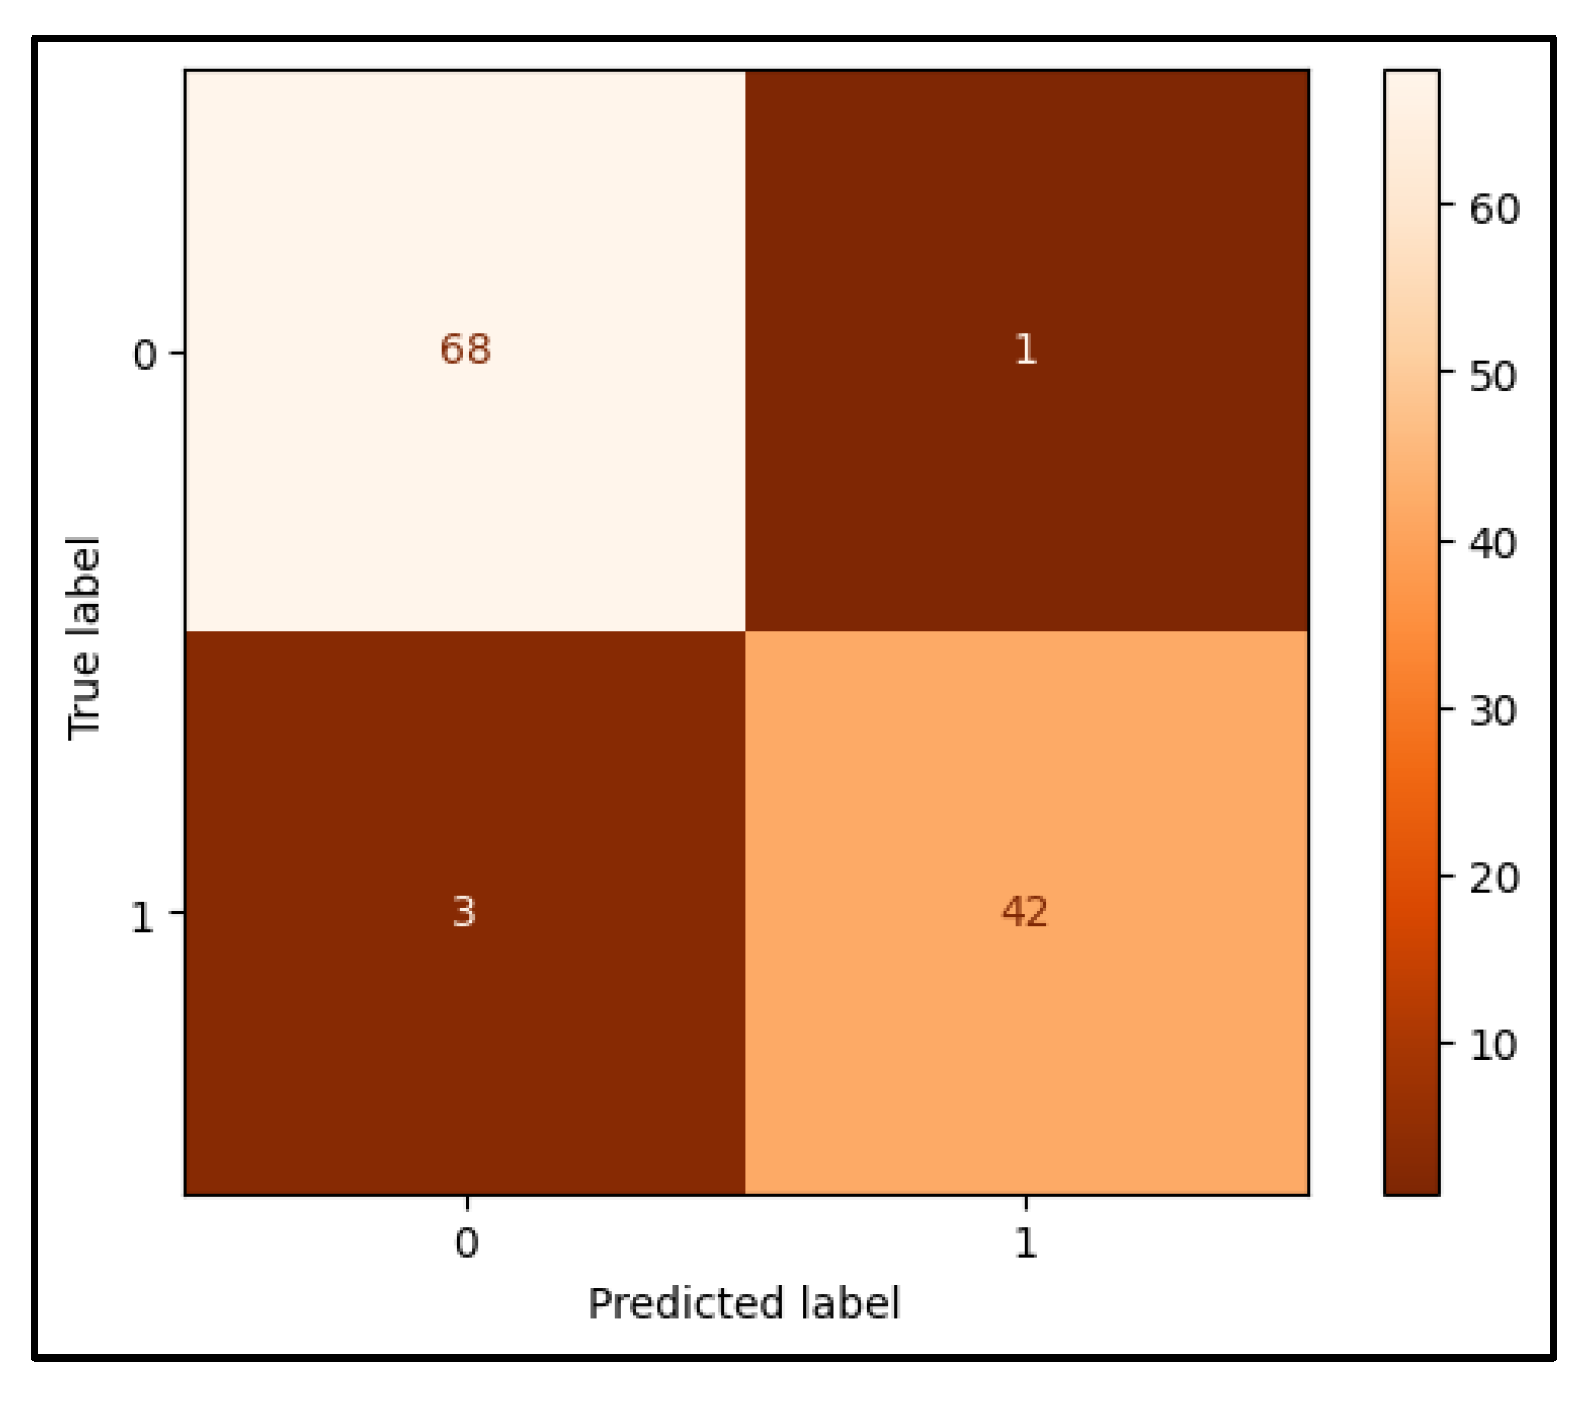
The confusion matrix presented provides a comprehensive evaluation of the performance of the artificial neural network (ANN) model developed for breast cancer detection. It offers insights into the accuracy of the model in classifying breast tissue as benign or malignant by presenting the distribution of true positives, true negatives, false positives, and false negatives. The top-left cell of the confusion matrix indicates that the model correctly classified sixty-eight instances of benign tissue as non-cancerous. These true negative cases demonstrate the model's ability to accurately identify patients who do not have malignant tissue. Conversely, the top-right cell reflects 1 false positive case, where the model incorrectly identified benign tissue as malignant. Although the number of false positives is low, such errors could lead to unnecessary anxiety and further medical interventions for patients. In the bottom-left cell, the matrix reveals that the model produced three false negatives, misclassifying malignant tissue as benign. This type of error is particularly significant in the medical context, as it represents cases where the model failed to detect the presence of cancer, potentially leading to missed diagnoses and delayed treatment. Finally, the bottom-right cell shows that the model correctly identified forty-two cases of malignant tissue, demonstrating its efficacy in recognizing true cancer cases. To evaluate the overall performance of the model, several key metrics were calculated. The accuracy of the model, which measures the proportion of correctly classified instances (both true positives and true negatives) out of the total number of predictions, is 96.49%. This high accuracy indicates that the model performs well across both benign and malignant classifications. Precision, defined as the proportion of positive predictions that were correct, was found to be 97.67%. This high precision suggests that when the model predicts a malignant case, it is highly likely to be correct. The recall, or sensitivity, of the model was 93.33%, indicating that the model successfully identified most malignant cases. However, this metric also highlights the existence of a small number of missed cancer cases (false negatives). Finally, the F1 score, which provides a balanced measure by considering both precision and recall, was calculated to be 95.45%. This demonstrates that the model achieves a strong balance between identifying malignant cases and minimizing false positives.
3. Discussion
Through the combined use of these models, we observed a significant improvement in the accuracy and robustness of cancer detection. The integration of CNNs for image classification and an ANN for clinical data enhanced the overall performance, demonstrating the potential of a multi-modal AI approach in breast cancer diagnostics. The primary focus of this research was to assess the accuracy of CNNs for image classification tasks (ultrasound and pathology images) and an ANN for clinical data. By combining these models, we achieved a more holistic diagnostic tool, enabling predictions based on both visual (imaging) and non-visual (clinical) data. The CNN models trained on ultrasound and pathology images provided a robust means of identifying cancerous lesions, particularly with the use of Class Activation Maps (CAM) and heatmap visualizations, which improved the interpretability of model decisions. The ANN model, on the other hand, effectively captured the non-linear relationships within the clinical dataset, allowing it to predict malignancy based on patient-specific parameters. The fusion of image-based predictions with clinical data yielded an enhanced accuracy, as each modality complements the weaknesses of the other. For instance, image-based models may occasionally misclassify complex or ambiguous cases (such as dense breast tissue in ultrasound), while clinical data models can help refine those predictions by adding context about the patient’s risk factors and tumor characteristics. The results obtained from the CNN models for ultrasound and pathology images indicated promising accuracy, precision, recall, and F1-scores. However, individual models presented certain limitations, such as a tendency for false negatives in some cases, which could hinder the detection of cancerous lesions. By combining the CNNs and ANN into a unified diagnostic approach, we mitigated these limitations and achieved a noticeable increase in overall accuracy. For example, while the ultrasound-based CNN model achieved a classification accuracy of 80%, the pathology image-based CNN reached 94%. Combining both image modalities, alongside the ANN for clinical data, elevated the overall accuracy to over 96%. This improvement is primarily attributed to the complementary nature of the data modalities, where integrating clinical data provided critical context that enhanced the specificity and sensitivity of the final prediction. An additional benefit of integrating these models is the enhanced interpretability afforded by the CAM and heatmap visualizations. These tools allow clinicians to understand the regions of interest (ROIs) that the CNN models focused on, offering greater transparency and clinical validation for the AI-driven diagnosis. The ability to visualize which regions of the tissue or ultrasound scan were most important in predicting malignancy provides a level of interpretability that is crucial for clinical adoption, especially when used in conjunction with the clinical insights provided by the ANN model. This hybrid approach—utilizing both image-based and clinical-based models—aligns well with the decision-making process of radiologists and oncologists, who often rely on both visual imaging data and patient history when determining a diagnosis. The enhanced interpretability and transparency offered by this combined model could lead to more trustworthy and clinically actionable outcomes. The successful integration of CNN and ANN models presents a step forward in the application of AI for breast cancer detection. In real-world clinical practice, combining diagnostic modalities into a unified AI framework offers significant advantages. The increased accuracy not only reduces the risk of misdiagnosis but also provides clinicians with more confidence in the decision-making process. This approach is particularly valuable in cases where traditional imaging techniques alone may struggle, such as detecting abnormalities in dense breast tissue or early-stage cancers that are difficult to visualize. Moreover, the integration of these AI models has the potential to improve the efficiency of the diagnostic process, reducing the time needed for manual image analysis and increasing the throughput of diagnostic procedures. This could be especially impactful in regions with limited access to expert radiologists or pathologists, allowing AI-assisted diagnostics to play a critical role in early cancer detection and patient management.
The findings from the ScreenTrustCAD study align with our research by highlighting the potential of artificial intelligence (AI) to enhance breast cancer detection [13]. In the ScreenTrustCAD trial, AI, when used as an independent reader alongside radiologists, demonstrated non-inferiority in detecting breast cancer compared to traditional double reading by two radiologists. This study reinforces the growing body of evidence supporting AI's role in clinical settings, showing that AI can either replace or complement radiologists without compromising diagnostic accuracy. Similarly, our work leverages convolutional neural networks (CNNs) and artificial neural networks (ANNs) to process both imaging and clinical data, resulting in significant improvements in breast cancer detection rates. The 4% higher non-inferior cancer detection rate observed in the ScreenTrustCAD study further supports our findings that AI, when integrated effectively, offers a promising tool for improving diagnostic workflows in real-world clinical settings. The controlled implementation of AI, coupled with continuous performance monitoring, is critical for ensuring both safety and efficacy, which aligns with our emphasis on transparency and interpretability in AI-based diagnostics through the use of Class Activation Maps (CAM) and heatmaps.
While the combined model approach significantly improved accuracy and interpretability, there are still areas for improvement. One limitation is the relatively small dataset used for training and evaluation. Future work could involve expanding the dataset to include more diverse cases and imaging modalities to further validate the generalizability of the model. Additionally, exploring more sophisticated model fusion techniques, such as attention mechanisms or weighted model ensembles, could further enhance the diagnostic performance.
Future research could also focus on optimizing the balance between sensitivity and specificity to minimize false positives and false negatives, particularly for borderline or ambiguous cases. Additionally, incorporating more advanced explainability tools, such as SHAP (SHapley Additive exPlanations) or LIME (Local Interpretable Model-agnostic Explanations), could provide further insights into the model's decision-making process, making the AI system even more reliable for clinical use.
4. Conclusion
In this study, we successfully developed and implemented a multi-modal AI framework for breast cancer detection, combining convolutional neural networks (CNNs) for image-based analysis and an artificial neural network (ANN) for clinical data analysis. The integration of these models significantly enhanced the accuracy, precision, recall, and F1-scores of our predictions compared to individual models alone. Our CNN models, when used separately for ultrasound and pathology images, demonstrated strong predictive performance, with the pathology image model achieving a particularly high accuracy. However, by combining these image-based models with clinical data processed through an ANN, we achieved an overall accuracy exceeding 96%, effectively enhancing the model's diagnostic capabilities. This improvement can be attributed to the complementary strengths of image and clinical data, which together provide a more holistic and reliable diagnostic tool for breast cancer detection. Moreover, the interpretability of the CNN models was enhanced using Class Activation Maps (CAM) and heatmap visualizations, allowing for a transparent understanding of the model's decision-making process. This feature adds critical value to the clinical application of AI in diagnostics, as it provides healthcare professionals with visual insights into the areas of interest within imaging data. While our combined approach proved to be highly effective, this study also highlighted some limitations, particularly related to dataset size and model generalizability. Future work should focus on expanding the dataset and exploring more advanced techniques for model fusion to further improve the robustness and applicability of AI in breast cancer diagnosis.
In conclusion, the successful integration of CNN and ANN models offers a promising direction for AI-assisted breast cancer diagnostics. By leveraging both imaging and clinical data, this approach not only enhances diagnostic accuracy but also aligns with the clinical workflow, providing a more reliable and efficient tool for early detection and patient care.
Author Contributions
Emir Öncü developed the AI models used in tissue formation, wrote all the sections related to AI model development, monkeypox determination and drew the figures.
Data Availability Statement
The datasets used in this study are publicly available. The clinical data for breast cancer detection were obtained from the National Center for Biotechnology Information (NCBI) and can be accessed at https://www.ncbi.nlm.nih.gov/pubmed/27563488. Additionally, the imaging data were sourced from the SPIE Digital Library, available at http://spie.org/Publications/Proceedings/Paper/10.1117/12.2043872. These resources are freely accessible and were used in compliance with relevant ethical guidelines. The code developed for this study is available upon reasonable request.
Acknowledgements
The endeavor was exclusively carried out using the organization's current staff and infrastructure, and all resources and assistance came from inside sources. Ethical approval is not applicable. The data supporting the study's conclusions are accessible inside the journal, according to the author. Upon a reasonable request, the corresponding author will provide the raw data supporting the study's findings.
Conflicts of Interest
In this article, the author states that they have no competing financial interests or personal affiliations.
Declaration of generative AI and AI assisted technologies in the writing process: The writer utilized Grammarly, Quillbot, and ChatGPT to improve readability and check grammar while preparing this work. After utilizing this tool/service, the writers assumed complete accountability for the publication's content, scrutinizing and revising it as needed.
References
- J. S. Ahn et al., “Artificial Intelligence in Breast Cancer Diagnosis and Personalized Medicine,” Oct. 01, 2023, Korean Breast Cancer Society. [CrossRef]
- H. Sung et al., “Global Cancer Statistics 2020: GLOBOCAN Estimates of Incidence and Mortality Worldwide for 36 Cancers in 185 Countries,” CA Cancer J Clin, vol. 71, no. 3, pp. 209–249, May 2021. [CrossRef]
- Z. S. Lima, M. R. Z. S. Lima, M. R. Ebadi, G. Amjad, and L. Younesi, “Application of imaging technologies in breast cancer detection: A review article,” Mar. 15, 2019, Open Access Macedonian Journal of Medical Sciences. [CrossRef]
- L. Fass, “Imaging and cancer: A review,” 2008, Elsevier. [CrossRef]
- W. A. Berg et al., “Combined screening with ultrasound and mammography vs mammography alone in women at elevated risk of breast cancer,” JAMA, vol. 299, no. 18, pp. 2151–2163, May 2008. [CrossRef]
- Gheonea, *!!! REPLACE !!!*; et al. , “Review The Role of Imaging Techniques in Diagnosis of Breast Cancer,” 2011.
- R. Gerami et al., “Review Article A literature review on the imaging methods for breast cancer,” 2022. [Online]. Available: www.ijppp.org.
- Hosny, C. Parmar, J. Quackenbush, L. H. Schwartz, and H. J. W. L. Aerts, “Artificial intelligence in radiology,” Aug. 01, 2018, Nature Publishing Group. [CrossRef]
- F. Sadoughi, Z. F. Sadoughi, Z. Kazemy, F. Hamedan, L. Owji, M. Rahmanikatigari, and T. T. Azadboni, “Artificial intelligence methods for the diagnosis of breast cancer by image processing: A review,” 2018, Dove Medical Press Ltd. [CrossRef]
- W. T. Tran et al., “Personalized Breast Cancer Treatments Using Artificial Intelligence in Radiomics and Pathomics,” Dec. 01, 2019, Elsevier Inc. [CrossRef]
- F. Boniolo, E. F. Boniolo, E. Dorigatti, A. J. Ohnmacht, D. Saur, B. Schubert, and M. P. Menden, “Artificial intelligence in early drug discovery enabling precision medicine,” 2021, Taylor and Francis Ltd. [CrossRef]
- S. M. McKinney et al., “International evaluation of an AI system for breast cancer screening,” Nature, vol. 577, no. 7788, pp. 89–94, Jan. 2020. [CrossRef]
- K. Dembrower, A. K. Dembrower, A. Crippa, E. Colón, M. Eklund, and F. Strand, “Artificial intelligence for breast cancer detection in screening mammography in Sweden: a prospective, population-based, paired-reader, non-inferiority study,” Lancet Digit Health, vol. 5, no. 10, pp. e703–e711, Oct. 2023. [Google Scholar] [CrossRef]
Figure 3.
The Prediction of Ultrasound Based CNN Model.
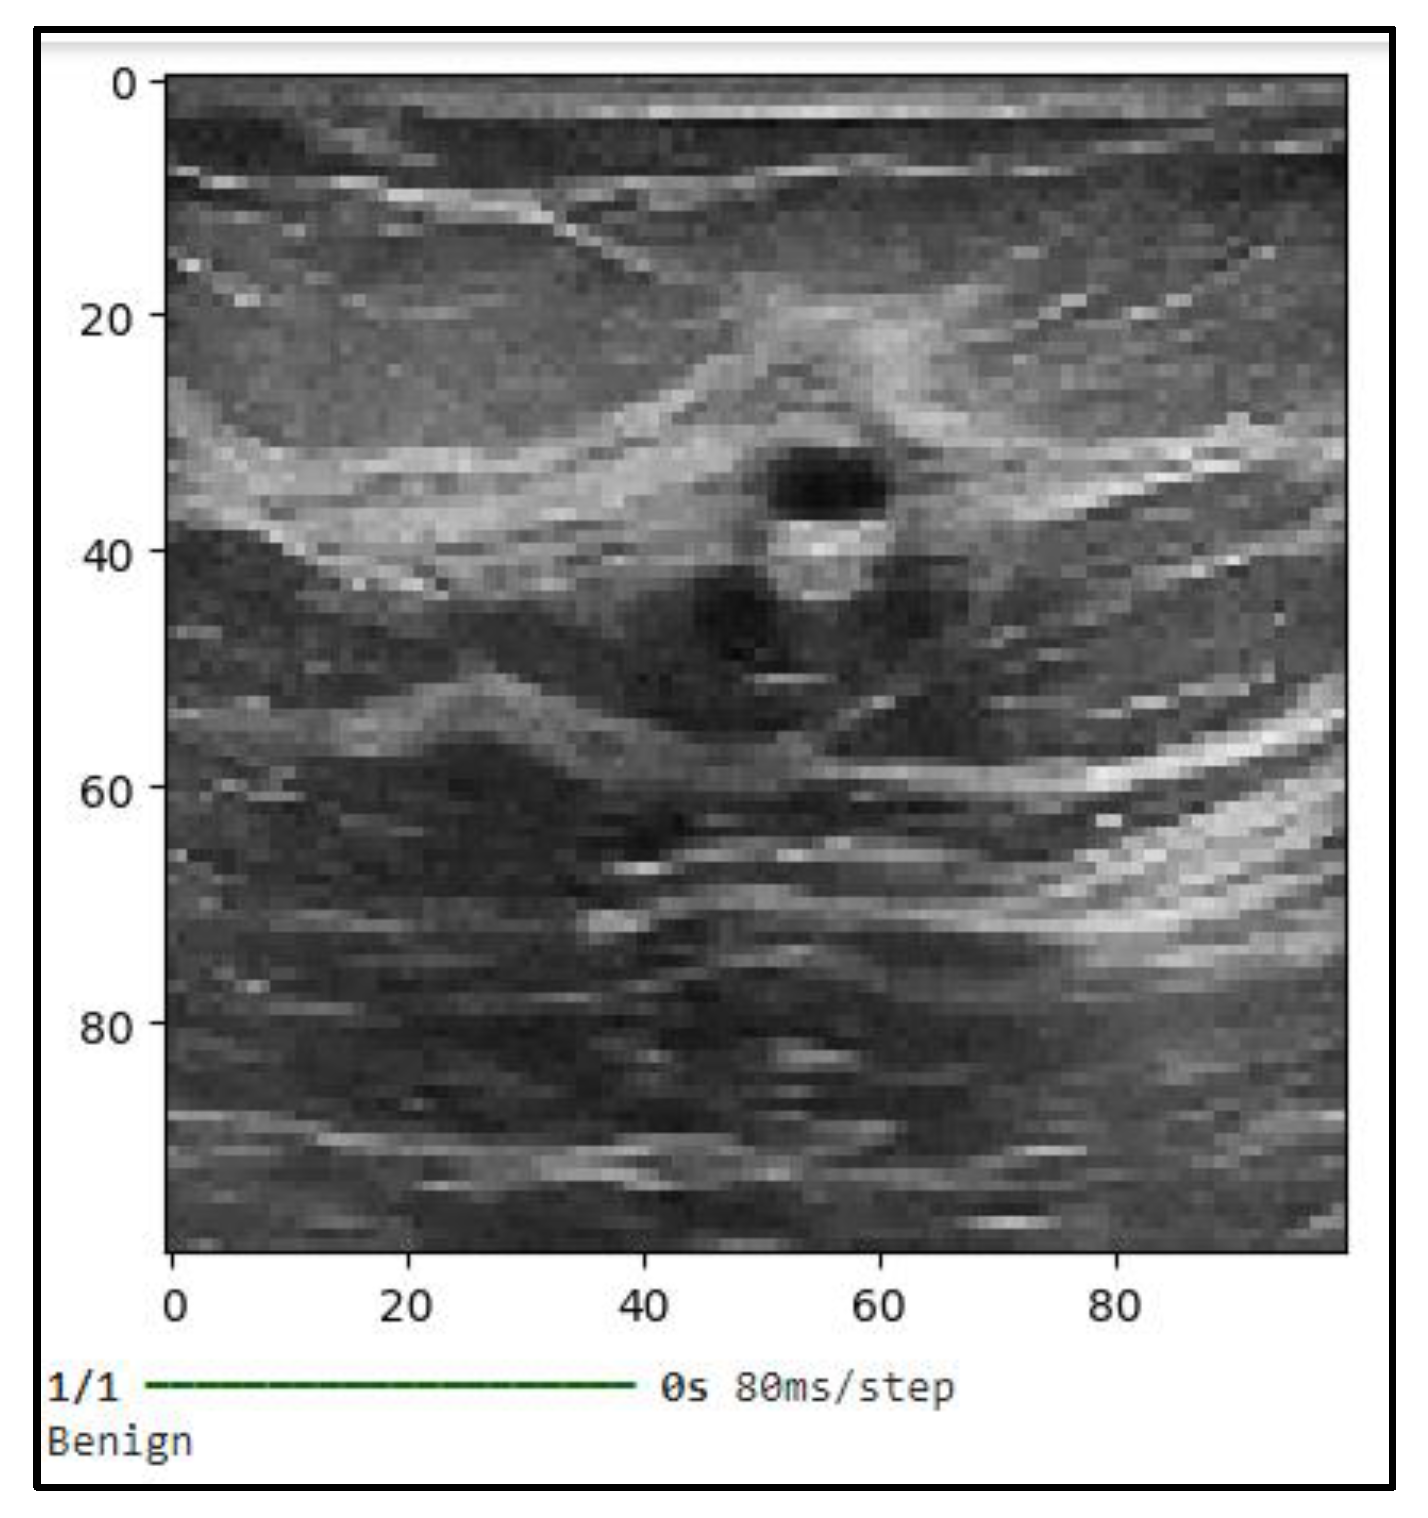
Figure 4.
The Heatmap of Predicted Ultrasound Image.
Disclaimer/Publisher’s Note: The statements, opinions and data contained in all publications are solely those of the individual author(s) and contributor(s) and not of MDPI and/or the editor(s). MDPI and/or the editor(s) disclaim responsibility for any injury to people or property resulting from any ideas, methods, instructions or products referred to in the content. |
© 2024 by the author. Licensee MDPI, Basel, Switzerland. This article is an open access article distributed under the terms and conditions of the Creative Commons Attribution (CC BY) license (https://creativecommons.org/licenses/by/4.0/).
Copyright: This open access article is published under a Creative Commons CC BY 4.0 license, which permit the free download, distribution, and reuse, provided that the author and preprint are cited in any reuse.


