
Submitted:
26 October 2024
Posted:
28 October 2024
You are already at the latest version
Abstract
This study explores the application of multi-real option valuation integrated with Security Token Offerings (STO) as an innovative approach to real estate project financing, using the Aspen Resort development as a case study. Traditional Discounted Cash Flow (DCF) methods often fall short in capturing the dynamic nature of long-term real estate projects, particularly in adapting to market uncertainties and changes. This research addresses these limitations by employing a multi-real option model, which allows for flexibility in decision-making by evaluating various investment phases through the binomial lattice framework. The analysis demonstrates that the STO-based project financing (STO-PF) model, when applied to the Aspen Resort, provides superior financial outcomes and strategic advantages compared to conventional DCF methods. Key findings reveal that the STO-PF model enhances liquidity, democratizes investment access, and offers improved risk management through digital platforms. The results showcase how integrating STOs with real option models quantifies the project’s expanded net present value (ENPV), thereby optimizing investment decisions under volatile market conditions. This study not only contributes theoretically to the literature on STO financing but also provides practical implications for developers seeking flexible and innovative financing solutions in real estate. Future research should explore the applicability of STOs across diverse market conditions and regulatory environments, including the integration of emerging technologies such as AI and blockchain for enhanced financial modeling.
Keywords:
STO PF
; Multi-Real Option
; Blockchain Based Platform
; AlternativeModel
; DigitalConstruction
; ComparativeValidation
; IntegratedStructure
; Integrated Project Management System
; AI
Introduction
In real estate development, profitability analysis is the cornerstone of feasibility evaluation. This analysis translates findings from initial investigation and market analysis phases into monetary terms, determining the viability and potential success of a project. Private developers, especially those relying on construction firms to provide payment guarantees for land acquisition loans, must thoroughly analyze financial costs based on cash flow projections. This stage is pivotal in determining whether a project will achieve its intended financial outcomes. However, traditional frameworks, particularly the Discounted Cash Flow (DCF) model, often present significant limitations when applied to real estate development projects.
Purpose: STO-Based Project Financing and Multi-Real Option Valuation
This study addresses the limitations of traditional real estate financing models by examining the integration of Security Token Offering (STO)-based project financing with a multi-real option valuation model1. An STO is a blockchain-enabled financial instrument that allows developers to issue digital tokens, representing ownership stakes or rights in a project, which facilitates early inclusion of future cash flows into the financing structure. By democratizing investment, this approach increases liquidity and widens access to capital through digital platforms.
By integrating STOs with a multi-real option valuation model, the study aims to provide a flexible and adaptive framework that incorporates market uncertainties and strategic decision-making capabilities. The multi-real option model extends beyond traditional single-option analysis by evaluating multiple investment stages and providing the flexibility to defer, expand, or abandon investments as conditions change. Particularly relevant to digital construction technologies, this model accounts for cost variability and risks arising from technological implementation and project progress, predicting future value step-by-step.
Research Objectives
This study aims to explore how Security Token Offerings (STO) can facilitate more efficient capital raising, enable the early integration of future cash flows into the development process, and enhance liquidity. By utilizing empirical data from the Aspen Resort project, the research conducts a quantitative comparison of the financial outcomes of the STO-PF model with those of traditional Discounted Cash Flow (DCF) approaches. The study introduces a model that integrates real options and flexibility into the evaluation process, providing a more comprehensive framework for future development projects. By leveraging digital platforms and blockchain technology, the STO-PF model democratizes investment access, reduces reliance on traditional debt mechanisms, and mitigates associated risks. Ultimately, this research seeks to demonstrate the superiority of the STO-PF model in enhancing financial stability and risk management for developers in an increasingly complex and dynamic market environment. The findings highlight the strategic advantages of adopting STO-based financing in real estate development, where the ability to adapt to future uncertainties becomes essential for sustainable financial outcomes.
Significance of the Study
This study represents a pioneering effort in empirically applying a multi-real option model within the framework of STO-based project financing in the real estate sector. By leveraging real-world data from the Aspen Resort project, the research provides robust quantitative evidence of the inherent advantages of STO financing. Specifically, it demonstrates how the integration of market uncertainties and strategic decision-making mechanisms, such as deferral and abandonment options, can significantly enhance investment outcomes and optimize the financial feasibility of projects.
The findings of this study hold practical significance for key stakeholders in the real estate market, including developers, investors, and policymakers. By highlighting the superior performance of STO-based financing compared to traditional methods, the study introduces a viable framework for modernizing real estate finance. This framework promises to improve financial stability and enable more effective risk management, especially in volatile market conditions.
Additionally, this research builds on contemporary developments by applying an innovative real options model to the unprecedented Aspen Resort project. Using actual STO data, the study offers empirical validation of the accuracy and strategic flexibility that STO-based project financing brings to real estate development. The comprehensive comparative analysis presented in this work not only sets a new standard for valuation precision and adaptability in real estate finance but also underscores the transformative potential of STO integration in reshaping traditional project financing models.
Review of Existing Research on Development Projects and Real Options
Financing Model for STO-Based Projects
The issuance of Security Token Offerings (STOs) is rapidly emerging as an innovative way to secure initial funding for real estate development projects. By issuing an STO, developers can incorporate the project's projected future value, including projected rental income, at an early stage, allowing executors to continue their projects as the project progresses, without losing funding in the face of rapidly changing situational obstacles. The model proposed in this study presents a new business model through the use of multi-real options that maximizes the reflection of future value creation in terms of the present, ensuring greater financial stability throughout the project lifecycle.
Discounted Cash Flow (DCF) method inherently assumes a fixed future scenario, making it unsuitable for long-term projects characterized by uncertainty and dynamic changes. This rigidity limits its flexibility in adapting to fluctuating market conditions, regulatory shifts, or unforeseen risks, especially in projects with extended timelines and significant market exposure (Guthrie, 2013). Consequently, DCF models often provide inaccurate valuation estimates because they do not accommodate strategic decision-making options, such as deferral, expansion, or abandonment, as the project progresses (Hoesli et al, 2021).
To address these limitations, this study proposes a comparative analysis using a multi-real option model to evaluate STO-based project financing (STO-PF) against traditional DCF-PF. By integrating Security Token Offerings (STOs) into the financing structure, the research explores how digital platforms and blockchain technology enable the early integration of future cash flows and market value. Unlike DCF's backward-looking perspective, the STO model provides a forward-looking approach, reflecting the project's potential future profitability.
By tokenizing anticipated future revenue streams, such as rental income, developers secure funding aligned with the project's long-term profitability potential. This proactive integration ensures consistent capital flow and allows stakeholders to make informed, strategic adjustments based on market signals, so it promotes collaboration among developers, financial institutions, and investors. Utilizing digital platforms such as blockchain enhances transparency and security, building investor confidence and facilitating a collaborative project execution approach. This contrasts sharply with the sequential dependency found in traditional models, where bridge loans and mortgages significantly influence project timelines and financing terms, and it democratizes real estate investment, broadening the investor base and increasing liquidity. This diversification reduces reliance on traditional debt instruments, thereby mitigating risks commonly associated with rigid, sequential project financing.
Assuming that a real estate development project is initiated through STO issuance, the developer's capital is used for the first phase (land acquisition and initial costs). Subsequent phases, including bridge financing and secondary investments (e.g., construction costs), are funded through additional STOs. This approach considers potential financial challenges, such as deteriorating market conditions or issues with other financial investors, introducing options for deferral or abandonment of the initial investment. This flexibility aligns with real options theory, which allows developers to adapt to future changes in the business environment (Guthrie, 2013; Hoesli et al, 2021).
Review of Existing Research on Development Projects and Real Options
Valuation research has traditionally focused on investments in technology and infrastructure sectors like IT and energy. However, the application of STOs has expanded into real estate, infrastructure projects, and complex development investments. Studies since 2020 have advanced the integration of real options with STO financing, offering refined models for dynamic and uncertain markets.
For example, Geltner and Mei (2021) applied a binomial model to urban regeneration projects, demonstrating that STOs could improve liquidity and investment access compared to traditional methods. They showed that combining STOs with real options provided more accurate valuations by accounting for the changing nature of real estate markets. Similarly, Anglin et al. (2022) evaluated wind farm investments, using a least-squares Monte Carlo method to integrate STOs. Their approach optimized funding and managed price volatility and regulatory risks, enhancing financial resilience.
Smith and Watkins (2023) explored large-scale infrastructure projects, such as ports, using a compound real options model. They demonstrated that incorporating abandonment and expansion options allowed for greater adaptability in managing complex risks, proving superior to DCF and single-option models.
Earlier works like Trigeorgis (1996) and Geltner et al. (2019) utilized models such as the Black-Scholes and binomial lattice but were limited to single-option scenarios. These models were less effective for the simultaneous interactions seen in complex real estate projects. Recent studies, such as those by Hoesli et al. (2021), emphasized the need for multi-real option models to capture these interactions more holistically.
Methodology: STO-PF and Multi-Real Option Models
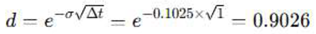
In this study, we propose a novel model that integrates Security Token Offerings (STO) with Project Financing (PF) within a multi-stage real options framework to address the core issues identified in Chapters 1 and 2. This integrated model, referred to as STO-PF with Multi-Real Option Model, offers a more flexible, transparent, and risk-diversified approach to real estate project financing, as illustrated in Figure 1. The model tackles the evolving needs for financial strategies in real estate development, allowing for better adaptability and transparency in the funding process while effectively distributing risk among various stakeholders. This model, by leveraging real options theory, enhances decision-making flexibility throughout the project lifecycle, allowing developers and investors to make informed decisions in response to market fluctuations and project uncertainties.
Implications for Broader Real Estate Finance Frameworks
By comparing these structures to traditional project financing (PF) models based on multi-real option frameworks, the analysis emphasizes how STOs enhance efficiency in capital raising and future cash flow integration through digital platforms. Unlike conventional models, which heavily depend on debt mechanisms and third-party guarantees, the STO structure offers distinct advantages by leveraging future-oriented valuation approaches.
Integrating STOs into existing real estate finance frameworks requires collaboration between developers, investors, financial institutions, and regulators. By developing standardized processes and platforms that facilitate the issuance and trading of tokens, the real estate industry can modernize its financing approaches and attract a wider range of investors.
Conceptual Framework and Core Components
The STO-PF model is designed to bridge the gap between traditional real estate financing and modern blockchain-based tokenization methods. It leverages Security Token Offerings to democratize investment by allowing both institutional and retail investors to participate in various stages of a real estate project. The key components of this model include: The developer or property owner initially secures equity through either internal funding or private equity sources which covers early-stage investments such as the land down payment. To finance the acquisition and permit phases, bridge loans provide short-term liquidity secured against the purchased land and existing capital, ensuring liquidity during the transition to the construction phase. As the project advances to the construction phase, the model employs PF, wherein future cash flows and project assets serve as collateral for additional funding. The PF structure enables developers to raise substantial funds without diluting their equity stakes. In this model, private equity, banks, and real estate trusts (REITs) contribute to project funding through direct equity or debt investments.
The pivotal feature of this model is the integration of, developers issue security tokens that represent fractional ownership of the project STOs through a blockchain-based platform. These tokens are available for public offering, allowing investors to participate in the project’s financial returns. Token holders receive beneficial certificates that guarantee a share in future cash flows, such as rental income, utility tokens, or sales proceeds upon project completion. This approach reflects future value in the early stages of the project, making it easier to secure capital without traditional large-scale loans.
Upon completion, traditional mortgage structures provide long-term financing, and the project generates rental income, or sales proceeds. This income is distributed to STO investors, ensuring alignment between the project's future cash flows and the initial token issuance.
By tokenizing project ownership, the model spreads risk across a wider investor base, reducing reliance on a few institutional lenders. This also mitigates the developer's risk, as the reliance on large, single-source loans diminishes.
The model incorporates a multi-real option approach, allowing developers to exercise flexibility in project financing. The ability to raise funds in stages, based on project milestones, aligns with the real options theory, which emphasizes value under conditions of uncertainty. This model introduces financial flexibility, enabling developers to make informed decisions about project continuation or restructuring at various stages.
The core advantage of this model lies in its ability to align stakeholder interests. Investors gain access to real-time financial performance data via blockchain, ensuring transparency and minimizing information asymmetry. Additionally, developers can tap into a diverse pool of capital sources, thus improving liquidity and optimizing project governance.
The integrated project digital management system forms the core of this innovative approach, highlighting the benefits of a structured and technologically enhanced project financing model.
Figure 2 shows the process of forming an alternative model of PF structure through a sophisticated digital integrated management system for real estate development. The digital platform oversees financial flows, stakeholder engagement, and real-time monitoring of project progress, streamlining comprehensive project management while creating alternatives. This structured integration model of PF demonstrates the potential of digital integration to enhance system transparency and collaboration, and improves business stability by making informed decision-making throughout the project lifecycle by ensuring that all stakeholders have access to up-to-date financial information.
Overview of Real Options
Real options refer to applying financial options models to evaluate the value of tangible assets, a concept pioneered by Stewart Myers (1977), who argued that traditional DCF approaches often undervalue projects by ignoring embedded options. Myers highlighted the need for financial management to evolve and include these real options, reflecting strategic investment flexibility.
Real options analysis provides decision-makers with the tools to adapt to future uncertainties by embedding flexibility and strategic value into investment appraisals. When conditions are favorable, options can be exercised to enhance project value, while unfavorable conditions allow for deferral or abandonment, minimizing losses (Copeland and Antikarov, 2001). This flexibility is especially significant when options interact, as their combined effects can alter overall project valuation (Pindyck and Dixit, 1994).
Traditional valuation methods generally assume that uncertainty raises discount rates, thus decreasing project value. However, the real options perspective suggests that higher uncertainty creates more opportunities for flexible decision-making, potentially increasing value. This adaptability is particularly valuable for long-term, complex real estate projects where market conditions and other factors evolve dynamically (Brach, 2003; Trigeorgis, 1993).
Model Selection Problem: The Binomial Lattice Model
Various models, including the Black-Scholes model, Binomial Lattice model, and Monte Carlo simulations, can be used to evaluate real options. However, in real estate development, the Binomial Lattice Model is often preferred due to its capacity to capture discrete time intervals and its flexibility in accounting for multiple investment phases. The Black-Scholes model requires extensive time-series data, which is often unavailable for real estate projects, making it less suitable. Monte Carlo simulation is suitable for high-dimensional probability models but is limited in its ability to provide decision-making models at each investment stage.
The binomial lattice model, developed by Cox et al.(1979), allows for the construction of a multi-period, discrete-time framework that is ideal for capturing the complexities of real estate development. It evaluates options at each stage of the project, accounting for both upward and downward movements in asset value based on market volatility.
Establishing a Multi-Real Option Model for STO-Based Projects
To analyze real estate investment options within STO financing, a sequential composite options valuation model is utilized. This model divides the investment process into short-term and long-term options, where each phase depends on the successful completion of the preceding phase. Long-term options are evaluated first using a binomial lattice approach, followed by the assessment of short-term options (Copeland and Antikarov, 2001).
In the application of multi-real options, there are two primary types of composite options: simultaneous composite options, where two options must be satisfied simultaneously for value realization, and sequential composite options, where each option depends on the successful execution of the preceding stage. The latter is more complex due to the need for conditional execution. Additionally, deferral options can be categorized into European-style options (exercisable only at expiration) and American-style options (exercisable at any time before expiration), with the latter being more intricate. This study develops a model incorporating American-style sequential composite options, tailored to the characteristics of real estate development projects, where the first investment must be completed before the second can proceed.
According to Trigeorgis (2005), the relationship between Expanded Net Present Value (ENPV) and Net Present Value (NPV) is expressed as:
ENPV=NPV+ROV
ENPV : Represents the project's value after considering the flexibility and strategic options offered by the STO financing structure.
NPV : The traditional NPV without considering options.
ROV : The value derived from the flexibility and strategic advantages, such as the ability to defer or abandon investments, provided by STOs.
Input Variable Setting
For the application of option theory to STO-based project financing in real estate development, it identifies key variables that affect the option price and outlining the process for multi-real option models.

Table 1.
Comparison of financial option variable and real option variable.
| Variable | Real Estate STO Financing Context | Equivalent in Financial Options |
|---|---|---|
| Present Value (S) | Represents the present value of the project’s projected cash flows, including future rental income, sales, or other revenue sources. | Asset Price (S) |
| Volatility (σ) | Reflects market uncertainty and the potential variability in property values that may affect future revenue. | Volatility of Asset Price (σ) |
| Strike Price (X1, X2) | Represents the investment required for the first and second phases of development. For example, X1 might be the cost of land acquisition, and X2 could be construction costs. | Strike Price (K) |
| Risk-Free Interest Rate (R) | The time value of money, reflecting the cost of delaying the investment decision. This affects whether it is more profitable to invest now or wait. | Risk-Free Interest Rate (r) |
| Expiration Date (T) | The window of opportunity during which the investment must be made, before the option expires. | Expiration Date (T) |
Model Applications and Validation
In the verification and results of the model, the Aspen Resort Project explains the case project overview and applies the model to prove the validity of the model as the result.
Case Study: Aspen Resort STO
The Aspen Resort project2, particularly the issuance of Aspen, serves as the focal case study to demonstrate the application of STO-based project financing and multi-real option valuation. Aspen was introduced by Elevated Returns as an innovative approach to tokenize a fraction of the St. Regis Aspen Resort. The project successfully raised $18 million by issuing tokens at $1 per unit, with a minimum investment requirement of 10,000 tokens per accredited investor, representing 19% of the property’s ownership. This STO marked a milestone in the use of blockchain technology for luxury real estate development.
The scenario analysis focuses on evaluating the Aspen Resort project using the multi-real option model developed within the binomial lattice framework. Several key assumptions are made to construct the binomial lattice and simulate different investment outcomes: The present value of the Aspen Resort’s projected cash flows, including rental income and the terminal sale price, is set at $22.57 million, representing 18.9% of the total asset value of the resort. This value is used as the initial node (t=0) in the binomial lattice. The model uses annual time intervals (Δt = 1 year). The maturity of the initial investment option (X1) is set at two years, while the maturity of the secondary investment option (X2) is set at four years, exercisable between the third and fourth years. At each node, the model applies the upward (u = 1.1079) and downward (d = 0.9026) coefficients calculated based on the volatility rate. Future cash flows are discounted using the risk-free rate to obtain their present values. The binomial lattice model calculates these values backward from the final node, using risk-neutral probabilities to determine the expected value at each stage. At each node, the model evaluates the options to continue, defer, or abandon the investment based on projected future cash flows and costs. This valuation is calculated through backward induction, ensuring that each decision point reflects the most strategic choice given the market conditions.
Comparison of Models: Applying the Multi-Real Option Model
By integrating key financial variables such as investment costs, volatility, and risk-neutral probabilities, the model enables a comprehensive scenario analysis that reflects the flexibility and strategic value of modern real estate financing methods. This scenario is illustrated in Figure 3, which depicts the sequential compound options framework.
The first investment occurs during the initial phase, and the second investment during the subsequent phase. The second investment must be preceded by the first investment. (Sequential Composite Option) At each phase, the option to exercise, defer, or abandon the investment is available. During each period, option rights can be exercised along the way. (U.S. Cuisine Option) The deferral option applies during the first investment phase, while both deferral and abandonment options are available during the second investment phase.
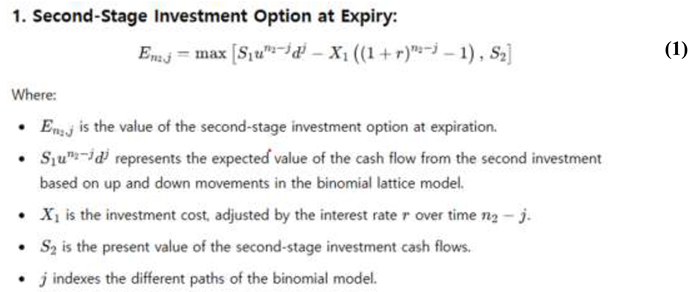
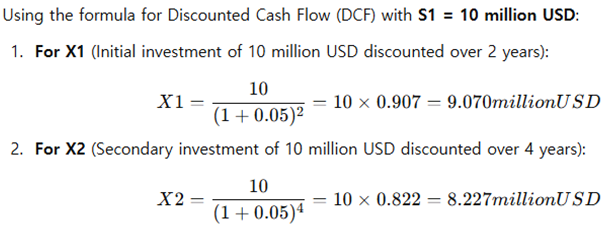
The first equation describes the decisions that an investor can make at the time of expiration of a secondary investment option. At this point, the investor can choose whether to proceed or stop the secondary investment. The investment decision is made by weighing the potential return from the secondary investment against the cost of the investment.
The equation is as follows:
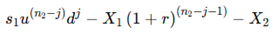
where S1 is the present value of the cash flows generated in the first phase and it represent the volatility of an asset's value, which can fluctuate upward or downward, respectively. This equation calculates the expected cash flow by considering the upward or downward movement of the asset.
X1 and X2: X1 is the first investment cost, and X2 is the second. This value represents the amount of money that must be paid in each of the two phases of investment considering both the cost of the primary and secondary investments before deciding whether to proceed with the investment.
(1+r): This value is the 'risk-free interest rate' that represents the value of the money over time at the time of investment.
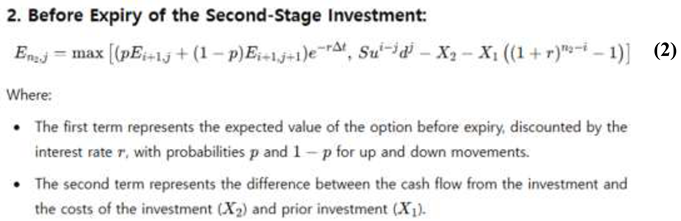
Describe the decisions made before the expiration of the secondary investment options. In other words, investors can make an interim decision before the expiration of the investment, that is, whether to execute, postpone, or stop the secondary investment depending on market conditions, even before expiration.
The equation is as follows:
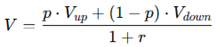
It refers to the method of calculating future cash flows probabilistically. where p is the risk-neutral probability, which means the probability that the market will go up, and 1−p is the probability that the market will go down. 1+r is a risk-free interest rate and is used to convert future cash flows to present value. In this binomial model, two probabilities are used to make investment decisions.
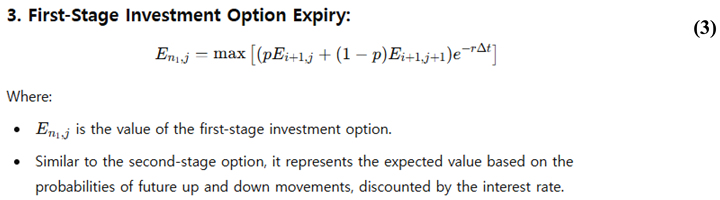
The third equation deals with the decisions that an investor can make during the period of the primary investment option. The investor considers the cost of the primary investment (X1) and the resulting cash flow to decide whether to proceed, postpone, or stop the primary investment.
The equation is as follows:
indicates how much time is left for investing at this point, using risk-neutral probability, it evaluates future cash flows by considering the likelihood that an asset will increase or decrease in value, and discounts it to its present value to support decision-making. Investors can make interim decisions that adapt to market fluctuations over time.
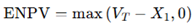
The value of short-term options E on each node is determined as follows:
The first equation determines whether to continue with the secondary investment or end up with the first, the value of proceeding with the second investment versus stopping at the first (Equation 1).
Before expiration, the second equation allows for intermediate decisions, which use risk-neutral probabilities to make decisions that account for upward and downward outcomes, the value of continuing the second investment versus holding or abandoning it (Equation 2).
Prior to the expiration of the primary investment option, the third equation allows you to determine whether to proceed with the primary investment based on the risk-neutral probability between now and expiration, the value obtained using risk-neutral probabilities (Equation 3).
The greater of executing the first investment or holding it open (Equation 4).
The greater value of either holding or executing the first investment (Equation 5).
In summary, the real multi-options model provides a comprehensive valuation approach to help investors be flexible in their decision-making in the first and second stages of their investments:
DCF Model for Aspen
The Aspen project represents an 18.9% ownership stake in the St. Regis Aspen Resort, with its valuation and returns being calculated using a Discounted Cash Flow (DCF) analysis. The analysis takes into account real market trends and projected rental income growth to proportionally adjust Aspen's value based on its share.
Table 2.
Management Expenses and Proper Calculations.
| Classification | t=0 | t=1 | t=2 | t=3 | t=4 | t=5 | t=6 |
|---|---|---|---|---|---|---|---|
| Rent Income | 0 | 0.50 | 0.51 | 0.52 | 0.53 | 0.54 | 0.55 |
| Management Income | 0 | 0.05 | 0.051 | 0.052 | 0.053 | 0.054 | 0.055 |
| Sale Price | 0 | 0 | 0 | 0 | 0 | 0 | 22.57 |
| Total Income | 0 | 0.55 | 0.561 | 0.572 | 0.583 | 0.594 | 23.12 |
| Property Purchase Price | 10.00 | 0 | 0 | 0 | 0 | 0 | 0 |
| Construction & Incidental Costs | 0 | 3.00 | 3.00 | 0 | 0 | 0 | 0 |
| Management Expenses | 0 | 0.10 | 0.10 | 0.10 | 0.10 | 0.10 | 0.10 |
| Total Expenditure | 10.00 | 3.10 | 3.10 | 0.10 | 0.10 | 0.10 | 0.10 |
| Net Operating Profit (NOP) | -10.00 | -2.55 | -2.539 | 0.472 | 0.483 | 0.494 | 23.02 |
| Rate of Discount (5%) | 1 | 0.9524 | 0.9070 | 0.8638 | 0.8227 | 0.7835 | 0.7462 |
| Discounted Cash Flows | -10.00 | -2.429 | -2.301 | 0.407 | 0.397 | 0.387 | 17.19 |
| NPV | 3.65 | ||||||
Administrative expenses started at t=1 and added a fixed $0.10 million per year. Net operating income (NOP) now correctly calculates both income and expenses, including administrative expenses added. The discount rate remains at 5% and is consistently applied to future cash flows. The project's final NPV is currently $3.65 million.
Table 3.
Aspen Project Binomial Lattice Model Variables.
| Variable | Value |
|---|---|
| Present Value (S) | 22.57 million USD |
| Present Value on Initial Investment (S1) | 10.00 million USD3 |
| Present Value on Secondary Investment (S2) | 12.57 million USD |
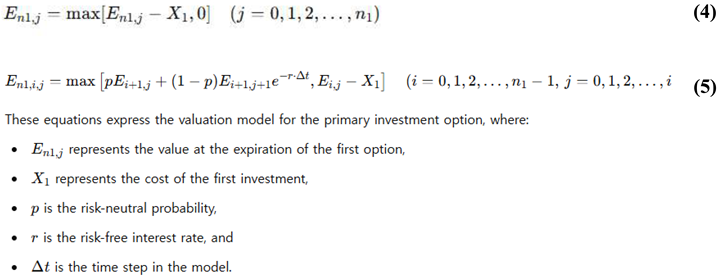
| Investment Expense on Initial Investment (X1) | 9.070 million USD (discounted over 2 years) |
| Investment Expense on Secondary Investment (X2) | 8.227 million USD (discounted over 4 years) |
| Volatility (σ) | 10.25% |
| Risk-Free Rate (R) | 5% |
| Time Interval (Δt) | 1 year |
| Up Coefficient (u) | 1.1079 |
| Down Coefficient (d) | 0.9026 |
| Similar Probability (p) | 0.7241 |
| Earnings (E) | – |
| Investment Period on Initial Investment (n1) | 2 years |
| Investment Period on Secondary Investment (n2) | 4 years |
In this case, the present value (PV), expressed as S, is calculated based on the projected future cash flow generated by the investment used to purchase the property and is discounted to the present. It includes the rental income for the investment period and the sale price of the property at the end of the investment period. The formula for calculating the present value is as follows:
Thus, the discounted values for S1 = 10 million USD are 9.070 million USD for X1 and 8.227 million USD for X2. Since the initial investment includes a large portion of the project’s costs, we assume the initial investment present value is proportional to its share of the total costs, giving us 10 million USD.
The S2 value refers to the present value of the secondary investment, which focuses on the value generated after the initial investment, particularly the value gained in later years of the investment when further income is earned while associated with later-stage expenses, such as construction costs and management. We split the construction costs into two equal parts over t=1 and t=2 (3 million USD each). S2 includes the part of the cash flow not covered by S1 and is derived from the sale price and rent income after the first two years, which totals 12.57 million USD.
The X1 value represents the investment costs associated with the initial investment stage (essentially, it refers to the property purchase). Based on the budget allocated, X1 is set to 9.070 million USD (discounted over 2 years), which includes the property purchase cost and other initial expenses.
The X2 value refers to the investment costs associated with the secondary investment, primarily construction and incidental costs incurred after the property purchase. The total for the secondary investment (X2) comes out to 8.227 million USD, which includes ongoing costs like management during the later stages.
We use a 5% discount rate to calculate the present value for both X1 and X2. Here’s how we calculate the discounted values:
Multi-Real Option Model for Aspen
This table represents the total project value at different time steps, starting from t=0 with a project value of 22.57 million USD. Each subsequent time step models the project value, applying the up coefficient (u) and down coefficient (d), just as in Table 4 to the values from the previous time step to model how the project value evolves over time, reflecting both potential increases and decreases.
Application to Aspen Project
- Initial Value (t=0): The total project value at t=0t=0t=0 is 22.57 million USD, as calculated based on the discounted cash flows from rent and the final sale price.
- Up Coefficient (u): Calculated based on volatility (10.25%) and time interval (1 year):
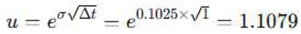
This means the project value can increase by about 10.79% at each upward step.
- 3.
- Down Coefficient (d): Inversely calculated:
This reflects a 9.74% decrease at each downward step.
Calculation for Table 4:
- Starting at t=0t=0t=0 with 22.57 million USD.
-
At t=1t=1t=1, we calculate two outcomes: one upward and one downward.
- ○
- Upward value: 22.57×1.1079=25.0022.57 =25.00
- ○
- Downward value: 22.57×0.9026=20.3722.57 =20.37
- For t=2t=2t=2, continue calculating upward and downward movements for each of the previous nodes.
Thus, we calculate the potential project values at each time step up to t=5t=5 based on the up and down factors.
t=0: The starting value is 10 million USD (the initial investment). Table 5 focuses specifically on the initial investment value, reflecting its potential growth or decline over the same time periods.
- Initial Value (t=0): S1=10.00S1 = 10.00S1=10.00 million USD.
-
We apply the same up (u) and down (d) coefficients calculated for Table 4.
- ○
- Upward movement at t=1: 10.00×1.1079=11.0810.00 =11.08
- ○
- Downward movement at t=1: 10.00×0.9026=9.0310.00 =9.03
- This process continues for each time step, building out the lattice for t=1 to t=5.
Table 6.
Binomial Lattice of Deferral/Composite Option Valuation (Secondary Option, million USD).
| t=0 | t=1 | t=2 | t=3 | t=4 | t=5 |
|---|---|---|---|---|---|
| 12.57 | 13.93 | 15.43 | 17.08 | 18.88 | 20.85 |
| 11.35 | 12.57 | 13.93 | 15.43 | 17.08 | |
| 10.25 | 11.35 | 12.57 | 13.93 | ||
| 9.25 | 10.25 | 11.35 | |||
| 8.35 | 9.25 | ||||
| 7.54 |
t=0: The starting value is 12.57 million USD, which is the present value of the secondary investment (S2) after the initial investment. As with the previous tables, we apply the up coefficient (u) and down coefficient (d) over each time step to model the potential future value of the secondary investment. This table models the value of the secondary investment (S2), which is 12.57 million USD. The process is the same as for S1 but applies to the later-stage investments.
- Initial Value (t=0): S2=12.57 million USD.
-
We apply the same up (u) and down (d) factors.
- ○
- Upward movement: 12.57×1.1079=13.9312.57 =13.93
- ○
- Downward movement: 12.57×0.9026=11.3512.57 =11.35
We build the lattice up to t=5t=5 as in the previous tables.
Table 7 details the primary investment (S1), which represents the initial property acquisition cost of $10 million (at t=0). The table uses a binomial lattice model, applying upward (u) and downward (d) movement coefficients at each time step to simulate potential changes in value. It tracks how the value of the primary investment evolves over time, providing decision points each quarter to continue or halt investment.
Table 8 uses a binomial lattice model to evaluate both primary and secondary investment options, focusing on the flexibility of subsequent investment decisions based on the outcomes of the initial phase. If the first phase (e.g., the profitable development of the Aspen St. Regis Resort) is successful, the project can expand, leading to higher returns. This flexible approach adapts investment decisions according to each project phase’s progress and profitability.
Comparative Validation Results
The analysis compares the traditional project financing (PF) model of the St. Regis Aspen Resort in New York with the Security Token Offering (STO) PF model, demonstrating the benefits of the convergence model. The STO PF model shows a project value (E) of $10 million, with a Real Option Value (ROV) of $6.35 million compared to the Net Present Value (NPV) of $3.65 million for the traditional PF structure. Both models present positive NPV, confirming the project's investment value. However, the STO structure introduces greater flexibility and accounts for future uncertainties, making it strategically advantageous. The evaluation of multiple real options results in a higher value of $6.35 million, highlighting how traditional NPV analysis, which does not incorporate such flexibility, undervalues the business.
The Aspen project uses a Security Token Offering (STO) model combined with real option valuation (ROV) to manage market uncertainties, such as those introduced by the pandemic. This model allows for investment flexibility across different development stages. By integrating variables like risk-free interest rates, volatility, and investment timing, the project offers a more strategic decision-making framework, enabling investors to evaluate and adjust investments dynamically and evaluates the Aspen project using both traditional project financing (PF) and STO mechanisms, comparing the Net Present Value (NPV) method with a multi-stage real option framework. The initial investment of $22.57 million, which corresponds to an 18.9% ownership stake, was assessed using a 5% discount rate over six years, resulting in an NPV of $3.65 million, indicating financial viability. However, NPV remains static, lacking adaptability to market fluctuations.
Applying ROV showed that the deferral option for the second investment phase was valued at $12.57 million, while the first phase was valued at $10 million. This added $8.92 million to the project’s value compared to the traditional NPV, highlighting the importance of flexibility and strategic planning. This confirms that real options align better with the fluid and dynamic nature of the STO and real estate sectors, providing a more accurate and strategic valuation.
Overall, the real options framework enhances investment strategies by allowing developers to adjust phases based on market signals, confirming the viability of phased investments. For Aspen, this structure supports both immediate and future growth by adapting investments in response to evolving market conditions, ensuring the project remains financially viable throughout its lifecycle.
Conclusion
This chapter synthesizes the key insights derived from the study, underscoring the significance of Security Token Offering (STO)-based project financing when integrated with real options models. These findings highlight the superiority of this approach over traditional Discounted Cash Flow (DCF) methodologies in the context of real estate development. The STO-real options model offers enhanced flexibility, increased access to capital, and greater risk diversification, enabling stakeholders to make more informed decisions throughout a project’s lifecycle.
One of the core contributions of this study is its demonstration of how STO-based financing aligns future value realization with present financing needs. By integrating digital platforms, the model enhances transparency and investor engagement, while offering a more resilient structure for managing the inherent uncertainties in real estate development. This stands in contrast to the static nature of DCF models, which often fail to capture the dynamic risks and opportunities encountered in real estate projects.
Summary of Findings
Traditional DCF methods are limited in their ability to accommodate market fluctuations and dynamic uncertainties, often resulting in rigid and static projections that fail to reflect the true value of a project. In contrast, the STO-based model utilizes blockchain technology and digital integration to provide flexibility, transparency, and enhanced liquidity.
The real options approach integrated into the STO-based model allows for dynamic project adjustments in response to real-time data and market conditions, enabling developers to optimize financial performance through strategic decisions such as deferral, expansion, or abandonment of investments.
The digital platform enhances transparency and stakeholder collaboration throughout the project lifecycle by integrating stakeholder interests and leveraging blockchain technology, which improves accountability, traceability, and investor confidence while reducing traditional financing risks.
The STO mechanism improves liquidity by facilitating asset tokenization and secondary market trading, while the digital management system streamlines financial structuring and enhances business stability, as evidenced by the Aspen Resort case where the real options framework and digital platform increased the project's Extended Net Present Value (ENPV) to $6.35 million.
In summary, the findings of this study demonstrate that STO-based financing, supported by a sophisticated digital integrated management system and real options, offers a superior framework for managing real estate projects. By moving beyond traditional conflicts and outdated practices among various stakeholders, the study highlights how the Figure 1: STO Refinancing Structure Model and Figure 2: Integrated Project Management System enhance liquidity and transparency through a structurally integrated digital financial model. This approach not only facilitates strategic and flexible decision-making but also ensures that real estate development remains financially viable and adaptable in a dynamic market environment.
Recommendations for Future Research
While this study presents a comprehensive framework for STO integration, there are several areas that warrant further investigation. Future research should focus on validating this model across different real estate markets and project types, assessing its scalability and applicability in varied economic contexts. Furthermore, the use of blockchain technology within this framework raises questions about regulatory compliance and the legal structures surrounding tokenized assets. These areas require deeper exploration to ensure that STO-based financing can be universally adopted.
To validate the findings of this study, it is essential to test STO-based project financing models across various economic contexts, such as emerging markets or regions with different regulatory landscapes. This would help determine whether the flexibility and liquidity benefits observed in this study are consistent and scalable under diverse conditions.
Additionally, the model's reliance on emerging technologies suggests the need for continuous technological refinement. Research should examine the potential of smart contracts and AI-driven risk management tools to further optimize the STO process, ensuring that both developers and investors benefit from enhanced financial security and predictive analytics.
Incorporating artificial intelligence (AI) and machine learning into STO platforms presents an opportunity to enhance the predictive capabilities of these models. AI-driven analytics could provide real-time market assessments, enabling investors and developers to make data-driven decisions with greater accuracy. By integrating AI-based risk analytics, STO models could dynamically adjust to evolving market conditions, optimizing investment timing and mitigating risks more effectively. Future studies should explore the development of AI algorithms tailored to analyze tokenized real estate assets, focusing on predictive modeling for market trends and risk management.
Limitations and Future Development
As the adoption of Security Token Offerings (STOs) in real estate continues to expand, regulatory challenges remain a critical barrier to their widespread implementation. The establishment of standardized and harmonized regulations across various jurisdictions is essential for promoting the global integration of STOs into real estate financing. Future research should focus on examining the impact of different regulatory frameworks on STO-based projects and developing strategies to achieve regulatory convergence. Effective collaboration among industry stakeholders, regulators, and policymakers will be vital in crafting a legal and regulatory environment that both safeguards investor interests and fosters innovation.
The integration of blockchain technology in STOs offers substantial opportunities for further research, particularly in the automation of key project financing processes through smart contracts, such as fund disbursement, revenue sharing, and compliance monitoring, which could enhance transaction efficiency, reduce administrative costs, and improve the transparency and reliability of financial operations, while blockchain’s potential to establish decentralized platforms connecting investors, developers, and other stakeholders could transform how real estate projects are financed and managed; additionally, incorporating digital construction technologies into the STO-based model, such as IoT sensors and blockchain-managed real-time data, allows for precise management of cost variability and project risks, providing highly accurate forecasts for material costs and construction schedules, thus increasing transparency for investors and enabling more informed financial decisions; this study forms the basis of an innovative financing model that improves accessibility, transparency, and flexibility in real estate development, and with continued academic exploration and technological advancements, the STO-real options model could become a key pillar of future real estate financing, offering a more resilient and adaptive alternative to traditional structures, while advocating for a structured approach to further investigate STO-based financing across various market conditions and regulatory environments, with a particular emphasis on how emerging technologies like artificial intelligence and smart contract automation can enhance financial modeling and decision-making in real estate development.
Final Thoughts
The integration of STO-based financing and real options models represents a transformative approach to real estate project finance. By enhancing flexibility, liquidity, and transparency, these models address the limitations of traditional DCF-based approaches and provide a more strategic and adaptive method for managing long-term real estate investments. As the real estate industry continues to evolve in response to digital transformation, the adoption of these innovative models is expected to become increasingly significant.
However, realizing the full potential of STOs requires overcoming regulatory and technical challenges. Through continued research and development, particularly in integrating advanced technologies like AI and blockchain, STO models can be further refined to optimize financial performance and risk management. The findings of this study provide a strong foundation for future research aimed at expanding the scope and applicability of STO-based project financing in a real successful project case, ensuring its role as a critical tool in modern real estate finance.
Data Availability Statement
The data sets, models, and source code supporting the conclusions of this article are available in the GitHub repository: https://github.com/gainorjk/SmartBioCity.git. These materials are open for public access to facilitate further research and development in this field. For additional information or specific requests, the corresponding author can be contacted directly.
References
- Anglin, P., Hossain, M., and Jones, K., 2022. Valuing wind farm investments using Monte Carlo simulation and security token offerings. Journal of Renewable Energy Finance, 34(2), pp.145-162. [CrossRef]
- Bennett, R., Miller, T., Pickering, M., and Kara, A.K., 2021. Hybrid approaches for smart contracts in land administration: Lessons from blockchain proofs-of-concept. Land, 10(2), p.220. [CrossRef]
- Brown, A., 2021. Blockchain and real estate: The role of smart contracts in financing structures. Journal of Financial Innovation, 15(2), pp.125-143.
- Copeland, T., and Antikarov, V., 2001. Real options: A practitioner’s guide.
- Cvijanović, D., 2014. The impact of property price fluctuations on financial risk in project finance structures. Journal of Real Estate Finance, 29(3), pp.145-162.
- Davis, H., and Clark, R., 2023. Refinancing real estate projects through security token offerings. Global Real Estate Review, 15(4), pp.299-313.
- Davis, M., and Thompson, P., 2021. The role of blockchain in enhancing real estate liquidity. Journal of Digital Finance, 4(1), pp.35-49.
- Devaney, S., and Stevenson, S., 2023. Multi-real option valuation of mixed-use developments: The impact of STO financing. International Journal of Real Estate Finance, 19(1), pp.78-94.
- Dentons, 2021. The tokenization of real estate: An introduction to fractional real estate investment. Dentons Real Estate.
- Elevated Returns, 2018. AspenCoin STO and real estate tokenization case study. Real Estate Insights.
- Geltner, D., and Mei, J., 2021. Applying real options and STOs in urban regeneration projects. Urban Economics Journal, 45(3), pp.215-238.
- Green, P., 2024. Allocation STOs: A new frontier in real estate investment. Journal of the International Society of Real Estate Management, 20(1), pp.87-99.
- Guthrie, G., 2013. Real options and real estate: When should developers exercise their options? Journal of Real Estate Finance and Economics, 47(2), pp.123-151.
- Hoesli, M., Morri, G., and Mazzucca, A., 2021. Real estate development valuation using multi-real options and STOs. Journal of Property Investment and Finance, 39(4), pp.213-232.
- Jones, M., and Thompson, R., 2023. Leveraging blockchain for NPL management. Journal of Financial Innovation, 18(3), pp.233-250.
- Jung, I.K., and Oh, S., 2023. Compound real option applications in infrastructure development: Ports and hubs. Journal of Infrastructure Finance, 28(2), pp.112-130.
- Kim, Y., and Park, J., 2023. Real estate investment through security token offerings. Journal of Financial Innovation, 19(2), pp.178-192.
- Lee, C., 2024. Tokenizing public land for urban development. Journal of Urban Economics, 22(1), pp.99-115.
- Saari, A., Vimpari, J., and Junnila, S., 2022. Blockchain in real estate: Recent developments and empirical applications. Land Use Policy, 121, 106334. [CrossRef]
- Sailor, M., and Harrison, R., 2021. Real estate development and STO market scenario. Real Estate Finance, 10(3), pp.67-78.
- Smith, T., and Watkins, R., 2023. Evaluating infrastructure projects with compound real options and STO financing. Infrastructure Finance Review, 29(2), pp.101-119.
- Trigeorgis, L., 1996. Real options: Managerial flexibility and strategy in resource allocation. Cambridge: MIT Press.
Figure 1.
STO Refinancing Structure Model Written by the Researcher.
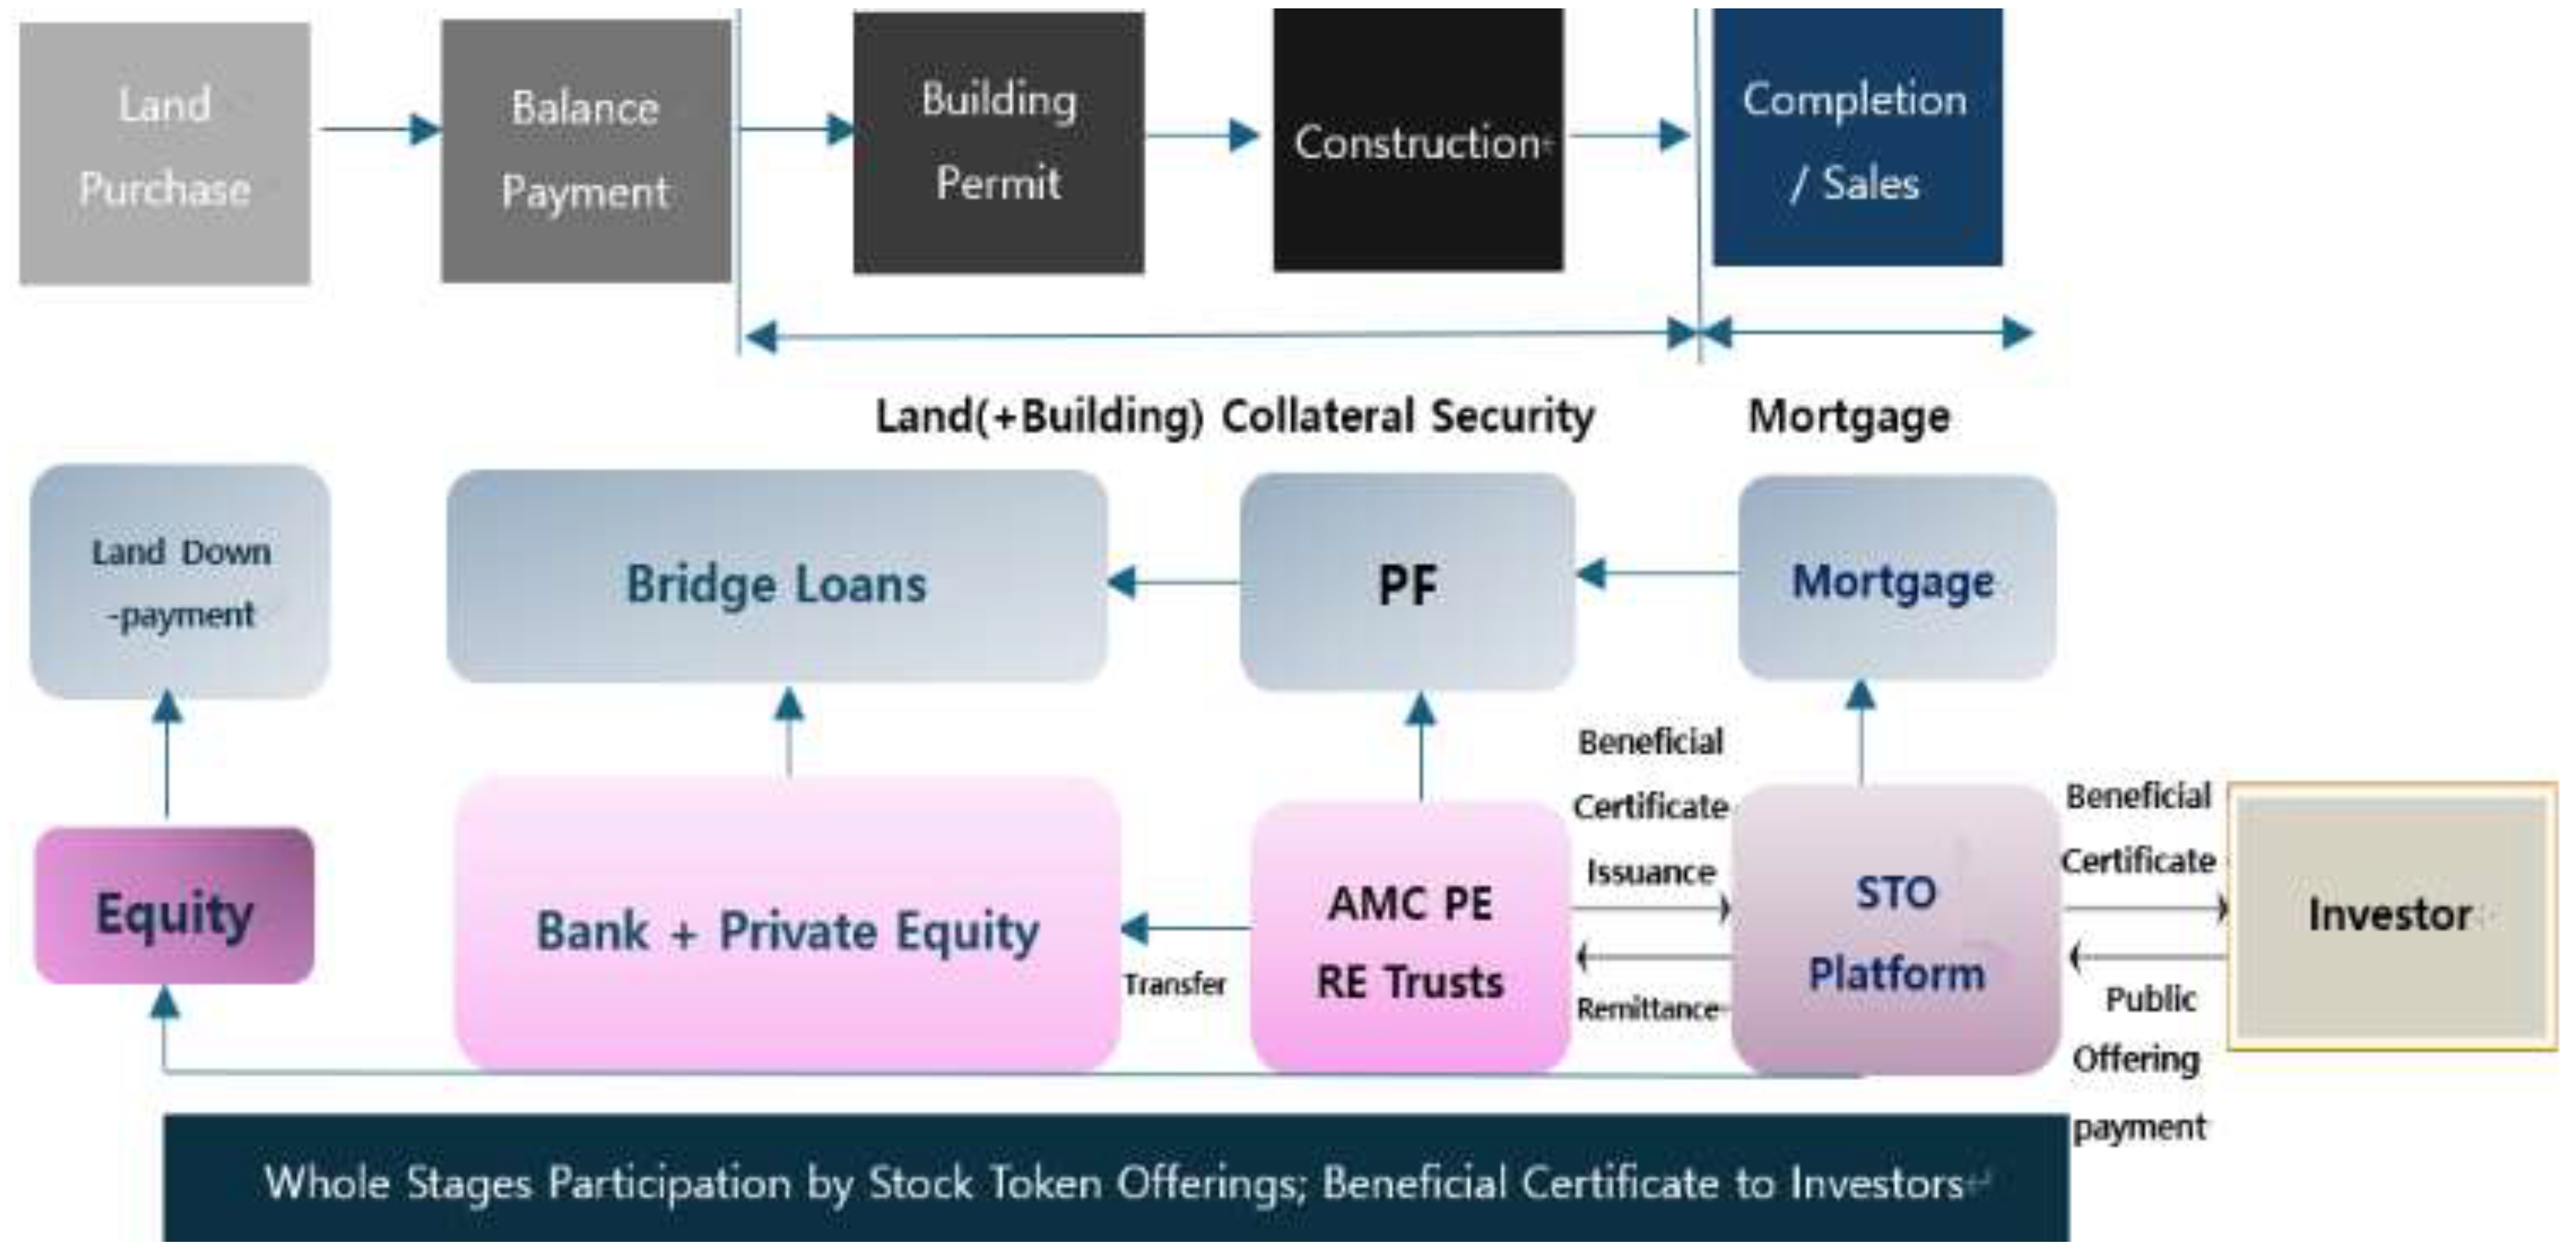
Figure 2.
Integrated project management system Revised by Researcher on prior research.
Figure 3.
Investment Scenario of real estate development.
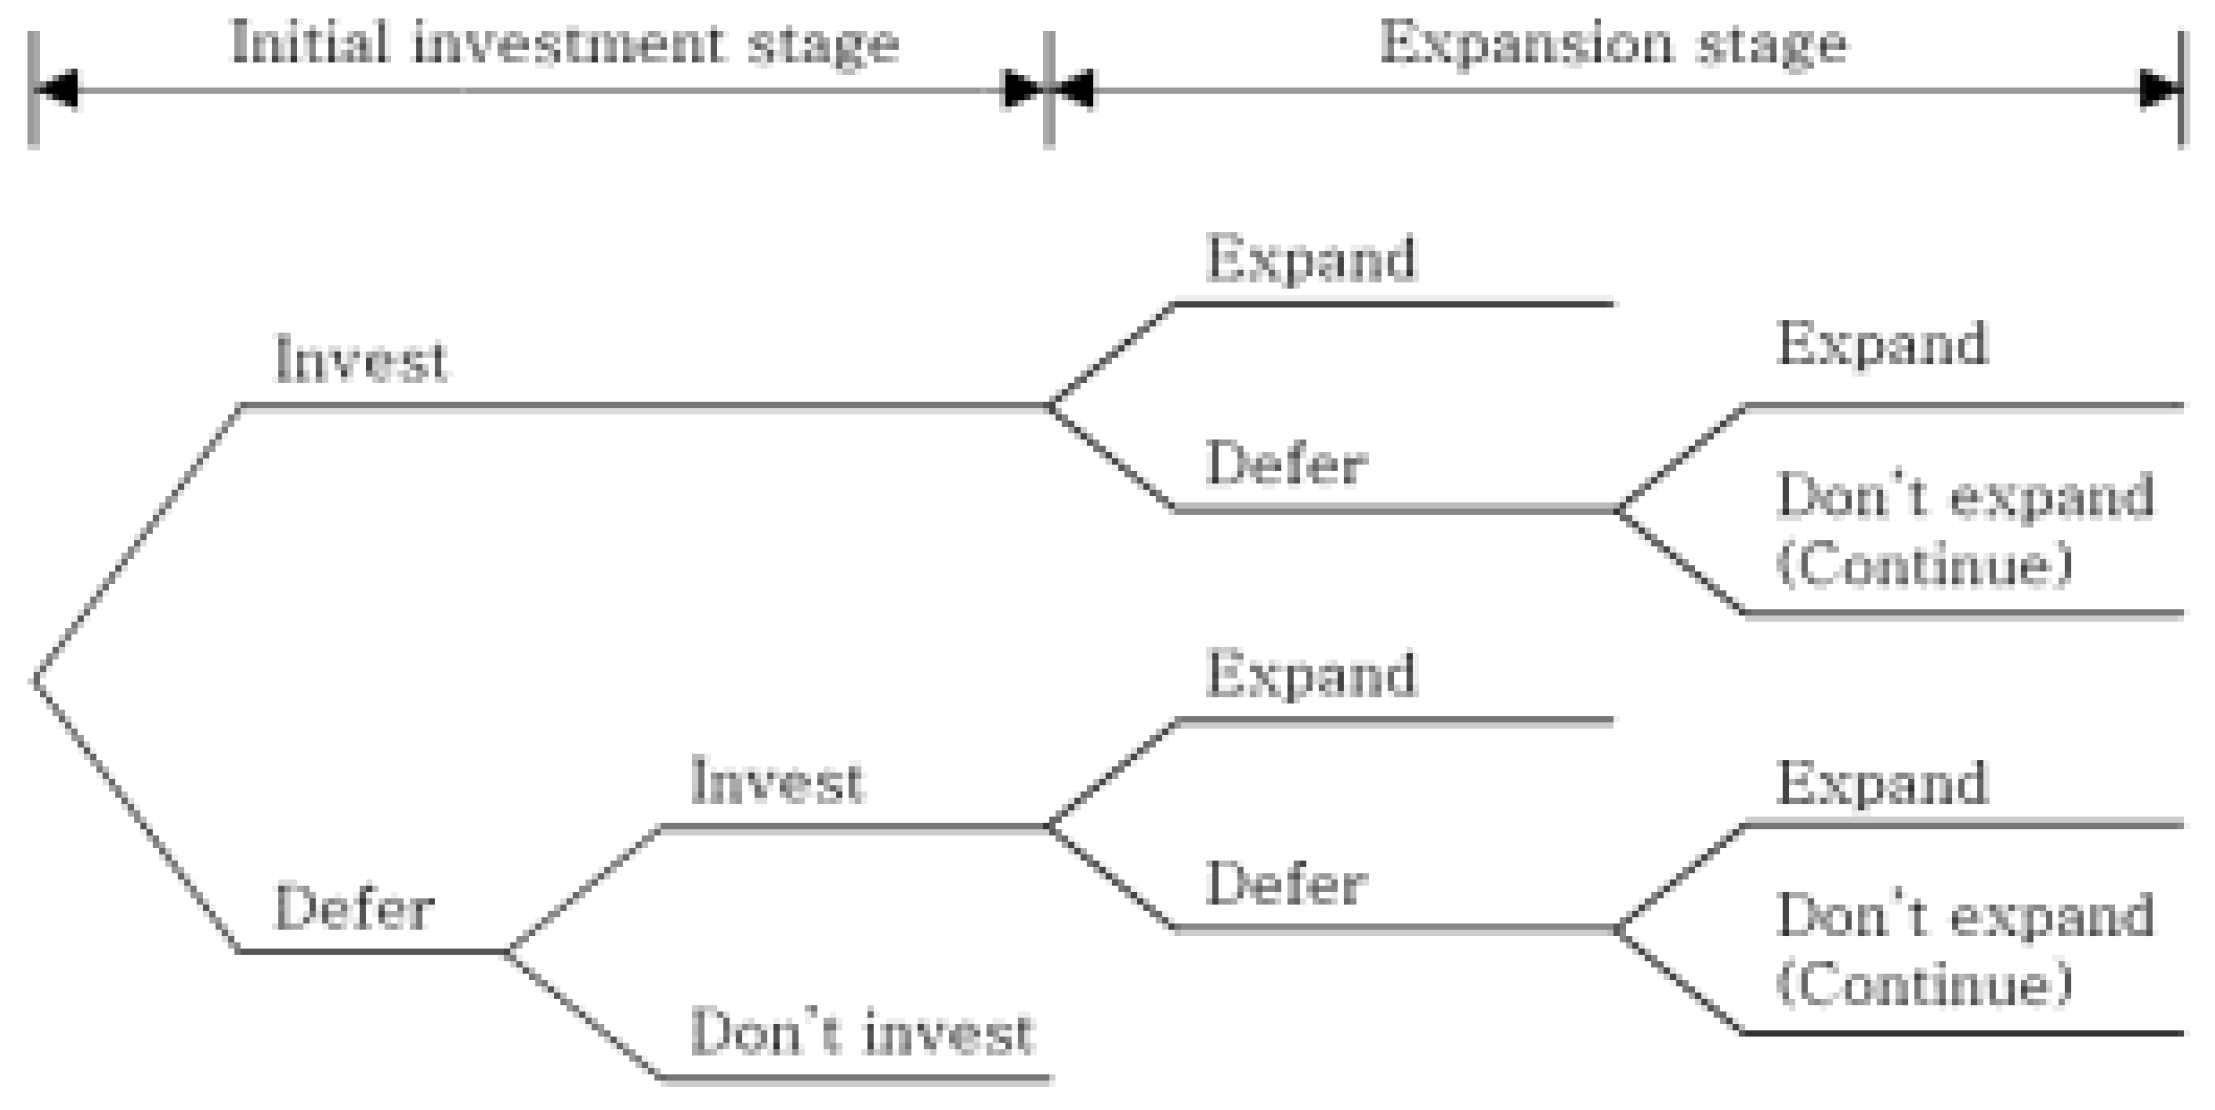
Table 4.
Binomial Lattice of Project Value on Total Investment (million USD).
| t=0 | t=1 | t=2 | t=3 | t=4 | t=5 |
|---|---|---|---|---|---|
| 22.57 | 25.00 | 27.69 | 30.67 | 33.95 | 37.55 |
| 20.37 | 22.57 | 25.00 | 27.69 | 30.67 | |
| 18.39 | 20.37 | 22.57 | 25.00 | ||
| 16.61 | 18.39 | 20.37 | |||
| 14.98 | 16.61 | ||||
| 13.50 |
Table 5.
Binomial Lattice of Project Value on Initial Investment (million USD).
| t=0 | t=1 | t=2 | t=3 | t=4 | t=5 |
|---|---|---|---|---|---|
| 10.00 | 11.08 | 12.27 | 13.58 | 15.01 | 16.57 |
| 9.03 | 10.00 | 11.08 | 12.27 | 13.58 | |
| 8.16 | 9.03 | 10.00 | 11.08 | ||
| 7.38 | 8.16 | 9.03 | |||
| 6.67 | 7.38 | ||||
| 6.03 |
Table 7.
Binomial Lattice of Deferral/Composite Option Valuation (Primary Option, million USD).
| t=0 | t=1 | t=2 | t=3 | t=4 | t=5 |
|---|---|---|---|---|---|
| 10.00 | 11.08 | - | - | - | - |
| 9.03 | - | - | - | - | |
| - | - | - | - | ||
| - | - | - | - | ||
| - | - | - | - | ||
| - | - | - | - |
Table 8.
Integrated Binomial Lattice of Option Valuation (million USD).
| t=0 | t=1 | t=2 | t=3 | t=4 | t=5 |
|---|---|---|---|---|---|
| 10.00 | 11.08 | 15.43 | 17.08 | 18.88 | 20.85 |
| 9.03 | 12.57 | 13.93 | 15.43 | 17.08 | |
| 10.25 | 11.35 | 12.57 | 13.93 | ||
| 9.25 | 10.25 | 11.35 | |||
| 8.35 | 9.25 | ||||
| 7.54 |
| 1 | Dragana Cvijanović (2014) highlights that valuing real estate as collateral in PF structures may inflate financial risk due to rising property prices and debt ratios. Matthew Smith (2023) finds that projects with higher equity ratios offer greater long-term success and investor stability. To address these issues, more flexible financing methods like STOs are recommended.. |
| 2 | Despite successfully raising $18 million, the Aspen Coin project struggled to scale and maintain liquidity in the secondary market due to regulatory complexity. Aspen Coin highlights the potential of STOs to revolutionize real estate finance by improving liquidity and enabling global investor participation, while also highlighting the hurdles associated with regulatory compliance and consistent market liquidity. |
| 3 | Property Appraisal Value: $224 million for 179 units, Mortgage: $130 million, Equity: $94 million, NOI: $13.2 million assumes a present value of $10 million for the initial investment in a conservative way. |
Disclaimer/Publisher’s Note: The statements, opinions and data contained in all publications are solely those of the individual author(s) and contributor(s) and not of MDPI and/or the editor(s). MDPI and/or the editor(s) disclaim responsibility for any injury to people or property resulting from any ideas, methods, instructions or products referred to in the content. |
© 2024 by the authors. Licensee MDPI, Basel, Switzerland. This article is an open access article distributed under the terms and conditions of the Creative Commons Attribution (CC BY) license (http://creativecommons.org/licenses/by/4.0/).
Copyright: This open access article is published under a Creative Commons CC BY 4.0 license, which permit the free download, distribution, and reuse, provided that the author and preprint are cited in any reuse.


