
Submitted:
28 October 2024
Posted:
28 October 2024
You are already at the latest version
Abstract
Urban biodiversity is crucial for ecological security, balance, and fostering residents' awareness of human-nature interconnectedness. Birds, as urban ecosystem indicators, reflect ecosystem services and are impacted by urban development. This study examined the distribution characteristics and environmental influences on representative bird species from typical ecological groups in Beijing, analyzing critical habitat locations and forecasting potential ecological corridors in light of urban planning. Distribution of six representative ecological groups of birds (song birds, terrestrial birds, climbing birds, aquatic birds, wading birds, raptor birds) in 2019 were constructed using kernel density analysis. The predicted potential distribution and contribution of environmental impact factors for six bird species (Falco tinnunculus, Ardea alba, Aix galericulata, Dendrocopos canicapillus, Streptopelia chinensis, Turdus mandarinus) were obtained using MaxEnt model. The potential ecological corridors were constructed by least-cost distance model. The results showed that: (1) Distribution density of bird groups was higher near water bodies and parks due to existing urban planning; (2) Blue-green corridors, including greenways and waterways, enhanced urban bird diversity; (3) Potential ecological corridors for six representative bird species primarily featured forested areas, with varied habitat type proportions tailored to each species' needs. Recommendations propose enhancing green-space connectivity and multi-habitat restoration for key species. This study underscores the need for refined urban planning strategies emphasizing diverse habitats and migration pathways, aiming to create sustainable living areas and ecological corridors. It also encourages utilizing platforms for birdwatching and public biological observation data to optimize urban biodiversity.
Keywords:
urban biodiversity
; bird distribution
; ecological corridors
; environmental impact
1. Introduction
In March 2022, following COP15 in October 2021, Beijing introduced its vision of becoming a “capital of biodiversity.” Biodiversity protection is now integrated across all facets of the city’s urban planning. The recently approved “Beijing Urban Master Plan (2016–2035)” (hereafter "Master Plan") emphasizes "protecting and restoring natural ecosystems and maintaining biodiversity." A key goal is developing urban ecological corridors to address Beijing’s uneven distribution of green spaces, facilitating wildlife movement and connecting fragmented habitats. This approach aims to conserve species within corridors and enhance genetic flow between populations.
In contrast to the more developed studies conducted in North America and Europe, research on urban biodiversity in China tends to be relatively static and pays less attention to the ecological processes of the organisms themselves, despite strong policy support for advancing urban biodiversity conservation efforts. Furthermore, there is a dearth of long-term, medium-scale research and practice [1,2]. Using urban birds as an example, several research have been carried out by domestic experts on these birds, which serve as vital indicators of urban biodiversity. Unfortunately, the majority of these studies have gathered bird data using time-limited, structured survey techniques such point or line counts [3,4]. As a result, it is challenging to gain dynamic data to support the implementation of pertinent planning and policies.Thanks to technological advancements, the development and application of remote sensing technology and data-sharing platforms in biodiversity over the past decade [5,6] have enabled the public to collect and manage bird data through mobile platforms such as smartphones [7]. Additionally, international research on bird distribution has reached certain results through citizen science [5,8], dependability of public observation data in assisting urban ecological planning research. Considering the current situation in China where certain achievements have been made in the application of public data, yet issues such as the lack of prominent application effectiveness still exist, utilizing and promoting existing data-sharing platforms for urban bird research to construct key species ecological corridor networks would optimize urban biodiversity conservation planning and urban green space system planning.
This study selected China's most comprehensive and complete citizen bird database to collect bird watching reports within the Beijing area, with the goal of observing data to study the distribution of biodiversity. The selection was based on the background of international hot spots and the current state of domestic research, combined with the existing implementation results of the "Overall Plan," and taking into consideration the potential of citizen science in biodiversity research. The article aimed to 1) ascertain the critical habitats and distribution density of six representative species of birds; 2) research the dynamic behaviours of birds and investigate the connection between environmental conditions and bird diversity dispersion; 3) identify prospective ecological corridors and ecological sources. Through the use of public data, this research helps to advance long-term, systematic studies of urban birds, supporting the development of urban design and architecture that promotes peaceful cohabitation between people and the natural world. It also offers guidance for upcoming land-spatial planning and urban biodiversity planning initiatives.
2. Materials and Methods
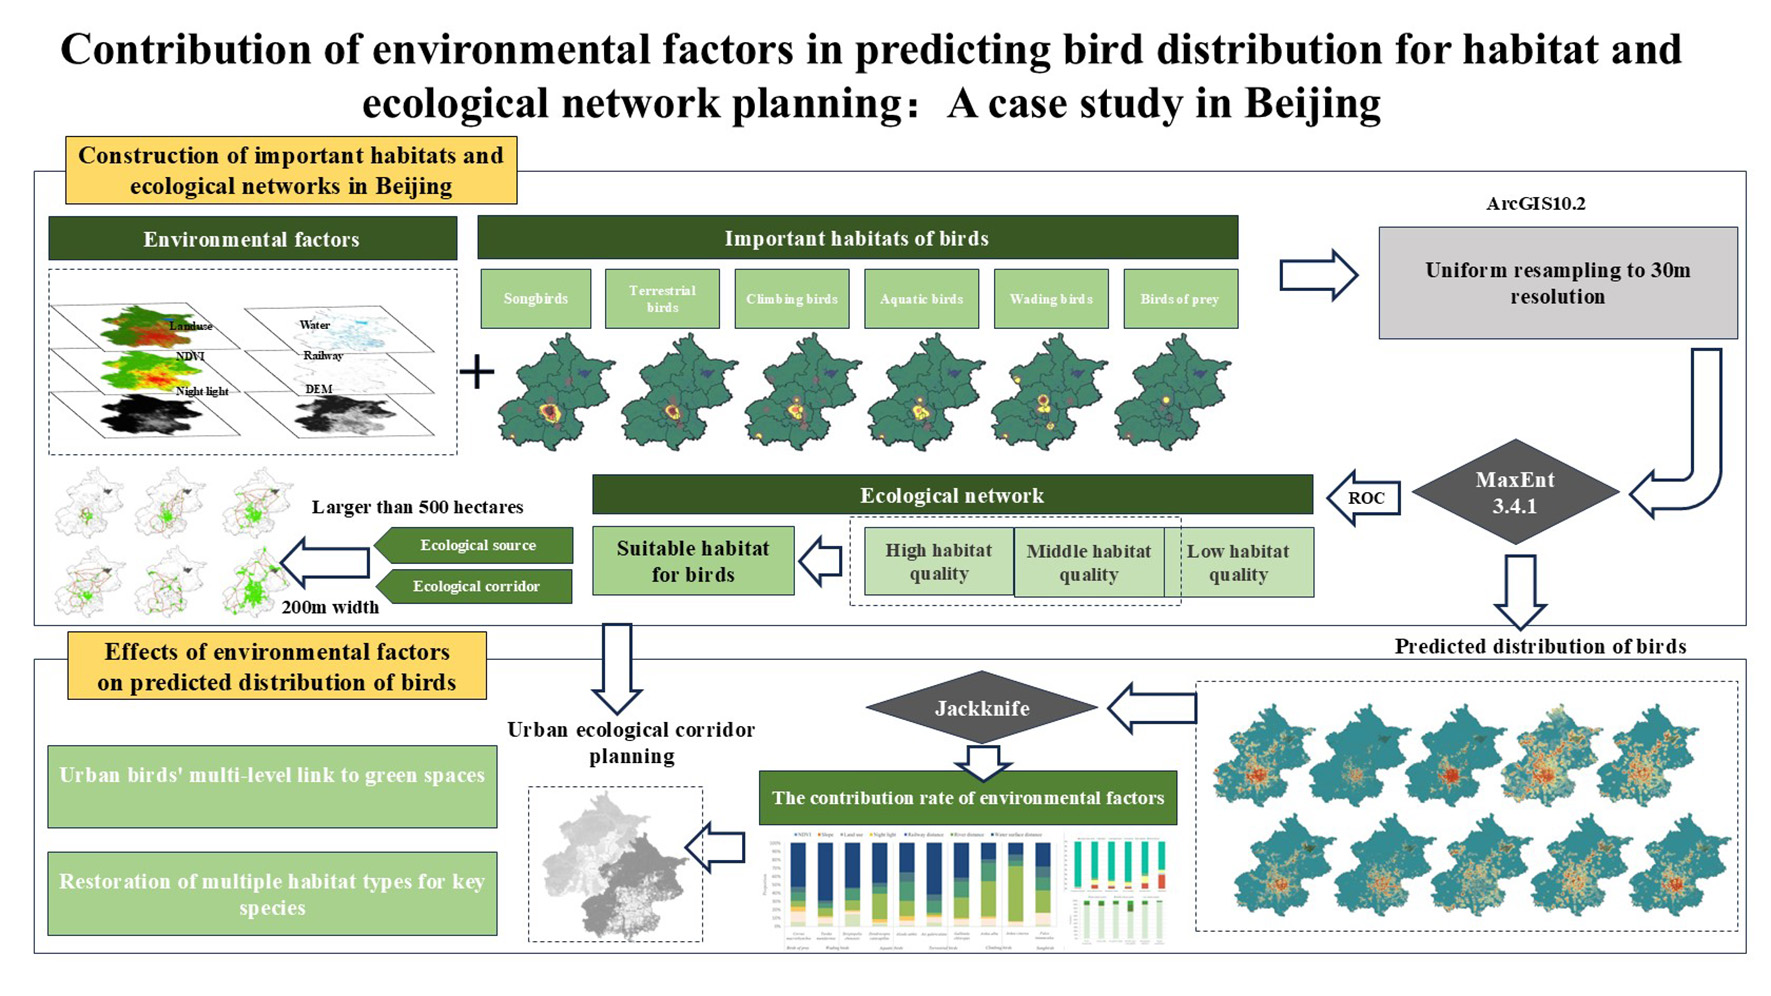
The study area's bird distribution was predicted using the MaxEnt software, which was based on the maximum entropy model in ecological niche modelling. Every theory or technique for locating corridors has pros and cons based on relevant study on corridors [12,13]. Thus, the relevance of combining multiple tools made up the main emphasis of this study [14]. The resistance model, which contended that species must overcome various degrees of resistance in order to move through various landscape features, was the primary model. The idea of a "minimum resistance corridor" connecting ecosystems arised naturally from the idea that the path with the least amount of accumulated resistance is the optimal corridor or best pathway. The key technologies were as follows: (Figure 1)
2.1. Study Area
The research area covers Beijing's metropolitan region, including plains and hilly terrain with diverse land types such as grasslands, shrublands, arable land, wetlands, forests, and developed areas in both urban and rural zones(Figure 2). Over the past 20 years, urbanization has increased substantially [9], with major land-use changes including the conversion of suburban farmland to construction land, wetlands to farmland and construction land, and a rapid expansion of built areas. This has fragmented Beijing's landscape, although forest area has notably grown, with forest patches now frequently interspersed among urban developments. According to the “2020 Statistical Bulletin on Beijing’s National Economic and Social Development”, the city’s forest coverage reached 44.4%, covering 62.5% of residents and offering significant potential for urban biodiversity habitats and corridors.
2.2. Data Sources
The USGS (United States Geological Survey) open data website (https://glovis.usgs.gov/app) provided the remote sensing image data for Beijing. The data was processed to create raster data for land use types and has a 30m picture resolution. The OpenStreetMap public mapping website (https://www.openstreetmap.org/) provided the vector data for the Beijing water systems, railways, and water bodies. The data on DEM and normalised vegetation index (NDVI) were sourced from the Geospatial Data Cloud website (http://www.gscloud.cn/). The official Luojia-1 website (http://59.175.109.173:8888/index.html) was the source of the data on nighttime light. The coordinates of the bird observation points on the China Bird Watching Record Centre platform (http://www.birdreport.cn/) were the source of the bird point data. The information recorded on the website include, among other things, the number of observations, the species of birds observed, the latitude and longitude of the observation point, and the observation time for each record point. The data was input into the database after being examined by the platform's computer system and manually verified for accuracy (Table 1).
2.3. Selection of Research Subjects
Between 2015 and 2020, there was a significant increase in the number of birds (Figure 3). The year 2019 had the biggest shift of all, with a sharp rise in bird habitats. Concurrently, the first stage of the "Beijing Urban Master Plan," which was authorised and put into effect in 2017, was expected to be finished by 2020. The best available public bird data from 2019 was selected as the source data for processing in light of the aforementioned considerations.
The common birds of Beijing could be categorised into six main groups according to their ecological habits: songbirds, terrestrial birds, climbing birds, aquatic birds, wading birds and raptor birds. Additionally, if more than 100 submissions were available, a preliminary screening based on the type of bird residency would be conducted, and the birds would be classified as either resident or migratory in Beijing (A flexible selection process would be used because the data available for some bird species was restricted and did not meet the criteria of over 100 entries. We skipped the data amount requirement and go on to the next flow channel if the quantity criteria was not met and there were no appropriate representative birds). The preliminary screening results were in accordance with the "Beijing Terrestrial Wild Animal List (2023)" and the "List of Terrestrial Wild Animals that were Beneficial or Have Important Economic and Scientific Research Value and are Nationally Protected." Chose representative species of birds from each category for study, taking into account factors such as protection status, scientific or commercial significance, and body size that represented variations in the habits of different bird species(Table 2) [10,11].
2.4. Data Analysis Methods
2.4.1. Evaluation Methods and Distribution Characteristics of Birds
Examined the distribution characteristics of birds based on the distribution patterns of six representative ecological groups of birds in 2019. In this study, we processed the latitude and longitude information of the locations using the ArcGIS kernel density analysis tool.
2.4.2. Prediction of Potential Bird Distribution
The maximal entropy method (MaxEnt) is widely employed in the niche model [15]. Its can reliably estimate species distribution with just data on species existence and environmental factors. This is important in circumstances where field observations are difficult or when the research region is too big, allowing for the prediction of species distribution and the mapping of habitat suitability using various current data(such as museum data, citizen science data, etc.). One of the better niche modelling programs available, it can also use the Jackknife method that is included with the model to determine the contribution rates of different environmental elements. The formula is as follows:
According to the bird species' habit characteristics, environmental data included DEM, distance to water bodies, distance to rivers, distance to railways, NDVI, land use, and night lights index. The data was processed in ArcGIS 10.2, uniformly resampled to a resolution of 30 meters, then loaded into MaxEnt 3.4.1 together with representative bird species point data chosen from the six main bird ecological groups. This produced predicted bird distributions and ROC curves.
2.4.3. Contributions of Environmental Impact Factors
Obtained the importance of various environmental factors on representative bird species based on Jackknife test model. A factor's contribution to the overall result was measured in the Jackknife test model, which quantified the contribution rate of the major environmental elements in the statistical habitat to the projected distribution results. A larger contribution rate suggested that the factor had a greater bearing on the distribution prediction of that particular species of bird. The NDVI vegetation index, land use types, elevation, distance to rivers, distance to water bodies distance to railroads, and night lights index were among the chosen environmental parameters. Grassland, shrubland, arable land, wetlands, forest land, and urban-rural building land are among the several land use types.
2.4.4. Construction of Potential Ecological Corridors for Various Bird Species
Constructed potential ecological corridors for various bird species through the least-cost distance model. The MaxEnt prediction distribution results and ROC curve were used to determine the best threshold for converting the anticipated probability values into particular appropriateness classes. ArcGIS 10.2 reclassified the raster data based on the threshold that has been chosen, classifying the quality of the habitat for birds into three categories: "low habitat quality," " middle habitat quality," and " high habitat quality." Considering that overly fragmented habitat patches are not conducive to corridor design, habitat patches larger than 500 hectares with reasonable distribution locations were extracted using spatial analysis tools as ecological sources for bird species. Using the Linkage Mapper corridor simulation software based on the minimum cost distance model. The ultimate goal of Linkage Mapper in optimizing paths is to minimize the following objective function. The formula is as follows:
Selecting the Linkage Pathways Tool, we considered both bird conservation and urban planning. We chose a corridor width parameter of 200 meters that can support ecological functions such as promoting bird diversity, reducing edge effects, encompassing diverse habitats, and protecting bird populations [16–18]. To create potential ecological corridors for different bird species, set the right criteria.
3. Results
3.1. Security Pattern of Bird Species Conservation
3.1.1. Potential Distribution of Representative Bird Species in an Ecological Network
The distribution pattern of the diversity density in Beijing in 2019 of six representative species of bird ecological groups (Figure 4) demonstrated that songbirds had the broadest distribution range and a high density in the core urban area of Beijing. Raptors had a rather dispersed distribution pattern, with their distribution center being the area surrounding Shahe Reservoir. Using data from 2019, distribution prediction for representative species of six bird groups was carried out using the MaxEnt model. It was evident from the projected distribution map (Figure 5) that the representative birds were mostly found in Beijing's center metropolitan area, especially in areas with water environments. Selected a representative bird from each ecological group and used ArcGIS and Linkage Mapper corridor simulation software to derive its ecological source and potential ecological corridors (Figure 6). Six representative bird ecological source sites were distributed in a way that demonstrated the following common traits: they were concentrated most heavily in urban built-up areas and radiate outward from this central location to nearby reservoirs and rivers. Ardea alba had a scattered ecological source distribution and a strong reliance on water, while the Falco tinnunculus had the widest distribution area and the strongest connectivity of its ecological sources. It can be found in highly urbanised areas as well as in river, lake, and forest environments. The Turdus mandarinus had the smallest ecological source distribution range among them. It was closely associated with urban construction areas. An examination of the possible places for ecological corridors showed that there was little contact with urban highways and some overlap with Beijing's water systems. The majority of the bird-representative prospective ecological corridors pass through picturesque places found in Beijing's shallow mountainous regions, as well as ecological wetlands mostly centred on the water systems of the Yongding, Chaobai, and Beiyun rivers.
3.1.2. Features of the Possible Species Composition of the Ecological Network Embodied by Birds
The areas inhabited by the best suitable regions for the six representative bird species were all less than 10% when the proportion of acceptable habitat area for different bird species was compared (Figure 7). The ecological corridors' buffer zone analysis (Figure 8) showed that the Turdus mandarinus 's potential corridor was the lowest and is focused in urban growth areas, while the Aix galericulata 's potential corridor area could span up to 300 km². An analysis of the composition of potential corridor land use types (Figure 9) showed that forest land was the primary component of the potential ecological corridors for six bird species. In the ecological corridor of the Falco tinnunculus, forest land accounts for 95%, while in the potential ecological corridor of the Turdus mandarinus, the proportion of built-up land is relatively high at 29.4%, the proportion of farmed land in the Streptopelia chinensis 's corridor composition is 13.7%.
3.2. Investigation of the Factors Affecting the Distribution of Bird Species
To further study the preferences and needs of representative birds regarding the environment of migration corridors, the analysis showed (Figure 10) that among the seven selected factors, the environmental factor that contributed the most to the distribution of wading birds, aquatic birds, climbing birds, and raptors was the distance to water bodies. The environmental factor with the highest contribution rate among terrestrial birds and songbirds was the nighttime light index. Wading birds were most affected by the distance to bodies of water; they were less affected by the night light index. The majority of wading birds were fairly large in size and were adapted to live and rest in marshes, along water edges, in shallow water, or on coasts. The Ardea alba and the Ardea cinerea were the two main subjects of this research. Since most songbird species were small birds that can adapt to a wide range of ecological situations and thrive in settings influenced by humans, night light intensity played a key role in predicting the distribution of songbirds. While the altitude factor's contribution rate was normally low, it was higher for the Falco tinnunculus, which was primarily found in the forested mountainous regions northwest of Beijing.
4. Discussion
The ecological sources of the six representative birds partially overlap with the urban park ring and wildness park ring in the city area's green space structure plan, and their potential ecological corridors essentially pass through the ecological control zones in the city area's two-lane-three-area plan as well as the more connected and restricted construction zones around the centralised construction area, according to a comparison and analysis of the study's results with the ecological spatial network in the Beijing Urban Overall Plan (2016–2035)( Figure 11). The ecological control zones in the city's two lines and three districts plan, as well as the more interconnected restricted construction zones surrounding the centralised construction zones, were essentially traversed by the potential ecological corridors. Additionally, a portion of the corridors was situated within the wedge-shaped green corridors in the city's green space structure plan. The municipal greenway system in the central urban area overlaps with the potential ecological corridors of Streptopelia chinensis, Aix galericulata, Turdus mandarinus, and Ardea alba. Additionally, the study's results on bird distribution showed a weak correlation with the urban green space in the overall plan. Nevertheless, there was little evidence linking the two, therefore more work needed to be done when designing ecological corridors in urban areas. Simultaneously, practical planning should take into account the spatial synergies and trade-offs of potential ecological corridors of various bird species. Nevertheless, this study's findings demonstrated that, on a larger scale in the urban area, the potential ecological corridors of various bird species were essentially non-linear and did not accurately reflect the spatial trade-offs and synergistic relationships between various ecological corridors of various bird species, as well as the synergistic relationships of their mutual benefits. More comprehensive research at smaller sizes was required for scientific discourse. Based on these two ideas, and using the findings of previous research and analysis, the paper will provide methods to enhance the design of urban ecological corridors from the perspectives of the green space system and habitat types.
4.1. Urban Birds' Multi-Level Link to Green Spaces
The research finds that representative bird species typically inhabit areas near green spaces and water bodies, with bird distribution strongly associated with urban vegetation patches and aquatic areas [19,20]. Human activity, such as reduced mobility during the pandemic, has impacted bird habitat and migration, leading to more widespread distribution [21,22]. Birds also utilize highly urbanized zones as resource areas [23,24]. To sustain urban bird diversity, expanding habitat patches and developing corridor networks is essential to enhance urban habitat connectivity [25]. In Beijing, where landscape fragmentation is significant, spatial planning must strengthen green area connectivity across planning levels—general, detailed, and special—to support urban bird diversity and corridor development [26,27]. Large corridors within green spaces are recommended at the macro level, utilizing waterways and main roads for connectivity. Detailed planning should ensure linear greenbelt landscapes that boost environmental quality and ecological services, with corridor widths tailored to species needs: 30-60 meters for small fauna and at least 100 meters for bird protection [28]. At the specialized planning level, urban biodiversity conservation programs prioritize green spaces as primary habitat carriers and grey spaces as supplementary, emphasizing multi-species habitat compatibility [29]. Future conservation efforts should reinforce green structure, increase public engagement in data collection, and enhance green area connectivity to support bird habitat restoration.
4.2. Restoration of Multiple Habitat Types for Key Species
The study also finds overlap between bird distribution and urban green spaces in the "Master Plan." Birds prefer wooded areas with high vegetation cover, low migration resistance, and ample resources, aligning with typical bird ecological behaviors [30]. However, monoculture forests can reduce biodiversity, so diverse land types are essential in bird corridor planning [31]. Research also shows that species like Turdus mandarinus and Streptopelia chinensis may utilize arable and construction lands within migration corridors due to specific habitat needs [32]. Focusing only on green space structure in urban planning without considering habitat types and specific bird species needs may limit urban bird diversity. The reduction of habitats like grasslands, wetlands, and arable land during corridor construction risks decreasing dependent species. To enhance urban biodiversity, green spaces should include varied habitats and target specific species in corridor design [33].
5. Conclusion
This study used the MaxEnt model to predict bird distribution and analyze environmental impact factors, identifying important habitats for six representative ecological groups in Beijing. The suitability of bird habitats was categorized using ROC curves, and potential ecological corridors for various species were constructed with the least-cost distance model. The findings highlight that green space system planning within the “Overall Plan” has positively influenced bird habitat connectivity and diversity, underscoring the importance of multi-level green space connectivity and multi-type habitat restoration for key species. Integrating public observation data offers an effective method to map urban bird habitats and corridors, providing critical insights for urban biodiversity conservation in spatial planning. Further, prioritizing biodiversity in spatial planning under ecological civilization principles can guide habitat restoration across diverse landscapes, supporting sustainable urban-rural development [34]. This approach demonstrates the feasibility of using public data and spatiotemporal big data for dynamic management of urban biodiversity conservation.
Author Contributions
Conceptualization, P. H.; methodology, L. T., R. H. and Z. H.; software, L. T., R. H. and Z. H.; validation, P. H. and Y. W.; data curation, Z. H.; writing—original draft preparation, L. T., R. H. and Z. H.; writing—review and editing, L. T. and P. H. visualization, L. T., R. H. and Z. H.; funding acquisition, P. H.
Funding
This research was funded by the National Key R&D Program of China (grant number 2023YFF1304600) and the National Natural Science Foundation of China (grant number ).
Data Availability Statement
The original contributions presented in the study are included in the article; further inquiries can be directed to the corresponding author.
Acknowledgments
Thanks to Professor Dong Jingjing from the School of Landscape Architecture, Beijing Forestry University and Zhang Mengyuan, the postdoctor of School of Sciences for the Human Habitat, University of Chinese Academy of Sciences ,for their guidance and assistance during the writing of this article.
Conflicts of Interest
The authors declare no conflicts of interest.
References
- Fidino, M. , & Magle, S. B. Trends in Long-Term Urban Bird Research. In: Murgui, E., Hedblom, M. (eds) Ecology and Conservation of Birds in Urban Environments. Springer, Cham, 2017, pp.161–184. [CrossRef]
- Heymans, A. , Breadsell, J., Morrison, G. M., Byrne, J. J., & Eon, C. Ecological Urban Planning and Design: A Systematic Literature Review. Sustainability, 2019, 11, 3723. [Google Scholar] [CrossRef]
- Zhang, Z. , & Huang G. Urban ornithological research in China:A review. Acta Ecologica Sinica, 2018, 38, 3357–3367. [Google Scholar] [CrossRef]
- Guo, S. , Zhaiteng X., Xiayuan Y., & Cao Y. The Mechanism of Urban Built Environment lmpact on Avian Diversity—— A Systematic Review. Chinese Landscape Architecture, 2022, 38, 71–76. [Google Scholar] [CrossRef]
- Kullenberg, C. , & Kasperowski, D. What Is Citizen Science? - A Scientometric Meta-Analysis. PLoS ONE, 2016, 11, e0147152. [Google Scholar] [CrossRef]
- Morneau, D. Citizen science in environmental and ecological sciences. NATURE REVIEWS METHODS PRIMERS, 2022, 2, 65. [Google Scholar] [CrossRef]
- Cao, L. , Meng F., & Zhao Q. Understanding Effects of Large-scale Development on Bird Migration andHabitats Through Cutting Edge Avian Monitoring Techniques. Bulletin of Chinese Academy of Sciences, 2021, 36, 436–447. [Google Scholar] [CrossRef]
- Pocock, M. J. O. , Chandler, M., Bonney, R., Thornhill, I., Albin, A., August, T., Bachman, S., Brown, P. M. J., Fernandes Cunha, D. G., Grez, A., Jackson, C., Peters, M., Rabarijaon, N. R., Roy, H. E., Zaviezo, T., & Danielsen, F. A Vision for Global Biodiversity Monitoring With Citizen Science. D. A. Bohan, A. J. Dumbrell, G. Woodward, & M. Jackson (Eds.). NEXT GENERATION BIOMONITORING, (Vol. 59, pp. 169–223). Elsevier Academic Press Inc. [CrossRef]
- Fu, G. , & Xiao N. Spatial-temporal changes of landscape fragmentation patterns in Beijing inthe last two decades. Acta Ecologica Sinica, 2016, 37, 2551–2562. [Google Scholar] [CrossRef]
- Zhen, G. A Checklist on the Classification and Distribution of the Birds of China (Third Edition). (2017) [2024-10-04]. https://book.sciencereading.cn/shop/book/Booksimple/show.do?id=B6048DA04D84BA118E053020B0A0A108E000.
- Cai, Q. Beijing Bird Records. (1988) [2024-10-04]. https://www.zhangqiaokeyan.com/book-cn/081504020113.html.
- Grafius, D. R. , Corstanje, R., Siriwardena, G. M., Plummer, K. E., & Harris, J. A. A bird’s eye view: using circuit theory to study urban landscape connectivity for birds. LANDSCAPE ECOLOGY, 2017, 32, 1771–1787. [Google Scholar] [CrossRef]
- Li, H. , Li L., Wu G., Zhou Y., Li W., & Mei Z. Analysis of the landscape-level connectivity of the Yunnan snub-nosed monkey habitat based on circuit theory. Acta Ecologica Sinica 2018, 38, 2221–2228. [Google Scholar] [CrossRef]
- Elsa Nordén. Comparison between three landscape analysis tools to aid conservation efforts. 2016 [2024-10-04]. 49 http://www.semanticscholar.org/paper/91929c759352b22f189296e0c55c16a877726ea3.
- Phillips, S. J. , Anderson, R. P., & Schapire, R. E. Maximum entropy modeling of species geographic distributions. ECOLOGICAL MODELLING, 2006, 190, 231–259. [Google Scholar] [CrossRef]
- Li, Y.-Y. , Zhang, Y.-Z., Jiang, Z.-Y., Guo, C.-X., Zhao, M.-Y., Yang, Z.-G., Guo, M.-Y., Wu, B.-Y., & Chen, Q.-L. Integrating morphological spatial pattern analysis and the minimal cumulative resistance model to optimize urban ecological networks: a case study in Shenzhen City, China. ECOLOGICAL PROCESSES, 2021, 10, 63. [Google Scholar] [CrossRef]
- Lin, G. , Yang, Z., Xu, L., Zhang, F., & Yang, R. Urban ecological network construction in Loess Plateau regions in China-case study of Huanxian city. ALEXANDRIA ENGINEERING JOURNAL, 2023, 74, 153–169. [Google Scholar] [CrossRef]
- Shen, Z. , Wu, W., Chen, M., Tian, S., & Wang, J. Linking Greenspace Ecological Networks Optimization into Urban Expansion Planning: Insights from China’s Total Built Land Control Policy. LAND, 2021, 10, 1046. [Google Scholar] [CrossRef]
- Sultana, M. , Mueller, M., Meyer, M., & Storch, I. Neighboring Green Network and Landscape Metrics Explain Biodiversity within Small Urban Green Areas-A Case Study on Birds. SUSTAINABILITY, 2022, 14, 6394. [Google Scholar] [CrossRef]
- Winarni, N. L. , Fuad, H. A. H., Anugra, B. G., Kaunain, N. N., Anisafitri, S., Atria, M., & Putrika, A. Potential Ecological Distributions of Urban Adapters and Urban Exploiters for the Sustainability of the Urban Bird Network. ISPRS INTERNATIONAL JOURNAL OF GEO-INFORMATION, 2022, 11, 474. [Google Scholar] [CrossRef]
- Schrimpf, M. B. , Des Brisay, P. G., Johnston, A., Smith, A. C., Sanchez-Jasso, J., Robinson, B. G., Warrington, M. H., Mahony, N. A., Horn, A. G., Strimas-Mackey, M., Fahrig, L., & Koper, N. Reduced human activity during COVID-19 alters avian land use across North America. SCIENCE ADVANCES, 2021, 7, eabf5073. [Google Scholar] [CrossRef]
- Xu, H. , Zhao, X., Jia, R., Chen, L., Yang, Z., & Zhang, G. Behavioral plasticity mediates adaptation to changes in food provisioning following the COVID-19 lockdown in black-headed gulls (Larus ridibundus). FRONTIERS IN ECOLOGY AND EVOLUTION, 2022, 10, 1013244. [Google Scholar] [CrossRef]
- Dale, S. Urban bird community composition influenced by size of urban green spaces, presence of native forest, and urbanization. URBAN ECOSYSTEMS, 2018, 21, 1–14. [Google Scholar] [CrossRef]
- Yang, K. , Cao Y., Feng Z., Gen bingjin, Feng Y., & Wang S. Spatial Characteristics of Urban Development in Beijing Using NighttimeLight Data. Remote Sensing Information, 2019, 34, 41–50. [Google Scholar]
- Beninde, J. , Veith, M., & Hochkirch, A. Biodiversity in cities needs space: a meta-analysis of factors determining intra-urban biodiversity variation. ECOLOGY LETTERS, 2015, 18, 581–592. [Google Scholar] [CrossRef]
- Aronson, M. F. J. , Lepczyk, C. A., Evans, K. L., Goddard, M. A., Lerman, S. B., MacIvor, J. S., Nilon, C. H., & Vargo, T. Biodiversity in the city: key challenges for urban green space management. FRONTIERS IN ECOLOGY AND THE ENVIRONMENT, 2017, 15, 189–196. [Google Scholar] [CrossRef]
- Wang, L. , Wang, H., Wang, Y., Che, Y., Ge, Z., & Mao, L. The relationship between green roofs and urban biodiversity: a systematic review. BIODIVERSITY AND CONSERVATION, 2022, 31, 1771–1796. [Google Scholar] [CrossRef]
- Yang, K. , Cao Y., Feng Z., Gen bingjin, Feng Y., & Wang S. Research Progress of Ecological Security Pattern Construction Based onMinimum Cumulative Resistance Model. Journal of Ecology and Rural Environment, 2021, 37, 555–565. [Google Scholar] [CrossRef]
- Fidino, M. , & Magle, S. B. Challenges of urban green space management in the face of using inadequate data. URBAN FORESTRY & URBAN GREENING, 2018, 31, 56–66. [Google Scholar] [CrossRef]
- Zhao, Y. , Wang C., Bai Z., & Hao Z. Changes of bird community under urbanization and its relationship with urban vegetation. Acta Ecologica Sinica, 2020, 41, 479–489. [Google Scholar] [CrossRef]
- Hua, F. , Wang, X., Zheng, X., Fisher, B., Wang, L., Zhu, J., Tang, Y., Yu, D. W., & Wilcove, D. S. Opportunities for biodiversity gains under the world’s largest reforestation programme. NATURE COMMUNICATIONS, 2016, 7, 12717. [Google Scholar] [CrossRef] [PubMed]
- Heymans, A. , Breadsell, J., Morrison, G. M., Byrne, J. J., & Eon, C. Nest site selection for five common birds and their coexistence in an urban habitat. The Science of the Total Environment, 2019, 690, 748–759. [Google Scholar] [CrossRef]
- Sandstrom, U. G. , Angelstam, P., & Mikusinski, G. Ecological diversity of birds in relation to the structure of urban green space. LANDSCAPE AND URBAN PLANNING, 2006, 77, 39–53. [Google Scholar] [CrossRef]
- Liu, D. , Yu W., Zhao X., & Zhang G. Ecologically Oriented Urban Design in Metropolitan Rural Areas:The Caseof Hangzhou Sanjianghui Green Park. Urban Planning Forum. [CrossRef]
Figure 1.
Bird ecological network assessment framework.
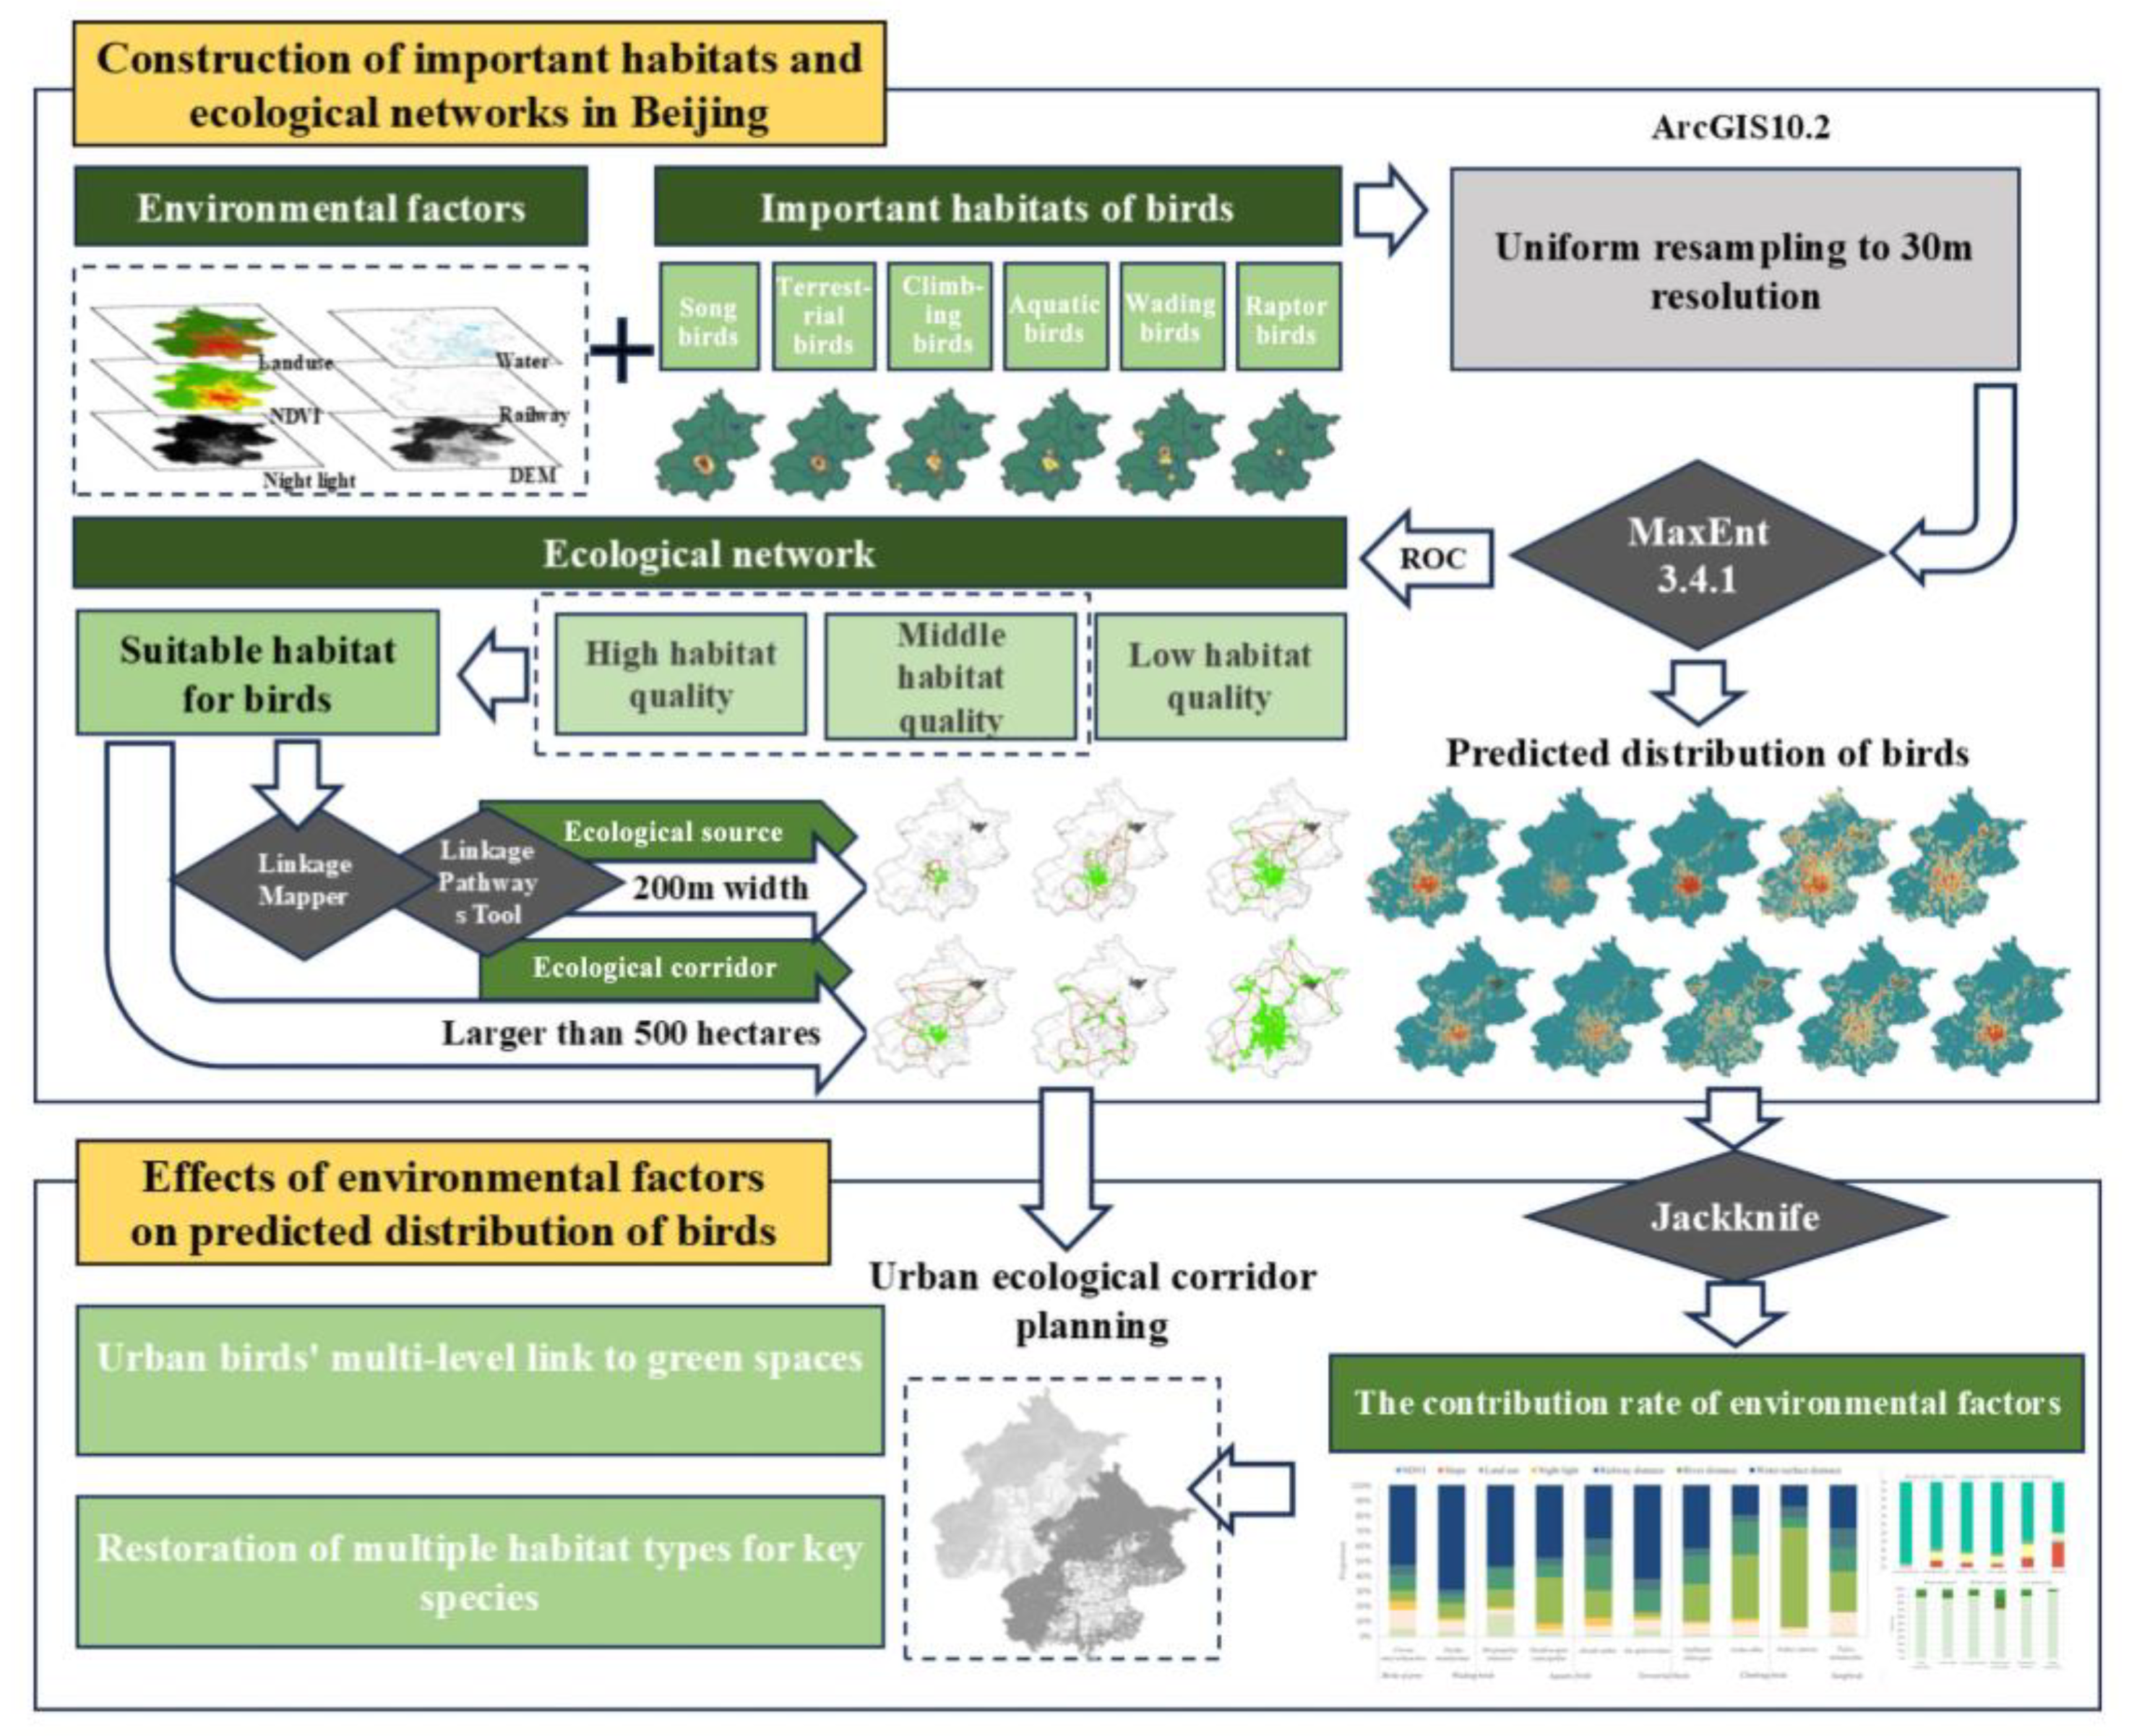
Figure 2.
Location of Beijing.
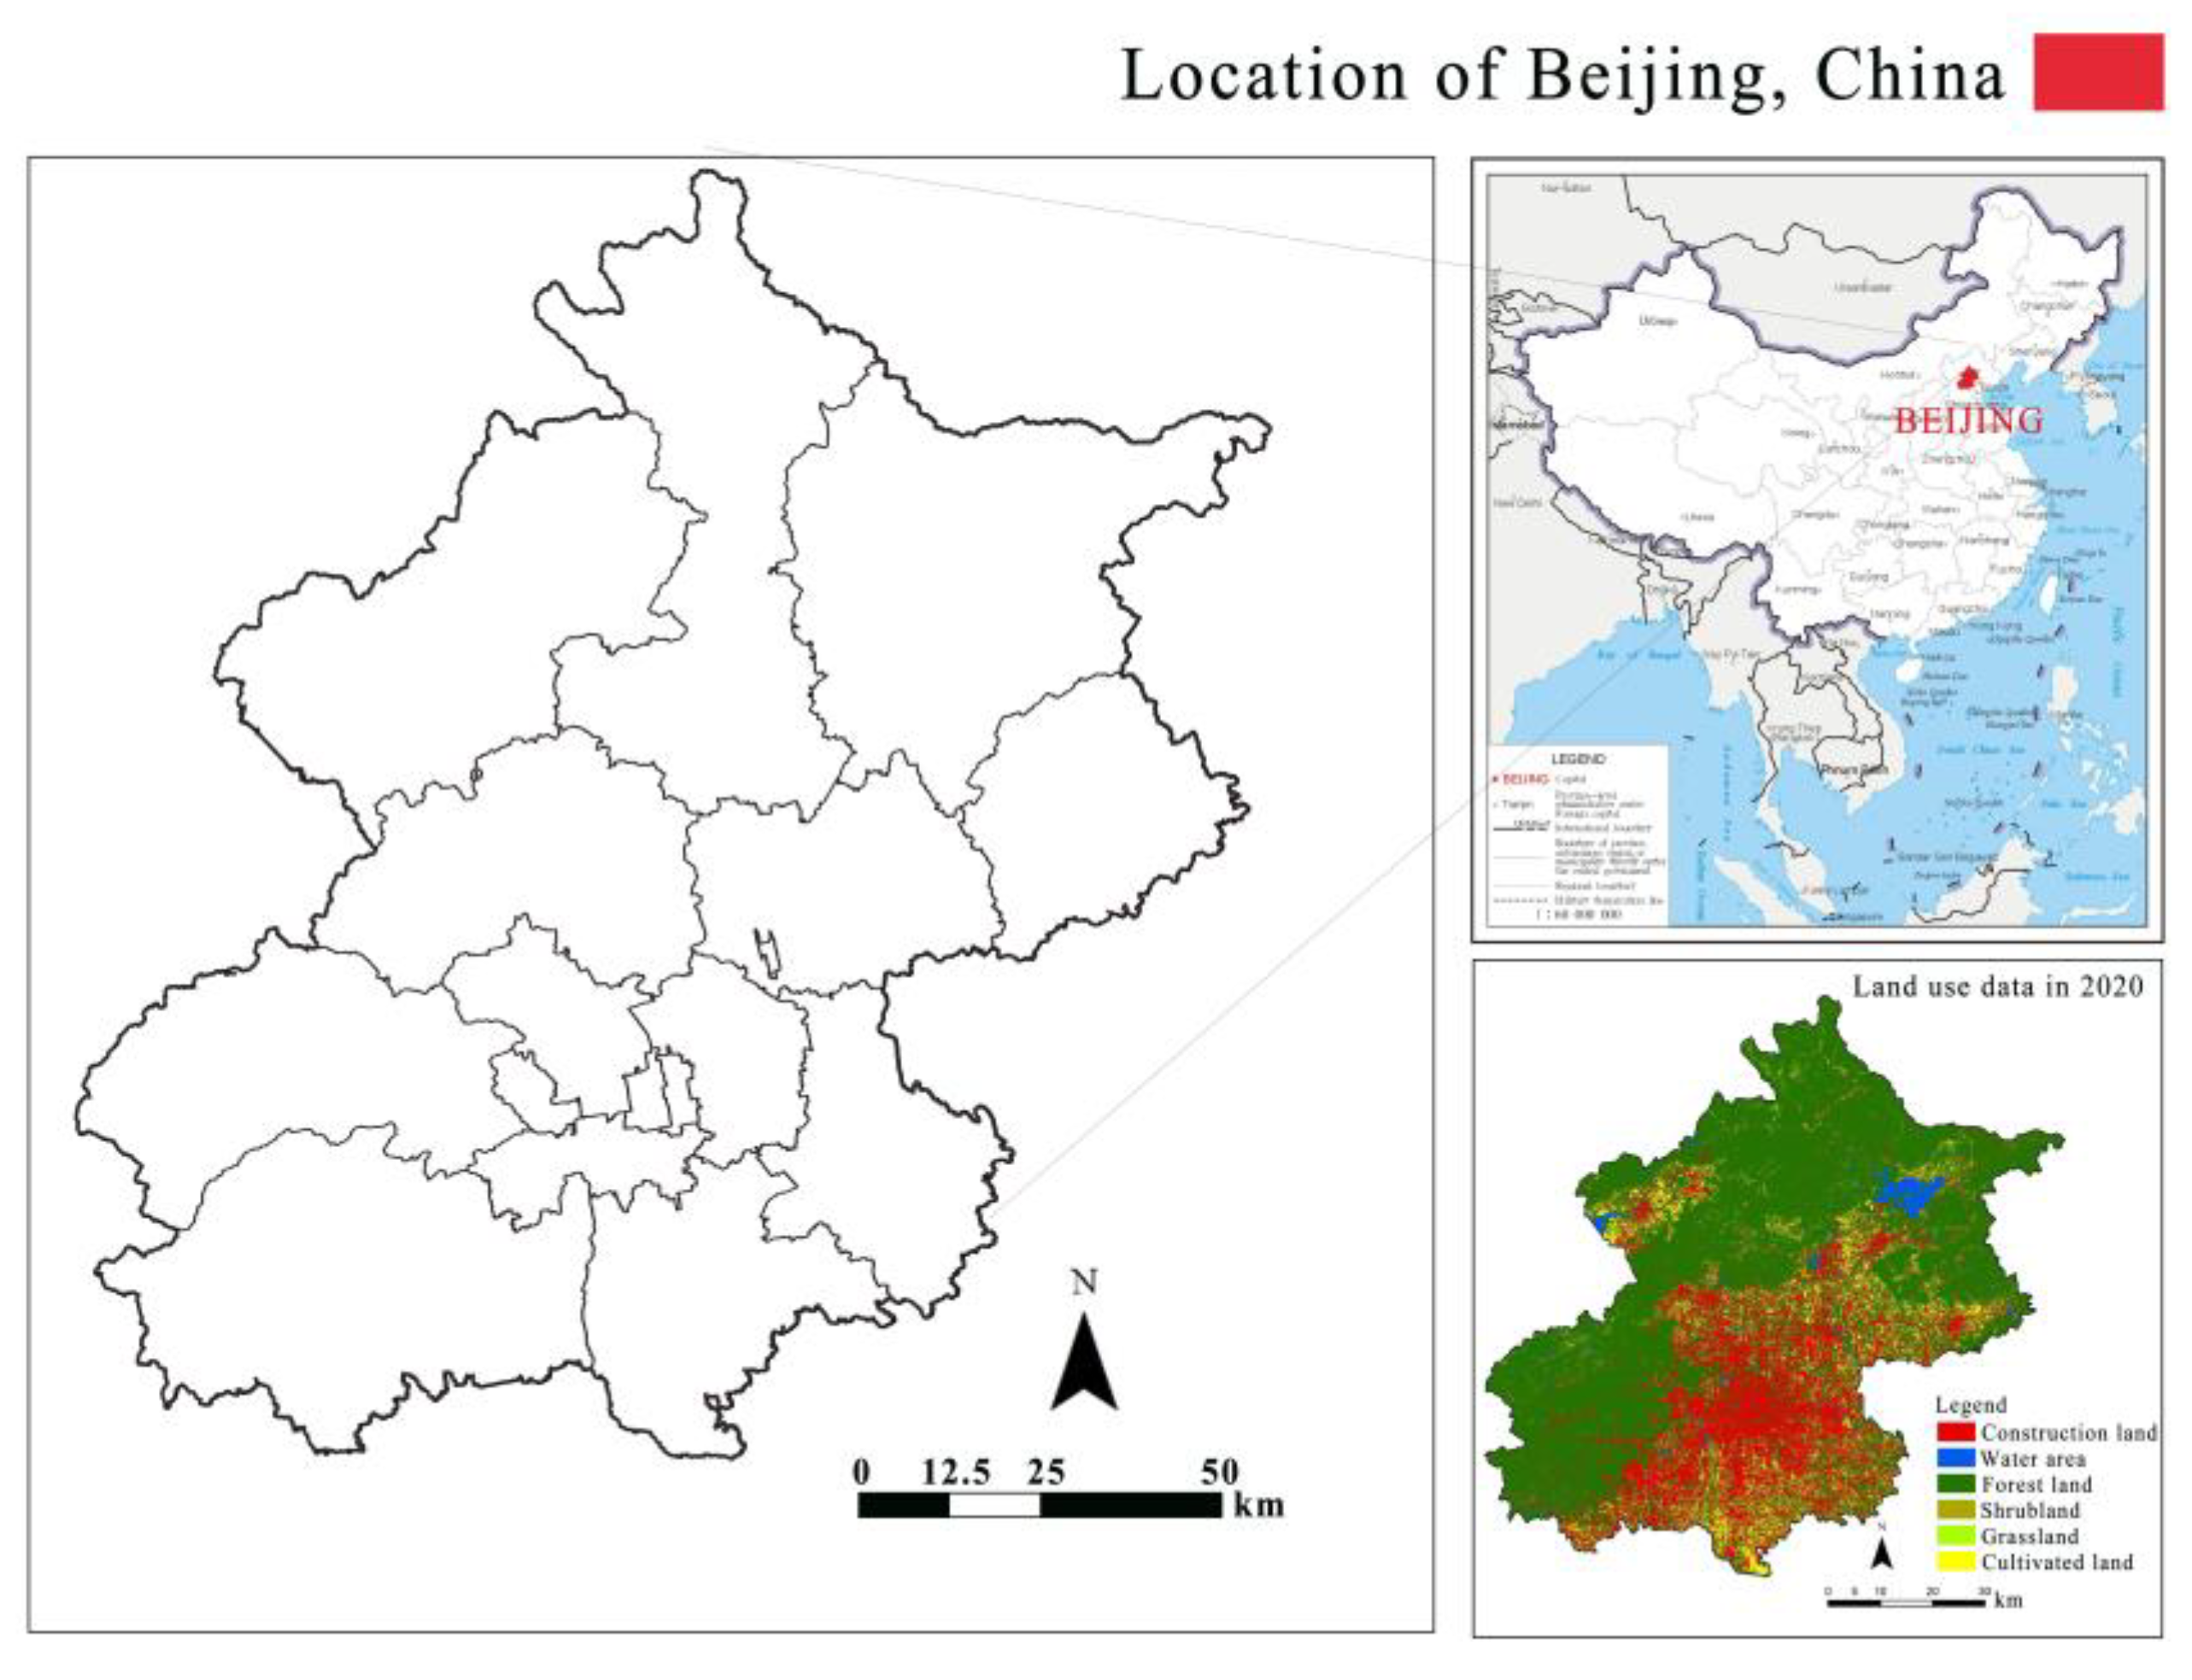
Figure 3.
2015-2020 Bird distribution density.
Figure 4.
Diversity density distribution patterns of six representative species of bird ecological groups in Beijing in 2019.(a: songbirds; b: terrestrial birds; c: climbing birds; d: aquatic birds; e: wading birds; f: raptor birds. ).
Figure 4.
Diversity density distribution patterns of six representative species of bird ecological groups in Beijing in 2019.(a: songbirds; b: terrestrial birds; c: climbing birds; d: aquatic birds; e: wading birds; f: raptor birds. ).
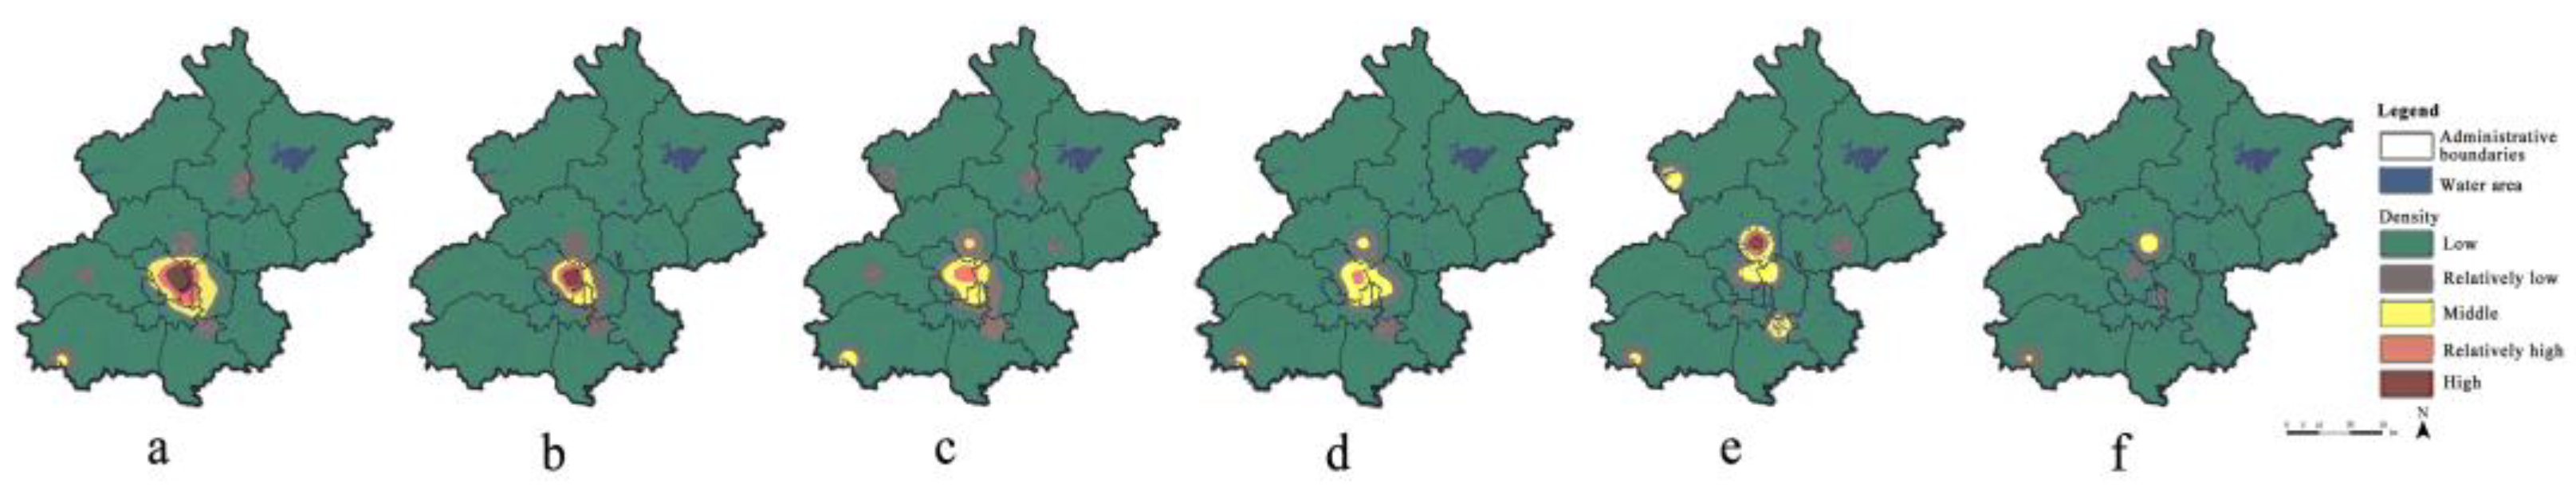
Figure 5.
Predicted distribution of representative bird species.(a: Corvus macrorhynchos; b: Turdus mandarinus; c: Streptopelia chinensis; d: Dendrocopos canicapillus; e: Alcedo atthis; f: Aix galericulata; g: Gallinula chloropus; h: Ardea alba; i: Ardea cinerea; j: Falco tinnunculus).
Figure 5.
Predicted distribution of representative bird species.(a: Corvus macrorhynchos; b: Turdus mandarinus; c: Streptopelia chinensis; d: Dendrocopos canicapillus; e: Alcedo atthis; f: Aix galericulata; g: Gallinula chloropus; h: Ardea alba; i: Ardea cinerea; j: Falco tinnunculus).
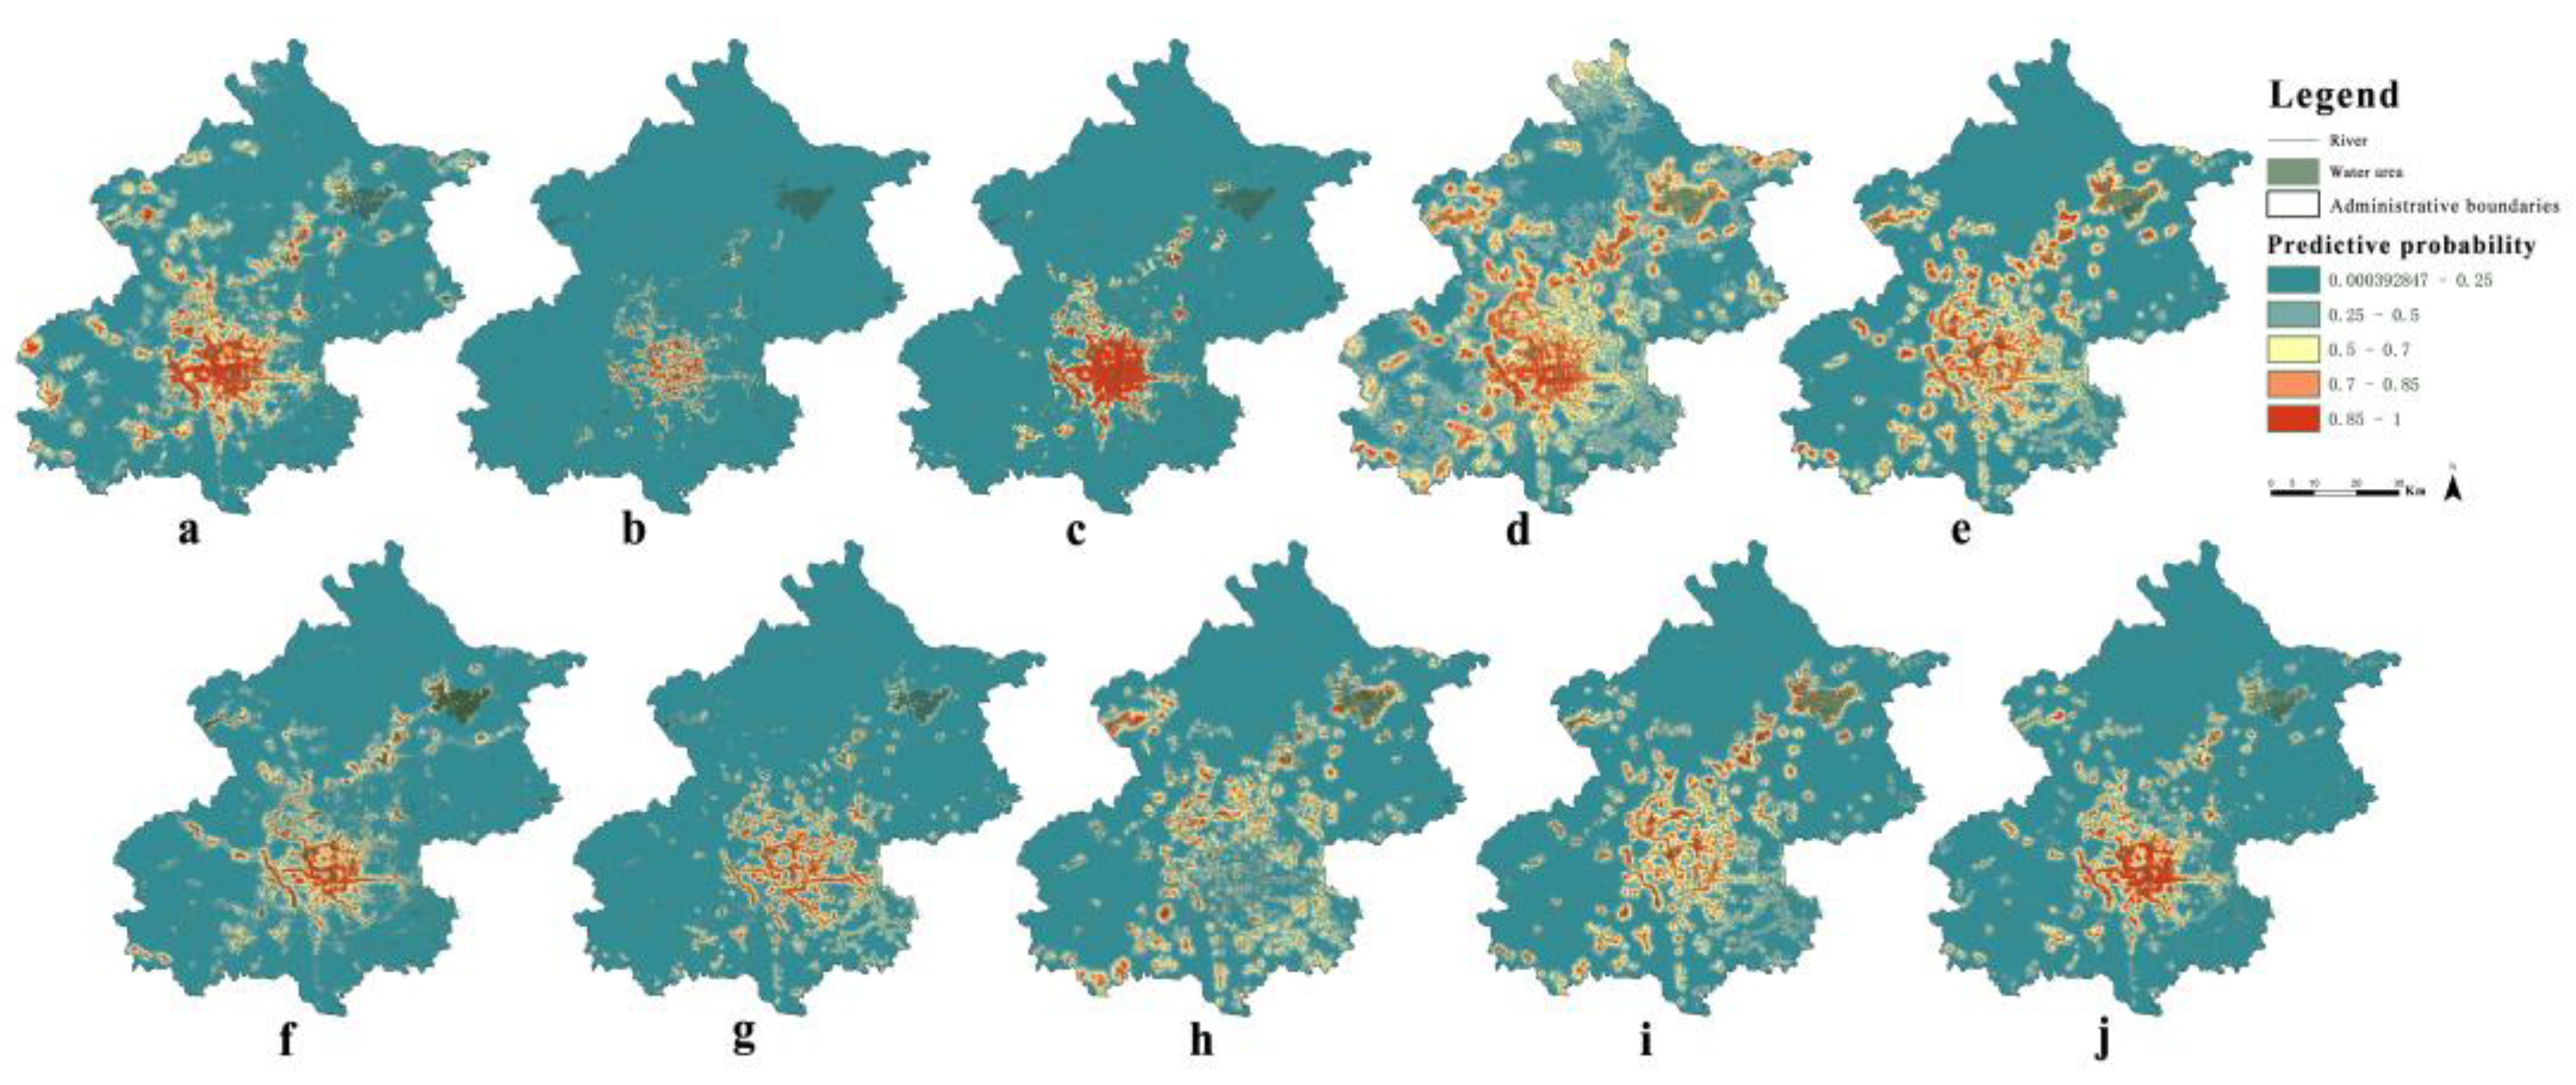
Figure 6.
Distribution of ecological sources and potential ecological corridor for representative bird species.(a: Turdus mandarinus; b: Streptopelia chinensis; c: Dendrocopos canicapillus; d: Aix galericulata; e: Ardea alba; f: Falco tinnunculus).
Figure 6.
Distribution of ecological sources and potential ecological corridor for representative bird species.(a: Turdus mandarinus; b: Streptopelia chinensis; c: Dendrocopos canicapillus; d: Aix galericulata; e: Ardea alba; f: Falco tinnunculus).
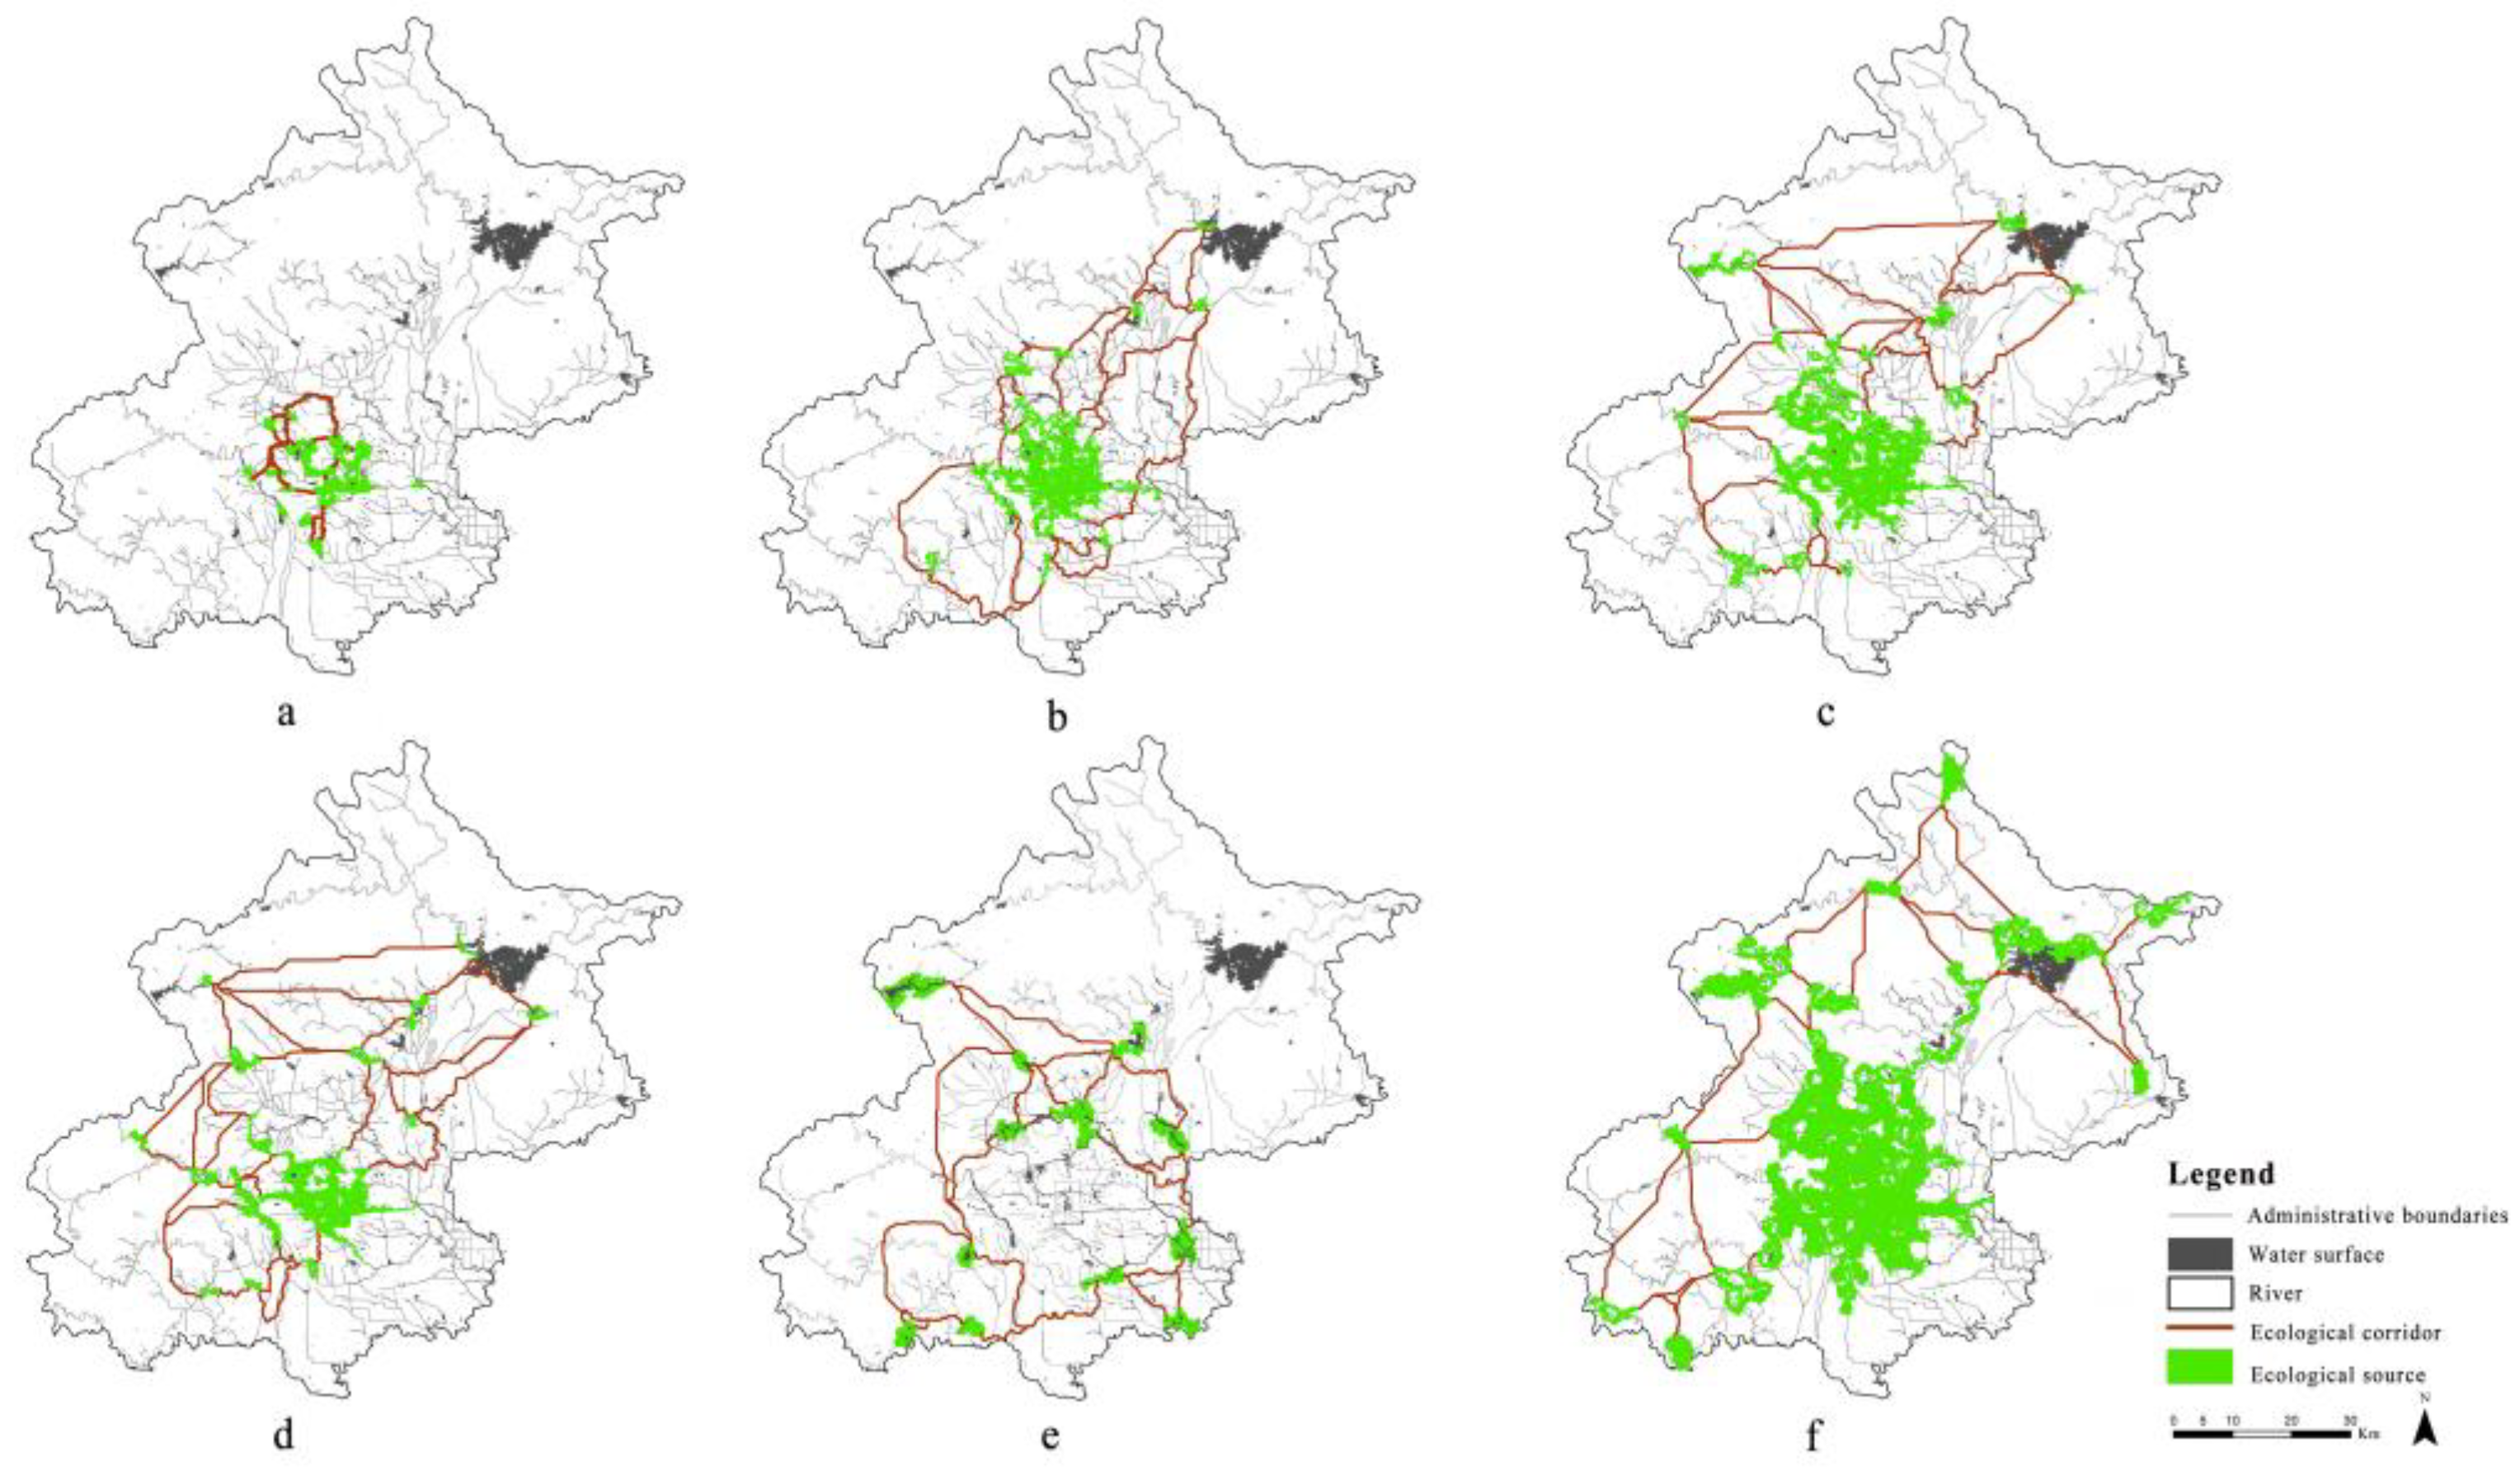
Figure 7.
The proportion of area suitable for different bird habitats.
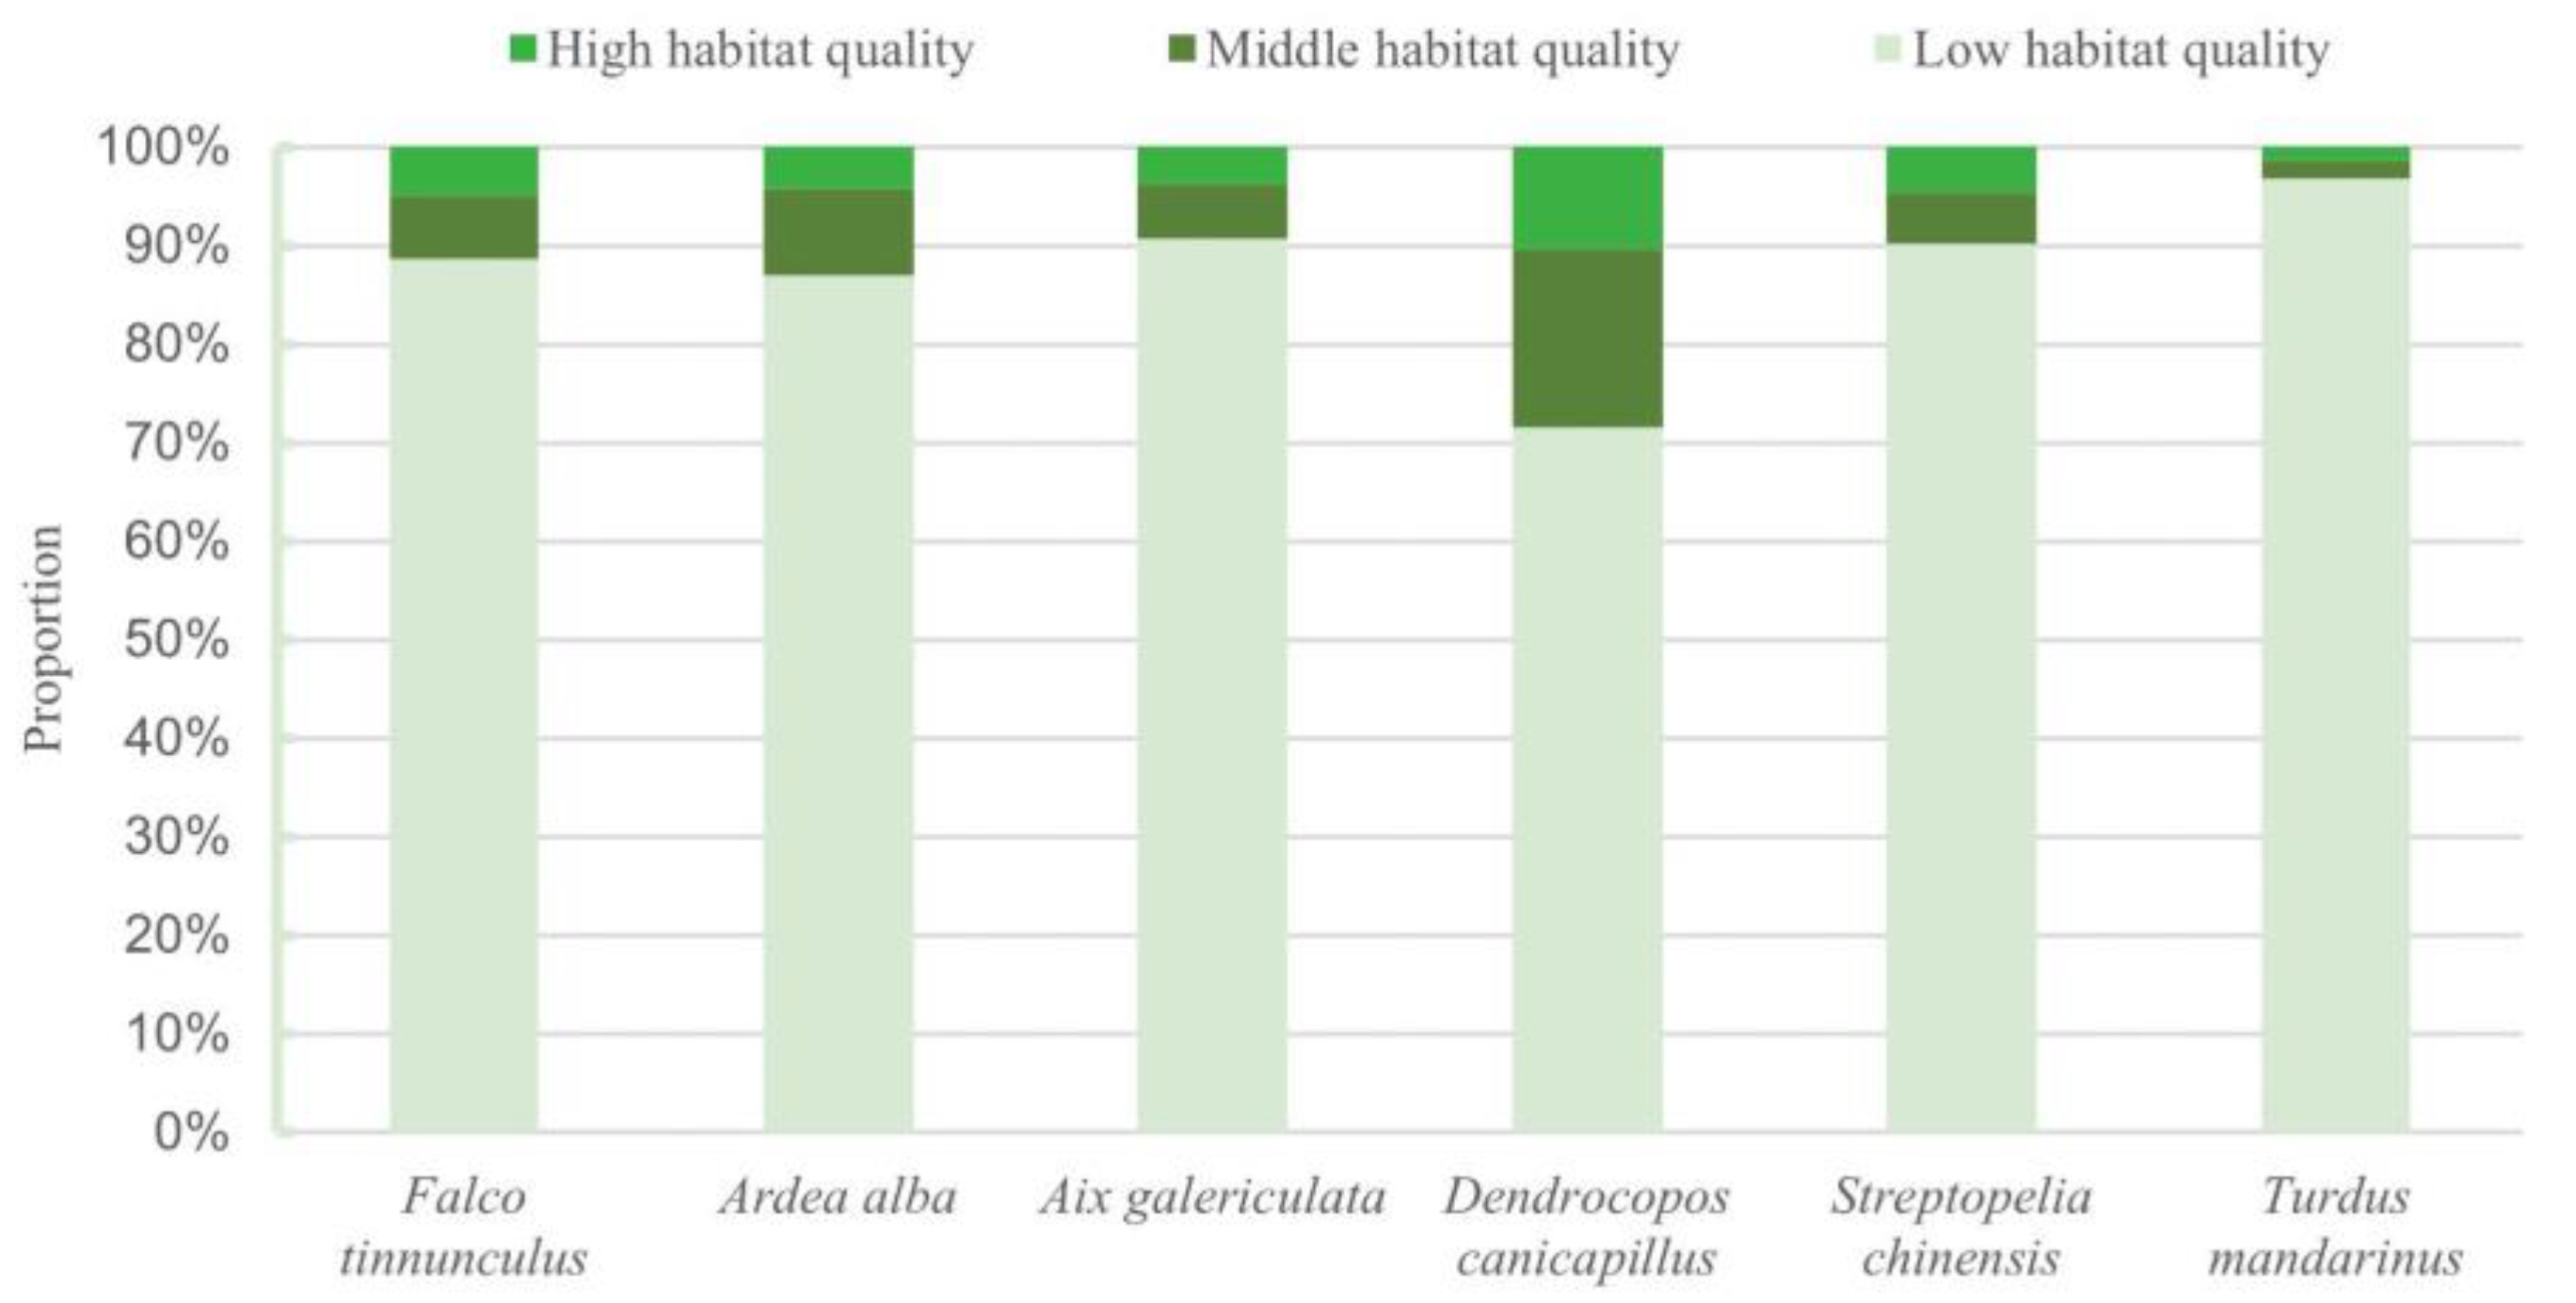
Figure 8.
Comparison of potential corridor area of different birds.
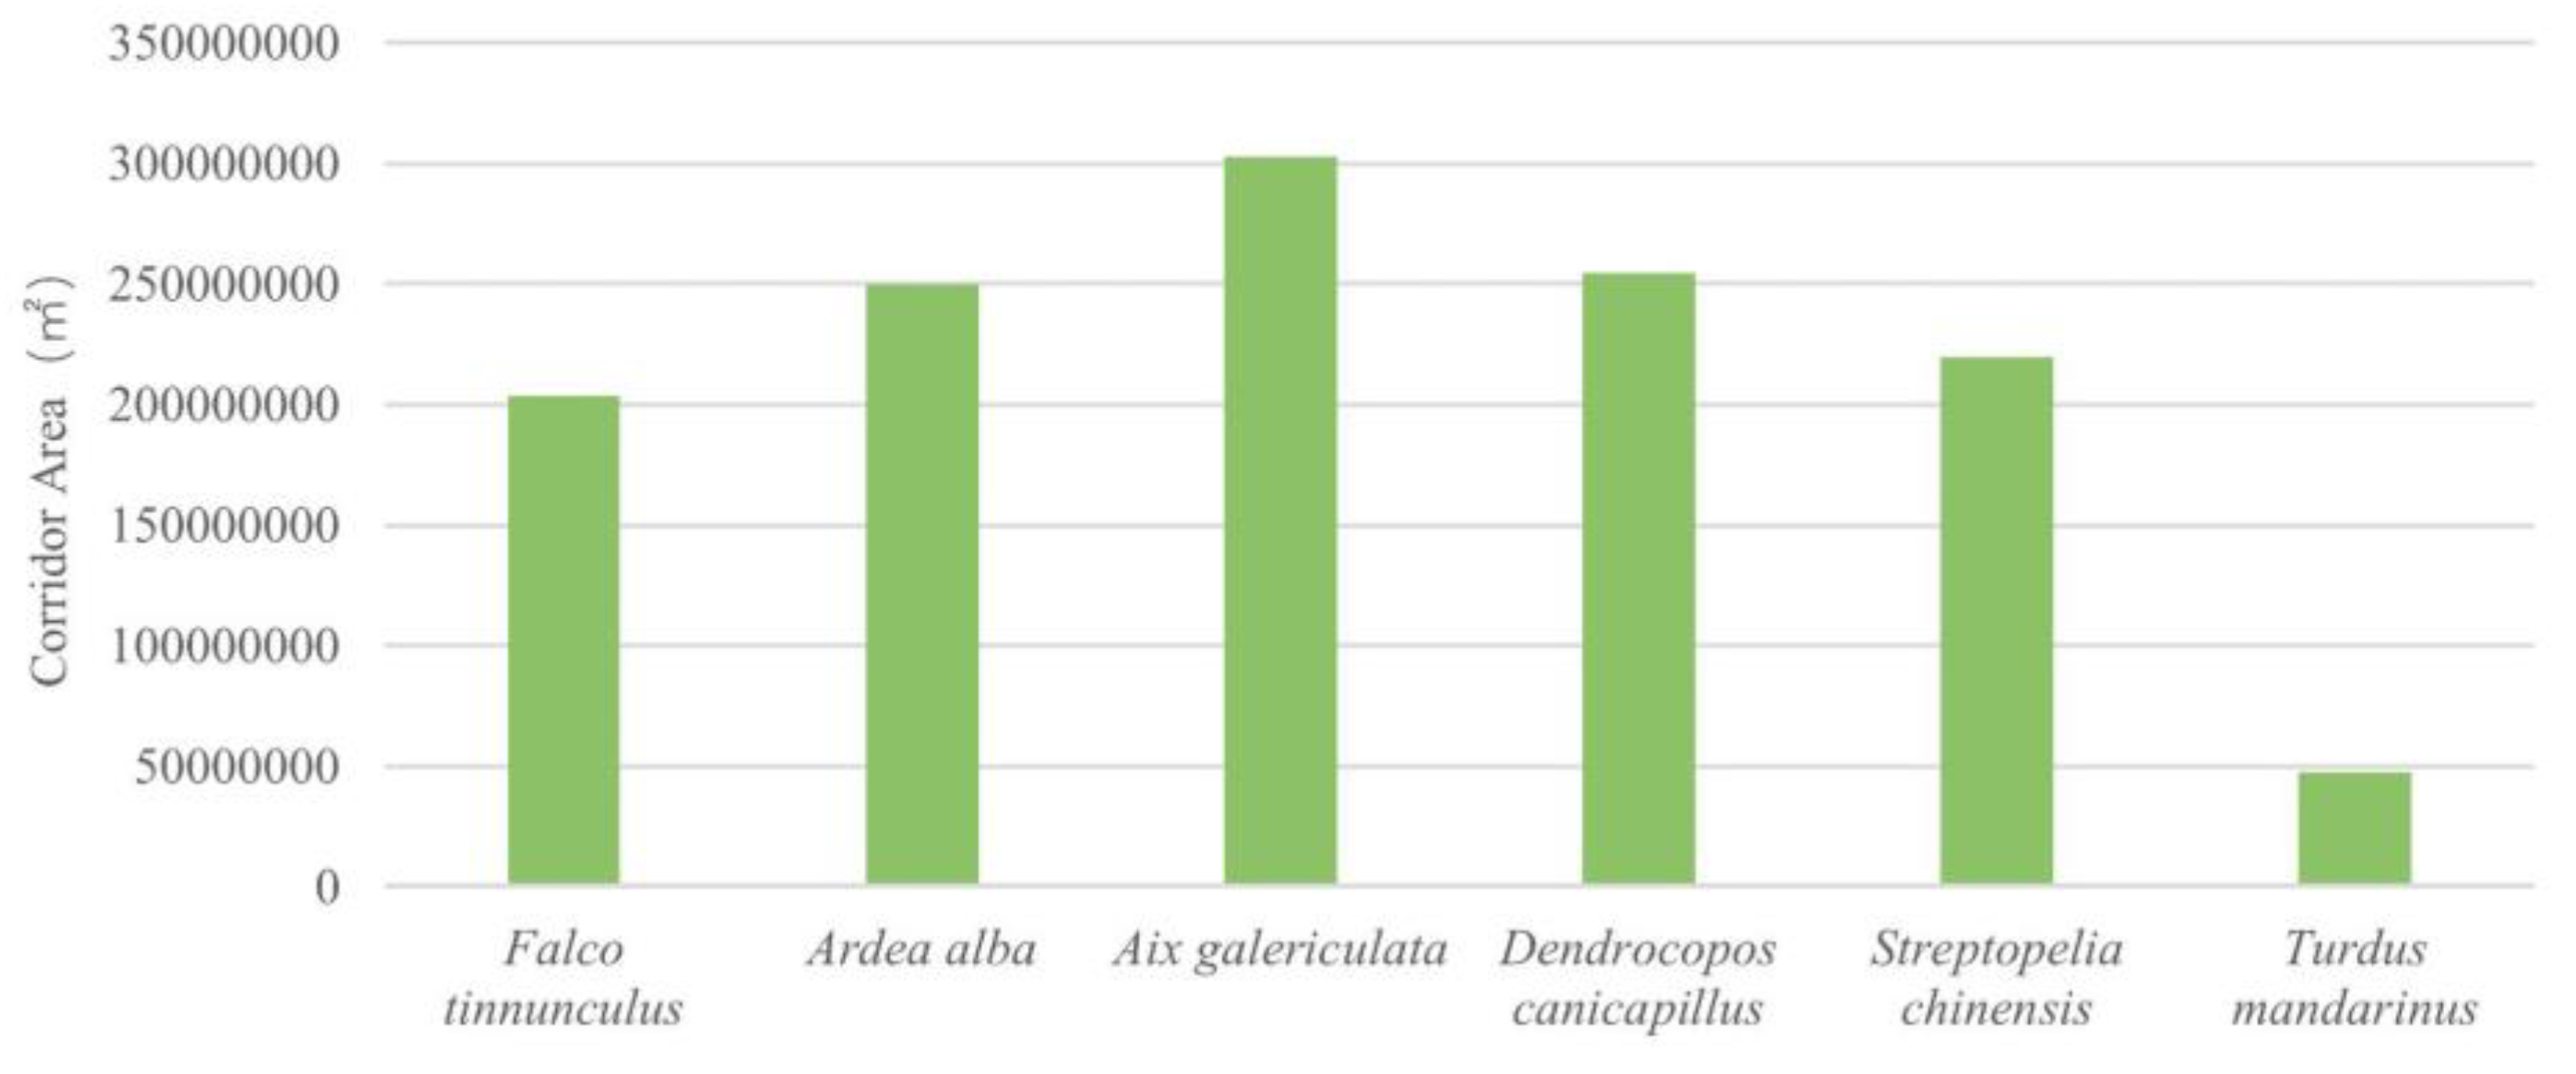
Figure 9.
Comparison of land composition of different bird corridors.
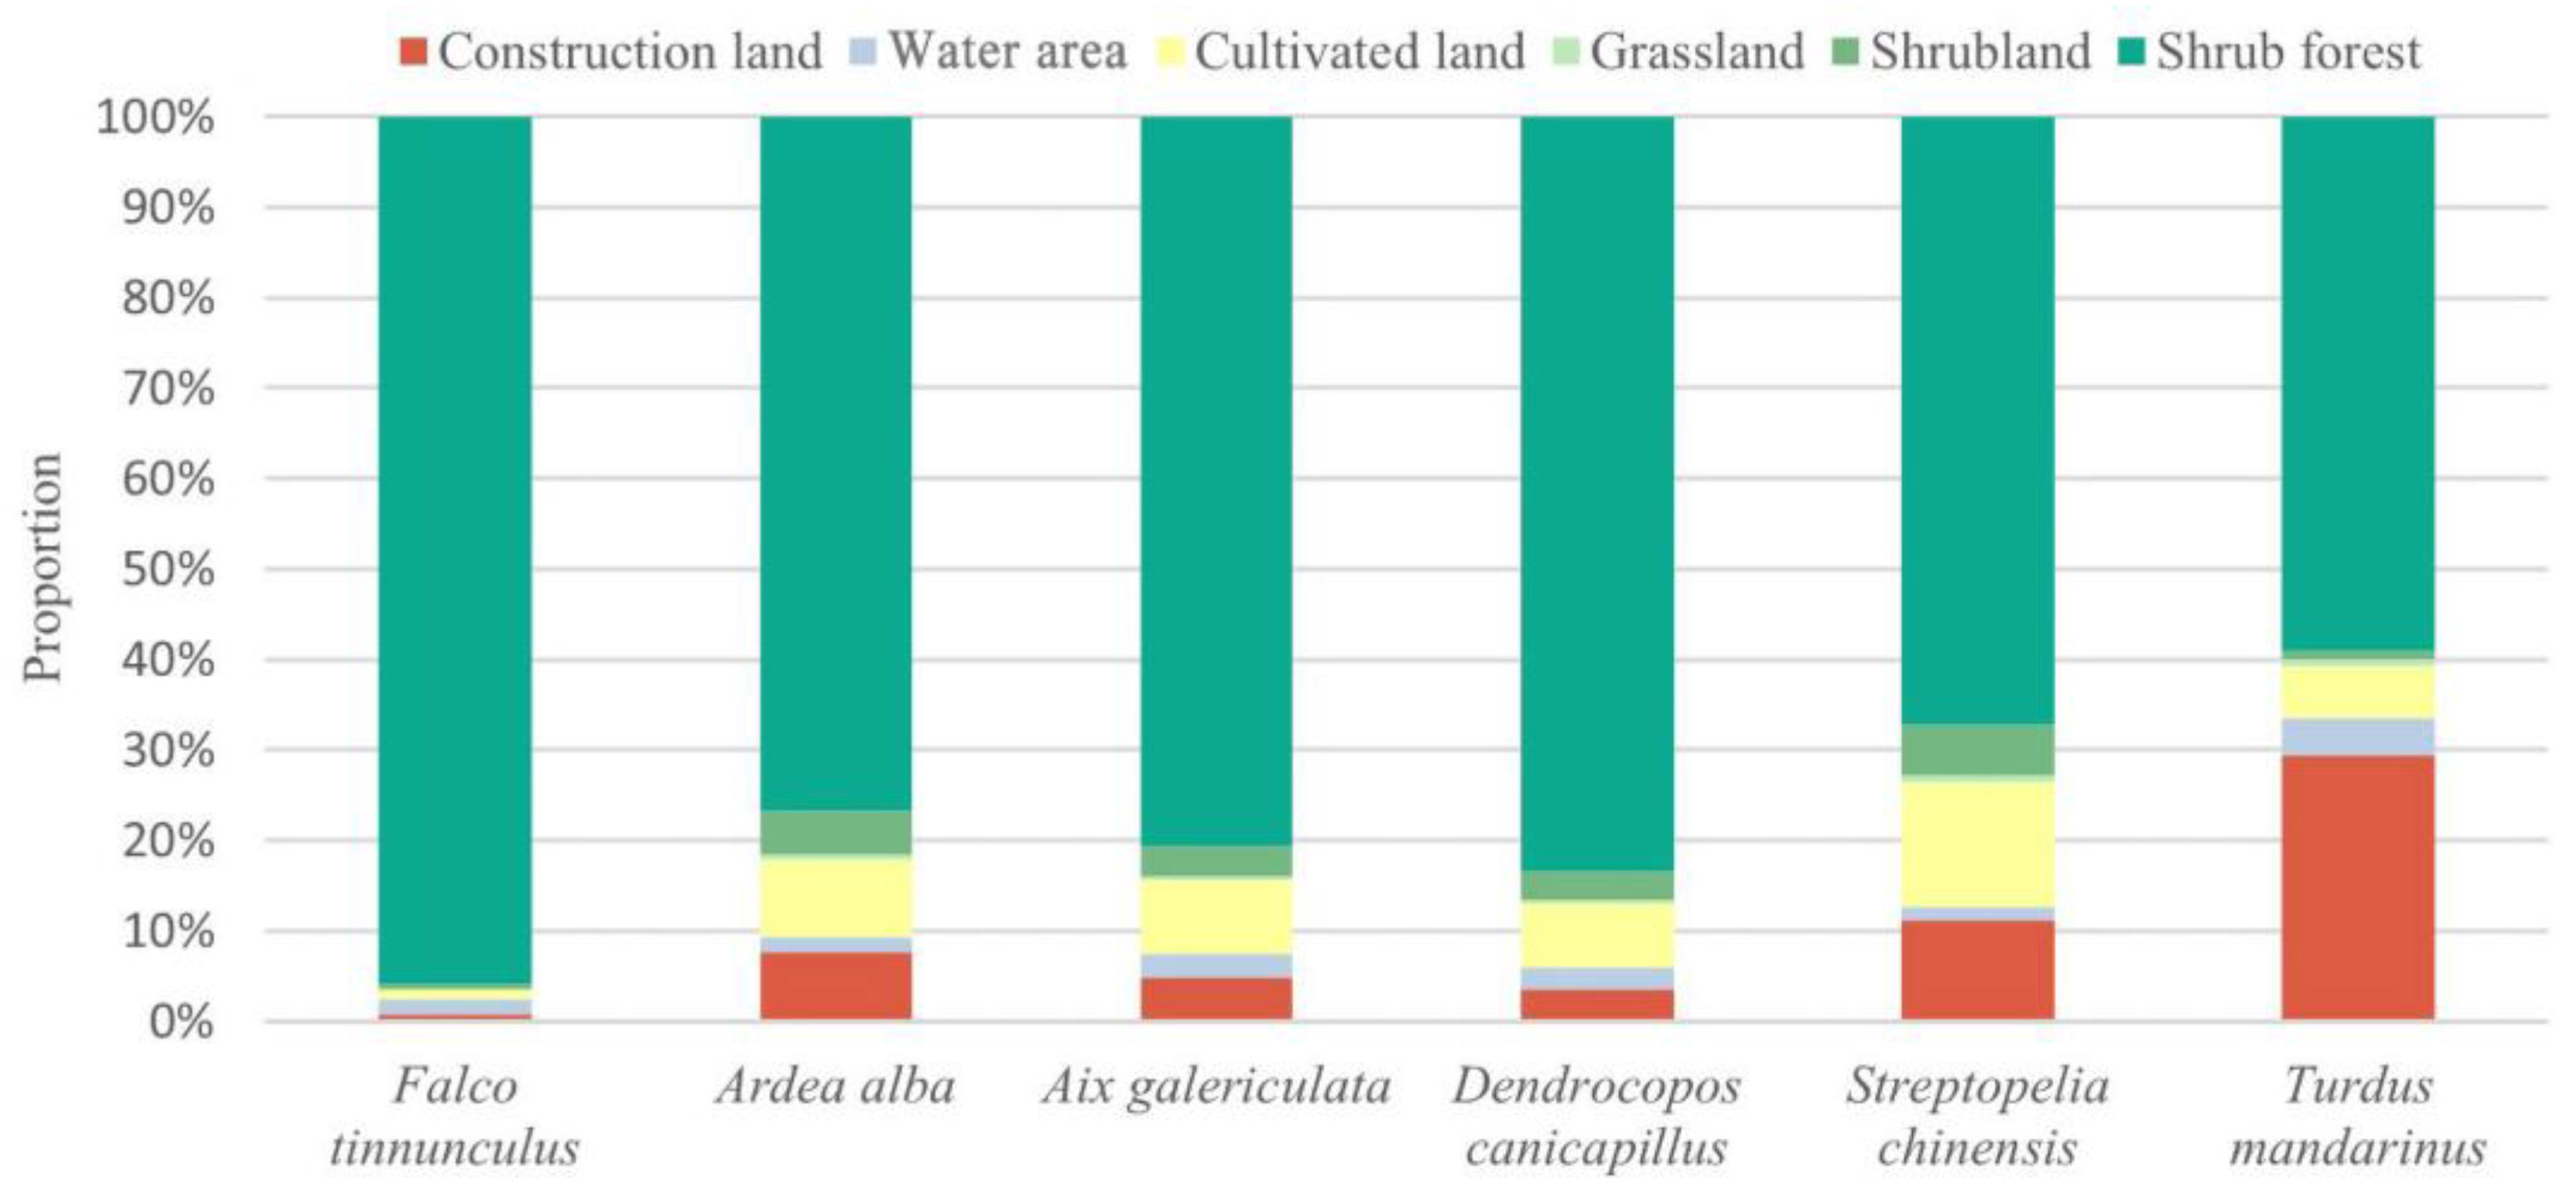
Figure 10.
Comparison of contribution rates of environmental impact factors of birds.
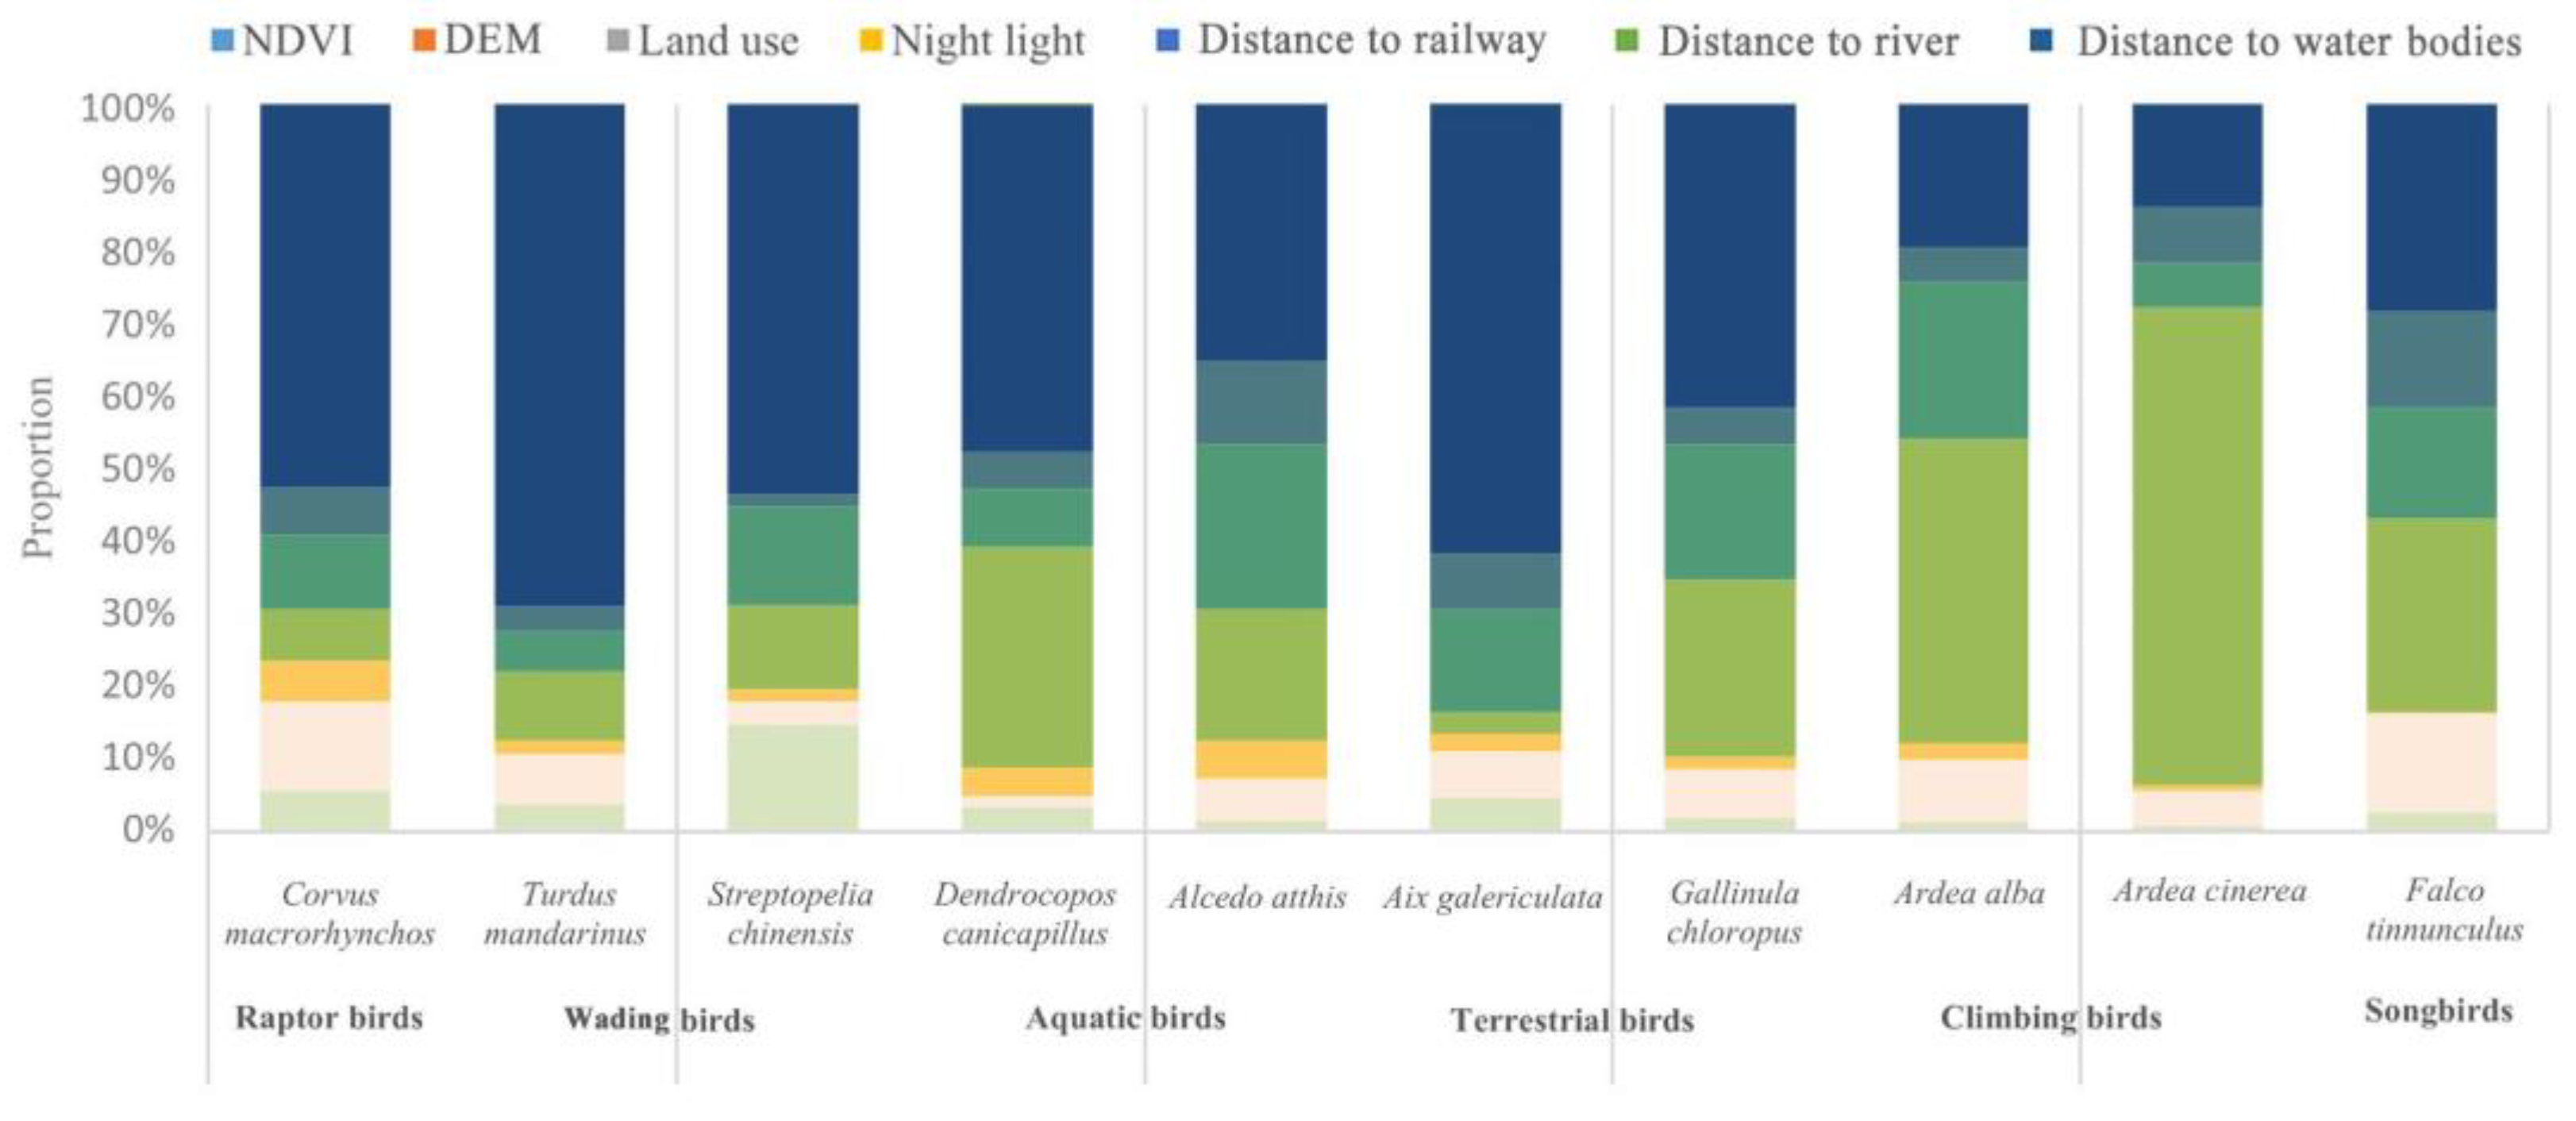

Table 1.
Details of datasets in this study.
| Data type | Data | Data source | Time |
|---|---|---|---|
| Geographical data |
Administrative boundary data | National Catalogue Service for Geographic Information | 2019 |
| Land use data | United States Geological Survey (USGS)(https://glovis.usgs.gov/app) | 2020 | |
| Railway network data | OpenStreetMap(https://www.openstreetmap.org/) | 2019 | |
| Water network data | OpenStreetMap(https://www.openstreetmap.org/) | 2019 | |
| Normalized difference vegetation index (NDVI) data | GSCloud(http://www.gscloud.cn/) | 2019 | |
| DEM | GSCloud(http://www.gscloud.cn/) | 2019 | |
| Night light data | Luojia No.1 (http://59.175.109.173:8888/index.html) | 2019 | |
| Public data |
Bird species occurrence point data | BirdReport.cn(http://www.birdreport.cn/) | 2019 |
Table 2.
Selection of representative species of birds relying on public observation databases.
| Number | Scientific name | Birds' living habits | Residen-ce type1 | Frequency of occurrence | Basis of selecting the species |
|---|---|---|---|---|---|
| 1 |
Corvus macrorhynchos |
Songbirds | R | 307 | (1)Corvus macrorhynchos and Turdus mandarinus are contrasting resident songbirds in Beijing with ample data, making them ideal representative species. |
| 2 | Turdus mandarinus | R | 288 | ||
| 3 |
Streptopelia chinensis |
Terrestrial birds |
R | 420 | (1)It has sufficient data available.(2)It has important economic and scientific research value |
| 4 | Dendrocopos canicapillus | Climbing birds |
R | 208 | (1)Both have important economic and scientific research value.(2)Dendrocopos canicapillus belongs to the most important protective birds species in Beijing. |
| 5 | Alcedo atthis | S/R | 110 | ||
| 6 | Aix galericulata | Aquatic birds |
P/R | 154 | (1)Aix galericulata belongs to the second most important protective birds species in China.(2)Gallinula chloropus has important economic and scientific research value. |
| 7 |
Gallinula chloropus |
S/P | 94 | ||
| 8 | Ardea alba | Wading birds |
P | 80 | (1)Ardea alba and Ardea cinerea are in similar size, protected status, and ample data in Beijing.(2)Both have important economic and scientific research value and belong to the important protective birds species in Beijing. |
| 9 | Ardea cinerea | S/P | 271 | ||
| 10 |
Falco tinnunculus |
Raptor birds |
R/S | 119 | (1)It belongs to the second most important protective birds species in Beijing.(2)It possesses the most data. |
1 R (resident); S (summer visitor); W (winter visitor); P (passage migrant); V (vagrant visitor).
Disclaimer/Publisher’s Note: The statements, opinions and data contained in all publications are solely those of the individual author(s) and contributor(s) and not of MDPI and/or the editor(s). MDPI and/or the editor(s) disclaim responsibility for any injury to people or property resulting from any ideas, methods, instructions or products referred to in the content. |
© 2024 by the authors. Licensee MDPI, Basel, Switzerland. This article is an open access article distributed under the terms and conditions of the Creative Commons Attribution (CC BY) license (http://creativecommons.org/licenses/by/4.0/).
Copyright: This open access article is published under a Creative Commons CC BY 4.0 license, which permit the free download, distribution, and reuse, provided that the author and preprint are cited in any reuse.


